B M O N E S B I T T B U R N SThe
Gabri Lalonde Advisory Group Fundamental vs. Technical Analysis
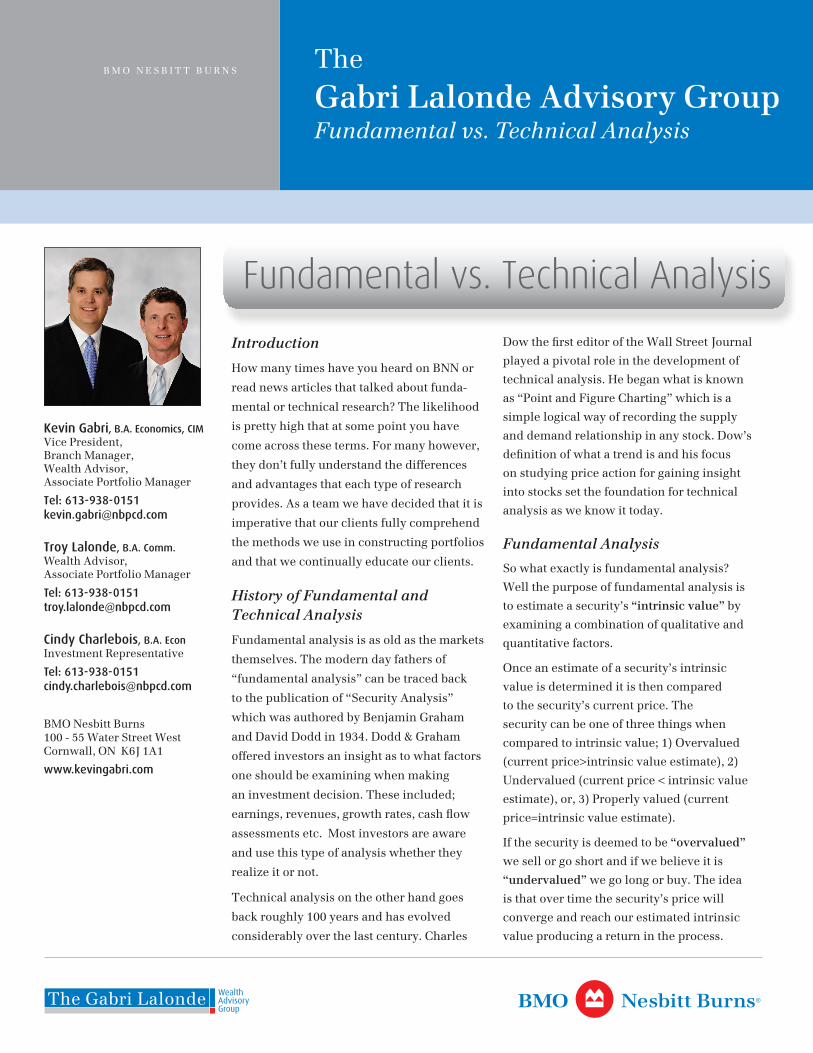
Kevin Gabri, B.A. Economics, CIM Vice President, Branch Manager, Wealth Advisor, Associate Portfolio Manager
Tel: 613-938-0151 [email protected]
Troy Lalonde, B.A. Comm. Wealth Advisor, Associate Portfolio Manager
Tel: 613-938-0151 [email protected]
Cindy Charlebois, B.A. Econ Investment Representative
Tel: 613-938-0151 [email protected]
BMO Nesbitt Burns 100 - 55 Water Street West Cornwall, ON K6J 1A1
www.kevingabri.com
Introduction
How many times have you heard on BNN or
read news articles that talked about funda-
mental or technical research? The likelihood
is pretty high that at some point you have
come across these terms. For many however,
they don’t fully understand the differences
and advantages that each type of research
provides. As a team we have decided that it is
imperative that our clients fully comprehend
the methods we use in constructing portfolios
and that we continually educate our clients.
History of Fundamental and Technical Analysis
Fundamental analysis is as old as the markets
themselves. The modern day fathers of
“fundamental analysis” can be traced back
to the publication of “Security Analysis”
which was authored by Benjamin Graham
and David Dodd in 1934. Dodd & Graham
offered investors an insight as to what factors
one should be examining when making
an investment decision. These included;
earnings, revenues, growth rates, cash flow
assessments etc. Most investors are aware
and use this type of analysis whether they
realize it or not.
Technical analysis on the other hand goes
back roughly 100 years and has evolved
considerably over the last century. Charles
Dow the first editor of the Wall Street Journal
played a pivotal role in the development of
technical analysis. He began what is known
as “Point and Figure Charting” which is a
simple logical way of recording the supply
and demand relationship in any stock. Dow’s
definition of what a trend is and his focus
on studying price action for gaining insight
into stocks set the foundation for technical
analysis as we know it today.
Fundamental Analysis
So what exactly is fundamental analysis?
Well the purpose of fundamental analysis is
to estimate a security’s “intrinsic value” by
examining a combination of qualitative and
quantitative factors.
Once an estimate of a security’s intrinsic
value is determined it is then compared
to the security’s current price. The
security can be one of three things when
compared to intrinsic value; 1) Overvalued
(current price>intrinsic value estimate), 2)
Undervalued (current price < intrinsic value
estimate), or, 3) Properly valued (current
price=intrinsic value estimate).
If the security is deemed to be “overvalued”
we sell or go short and if we believe it is
“undervalued” we go long or buy. The idea
is that over time the security’s price will
converge and reach our estimated intrinsic
value producing a return in the process.
Fundamental vs. Technical Analysis
The Gabri Lalonde Wealth AdvisoryGroup
The Gabri Lalonde Advisory Group
In conducting this type of analysis two significant assumptions
are made. The first is that the current price of the security being
analyzed is incorrect. Essentially, this means that the market is
believed to be wrong. The second assumption is that over the
long-term the security will approach its “intrinsic value”.
These two assumptions open the door to significant criticism.
Those that believe that the markets are “efficient” and in what
is known in finance as the Efficient Market Hypothesis argue
that the current price of a security reflects all information both
current and future. The other criticism comes in the assumption
that the security will approach its intrinsic value. Is it really
realistic to assume that the security’s price in the market will
converge to your estimate of intrinsic value? Some would argue
no while fundamental analysis proponents would say yes.
Conducting Fundamental Analysis
When a fundamental analyst sits down to begin his/her
analysis they must gather a wide variety of data in order to
compare and analyze both quantitative and qualitative factors.
Before the analysis begins the analyst lays out a wide range
of questions which they will attempt to answer on their way
to generating that ever important “intrinsic value” estimate.
These questions include but are not limited to:
• What is the company’s current business?
• Is revenue growing?
• Are they profitable?
• What are their products/services?
• How are they faring vs. competitors?
• What is the industry structure?
• What is their financial situation?
• Do they have a strong management team?
Both quantitative and qualitative factors are used to answer
these questions.
Quantitative Factors
Quantitative factors are measured in numerical terms. They
would include things such as earnings, cash flow needs,
growth rates etc... and the data used to compile them is pulled
from a variety of financial sources. The three main sources of
data used in compiling quantitative values are the company’s
balance sheet, income statement and cash flow statement.
The company’s balance sheet shows their assets, liabilities
and equity at a particular point in time. The income statement
shows a summary of a company’s revenue and expenses for a
given period and the cash flow statement shows a company’s
cash inflows and outflows. From these three statements
analysts are able to answer some of the questions listed above.
A fundamental analyst will then take all of the quantitative data
and calculate various financial metrics in order to get a sense of
the company’s prospects going forward and to compare them
relative to their peers and the industry they operate in. They
also use Ratio Analysis to gauge whether the company appears
to be undervalued, or overvalued versus their peers.
Qualitative Factors
Qualitative factors are much more challenging to analyze
compared to quantitative factors in that they are very difficult to
measure. They include but are not limited to intangibles such
as: the strength of the company’s business model, the quality of
their management team, patents, their competitive position and
corporate governance structure. Analysts attempt to come up
with some way of attaching a value to these things that can be
used in the determination of the company’s intrinsic value.
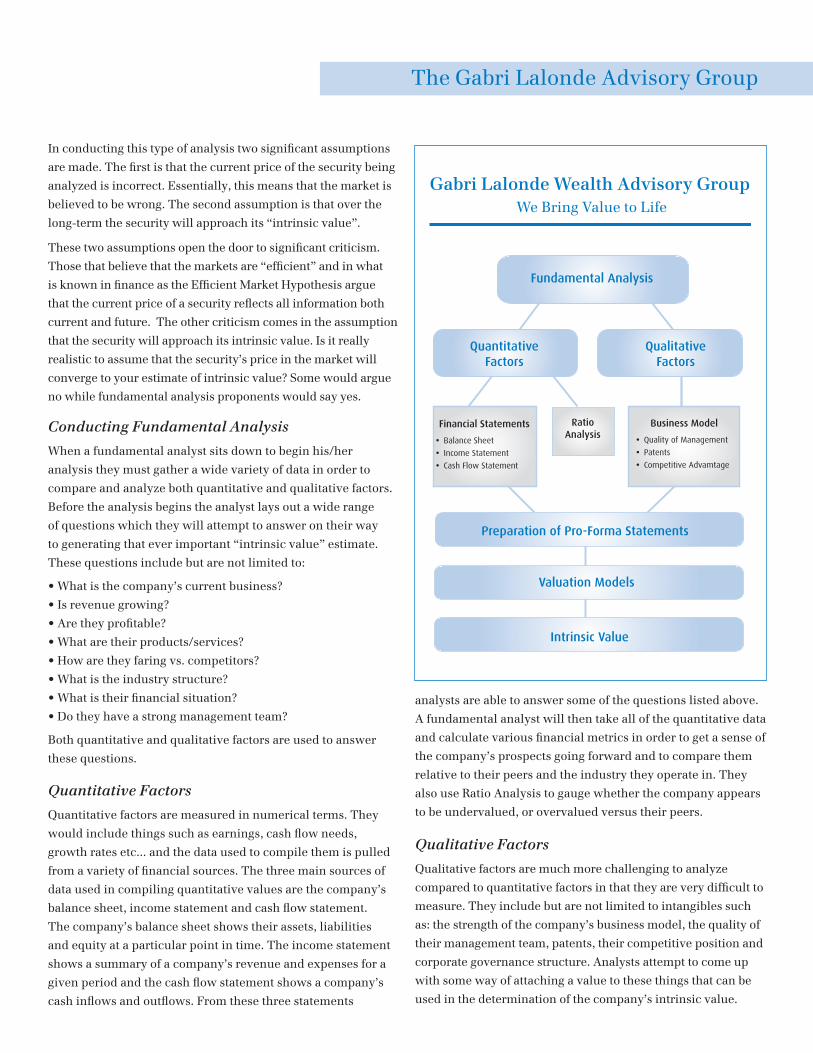
Gabri Lalonde Wealth Advisory GroupWe Bring Value to Life
Fundamental Analysis
QuantitativeFactors
QualitativeFactors
RatioAnalysis
Intrinsic Value
Preparation of Pro-Forma Statements
Valuation Models
Financial Statements
� Balance Sheet
� Income Statement
� Cash Flow Statement
Business Model
� Quality of Management
� Patents
� Competitive Advamtage
Pro-Forma Statements Preparation and Valuation Models
Once the analyst has compiled the quantitative data and
analyzed qualitative factors they then produce what is called
“Pro-Forma” financial statements. These are forward looking
financial statements that analysts use to project out companies
cash flows, earnings etc. After pro-forma statements have been
created, analysts then turn their attention to plugging the data
into valuation models. These are usually proprietary and vary
substantially in the way that they arrive at a final “intrinsic
value”.
Summation
Performing fundamental analysis should provide analysts/
investors with a strong understanding of the security’s
business model, the industry it operates in and its competitive
advantage. By using both quantitative and qualitative factors,
analysts are then able to generate pro-forma financial state-
ments and take the results and plug them into a valuation
models in order to produce an estimate of the security’s
intrinsic value. Once the analyst has performed the pain
staking task of gathering and analyzing all the data and has
produced the “intrinsic value” estimate they simply compare it
to the security’s current price and buy if the price is below the
intrinsic value and sell if the security’s current price is above
the estimate.
Technical Analysis
Technical analysis differs from fundamental analysis in
that the emphasis is not on determining an intrinsic value
but rather it focuses on identifying “patterns” and “trends”
which may suggest future price movements. It uses statistics
generated by past movements in both price and volume data.
Technical analysts hold the belief that historical performance
of both stocks and the markets are indicators of future perfor-
mance and focus their attention on identifying patterns.
Some analysts rely on chart patterns and others on technical
indicators in order to predict future security performance.
At its root technicians rely solely on supply/demand of a
particular security in forecasting future performance.
The field of technical analysis relies on three assumptions
holding true. The first assumption is that the markets discount
everything. That is all information is already incorporated in
the price of a security. The second is that prices move in trends.
The final assumption which is probably the most important of
the three is that history repeats itself.
Technicians believe that investor psychology provides
consistent reaction given certain stimuli over time.
Like fundamentalists technicians do suffer from criticism.
The largest comes from fundamentalists who argue that
technical analysis ignores company fundamentals completely.
Technicians know nothing and care to know nothing about the
security they are analyzing. Instead they focus their attention
on strictly supply and demand conditions.
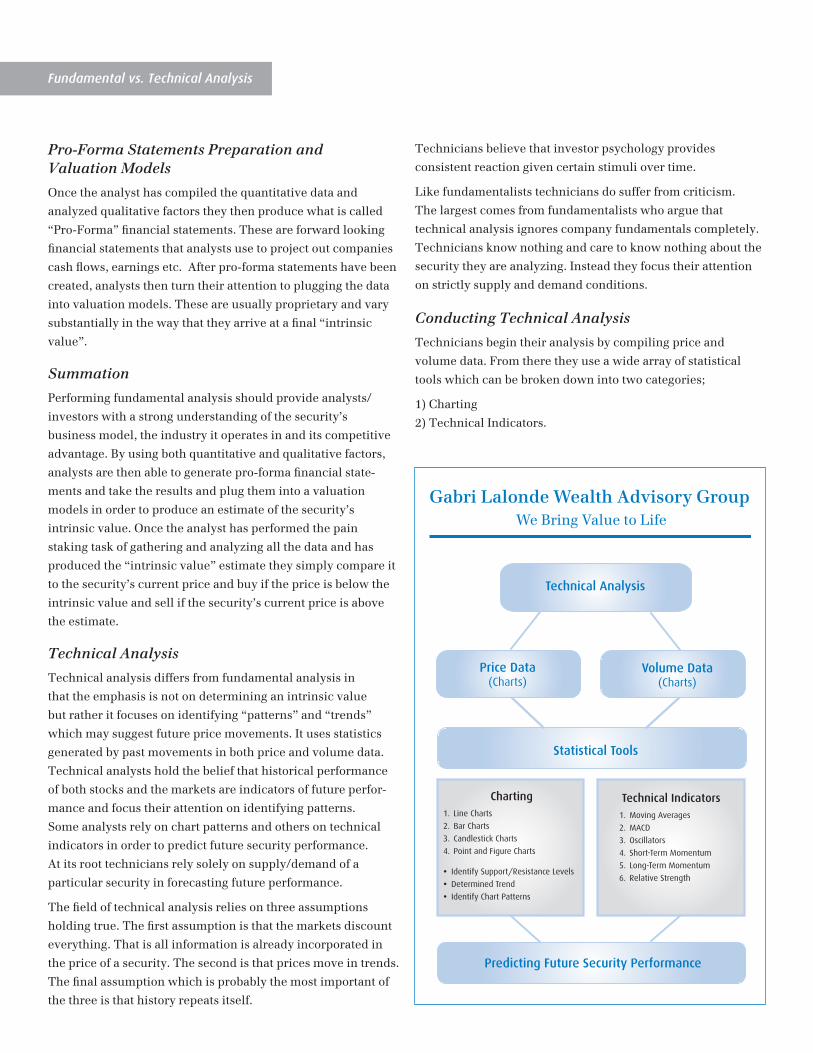
Conducting Technical Analysis
Technicians begin their analysis by compiling price and
volume data. From there they use a wide array of statistical
tools which can be broken down into two categories;
1) Charting
2) Technical Indicators.
Fundamental vs. Technical Analysis
Gabri Lalonde Wealth Advisory GroupWe Bring Value to Life
Technical Analysis
Statistical Tools
Price Data(Charts)
Volume Data(Charts)
Predicting Future Security Performance
Charting1. Line Charts
2. Bar Charts
3. Candlestick Charts
4. Point and Figure Charts
� Identify Support/Resistance Levels
� Determined Trend
� Identify Chart Patterns
Technical Indicators1. Moving Averages
2. MACD
3. Oscillators
4. Short-Term Momentum
5. Long-Term Momentum
6. Relative Strength
The Gabri Lalonde Advisory Group
Charting
Technicians examine charts in order to identify patterns and
trends which they use to gain an idea of where they think the
security’s price will go. 4 Types of different charts are usually
analyzed in this process.
These four charts are 1) Line Charts, 2) Bar Charts,
3) Candlestick Charts and 4) Point and Figure Charts.
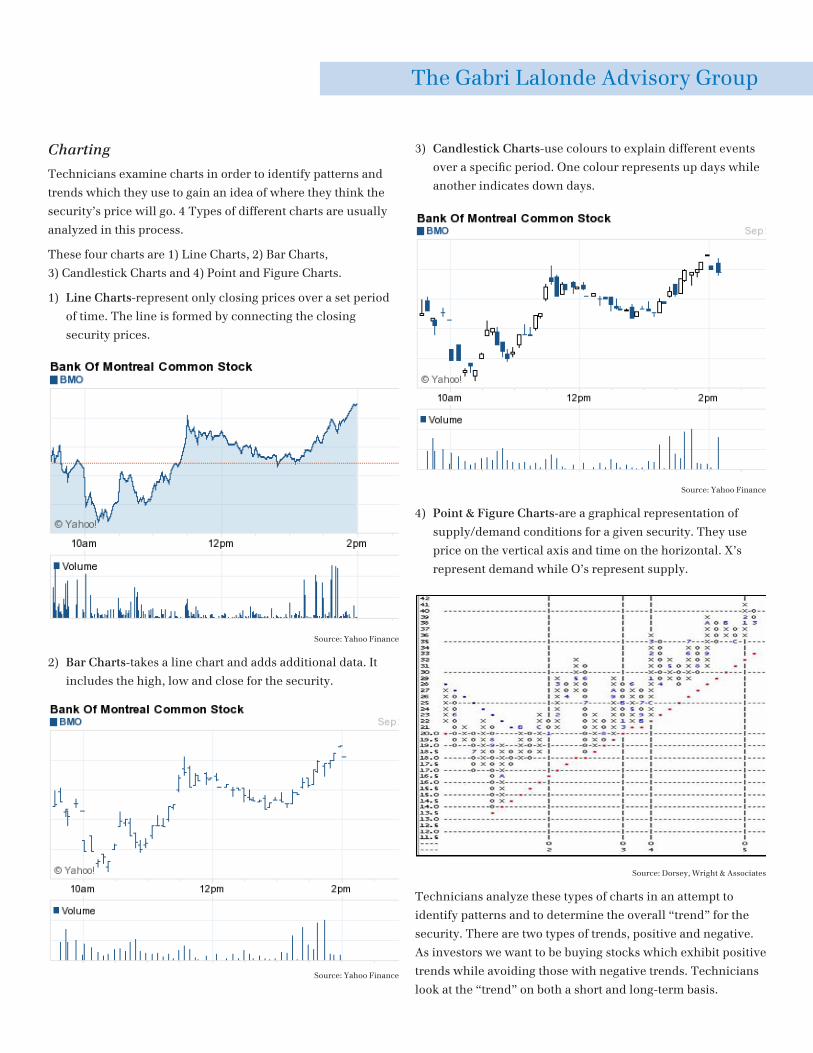
1) Line Charts-represent only closing prices over a set period
of time. The line is formed by connecting the closing
security prices.
Source: Yahoo Finance
2) Bar Charts-takes a line chart and adds additional data. It
includes the high, low and close for the security.
Source: Yahoo Finance
3) Candlestick Charts-use colours to explain different events
over a specific period. One colour represents up days while
another indicates down days.
Source: Yahoo Finance
4) Point & Figure Charts-are a graphical representation of
supply/demand conditions for a given security. They use
price on the vertical axis and time on the horizontal. X’s
represent demand while O’s represent supply.
Source: Dorsey, Wright & Associates
Technicians analyze these types of charts in an attempt to
identify patterns and to determine the overall “trend” for the
security. There are two types of trends, positive and negative.
As investors we want to be buying stocks which exhibit positive
trends while avoiding those with negative trends. Technicians
look at the “trend” on both a short and long-term basis.
Fundamental vs. Technical Analysis
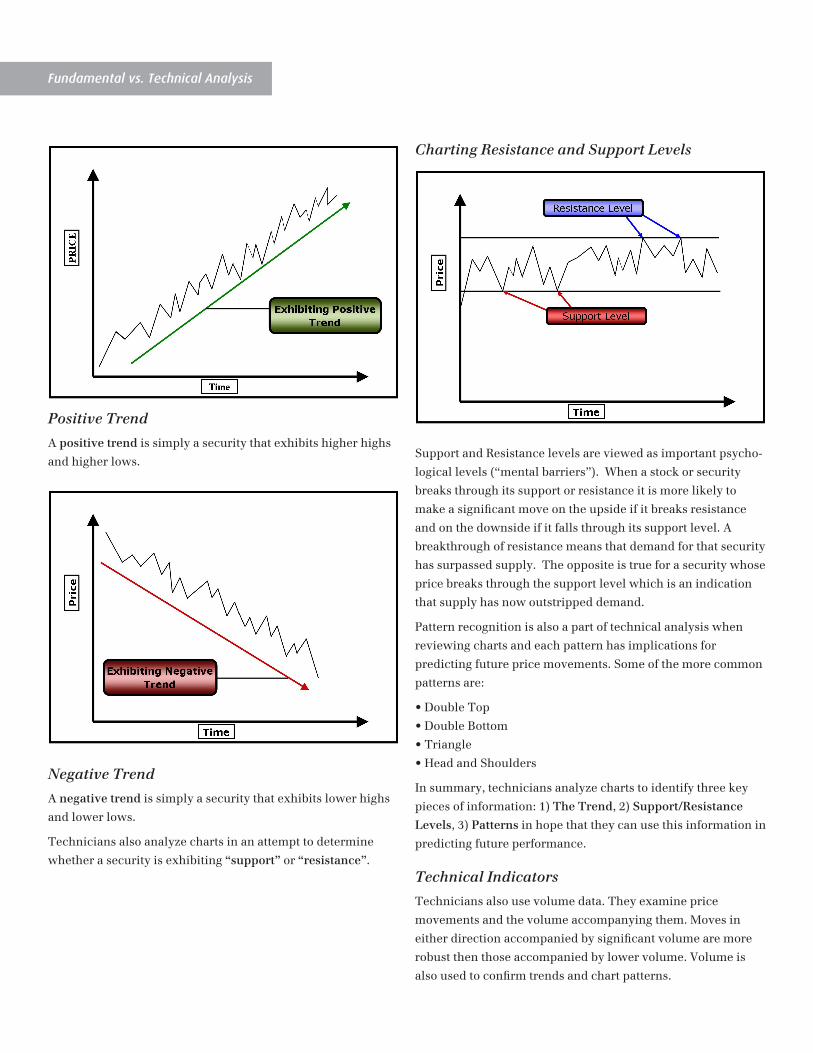
Positive Trend
A positive trend is simply a security that exhibits higher highs
and higher lows.
Negative Trend
A negative trend is simply a security that exhibits lower highs
and lower lows.
Technicians also analyze charts in an attempt to determine
whether a security is exhibiting “support” or “resistance”.
Charting Resistance and Support Levels
Support and Resistance levels are viewed as important psycho-
logical levels (“mental barriers”). When a stock or security
breaks through its support or resistance it is more likely to
make a significant move on the upside if it breaks resistance
and on the downside if it falls through its support level. A
breakthrough of resistance means that demand for that security
has surpassed supply. The opposite is true for a security whose
price breaks through the support level which is an indication
that supply has now outstripped demand.
Pattern recognition is also a part of technical analysis when
reviewing charts and each pattern has implications for
predicting future price movements. Some of the more common
patterns are:
• Double Top
• Double Bottom
• Triangle
• Head and Shoulders
In summary, technicians analyze charts to identify three key
pieces of information: 1) The Trend, 2) Support/Resistance
Levels, 3) Patterns in hope that they can use this information in
predicting future performance.
Technical Indicators
Technicians also use volume data. They examine price
movements and the volume accompanying them. Moves in
either direction accompanied by significant volume are more
robust then those accompanied by lower volume. Volume is
also used to confirm trends and chart patterns.
The opinions, estimates and projections contained herein are those of the author as of the date hereof and are subject to change without notice and may not reflect those of BMO Nesbitt Burns Inc. (“BMO NBI”). Every effort has been made to ensure that the contents have been compiled or derived from sources believed to be reliable and contain information and opinions that are accurate and complete. Information may be available to BMO Nesbitt Burns or its affiliates that is not reflected herein. However, neither the author nor BMO NBI makes any representation or warranty, express or implied, in respect thereof, takes any responsibility for any errors or omissions which may be contained herein or accepts any liability whatsoever for any loss arising from any use of or reliance on this report or its contents. This report is not to be construed as an offer to sell or a solicitation for or an offer to buy any securities. BMO NBI, its affiliates and/or their respective officers, directors or employees may from time to time acquire, hold or sell securities mentioned herein as principal or agent. BMO NBI will buy from or sell to customers securities of issuers mentioned herein on a principal basis. BMO NBI, its affiliates, officers, directors or employees may have a long or short position in the securities discussed herein, related securities or in options, futures or other derivative instruments based thereon. BMO NBI or its affiliates may act as financial advisor and/or underwriter for the issuers mentioned herein and may receive remuneration for same. A significant lending relationship may exist between Bank of Montreal, or its affiliates, and certain of the issuers mentioned herein. BMO NBI is a wholly owned subsidiary of Bank of Montreal. Any U.S. person wishing to effect transactions in any security discussed herein should do so through BMO Nesbitt Burns Corp. ® “BMO (M-bar Roundel symbol)” is a registered trade-mark of Bank of Montreal, used under licence. ® “Nesbitt Burns” is a registered trade-mark of BMO Nesbitt Burns Inc. BMO Nesbitt Burns Inc. is a wholly-owned subsidiary of Bank of Montreal. All insurance products and advice are offered through BMO Nesbitt Burns Financial Services Inc. by licensed life insurance agents, and, in Quebec, by financial security advisors. The comments included in the publication are not intended to be a definitive analysis of tax law: The comments contained herein are general in nature and professional advice regarding an individual’s particular tax position should be attained in respect of any person’s specific circumstances.
Member-Canadian Investor Protection Fund and Member of the Investment Industry Regulatory Organization of Canada
Technical analysis also uses complex mathematical tools in
making investment decisions.
In conjunction with charts, analysts also calculate technical
indicators which are used to identify the “trend”. The technical
indicators are all calculated off of the charts and include;
Moving Averages, MACD, Oscillators, Short and Long-Term
Momentum as well as Relative Strength.
Summation
Unlike fundamentalists, technicians do not care whether or not
a stock is properly valued.
Instead they only care about the underlying supply/demand
relationship of the security being analyzed. If supply is in
control, the price of the security should drop and if demand
is in control the price should rise. They start by collecting
price and volume data. They construct various charts and use
a variety of technical indicators in an attempt to identify the
“trend” and patterns in order to predict future performance.
Which Is Better, Fundamental or Technical Analysis?
The verdict is still out as to which type of analysis is better,
however, we believe that both have merit. For this reason
we incorporate both types of analyses in running our clients’
portfolios. It is our belief that fundamental and technical
analysis do not have to be mutually exclusive. Instead, we
believe that by combing the two we are much further ahead
than just using each on an individual basis. So our investment
process uses fundamental analysis to narrow down the
investment universe and then applies technical indicators
to give our team entry and exit points. By buying securities
that are both strong on a fundamental and technical basis we
are increasing our probability of success. Which would you
rather have? A company with weak fundamentals and weak
technicals or a company that is both strong on a fundamental
and technical basis? For more information on the Gabri
Lalonde Counter-Intuitive Investment Process or on technical
or fundamental analysis feel free to contact our team.
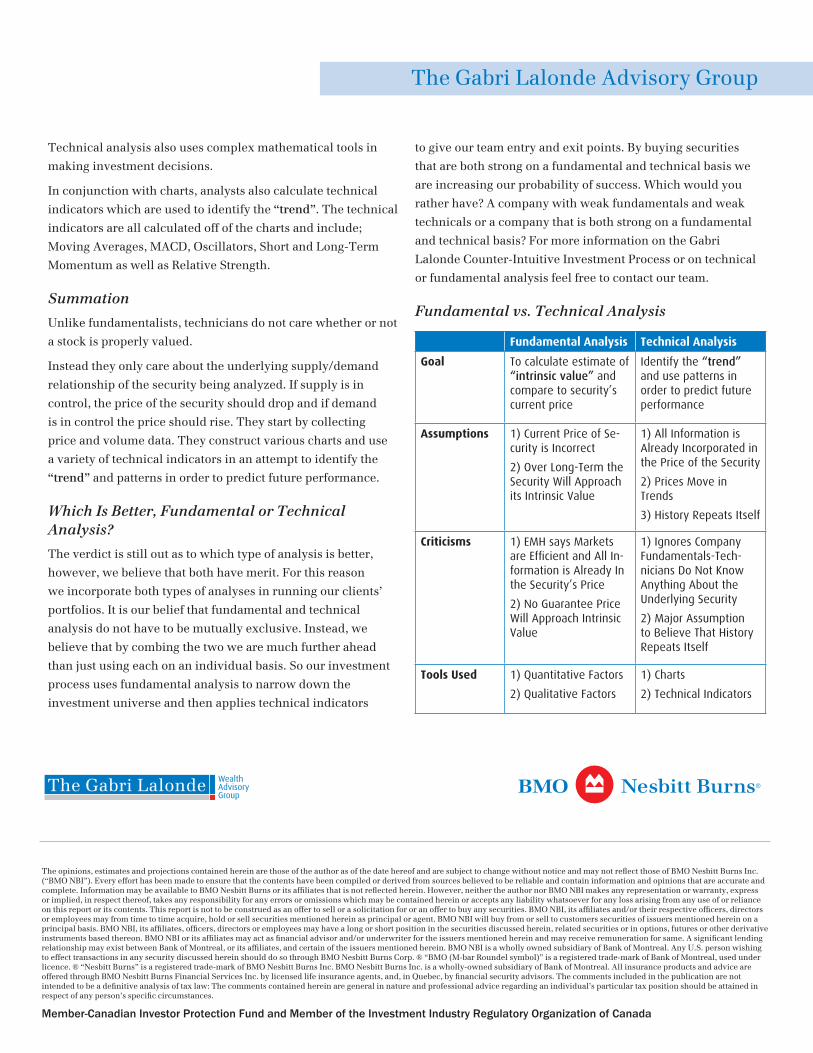
Fundamental vs. Technical Analysis
Fundamental Analysis Technical Analysis
Goal To calculate estimate of “intrinsic value” and compare to security’s current price
Identify the “trend” and use patterns in order to predict future performance
Assumptions 1) Current Price of Se-curity is Incorrect
2) Over Long-Term the Security Will Approach its Intrinsic Value
1) All Information is Already Incorporated in the Price of the Security
2) Prices Move in Trends
3) History Repeats Itself
Criticisms 1) EMH says Markets are Efficient and All In-formation is Already In the Security’s Price
2) No Guarantee Price Will Approach Intrinsic Value
1) Ignores Company Fundamentals-Tech-nicians Do Not Know Anything About the Underlying Security
2) Major Assumption to Believe That History Repeats Itself
Tools Used 1) Quantitative Factors
2) Qualitative Factors
1) Charts
2) Technical Indicators
The Gabri Lalonde Advisory Group
The Gabri Lalonde Wealth AdvisoryGroup