FUNCTIONALITY OF AZADIRACHTA INDICA A.
JUSS (NEEM) IN BEVERAGES
A Doctoral Dissertation
Presented to
The Faculty of the Graduate School
At the University of Missouri
In Partial Fulfillment
Of the Requirements for the Degree
Doctor of Philosophy
By
Abhinandya Datta
Dr. Ingolf Grün, Dissertation Supervisor
December 2016

© Copyright by Abhinandya Datta 2011

ALL Rights Reserved
The undersigned, appointed by the dean of the
Graduate School, have examined the dissertation
entitled
FUNCTIONALITY OF AZADIRACHTA INDICA A. JUSS
(NEEM) IN BEVERAGES
Presented by Abhinandya Datta
A candidate for the degree of Doctor of
Philosophy
And hereby certify that, in their opinion, it is
worthy of acceptance.
Dr. Ingolf Grün, Food Science
Dr. Misha Kwasniewski, Grape and Wine Institute
Dr. Azlin Mustapha, Food Science
Dr. Philip Deming, Statistics
ii
ACKNOWLEDGEMENT
First and foremost, I would like to thank my advisor Dr.
Ingolf Gruen, for being an understanding and inspiring
guide. His patience and amiable nature has gone a very
long way in helping me through the challenges of pursuing
a Ph.D. I appreciate his time, ideas, effort and funding,
all of which have contributed immensely towards making my
academic experience very productive and stimulating.
I want to extend my sincerest thanks and gratitude
towards Lakdas Fernando, technical assistant in our lab.
It was his training on various instruments that allowed
me to carry out my research smoothly.
I would like to thank all my other committee members- Dr.
Azlin Mustapha, Dr. Misha Kwasniewski and Dr. Philip
Deming, for their useful and constructive inputs, which
have helped in making my thesis well rounded. I am very
honored to have them on my committee.
I would also like to thank Brad Alberts and Dr. Lada
Michaes, from the Department of Social Statistics, for
their time and help with data analysis.
Last but definitely not the least, I am grateful to my
parents, family and friends for their love, care,
encouragement and support, without which all of this
would not have been possible.

iii
TABLE OF CONTENTS
ACKNOWLEDGEMENT…………………………………………………………………………………………………ii
LIST OF FIGURES…………………………………………………………………………………………………vii
LIST OF TABLES………………………………………………………………………………………………………x
ABSTRACT………………………………………………………………………………………………………………… xi
CHAPTERS
1. INTRODUCTION…………………………………………………………………………………………………………1
1.1 Background……………………………………………………………………………………………………1
1.2 Objectives……………………………………………………………………………………………………5
2. LITERATURE REVIEW
2.1 Headspace Solid-Phase Microextraction………………………7
2.2 Essential oils…………………………………………………………………………………13
2.3 Flavonoids and their health benefits………………………20
2.4 Limonoids and their removal for de-bittering…33
2.5 Milk-protein interaction………………………………………………………41
3.IDENTIFICATION AND QUANTIFICATION OF FLAVONOLS-
MYRICETIN, QUERCETIN AND KAEMPFEROL, TOTAL POLYPHENOLIC
CONTENT AND ANTI-OXIDANT ACTIVITIES IN AZADIRACHTA
INDICA A. JUSS LEAVES COMMERCIALLY AVAILABLE IN THE U.S.
BY HPLC-DAD-ESI-MS/MS
3.1Introduction………………………………………………………………………………………………49
3.2 Material and methods
3.2.1 Plant material………………………………………………………………………51
3.2.2 Reagents………………………………………………………………………………………52
3.2.3 Extractions………………………………………………………………………………52
3.2.4 UPLC-ESI-MS/MS for identification of
flavonols……………………………………………………………………………………54
3.2.5 HPLC-DAD conditions for quantification of
flavonols……………………………………………………………………………………55
3.2.6 Total phenolic content by Folin-Ciocalteau
assay………………………………………………………………………………………………55

iv
3.2.7 Colorimetric estimation of total
limonoids……………………………………………………………………………………56
3.2.8 Anti-oxidant activity
determinations………………………………………………………………………58
3.2.9 Statistical analysis………………………………………………………59
3.3 Results and discussions
3.3.1 Identification of flavonol aglycones……………60
3.3.2 Content of flavonols as determined by HPLC-
DAD……………………………………………………………………………………………………64
3.3.3 Total phenolics determined by Folin-
Ciocalteau assay…………………………………………………………………67
3.3.4 Anti-oxidant activities- FRAP anti-oxidant
assay & DPPH anti-oxidant activity…………………68
3.3.5 Total limonoids- limonoid glucosides and
aglycone………………………………………………………………………………………71
3.3.6 Analysis of commercial samples……………………………72
3.4 Conclusions………………………………………………………………………………………………74
4.CHARACTERIZATION OF THE VOLATILE PROFILE OF NEEM
(AZADIRACHTA INDICA A. JUSS.) LEAF AND BARK COMMERCIALLY
AVAILABLE IN THE UNITED STATES USING HS-SPME LINKED WITH
GAS CHROMATOGRAPHY-MASS SPECTROMETRY
4.1 Introduction……………………………………………………………………………………………75
4.2 Materials and methods
4.2.1 Plant material………………………………………………………………………77
4.2.2 Chemicals……………………………………………………………………………………77
4.2.3 HS-SPME procedure………………………………………………………………77
4.2.4 Extraction of Essential oil……………………………………78
4.2.5 GC-MS Analysis………………………………………………………………………79
4.2.6 Statistical Analysis………………………………………………………79
4.3 Results and discussions
4.3.1 Comparison of the volatile profile of neem
dried leaf powder, dry leaf and fresh
leaf…………………………………………………………………………………………………80
4.3.2 Comparison between neem bark and leaf
powder
volatiles……………………………………………………………………………………84
4.3.3 Comparison between HS –SPME and essential
oil volatiles of dried neem leaf
powder……………………………………………………………………………………………88
4.4 Conclusions………………………………………………………………………………………………89
5.EFFECT OF TWO ADSORBENT BASED DE-BITTERING PROCEDURES
IN NEEM (AZADIRACHTA INDICA A. JUSS) TEA- EFFECT ON TOTAL
PHENOLIC CONTENT, ANTI-OXIDANT CAPACITY, COLOR AND
VOLATILE PROFILE
5.1Introduction……………………………………………………………………………………………110
5.2 Materials and methods

v
5.2.1 Plant material……………………………………………………………………112
5.2.2 Chemicals…………………………………………………………………………………112
5.2.3 Tea preparation…………………………………………………………………113
5.2.4 De-bittering procedures……………………………………………113
5.2.5 Extraction of flavonols……………………………………………114
5.2.6 Determination of polyphenol content by the
Folin- Ciocalteu assay………………………………………………115
5.2.7 Determination of antioxidant activities…115
5.2.8 Colorimetric determination of total
limonoid glucoside and limonoid
aglycones…………………………………………………………………………………117
5.2.9 HPLC Analysis for the estimation of
flavonols…………………………………………………………………………………118
5.2.10 Analysis of Flavor Volatiles by headspace-
solid phase microextraction (HS-SPME) by
GC-MS…………………………………………………………………………………………119
5.2.12 Color Properties……………………………………………………………120
5.2.13 Statistical Analysis…………………………………………………121
5.3 Results and discussions
5.3.1 Effect of debittering procedure on
flavonols, total polyphenols and
limonoids…………………………………………………………………………………122
5.3.2 Effect of debittering procedure on anti-
oxidant activity of neem tea………………………………124
5.3.3 Effect of debittering procedure on color
properties………………………………………………………………………………125
5.3.4 Effect of debittering procedure on the
volatile profile of neem tea………………………………127
5.4 Conclusions……………………………………………………………………………………………133
6.EFFECT OF TEA MATRIX AND TYPE OF MILK ON THE RECOVERY
OF FLAVONOLS, TOTAL PHENOLIC CONTENT AND ANTI-OXIDANT
ACTIVITY WITH AN APPLICATION TOWARDS READY TO DRINK
BEVERAGES (RTD’S)
6.1 Introduction…………………………………………………………………………………………134
6.2 Materials and Methods
6.2.1 Samples………………………………………………………………………………………137
6.2.2 Chemicals and standards……………………………………………138
6.2.3 Sample preparation…………………………………………………………138
6.2.4 Preparation of flavonol standards and
flavonol extraction………………………………………………………139
6.2.5 HPLC analysis………………………………………………………………………140
6.2.6 Total phenolic content by Folin-Ciocalteau
assay……………………………………………………………………………………………140
6.2.7 DPPH Anti-oxidant activity……………………………………141
6.2.8 Statistical analysis……………………………………………………141
6.2.9 Analysis of commercial sample……………………………142

vi
6.3 Results and discussions
6.3.1 Effect of tea matrix on in-vitro flavonols,
total phenolic content and DPPH anti-oxidant
activity………………………………………………………………………………………………143
6.3.2 Effect of different types of milk on flavonol
binding, total phenolic content DPPH anti-
oxidant activity…………………………………………………………………………150
6.3.3 Analysis of commercial sample………………………………………157
6.4 Conclusions………………………………………………………………………………………………………158
FUTURE DIRECTION OF RESEARCH……………………………………………………………………159
REFERENCES……………………………………………………………………………………………………………………164
VITA……………………………………………………………………………………………………………………………………190

vii
List of Figures
Number of papers based on Web of Knowledge search for
years 2006–2011…………………………………………………………………………………………………………8
Application of SPME to different food matrices………………………8
SPME Fiber assembly………………………………………………………………………………………………9
Steps in Headspace SPME coupled with GC-MS…………………………………10
Different classes of compounds found in essential
oils……………………………………………………………………………………………………………………………15, 16
Basic skeleton structure of flavonoids……………………………………………22
Different flavonoid classes…………………………………………………………………………23
DPPH anti-oxidant assay……………………………………………………………………………………31
FRAP assay………………………………………………………………………………………………………………………33
Structures of some limonoids………………………………………………………………………36
Metabolic pathway of limonin………………………………………………………………………39
Chromatogram shows us three well separated peaks at 6.61,
9.81 and 12.96 mins when the signal is recorded at 370 nm
with a photo diode array detector…………………………………………………………60
Structures of investigated flavonols…………………………………………………61
MS/MS spectrum of myricetin…………………………………………………………………………62
MS/MS spectrum of quercetin…………………………………………………………………………63
MS/MS spectrum of kaempferol………………………………………………………………………63
Retro Diels Alder cleavage of the C ring………………………………………64
Total phenolic content in the ethanolic extract of
various tea samples………………………………………………………………………………………………67
Total phenolic content in the ethanolic extract of
various tea samples………………………………………………………………………………………………68
Co-relation between FRAP values and total phenolic
content………………………………………………………………………………………………………………………………69
viii
Co-relation between DPPH values and total phenolic
content………………………………………………………………………………………………………………………………69
Distribution of flavonols in commercial neem capsules in
ethanolic extract and infusion…………………………………………………………………73
Percentage (%) of different classes of compounds as
identified from the headspace of various neem samples by
SPME and GC-MS……………………………………………………………………………………………………………81
Score plot for dried leaf powder (DLP), dry leaf (DL) and
fresh leaf (FL)…………………………………………………………………………………………………………82
Loading plot for variables of dried leaf powder, dry leaf
and fresh leaf……………………………………………………………………………………………………………82
Number of mono- and sesquiterpenes in only bark, only
leaves or found in both tissues………………………………………………………………82
Chromatograms of the various neem leaf and bark
samples………………………………………………………………………………………………………………………85,86
Effect of DP on quercetin in neem tea……………………………………………122
Effect of DP on the total phenolic content in neem
tea………………………………………………………………………………………………………………………………………123
Effect of de-bittering procedure on the limonoid content
of neem
tea………………………………………………………………………………………………………………………………………124
Effect of de-bittering procedure on the FRAP anti-oxidant
assay in neem tea…………………………………………………………………………………………………125
Effect of de-bittering procedure on the DPPH anti-oxidant
activities in neem tea……………………………………………………………………………………126
Principal Component Analysis (PCA)- Score Plot. This
shows the clustering tendency of neem tea (control) and
the two de-bittered (treated) samples……………………………………………128
Loading plot of the variables reveals the specific
volatiles (variables) that help discriminate between neem
tea (control) and the two de-bittered samples
(treatments)………………………………………………………………………………………………………………129
HPLC chromatograms of control (above) and treatment
(below) samples………………………………………………………………………………………………………144
Comparative reduction in myricetin due to bovine milk
addition in different tea matrices……………………………………………………145

ix
Comparative reduction in quercetin due to bovine milk
addition in different tea matrices……………………………………………………145
Comparative reduction in kaempferol due to bovine milk
addition in different tea matrices……………………………………………………146
Reduction in total phenolic content on addition of bovine
milk to different tea matrices………………………………………………………………148
Reduction in DPPH anti-oxidant activity on addition of
bovine milk to different tea matrices……………………………………………150
Comparative reduction in myricetin due to the addition of
different types of milk to green tea………………………………………………152
Comparative reduction in quercetin due to the addition of
different types of milk to green tea………………………………………………152
Comparative reduction in kaempferol due to the addition
of different types of milk to green tea………………………………………153
Reduction in total phenolic content on addition of
different types of milk to green tea………………………………………………154
Reduction in DPPH anti-oxidant activity after the
addition of different types of milk to green
tea………………………………………………………………………………………………………………………………………155

x
List of Tables
Means of individual flavonols in ethanolic extract and
infusion of various tea samples………………………………………………………………65
Means of anti-oxidant activities – FRAP and DPPH activity
in the ethanolic extract of various tea samples……………………70
Means of anti-oxidant activities – FRAP and DPPH activity
in the infusion of various tea samples……………………………………………70
Limonoid content in neem leaf and bark samples in the
ethanolic extract……………………………………………………………………………………………………72
Limonoid content in neem leaf and bark samples in the
infusion……………………………………………………………………………………………………………………………72
Volatile compounds in the different samples of neem as
identified and quantified (%RA= %Relative Abundance) by
GC-MS……………………………………………………………………………………………………………………………………91
Volatiles, unique to essential oil, as identified and
quantified (%RA= %Relative Abundance) by GC-MS……………………105
The difference in color parameters of neem and de-
bittered neem tea…………………………………………………………………………………………………126
Volatile compounds in NT and the two de-bittered samples
identified on a DB-5 MS column………………………………………………………………130
Amount of flavonols-myricetin, quercetin and kaempferol
in tea samples…………………………………………………………………………………………………………143
The total phenolic content of various tea samples as
determined by the Folin’s assay……………………………………………………………147
The DPPH anti-oxidant activity of various tea samples…149
Nutritional differences between skimmed milk, soya milk
and almond milk………………………………………………………………………………………………………151

xi
FUNCTIONALITY OF AZADIRACHTA INDICA A. JUSS
(NEEM) IN BEVERAGES
Abhinandya Datta
Dr. Ingolf Grün, Dissertation supervisor
ABSTRACT
A significant increase in the health consciousness of
people all around the world has rekindled interest in age
old medicinal systems such as Ayurveda and Unani. The
various trees, herbs and shrubs used in these ancient
practices are being incorporated today into foods and
beverages to meet the health expectations of consumers
from their diet. There is an intense curiosity among
analytical chemists to identify the compounds that
contribute to the health benefits. Azadirachta indica A.
Juss is one such medicinal tree, indigenous to the Indian
sub-continent that has found a revered place among
village folks for its medicinal properties in being able
to cure gastro-intestinal, dental and skin problems.
Modern day research on cancer cell lines and animal
models have shown neem to possess excellent anti-
inflammatory, anti-cancer and anti-diabetic properties.
In the first section, we analyze commercially available
neem in the United States for its bio-active potential
and contrast it with traditionally consumed teas- green
and black tea. We found that the total polyphenols and
anti-oxidant activities in green and black tea are far
xii
higher than in neem, possibly due to the presence of
flavan-3-ols in these teas. However, we used LC-ESI-MS/MS
to identify specific flavonols- myricetin, quercetin and
kaempferol in neem leaves, which were present in greater
quantities in neem than in these teas. These flavonols
have been known to impart neem its anti-diabetic property
and therefore, its identification and quantification was
crucial. In the second study, we examine the volatile
profile of various neem leaf samples- powdered, dried and
fresh, through solid phase microextraction (SPME) and
essential oil extraction and analyze the constituents
using gas chromatography-mass spectrometry. Fresh leaves
contain organosulfur compounds that are absent in other
samples. There is a preponderance of sesquiterpenes found
in dried leaves and leaf powder. Diterpenes and acids
were found to be major distinguishing factors between the
HS-SPME and essential oil volatile composition of dried
neem leaf powder. The study reveals information about the
aroma profile of different neem samples besides lending
credence to its health properties as some of the
volatiles identified are known to possess health
properties. In the third section, we explore the area of
Ready to Drink beverages (RTD’s) and the consequences of
adding milk to tea. We observe, that while tea matrix-
green, neem and black tea, does not affect the decrease
in flavonols-myricetin, quercetin and kaempferol, the

xiii
overall in-vitro phenolic content and anti-oxidant
activity is reduced more markedly in green and black tea.
Among the different added milks, soya milk appeared to
have the least effect on flavonols, phenolic content and
anti-oxidant activity, in contrast with bovine and soya.
Although, protein-flavonoid interactions are important,
the change in protein content of milk did not explain the
changes in-vitro effect on phenolic compounds and
consequent anti-oxidant activity. In the final section,
we see explore the effect of two adsorbents based de-
bittering strategies on the bioactive potential and
organoleptic properties of neem tea. While both the solid
phase extraction (SPE) and Amberlite XAD-16 (AMB) are
successful in reducing the bitterness, both lead to a
reduction in flavonol, total polyphenol, limonoid
glucoside and anti-oxidant activity. On comparison, the
reduction in SPE- treated neem tea is more than the AMB-
treated, although both treatments lead to the removal of
sesquiterpenes from the volatile profile. Given our
results, the approach of using polyadsorbent resins for
de-bittering purposes can be pursued further.

1
CHAPTER 1
INTRODUCTION
1.1 BACKGROUND
Neem (Azadirachta indica A. Juss) is an evergreen,
medicinal tree indigenous to South-East Asia
(Bhattacharyya and Sharma 2004). It is also found in
tropical and sub-tropical regions of Africa, America and
Australia (Schmutterer 1990). Neem has been regarded for
centuries as the centerpiece of natural healing in the
villages of ancient Indian sub-continent. The taxonomic
position of the Neem tree is as follows:
Order: Rutales; Family: Meliaceae (mahogany family);
Genus: Azadirachta; Species: indica.
A repository of abundant medicinal compounds, which have
treated a multitude of diseases, neem has earned the
respectable title of ‘sarvaroga nivarini’ or the panacea
for all diseases (Arora and others 2008). All its parts
including the leaf, stem, bark, twig, seed and flowers
have been used for treating a wide variety of diseases.
Today, neem and its extracts have been commercialized
into tea, soaps, shampoos, toothpaste and other cosmetic
products. With a renewed interest in the age-old medical
wisdom of our ancestors and the discovery of new
analytical techniques, there is inquisitiveness in the
scientific world to understand the applications of neem

2
towards treating some of the most challenging diseases of
our times like cancer and diabetes.
There are several scientific papers elucidating the
therapeutic role of neem extracts in cancer cell lines
and model systems (Dasgupta and others 2004; Kumar and
others 2006a; Roy and others 2007; Gunadharini and others
2011), in diabetes (Dholi and others 2011; Ponnusamy and
others 2015; Mukherjee and Sengupta 2013), and its
efficacy of anti-fungal and anti-bacterial activity
(Gupta and Bhat 2016; Raghavendra and Balsaraf 2014;
Akpuaka and others 2013). Although there are quantitative
reports of bioactive limonoids, flavonoids and total
phenolics in neem, the amount of information regarding
specific compounds in these chemical groups is limited.
The studies on neem volatiles are comparatively fewer in
number. The volatile composition of neem leaves and seeds
has been studied by dynamic headspace extraction and
solid phase microextraction, respectively. The bark
volatiles have not been studied yet, although the gastro-
protective and anti-microbial effects of its extracts
have been elucidated (Bandyopadhyay and others 2002b; De
and Ifeoma 2002; Tiwari and others 2010). There is
literature documenting the anti-fungal (Zeringue and
Bhatnagar 1994) and pesticidal activity (Pathak and
Krishna 1991; Koul 2004; Balandrin and others 1988)of
neem leaf and seeds. Shivashankar and others (2012)

3
identified organosulfur compounds such as 2,5 dimethyl
thiophene; 3,4 dimethyl thiophene and 1,3 dithiane in
neem seeds whereas Zeringue and Bhatnagar (1994) observed
that the volatile profile of neem leaf was dominated by
ketones, which accounted for 43% of the total area
followed by alcohols, which occupied 23% of the
headspace.
A growing consumer consciousness about the health value
of their food choices has spawned the growth of a
category of food products called functional foods. These
foods and beverages aim to go beyond meeting the basic
everyday nutritional needs and provide us protection from
chronic diseases (Bigliardi and Galati 2013). Ready to
drink beverages, which comprise of bottled or canned ice
tea, coffee, fruit or vegetable smoothies, energy drinks,
yogurt drinks, are an important market segment of this
category.
Given the surge in popularity of tea as a health
beverage, it has been combined with milk to produce ready
to dink beverages that combine the health benefits of
both. However, this complex mixture can pose challenges
for food scientists given the interaction of milk
proteins with various tea components affecting the anti-
oxidant activity and bioavailability of polyphenols.
Complex formation of protein and phenolics results from
hydrogen binding and hydrophobic interactions (Prigent

4
and others 2003; Yuksel and others 2010). The scientific
community is split on the effect of milk addition on the
anti-oxidant activity and bioavailability of tea
polyphenols. While there are authors who observed that
the addition of milk to tea leads to a decrease in
polyphenol bioavailability and hence reduces the anti-
oxidant activity (Serafini and others 1996; Langley-Evans
2000; Ryan and Petit 2010; Arts and others 2002; Xiao and
others 2011)there are other authors, who suggested that
milk addition has no effect on the anti-oxidant activity
(Leenen and others 2000). Hollman and others (2001), and
Kivits and others (1998) suggested that the in-vivo bio-
availabilities of polyphenols are not affected in tea by
milk addition.
The rich content of phytonutrients, especially limonoids
leads to an extremely unpleasant bitter taste in neem
leaf. This poses a huge problem for the food industry, as
bitterness usually has an inverse impact on consumer
acceptability of food products and beverages. While
several de-bittering methods have been employed in the
food industry for orange juice (Fernández‐Vázquez and
others 2013), grapefruit juice (Lee and Kim 2003),
legumes (Jiménez‐Martínez and others 2009) and other
bitter foods and beverages, they can often lead to a loss
of nutritional and sensorial properties that is

5
undesirable. Therefore, it is important to opt for a de-
bittering procedure, which is able to reduce the
bitterness without affecting the bioactive profile and
organoleptic properties adversely.
1.2 OBJECTIVES
In our study, we aimed to further support the medicinal
claims of Azadirachta indica by identifying and
quantifying polyphenols and volatile compounds
responsible for its health value. We further analyzed the
challenges a food scientist may face in incorporating
neem into food products, specifically working with neem
tea. In this regard, we analyzed the effect of various
milks (bovine, soy and almond) on the in-vitro measure
amounts of neem flavonols (polyphenols) with an
application in ready to drink beverages (RTD’s). Since
neem is rich in limonoids that impart bitterness, we
attempted to come up with adsorbent based de-bittering
strategies. We further investigated the impact of these
de-bittering strategies on neem tea with regards to its
polyphenolic, anti-oxidant and sensory properties.
Specific objectives of this study are:
1. To identify and quantify select flavonoids in neem leaf
extracts (ethanolic and water) and compare them to green
and black through HPLC-DAD-ESI- MS/MS.
6
2. Study neem volatiles as extracted by headspace solid
phase microextraction (HS-SPME) and hydrodistillation
and analyzed by gas chromatography-mass spectrometry.
3. Study the interaction of milk proteins and flavonoids,
its effect on anti-oxidant capacity and its potential
application in Ready to Drink beverages (RTD’S).
4. Assess the impact of two adsorbent based de-bittering
procedures on the polyphenolic, anti-oxidant and
organoleptic properties of neem tea.

7
CHAPTER 2
LITERATURE REVIEW
2.1 Headspace Solid-Phase Microextraction (HS-
SPME)
Since its introduction in the 1990’s, solid phase
microextraction (SPME) has emerged as the preferred tool
for the extraction of volatiles in the analytical
chemistry world. Invented by Pawliszyn and Arthur in
1990, SPME has found extensive usage for extraction of
flavor volatiles in the food industry. It has several
advantages over traditional extraction techniques, such
as solvent assisted flavor evaporation (SAFE), liquid-
liquid extraction (L/L E), high vacuum transfer (HVT),
and has become the extraction technique of choice (Jeleń
and others 2012). Fig 1 A. shows the dramatic increase in
the number of publications involving SPME compared to
other methods during the period of 2006-2011. Besides
being cheap, sensitive, highly reproducible and offering
fast sampling times, SPME is solventless and provides a
high degree of enrichment of the analytes of interest
(Wardencki and others 2004). SPME can be automated but
the manual form is also convenient to use, offering
cheap, reusable holders in which the fiber can be
replaced (Jeleń and others 2012). A literature search on
SPME reveals that is has an abundance of applications

8
with it being used for fruits and vegetables second only
to wine, as depicted in Fig 1.B.
Fig 1. A. Number of papers based on Web of Knowledge
search for years 2006–2011(Jeleń and others
2012)
B. Application of SPME to different food matrices
(Jeleń and others 2012)
The SPME fiber assembly consists of a fiber holder and a
cylindrical shaped fused silica fiber inside a stainless-
steel needle, as shown in Fig.2. The needle is connected
to a syringe so that the coated fiber can be protruded
outside or drawn-in when needed. The fused silica fiber

9
is coated with a relatively thin film (in the order of
microns) of various polymeric stationary phases.
Fig. 2 SPME Fiber assembly (Vas and Vekey 2004)
The SPME fiber is placed either in contact with the
sample matrix (direct immersion) or into the headspace
above (Pragst and others 2001)for a predetermined amount
of time. The analyte(s) are extracted directly from an
aqueous, gaseous or headspace above the solid or liquid
samples onto a stationary phase. Then, the extracted
analytes are desorbed either by thermal means or by using
a solvent and analyzed by gas chromatography or high
pressure liquid chromatography.
10
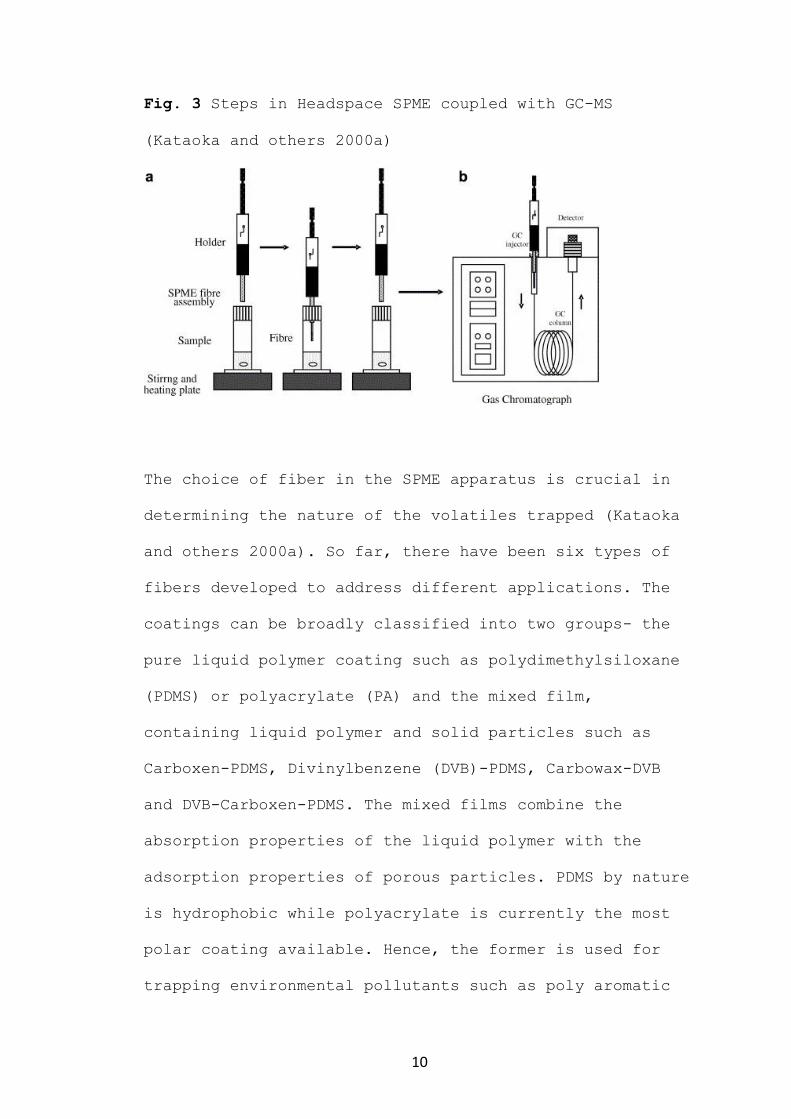
Fig. 3 Steps in Headspace SPME coupled with GC-MS
(Kataoka and others 2000a)
The choice of fiber in the SPME apparatus is crucial in
determining the nature of the volatiles trapped (Kataoka
and others 2000a). So far, there have been six types of
fibers developed to address different applications. The
coatings can be broadly classified into two groups- the
pure liquid polymer coating such as polydimethylsiloxane
(PDMS) or polyacrylate (PA) and the mixed film,
containing liquid polymer and solid particles such as
Carboxen-PDMS, Divinylbenzene (DVB)-PDMS, Carbowax-DVB
and DVB-Carboxen-PDMS. The mixed films combine the
absorption properties of the liquid polymer with the
adsorption properties of porous particles. PDMS by nature
is hydrophobic while polyacrylate is currently the most
polar coating available. Hence, the former is used for
trapping environmental pollutants such as poly aromatic

11
hydrocarbons(PAH) while the latter coating is used for
analyzing fatty acids and reduced sulfur compounds.
Carboxen is a carbon molecular sieve containing macro-,
meso- and micropores and is used in combination with
PDMS. The pore size does not allow the bigger molecules
to enter the micropores (where the interactions are the
strongest), so that the combination of Carboxen and PDMS
improves the extraction for small molecules (Popp and
Paschke 1997; Azodanlou and others 1999). The
divinylbenzene solid polymer has larger pores than
Carboxen and is thus better adapted for the extraction of
bigger molecules such as aniline derivatives (Müller and
others 1997; DeBruin and others 1998).
The DVB-Carboxen-PDMS fiber extracts a very wide spectrum
of analytes varying in polarity and size. The first layer
is made of PDMS/ Carboxen and is covered with a second
layer made of PDMS/DVB. The small molecules, having a
higher diffusion coefficient, reach the inner layer
faster where they are adsorbed onto the Carboxen. The
heavier molecules are retained in the outer of DVB layer.
Desorption is also facilitated with this configuration.
The Carbowax-DVB is the most polar fiber of the second
group.
The affinity of the fiber for an analyte depends on the
principle of “like dissolves like” (Kataoka and others
2000a). Thus, the polarity of the fiber coating and the
12
nature of the target compounds intended to be extracted
from a food sample should be kept in mind. The fiber
thickness can also affect the nature and the amount of
the target analyte adsorbed onto the fiber (Kataoka and
others 2000a). The extraction efficiency of analytes is
also dependent upon, and can be improved, by heating the
sample, saturating the sample with salts, or agitating
the sample using a magnetic stir bar (Vázquez and others
2008; Psillakis and Kalogerakis 2001). The addition of
salt increases the ionic strength of the solution leading
to a “salting out” effect, which decreases the solubility
of the target analyte thereby, improving the extraction
efficiency. The attainment of equilibrium between the
sample and fiber is necessary to achieve maximum
sensitivity during SPME extraction (Jeleń and others
2012). After equilibrium is attained between the sample
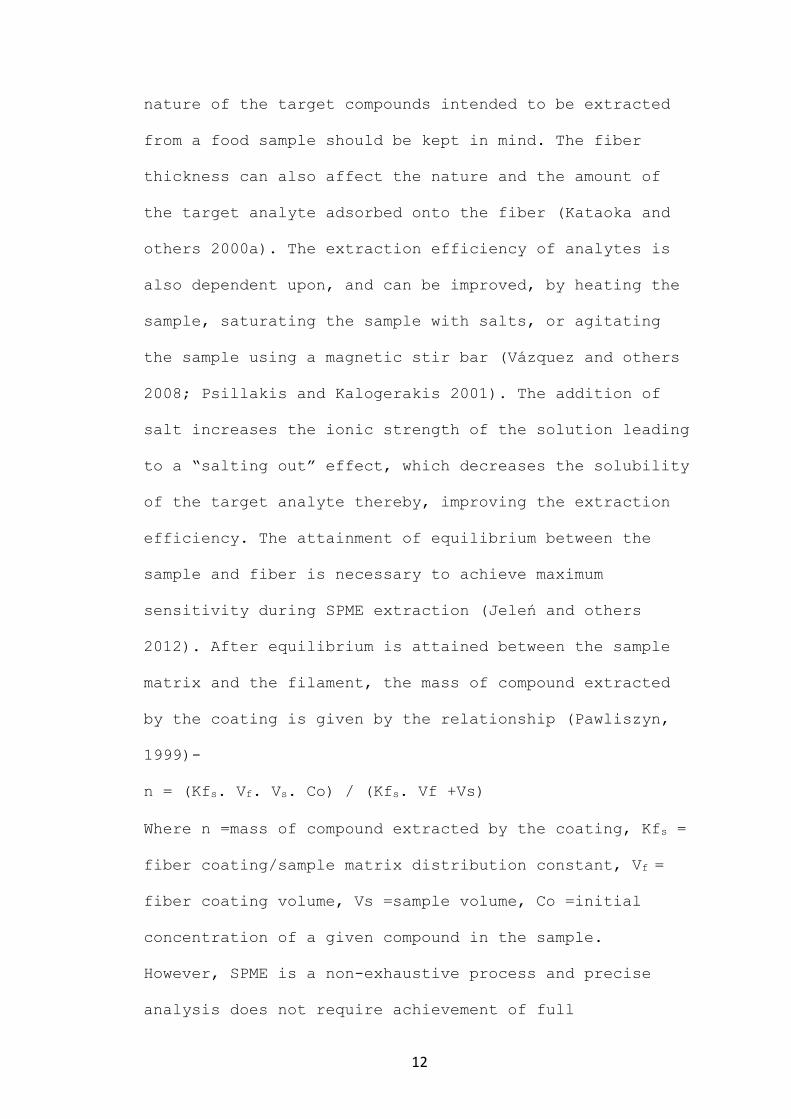
matrix and the filament, the mass of compound extracted
by the coating is given by the relationship (Pawliszyn,
1999)-
n = (Kfs. Vf. Vs. Co) / (Kfs. Vf +Vs)
Where n =mass of compound extracted by the coating, Kfs =
fiber coating/sample matrix distribution constant, Vf =
fiber coating volume, Vs =sample volume, Co =initial
concentration of a given compound in the sample.
However, SPME is a non-exhaustive process and precise
analysis does not require achievement of full

13
equilibration (Jeleń and others 2012) .This is because of
the linear relationship between the amount of analyte
adsorbed by the SPME fiber and its initial concentration
in the sample matrix under non-equilibrium conditions
(Kataoka and others 2000b) .
2.2 Essential Oils
Essential oils (EO) are volatile, natural, complex
compounds characterized by a strong odor and are formed
by aromatic plants as secondary metabolites (Bakkali and
others 2008). They are also called volatile or ethereal
oils (Guenther 1948). While they can be extracted by
expression, fermentation, enfleurage or extraction, the
method of steam distillation is most commonly used for
commercial production of essential oils. Essential oils
have been used for centuries in medicine, perfumery,
cosmetic, and have been added to foods as part of spices
or herbs.
They contain hydrocarbons, such as monoterpenes,
sesquiterpenes and diterpenes, and oxygenated organic
compounds, such as alcohols, esters, ethers, aldehydes,
ketones, lactones, phenols and phenol ethers (Guenther
1972). The composition varies with respect to plant
species and geographical areas in which they are
cultivated (Zygadlo and others 2003). They can be
extracted from different parts of the plant such as from
14
flowers, buds, seeds, leaves, twigs, bark, herbs, wood,
fruits and roots (Sánchez-González and others 2011).
Essential oils protect plants through their insect
repellant activity (Jaenson and others 2006; Govere and
others 2000), because many monoterpenes, sesquiterpenes
and diterpenes (Kiran and others 2007; Jaenson and others
2006; Sukumar and others 1991; Odalo and others 2005)
have been associated with insect repellant activity. For
example, beta–caryophyllene, a sesquiterpene found in
several essential oils has been found to have strong
insect repellant activity against A. aegypti (yellow
fever mosquito) (Gillij et al., 2008). Moreover, the
oxygenated compounds phenylethyl alcohol, b-citronellol,
cinnamyl alcohol, geraniol, and alpha-pinene, isolated
from the essential oil of Dianthus caryophyllum, showed
strong repellent activities against ticks (I. ricinus)
(Tunón and others 2006).
Given the myriad of chemical compounds found in EOs, the
mechanism of anti-microbial action cannot likely be
attributed to a single mechanism (Skandamis and Nychas
2001; Carson and others 2002).
Since essential oil components are hydrophobic in nature,
they can partition into the cell membrane lipid layer and
disrupt it allowing the leakage of important cell
components and ions (Sikkema and others 1994; Oosterhaven
and others 1995; Carson and others 2002; Skandamis and
15
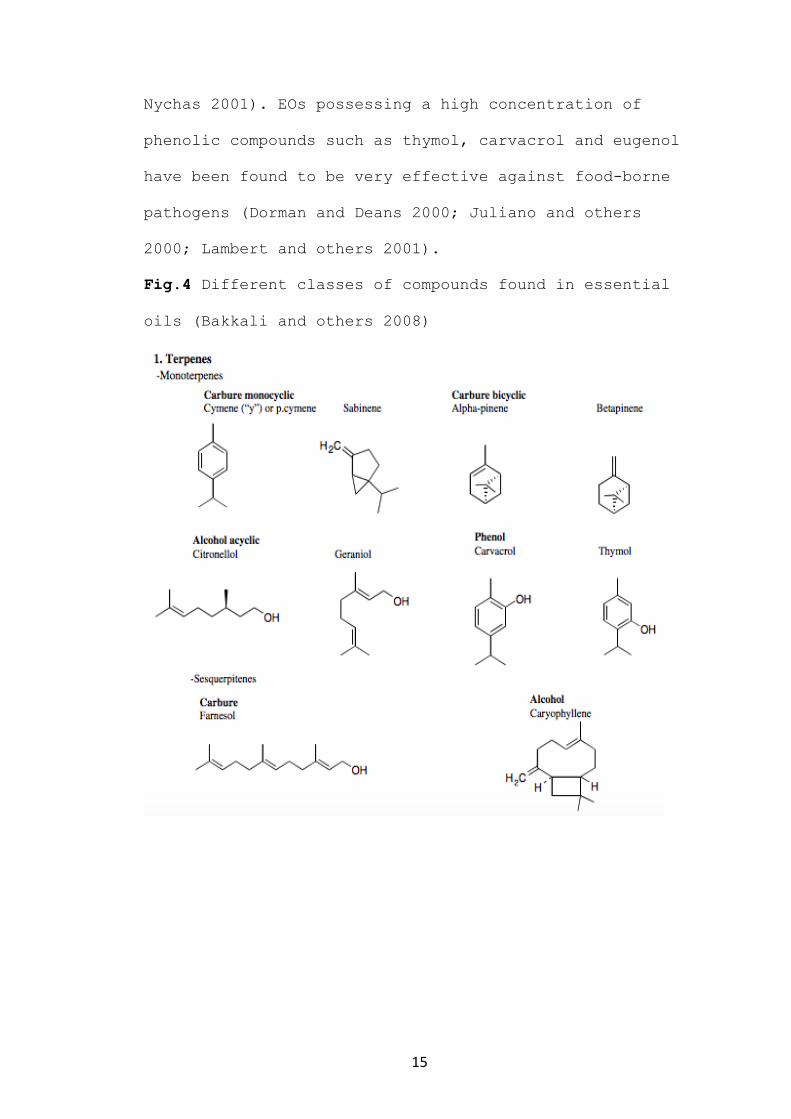
Nychas 2001). EOs possessing a high concentration of
phenolic compounds such as thymol, carvacrol and eugenol
have been found to be very effective against food-borne
pathogens (Dorman and Deans 2000; Juliano and others
2000; Lambert and others 2001).
Fig.4 Different classes of compounds found in essential
oils (Bakkali and others 2008)

16
The structural configuration of EO components also affect
the efficiency of anti-microbial action. The change in
position of the hydroxyl group in the phenolic ring in
carvacrol and thymol, were found to affect how they acted
against gram-positive and gram-negative species (Dorman
and Deans 2000). The lack of the phenolic ring itself
(destabilized electrons) seems to have an impact on the
anti-microbial activity as seen with menthol compared to
carvacrol (Ultee and others 2002). The addition of an
acetate moiety, such as in the conversion of geraniol to
geranyl acetate, increased the anti-microbial activity

17
(Dorman and Deans 2000). In non-phenolic compounds, the
saturation of the alkyl groups seems to affect the
activity against micro-organisms as seen in the case of
limonene ((1-methyl-4-(1-methylethenyl)-cyclohexene),
which was found to be more effective than p-cymene (1-
Methyl-4-(1-methylethyl) benzene)(Dorman and Deans 2000).
Another possible mechanism by which EO components act on
cell membranes is by affecting proteins located in the
bilipid layer (Knobloch and others 1989). Two probable
ways in which cyclic hydrocarbons in EOs work is by
either accumulating in the bilipid layer and disrupting
the lipid–protein interaction or by direct interaction of
the lipophilic compounds with hydrophobic parts of the
protein (Juven and others 1994). Cinnamon oil and its
components have been shown to inhibit amino acid
decarboxylases in Enterobacter aerogenes by possibly
directly binding with the protein (Wendakoon and
Sakaguchi 1995).
In the context of food borne pathogens and food spoilage
bacteria, EOs have been found to be more effective
against gram-positive than gram-negative bacteria. This
is because of the presence of a cell wall in gram
negative bacteria (Ratledge and Wilkinson 1988), which
restricts diffusion of hydrophobic compounds through its
lipopolysaccharide covering (Vaara 1992).
18
The phenolic and terpenoid compounds in EO’s make them
potent anti-oxidants, which has been measured by chemical
assays (Bektaş and others 2016; Yassa and others 2015).
One of the organelles attacked by the EO seems to be the
mitochondria. As proposed by Bakkali and others (2008),
EOs disrupt the mitochondrial membrane. When this
happens, there are changes in the electron transport
chain, leading to the production of free radicals which
then damage DNA, proteins and lipids (Van Houten and
others 2006). Moreover, some of the phenolic constituents
of EOs react with reactive oxygen species (ROS) to
produce highly reactive phenoxyl radicals which cause
further damage. These types of radical reactions are
dependent on and enhanced by the presence of cell
transition metal ions such as Fe++, Cu++, Zn++, Mg++ or
Mn++ (Stadler and Fay 1995; Sakihama and others 2002;
Jiménez‐Martínez and others 2009; Azmi and others 2006).
Essential oils, being volatile, are being widely used in
aromatherapy. Lavender essential oil, with its two main
components linalool and linalyl acetate, has been
successfully shown to have a sedative effect (Buchbauer
and others 1991). Essential oils of lavender, rose,
orange, bergamot, lemon, sandalwood, clary sage, Roman
chamomile and rose scented germanium have found extensive
usage in reduction of anxiety, stress and depression
(Setzer 2009).

19
The crude essential oils classified as GRAS by FDA
include, amongst others, clove, oregano, thyme, nutmeg,
basil, mustard, and cinnamon (Carson and others 2002).
There are regulatory limitations on the accepted daily
intake of essential oils or essential oil components. So,
before they can be used in food products, a daily intake
survey should be available for evaluation by FDA
(Hyldgaard and others 2012). However, the research into
the use of essential oils in food preservation has
yielded encouraging results. Singh and others (2002) used
thyme oil treatment followed by aqueous chlorine
dioxide/ozonated water, or ozonated water/aqueous
chlorine dioxide and saw that it caused a significant
3.75 and 3.99 log, and 3.83 and 4.34 log reduction in E.
coli O157:H7, when applied on lettuce and baby carrots,
respectively.
Chouliara and others (2007) observed an additional
preservation effect on fresh chicken breast meat, when
oregano essential oil (0.1% and 1% w/w) and modified
atmosphere packaging (MAP) (30% CO2/70% N2 and 70% CO2/30%
N2) were applied in combination. In yet another study,
the addition of 0·8% (v/w) oregano essential oil to beef
meat fillets resulted in an initial reduction of 2–3
log of the majority of the bacterial population
(Tsigarida and others 2000).
20
Despite these positive results, there are limitations to
the use of essential oils in food systems because of
their intense aroma which may alter the sensory profile
of the food, even at low concentrations (Lv and others
2011). The fact that essentials oils possess anti-
microbial activity only at high concentrations limits its
usage.
Furthermore, there are food matrices in which the EO
constituents are rendered ineffective due to their
interaction with fat (Rattanachaikunsopon and
Phumkhachorn 2010), starch (Gutierrez and others 2008)
and proteins (Kyung 2012).
In spite of the fact that a considerable number of EO
components are GRAS and/or approved food flavorings, some
research data indicate irritation and toxicity, for
example, with eugenol, menthol and thymol in root canal
treatments (Gómez-López 2012).
Some EOs and their components have been known to cause
allergic contact dermatitis in people who use them
frequently (Carson and Riley 2001). Splasmogenic
properties have been seen in essential oils used in
aromatherapy and paramedicine, although it was not
possible to link it with a specific component (Madeira
and others 2002). It is recommended that more safety
studies be carried out before EOs are more widely used or
at greater concentrations in foods that at present.

21
2.3 Flavonoids and their health benefits
Flavonoids are secondary plant metabolites, nearly
ubiquitous in plants and are recognized as the pigments
responsible for the colors of leaves (Middleton and
others 2000). Over 5000 structurally unique flavonoids
have been identified in plant sources (Xia and others
2013). Flavonoids possess low molecular weights and
comprise of the basic structure of fifteen carbon atoms,
arranged in a C6–C3–C6 configuration (Ignat and others
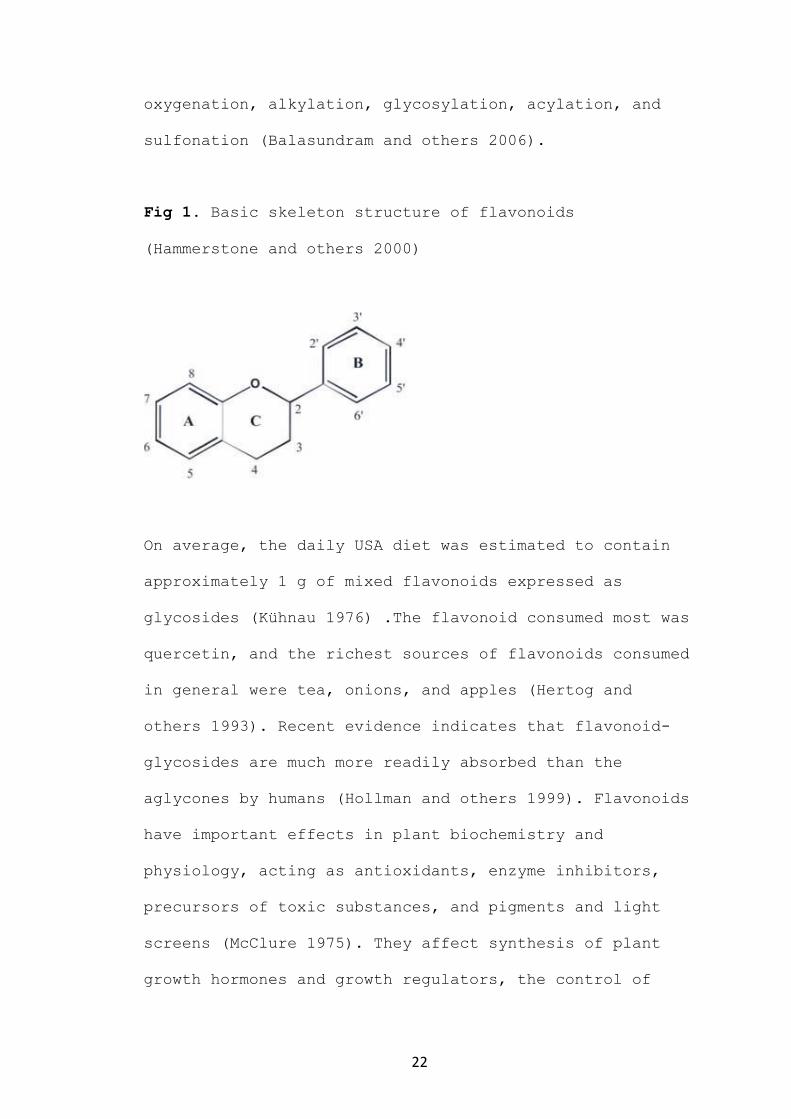
2011). They contain two benzene rings (A and B) linked
through a heterocyclic pyran or pyrone (with a double
bond) ring (C) in the middle (Middleton and others 2000),
as shown in Fig. 1. The aromatic ring A is derived from
the acetate/malonate pathway, while ring B is derived
from phenylalanine through the shikimate pathway (Merken
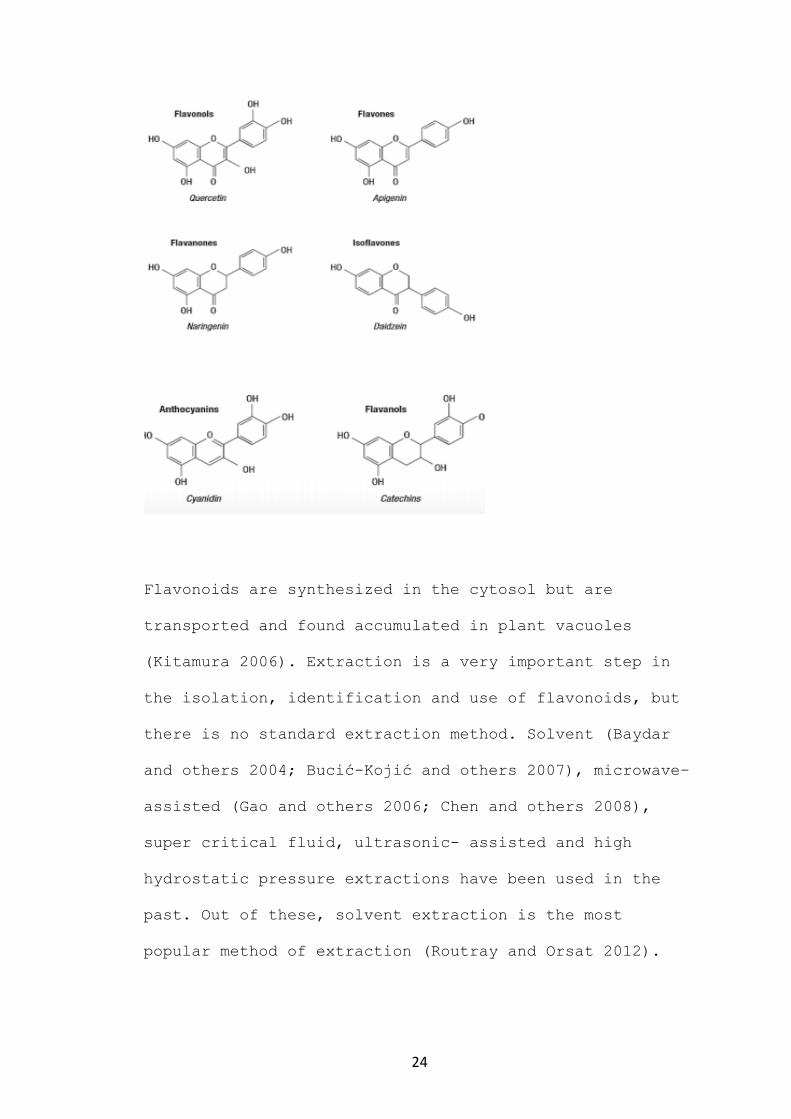
and Beecher 2000). Variations in the substitution
patterns of ring C results in the major flavonoid
classes, i.e., flavonols, flavones, flavanones, flavanols
(or catechins), isoflavones, flavanonols, and
anthocyanidins (Hollman and others 1999) of which
flavones and flavonols are the most widely occurring and
structurally diverse (Harborne and others 1999), as
depicted in Fig. 2. Substitutions to rings A and B give
rise to different compounds within each class of
flavonoids (Pietta 2000). These substitutions may include
22
oxygenation, alkylation, glycosylation, acylation, and
sulfonation (Balasundram and others 2006).
Fig 1. Basic skeleton structure of flavonoids
(Hammerstone and others 2000)
On average, the daily USA diet was estimated to contain
approximately 1 g of mixed flavonoids expressed as
glycosides (Kühnau 1976) .The flavonoid consumed most was
quercetin, and the richest sources of flavonoids consumed
in general were tea, onions, and apples (Hertog and
others 1993). Recent evidence indicates that flavonoid-
glycosides are much more readily absorbed than the
aglycones by humans (Hollman and others 1999). Flavonoids
have important effects in plant biochemistry and
physiology, acting as antioxidants, enzyme inhibitors,
precursors of toxic substances, and pigments and light
screens (McClure 1975). They affect synthesis of plant
growth hormones and growth regulators, the control of

23
respiration, photosynthesis, morphogenesis, and sex
determination, as well as defense against infection
(Smith and Banks 1986). Its anti-inflammatory, anti-
oxidant, hepatoprotective, antiviral, and anti-
carcinogenic activities (Fu and others 2013; Huang and
others 2015; Sirovina and others 2013; Romagnolo and
Selmin 2012; Liu and others 2008b) have been well
documented. A renewed interest in traditional folk
medicine, along with the development of analytical
methodologies, has rekindled interest in the flavonoids
and the need to understand their interaction with
mammalian cells and tissues.
Fig 2. Different flavonoid classes (Ignat and others
2011)
24
Flavonoids are synthesized in the cytosol but are
transported and found accumulated in plant vacuoles
(Kitamura 2006). Extraction is a very important step in
the isolation, identification and use of flavonoids, but
there is no standard extraction method. Solvent (Baydar
and others 2004; Bucić-Kojić and others 2007), microwave–
assisted (Gao and others 2006; Chen and others 2008),
super critical fluid, ultrasonic- assisted and high
hydrostatic pressure extractions have been used in the
past. Out of these, solvent extraction is the most
popular method of extraction (Routray and Orsat 2012).
25
The extraction process usually involves a pre-treatment
step aimed at increasing the contact surface area between
the solvent and the sample. These pretreatment steps lead
to the breakdown of cellular structures, which further
enhances the yield of the bioactive compounds. Some of
these steps include maceration, centrifugation,
vortexing, homogenization, grinding, milling, or drying
(generally freeze drying to prevent degradation of
flavonoids)(Routray and Orsat 2012; Merken and Beecher
2000).
The extraction efficiency depends on several factors such
as a time, temperature, nature of solvent, liquid-solid
ratio, flow rate and particle size. The most common
solvents used are water, methanol or ethanol (Fiamegos
and others 2004; Wang and Helliwell 2001; Wang and others
2003; Chu and others 2000).
Flavonoids exist in both glycoside and aglycone forms (Lv
and others 2015). For ease of analysis, the glycosides
are usually hydrolyzed into the common aglycone form.
Both acidic and alkaline hydrolysis are done. Although
reaction times and temperatures for the acidic and
alkaline hydrolysis conditions vary a great deal, this
general method involves treating the plant extract or
food sample itself with inorganic acid (HCl) (Escarpa and
González 2001)or NaOH (1-2 M) (Shahrzad and Bitsch

26
1996)at reflux or above reflux temperatures in aqueous or
alcoholic solvents.
High Pressure Liquid Chromatography (HPLC) has emerged as
the analytical tool of choice for the separation,
identification and quantification of flavonoids (Wang and
Helliwell 2001; Ooh and others 2015; Tomás-Barberán and
others 2001). The chromatographic mode is, almost
exclusively, reverse phase performed on a C18 column. The
mobile phase usually consists of a binary solvent system,
with gradient elution, containing acidified water
(solvent A) and a polar organic solvent (solvent B).
UV/VIS diode array detector (DAD)(Sakakibara and others
2003), mass or tandem mass spectrometry (Ali and Alan
2015; Qiao-Hui and others 2016) have been the detectors
of choice.
For complex matrices, pre-concentration steps such as
solid phase extraction (SPE) (Lalaguna 1993;
Michalkiewicz and others 2008) and divinylbenzene styrene
resins such as XAD 4 OR XAD-16 (Liu and others 2008b; Li
and others 2005) are used to remove interfering
components.
Flavonoids contain conjugated ring structures and
hydroxyl groups that have the potential to function as
antioxidants in vitro or in cell free systems by
scavenging superoxide anion, singlet oxygen, lipid
peroxyradicals, and stabilizing free radicals involved in
27
oxidative processes through hydrogenation or complexing
with oxidizing species (Yao and others 2004).
Flavonoids are thought to mediate their anti-oxidant
action by the following mechanisms:
Direct radical scavenging involves the acceptance of
electrons by the flavonoid from free radicals to oxidize
itself to form a less-reactive radical. This can be best
described by the equation:
Flavonoid (OH) + R• > flavonoid (O•) + RH (Nijveldt and
others 2001)
where R• is a free radical and O• is an oxygen free
radical. The protective action of flavonoids in
preventing LDL (Low Density Lipoprotein) oxidation to
prevent atherosclerosis is because of this free radical
scavenging function (Hirano and others 2001; Fuhrman and
Aviram 2001).
Interfering with nitric oxide synthase activity is
another mechanism through which flavonoids attenuate free
radicals. The inorganic free radical nitric oxide (NO)
has been implicated in physiological and pathological
processes such as vasodilation, non-specific host
defense, ischemia reperfusion injury, and chronic or
acute inflammation (Matsuda and others 2003). Apigenin,
diosmetin, tetra-O-methylluteolin and hexa-O-
methylmyricetin were found to show potent nitric oxide
synthase inhibitory activity (Matsuda and others 2003).

28
Nitric oxide released by activated macrophages reacts
with free radicals to form peroxynitrite that has an
oxidative effect on low-density lipoproteins (LDLs)
(Jessup and others 1992). Haenen and others (1997) found
that the peroxynitrite scavenging activity of flavonoids
was found to be 10 times more than the known
peroxynitrite scavenger ebselen. This effect has a direct
bearing on the beneficial effect of flavonoids and the
incidence of coronary heart disease (Haenen and others
1997).
The flavonoids react with the free radicals to counteract
the formation of peroxynitrite. Nitric oxide, although
being a vasodilator, can on its own be regarded as a free
radical. There are reports of flavonoids directly
scavenging nitric oxide molecules.
In humans, xanthine oxidase is a flavoprotein enzyme
responsible in catalyzing the oxidative hydroxylation of
hypoxanthine and xanthine to produce uric acid and
subsequent reduction of O2 at the flavin center with
generation of reactive oxygen species, either superoxide
anion radical or hydrogen peroxide (Boban and others
2014). Excessive uric acid deposits in joints and causes
a painful disorder called gout (Martinon and others
2006). Furthermore, there is overwhelming acceptance that
xanthine oxidase is associated with pathological
conditions involving inflammation, metabolic disorders,
29
cellular aging, reperfusion damage, atherosclerosis,
hypertension, and carcinogenesis (Dawson and Walters
2006; Pacher and others 2006). Flavonoids have shown to
have an inhibitory effect on xanthine oxidase (Lin and
others 2015; Cos and others 1998). The hydroxyl groups at
C-5 and C-7 and the double bond between C-2 and C-3 were
found to be essential for a high inhibitory activity on
xanthine oxidase (Cos and others 1998).
Several flavonoids have exhibited an iron and copper
chelating activity (Mira and others 2002). In fact, the
prominent anti-oxidant activity of the flavonoid
quercetin is attributed to its iron chelating activity by
which it is able to suppress DNA strand scission and
cytotoxicity caused by tert-butylhydroperoxide (Sestili
and others 1998). Quercetin, catechin and diosmetin have
been implicated in prevention of iron induced lipid
peroxidation of rat hepatocytes (Morel and others 1993).
Eicosanoids derived from arachidonic acid metabolism,
including products from cyclooxygenase (COX)
(prostaglandins) and lipoxygenase (LOX) (leukotrienes),
seem to also play a critical role in inflammation.
Flavonoids have been implicated in an anti- inflammatory
role (MORONEY and others 1988; Ferrandiz and Alcaraz
1991). For example, cyanidin-3-glucoside has shown
inhibitory effects on the production of several mediators
during inflammation in the colonic carcinoma cell line

30
HT29 by down-regulating COX-2 (cyclooxygenase)
expression. Quercetin glycoside, quercitrin when
administered under 5mg/kg body weight showed anti-
inflammatory response in different model systems
(Comalada and others 2005; de Medina and others 1996).
Oxidative damages to cells have been implicated in cancer
(Paz-Elizur and others 2008), liver disease(Preedy and
others 1998), Alzheimer’s disease (Moreira and others
2005), aging (Liu and Mori 2005), arthritis (Čolak 2008),
inflammation (Mukherjee and others 2007), diabetes (Rains
and Jain 2011) and other diseases.
A biological antioxidant has been defined as “any
substance that, when present at low concentrations
compared to those of an oxidizable substrate,
significantly delays or prevents oxidation of that
substrate” (Halliwell and Gutteridge 1999). The
beneficial effects of polyphenols in fruits, vegetables
and various plant products has been attributed to their
anti-oxidant capacity. There are several methods to
measure the anti-oxidant capacity of foods and beverages
but each of them come with their drawbacks.
DPPH or 2,2- Diphenyl-1-picrylhydrazyl assay is a widely-
used method of measuring anti-oxidant capacity of
biological systems. 2,2- Diphenyl-1-picrylhydrazyl is a
stable organic nitrogen radical, which has a purple color
(MacDonald‐Wicks and others 2006). The principle of the

31
assay is based on the decolorization of the DPPH radical
due to the presence of anti-oxidants, which is measured
at 515 nm (Moon and Shibamoto 2009)(Fig. 3). The decrease
in the absorbance of the test sample is proportional to
the concentration of anti-oxidants in the sample.
Fig. 3 DPPH anti-oxidant assay (Moon and Shibamoto 2009)
The assay tests the ability of compounds to act as
hydrogen donors (Brand-Williams and others 1995). It is
simple, rapid and can be performed with a
spectrophotometer. However, the assay has several

32
drawbacks. Carotenoids, which have the same absorption
maxima as DPPH radical of 515nm, often interfere with the
assay (Nomura and others 1997). Steric accessibility is a
crucial factor in the DPPH reaction since small molecules
have a better access to the radical site than larger ones
(Xie and Schaich 2014). The radical site is protected
inside a reaction cage formed by the two phenyl rings
orthogonal to each other, and the picryl ring angled
about 30° with its two nitro groups oriented above and
below the radical site. DPPH also is decolorized by
reducing agents as well as hydrogen transfer, which also
contributes to inaccurate interpretations of anti-oxidant
capacity. DPPH is a stable nitrogen radical that bears no
similarity to the highly reactive and transient peroxyl
radicals involved in lipid peroxidation. Many
antioxidants that react quickly with peroxyl radicals may
react slowly or may even be inert to DPPH due to steric
inaccessibility and therefore at times, is not a
realistic representation of anti-oxidant capacity of
foods and beverages.
FRAP or ferric reducing anti-oxidant assay involves the
transfer of electrons from anti-oxidants, which reduces
ferric salt, Fe (III)(TPTZ)2Cl3 (TPTZ) 2,4,6-tripyridyls-
triazine), to its reduced Fe(II) form, to form a blue
colored complex whose absorbance is measured at 593 nm
(Fig.4). The time period of analysis has a bearing on the
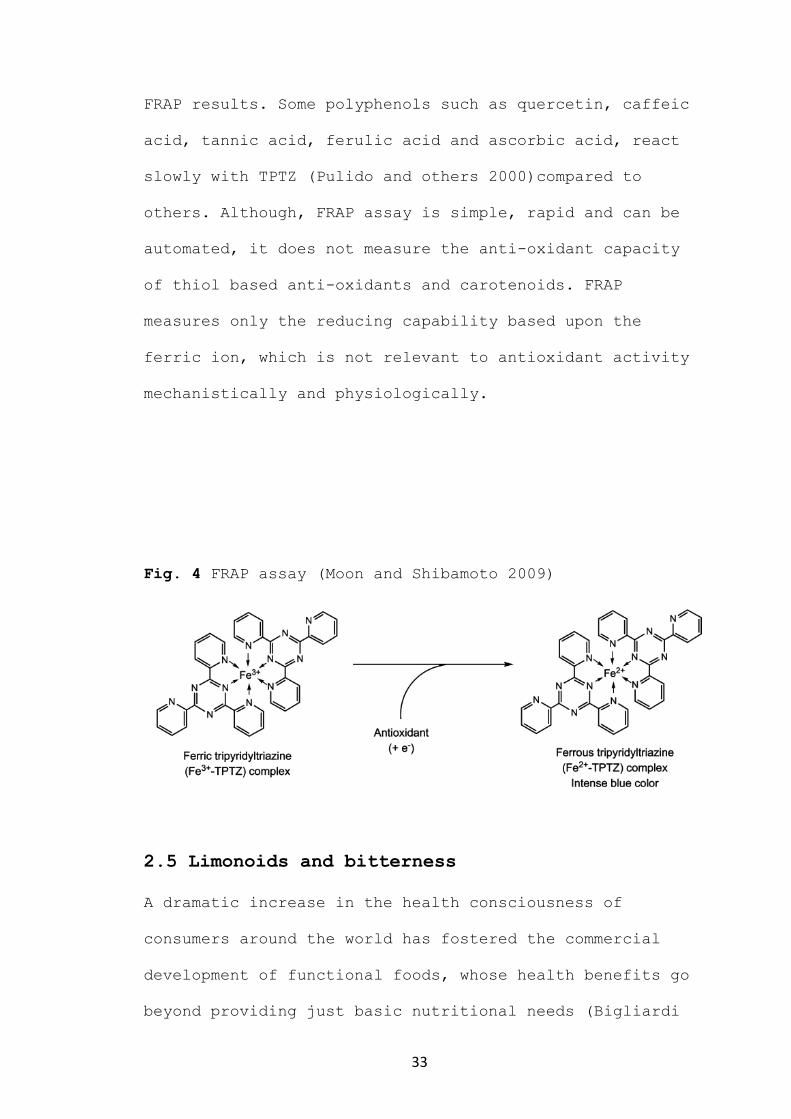
33
FRAP results. Some polyphenols such as quercetin, caffeic
acid, tannic acid, ferulic acid and ascorbic acid, react
slowly with TPTZ (Pulido and others 2000)compared to
others. Although, FRAP assay is simple, rapid and can be
automated, it does not measure the anti-oxidant capacity
of thiol based anti-oxidants and carotenoids. FRAP
measures only the reducing capability based upon the
ferric ion, which is not relevant to antioxidant activity
mechanistically and physiologically.
Fig. 4 FRAP assay (Moon and Shibamoto 2009)
2.5 Limonoids and bitterness
A dramatic increase in the health consciousness of
consumers around the world has fostered the commercial
development of functional foods, whose health benefits go
beyond providing just basic nutritional needs (Bigliardi

34
and Galati 2013). A better understanding of the
relationship between diet and health has led to a boom in
dietary health supplements, such as foods and beverages
incorporating medicinal plant extracts. These functional
foods contain bioactive compounds, such as anthocyanins,
carotenoids, flavonoids, isoflavones and terpenes, which
are targeted towards improving digestive health, child
nutrition, weight management, obesity, diabetes, and
beauty enhancement, to mention a few. Numerous consumer
studies have pointed towards the primary role of taste as
a factor, which directs consumers’ food choice in general
(Urala and Lähteenmäki 2003; Grunert and others 2000;
Richardson and others 1994). Also, in the specific case
of functional foods, taste experiences have been reported
as extremely critical factors when selecting this food
category (Tuorila and Cardello 2002; Childs 1997; Gilbert
2000). Although increasing the functionality of the food
should not necessarily change its sensory quality, there
are instances where bitter, acrid, astringent or salty
off-flavors often get incorporated with the use of
bioactive compounds or plant-based phytonutrients (Urala
and Lähteenmäki 2004). These off –flavors have led to a
decrease in consumer liking and consumption of functional
foods despite having convincing health claims, as shown
in some studies (Drewnowski and Gomez-Carneros 2000;
Tuorila and Cardello 2002). Bitter taste is one of these

35
offensive sensorial modalities and has been the primary
reason for the rejection of food products although there
are certain foods such as coffee, beer, wine and bitter
melon where a certain degree of bitterness is acceptable.
(Binello and others 2004; Binello and others 2008; Singh
and others 2002a; Shaw and others 1984). Therefore,
bitterness removal is one of the biggest hurdles for the
functional food industry, in order to make functional
foods more palatable to a larger consumer base.
Limonoids are highly oxygenated triterpenes found
abundantly in the plant kingdom, in species belonging to
the family Meliaceae and Rutaceae (Fig.1). Limonoids are
found either in glycosylated or non-glycosylated forms.
While the glucosides are soluble in water and tasteless
in nature (Hasegawa and others 1989), the aglycones are
bitter in nature and contribute to the bitterness in neem
and citrus fruits (Nathan and others 2005; Kita and
others 2000). They are synthesized via the terpenoid
biosynthetic pathway, which involves the cyclization of
squalene to form a tetracyclic triterpene cation, euphane
and tirucallane, two chemically similar compounds that
are purportedly the precursors of limonoids.
Limonoid based bitterness removal has been studied
extensively in the context of the citrus juice industry.
Several techniques have been employed to reduce the
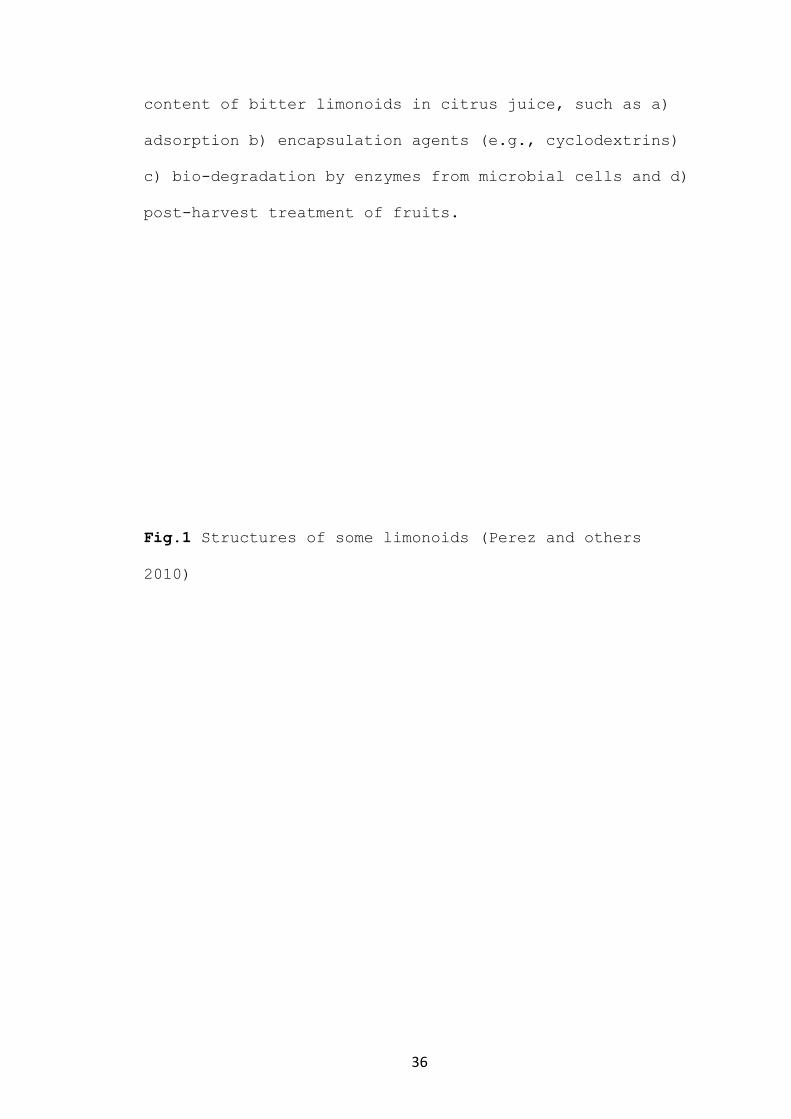
36
content of bitter limonoids in citrus juice, such as a)
adsorption b) encapsulation agents (e.g., cyclodextrins)
c) bio-degradation by enzymes from microbial cells and d)
post-harvest treatment of fruits.
Fig.1 Structures of some limonoids (Perez and others
2010)

37
Adsorption is a physico-chemical process that involves
the mass transfer of a solute (adsorbate) from the fluid
phase to the adsorbent surface till the thermodynamic
equilibrium of the adsorbate concentration is attained,
with no further net adsorption (Belter and others 1987;
Doran 2006). Some of the earliest successful attempts of
using adsorbents to remove bitterness were made by
Chandler and Kefford (1968) with polyamides.
Consequently, a variety of adsorbents, such as cellulose
acetate, nylon-based matrices, porous polymers, and ion
exchangers have been explored to reduce bitterness and
acidity in grapefruit juice (Johnson and Chandler 1982)

38
Synthetic polyadsorbent resins such as Amberlite neutral
resins (XAD-4, XAD-7 and XAD-16), as well as natural
adsorbents (activated diatomaceous earths, activated
granular carbon), have been used for removal of limonin
from orange juice (Ribeiro and others 2002). Ribeiro and
others (2002) found that the synthetic resins are more
effective than natural adsorbents at removing bitter
principles in orange juice. In addition, it was selective
in the removal process by causing minimal reduction in
reducing sugars, vitamin C and proteins. In a comparative
study between cyclodextrins and synthetic resins, Wilson
and others (1989) found XAD- 16 resins to be more
effective at bitterness removal than XAD- 4 and beta
cyclodextrin. Kola and others (2010) tested the
efficiency of an adsorbent resin (Amberlite XAD-16 HP)
and an ion-exchange resin (Dowex Optipore L285) in
Washington Navel orange juices. Both the treatments were
able to reduce bitterness satisfactorily. However, the
ion exchange resin led to some undesirable properties
such as reduced titratable acidity, increased soluble
solids content and increased pH.
Cyclodextrins are cyclic oligosaccharides composed of
6(α), 7 (β) and 8 (γ) glucopyranose units joined together
by glycosidic bonds (Del Valle 2004). They possess a
unique, amphipathic bucket like structure where the outer
side of the molecule is hydrophilic while the inner

39
cavity is hydrophobic (Szejtli 1998). The inner
hydrophobic cavity can bind with lipophilic bitterness
imparting compounds forming an inclusion complex (Szejtli
and Szente 2005). This leads to a reduction in oral
solubility of the bitter compound upon ingestion or a
limited exposure to taste buds, thereby minimizing the
perception of bitterness (Shaw and others 1984; Shin and
Lee 2015; Fajarika and Noor 2015). It has been used for
debittering of navel orange juice (Shaw and others 1984),
grapefruit juice (Shaw and others 1984; Shaw and Buslig
1986; SHAW and WILSON 1985)and tangerine juice
(Mongkolkul and others 2006) .
Use of enzymes from immobilized microbial masses to
convert limonin into non-bitter metabolites, has been
applied successfully in citrus juices by several authors.
It utilizes the pathway illustrated in Fig. 2.
Fig. 2 Metabolic pathway of limonin (Puri and others
1996)

40
Hasegawa, Vandercook and others (1985) observed that 81%
of limonin and almost all nomilin were converted to non-
bitter end products. The constitutively produced limonol
dehydrogenase enzyme, converted limonin to limonol after
navel orange juice serum was treated with Corynebacterium
fascians cells immobilized in acrylamide gel, after a
24 h reaction time, in a packed bed column. Also of
significance was the result that organic acids including
citric, malic, and ascorbic acid, as well as sugars, i.e.
fructose, glucose, and sucrose, which are important for
organoleptic properties, were unaffected. A slightly
lower 73% reduction in Limonin was seen when Arthrobacter
globiformis cells were used under the same conditions
(Hasegawa and others 1983). A purified soil bacterium,
Acetinobacter sp. was identified by Vaks and Lifshitz
(198l) and used to treat early season (more bitter)
juice. The bacterium was able to use limonin as a sole

41
carbon source and convert it into two non-bitter
products- deoxylimonin and deoxylimonic acid. Ribeiro et
al. (2003) utilized Acinetobacter calcoaceticus to de-
bitter orange juice, in which limonin was converted into
non-bitter products through the deoxylimonoid pathway,
without affecting the sugar content of the juice. Cánovas
and others (1998), used Rhodococcus fascians with
synthetic orange juice at pH 4, and observed a 70%
reduction in limonin. When these cells were immobilized
in polyurethane foams, 85% limonin conversion was
attained, after a 200 h reaction, in a continuous
reactor.
Puri and others (1996) noted that the techniques of
immobilization occupied the same loci as the ones that
are useful for enzyme activity. As a result, the enzyme
method of debittering exhibited slow kinetics, which made
it impractical for scale up operations. Therefore, as a
solution, use of free cells was undertaken. Inactivation
of enzymes by particulate matter or clogged columns were
the other drawbacks of the enzymatic method of de-
bittering, as noted by Puri and others (1996).
Post-harvest treatment of naval orange, lemon, and
grapefruit with 20 ppm ethylene accelerated limonoid
metabolism and reduced bitterness to more palatable
levels than untreated ones (Maier and others 1973). The
bitterness reduction, which can be also achieved through

42
2-chloroethylphosphonic acid (CEPA), was a result of the
destruction of Limonoate A Ring Lactone (LARL) that was
prevented from converting itself to the bitter limonin.
Limonoids are quite bioactive in nature having
insecticidal, anti-bacterial, anti-malarial, anti-fungal,
anti-cancer, anti-viral and other pharmacological
activities (Govindachari and others 1996; Nathan and
others 2005; Abdelgaleil and others 2004; Poulose and
others 2006; Balestrieri and others 2011; Zhang and
others 2007; Rahman and others 2009). Therefore, their
removal may lead to a significant decline in the health
value of foods and beverages. The ideal method should aim
to retain health-promoting compounds while improving or
maintaining organoleptic properties.
2.5 Milk protein- flavonoid interaction
Bovine milk contains 3–3.5% (w/v) of proteins of which
about 80% on average consist of caseins and the whey or
serum proteins make up the remaining 20% (Bordin and
others 2001). It consists of water-soluble globular
proteins, main fractions of which are beta-lactoglobin,
alpha-lactalbumin, bovine serum albumin and
immunoglobulins (Haug and others 2007). Caseins are an
important nutrient delivery system carrying calcium and
phosphate (Xiao and others 2011). It is rich in proline
residues (Kohmura and others 1989). Casein has a micelle
structure with hydrophilic parts on the surface while the

43
interiors are hydrophobic in nature (Sahu and others
2008).
Milk consumption with tea is a part of daily practice.
The application of tea or tea extracts in dairy products
is also becoming popular due to the antibacterial and
bioactive properties of polyphenols found in tea
(Ferruzzi and Green 2006). Proteins interact with
polyphenols (flavonoids) either reversibly or
irreversibly. The reversible interactions include
hydrogen bonding, van der Waal’s forces and hydrophobic
bonding. The irreversible bonds are covalent in nature.
Yuskel and others (2010) studied the interaction between
green tea flavonoids and milk protein through
spectrofluorometric analysis and observed a decrease in
protein surface hydrophobicity via quenching of
tryptophan and tyrosine fluorescence, which indicated
hydrophobic binding between milk proteins and green tea
flavonoids. The binding enthalpies obtained from
Isothermal Titration Calorimetry (ITC) analysis also
backed up his findings and showed that interaction was
non-covalent between catechin and beta-casein. Ye and
others (2013) provided further confirmation of
hydrophobic interactions by observing fluorescence
quenching of whole milk in green tea and black tea
solutions. They also suggested the possibility of
hydrogen bonding between the phenolic hydroxyl group and

44
the amide group of milk proteins, as evidenced by the
increase of UV absorption intensity, upon milk addition.
Ye and others (2013) observed an alteration in the
structure of proteins due to polyphenol-milk protein
interactions. This results in altering the secondary
structure of milk protein from random coils and large
loops to alpha- helix, intra- beta sheet and turn
structures, as revealed by FTIR data. The interactions of
phenolic compounds and proteins are known to affect the
structure of proteins, content of free polyphenols,
antioxidant capacity and bioavailability of phenolic
compounds in foods.
There are several factors that affect the binding of
polyphenols with proteins. They are as follows:
1. Temperature: Temperature can affect hydrogen bonding
and lead to the formation of hydrophobic bonds. Both
Sastry and Rao (1990), and Prigent and others (2003)
observed a decrease in the binding affinity of proteins
for 5-O- caffeoylquinic acid with an increase in the
temperature. However, Hoffman and others (2006) concluded
that the precipitation of bovine serum albumin with
procyanidin derivatives was not affected by temperature.
Tsai and She (2006) on the contrary reported that the
superoxide dismutase (SOD) activity from peas increased
because of its increase in heat stability at higher
temperatures because of protein-phenolic interactions.

45
2. pH: The highest precipitation of the protein-
polyphenolic complex is seen at 0.3-3.1 pH below the
isoelectric point of the protein (Naczk and others 2006).
Unlike temperature, pH only affected only the degree of
binding not the binding affinity for the interaction
between 5-O- caffeoylquinic acid and 11S protein from
sunflower seeds (Sastry and Rao 1990). The lower pH
facilitated the dissociation of oligomeric proteins
exposing more binding sites for the polyphenol to bind.
The pH can affect the nature of bonding between
polyphenols and proteins as shown by Prigent and others
(2003). The authors reported that while chlorogenic acid
(polyphenol) interaction with bovine serum albumin (BSA),
lysozyme and α-lactalbumin was supported by non-covalent
bonds at pH ≤ 7, the increasing pH produced radicals and
quinones from auto-oxidation of proteins that led to
covalent interactions with polyphenols. Contradictory to
the studies above, Frazier and others (2006), and
Charlton and others (2002) failed to see an effect of pH
on (-)-epicatechin- BSA interaction. They suggested that
electrostatic interactions or non-covalent interactions
are not a major factor in complex formation. They
attributed increased protein-polyphenol precipitation
close to isoelectric pH to limited protein solubility at
this pH.

46
3. Types of proteins and protein concentration: The
hydrophobicity, isoelectric point and amino acid
composition of proteins affect its interaction with
polyphenols (Prigent and others 2003). The authors
observed that the binding of chlorogenic acid was higher
with BSA as compared to lysozyme and α-lactalbumin.
The protein concentration also plays a role in its
complex formation with polyphenols. At lower
concentrations, no statistically significant difference
(p ≤ 0.05) was found between precipitation at 0.5 and 1.0
mg/ml BSA. This was however, not the case at
concentrations higher than 1.0 mg/ml.
4. Types and structures of phenolic compounds: The size
of polyphenol molecules and the presence/absence of
carbohydrate, methyl, methoxy and hydroxyl groups affect
its affinity with proteins. Dubeau and others (2010)
reported that the large theaflavins, thearubigins
polymers in black tea bound more than their respective
catechin monomers. A stronger interaction was found
between quercetin and BSA as compared to its glycosylated
derivative, quercetin 3-O-β-D glucopyranoside (Martini
and others 2008). Xiao and others (2011) observed a very
slight increase between quercetin and its rhamnoside,
quercitrin, in its interaction with bovine milk protein.
The increasing glycosylation of flavonoids, the authors
suggest, leads to increasing steric hindrance that

47
weakens protein binding. Xiao and others (2011) also
investigated the effects of methylation, methoxylation
and hydroxylation of polyphenols and their affinities for
milk proteins. They observed that while methylation of
flavonoids leads to a decrease in affinity for milk
protein, methoxylation produced little effect. For
example, formononetin had a 14.79 times lesser affinity
than its non-methylated form, daidzein.
The effect of hydroxylation of flavones on milk protein
binding depended on the ring that was hydroxylated. While
hydroxylation of ring A of flavones increased binding
affinity, the hydroxylation of ring C did not produce any
effect. Hydroxylation of ring B produced a mixed effect.
For example, the affinity of apigenin (5, 7, 3) for milk
protein was found to be 4.27-times higher than that of
chrysin (5,7) while the affinity of apigenin (5, 7, 3)
for milk protein was the same as that of luteolin
(5,7,3,4).
The hydroxylation of flavonol A and B rings slightly
enhanced the binding affinity for milk protein. The
hydroxylation of position 3 of the B ring of kaempferol
to form quercetin enhances the binding affinity by 1.41
times. This affinity further increases to 2.09 times when
quercetin is converted to myricetin by the addition of a
hydroxyl at the 5th position of B ring. In flavanones
too, the hydroxylation of ring A leads to a highly

48
significant increase in binding affinity up to 104.71
times.
5. Addition of extraneous chemicals: Addition of salt (Na
Cl) or sodium sulfate (Na2SO3) inhibited the dissociation
of oligomeric proteins and hence reduced the number of
binding points (Sastry and Rao 1990). This led to a
decrease in the quantum of binding not the binding
affinity of polyphenols.
So far, there have been a multitude of studies in the
field of flavan-3-ol (catechin and its derivatives) and
milk protein interactions and its effect on anti-oxidant
capacity. But these studies have revealed contradictory
results. Three types of results have been observed.
Firstly, a non-masking effect of milk or milk proteins
was seen by some authors (Kyle and others 2007; Richelle
and others 2001; Leenen and others 2000), in which the
anti-oxidant potential remained the same. Secondly,
certain authors (Stojadinovic and others 2013; Xiao and
others 2011; Sharma and others 2008; Arts and others
2002; Serafini and others 1996) observed a masking effect
of flavonoids that led to a reduction in anti-oxidant
activity of the tea-milk mixture. Thirdly, Dub eau and
others (2010) observed a dual effect in which, upon milk
addition, the ABTS+ anti-oxidant capacity of teas was
reduced but the chain breaking anti-oxidant capacity,
determined by lipid peroxidation method, increased.

49
All these variable results, have led to a confusion in
understanding the effect of milk addition on the
bioavailability of polyphenols and anti-oxidant potential
of tea.
Chapter 3
50
Identification and quantification of the
flavonols myricetin, quercetin and
kaempferol, total polyphenolic content,
total limonoids and anti-oxidant activities
in Azadirachta indica A. Juss leaves
commercially available in the United States
3.1 Introduction
Flavonoids are plant secondary metabolites whose putative
health values include anti-inflammatory, anti-oxidant,
hepatoprotective, anti-viral, and anti-carcinogenic
effects (Liu and others 2008a; Huang and others 2015;
Sirovina and others 2013; Romagnolo and Selmin 2012).
With better analytical techniques and an increase in
popularity of alternative medicines, there has been a
renewed interest in studying them.
Neem (Azadirachta indica A. Juss) is an evergreen tree
cultivated in various parts of the Indian sub-continent
(Biswas and others 2002). It has been in use in Indian
folk medicine for centuries because of its purported
therapeutic value (Kaushik and others 2012). Given the
prominent role it has played in curing diseases of Indian
villagers, it has been hailed as a “divine” tree, a
“village dispensary” and “nature’s drugstore” (Maithani
and others 2011). Today, extensive research has shown
that it may have anti-cancer (Subapriya and Nagini 2003),
anti- diabetic (Khosla and others 2000), anti-
inflammatory (Schumacher and others 2011), anti-
51
ulcerogenic (Dorababu and others 2006) and anti-microbial
effects (Badam and others 1999). Taking advantage of its
reputation in rural India, Neem has been commercialized
into products in the form of tea, soaps, facewashes,
creams, and toothpastes.
While there are several encouraging reports on the in-
vitro therapeutic effects of Neem in literature, studies
characterizing its bioactive profile are not as numerous.
Existing studies have used colorimetric methods to
determine total phenolics, total flavonoids and total
anti-oxidant activity (Nahak and Sahu 2010; Ghimeray and
others 2009; Hismath and others 2011) but fail to isolate
and identify specific compounds. Others studies that have
identified specific flavonoids in neem (Pandey and others
2014; Chakraborty and others 1989) use older analytical
methods, such as thin layer chromatography, and do not
provide quantitative information. We have used neem leaf
and bark samples commercially available in the United
States for our analysis and, to our knowledge, this is
the only study profiling its polyphenols, limonoid
content and anti-oxidant activities.
Our aims and objectives for this research were four-fold:
A) To identify and quantify specific flavonoids, i.e.;
flavonols, namely myricetin, quercetin and kaempferol,
using HPLC-DAD-ESI-MS/MS in neem leaves and bark.

52
B) To quantify the total phenolics and the associated
anti-oxidant activities.
C) To quantify the total limonoids in neem leaf and bark
due to their abundance in members of the Meliaceae
family (Taylor 1984).
D) To analyze the distribution of flavonols in neem
capsules available from different vendors in the United
States.
To place the bio-active profile of neem in context, we
have compared it with more conventionally consumed teas
such as green and black tea leaves, which are well known
for their health promoting properties.
3.2 Materials and methods
3.2.1. Plant materials
Three different lots of Neem (Azadirachta indica) leaf
powder and tea cut leaves were purchased from Neem Tree
Farms Inc. (Brandon, FL., USA) while Great Value green
tea and Schnucks 100% Natural Orange Pekoe & Pekoe Cut
black tea were purchased from local Walmart and Schnucks
super markets, respectively.
Commercial samples of neem leaf capsules were bought
online from three different vendors, Nature’s way,
PipingRock and Vitacost.
3.2.2. Reagents

53
Myricetin, quercetin, and kaempferol were purchased from
Cayman Chemicals (Ann Arbor, MI, USA). HPLC-grade
acetonitrile, water, DPPH (2,2-diphenyl-1-picrylhydrazyl)
reagent, TPTZ (2,4,6-Tripyridyl-s-triazine, gallic acid,
as well as trifluoroacetic acid and Folin’s reagent were
purchased from Sigma Aldrich Co. (St. Louis, MO, USA).
Absolute ethanol was bought from the University of
Missouri chemical store (Columbia, MO, USA). Limonin
glucoside was purchased from Abcam Biochemicals
(Cambridge, MA, USA) while limonin was bought from LKT
Laboratories Inc. (St Paul, MN, USA).
3.2.3. Extractions
The method of Wang and Helliwell (2001) was followed for
extracting flavonols, with the addition of an anti-
oxidant. Briefly, 1 g of neem leaf powder, neem tea cut
leaves, neem bark powder, green and black tea leaves and
were suspended in 40 mL of 60% ethanol and 5 mL of 6M HCl
together with 40 mg of ascorbic acid as the antioxidant.
This mixture was refluxed at 95° C for two hours to allow
the hydrolysis of the flavonol glycosides into the
respective aglycones. The hydrolyzed solution was cooled,
vacuum filtered using P8 Fisher Scientific filter paper
and made up to 50 mL in a volumetric flask using 60%
ethanol. This solution was filtered through a 0.45 μm
nylon filter (EMD Millipore, Billerica, MA, USA) and 20
μL was injected into the HPLC.

54
Neem infusions were made according to the method shown in
the Neem information booklet provided by the supplier.
Neem leaf powder, Neem tea-cut leaves, bark powder, black
or green tea leaves (1.25 grams) were added to 250 mL of
boiling water, and the aqueous extraction was allowed to
take place for 5 mins. This solution was filtered and
made up to volume in a 250-mL volumetric flask using de-
ionized water. 16 mL of this solution was mixed with 24
mL of absolute ethanol to produce a concentration of 60 %
ethanol. 40 mg of ascorbic acid and 5 mL of 6 M HCl was
added to this solution. The solution was refluxed,
filtered and made up to a volume of 50 mL as described
for the dry tea leaves extraction.
For the purpose of extracting polyphenols and
subsequently measuring their anti-oxidant activities, 200
mg of neem leaf powder, neem tea cut leaves, bark powder,
green and black tea leaves were extracted in 20 mL 60%
ethanol or water, for 2 hours at 100° C. The samples were
vacuum filtered and made up to 25 mL using 60% ethanol or
water.
3.2.4. UPLC-ESI-MS/MS for identification of flavonols
The identity of the flavonol aglycones were confirmed by
a H-class Waters Xevo QTOF MS UPLC with PDA detector set
at 370 nm. Separation of flavonols was performed on a
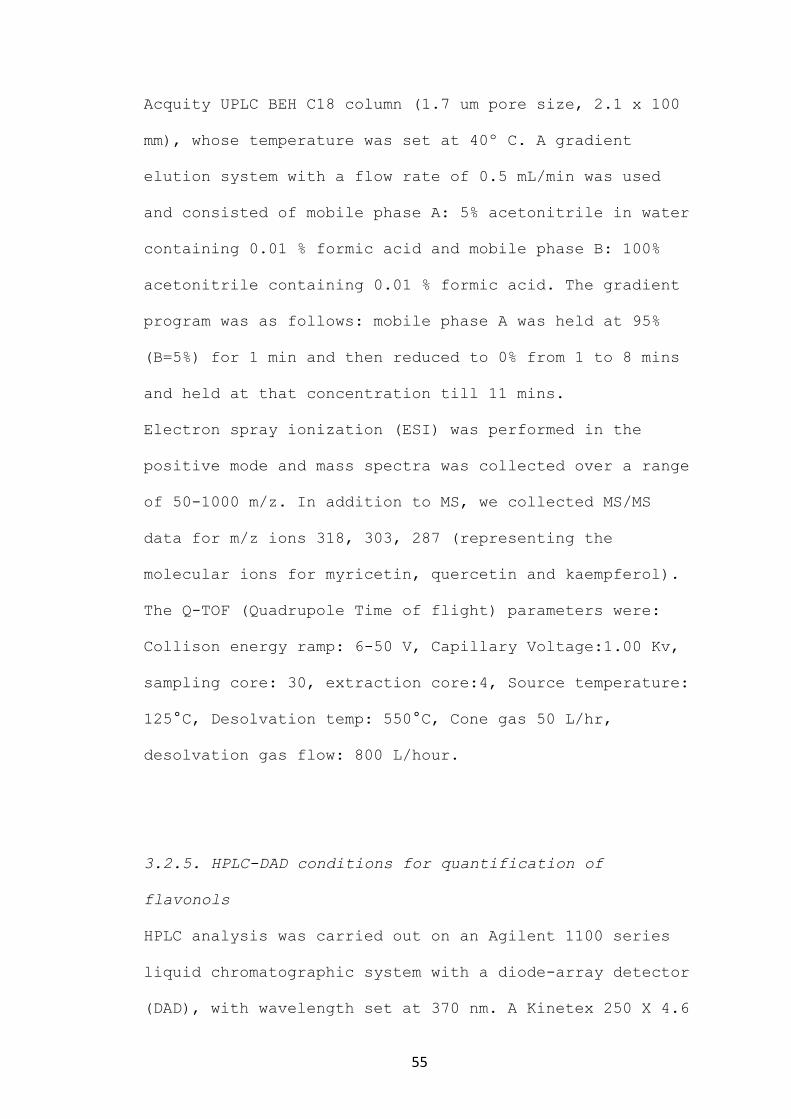
55
Acquity UPLC BEH C18 column (1.7 um pore size, 2.1 x 100
mm), whose temperature was set at 40º C. A gradient
elution system with a flow rate of 0.5 mL/min was used
and consisted of mobile phase A: 5% acetonitrile in water
containing 0.01 % formic acid and mobile phase B: 100%
acetonitrile containing 0.01 % formic acid. The gradient
program was as follows: mobile phase A was held at 95%
(B=5%) for 1 min and then reduced to 0% from 1 to 8 mins
and held at that concentration till 11 mins.
Electron spray ionization (ESI) was performed in the
positive mode and mass spectra was collected over a range
of 50-1000 m/z. In addition to MS, we collected MS/MS
data for m/z ions 318, 303, 287 (representing the
molecular ions for myricetin, quercetin and kaempferol).
The Q-TOF (Quadrupole Time of flight) parameters were:
Collison energy ramp: 6-50 V, Capillary Voltage:1.00 Kv,
sampling core: 30, extraction core:4, Source temperature:
125°C, Desolvation temp: 550°C, Cone gas 50 L/hr,
desolvation gas flow: 800 L/hour.
3.2.5. HPLC-DAD conditions for quantification of
flavonols
HPLC analysis was carried out on an Agilent 1100 series
liquid chromatographic system with a diode-array detector
(DAD), with wavelength set at 370 nm. A Kinetex 250 X 4.6
56
mm, 5 μ C 18, 100 Å (Phenomenex Inc., Torrance, CA)
column was used for the separation of the flavonol
aglycones. A gradient elution system comprising of two
mobile phases, namely mobile phase A, 0.1 %
trifluoroacetic acid in water and mobile phase B, 0.1%
trifluoroacetic acid in acetonitrile, was used. The
gradient used was 80% A and 20% B at 0 min which was
gradually reduced to 60% A at 20 mins and held for
another 5 mins. A 5-min post time was added for the
mobile phase concentrations to come back to initial
levels. The flow rate was 1 mL/min and the column
temperature was set at 40° C.
Myricetin, quercetin and kaempferol standards were
dissolved in 60% ethanol and external standard curves
were developed for quantification purposes within the
appropriate concentration range of the sample. The
myricetin and kaempferol standard curves were developed
within the range of 0-0.04 mg/mL respectively, while the
quercetin standard curve was developed within the range
of 0-0.25 mg/mL.
3.2.6. Total phenolic content by Folin-Ciocalteau assay
The amount of total phenolics was determined using the
Folin–Ciocalteau assay adapted from (Devi and others
2009). 50 μL of the ethanolic or aqueous extract (diluted
to fit the range of the standard curve) was added to a
mixture of 250 μL of Folin's reagent (1:3 diluted with

57
distilled water), 750 μL 7% sodium carbonate and 3 mL
distilled water. The solution was incubated at room
temperature for 2 hours and absorbance readings were
taken at 725 nm using a Varian Cary® 50 UV-VIS
spectrophotometer (Agilent Technologies Inc., Santa
Clara, CA). A calibration curve of gallic acid (ranging
from 0.1 to 0.7 mg/mL) was prepared and the results,
determined from regression equation of the calibration
curve (y = 30.657x + 0.0041, R2 = 0.99), were expressed
as mg gallic acid equivalents per gram of the sample.
3.2.7. Colorimetric estimation of total limonoids
The method of Breksa and Ibarra (2007) was used with
minor modifications to quantify limonoids in neem leaf
and bark.
The extraction of limonoid glucosides was done using C 18
SPE cartridges which were conditioned using 5 mL methanol
and consequently with 5 mL of de-ionized water. Then 5 mL
of neem leaves and bark extract (aqueous and 60% ethanol)
was loaded onto the cartridge. The limonoid glucosides
trapped in the column were eluted with 5mL of methanol
and evaporated under a steady flow of nitrogen gas. The
sample was reconstituted in 3 mL of 30% acetonitrile.
The aglycones were extracted by chloroform. Neem tea was
mixed with chloroform in a 1:2 ratio (2.5: 5mL) and
vortexed. Once the phases separated, the upper phase was
discarded and the lower phase (chloroform) was evaporated
58
to dryness under a steady flow of nitrogen gas. The
sample was re-constituted in 3 mL of 100 % acetonitrile
and the colorimetric assay was performed exactly
according to the procedure of limonin glucoside
determination quantified at 470 nm.
Briefly, 2 mL of limonin glucoside standard or neem/ SPE/
AMB treated samples was mixed with 1.65 mL of DMAB
indicator. To this, 1.65 mL of stock acid solution is
added. The test tubes were incubated for 30 minutes at
room temperature and the color developed was measured
spectrophotometrically at 503 nm. Total limonoid
glucoside in the sample was determined in terms of
limonin glucoside equivalents. This was done using a
calibration curve generated from limonin glucoside made
up in 30% acetonitrile (0- 200 μg/mL, y = 2.1269x +
0.001, R2=0.99) while the limonin standard curve
developed with limonin (0-40 μg/mL, y = 5.676x + 0.0039,
R2=0.99).
The colorimetric quantification was based on the
formation of red to orange colored derivatives resulting
from the treatment of limonin glucoside, or the neem
extract with 4- dimethylamino benzaldehyde (DMAB) in the
presence of perchloric and acetic acids.
3.2.8 Anti-oxidant activity determinations
A) FRAP assay

59
The FRAP assay was performed according to the method of
Thaipong and others (2006) with minor modifications. The
FRAP reagent was prepared by mixing 300mM acetate buffer
(pH 3.6), 10 mM TPTZ (2,4,6-Tripyridyl-s-triazine) and 20
mM ferric chloride in the ratio of 10:1:1 ratio
respectively along with 24 mL of distilled water. 150 μL
of the sample (diluted appropriately to fit the range of
the standard curve) was added to 2850 μL of FRAP reagent.
The samples and standards were incubated for 30 mins at
room temperature in the dark. The absorbance of the
colored product [ferrous tripyridyltriazine complex] was
measured spectrophotometrically at 593 nm. The standard
curve was developed using gallic acid as a standard
within the concentration range of 0.01-0.04 mg/mL (y=
18.149x - 0.0084, R2=0.99). Results are expressed in mg
GAE/g of the sample.
B) DPPH (2,2-diphenyl-1-picrylhydrazyl) radical
scavenging assay
DPPH anti-oxidant assay was performed according to the
method of Thaipong and others (2006) with modifications.
Stock solution was prepared by dissolving 20 mg DPPH in
100mL methanol and it was then stored at -20° C until
used. The working solution was obtained by mixing 20mL of
stock solution with 80 mL methanol.

60
To 2ml of de-ionized water, 200 μL of sample (of
appropriate dilutions) or blank was added and was allowed
to react with 2800 μL of the DPPH solution. Then the
decrease in absorbance was measured at 515 nm after 90
minutes. Methanol was used as blank and 60% ethanol (or
water for tea infusion) was treated as control . Anti-
oxidant activity was expressed as percentage inhibition
of the DPPH radical and was determined by the following
equation as reported by (Yen and Duh 1994).
%𝐴𝐴 = (𝐴𝑏𝑠𝑜𝑟𝑏𝑎𝑛𝑐𝑒𝑐𝑜𝑛𝑡𝑟𝑜𝑙 − 𝐴𝑏𝑠𝑜𝑟𝑏𝑎𝑛𝑐𝑒𝑠𝑎𝑚𝑝𝑙𝑒) ∕ 𝐴𝑏𝑠𝑜𝑟𝑏𝑎𝑛𝑐𝑒𝑐𝑜𝑛𝑡𝑟𝑜𝑙 × 100
The percentage DPPH anti-oxidant values were converted to
vitamin C equivalent anti-oxidant capacity using a
standard curve, which was found to be linear between
0.0176 -0.1408 mg/mL (y= y = 693.12x - 3.0024, R2=0.98).
The results were expressed in mg/g of vitamin C
equivalent anti-oxidant capacity (VCEAC).
3.2.9 Statistical analysis
Three different batches of Neem leaf powder, Neem tea-cut
leaves, green and black tea were bought and each batch
was subjected to triplicate analysis. Analysis of
variance (ANOVA) was done to test for differences in
flavonol, phenolic and anti-oxidant activities while the
Tukey’s range test was used to subsequently separate the
means if the ANOVA was significant, using Minitab 16
statistical software (Minitab Inc., PA, USA).

61
3.3 Results and discussions
3.3.1 Identification of flavonol aglycones
The three flavonols are separated clearly on the reverse
phase C18 column eluting in the order of myricetin,
quercetin and kaempferol at approximately 8, 12 and 18
mins (Fig. 1). The structures of the flavonols is shown
in Fig. 2.
Fig. 1. Chromatogram shows us three well separated peaks
at 6.61, 9.81 and 12.96 mins when the signal is recorded
at 370 nm with a photo diode array detector.
Fig. 2. The structures of the investigated flavonols
(Huck et al., 2001)
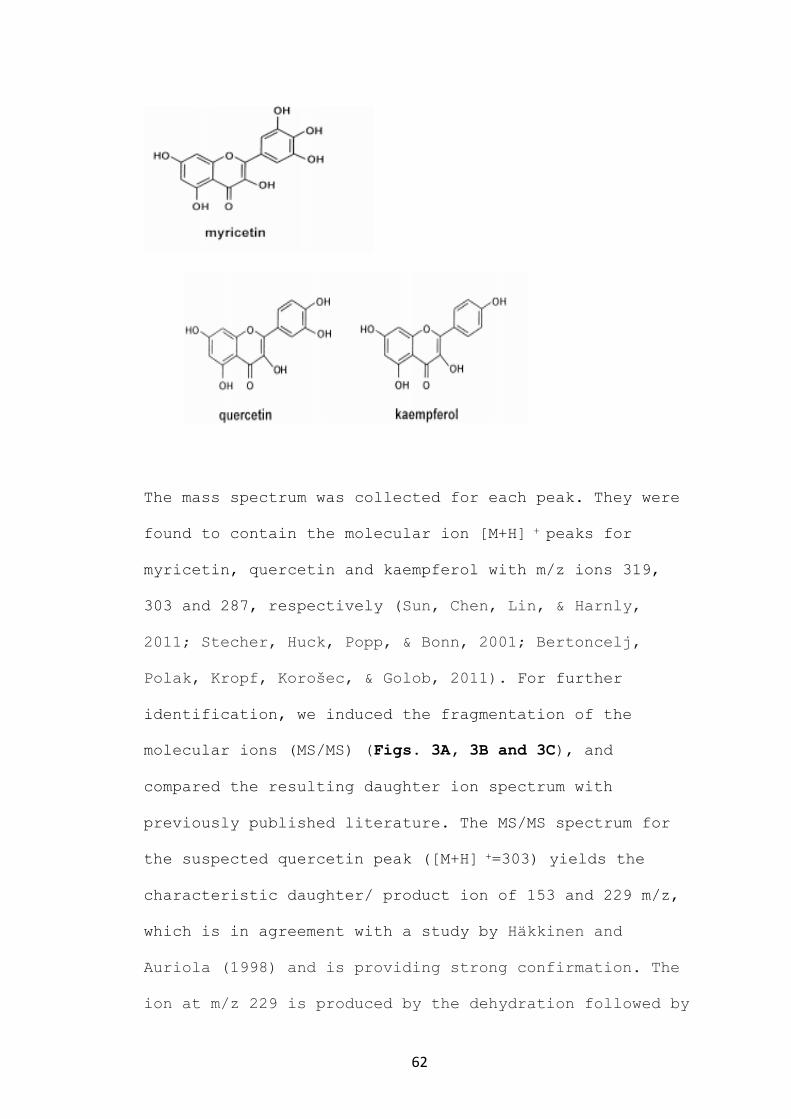
62
The mass spectrum was collected for each peak. They were
found to contain the molecular ion [M+H] + peaks for
myricetin, quercetin and kaempferol with m/z ions 319,
303 and 287, respectively (Sun, Chen, Lin, & Harnly,
2011; Stecher, Huck, Popp, & Bonn, 2001; Bertoncelj,
Polak, Kropf, Korošec, & Golob, 2011). For further
identification, we induced the fragmentation of the
molecular ions (MS/MS) (Figs. 3A, 3B and 3C), and
compared the resulting daughter ion spectrum with
previously published literature. The MS/MS spectrum for
the suspected quercetin peak ([M+H] +=303) yields the
characteristic daughter/ product ion of 153 and 229 m/z,
which is in agreement with a study by Häkkinen and
Auriola (1998) and is providing strong confirmation. The
ion at m/z 229 is produced by the dehydration followed by
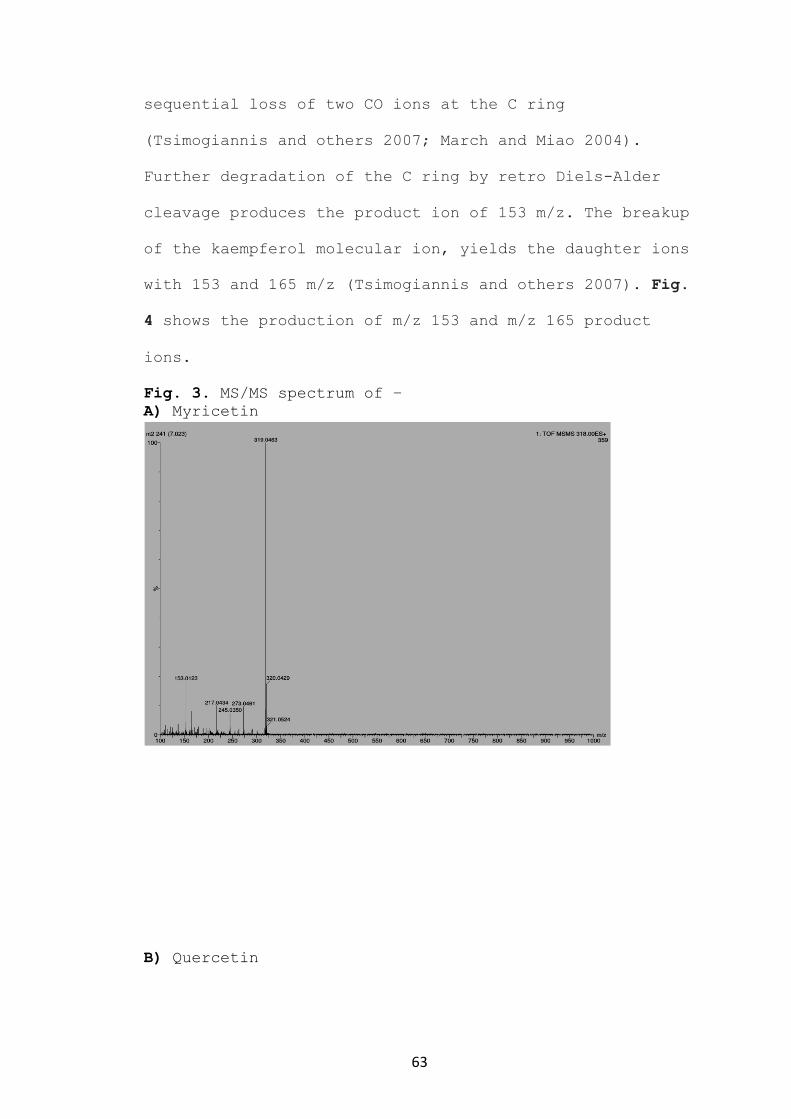
63
sequential loss of two CO ions at the C ring
(Tsimogiannis and others 2007; March and Miao 2004).
Further degradation of the C ring by retro Diels-Alder
cleavage produces the product ion of 153 m/z. The breakup
of the kaempferol molecular ion, yields the daughter ions
with 153 and 165 m/z (Tsimogiannis and others 2007). Fig.
4 shows the production of m/z 153 and m/z 165 product
ions.
Fig. 3. MS/MS spectrum of –
A) Myricetin
B) Quercetin

64
C) Kaempferol

65
Fig. 4. Retro Diels Alder cleavage of the C ring
(Tsimogiannis et al. 2007)
3.3.2 Content of flavonols as determined by HPLC-DAD
The neem leaf powder ethanolic extract yielded the
highest amount of flavonols followed by green and black
tea with 12.79 ± 0.80 mg/g, 5.92 ± 0.49 mg/g and 5.82 ±
0.40 mg/g, respectively (Table 1). This may be attributed
to the larger particle size of green and black tea as
compared to the finely powdered Neem leaves. A similar
phenomenon was observed by Wang and Helliwell (2001) in
their study. The ANOVA results show that quercetin, which
was the pre-dominant flavonol, was significantly (p<
0.05) higher in neem powder as compared to green and
black tea. The neem bark samples were not found to
contain any of the flavonols under investigation. This

66
contradicts results of Sultana and Anwar (2008), who
found quercetin and kaempferol at levels of 31.9 ± 1.3
and 0.5 ± 0.1 mg/kg in neem bark, respectively.
Table 1. Means of individual flavonols in ethanolic
extract and infusion of various tea samples.
Comparison of means is done between flavonols in the same row between samples (n= 3
S.D.)
In the tea infusions or aqueous extracts (Table 1), the
total flavonols followed a similar pattern to that of the
ethanolic extracts, with neem powder showing
significantly higher amounts than green and black tea.
Again, similar to the ethanolic extractions, quercetin
was the flavonol present in the highest concentration for
all samples.
It is also seen, irrespective of the extraction solvent
used, that the content of myricetin is lower in black tea
as compared to green tea. This is to be expected because
of the fermentation step exclusive to black tea and the
Samples Myricetin Quercetin Kaempferol Myricetin Quercetin Kaempferol
Neem leaf
powder 1.90 ± 0.19a 9.33 ± 0.46a 1.56 ± 0.15a 2.07 ± 0.32a 8.31 ± 0.42a 1.36 ± 0.19a
Green tea 1.67 ± 0.03a 2.99 ± 0.16b 1.25 ± 0.16a 1.80 ± 0.12a 2.92 ± 0.15b 1.11 ± 0.11a
Black tea 0.56 ± 0.08b 3.67 ± 0.26b 1.59 ± 0.10a - 3.61 ± 0.38b 1.40 ± 0.08a
Ethanolic extract Infusion

67
fact that myricetin is the most susceptible of the three
flavonols (McDowell and others 1990).
Wang and Helliwell (2001) studied the three flavonols –
myricetin, quercetin and kaempferol in four different
varieties of green tea and two different varieties of
black tea. Consistent with our results, they found that,
except for the Longjing variety of green tea and the
Qimen variety of black tea, quercetin was the predominant
flavonol. However, they also found that myricetin was the
least abundant flavonol across all varieties and types of
tea. This is a contradiction to our results, where
although our dry black tea sample yielded more kaempferol
than myricetin, the levels were reversed in green tea.
As reported by Wang and Helliwell (2001), when extracted
with ethanol, the total flavonols in dry tea leaves range
from 0.83 to 3.31 mg/g for green tea and 0.24 to 2.31
mg/g for black tea. Our results indicate much higher
values for both, which can be explained by differences in
tea variety, their geographical location and agricultural
conditions in which they were cultivated. Another
possible reason to explain the higher values could be the
use of an anti-oxidant, ascorbic acid that we adapted
from Nuutila and others (2002) which could have had a
protective effect on flavonol oxidation, during the
hydrolysis procedure.
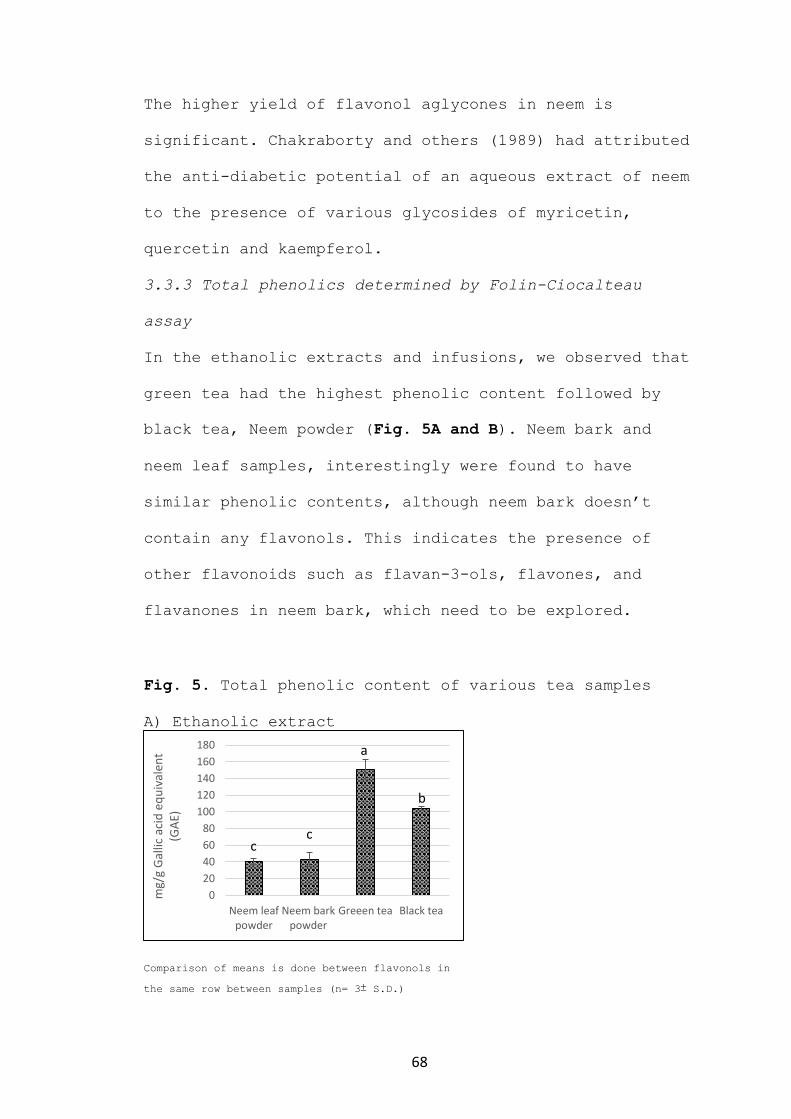
68
The higher yield of flavonol aglycones in neem is
significant. Chakraborty and others (1989) had attributed
the anti-diabetic potential of an aqueous extract of neem
to the presence of various glycosides of myricetin,
quercetin and kaempferol.
3.3.3 Total phenolics determined by Folin-Ciocalteau
assay
In the ethanolic extracts and infusions, we observed that
green tea had the highest phenolic content followed by
black tea, Neem powder (Fig. 5A and B). Neem bark and
neem leaf samples, interestingly were found to have
similar phenolic contents, although neem bark doesn’t
contain any flavonols. This indicates the presence of
other flavonoids such as flavan-3-ols, flavones, and
flavanones in neem bark, which need to be explored.
Fig. 5. Total phenolic content of various tea samples
A) Ethanolic extract
Comparison of means is done between flavonols in
the same row between samples (n= 3 S.D.)
0
20
40
60
80
100
120
140
160
180
Neem leafpowder
Neem barkpowder
Greeen tea Black tea
mg/
g G
allic
aci
d e
qu
ival
ent
(GA
E)
a
b
cc

69
B) Infusion
Comparison of means is done between flavonols in the
same row between samples (n= 3 S.D.)
The higher phenolic levels in green tea, as compared to
black tea, can be attributed to the loss of catechins
during processing of black tea involving fermentation
(Zuo and others 2002).
3.3.4 Anti-oxidant activities- FRAP anti-oxidant assay &
DPPH anti-oxidant activity
The results of the FRAP and DPPH assay co-relate strongly
with that of the Folin’s assay used for the determination
of total phenolics (Fig. 6A and B). This in agreement
with other authors (Zhao and others 2014; Bhoyar and
others 2011; Dudonné and others 2009).
0
20
40
60
80
100
120
140
160
Neem leafpowder
Neem barkpowder
Greeen tea Black tea
mg/
g G
allic
aci
d e
qu
ival
ent
(G
AE)
a
b
cc
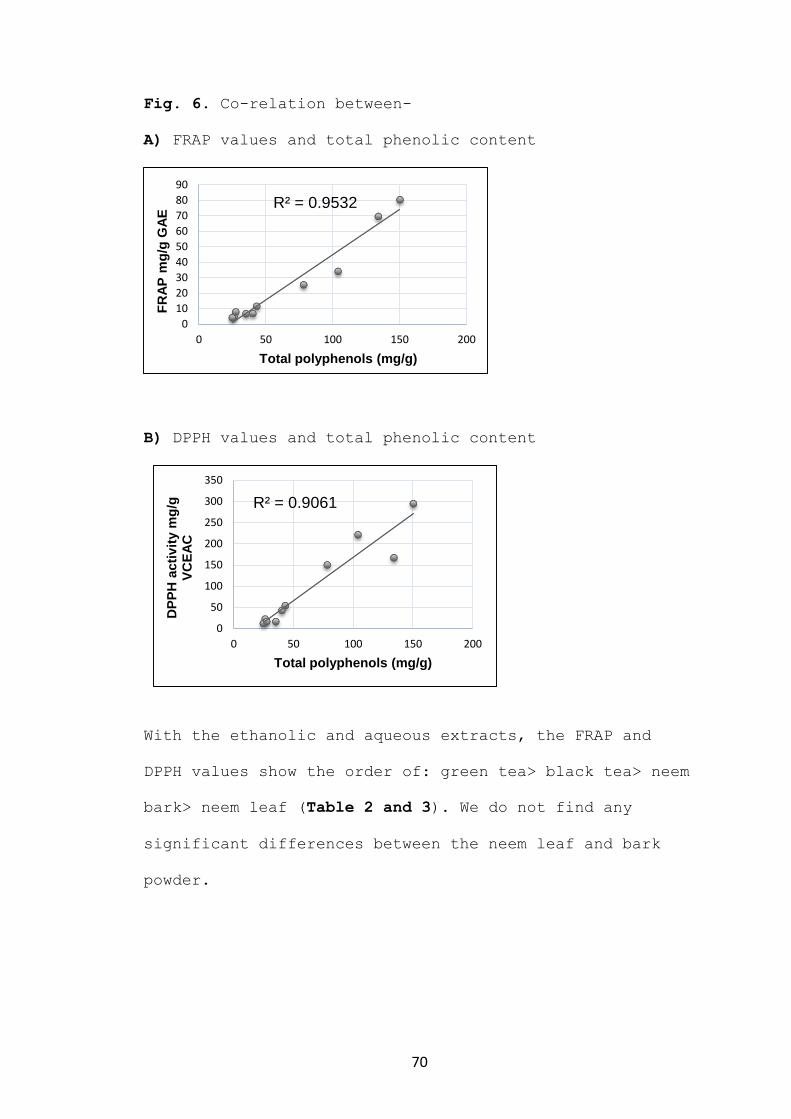
70
Fig. 6. Co-relation between-
A) FRAP values and total phenolic content
B) DPPH values and total phenolic content
With the ethanolic and aqueous extracts, the FRAP and
DPPH values show the order of: green tea> black tea> neem
bark> neem leaf (Table 2 and 3). We do not find any
significant differences between the neem leaf and bark
powder.
R² = 0.9532
0
10
20
30
40
50
60
70
80
90
0 50 100 150 200
FR
AP
mg
/g G
AE
Total polyphenols (mg/g)
R² = 0.9061
0
50
100
150
200
250
300
350
0 50 100 150 200
DP
PH
acti
vit
y m
g/g
V
CE
AC
Total polyphenols (mg/g)
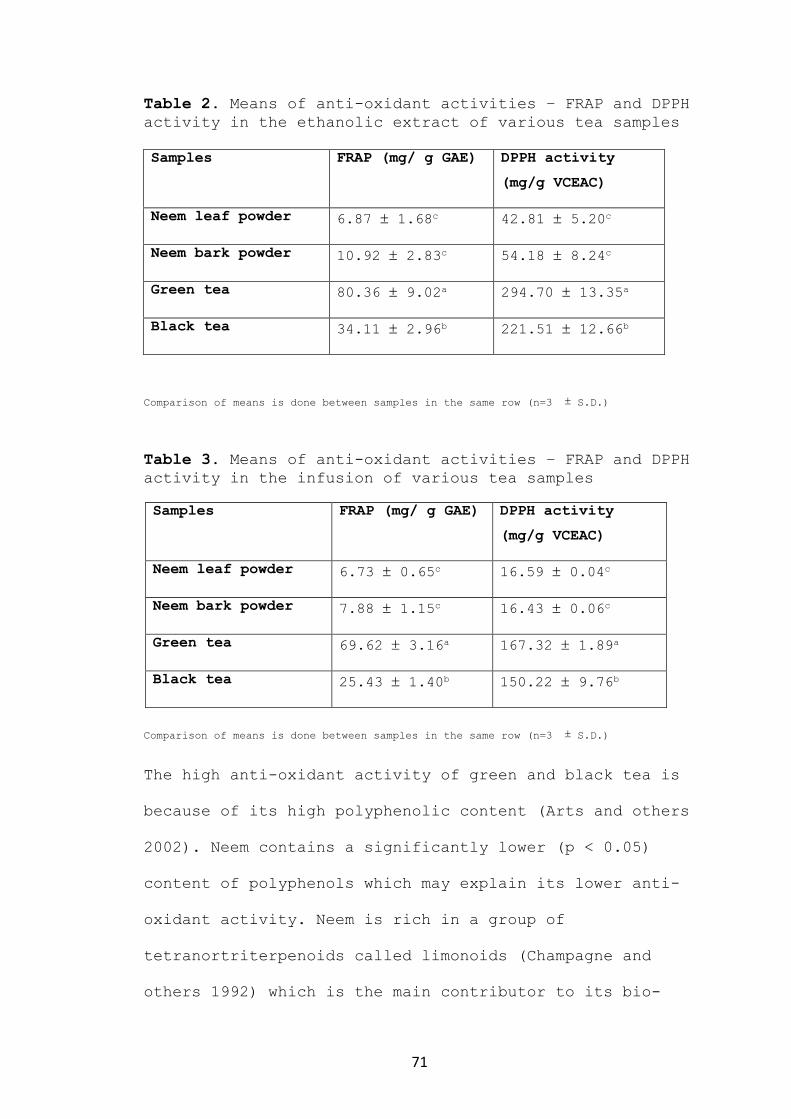
71
Table 2. Means of anti-oxidant activities – FRAP and DPPH
activity in the ethanolic extract of various tea samples
Samples FRAP (mg/ g GAE) DPPH activity
(mg/g VCEAC)
Neem leaf powder 6.87 1.68c 42.81 5.20c
Neem bark powder 10.92 2.83c 54.18 8.24c
Green tea 80.36 9.02a 294.70 13.35a
Black tea 34.11 2.96b 221.51 12.66b
Comparison of means is done between samples in the same row (n=3 S.D.)
Table 3. Means of anti-oxidant activities – FRAP and DPPH
activity in the infusion of various tea samples
Comparison of means is done between samples in the same row (n=3 S.D.)
The high anti-oxidant activity of green and black tea is
because of its high polyphenolic content (Arts and others
2002). Neem contains a significantly lower (p < 0.05)
content of polyphenols which may explain its lower anti-
oxidant activity. Neem is rich in a group of
tetranortriterpenoids called limonoids (Champagne and
others 1992) which is the main contributor to its bio-
Samples FRAP (mg/ g GAE) DPPH activity
(mg/g VCEAC)
Neem leaf powder 6.73 0.65c 16.59 0.04c
Neem bark powder 7.88 1.15c 16.43 0.06c
Green tea 69.62 3.16a 167.32 1.89a
Black tea 25.43 1.40b 150.22 9.76b

72
activity (Huang and others 2004; Nathan and others 2005).
But these limonoids possess far lesser anti-oxidant
activity than polyphenols because of the lack of hydroxyl
groups which get oxidized (Yu and others 2005).
3.3.5 Total limonoids- limonoid glucosides and aglycones
Table 4 and 5 shows the content of limonoids- glucosides
and aglycones in neem leaf and bark in ethanolic and
aqueous extracts. The limonoid glucosides extracted by
neem leaf and bark in both the ethanolic extract and the
infusion is similar. While more limonoid aglycones are
extracted in neem leaf than neem bark in the ethanolic
extract, we did not find any significant differences
(p<0.05) in the infusion. Neem, belonging to the
Meliaceae family, is a rich repository of limonoids(Roy
and Saraf 2006), and that is supported by the content of
limonoids extracted in our experiments. These values are
much higher than in Washington Navel oranges and Rio star
grapefruit where LE were found to be 0.002 ± 0.00 and
0.01 ± 0.00 mg/g, and the limonoid glucoside content was
found to be 0.14 ± 0.00 and 0.21± 0.01 mg/g LGE,
respectively.
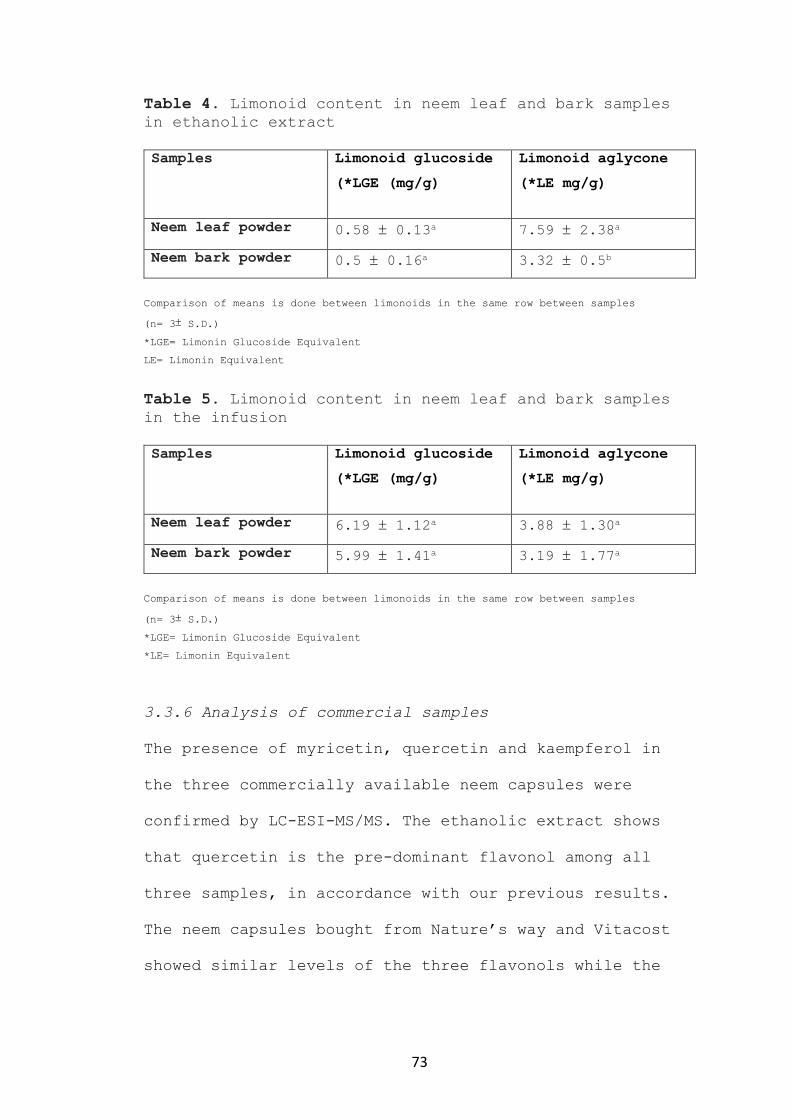
73
Table 4. Limonoid content in neem leaf and bark samples
in ethanolic extract
Samples Limonoid glucoside
(*LGE (mg/g)
Limonoid aglycone
(*LE mg/g)
Neem leaf powder 0.58 0.13a 7.59 2.38a
Neem bark powder 0.5 0.16a 3.32 0.5b
Comparison of means is done between limonoids in the same row between samples
(n= 3 S.D.)
*LGE= Limonin Glucoside Equivalent
LE= Limonin Equivalent
Table 5. Limonoid content in neem leaf and bark samples
in the infusion
Samples Limonoid glucoside
(*LGE (mg/g)
Limonoid aglycone
(*LE mg/g)
Neem leaf powder 6.19 1.12a 3.88 1.30a
Neem bark powder 5.99 1.41a 3.19 1.77a
Comparison of means is done between limonoids in the same row between samples
(n= 3 S.D.)
*LGE= Limonin Glucoside Equivalent
*LE= Limonin Equivalent
3.3.6 Analysis of commercial samples
The presence of myricetin, quercetin and kaempferol in
the three commercially available neem capsules were
confirmed by LC-ESI-MS/MS. The ethanolic extract shows
that quercetin is the pre-dominant flavonol among all
three samples, in accordance with our previous results.
The neem capsules bought from Nature’s way and Vitacost
showed similar levels of the three flavonols while the

74
ones bought from Piping Rock contained significantly
(p<0.05) lower levels (Fig.7)
Fig.7. Distribution of flavonols in commercial neem
capsules
A) Ethanolic extract
Comparison of means is done between the same flavonol of different samples. Means with
different letters are significantly different (p<0.05)
B) Infusion
Comparison of means is done between the same flavonol of different samples. Means with
different letters are significantly different (p<0.05)
0.00
1.00
2.00
3.00
4.00
5.00
6.00
7.00
8.00
9.00
10.00
Nature's way Vitacost Piping Rock
Fla
vonol conte
nt
(mg/g
)
Myricetin Quercetin Kaempferol
aa
ba a
ba a
b
0
0.1
0.2
0.3
0.4
0.5
0.6
Nature's way Vitacost Piping Rock
Querc
etin c
onte
nt
(mg/g
) a a
b
75
Quercetin was the only flavonol extracted in the
infusion. Similar to the ethanolic extract, the level of
quercetin was significantly (p<0.05) lower Piping rock
compared to samples obtained from the other two vendors.
3.4 Conclusions
Our study provides nutritional information about the
health value of neem leaf and bark to U.S. consumers that
would help them in making a better purchasing decision
while choosing between a medicinal tea i.e.; neem and
more traditional beverages such as green and black tea.
While green and black tea proved to be much richer
repositories of polyphenols and hence, possess
significantly more anti-oxidant activity than neem leaf
and bark, a closer look at the levels of specific
flavonoids, i.e.; flavonols-myricetin, quercetin and
kaempferol provides encouraging reasons for the use of
neem leaf. These flavonols and high quantities of
limonoids, might be the basis of the many health benefits
of neem.

76
Chapter 4
CHARACTERIZATION OF THE VOLATILE PROFILE OF
NEEM (AZADIRACHTA INDICA A. JUSS.) LEAF AND
BARK COMMERCIALLY AVAILABLE IN THE UNITED
STATES USING HS-SPME LINKED WITH GAS
CHROMATOGRAPHY-MASS SPECTROMETRY
4.1 Introduction
Medicinal trees have formed an integral part of the
remedial measures various civilizations have adopted over
the years to counter a multitude of diseases. These trees
have acted as an alternative to traditional western
medicine and have found consumer acceptability because of
being a ‘natural source’, in various parts of the world
(Bussmann and others 2007). More recently, with a better
understanding of the relationship between diet and
health, consumers have been especially attracted to herbs
and the functional foods incorporating them, for a
healthier lifestyle.
Azadirachta Indica A. Juss. (Meliaceae) is one such
medicinal tree, whose leaves, bark, seed pulp, flower,
fruit and twig have been used since times immemorial in
the Indian sub-continent as a popular household remedy
(Subapriya and Nagini 2005). Neem tree is considered as

77
‘sarvaroga nivarini’ (the panacea for all diseases) and
has also been hailed as ‘heal all’, ‘divine tree’,
‘village dispensary’ and ‘nature’s drugstore (Subapriya
and Nagini 2005). Today, neem and its extracts are being
commercially sold as tea, soaps, cosmetic creams,
toothpastes and shampoos.
Neem has been experimentally shown to have anti-cancer
(Kumar and others 2006b), anti-diabetic (Perez-Gutierrez
and Damian-Guzman 2012a), anti-inflammatory (Akihisa and
others 2011), anti –ulcerogenic (Bandyopadhyay and others
2002a), anti-microbial (SaiRam and others 2000) and
contraceptive (Raghuvanshi and others 2001) properties.
Much of these beneficial properties have been attributed
to the non-volatile flavonoids and limonoids in neem.
Although in general, headspace volatiles and volatiles
from essential oils from various botanicals have received
considerable attention in the medical community,
literature regarding neem leaf volatiles is scarce except
for Zeringue and Bhatnagar (1994), while it is totally
missing in the case of bark.
This study aims to bridge the gap by elucidating a
comprehensive profile of the volatiles in different
samples of neem leaf and neem bark powder by using an
efficient, non-invasive and solvent-less technique
(Jelen, Majcher, & Dziadas, 2012) called solid phase
microextraction coupled with gas chromatography–mass

78
spectrometry. Furthermore, we also aim to report the
extraction and constituents of the essential oil derived
from neem leaf, previously never reported.
With this information, we seek to find justification for
the application of neem leaf and bark as a medicinal
resource in functional food products and beverages.
4.2 Materials and methods
4.2.1 Plant material
Neem leaf powder, fresh leaf, dried leaf and bark powder
was bought from Neem Tree Farms Inc., Brandon, Florida.
Samples from two different commercial batches of each
sample type were used for triplicate analysis producing a
total sample size of six (6) for every sample type.
4.2.2 Chemicals
Volatile chemical standards – alpha-ionone, beta
caryophyllene, beta –ionone and D-limonene were bought
from Bedoukian chemicals (Bedoukian Research, Inc., CT,
USA) and prepared in hexane.
4.2.3 HS-SPME procedure
2 grams of neem leaf /bark powder in 4 mL water were
placed with 4 mL water into a 10-mL glass vial with an
open center screw cap and a Teflon/Silicon septum
(Supelco, Bellefonte, USA). The sample was equilibrated
for 4 hours at 60°C in a water bath followed by SPME
79
fiber exposure of 1 hour, allowing the volatiles to be
adsorbed on the fiber.
For analyzing fresh and dried neem leaf samples, a small
vial was unusable for analysis. Therefore, a larger glass
beaker with a modified cap and a rubber septum was used
as the extraction vessel. 5 grams of leaf samples were
placed into 200 mL of water and were treated the same way
as the neem leaf and bark powders, using identical
equilibration time, exposure time and temperature. A
Stable Flex fiber (Sigma –Aldrich, St. Louis, MO) coated
with 50/30 μm Divinylbenzene/Carboxen on
Polydimethylsiloxane was used for this analysis.
4.2.4 Extraction of Essential oil
25 g of Neem leaf powder was subjected to a Soxhlet
extraction for 4 hours with Petroleum ether (BP 35˚-60˚C)
to get the total hydrophobic extract. The solvent was
evaporated using a rotary evaporator. The greenish
residue that collected was then subjected to
hydrodistillation (Clevenger apparatus) for 3 hours. The
steam volatile fraction, i.e., the essential oil was
collected by trapping it in hexane. To the hexane
extract, a pinch of sodium sulfate was added to remove
any water. It was then concentrated down to 0.5 mL using
nitrogen gas; the remaining extract was stored in sealed
vials at 4˚C until further analysis.

80
4.2.5 GC-MS Analysis
A Varian GC 3400CX (Varian, Walnut Creek, CA, USA)
equipped with a 1078 programmable injector connected to a
Varian Saturn 2000 Mass spectrometer with an ion trap
detector was used for GC-MS analysis. Volatiles were
separated by using a DB-5MS UI, 30 m X 0.25 mm, 0.25 um
film thickness (Agilent J & W Columns) fused silica
capillary column. Helium carrier gas flow rate was kept
at 1ml/min and injector, transfer line and ion trap
temperatures were 250, 250, 1500C, respectively. The
analysis was done in the splitless mode and the post
desorption split flow was 100 ml/min. The column
temperature program was: 350C held for 5 min. and linear
temperature program from 35 to 2500C at 30C/Min.
Identification of chemical compounds was established
using mass spectra comparison with the NIST 1992 and
Wiley 5 libraries, retention indices of standards, and
literature values.
4.2.6 Statistical Analysis
A multivariate analysis in the form of Principal
Component Analysis (PCA) was performed on three different
neem samples- leaf powder, dried leaf and fresh leaf to
visualize their grouping tendencies and identify
variables (volatiles) influencing their variability. The
composition data matrix of three samples (103 variables x
18 samples= 1854 data points) was analysed using

81
Microsoft Excel software 2011 (Microsoft Corp., Redmond,
WA, USA) with the help of XLSTAT software add-in.
Eigenvalues were calculated using a co-variance matrix
among 103 chemical compounds as input, and the score and
loading plots were generated using sample type and
volatile constituents, respectively.
4.3 Results and discussion
4.3.1 Comparison of the volatile profile of neem dried
leaf powder, dry leaf and fresh leaf
Forty-two (42), thirty-seven (37) and seventy-one (71)
compounds were detected in neem dried leaf powder, dry
leaf and fresh leaf, respectively. In all these samples,
the sesquiterpenes were the most significant class of
compounds, that made up 534.8%, 56.8% and 18.3% of the
total number of compounds extracted, respectively.
Caryophyllene oxide at 17.04 ± 3.58%, unidentified
sesquiterpene 21 at 35.77± 6.78 % and 2,6 nonadienal (E,
Z) at 8.27 ± 6.00% relative abundance (Table 1), made the
highest contribution towards the headspace of neem dried
leaf powder, dry leaf and fresh leaf, respectively. The
other major classes of compounds were monoterpenes,
aldehydes, ketones and alcohols as shown in Fig. 1.
The three sample types were clearly differentiated by
Principal Component Analysis. Fig.2 and Fig. 3 show the
score and loading plot, for samples and variables,
respectively.

82
Fig. 1. Percentage (%) of different classes of compounds
as identified from the headspace of various neem samples
by SPME and GC-MS.
The first two principal components were able to explain
more than 75% of the total variability (F1= 52.5%,
F2=19.95%) between the three samples. We observed, that
the dry leaf and dried leaf powder samples were separated
from the fresh leaf samples on F1. F2 not only separated
the dry leaf samples from the dried leaf powder samples.
The variation between the dry leaf and dried leaf powder,
and between the two fresh leaf batches is primarily due
to the variability in monoterpenes, pyrroles and aromatic
compounds and to a lesser extent due to esters and
ethers, as is evident from the loading plot (Fig.3). Fig.
3 also shows us that alcohols, sulfur compounds and
furans contribute most to the separation of samples by F1
while aldehydes, esters, ethers and ketones load both on
F1 and F2 thus contributing to differentiation of samples
0
10
20
30
40
50
60
Perc
en
tag
e o
f to
tal v
ola
tile
s
extr
acte
d (
%)
Dried leaf powder
Dry leaf
Fresh leaf

83
by the two main principal components. Some of the
important compounds in each sample type have been shown
in the chromatograms in Fig. 4.
Fig. 2. Score plot for dried leaf powder (DLP), dry leaf
(DL) and fresh leaf (FL)
Fig. 3. Loading plot for variables of dried leaf powder,
dry leaf and fresh leaf

84
One of the distinguishing factors of the volatile profile
of fresh leaf is the presence of organosulfur compounds
in the headspace. Organosulfur compounds such as di-n-
propyl and n-propyl-1-propenyl di-, tri- and tetra
sulfides and their importance have been reported before
in neem seeds (Balandrin, Lee, & Klocke, 1988).
Shivashankar et al. (2012) also identified 2,5 dimethyl
thiophene; 3,4 dimethyl thiophene and 1,3 dithiane in
neem seeds via HS-SPME. The protective action of
organosulfur compounds against Aedes aegypti, Heliothis
virescens, Heliothis zea (Balandrin et al., 1988) and
Asian citrus psyllid (Rouseff, Onagbola, Smoot, &
Stelinski, 2008) have been elucidated.
Zeringue and Bhatnagar (1994) collected fresh neem leaf
volatiles by purging them with air and trapping the
volatiles in a Tenax trap, before thermally desorbing
them into a GC. The volatile profile was dominated by
ketones which accounted for 43% of the total area
followed by alcohols which occupied 23% of the headspace.
This is in sharp contrast to our observations, where we
found that the headspace of fresh neem leaves had a high
proportion of sesquiterpenes (~50%).
Several organosulfur compounds (10) were also identified,
as mentioned above, that were missing in the study of
Zeringue and Bhatnagar (1994). Two contributing factors
to this variation might be the different geographical

85
origin of our neem sample and /or the different
extraction technique used in our study.
4.3.2 Comparison between neem bark and leaf powder
volatiles
Courtois et al. (2012) from an extensive study of fifty-
five (55) tropical tree species, showed that the terpene
volatiles released by the leaves of a species are very
different from the ones released by the bark. Considering
that leaves and bark are attacked by different
communities of insect herbivores (Novotny & Wilson,
1997), some qualitative differences were found in the
released volatiles, indicating that some terpenes may be
specialized to ward off non-overlapping communities of
herbivores. A similar phenomenon was observed in our
study. The commonalities and differences have been
elucidated in Fig.4.
Fig.4. Number of mono- and sesquiterpenes in only bark,
only leaves or found in both tissues
0
10
20
30
40
50
60
Monoterpenes Sesquiterpenes
Nu
mb
er o
f co
mp
ou
nd
s
Only Bark
Commmon
Only Leaf

86
Fig.5. Chromatograms of the various neem leaf and bark samples
A) Neem dried leaf powder
B) Neem dry leaf

87
c) Neem fresh leaf
D) Neem essential oil
Table 1 compares the headspace volatiles extracted by HS-
SPME between neem bark and leaf powder. Sixty-seven (67)
of the sixty-seven (67) compounds detected in neem bark

88
powder by HS-SPME analysis were identified. The volatile
profile of the bark was dominated by sesquiterpene
volatiles (35 compounds), which accounted for 51.4 % of
the total volatiles, much like for the leaf. Alcohols,
ketones and monoterpenes constituted 9 % of the total
volatiles. Aldehydes and aromatic compounds made up 4.4 %
while alkanes made up 2.9 %. Diterpenes, esters, ethers,
furans and alkenes formed a miniscule percent of the
extracted volatiles at 1.4 %.
The highest contribution to the headspace of bark came
from naphthalene, a polycyclic aromatic compound that was
unique to bark in our analysis, as opposed to
caryophyllene oxide, a sesquiterpene, for leaf. This
might be surprising as naphthalene is usually associated
with anthropogenic activity related to the mineral oil
and coal industry. However, they have been found on the
antennae of stem borers (lepideptorus insects) and are
thought to have semiochemical activity (attractant),
being released from Napier grass, Pennisetum purpureum,
and Sudan grass, Sorghum sudanensis (Khan, Pickett, Berg,
Wadhams, & Woodcock, 2000).
Naphthalene’s relative abundance was 25.43 ± 6.98% while
that of caryophyllene oxide was 17.04 ± 3.58 %. Other
major contributions in neem bark from the sesquiterpene
class came from beta caryophyllene, alpha copaene,
acoradiene, caryophyllene alcohol and alloaromadendrene

89
with relative abundance of 8.57 ±5.35 %, 3.14 ± 1.62%,
2.76± 1.13% ,2.52 ± 1.73% and 2.39 ± 1.85 %.
4.3.3 Comparison between HS –SPME and essential oil
volatiles of dried neem leaf powder
Table 1 compares the qualitative aspects of the volatiles
extracted by HS-SPME and in essential oil. Sixty-four
(64) compounds were identified in neem essential oil. The
essential oil produced a very low yield of ~0.0001 % and
was rich in sesquiterpenes much like the headspace
volatiles extracted by SPME, accounting for 46.1 % of the
total volatiles extracted. Ketones and monoterpenes were
the second and third most abundant group with 12.5 % and
10.9 % of the total volatiles respectively. Esters made
up 9.2%, which was in sharp contrast with the headspace
volatile composition where esters made up merely 2.3%.
Alcohols, aldehydes and diterpenes made up 4.7 % of the
volatile composition. The presence of diterpenes and
acids are major distinguishing factors between the
headspace and essential oil volatile composition. In
addition to the compounds shown in the Table 1, compounds
unique to essential oil allowing us to distinguish
between it and different samples are listed in Table 2.
Some of the major contributors to the volatile
composition were caryophyllene oxide with 12.88 ± 6.29%,
an unknown sesquiterpene with 4.56± 0.48% and spathulenol
with 3.88 ± 1.31% of the relative abundance, all

90
belonging to sesquiterpenes. The carboxylic acid, n-
hexadecanoic acid made up a significant 12.66 ± 7.56 % of
the total while the diterpene phytol contributed 4.67 ±
2.96%.
Thus, caryophyllene oxide is most important contributor
to both, the headspace and essential oil volatiles. This
provides further evidence of neem as a tree with
tremendous medicinal benefits as caryophyllene oxide has
been implicated for its anti-inflammatory role in
lymphoma and neuroblastoma cells (Sain et al. 2014) and
is a major constituent of various essential oils with
health beneficial effects (Tung, Chua, Wang, & Chang,
2008; Chang, Chen, & Chang, 2001; Baratta, Dorman, Deans,
Biondi, & Ruberto, 1998). Some of the important compounds
in the essential oil are shown below in Fig. 6.
4.4 Conclusions
Neem (Azadirachta indica A. Juss) has always been
considered a tree with great medicinal properties by
people of the Indian sub-continent. Our study adds
valuable information in elucidating the chemicals that
may be responsible for neem’s effects. We observe, that
the process of drying the fresh leaves removes some of
the alcohols and furans while eliminating organosulfur
volatiles. The process of mechanical crushing to further
convert the dried leaf into powder, leads to either a
complete or partial loss of compounds such as- octanal;

91
2,4 heptadienal (E, E), ethyl hexanol,
benzeneacetaldehyde, geranyl acetone and specific
sesquiterpenes. The profile of the dried leaf and bark
powder is important in the beverage context, as they are
being marketed and sold as medicinal teas. Neem essential
oil can be incorporated into foods as a natural oxidant
given the high load of beneficial compounds it contains.
However, an optimum method to improve its extraction
yield must be figured out before any commercial
application can be undertaken.
The high proportion of sesquiterpenes in all the neem
leaf samples and bark, whose role as anti-carcinogenic
and anti-microbial chemicals is already well established,
supports the image of neem as a very effective medicinal
plant that could play a significant role in the
functional foods industry.
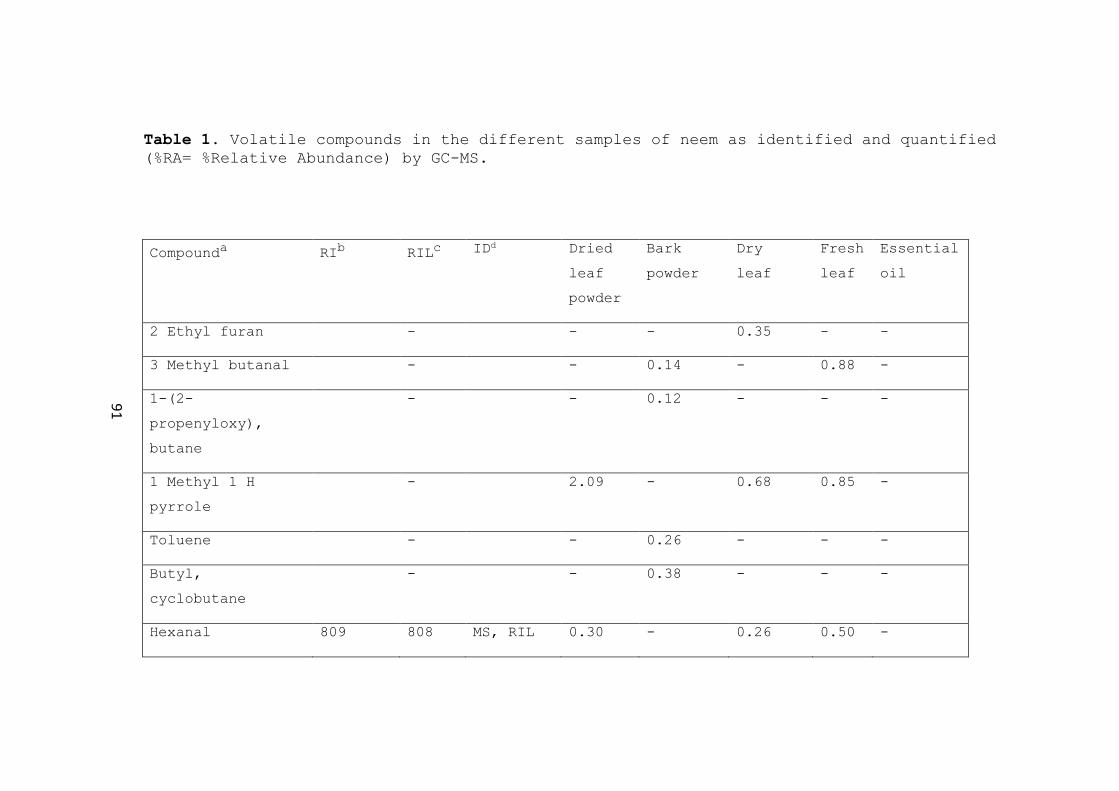
Table 1. Volatile compounds in the different samples of neem as identified and quantified
(%RA= %Relative Abundance) by GC-MS.
Compounda RI
b RIL
c IDd Dried
leaf
powder
Bark
powder
Dry
leaf
Fresh
leaf
Essential
oil
2 Ethyl furan - - - 0.35 - -
3 Methyl butanal - - 0.14 - 0.88 -
1-(2-
propenyloxy),
butane
- - 0.12 - - -
1 Methyl 1 H
pyrrole
- 2.09 - 0.68 0.85 -
Toluene - - 0.26 - - -
Butyl,
cyclobutane
- - 0.38 - - -
Hexanal 809 808 MS, RIL 0.30 - 0.26 0.50 -
91

Compounda RI
b RIL
c IDd Dried
leaf
powder
Bark
powder
Dry
leaf
Fresh
leaf
Essential
oil
2,5 Dihydro, 3,4
dimethyl furan
827 - MS - - - 1.04 -
1,1, 3 Trimethyl
cyclopentane
844 - MS 1.35 - 2.37 2.08 -
2,4 Dimethyl
thiophene
872 878 MS, RIL - - - 0.30 -
Styrene 887 893 MS, RIL - - - 0.19 -
2 Heptanone 891 895 MS, RIL - 0.31 - - -
3,4 Dimethyl
thiophene
899 - MS - - - 1.50 -
Heptanal 902 903 MS, RIL - - - 0.33 -
Methoxy benzene 916 918 MS, RIL - 0.09 - 3.74 -
Dl propyl sulfide 918 - MS - - - 0.15 -
1,3 Dithiane 934 - MS - - - 0.33 -
Benzaldehyde 960 960 MS, RIL 2.54 1.73 0.66 6.12 -
Heptanol 974 973 MS, RIL - 0.59 - - -
92

Compounda RI
b RIL
c IDd Dried
leaf
powder
Bark
powder
Dry
leaf
Fresh
leaf
Essential
oil
Octen-3-ol 983 979 MS, RIL - 0.25 - - -
Sulcatone 987 985 MS, RIL 1.93 0.79 0.52 0.39 0.12
2 Pentyl furan 991 993 MS, RIL - 1.37 - 1.68 -
Isolimonene 998 998 MS, RIL - - - 4.17 -
Octanal 1001 1001 MS, RIL - - 0.38 0.68 -
2,4 heptadienal
(E, E)
1008 1006 MS, RIL - - 0.49 0.82 0.40
2 Methyl 4
octanone
1020 - MS - - - 0.53 -
p Cymene 1023 1027 MS, RIL - 1.37 - - -
D- Limonene 1028 1030 MS, RIL,
RIS
0.26 1.32 0.60 0.14 0.01
2 Ethyl hexanol 1031 1032 MS, RIL - 0.44 0.87 0.78 -
Benzeneacetaldehy
de
1043 1044 MS, RIL - 0.31 0.78 3.65 -
93
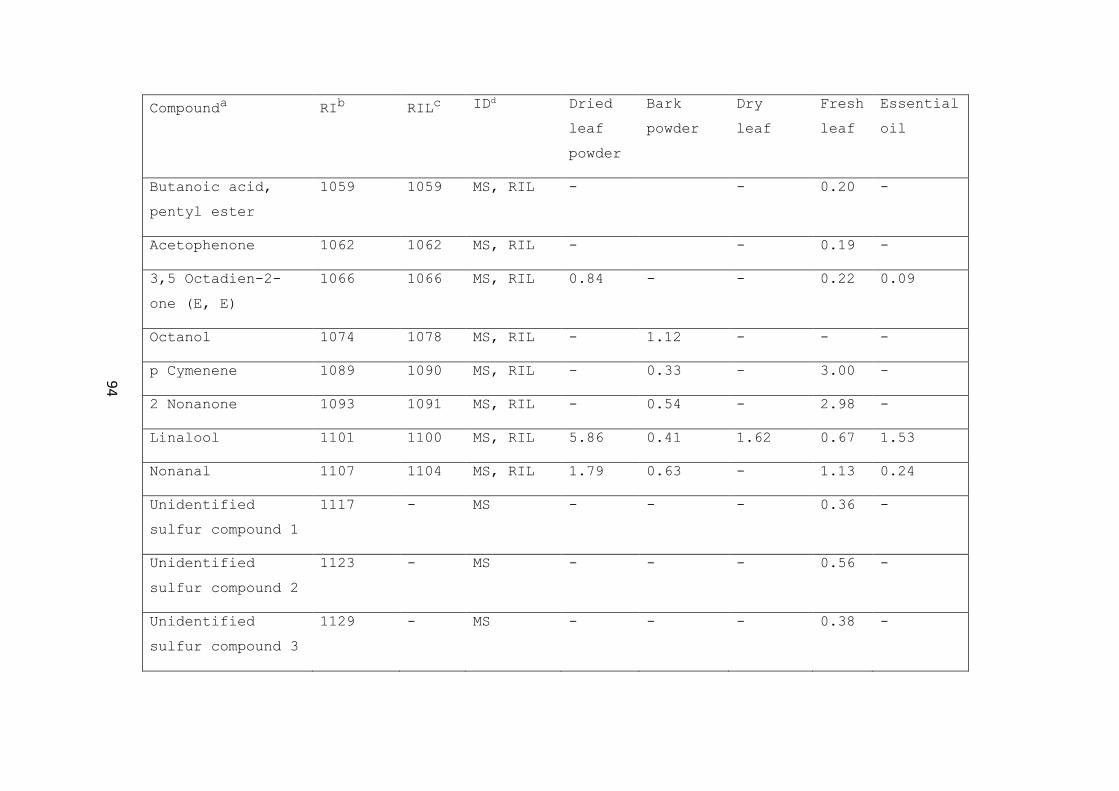
Compounda RI
b RIL
c IDd Dried
leaf
powder
Bark
powder
Dry
leaf
Fresh
leaf
Essential
oil
Butanoic acid,
pentyl ester
1059 1059 MS, RIL - - 0.20 -
Acetophenone 1062 1062 MS, RIL - - 0.19 -
3,5 Octadien-2-
one (E, E)
1066 1066 MS, RIL 0.84 - - 0.22 0.09
Octanol 1074 1078 MS, RIL - 1.12 - - -
p Cymenene 1089 1090 MS, RIL - 0.33 - 3.00 -
2 Nonanone 1093 1091 MS, RIL - 0.54 - 2.98 -
Linalool 1101 1100 MS, RIL 5.86 0.41 1.62 0.67 1.53
Nonanal 1107 1104 MS, RIL 1.79 0.63 - 1.13 0.24
Unidentified
sulfur compound 1
1117 - MS - - - 0.36 -
Unidentified
sulfur compound 2
1123 - MS - - - 0.56 -
Unidentified
sulfur compound 3
1129 - MS - - - 0.38 -
94

Compounda RI
b RIL
c IDd Dried
leaf
powder
Bark
powder
Dry
leaf
Fresh
leaf
Essential
oil
Isodurene 1148 1137 MS, RIL - 4.96 - - -
Unidentified
sulfur compound 4
1150 - MS - - - 0.70 -
2,6 Nonadienal
(E, Z)
1153 1154 MS, RIL - - - 8.27 -
2 Nonenal (E) 1160 1162 MS, RIL - - - 1.72 -
1,3 Dimethoxy
benzene
1167 1164 MS, RIL - 0.17 - - -
2,4 Dimethyl
benzaldehyde
1172 1178 MS, RIL 0.34 - - 0.51 -
Nonanol 1175 1171 MS, RIL - 0.60 - - -
Naphthalene 1183 1179 MS, RIL - 25.43 - - -
Methyl salicylate 1191 1191 MS, RIL 1.12 0.17 - - -
Safranal 1194 1197 MS, RIL 0.90
1.04 0.47 -
95

Compounda RI
b RIL
c IDd Dried
leaf
powder
Bark
powder
Dry
leaf
Fresh
leaf
Essential
oil
Beta cyclocitral 1218 1219 MS, RIL 1.05 0.22 1.37 2.23 -
(Z) Citral 1234 1238 MS, RIL,
RIS
0.54 - - - 0.68
Unidentified
monoterpene 1
1247 - MS 5.61 - - - -
Beta
homocyclocitral
1252 - MS - - 0.45 -
(E) Citral 1265 1269 MS, RIL,
RIS
0.68 - - - 1.15
Alpha ethylidene
benzene
acetaldehyde
1265 1268 MS, RIL - - - 0.31 -
Cyclohexene, 5
methyl-3- (1
methylethenyl),
trans (-)
1279 - MS - - - 0.88 -
2 Undecanone 1295 1291 MS, RIL - 0.65 - - -
96
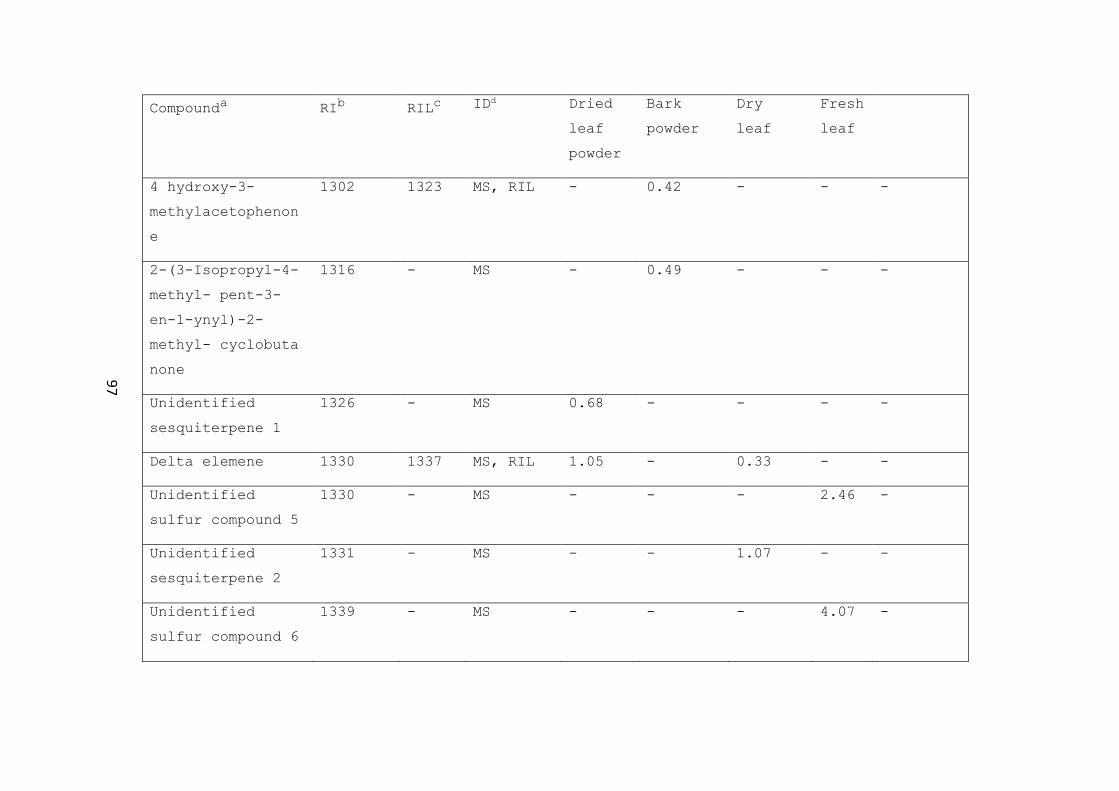
Compounda RI
b RIL
c IDd Dried
leaf
powder
Bark
powder
Dry
leaf
Fresh
leaf
4 hydroxy-3-
methylacetophenon
e
1302 1323 MS, RIL - 0.42 - - -
2-(3-Isopropyl-4-
methyl- pent-3-
en-1-ynyl)-2-
methyl- cyclobuta
none
1316 - MS - 0.49 - - -
Unidentified
sesquiterpene 1
1326 - MS 0.68 - - - -
Delta elemene 1330 1337 MS, RIL 1.05 - 0.33 - -
Unidentified
sulfur compound 5
1330 - MS - - - 2.46 -
Unidentified
sesquiterpene 2
1331 - MS - - 1.07 - -
Unidentified
sulfur compound 6
1339 - MS - - - 4.07 -
97

Compounda RIb RILc IDd Dried
leaf
powder
Bark
powder
Dry
leaf
Fresh
leaf
Essential
oil
Unidentified
sesquiterpene 3
1342 - MS 0.58 - - - -
1H indene,
ethylideneoctahyd
ro-7a methyl (1Z,
3a.alpha,
7a.beta)
1350 - MS - - - 0.38 -
(-)-
Isolongifoline
1352 1378 MS - 0.37 - - -
Bicyclo [5.2.0]
nonane, 4-
methylene-2, 8,8-
trimethyl-2-
vinyl-
1368 1458 MS - 0.48 - - -
2H-2, 4a-
Ethanonaphthalene
, 1,3,4,5,6,7-
hexahydro-2, 5,5-
trimethyl-
1373 - MS - 0.72 - - -
98

Compounda RIb RILc IDd Dried
leaf
powder
Bark
powder
Dry
leaf
Fresh
leaf
Essential
oil
Alpha copaene 1375 1377 MS, RIL 1.07 3.14 3.91 0.60 -
Beta bourbonene 1378 1380 MS, RIL 3.22 - 0.98 - -
Beta elemene 1389 1393 MS, RIL 2.21 0.59 1.24 - -
Unidentified
sesquiterpene 4
1404 - MS - 0.74 - - -
Unidentified
sesquiterpene 5
1412 - MS - 0.80 - - -
Alpha cedrene 1415 1415 MS, RIL - 0.81 - - -
Beta
caryophyllene
1415 1418 MS, RIL,
RIS
5.28 8.57 5.54 0.33 0.32
Alpha ionone 1418 1422 MS, RIL,
RIS
0.53 - 0.97 0.78 0.29
Unknown
sesquiterpene 6
1423 - MS - 0.88 -
Gamma elemene 1424 1425 MS, RIL 3.32 - 5.28 0.61 -
99

Compounda RI
b RIL
c IDd Dried
leaf
powder
Bark
powder
Dry
leaf
Fresh
leaf
Essential
oil
Trans alpha
bergamotene
1428 1432 MS, RIL 0.95 0.81 0.90 - -
Di-epi-α-cedrene 1430 1427 MS, RIL - - - 0.46 -
Beta patchoulene 1442 1380 MS - - - 0.73 -
Alpha himachalene 1444 1447 MS, RIL 4.94 - - - -
Geranyl acetone 1449 1448 MS, RIL - 1.09 1.11 0.49 -
Humulene 1455 1455 MS, RIL 1.31 1.27 1.75 0.25 -
Alloaromadendrene 1459 1460 MS, RIL - 2.39 - - -
Beta acoradiene 1466 1466 MS, RIL - 2.76 - - -
Unidentified
sesquiterpene 7
1470 - MS 2.65 - - - -
Beta ionone 1473 1477 MS, RIL,
RIS
3.29 - 5.92 4.05 1.99
(+)-Epi
bicyclosesquiphel
landrene
1476 1482 MS, RIL - 1.70 7.48 - -
10
0

Compounda RI
b RIL
c IDd Dried
leaf
powder
Bark
powder
Dry
leaf
Fresh
leaf
Essential
oil
Beta ionone
isomer
1479 - MS - - - - -
Beta Selinene 1483 1485 MS, RIL 0.96 - - - -
Unidentified
sesquiterpene 8
1486 - MS 0.85 - - - -
Unidentified
sesquiterpene 9
- MS 1.79
Valencene 1487 1490 MS, RIL 1.57 - 0.80 0.49 0.38
Unidentified
sesquiterpene 10
1488 - MS - 0.67 - - -
Unidentified
sesquiterpene 11
1491 - MS - 1.19 -
Delta selinene 1493 1493 MS, RIL - 0.58 -
Alpha muurolene 1494 1499 MS, RIL 2.35 0.33 - -
Beta himachalene 1494 1499 MS, RIL 2.04 - - 0.24 0.71
10
1
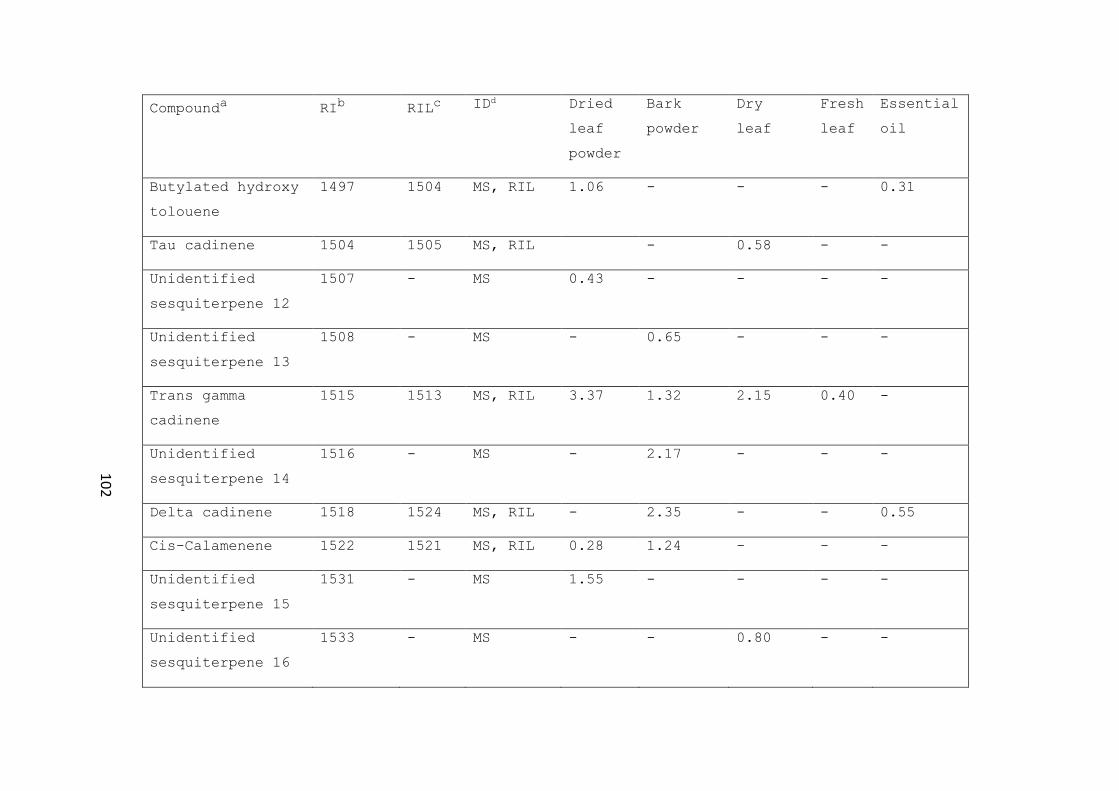
Compounda RI
b RIL
c IDd Dried
leaf
powder
Bark
powder
Dry
leaf
Fresh
leaf
Essential
oil
Butylated hydroxy
tolouene
1497 1504 MS, RIL 1.06 - - - 0.31
Tau cadinene 1504 1505 MS, RIL - 0.58 - -
Unidentified
sesquiterpene 12
1507 - MS 0.43 - - - -
Unidentified
sesquiterpene 13
1508 - MS - 0.65 - - -
Trans gamma
cadinene
1515 1513 MS, RIL 3.37 1.32 2.15 0.40 -
Unidentified
sesquiterpene 14
1516 - MS - 2.17 - - -
Delta cadinene 1518 1524 MS, RIL - 2.35 - - 0.55
Cis-Calamenene 1522 1521 MS, RIL 0.28 1.24 - - -
Unidentified
sesquiterpene 15
1531 - MS 1.55 - - - -
Unidentified
sesquiterpene 16
1533 - MS - - 0.80 - -
10
2
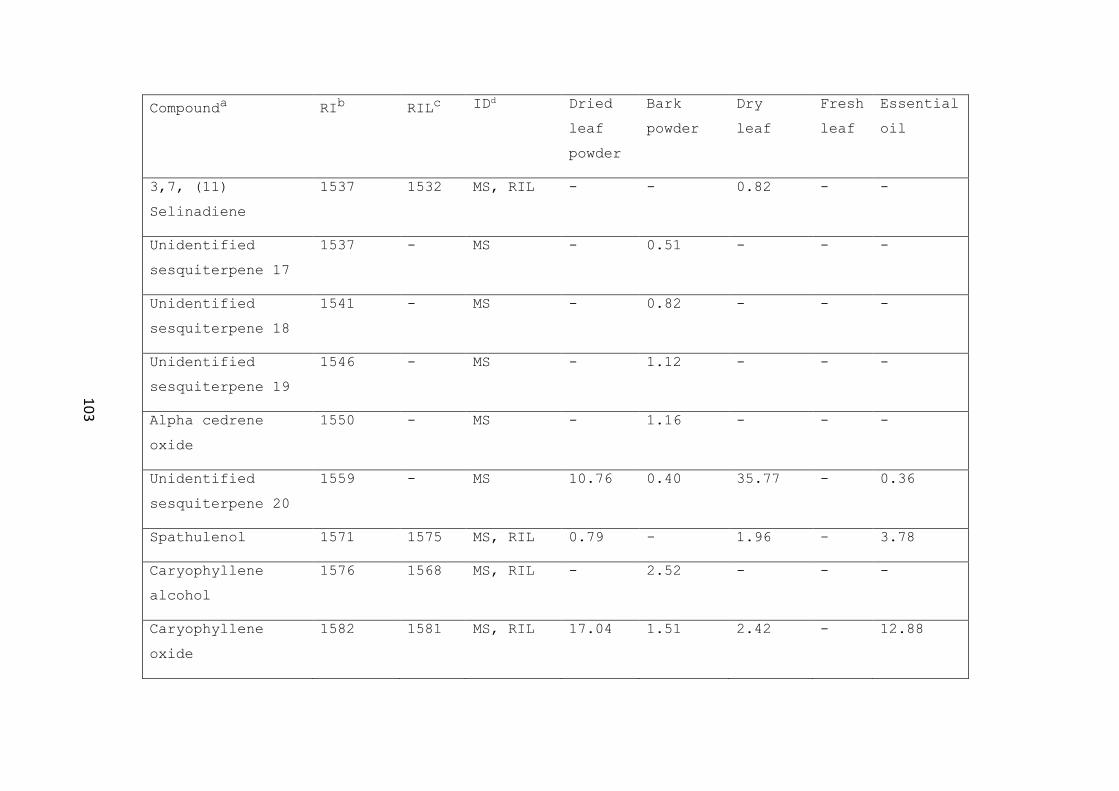
Compounda RI
b RIL
c IDd Dried
leaf
powder
Bark
powder
Dry
leaf
Fresh
leaf
Essential
oil
3,7, (11)
Selinadiene
1537 1532 MS, RIL - - 0.82 - -
Unidentified
sesquiterpene 17
1537 - MS - 0.51 - - -
Unidentified
sesquiterpene 18
1541 - MS - 0.82 - - -
Unidentified
sesquiterpene 19
1546 - MS - 1.12 - - -
Alpha cedrene
oxide
1550 - MS - 1.16 - - -
Unidentified
sesquiterpene 20
1559 - MS 10.76 0.40 35.77 - 0.36
Spathulenol 1571 1575 MS, RIL 0.79 - 1.96 - 3.78
Caryophyllene
alcohol
1576 1568 MS, RIL - 2.52 - - -
Caryophyllene
oxide
1582 1581 MS, RIL 17.04 1.51 2.42 - 12.88
10
3

a Compounds are listed in order of elution from a DB-5MS column.
b Linear retention index on DB-5MS column, experimentally determined using homologous series of
C8-C20 alkanes.
c Relative retention index according to Adams, 1995 for DB 5 capillary columns.
d Identification methods: MS, by comparison of the mass spectrum with the NIST 1992 and Wiley 5
libraries; RIL, by comparison of RI with those reported in the literature (Adams, 1995); RIS,
by matching retention times of commercial standards with compound peaks in the samples.
Compounds identified by only MS are done so tentatively.
Compounda RI
b RIL
c IDd Dried
leaf
powder
Bark
powder
Dry
leaf
Fresh
leaf
Essential
oil
Unidentified
sesquiterpene 21
1594 - MS - 1.07 - - -
Unidentified
sesquiterpene 22
1631 - MS - 1.32 - - -
Gamma eudesmol 1657 1651 MS, RIL - 1.57 - - -
Cadalene 1673 1674 MS - 0.72 - - -
Heptadecene 1682 1676 MS - 0.39 - - -
Abietatriene >1714 2051 MS - 0.54 - -
Methyl (z)
5,11,14,17
eicosatetraenoate
>1714 2274 MS - - - 2.58 -
10
4

Table 2. Volatiles, unique to essential oil, as identified and quantified (%RA= %Relative
Abundance) by GC-MS.
Compounda RIb RILc IDd %RA
2,3 Dimethyl 2 butanol - - MS 0.25
3 Methyl 3 pentanol - - MS 0.09
2 Hexanone - - MS 0.06
Alpha terpineol 1196 1198 MS, RIL 0.27
3 methyl -3-(4 methyl 3
pentenyl)
Oxiranecarboxaldehyde
1233 MS 0.34
Linalyl acetate 1252 1257 MS, RIL 0.57
Unidentified sesquiterpene
1
1348 - MS 0.41
2 Methyl propanoic acid, 3
hydroxy 2,4,4 trimethyl
pentyl ester
1373 1365 MS, RIL 0.51
Geranyl acetate 1381 1383 MS, RIL 0.37
10
5

Compounda RIb RILc IDd %RA
Longifolene 1450 1448 MS, RIL 1.47
Beta ionone epoxide 1483 - MS 1.01
Unidentified sesquiterpene
2
1517 - MS 0.75
Unidentified sesquiterpene
3
1526 - MS 1.19
Unidentified sesquiterpene
4
1538 - MS 0.35
Unidentified sesquiterpene
5
1542 - MS 0.32
Unidentified sesquiterpene
6
1559 - MS 0.36
E-Nerolidol 1564 1564 MS, RIL 0.35
Lauric acid 1574 1571 MS, RIL 1.93
Unknown sesquiterpene 7 1591 - MS 1.28
Unknown sesquiterpene 8 1605 - MS 0.58
10
6

Compounda RIb RILc IDd %RA
2,5,9 trimethylcycloundeca-
4, 8 dienone
1611 - MS 3.24
Unknown sesquiterpene 9 1614 - MS 0.91
Unidentified sesquiterpene
10
1618 - MS 0.69
7 R, 8R-8hydroxy-4-
isopropylidene-7-
methylbicyclo undecene
1624 1696 MS 1.27
Unidentified sesquiterpene
12
1639 - MS 0.95
Alpha elemene 1649 - MS 1.33
Unidentified sesquiterpene
13
1657 - MS 2.02
Aromadendrene oxide II 1672 1678 MS, RIL 2.45
Gamma costol 1683 - MS 1.48
10
7

Compounda RIb RILc IDd %RA
6 Isopropenyl 4,8a dimethyl
octahydro naphthalen-2-ol
1692 1690 MS, RIL 0.92
2 Octyl benzoate 1710 - MS 1.71
Unidentified sesquiterpene
14
1714 - MS 2.32
3 Isopropyl 6,7
dimethylcyclo decane-9, 10
diol
1745 - MS 1.10
Benzyl benzoate 1769 1762 MS, RIL 1.29
7R, 8R-8-Hydroxy-4-
isopropylidene-7-
methylbicyclo[5.3.1] undec-
1-ene
1772 - MS 3.41
Neophytadiene 1841 1838 MS, RIL 1.88
Hexadecanoic acid methyl
ester
1929 1927 MS, RIL 2.25
Isophytol 1951 1956 MS, RIL 0.54
10
8

Compounda RIb RILc IDd %RA
n Hexadecanoic acid 1971 1972 MS, RIL 12.66
8 Octadecanoic acid, methyl
ester (E)
>1971 2110 MS 1.33
Phytol >1971 2122 MS 4.67
Linolein >1971 - MS 2.23
Cis-9-eicosenol >1971 - MS 0.82
a Compounds are listed in order of elution from a DB-5MS column.
b Linear retention index on DB-5MS column, experimentally determined using homologous series of
C8-C20 alkanes.
c Relative retention index according to Adams, 1995 for DB 5 capillary columns.
d Identification methods: MS, by comparison of the mass spectrum with the NIST 1992 and Wiley 5
libraries; RIL, by comparison of RI with those reported in the literature (Adams, 1995). Compounds
identified by only MS are done so tentatively.
10
9

110
Chapter 5
Comparison of two adsorbent based de-bittering
procedures for neem (Azadirachta indica A.
Juss) tea- Effect on polyphenols, anti-oxidant
capacity, color and volatile profile
5.1 Introduction
Bitterness reduction is a huge challenge for the food
industry. Human beings have an inherent liking for sweet taste
(Myers and Sclafani 2003) but bitterness, generally, leads to
consumer rejection of food products (Stein and others 2003).
This is especially of concern for functional foods and
medicinal extracts, which target digestive health, weight
management, cancer and diabetes (Cencic and Chingwaru 2010).
The phytonutrients in these food products and extracts are
usually associated with a bitter and acrid off flavors, which
leads to a negative consumer experience (Drewnowski and Gomez-
Carneros 2000). Therefore, to improve the commercial viability
of such health promoting products, counteracting the
bitterness becomes a vital aspect of product development.
Neem (Azadirachta indica A. Juss.) is an evergreen tree
cultivated in various parts of the Indian sub-continent (Ray
and others 1996). It has been in use over centuries in Indian
folk medicine for its therapeutic value. Its bioactivity and
health promoting properties, have to a large extent, been
attributed to a group of bitter tetranortriterpenoids called
limonoids, in addition to various polyphenolic substances

111
(Champagne and others 1992). Today, extensive research has
shown that neem may have anti-cancer (Wu and others 2014),
anti- diabetic (Perez-Gutierrez and Damian-Guzman 2012b),
anti-inflammatory (Schumacher and others 2011), anti-
ulcerogenic (Dorababu and others 2004), and anti-microbial
effects (El-Mahmood and others 2013). Neem leaves are sold
today as ‘medicinal’ tea to health-conscious consumers all
over the world. But the high content of limonoids make it
extremely bitter and unpalatable.
The area of bitterness reduction has been researched
extensively in orange juice using various strategies such as
cyclodextrin polymers (Wilson III and others 1989),
polyadsorbent resins (Ribeiro and others 2002) and enzymatic
reactions (Cánovas and others 1998). One of the compounds
responsible for orange juice bitterness is limonin, which
belongs to the larger class of compounds called limonoids. The
bitterness principle of neem also constitutes limonoids,
azadirachtin being one of the primary ones being reported
(Parida and others 2002). Therefore, one could expect the
methods adopted to minimize bitterness in orange juice to work
effectively for neem tea as well. Solid phase extraction (SPE)
has been used previously to isolate limonoids in citrus juice
(Widmer 1991) and neem extracts (Jarvis and Morgan 2000; Lee
and others 2013) and therefore we hypothesized, that it could
be an effective method for removing limonoids and reducing
bitterness. In addition, there are several examples of the use

112
of cross linked divinylbenzene- styrene resins as effective
agents of bitterness removal (Ribeiro and others 2002; Stinco
and others 2013; Fernández‐Vázquez and others 2013).
While adsorption based removal of bitterness through polymeric
resins has the advantage of being a low energy processes, they
have elicited a “flavor scalping” effect (Fayoux and others
2007) and changes in color properties (Lee and Kim 2003) due
absorption of pigments by resins, which may have an adverse
effect on sensorial properties. Our aim is to apply adsorbent
based DPs to Neem tea infusion and observe the changes linked
to its purported health promoting. The results of this study
are useful for the food and beverage industry in the product
development process. The results can help functional food
developers specifically, to come up with de-bittering
procedures that can eliminate the bitterness and off-flavors
of phytonutrients while minimizing the loss in bio-active
compounds.
5.2 Materials and methods
5.2.1 Plant material
Three batches of neem tea-cut leaves (A. indica) with
different lot numbers were bought online from Neem Tree Farms
(Brandon, FL). These leaves were imported from Mexico and then
dried in a solar heated drying room, according to information
provided by the vendor.
5.2.2 Chemicals

113
Analytical grade ethanol was bought locally from the chemical
stores of the Department of Chemistry, University of Missouri,
Columbia. HPLC grade water, ascorbic acid, acetic acid,
chloroform, acetonitrile and Amberlite XAD-16 hydrophobic,
macro-reticular resin were bought from Thermo Fisher
Scientific (Waltham, MA, USA). Folin-Ciocalteau reagent,
perchloric acid (70%) DPPH (2,2-diphenyl-1-picrylhydrazyl)
were bought from Sigma-Aldrich (St. Louis, MO, USA) while the
C18 solid-phase extraction cartridges (100 mg, 1.5mL) were
bought from Grace Alltech (Columbia, MD, USA). The standard
for quercetin was bought from Cayman Chemical Co. (Ann Arbor,
MI, USA), and the standards for limonin glucoside and limonin
were bought from Abcam (Cambridge, MA, USA).
5.2.3 Tea preparation
To 100 mL of boiling water, 0.5 grams of tea was added and the
aqueous extraction was allowed to take place for 5 mins. This
solution was filtered using Fisherbrand P8 filter paper and
made up to volume in a 100-mL volumetric flask with distilled
water.
5.2.4 De-bittering procedures (DPs)
The DP’s were optimized for their bitterness reduction
capacity through bench top testing. The volume of tea to bed
volume (adsorbing material) ratio was noted.
A) Solid Phase Extraction (SPE) de-bittering procedure
20 mL of Neem tea was passed through each Grace™ Alltech™
Prevail™ C18 SPE column and the eluent was collected into two

114
10-mL glass tubes. The cartridges were sold pre-conditioned;
therefore, no preconditioning step with any organic solvent
was required. The volume ratio of tea: bed was 200:1.
B) Amberlite (AMB XAD-16) de-bittering procedure
The polymeric, macroreticular, hydrophobic, adsorbent resin
was washed overnight with distilled water to clear away the
anti-microbial sodium chloride and sodium carbonate salts that
it ships with. After drying in an oven, 2 grams of the bead-
like resin, was added to 50 mL of the Neem tea and stirred at
600 rpm with a magnetic stirrer in a batch operation. The
volume ratio of tea: bed was 25:1)
5.2.5 Extraction of flavonols
In order to quantify the amount of flavonols, the hydrolysis
method of Wang and Helliwell (2001) was followed with slight
modifications. Briefly, 8 mL of the neem tea was added to 12
mL of absolute (99.99%) ethanol in 100-mL round bottom flasks.
To this mixture, 5 mL of 6 N HCL and 40 mg of ascorbic acid
(anti-oxidant) (Nuutila and others 2002) was added and the
solution was refluxed at 95° C for two hours. The hydrolyzed
solution was filtered and made up to 25 mL in a volumetric
flask, using 60% ethanol. It was filtered through a 0.45 μ
nylon filter (EMD Millipore, Billerica, MA, USA) and injected
into the HPLC.
A stock solution of the flavonol standard, quercetin, was
prepared by dissolving 10 mg of the pure standard in 25 mL of
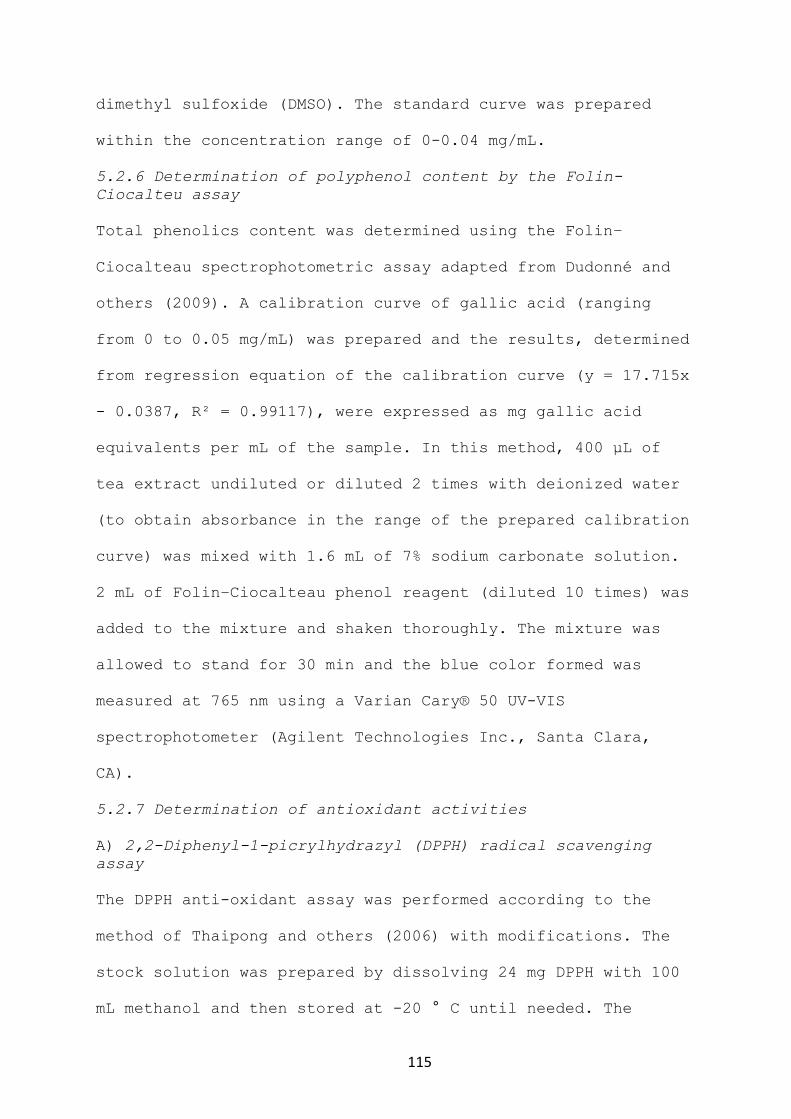
115
dimethyl sulfoxide (DMSO). The standard curve was prepared
within the concentration range of 0-0.04 mg/mL.
5.2.6 Determination of polyphenol content by the Folin-
Ciocalteu assay
Total phenolics content was determined using the Folin–
Ciocalteau spectrophotometric assay adapted from Dudonné and
others (2009). A calibration curve of gallic acid (ranging
from 0 to 0.05 mg/mL) was prepared and the results, determined
from regression equation of the calibration curve (y = 17.715x
- 0.0387, R² = 0.99117), were expressed as mg gallic acid
equivalents per mL of the sample. In this method, 400 μL of
tea extract undiluted or diluted 2 times with deionized water
(to obtain absorbance in the range of the prepared calibration
curve) was mixed with 1.6 mL of 7% sodium carbonate solution.
2 mL of Folin–Ciocalteau phenol reagent (diluted 10 times) was
added to the mixture and shaken thoroughly. The mixture was
allowed to stand for 30 min and the blue color formed was
measured at 765 nm using a Varian Cary® 50 UV-VIS
spectrophotometer (Agilent Technologies Inc., Santa Clara,
CA).
5.2.7 Determination of antioxidant activities
A) 2,2-Diphenyl-1-picrylhydrazyl (DPPH) radical scavenging
assay
The DPPH anti-oxidant assay was performed according to the
method of Thaipong and others (2006) with modifications. The
stock solution was prepared by dissolving 24 mg DPPH with 100
mL methanol and then stored at -20 ° C until needed. The

116
working solution was obtained by mixing 20 mL of stock
solution with 80 mL of methanol.
Briefly, 2800 µL of DPPH working solution was added to 200 µL
of sample and the solution was diluted with 2 mL of de-ionized
water. The samples or standard was incubated for 30 mins at
room temperature in the dark. The decolorization was measured
spectrophotometrically at 515 nm using a Varian Cary® 50 UV-
VIS spectrophotometer (Agilent Technologies Inc., Santa Clara,
CA). Anti-oxidant activity was expressed as percentage
inhibition of the DPPH radical and was determined by the
following equation as reported by Yen and Duh (Yen and Duh
1994).
%𝐴𝐴 = (𝐴𝑏𝑠𝑜𝑟𝑏𝑎𝑛𝑐𝑒𝑐𝑜𝑛𝑡𝑟𝑜𝑙 − 𝐴𝑏𝑠𝑜𝑟𝑏𝑎𝑛𝑐𝑒𝑠𝑎𝑚𝑝𝑙𝑒) ∕ 𝐴𝑏𝑠𝑜𝑟𝑏𝑎𝑛𝑐𝑒𝑐𝑜𝑛𝑡𝑟𝑜𝑙 × 100
The percentage (%) anti-oxidant activity was converted to
ascorbic acid equivalents using an ascorbic acid standard
curve found to be linear between 0.0176-0.1408 mg/mL (y =
693.12x - 3.0024
R² = 0.98683). The results were expressed in mg of “vitamin C
equivalent anti-oxidant capacity” (VCEAC) per gram of the
sample.
B) Ferric ion-reducing antioxidant power (FRAP) assay
The FRAP assay was performed according to the method of
Thaipong and others (2006) with minor modifications. The FRAP
reagent was prepared by mixing 300 mM acetate buffer (PH 3.6),
10 mM TPTZ and 20 mM ferric chloride in the 10:1:1 ratio. 150
μL of the sample or standard was added to 2 mL of de-ionized

117
water and 2850 μL of FRAP reagent. The samples and standards
were incubated for 30 mins at room temperature in the dark.
The absorbance of the colored product [ferrous
tripyridyltriazine complex] was measured at 593 nm using a
Varian Cary® 50 UV-VIS spectrophotometer (Agilent Technologies
Inc., Santa Clara, CA). The standard curve was developed using
gallic acid as a standard and found to be linear between
0.0025-0.045 mg/mL (y=12.198 x + 0.0378, R2= 0.99582). Results
were expressed in mg GAE/g of the sample.
5.2.8 Colorimetric determination of total limonoid glucoside
and limonoid aglycones
The total limonoid glucoside content was determined according
to the method of Breksa and Ibarra (2007) with slight
modifications. The colorimetric quantification was based on
the formation of red to orange colored derivatives resulting
from the treatment of the standard, limonin glucoside, or the
neem extract with 4- dimethylamino benzaldehyde (DMAB) in the
presence of perchloric and acetic acids.
5 mL of neem tea (control) or SPE-treated or AMB-treated tea
was passed through a C18 SPE column. The limonoids trapped in
the column were eluted with 3 mL of methanol and evaporated
under a steady flow of nitrogen gas. The sample was
reconstituted in 3 mL of 30% acetonitrile.
The total limonoid aglycone was also determined by the method
of Breksa and Ibarra (Breksa and Ibarra 2007). The aglycones
were extracted by chloroform. Neem tea was mixed with
118
chloroform in a 1:1 ratio and vortexed. Once the phases
separated, the upper phase was discarded and the lower phase
(chloroform) was collected and evaporated to dryness under a
steady flow of nitrogen gas. The sample was re-constituted in
2.5 mL acetonitrile and the colorimetric assay was performed
exactly according to the procedure of limonin glucoside
determination. The standard curve developed with the limonin
aglycone as the standard (0-20 μg/mL).
Briefly, 2.1 mL of limonin glucoside standard or neem/ SPE/
AMB treated samples was mixed with 1.65 mL of DMAB indicator.
To this, 1.65 mL of stock acid solution is added. The test
tubes were incubated for 30 minutes at room temperature and
the color developed was measured at 503 nm. Total limonoid
glucoside in the sample was determined in terms of limonin
glucoside equivalents. This was done using a calibration
curve generated from limonin glucoside made up in 30%
acetonitrile (0- 100 μg/mL).
5.2.9 HPLC Analysis for the estimation of flavonols
HPLC analysis was carried out on an Agilent 1100 series liquid
chromatographic system with a diode-array detector set at 370
nm. A Kinetex 250 X 4.6 mm, 5 μ C 18, 100 Å (Phenomenex Inc.,
Torrance, CA, USA) column was used for the separation of the
flavonol aglycones. A gradient elution system comprising of
two mobile phases, namely mobile phase A, 0.1 %
trifluoroacetic acid in water and mobile phase B, 0.1%
trifluoroacetic acid in acetonitrile, was used. The gradient

119
used was 80% A and 20% B at 0 min which was gradually reduced
to 60% A at 20 mins and held for another 5 mins. A 5 min post
time was added for the mobile phase concentrations to come
back to initial levels. The flow rate was 1 mL/min and the
column temperature was set at 40 °C. The identification of
each compound was done by matching retention times with
standards and quantification was based on the external
standard curve method.
5.2.10 Analysis of volatiles by headspace-solid phase
microextraction (HS-SPME)
A DVB/CAR/PDMS (Divinylbenzene/Carboxen/Polydimethylsiloxane)
fiber with a 50/30 μm coating thickness (Supelco Inc.,
Bellefonte, PA) was used for this investigation. For SPME
analysis, 5 mL of the tea/de-bittered tea sample was placed in
a 10-mL vial, which was capped with a PTFE/Silicone septum
(Supelco Inc., Bellefonte, PA). 500 mg of sodium chloride was
added and the sample was magnetically stirred to aid the
volatilization process (Reto and others 2007). After
equilibration at 70 °C for 3 hours, the fiber was exposed to
the headspace to absorb/adsorb the volatiles for 1 hour.
Subsequently, the fiber was desorbed in the GC injection port
for 5 mins before its next use.
5.2.11 GC-MS Analysis
A Varian GC 3400CX (Varian, Walnut Creek, CA, USA) equipped
with a 1078 programmable injector connected to a Varian Saturn
2000 Mass spectrometer with an ion trap detector was used for

120
GC-MS analysis. Volatiles were separated by using a DB-5MS (J
& W Scientific, Folsom, CA, USA) UI, 30 m * 0.25 mm with 0.25
μm film thickness fused silica capillary column. Helium
carrier gas flow rate was set at 1mL/min and injector,
transfer line and ion trap temperatures were 250°, 250°, 150
°C, respectively. Desorption was done in the splitless mode
and the post desorption split flow was 100 mL/min. The column
temperature program used was: 35 °C held for 5 min followed by
a linear temperature program from 35 to 250 °C at 3°C/min.
Identification of chemical compounds was established using
mass spectra comparison with the NIST 1992 and Wiley 5
libraries, retention indices of standards, and literature
values.
5.2.12 Color Properties
The color properties of neem tea, SPE-treated and Amberlite-
treated tea, namely L*, 𝒶*, b * were measured by Minolta
colorimeter CR-410 (Konica Minolta Sensing Inc., Osaka, Japan)
(Sigge and others 2001). Chroma and hue angle were calculated
by the following formulae-
𝐶ℎ𝑟𝑜𝑚𝑎 (𝑐𝑎𝑏∗ ) = 𝑎∗2 + 𝑏∗2
𝐻𝑢𝑒 𝑎𝑛𝑔𝑙𝑒 (ℎ𝑎𝑏) = 𝑡𝑎𝑛−1𝑏∗
𝑎∗
The color difference between samples (ΔE*ab) is calculated from
L*, a*, b* by the formula-
∆𝐸𝑎𝑏∗ =(ΔL*)2 + (Δ𝒶*)2+ (Δb*)2

121
where ΔL, Δ𝒶*, Δb* are differences between neem tea and the de-
bittered neem teas (SPE and Amberlite treated).
5.2.13 Statistical Analysis
Three different batches of Neem tea-cut leaves were purchased.
One sample from each batch was analyzed in duplicate to give
triplicate analysis with two subsamples. Calculations of mean,
standard deviation, analysis of variance (ANOVA) with Tukey’s
post hoc test to determine significant differences, were
performed in Minitab 16 statistical software (Minitab Inc.,
PA, USA). While comparing means using ANOVA, a randomized
block design was used where the batch of the sample was
blocked.
Principal Component Analysis (PCA) was performed in Minitab
16, on neem tea and the two de-bittered samples to visualize
their clustering tendency based on their volatile profile and
identify volatiles (variables) influencing their variability.
The data matrix consisted of 47 variables x 9 samples= 423
data points. Eigenvalues were calculated using a co-relation
matrix among 47 volatile compounds as input, and the score and
loading plots were generated using sample type and volatile
constituents, respectively.
5.3 Results and Discussion
5.3.1 Effect of DP on flavonols, total polyphenols and
limonoids
Figs. 1-3 show us the mean levels of flavonol (quercetin),
total polyphenols and limonoids, respectively. In addition to

122
quercetin, two other flavonols, tentatively identified as
myricetin and kaempferol, were extracted. However, myricetin
and kaempferol were extracted in amounts that were below the
quantitation limit of the method. The SPE DP completely
eliminates quercetin while Amberlite XAD-16 treated tea
retained quercetin to such a degree that there were no
significant differences to the control neem tea (Fig 1). The
reduction in flavonoids was also observed in previous
literature (Ribeiro and others 2002; Lee and Kim 2003), where
flavonoids where adsorbed effectively by polyadsorbent resins.
The ability of Amberlite XAD-16 to retain quercetin might be
important aspect of maintaining neem’s functionality.
Fig. 1. Effect of DP on quercetin in neem tea (n= 3 SD)
Means that do not share the same letter are significantly different (p < 0.05)
0.00
0.50
1.00
1.50
2.00
2.50
3.00
3.50
4.00
Neem tea SPE AMB
Qu
erc
etin
(m
g/g
)
a
a

123
Fig. 2. Effect of DP on the total phenolic content in neem tea
(n=3 SD)
Means that do not share the same letter are significantly different (p < 0.05)
The SPE DP reduced the total polyphenols by 91.17% while this
decrease was much lesser due to the AMB DP at 19.01%. The DP
caused a significant reduction (p<0.05) in both limonoid
aglycones and limonoid glucosides content. The amount of total
limonoid aglycones and limonoid glucoside was found to be 0.54
mg/g LE and 1.75 mg/g LGE (Fig. 3). These values are much
higher than in Washington Navel oranges and Rio star
grapefruit where LE were found to be 0.002 ± 0.00 and 0.01 ±
0.00 mg/g , and the limonoid glucoside content was found to be
0.14 ± 0.00 and 0.21± 0.01 mg/g LGE, respectively (Breksa and
Ibarra 2007).
0.00
2.00
4.00
6.00
8.00
10.00
12.00
14.00
Neem tea SPE AMB
Tota
l po
lyp
hen
ols
(m
g/G
AE)
a
bc

124
Fig.3. Effect of de-bittering procedure on the limonoid content
of neem tea (n= 3 SD)
Means that do not share the same letter are significantly different (p < 0.05)
Both the SPE and Amberlite treatment resulted in a decrease of
limonoid aglycone, which is in agreement with the results of
Shaw and Buslig (Shaw and Buslig 1986); Johnson and Chandler
(Johnson and Chandler 1982) and Wilson et al. (Wilson III and
others 1989) who used XAD-4, XAD-7 and XAD- 16 for achieving
de-bittering, respectively. The loss of limonoid glucoside was
67% and 79% for SPE and Amberlite XAD-16 treated neem tea,
respectively, while the treatments reduced the limonoid
aglycones equally by 62%. This loss may have a negative impact
on the health benefits of de-bittered neem tea (Miller and
others 1989).
5.3.2 Effect of DP on anti-oxidant activity of neem tea
We observe a significant decrease (p<0.05) in DPPH activity and
FRAP assay in the two de-bittered teas (Fig. 4). This is
commensurate with the significant (p<0.05) reduction in
polyphenols and the limonoids. Although limonoids, as
0.00
500.00
1000.00
1500.00
2000.00
2500.00
Neem tea SPE AMB
Lim
on
in e
qu
ival
ent
(μg/g)
bb
a
0.00
500.00
1000.00
1500.00
2000.00
2500.00
Neem tea SPE AMBLi
mo
nin
glu
cosi
de
equ
ival
ent
(μg/
g)
bb
a

125
determined by DPPH activity, are weaker anti-oxidants compared
to flavonoids due to fewer number of hydroxyl groups (Yu and
others 2005), its high concentration in neem (Champagne and
others 1992) makes these compounds a potent contributor towards
the overall anti-oxidant capacity. Thus, the removal of
limonoids might have a more pronounced effect on the DPPH anti-
oxidant capacity than in the FRAP assay.
5.3.3 Effect of DP on color properties
The de-bittering procedures affected the color properties of
neem tea. The values of L*, a* and b* of neem and the two de-
bittered teas are presented in Table 1. The lightness of the
sample is not affect by the treatment.
Fig. 4. Effect of de-bittering procedure on
A) FRAP
Means that do not share the same letter are significantly different (p < 0.05) (n=3 S.D.)
0
5
10
15
20
25
Neem tea SPE AMB
Vit
amin
C E
qu
ival
ent
An
ti-o
xid
ant
C
apac
ity
(mg/
g)
a
b
c
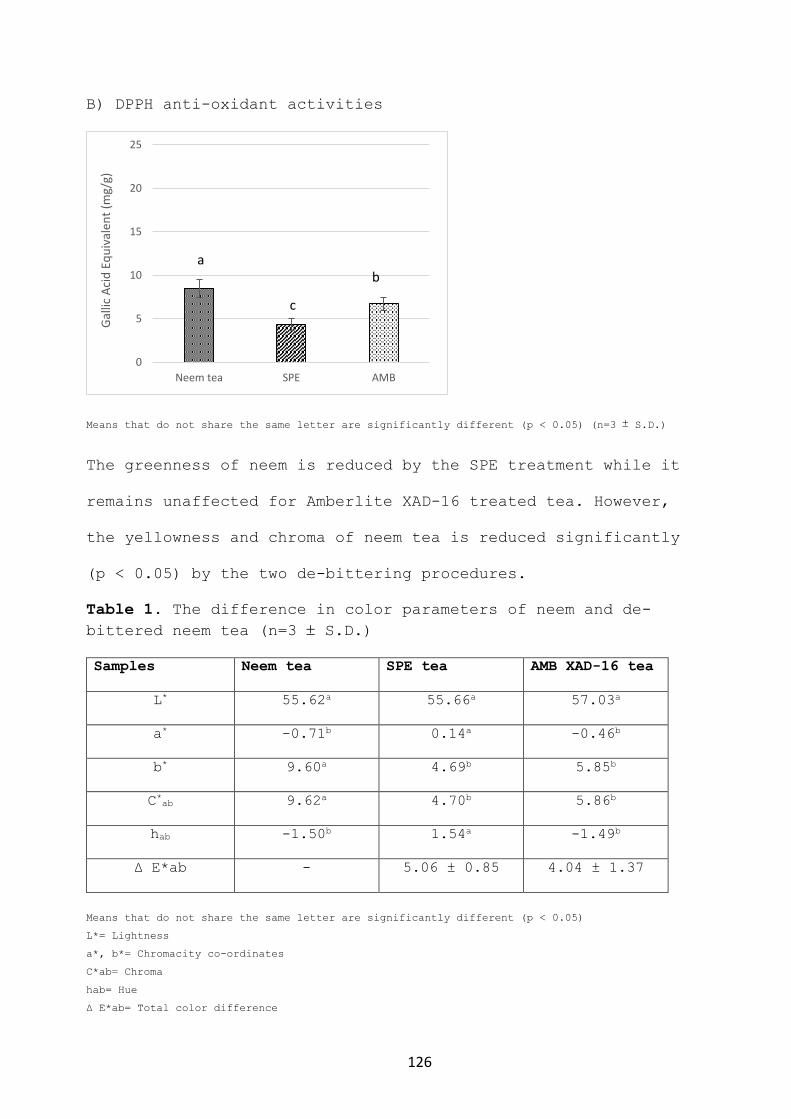
126
B) DPPH anti-oxidant activities
Means that do not share the same letter are significantly different (p < 0.05) (n=3 S.D.)
The greenness of neem is reduced by the SPE treatment while it
remains unaffected for Amberlite XAD-16 treated tea. However,
the yellowness and chroma of neem tea is reduced significantly
(p < 0.05) by the two de-bittering procedures.
Table 1. The difference in color parameters of neem and de-
bittered neem tea (n=3 S.D.)
Samples Neem tea SPE tea AMB XAD-16 tea
L* 55.62a 55.66a 57.03a
a* -0.71b 0.14a -0.46b
b* 9.60a 4.69b 5.85b
C*ab 9.62a 4.70b 5.86b
hab -1.50b 1.54a -1.49b
Δ E*ab - 5.06 ± 0.85 4.04 ± 1.37
Means that do not share the same letter are significantly different (p < 0.05)
L*= Lightness
a*, b*= Chromacity co-ordinates
C*ab= Chroma
hab= Hue
Δ E*ab= Total color difference
0
5
10
15
20
25
Neem tea SPE AMB
Gal
lic A
cid
Eq
uiv
alen
t (m
g/g)
a
c
b

127
The hue angle remains unaffected. The total color difference (Δ
E*ab) between neem tea and SPE treated tea was 5.06 ± 0.85
CIELAB units while that between neem tea and Amberlite XAD-16
treated tea was 4.04 ± 1.37 CIELAB units. The mean value of Δ
E*ab was greater than the visual discrimination threshold (Δ E*ab
> 3) indicating that the color changes are visually appreciable
(Melgosa and others 2001). The color changes in the de-bittered
samples can be explained by the decrease in the flavonol and
the total polyphenolic content, which are known to contribute
to color (Bao and others 2005).
5.3.4 Effect of DP on the volatile profile of neem tea
Both the SPE and Amberlite XAD-16 treated led to the loss of
major sesquiterpenes such as dihydroactinidiolide, spathulenol
and caryophyllene oxide in neem tea (Table 2). These compounds
are often found in essential oils possessing anti-inflammatory,
anti-bacterial and anti-oxidant properties (Shimizu and others
1990); (Goff and Klee 2006; Wu and others 2014). Thus, their
loss could affect the bioactive potential of neem tea.
Surprisingly, we observed the generation of some volatile
compounds because of the treatment such as the generation of 2-
heptanone, 2-ethyl hexanol in the SPE and AMB XAD-16 treated
teas. The compounds 4- ethoxy benzoic acid and 3,5 ditert-
butyl-4-hydroxy benzaldehyde were exclusively found in SPE and
AMB tea, respectively. The PCA score plot (Fig. 5) is able to
separate neem tea from the treated samples.

128
Fig.5. Principal Component Analysis (PCA)- Score Plot. This
shows the clustering tendency of neem tea (control) and the two
de-bittered (treated) samples. Since they lie in different
quadrants, it can be established that the de-bittering
procedures impact the volatile profile (n=3)
The three samples are distinguished easily since they are
clustered in three separate quadrants. The neem tea is
separated from SPE tea on the first principal component (F1)
while it separates from AMB tea on both the first and second
principal component (F2). The loading plot (Fig. 6) reveals
that neem tea is separated from the two de-bittered teas by
sesquiterpenes, ketones and acids while the volatiles such as
heptanal, benzeneacetaldehyde, 2 ethyl hexanol, dl –limonene
load strongly on to F2 and distinguish SPE tea from AMB XAD-16
treated tea.
Neem teaNeem teaNeem tea
SPE tea
SPE tea
SPE tea
AMB teaAMB tea
AMB tea
-5
-4
-3
-2
-1
0
1
2
3
4
5
-6 -5 -4 -3 -2 -1 0 1 2 3 4 5 6 7 8 9
F2 (
15
.65
%)
F1 (53.52 %)

129
Fig.6. Loading plot of the variables reveals the specific
volatiles (variables) that help discriminate between neem tea
(control) and the two de-bittered samples (treatments) (n=3)
1 methyl 1 H pyrrole
hexanal
2 heptanone
heptanal
methoxy benzene
benzaldehyde
sulcatone
octanal
dl limonene
2 ethyl hexanol
benzeneacetaldehyde
p cymenene
2 nonanone
linalool
benzoic acid ethyl ester
methyl salicylate
safranalbeta cyclocitraleugenol
propanoic acid,2 methyl, 3 hydroxy 2,4,4
trimethylpentyl ester
alpha ionone
geranyl acetone
2,4 di tert butyl phenol
p benzoquinone
4 ethoxy benzoic acid ethyl ester
3,5 di-tert-butyl-4-hydroxybenzaldehyde
beta iononebeta ionone epoxideunknown STunknown ST
hexahydro-8a-methyl-,1,8 (2H,5H)-NaphthalenedioneDihydroactinolidespathulenolcaryophyllene oxideunknown STunknown STunknown STbeta selineneunknown STunknown ST oxideJuniper camphorunknown ST
3-isopropyl-6,7-dimethyltricyclo[4.4.0.0(2,8
)]decane-9,10-diolEudesma-4,11-dien-2-ol
7R,8R-8-Hydroxy-4-isopropylidene-7-
methylbicyclo[5.3.1]undec-1-ene
3,5 di-tert-butyl-4-hydroxybenzaldehyde
Farnesyl acetaldehyde
-1
-0.75
-0.5
-0.25
0
0.25
0.5
0.75
1
-1 -0.75 -0.5 -0.25 0 0.25 0.5 0.75 1
F2 (
15
.65
%)
F1 (53.52 %)
Variables (axes F1 and F2: 69.17 %)

Table 1. Volatile compounds in NT and the two de-bittered samples identified on a DB-5 MS column
Compounds Neem tea SPE AMB
1-methyl 1 H pyrrole + + +
Hexanal + + +
1,1,3 trimethyl cyclopentane + - -
2-heptanone - + +
Heptanal + + -
Methoxy benzene + + +
Benzaldehyde + + +
Sulcatone + + +
Octanal + + +
dl-limonene + + +
2-ethyl hexanol - + +
Benzeneacetaldehyde + + +
Linalool + + +
Methyl salicylate + + +
Safranal + - -
13
0

Compounds Neem tea SPE AMB
Eugenol + - -
Propanoic acid,2 methyl, 3 hydroxy 2,4,4 trimethylpentyl ester + - +
Alpha ionone + - -
Geranyl acetone + + +
p-benzoquinone + + +
Beta ionone + - -
Beta ionone epoxide + - -
4-ethoxy benzoic acid ethyl ester - + -
Unknown ST + - -
Unknown ST + - -
Hexahydro-8a-methyl-,1,8 (2H,5H)-Naphthalenedione + - -
Dihydroactinolide + - -
Spathulenol + - -
Caryophyllene oxide + - -
Unknown ST + - -
Unknown ST + - -
13
1

Compounds Neem tea SPE AMB
Beta selinene + - -
Unknown ST + - -
Unknown ST oxide + - -
Juniper camphor /globulol + - -
9.beta.-Acetoxy-3.beta.-hydroxy-3,5.alpha.,8-trimethyltricyclo[6.3.1.0]
dodec-8-ene
+ - -
3-isopropyl-6,7-dimethyltricyclo[4.4.0.0(2,8)]decane-9,10-diol + - -
Eudesma-4,11-dien-2-ol + - -
3,5 ditert-butyl-4-hydroxy benzaldehyde +
7R,8R-8-hydroxy-4-isopropylidene-7-methylbicyclo[5.3.1]undec-1-ene + - -
Farnesyl acetaldehyde + + +
Di-tert-butyl-1-oxaspiro[4.5]deca-6,9-diene-2,8-dione + + +
13
2

133
6.4 Conclusions
Both treatments, SPE and XAD-16 resin, were able to reduce the
bitterness in neem tea as demonstrated by the reduction of
total limonoid aglycones. However, the Amberlite XAD-16 resin
treatment was more effective in preserving the loss in bio-
active compounds and anti-oxidant capacity than the SPE
treatment. The encouraging results obtained should lead to
further research with other styrene/divinylbenzene polymer
resins such as Amberlite XAD-2, XAD-4, XAD-7 HP, XAD-16HP and
Dowex-L285 to see if they are able to preserve the bio-active
polyphenols and anti-oxidant adequately while removing the
bitterness completely.
134
Chapter 6
Effect of tea matrix and type of milk on
the recovery of flavonols, total phenolic
content and anti-oxidant activity with an
application towards Ready-to-Drink
beverages (RTD’S)
6.1 Introduction
Tea is a traditional beverage that may provide numerous
health benefits due to its high concentrations of
antioxidants in the form of polyphenols (Chen and others
2015; Miura and others 2015). In many societies, teas are
traditionally consumed with milk, and more recently
ready-to-drink (RTD) beverages, including teas, have
become popular.
An RTD is any packaged beverage that is sold in a prepared
form, ready for consumption. The Ready-to-Drink (RTD) product
segment has seen significant growth over the last few years
with new entrants and innovation, mainly due to a new wave of
consumers seeking convenient alternatives that fit their
active lifestyles. Many tea-based RTD’s are sold in the
market with added dairy components.
Due to the boom in this specific beverage market segment,
research of milk protein-polyphenol interaction has assumed
great significance. Both covalent and non-covalent bonding

135
has been suggested as possible mechanisms of bonding between
polyphenols and proteins. It was suggested that hydrophobic
forces initiate interactions, which are consequently
stabilized by hydrogen bonding (Prigent and others 2003).
Further evidence of hydrophobic interactions in protein-
polyphenol interactions was provided through fluorometry and
isothermal calorimetric analysis (Yuksel and others 2010).
Determining the nature and quantum of binding in-vitro can be
helpful for understanding the dissociation and availability
of the protein-flavonoid complex and subsequent absorption of
flavonoids in-vivo. So far, there have been a multitude of
studies on flavan-3-ols (catechin and its derivatives) and
milk protein interactions and their effect on anti-oxidant
capacity. But these studies have revealed contradictory
results. Three types of results have been observed. Firstly,
some authors (Kyle and others 2007; Richelle and others 2001;
Leenen and others 2000) observed no effect of milk or milk
proteins on the anti-oxidant potential of the teas. Other
authors (Stojadinovic and others 2013; Xiao and others 2011;
Sharma and others 2008; Arts and others 2002; Serafini and
others 1996) observed a binding effect of milk with
flavonoids that led to a reduction in anti-oxidant activity
of the tea-milk mixture. Thirdly, it was also observed that
while the addition of milk to green, Darjeeling and English
breakfast teas lead to a decrease in the anti-oxidant
activity (ABTS+ free radical scavenging), it had an enhanced

136
chain breaking anti-oxidant effect (lipid peroxidation
method) (Dubeau and others 2010).
While most of the research has focused on the binding and
recovery of flavan-3-ols post milk addition, our study
determined the effect of milk addition on flavonols.
Flavonols are an important group of compounds whose
health effects have been well documented. They have been
shown to have a protective effect on DNA damage in human
lymphocytes (Duthie and others 1997), reduce the risk of
oxidative metabolism in neurons (Oyama and others 1994),
lower plasma glucose (Liu and others 2005; Park 1999),
reduce the risk of coronary heart disease (Huxley and
Neil 2003), in addition to numerous other beneficial
effects (Guardia and others 2001; Pavanato and others
2003; Noroozi and others 1998).
We used three different teas or infusions, specifically
one medicinal infusion (Neem) and two conventional teas
(green and black) in our study. Neem (Azadirachta indica
A. Juss) is an evergreen tree belonging to the Meliaceae
family, cultivated in various parts of the Indian sub-
continent (Biswas and others 2002). It has been in use in
Indian folk medicine for centuries because of its
therapeutic value (Mishra and others 1995; Kaushik and
others 2012). Recently, our lab has shown that it is a
rich source of flavonols with levels even higher than
those in green and black tea [unpublished]. Given its

137
myriad of purported health benefits, and a general
consumer trend towards functional foods and
nutraceuticals, Neem leaf powder is being marketed and
consumed as tea.
Our aims in this study were two-fold. Firstly, we observed if
there was a difference in the in-vitro anti-oxidant activity
due to a decrease in polyphenols and other bioactives, when
bovine milk is added to different tea matrices, i.e. neem,
green and black tea. Secondly, plant based milks such as
almond, coconut, soya and rice milk have great potential for
application in Ready to Drink health beverages (RTD’s), given
their lactose free nature. Being sourced from plants, they
are a popular option among vegans. Keeping in mind this trend
of increased consumption of these alternative, non-dairy
sources of milk, we investigated the differences in effect of
adding bovine, soya and almond milk on in-vitro phenolic
content and anti-oxidant activity.
6.2 Materials and methods
6.2.1 Samples
Three different lots of Neem (Azadirachta indica) leaf
powder were purchased from Neem Tree Farms Inc. (Brandon,
FL., USA), and three lots of Great Value Green tea and
Schnucks 100% Natural Orange Pekoe & Pekoe Cut Black tea
were purchased from local Walmart and Schnucks super
markets in Columbia, MO, respectively.

138
Skimmed milk (Prairie Farms Dairy Inc., Carlinville, IL)
and Silk (Light original) soymilk (White Wave Services
Inc., Broomfield, CO) were bought from the local Hyvee
store and unflavored (original) almond milk (So Delicious
Dairy Free, Springfield, OR) was bought from the local
Lucky’s supermarket. Three samples of commercial ready to
drink (RTD) green tea-bovine milk Taste Nirvana Real
Green Tea Latte (Nirvana Foods & Commerce International
Co., Ltd., Walnut, CA) were bought online.
6.2.2 Chemicals and standards
The flavonol standards myricetin, quercetin and
kaempferol were bought from Cayman Chemical Co. (Ann
Arbor, MI). HPLC grade acetonitrile and water were
purchased from Thermo Fisher Scientific Inc. (Waltham,
MA, USA) while ascorbic acid, trifluoroacetic acid and
DPPH (2,2-diphenyl-1-picrylhydrazyl) reagent was
purchased from Sigma Aldrich Co. (St. Louis, MO, USA).
6.2.3 Sample preparation
Teas were prepared by brewing 5 g of Neem leaf powder or
green tea or black tea in 100 mL of de-ionized water for 2
hours at 100 °C. Each solution was then vacuum-filtered
through a Fisher brand P8 filter paper. The filtered
solutions were then made up to a volume of 100 mL in a
volumetric flask using de-ionized water.
Fifteen (15) mL of milk, diluted 2:3 (v/v) with de-ionized
water and maintained at approximately 4ºC, was added to 10 mL

139
of tea (Neem, green or black tea) in plastic centrifuge tubes
at room temperature. The samples were centrifuged at 11,000 x
g for 30 mins and the supernatants were made up to 25 mL in
volumetric flasks using de-ionized water.
Parallel sets of tea-water preparations, as controls, were
made in an identical manner by diluting teas with de-ionized
water in order to assess the impact of milk on polyphenol and
flavonol recovery.
6.2.4 Preparation of flavonol standards and flavonol
extraction
Prior to extraction, tea–water controls and tea-milk
treatment solutions were subjected to alcoholic hydrolysis
(Wang and Helliwell 2001) to form the aglycones of the
flavonol glycosides. To eight (8) mL of hydrolyzed sample, 12
mL of absolute (100%) ethanol was added to set the ethanol
concentration at 60%. For hydrolysis, 5 mL of 6N
hydrochloric acid was added to this mixture. The samples were
then refluxed using a condenser in a water bath set at 95° C
for 2 hours. The hydrolyzed solution was cooled, filtered
using Fisherbrand P8 filter paper and made up to 25 mL in a
volumetric flask with 60% ethanol. After filtering again,
using a 0.22 μm filter, 30 μL was injected into the HPLC.
Flavonol standards myricetin, quercetin and kaempferol were
prepared by making stock solutions dissolved in dimethyl
sulfoxide (DMSO). Working standard curves ranging from 0-

140
0.008, 0-0.032 and 0-0.006 mg/mL were prepared for myricetin,
quercetin and kaempferol, respectively.
6.2.5 HPLC analysis
Analysis of flavonols was performed using an Agilent 1100
series HPLC system equipped with a diode-array detector set
at 370 nm. An Aqua 250 x 4.6 mm 5 μ C 18, 100 Å (Phenomenex
Inc., Torrance, CA) reverse-phase column was used for the
separation of the flavonol aglycones. A gradient elution
system comprising of two mobile phases, namely mobile phase
A, 0.1 % trifluoroacetic acid in water and mobile phase B,
0.1% trifluoroacetic acid in acetonitrile, was used. The
gradient used was 80% A and 20% B at 0 min which was
gradually reduced to 60% A over 27 minutes. A 3 min post time
was added for the mobile phase concentrations to come back to
initial levels. The flow rate was 1 mL/min and the column
temperature was set at 40 °C.
Identification of each compound was accomplished by comparing
its retention times with those of chemically pure standards
and quantification was based using external standard curves.
6.2.6 Total phenolic content by Folin-Ciocalteau assay
Total phenolic content was determined by the Folin–
Ciocalteu assay as performed by Thaipong and others
(2006). To 50 µL of sample, 250 µL of Folin’s reagent
(1:3 dilution) and 750 µL of 7.5% sodium carbonate along
with 3 mL of de-ionized water was added. The solution was
vortexed, incubated for 2 hours and absorbance was

141
measured at 725 nm using a Varian Cary® 50 UV-VIS
spectrophotometer (Agilent Technologies Inc., Santa
Clara, CA). Gallic acid was used to prepare a standard
curve with a concentration range of 0.1-0.7 mg/mL and the
results were expressed in gallic acid equivalents (GAE).
6.2.7 DPPH Anti-oxidant activity
The method of Thaipong and others (2006) was followed
with slight modifications. The stock solution was
prepared by dissolving 24 mg DPPH in100mL of methanol,
and it was then stored at -20 °C until used. The working
solution was obtained by mixing 20 mL of stock solution
with 80 mL methanol.
To 2 ml of de-ionized water, 200 μL of sample was added
and was allowed to react with 2800 μL of the DPPH
solution. The extent of de-colorization was measured at
515 nm after 90 minutes, using a Varian Cary® 50 UV-VIS
spectrophotometer. The blank was prepared by using de-
ionized water. Percentage (%) DPPH anti-oxidant activity
was calculated as follows-
% DPPH activity= (Absorbance of control- Absorbance of
sample)/ (Absorbance of control) * 100 (Yen and Duh 1994)
The percentage (%) anti-oxidant values were converted to
vitamin C equivalents (VCEAC) by using a standard curve
of ascorbic acid that was found to be linear between
0.0176-0.1408 mg/mL.
6.2.8 Statistical analysis

142
Three different batches of Neem leaf powder, green and
black tea were brewed and each batch was subjected to
duplicate analysis.
In order to determine the in-vitro effect of tea matrix
and milk type on in-vitro flavonol concentration, total
polyphenolic content and % DPPH anti-oxidant activity, an
Analysis of Variance (ANOVA) was conducted according to
the procedure of General Linear Model using Minitab 17
statistical software (Minitab Inc., Philadelphia, PA,
USA). Tukey’s post hoc test was used to determine the
significant differences of the mean values among
treatments (P < 0.05).
6.2.9 Analysis of commercial sample
Twenty-five (25) mL of Taste Nirvana green tea latte was
pipetted into a centrifuge tube and subjected to
centrifugation for 30 mins at 11,000 x g. Afterwards, the
supernatant was made up to volume with de-ionized water in a
25 mL volumetric flask. Eight (8) mL of the sample was
hydrolyzed using the exact same procedure as the tea-milk
mixtures and control samples.
The pellet was dried in a vacuum oven at 80°C. The dried
pellet was transferred onto a round bottom flask and was
subjected to alcoholic hydrolysis by adding 20 mL of 60%
ethanol and 5 mL of 6N hydrochloric acid.
Both the hydrolyzed solutions of the supernatant and the
pellet were made upto volume in a 25 Ml volumetric flask

143
and 30 µL was injected for HPLC analysis.
6.3 Results and Discussions
6.3.1 Effect of tea matrix on in-vitro flavonols, total
phenolic content and DPPH anti-oxidant activity
The three flavonols of interest, namely myricetin,
quercetin and kaempferol were easily separated on a C18
column by RP-HPLC (Figure 1). The amounts of each flavonol
for the three tea types are shown in Table 1.
Table 1. Amount of flavonols-myricetin, quercetin and
kaempferol in tea samples. Results are expressed in mg/gram
of sample (n=3 ± standard deviation)
Samples Myricetin Quercetin Kaempferol
Neem tea 0.83 ± 0.24 4.24 ± 0.52 0.69 ± 0.12
Green tea 0.69 ± 0.05 1.72 ± 0.05 0.66 ± 0.02
Black tea - 1.68 ± 0.18 0.71 ± 0.10
Although myricetin was detectable in black tea, levels were
below quantitation limits and hence, not considered for any
calculations.
We observed that the amount of tea flavonols recovered from
the supernatant was diminished by the addition of milk
significantly (p<0.05). The mean decrease in myricetin was
similar in green tea and neem tea, with values of 33.3 % and
30.3%, respectively (Figure 2A, 2B and 2C). A similar pattern
was seen with both quercetin and kaempferol levels, reducing
significantly (p<0.05) within each tea type. But since, this

144
decrease was significant (p<0.05) across all three types of
tea, we did not see a matrix effect on flavonol levels.
Our results were deduced from the absence of significant
interaction (p>0.05) between the factors- ‘tea’ and ‘sample
type’, for any of the three flavonols, indicating that the
reduction in individual flavonols-myricetin, quercetin and
kaempferol, is not significantly affected by the matrix they
are present in.
Figure 1. HPLC chromatograms of control (above) and
treatment (below) samples

145
Figure 2A. Comparative reduction in myricetin due to
bovine milk addition in different tea matrices (n=3 ±
S.D.)
Means that do not share a common letter are significantly different (p<0.05)
Figure 2B. Comparative reduction in quercetin due to bovine
milk addition in different tea matrices (n=3 ± S.D.)
Means that do not share a common letter are significantly different (p<0.05)
0
0.2
0.4
0.6
0.8
1
1.2
Green tea Neem tea
Fla
vo
no
l co
nte
nt
(mg
/g)
Tea-water control Tea-milk treatment
a
a
b
0
0.5
1
1.5
2
2.5
3
3.5
4
4.5
5
Green tea Neem tea Black tea
Fla
vo
no
l co
nte
nt
(mg
/g)
Tea-water control Tea-milk treatment
c
b
c
d
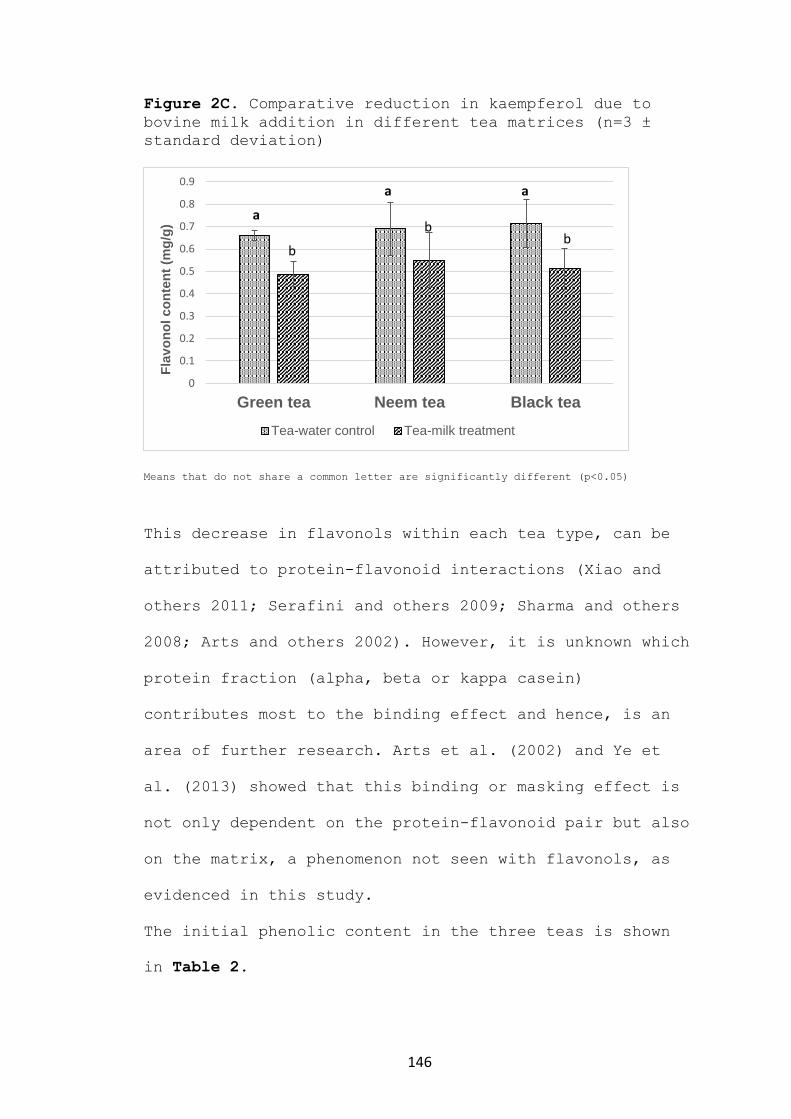
146
Figure 2C. Comparative reduction in kaempferol due to
bovine milk addition in different tea matrices (n=3 ±
standard deviation)
Means that do not share a common letter are significantly different (p<0.05)
This decrease in flavonols within each tea type, can be
attributed to protein-flavonoid interactions (Xiao and
others 2011; Serafini and others 2009; Sharma and others
2008; Arts and others 2002). However, it is unknown which
protein fraction (alpha, beta or kappa casein)
contributes most to the binding effect and hence, is an
area of further research. Arts et al. (2002) and Ye et
al. (2013) showed that this binding or masking effect is
not only dependent on the protein-flavonoid pair but also
on the matrix, a phenomenon not seen with flavonols, as
evidenced in this study.
The initial phenolic content in the three teas is shown
in Table 2.
0
0.1
0.2
0.3
0.4
0.5
0.6
0.7
0.8
0.9
Green tea Neem tea Black tea
Fla
vo
no
l co
nte
nt
(mg
/g)
Tea-water control Tea-milk treatment
a
b
a
b
a
b

147
Table 2. The total phenolic content of various tea
samples as determined by the Folin’s assay. The results
are expressed in mg GAE/gram of the sample (n=3 ±
standard deviation)
Samples Total phenolic content
Neem tea 28.73 ± 0.81
Green tea 114.48 ± 2.27
Black tea 56.30 ± 6.59
The total phenolic content showed significant (p<0.05)
reduction in the supernatant of the green and black tea-
milk mixtures of 26.2 and 29.4 %, respectively. However,
we did not see any such decrease in neem tea, indicating
a matrix effect (Fig.3). According to a study by Ye and
others (2013), the binding affinities of tea catechins
with milk protein fractions are affected by the
coexisting phenolics in the compound system. This
explains the matrix effect with regards to the total
phenolic content but fails do so in the case of
individuals flavonols. One of the major bio-active
compounds in neem are a group of triterpenoids called
limonoids(Parida and others 2002).

148
Fig.3. Reduction in total phenolic content on addition of
bovine milk to different tea matrices (n=3 ± standard
deviation)
Means that do not share a common letter are significantly different (p < 0.05)
The pattern of decrease in DPPH anti-oxidant activity
in the three teas is commensurate with the reduction in
phenolics, as total phenolic content and anti-oxidant
activity are highly co-related (Zhao and others 2014; Bhoyar
and others 2011). The DPPH anti-oxidant activity
of neem, green and black tea samples are provided in
Table 3. The DPPH activity decreased significantly in
both green and black tea by 22.4 and 23.3 %, respectively
(Fig.4). But, this reduction (16.5%) was not found to
be significant in neem tea. This observation may be due
to the lack of binding of milk proteins with limonoids, a
group of triterpenoids present in high quantities in neem
(Parida and others 2002). Although limonoids are weaker
0
20
40
60
80
100
120
140
Green tea Neem tea Black tea
mg
/g G
allic
acid
eq
uiv
ale
nt
Tea-water control Tea-milk treatment
a
b
c
de e

149
anti-oxidants compared to flavonoids due to fewer
number of hydroxyl groups (Yu and others 2005),
its high concentration in neem (Champagne and others 1992)
makes these compounds a potent contributor towards the
overall anti-oxidant capacity. The minimal loss of
phenolics and hence, anti-oxidant activity in neem tea
is perhaps due to the low levels of phenolics in neem
that leads to a low phenolic/protein ratio. The low
phenolic/protein ratio, as suggested by Prigent and others
(2003), affects the protein-phenolic interaction .
Table 3. The DPPH anti-oxidant activity of various tea
samples. The results are expressed in mg of vitamin C
equivalent/ gram of sample (n=3 ± standard deviation)
Samples Anti-oxidant activity
Neem tea 17.90 ± 0.47
Green tea 165.40 ± 2.24
Black tea 63.90 ± 4.83
Our results also indicate no quantitative difference in the
decrease of phenolic content and DPPH values in the
supernatant of green and black tea. This is in contradiction
to the results of Dubeau and others (2010) in which the
authors suggest that larger polyphenols such as thearubigins
and theaflavins in black tea, have a greater binding affinity
for milk proteins as compared to smaller polyphenols.
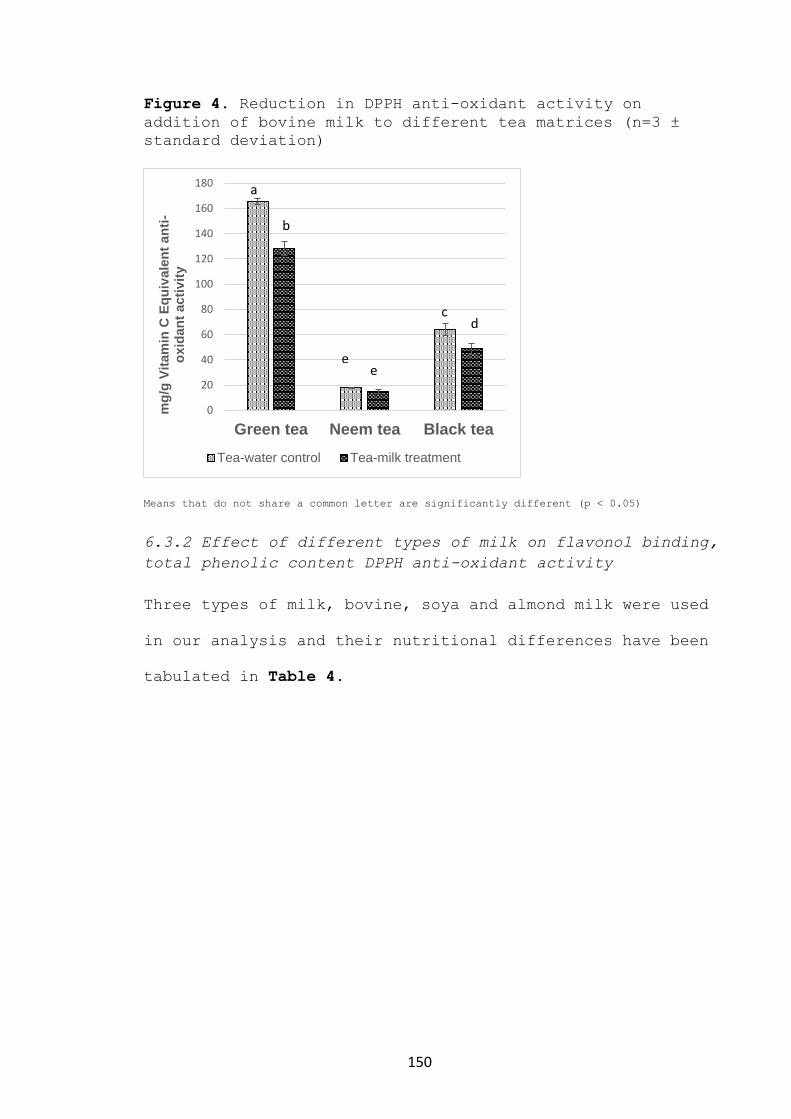
150
Figure 4. Reduction in DPPH anti-oxidant activity on
addition of bovine milk to different tea matrices (n=3 ±
standard deviation)
Means that do not share a common letter are significantly different (p < 0.05)
6.3.2 Effect of different types of milk on flavonol binding,
total phenolic content DPPH anti-oxidant activity
Three types of milk, bovine, soya and almond milk were used
in our analysis and their nutritional differences have been
tabulated in Table 4.
0
20
40
60
80
100
120
140
160
180
Green tea Neem tea Black tea
mg
/g V
itam
in C
Eq
uiv
ale
nt
an
ti-
oxid
an
t acti
vit
y
Tea-water control Tea-milk treatment
a
b
cd
ee

151
Table 4. Nutritional differences between skimmed milk,
soya milk and almond milk. All amounts are per serving
(240 mL)
Nutrient Skimmed
milk
Soya milk Almond
milk
Total fat
a) Saturated fat
b) Polyunsaturated
fat
c)Monounsaturated
fat
0 g
0 g
-
-
1.5 g
0 g
1 g
0.5 g
2 g
0 g
-
-
Cholesterol 5 mg 0 mg 0 mg
Sodium 120 mg 135 mg 95 mg
Potassium - 340 mg 35 mg
Total carbohydrates
a) Dietary fiber
b) Sugars
11 g
0 g
11 g
5 g
1 g
3 g
8 g
0 g
8 g
Protein 8 g 6 g 5 g
We observe that myricetin, quercetin and kaempferol reduce
significantly (p<0.05) in bovine and almond milk but
not in soya milk (Fig. 5A, 5B and 5C). Hence, in the
two-way ANOVA analysis, the two factors- ‘milk type’ and
‘sample type’ show significant interaction (p < 0.05) for
quercetin and kaempferol but not for myricetin (p >0.05 or
p=0.087). This indicates that the type of milk added
affects the decrease of quercetin and kaempferol in the
tea-milk supernatant.
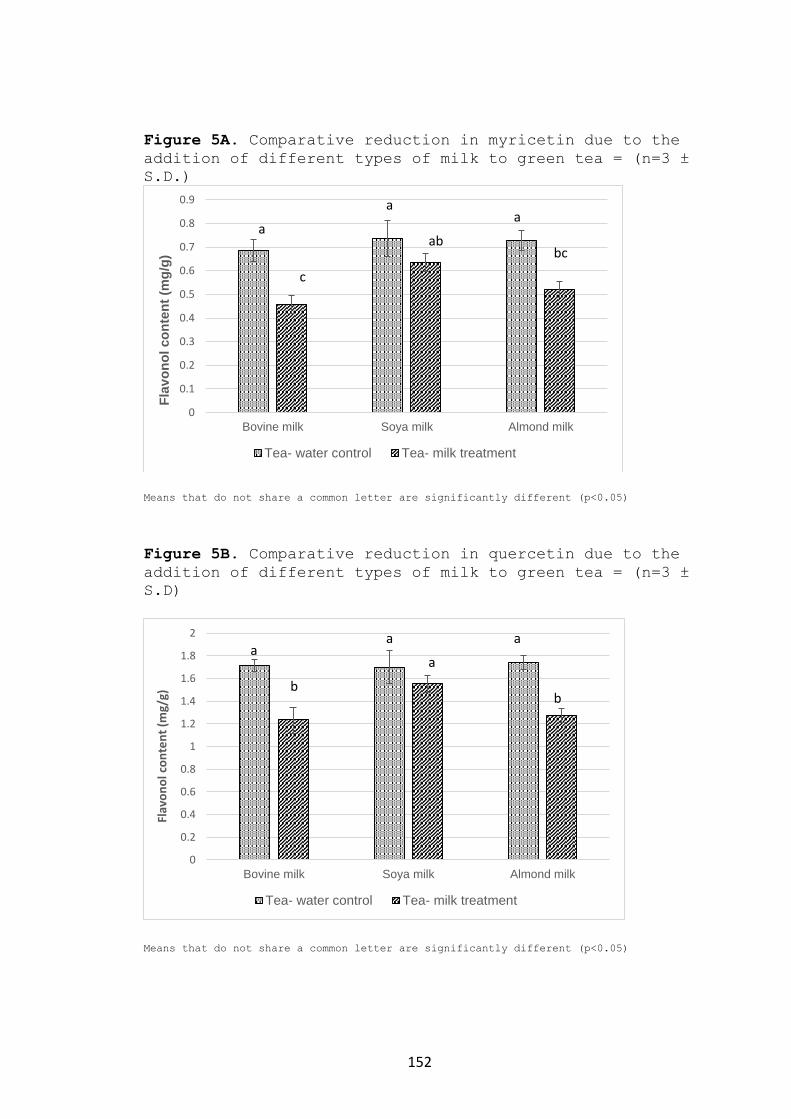
152
Figure 5A. Comparative reduction in myricetin due to the
addition of different types of milk to green tea = (n=3 ±
S.D.)
Means that do not share a common letter are significantly different (p<0.05)
Figure 5B. Comparative reduction in quercetin due to the
addition of different types of milk to green tea = (n=3 ±
S.D)
Means that do not share a common letter are significantly different (p<0.05)
0
0.1
0.2
0.3
0.4
0.5
0.6
0.7
0.8
0.9
Bovine milk Soya milk Almond milk
Fla
vo
no
l co
nte
nt
(mg
/g)
Tea- water control Tea- milk treatment
a
aa
c
abbc
0
0.2
0.4
0.6
0.8
1
1.2
1.4
1.6
1.8
2
Bovine milk Soya milk Almond milk
Flav
on
ol c
on
ten
t (m
g/g)
Tea- water control Tea- milk treatment
aa a
a
bb
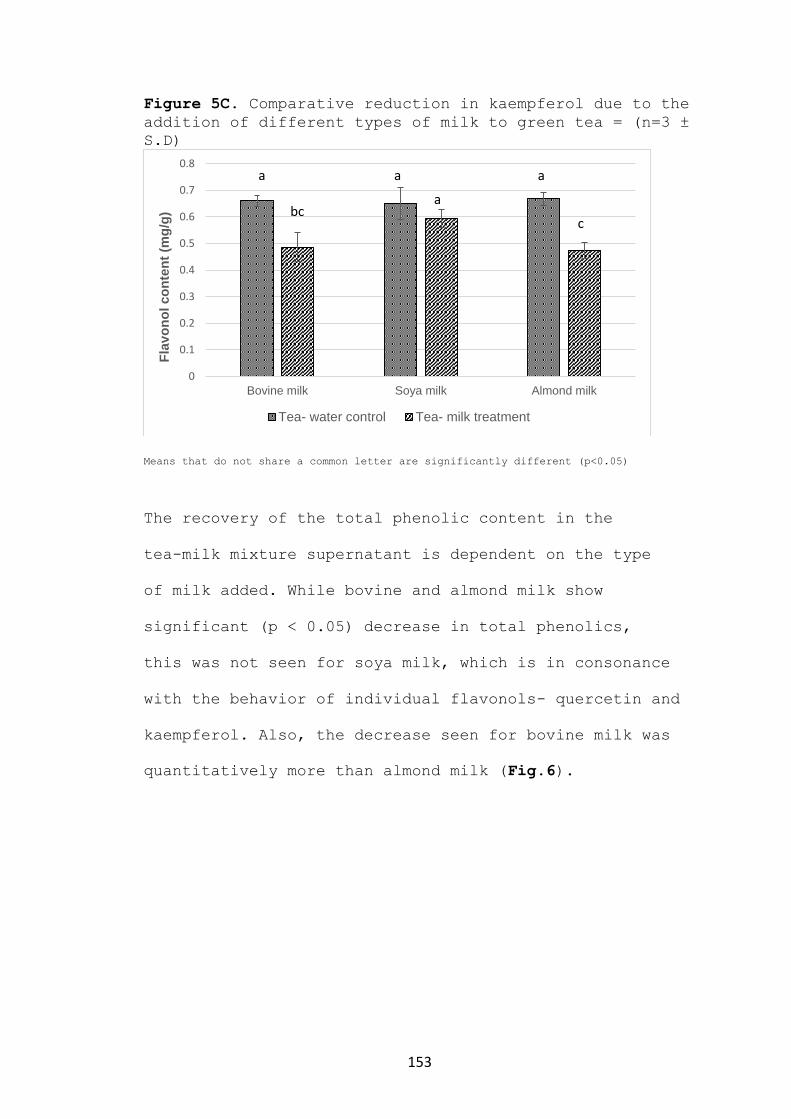
153
Figure 5C. Comparative reduction in kaempferol due to the
addition of different types of milk to green tea = (n=3 ±
S.D)
Means that do not share a common letter are significantly different (p<0.05)
The recovery of the total phenolic content in the
tea-milk mixture supernatant is dependent on the type
of milk added. While bovine and almond milk show
significant (p < 0.05) decrease in total phenolics,
this was not seen for soya milk, which is in consonance
with the behavior of individual flavonols- quercetin and
kaempferol. Also, the decrease seen for bovine milk was
quantitatively more than almond milk (Fig.6).
0
0.1
0.2
0.3
0.4
0.5
0.6
0.7
0.8
Bovine milk Soya milk Almond milk
Fla
vo
no
l co
nte
nt
(mg
/g)
Tea- water control Tea- milk treatment
a a a
bcc
a
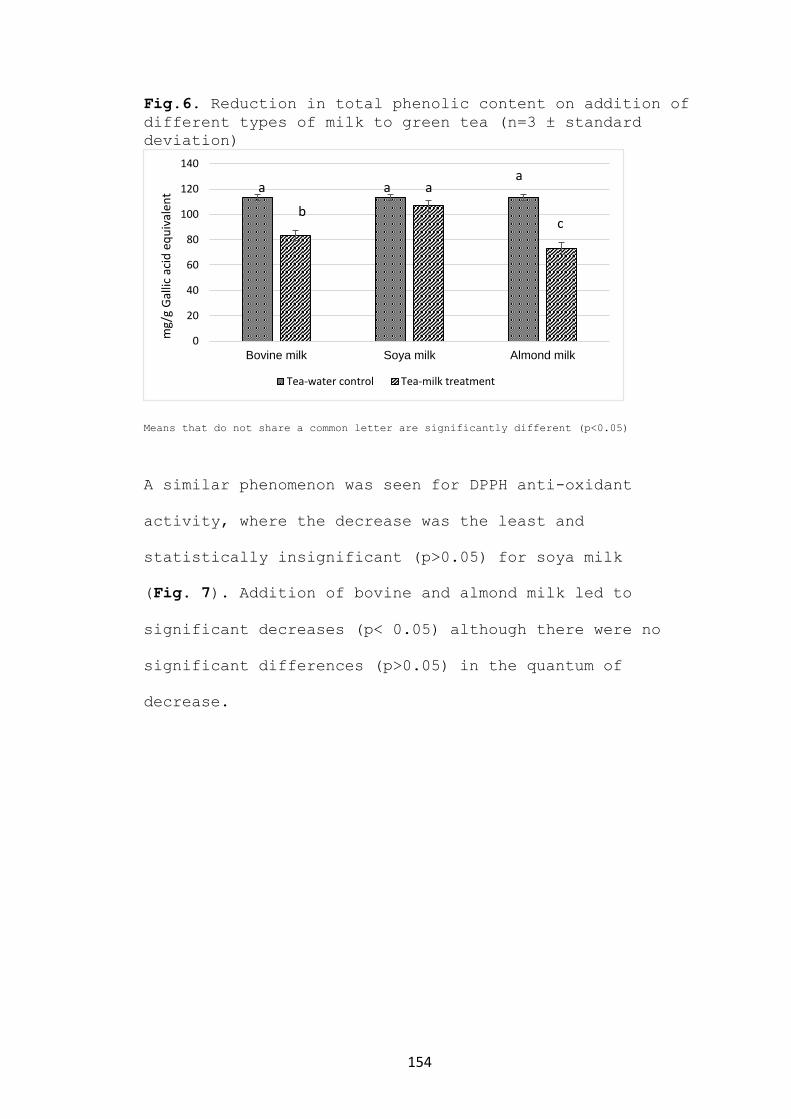
154
Fig.6. Reduction in total phenolic content on addition of
different types of milk to green tea (n=3 ± standard
deviation)
Means that do not share a common letter are significantly different (p<0.05)
A similar phenomenon was seen for DPPH anti-oxidant
activity, where the decrease was the least and
statistically insignificant (p>0.05) for soya milk
(Fig. 7). Addition of bovine and almond milk led to
significant decreases (p< 0.05) although there were no
significant differences (p>0.05) in the quantum of
decrease.
0
20
40
60
80
100
120
140
Bovine milk Soya milk Almond milk
mg/
g G
allic
aci
d e
qu
ival
ent
Tea-water control Tea-milk treatment
a aa
a
bc

155
Figure 7. Reduction in DPPH anti-oxidant activity after
the addition of different types of milk to green tea (n=3
± S.D.)
Means that do not share a common letter are significantly different (p<0.05)
Our results are partly in consonance with those of Ryan and
Sutherland (2011) , who observed higher antioxidant values
(FRAP) or no change after the addition of soya milk
to black tea, as compared to semi-skimmed bovine milk.
According to previous literature (Ryan and Petit 2010;
Ferruzzi and Green 2006), increase in protein content
led to higher protein-phenolic interaction. Our study
contradicts these observations, because despite having the
highest protein content of 8 g, the recovery of phenolics
after the addition of bovine milk is comparable to that of
almond milk with 5 g of protein. Soya milk with 6 g of
protein, shows higher recovery than both bovine and almond
milk defying previous observations on protein-phenolic
interactions.
0
20
40
60
80
100
120
140
160
180
Bovine milk Soya milk Almond milk
mg
/g V
itam
in C
Eq
uiv
ale
nt
an
ti-o
xid
an
t acti
vit
y
Tea-water control Tea-milk treatment
a
b
aa
a
b

156
This unusual variation in our observations can be explained
by three reasons. Firstly, the presence of higher protein
content may not ensure more precipitation and thus, lower
recovery. An important aspect to consider would be the
casein/whey protein (insoluble/soluble protein) ratio. As
observed by Ye and others (2013), the polyphenols bind
differently to the casein and the whey protein fraction.
Therefore, an analysis into the soluble and insoluble
fractions of the different milk proteins could provide us
with a cogent explanation.
Another factor that could contribute to our observation,
is the different chemistry of the proteins involved.
Although the composition of soya milk is complex,
conglycinin and glycinin represent the majority of soy
proteins (Riblett and others 2001) ,while there are soy
proteins that are rich in the sulfur amino acid-
methionine (Young 1991). Polyphenols bind to the proline
rich regions of conglycinin and glycinin
(Maruyama and others 2004) with subsequent complexation
(Luck and others 1994). However, our results suggest
that the binding of polyphenols to soya proteins is not
similar quantitatively to bovine milk proteins.
The almond milk used in our study was fortified with
unknown proportions of pea and rice protein. There is
not enough literature about rice and pea protein

157
interaction with polyphenols which can help explain our
results and therefore, needs to be researched.
Thirdly, there can be extraneous factors such as the
presence of fat in soya and almond milk that could
affect the protein-polyphenol interactions.
Serafini and others (2009) propounded that longer
peptide chains, the formation of which is apparently
associated with increasing fat content, could result in
increased polyphenol complexation perhaps similar to the
interactions described between β-lactoglobulins and
phenolic acids (Stojadinovic and others 2013). The role
of fat content on the anti-oxidant effect is unclear.
While Langley-Evans (2000) has shown that high-fat milk
digested in vitro with black tea had a more pronounced
negative impact on antioxidant capacity than low fat milk,
Ryan and Petit (2010) contradicted them by observing that
the lower fat content of skimmed milk had a more drastic
reduction in anti-oxidant activity due to its lower
content of milk polyphenols.
The decrease in the anti-oxidant activity is consistent
with the observations of Gallo and others (2013);
Arts and others (2002); Dubeau and others (2010) and
Sharma and others (2008), in which the authors suggested
a masking effect of bovine milk protein components on
polyphenolic components. The consonance between the
phenolic recovery and anti-oxidant levels can be

158
explained by the fact that the antioxidant ability of
the polyphenol–milk protein complex does not depend on
the sum of the antioxidant ability of polyphenol
molecules bound but simply on the number of polyphenols
unbound Xiao and others (2011).
6.3.3 Analysis of commercial samples
Unlike the tea- milk model mixtures, we did not observe
any flavonols in the supernatant. Instead all the
flavonols were isolated form the dried pellet.
The amount of myricetin, quercetin and kaempferol
recovered from the pellet was 0.01 ± 0.00, 0.19 ± 0.04
and 0.13 ± 0.03 mg/280 mL of the sample.
This may be due to the presence of various other
components such as fats, sugars and dietary fibers,
all of which may lead to the binding of flavonols.
6.4 Conclusions
From a product development perspective for Ready to
Drink (RTD) beverages, striking the ideal balance
between protein and flavonoid content is the key.
From our studies, we observe that the recovery of
polyphenols and the preservation of anti-oxidant activity
is the highest for neem tea and for soya milk among
different tea and milk types, respectively. Therefore,
neem tea-soya milk based beverages can play an
important role in the growth of the RTD beverage industry.

159
Future direction of research
Our study focused on neem leaf and bark and the
elucidation of their bio-active potential. While we
restricted our research to flavonols, other groups of
health promoting compounds such as phenolic acids,
flavones, flavan-3-ols and flavanones are probably
present in neem. Obtaining qualitative and quantitative
information about these compounds would give us a better
idea of the bio-active profile of neem. Furthermore, this
profiling can be extended to neem seeds, flowers and
twigs which have also found use in ancient medical
practice.
The neem leaf powder bought from Neem Tree Farms in
Florida is sourced from India and Mexico while the fresh
Neem leaves are grown in Florida. Since the suppliers are
able to provide this information today, one can perform a
study to see if a distinction can be drawn between neem
samples from different countries based on their chemical
constitution. The results from a source/origin based LC-
MS and GC-MS profiling of neem would be valuable to the
cultivators of neem in these countries helping them in
adopting practices that would enhance neem’s bioactive
potential.
Counteracting the bitterness of neem is essential in
making it more palatable and is a key aspect of expanding

160
its commercial applications. The bitter principle in neem
comprises of a group of compounds called limonoids.
Although neem contains over 3,000 different limonoids and
their derivatives, attempts must be made in isolating as
many limonoids as possible, by trying to remove them
selectively to understand the effect of each limonoid on
the bitterness and bio-activity of neem. A big step
forward would be the ability to isolate the bitter
compounds individually and remove them selectively in
order to preserve or cause minimal loss to the overall
bio-activity of neem.
The ideal bitterness reducing strategy is the one which
is not only effective in reducing bitterness but is able
to do so with minimal cost and least damage or loss to
the bioactive nutrients and organoleptic properties of
the food/beverage in question. Our study was able to
successfully remove the bitterness from neem but had the
disadvantage of causing nutritional and sensorial loss to
neem tea. While the results for Amberlite XAD-16 were
more encouraging than those for SPE, there was still some
loss in polyphenols, anti-oxidant capacity, color and
volatiles, which can perhaps be averted by exploring
other strategies of de-bittering. These may include the
use of other styrene/divinylbenzene polymer resins such
as Amberlite XAD-7 HP, XAD-16HP and Dowex-L285;
cyclodextrins; enzymes catalyzing the conversion of

161
limonin from immobilized bacterial cells and altering
cultivation practices to ensure lesser production of
bitter limonoids.
Understanding the effect of de-bittering on sensorial
properties of neem tea is an area which needs more
understanding. While our study conclusively showed that
the debittering procedure led to a significant decrease
in bitterness, it did not provide us information on the
effect on volatiles of neem tea. A descriptive sensory
panel with extensive training is required for this
purpose as an untrained panel cannot reveal any useful
information.
The growing popularity of ready to drink beverages
(RTD’s) has demanded a better understanding of milk
protein-flavonoid interactions which may ultimately
affect the bio-availability of flavonoids in-vivo. Our
study expands on the knowledge gained about the behavior
of catechins (flavan-3-ols) to the interaction of
flavonols with different milk proteins-bovine, soy and
almond. With the increased usage of plant-based milks in
RTD’s, it will be knowledge-worthy to expand the study to
various other plant-based milks available in the market
place such as rice, flaxseed and coconut milk. While our
study encompassed the applied aspects of tea-milk
interaction, it would be worthwhile to extend the study
to answer some of the basic questions involved. These
162
include exploring the mechanisms of interaction between
proteins in soya, almond, rice and flaxseed milk with
different flavonoids in tea because our understanding of
flavonoid-protein binding studies is so far limited to
bovine milk proteins. One interesting observation from
our study was that although the addition of bovine milk
to neem tea did not affect the amount of polyphenols in
the supernatant, we did see an overall decrease in the
anti-oxidant capacity. We suspect that this might be due
to the binding of casein with limonoids. This behavior is
very poorly understood and requires further research.
The role of milk fat in affecting the anti-oxidant
capacity of tea-milk systems is also controversial. A
previous study had suggested that reducing the fat
content of bovine milk leads to a significant reduction
in the anti-oxidant values because of a decrease in fat
soluble anti-oxidants, such as carotenoids, tocopherols
and retinols. However, these results were contradicted by
another author observing that the highest decrease in
FRAP anti-oxidant values were due to the addition of
whole milk as compared to semi-skimmed or skimmed milk.
They suggest a direct interaction between tea catechins
and milk fat similar to the interaction between tea
catechins and lipoprotein fractions in human plasma. Yet
others have suggested that milk fat leads to the
formation of longer peptide chains, thereby increasing

163
protein-polyphenol interactions. The effect of fat in
plant based milks on polyphenols in different tea
matrices and its effect on the in-vitro anti-oxidant
activity is an area of interest for us.
Besides fat, the role of sugars and dietary fibers is a
direction of research that can be pursued to gather more
knowledge about RTD’s.

164
References
Abdelgaleil SA, Iwagawa T, Doe M, Nakatani M. 2004.
Antifungal limonoids from the fruits of Khaya
senegalensis. Fitoterapia 75(6):566-72.
Akihisa T, Takahashi A, Kikuchi T, Takagi M, Watanabe K,
Fukatsu M, Fujita Y, Banno N, Tokuda H, Yasukawa K.
2011. The melanogenesis-inhibitory, anti-
inflammatory, and chemopreventive effects of
limonoids in n-hexane extract of Azadirachta indica
A. Juss. (neem) seeds. Journal of oleo science
60(2):53-9.
Akpuaka A, Ekwenchi M, Dashak D, Dildar A. 2013.
Biological activities of characterized isolates of
n-hexane extract of Azadirachta indica A. Juss
(Neem) leaves. NY Sci J 6:119-24.
Ali MSM, Alan C. 2015. Analysis of phenolics in
Anacardium occidentale shoot extracts using a
reversed-phase high performance liquid
chromatography tandem mass spectrometry (RP-HPLC-
MS)[Analisis fenolik dalam ekstrak pucuk Anacardium
occidentale menggunakan fasa berbalik kromatografi
cecair berprestasi tinggi dan spektrometri jisim
(RP-HPLC-MS)]. Journal of Tropical Agriculture and
Food Science 38:221-30.
Arora R, Singh S, Sharma R. 2008. Neem leaves: Indian
herbal medicine. Botanical Medicine in Clinical
Practice:85-98.
Arts MJ, Haenen GR, Wilms LC, Beetstra SA, Heijnen CG,
Voss H-P, Bast A. 2002. Interactions between
flavonoids and proteins: effect on the total
antioxidant capacity. Journal of Agricultural and
Food Chemistry 50(5):1184-7.
Azmi AS, Bhat SH, Hanif S, Hadi S. 2006. Plant
polyphenols mobilize endogenous copper in human
peripheral lymphocytes leading to oxidative DNA
breakage: a putative mechanism for anticancer
properties. FEBS letters 580(2):533-8.
Azodanlou R, Darbellay C, Luisier J, Villettaz J, Amadò
R. 1999. A new concept for the measurement of total
volatile compounds of food. Zeitschrift für
Lebensmitteluntersuchung und-Forschung A 208(4):254-
8.
Badam L, Joshi S, Bedekar S. 1999. 'In vitro'antiviral
activity of neem (Azadirachta indica. A. Juss) leaf
extract against group B coxsackieviruses. The
Journal of communicable diseases 31(2):79-90.
Bakkali F, Averbeck S, Averbeck D, Idaomar M. 2008.
Biological effects of essential oils–a review. Food
and chemical toxicology 46(2):446-75.

165
Balandrin MF, Lee SM, Klocke JA. 1988. Biologically
active volatile organosulfur compounds from seeds of
the neem tree, Azadirachta indica (Meliaceae).
Journal of agricultural and food chemistry
36(5):1048-54.
Balasundram N, Sundram K, Samman S. 2006. Phenolic
compounds in plants and agri-industrial by-products:
Antioxidant activity, occurrence, and potential
uses. Food chemistry 99(1):191-203.
Balestrieri E, Pizzimenti F, Ferlazzo A, Giofrè SV,
Iannazzo D, Piperno A, Romeo R, Chiacchio MA,
Mastino A, Macchi B. 2011. Antiviral activity of
seed extract from Citrus bergamia towards human
retroviruses. Bioorganic & medicinal chemistry
19(6):2084-9.
Bandyopadhyay U, Biswas K, Chatterjee R, Bandyopadhyay D,
Chattopadhyay I, Ganguly CK, Chakraborty T,
Bhattacharya K, Banerjee RK. 2002a. Gastroprotective
effect of Neem (Azadirachta indica) bark extract:
possible involvement of H(+)-K(+)-ATPase inhibition
and scavenging of hydroxyl radical. Life sciences
71(24):2845-65.
Bandyopadhyay U, Biswas K, Chatterjee R, Bandyopadhyay D,
Chattopadhyay I, Ganguly CK, Chakraborty T,
Bhattacharya K, Banerjee RK. 2002b. Gastroprotective
effect of Neem (Azadirachta indica) bark extract:
Possible involvement of H+-K+-ATPase inhibition and
scavenging of hydroxyl radical. Life sciences
71(24):2845-65.
Bao J, Cai Y, Sun M, Wang G, Corke H. 2005. Anthocyanins,
flavonols, and free radical scavenging activity of
Chinese bayberry (Myrica rubra) extracts and their
color properties and stability. Journal of
Agricultural and Food Chemistry 53(6):2327-32.
Baydar NG, Özkan G, Sağdiç O. 2004. Total phenolic
contents and antibacterial activities of grape
(Vitis vinifera L.) extracts. Food Control
15(5):335-9.
Bektaş E, Daferera D, Sökmen M, Serdar G, Ertürk M,
Polissiou MG, Sökmen A. 2016. In vitro
antimicrobial, antioxidant, and antiviral activities
of the essential oil and various extracts from
Thymus nummularis M. Bieb. Indian Journal of
Traditional Knowledge 15(3):403-10.
Belter PA, Cussler EL, Hu W. 1987. Bioseparations:
downstream processing for biotechnology.
Bhattacharyya KG, Sharma A. 2004. Adsorption of Pb (II)
from aqueous solution by Azadirachta indica (Neem)
leaf powder. Journal of hazardous materials
113(1):97-109.

166
Bhoyar MS, Mishra GP, Naik PK, Srivastava R. 2011.
Estimation of antioxidant activity and total
phenolics among natural populations of Caper
(Capparis spinosa) leaves collected from cold arid
desert of trans-Himalayas. Australian Journal of
Crop Science 5(7):912.
Bigliardi B, Galati F. 2013. Innovation trends in the
food industry: the case of functional foods. Trends
in Food Science & Technology 31(2):118-29.
Binello A, Cravotto G, Nano GM, Spagliardi P. 2004.
Synthesis of chitosan–cyclodextrin adducts and
evaluation of their bitter‐masking properties. Flavour and fragrance journal 19(5):394-400.
Binello A, Robaldo B, Barge A, Cavalli R, Cravotto G.
2008. Synthesis of cyclodextrin‐based polymers and their use as debittering agents. Journal of applied
polymer science 107(4):2549-57.
Biswas K, Chattopadhyay I, Banerjee RK, Bandyopadhyay U.
2002. Biological activities and medicinal properties
of neem (Azadirachta indica). CURRENT SCIENCE-
BANGALORE- 82(11):1336-45.
Boban M, Kocic G, Radenkovic S, Pavlovic R, Cvetkovic T,
Deljanin-Ilic M, Ilic S, Bobana MD, Djindjic B,
Stojanovic D. 2014. Circulating purine compounds,
uric acid, and xanthine oxidase/dehydrogenase
relationship in essential hypertension and end stage
renal disease. Renal failure.
Bordin G, Raposo FC, De la Calle B, Rodriguez A. 2001.
Identification and quantification of major bovine
milk proteins by liquid chromatography. Journal of
chromatography A 928(1):63-76.
Brand-Williams W, Cuvelier M-E, Berset C. 1995. Use of a
free radical method to evaluate antioxidant
activity. LWT-Food science and Technology 28(1):25-
30.
Breksa AP, Ibarra P. 2007. Colorimetric method for the
estimation of total limonoid aglycones and glucoside
contents in citrus juices. Journal of agricultural
and food chemistry 55(13):5013-7.
Buchbauer G, Jirovetz L, Jäger W. 1991. Aromatherapy:
evidence for sedative effects of the essential oil
of lavender after inhalation. Zeitschrift für
Naturforschung C 46(11-12):1067-72.
Bucić-Kojić A, Planinić M, Tomas S, Bilić M, Velić D.
2007. Study of solid–liquid extraction kinetics of
total polyphenols from grape seeds. Journal of Food
Engineering 81(1):236-42.
Bussmann RW, Sharon D, Vandebroek I, Jones A, Revene Z.
2007. Health for sale: the medicinal plant markets
in Trujillo and Chiclayo, Northern Peru. Journal of
ethnobiology and ethnomedicine 3:37.

167
Cánovas M, García-Cases L, Iborra J. 1998. Limonin
consumption at acidic pH values and absence of
aeration by Rhodococcus fascians cells in batch and
immobilized continuous systems. Enzyme and microbial
technology 22(2):111-6.
Carson C, Riley T. 2001. Safety, efficacy and provenance
of tea tree (Melaleuca alternifolia) oil. Contact
Dermatitis 45(2):65-7.
Carson CF, Mee BJ, Riley TV. 2002. Mechanism of action of
Melaleuca alternifolia (tea tree) oil on
Staphylococcus aureus determined by time-kill,
lysis, leakage, and salt tolerance assays and
electron microscopy. Antimicrobial agents and
chemotherapy 46(6):1914-20.
Cencic A, Chingwaru W. 2010. The role of functional
foods, nutraceuticals, and food supplements in
intestinal health. Nutrients 2(6):611-25.
Chakraborty T, Uerotta L, Poddar G. 1989. Evaluation of
Azadirachta indica leaf extract for hypoglycemic
activity in rats Phytother. Res 3:30-2.
Champagne DE, Koul O, Isman MB, Scudder GG, Towers GN.
1992. Biological activity of limonoids from the
Rutales. Phytochemistry 31(2):377-94.
Chandler B, Kefford J, Ziemelis G. 1968. Removal of
limonin from bitter orange juice. Journal of the
Science of Food and Agriculture 19(2):83-6.
Charlton AJ, Baxter NJ, Khan ML, Moir AJ, Haslam E,
Davies AP, Williamson MP. 2002. Polyphenol/peptide
binding and precipitation. Journal of agricultural
and food chemistry 50(6):1593-601.
Chen G, Tan ML, Li KK, Leung PC, Ko CH. 2015. Green tea
polyphenols decreases uric acid level through
xanthine oxidase and renal urate transporters in
hyperuricemic mice. J Ethnopharmacol 175:14-20.
Chen J, Wang J, Zhang X, Jin Y. 2008. Microwave-assisted
green synthesis of silver nanoparticles by
carboxymethyl cellulose sodium and silver nitrate.
Materials chemistry and physics 108(2):421-4.
Childs NM. 1997. Foods that help prevent disease:
consumer attitudes and public policy implications.
Journal of Consumer Marketing 14(6):433-47.
Chouliara E, Karatapanis A, Savvaidis I, Kontominas M.
2007. Combined effect of oregano essential oil and
modified atmosphere packaging on shelf-life
extension of fresh chicken breast meat, stored at 4
C. Food Microbiology 24(6):607-17.
Chu YH, Chang CL, Hsu HF. 2000. Flavonoid content of
several vegetables and their antioxidant activity.
Journal of the Science of Food and Agriculture
80(5):561-6.

168
Čolak E. 2008. New markers of oxidative damage to
macromolecules. Journal of medical Biochemistry
27(1):1-16.
Comalada M, Camuesco D, Sierra S, Ballester I, Xaus J,
Gálvez J, Zarzuelo A. 2005. In vivo quercitrin anti‐inflammatory effect involves release of quercetin,
which inhibits inflammation through down‐regulation of the NF‐κB pathway. European journal of immunology 35(2):584-92.
Cos P, Ying L, Calomme M, Hu JP, Cimanga K, Van Poel B,
Pieters L, Vlietinck AJ, Berghe DV. 1998. Structure-
activity relationship and classification of
flavonoids as inhibitors of xanthine oxidase and
superoxide scavengers. Journal of Natural Products
61(1):71-6.
Dasgupta T, Banerjee S, Yadava P, Rao A. 2004.
Chemopreventive potential of Azadirachta indica
(Neem) leaf extract in murine carcinogenesis model
systems. Journal of ethnopharmacology 92(1):23-36.
Dawson J, Walters M. 2006. Uric acid and xanthine
oxidase: future therapeutic targets in the
prevention of cardiovascular disease? British
journal of clinical pharmacology 62(6):633-44.
de Medina FS, Gálvez J, Romero JA, Zarzuelo A. 1996.
Effect of quercitrin on acute and chronic
experimental colitis in the rat. Journal of
Pharmacology and Experimental Therapeutics
278(2):771-9.
De NB, Ifeoma E. 2002. Antimicrobial effects of
components of the bark extract of neem (Azadirachta
indica A. J uss). Technology and Development 8:23-8.
DeBruin LS, Josephy PD, Pawliszyn JB. 1998. Solid-phase
microextraction of monocyclic aromatic amines from
biological fluids. Analytical chemistry 70(9):1986-
92.
Del Valle EM. 2004. Cyclodextrins and their uses: a
review. Process biochemistry 39(9):1033-46.
Devi MA, Gondi M, Sakthivelu G, Giridhar P, Rajasekaran
T, Ravishankar G. 2009. Functional attributes of
soybean seeds and products, with reference to
isoflavone content and antioxidant activity. Food
Chemistry 114(3):771-6.
Dholi SK, Raparla R, Mankala SK, Nagappan K. 2011. Invivo
Antidiabetic evaluation of Neem leaf extract in
alloxan induced rats. Journal of applied
Pharmaceutical science 1(4):1.
Dorababu D, Joshi M, Kumar B, Chaturvedi A, Goel R. 2006.
Effect of aqueous extract of neem (Azadirachta
indica) leaves on offensive and defensive gastric
mucosal factors in rats. Indian Journal of
Physiology and Pharmacology 50(3):241.
169
Dorababu M, Prabha T, Priyambada S, Agrawal V, Aryya N,
Goel R. 2004. Effect of Bacopa monniera and
Azadirachta indica on gastric ulceration and healing
in experimental NIDDM rats. Indian journal of
experimental biology 42(4):389-97.
Doran PM. 2006. Loss of secreted antibody from transgenic
plant tissue cultures due to surface adsorption.
Journal of biotechnology 122(1):39-54.
Dorman H, Deans S. 2000. Antimicrobial agents from
plants: antibacterial activity of plant volatile
oils. Journal of applied microbiology 88(2):308-16.
Drewnowski A, Gomez-Carneros C. 2000. Bitter taste,
phytonutrients, and the consumer: a review. The
American journal of clinical nutrition 72(6):1424-
35.
Dubeau S, Samson G, Tajmir-Riahi H-A. 2010. Dual effect
of milk on the antioxidant capacity of green,
Darjeeling, and English breakfast teas. Food
chemistry 122(3):539-45.
Dudonné S, Vitrac X, Coutiere P, Woillez M, Mérillon J-M.
2009. Comparative study of antioxidant properties
and total phenolic content of 30 plant extracts of
industrial interest using DPPH, ABTS, FRAP, SOD, and
ORAC assays. Journal of agricultural and food
chemistry 57(5):1768-74.
Duthie S, Collins A, Duthie G, Dobson V. 1997. Quercetin
and myricetin protect against hydrogen peroxide-
induced DNA damage (strand breaks and oxidised
pyrimidines) in human lymphocytes. Mutation
Research/Genetic Toxicology and Environmental
Mutagenesis 393(3):223-31.
El-Mahmood A, Ogbonna O, Raji M. 2013. The antibacterial
activity of Azadarichta indica (neem) seeds extracts
against bacterial pathogens associated with eye and
ear infections. Journal of Medicinal Plants Research
4(14):1414-21.
Escarpa A, González M. 2001. Approach to the content of
total extractable phenolic compounds from different
food samples by comparison of chromatographic and
spectrophotometric methods. Analytica Chimica Acta
427(1):119-27.
Fajarika D, Noor E. 2015. The Design Process for
Entrapping Limonin and Naringin in Siam Juice by
Cyclodextrin. IPTEK Journal of Proceedings Series
(1).
Fayoux SC, Hernandez RJ, Holland RV. 2007. The
debittering of navel orange juice using polymeric
films. Journal of food science 72(4):E143-E54.
Fernández‐Vázquez R, Stinco CM, Hernanz D, Heredia FJ, Vicario IM. 2013. Industrial orange juice
debittering: effect on volatile compounds and

170
overall quality attributes. International Journal of
Food Science & Technology 48(9):1861-7.
Ferrandiz M, Alcaraz M. 1991. Anti-inflammatory activity
and inhibition of arachidonic acid metabolism by
flavonoids. Agents and actions 32(3-4):283-8.
Ferruzzi MG, Green RJ. 2006. Analysis of catechins from
milk–tea beverages by enzyme assisted extraction
followed by high performance liquid chromatography.
Food Chemistry 99(3):484-91.
Fiamegos YC, Nanos CG, Vervoort J, Stalikas CD. 2004.
Analytical procedure for the in-vial derivatization—
extraction of phenolic acids and flavonoids in
methanolic and aqueous plant extracts followed by
gas chromatography with mass-selective detection.
Journal of Chromatography A 1041(1):11-8.
Frazier RA, Papadopoulou A, Green RJ. 2006. Isothermal
titration calorimetry study of epicatechin binding
to serum albumin. Journal of pharmaceutical and
biomedical analysis 41(5):1602-5.
Fu Y, Chen J, Li Y-J, Zheng Y-F, Li P. 2013. Antioxidant
and anti-inflammatory activities of six flavonoids
separated from licorice. Food chemistry 141(2):1063-
71.
Fuhrman B, Aviram M. 2001. Flavonoids protect LDL from
oxidation and attenuate atherosclerosis. Current
opinion in lipidology 12(1):41-8.
Gallo M, Vinci G, Graziani G, De Simone C, Ferranti P.
2013. The interaction of cocoa polyphenols with milk
proteins studied by proteomic techniques. Food
research international 54(1):406-15.
Gao M, Song B-Z, Liu C-Z. 2006. Dynamic microwave-
assisted extraction of flavonoids from Saussurea
medusa Maxim cultured cells. Biochemical Engineering
Journal 32(2):79-83.
Ghimeray AK, Jin C-W, Ghimire BK, Cho DH. 2009.
Antioxidant activity and quantitative estimation of
azadirachtin and nimbin in Azadirachta Indica A.
Juss grown in foothills of Nepal. African Journal of
Biotechnology 8(13).
Gilbert L. 2000. Marketing functional foods: how to reach
your target audience.
Goff SA, Klee HJ. 2006. Plant volatile compounds: sensory
cues for health and nutritional value? Science
311(5762):815-9.
Gómez-López VM. 2012. Decontamination of fresh and
minimally processed produce: Wiley Online Library.
Govere J, Durrheim D, Du Toit N, Hunt R, Coetzee M. 2000.
Local plants as repellents against Anopheles
arabiensis, in Mpumalanga Province, South Africa.
The Central African journal of medicine 46(8):213-6.
171
Govindachari T, Narasimhan N, Suresh G, Partho P,
Gopalakrishnan G. 1996. Insect antifeedant and
growth-regulating activities of salannin and other
C-seco limonoids from neem oil in relation to
azadirachtin. Journal of chemical ecology
22(8):1453-61.
Grunert KG, Bech-Larsen T, Bredahl L. 2000. Three issues
in consumer quality perception and acceptance of
dairy products. International Dairy Journal
10(8):575-84.
Guardia T, Rotelli AE, Juarez AO, Pelzer LE. 2001. Anti-
inflammatory properties of plant flavonoids. Effects
of rutin, quercetin and hesperidin on adjuvant
arthritis in rat. Il farmaco 56(9):683-7.
Guenther E. 1948. The essential oils, volume I. Van
Nostrand Company Inc., New York.
Guenther E. 1972. The Essential Oils: History-Origin in
Plants Production. Analysis 1:147-51.
Gunadharini DN, Elumalai P, Arunkumar R, Senthilkumar K,
Arunakaran J. 2011. Induction of apoptosis and
inhibition of PI3K/Akt pathway in PC-3 and LNCaP
prostate cancer cells by ethanolic neem leaf
extract. Journal of ethnopharmacology 134(3):644-50.
Gupta S, Bhat G. 2016. Antibacterial effect of Neem oil
on Methicillin resistant Staphylococcus aureus.
Journal of Medicinal Plants Studies 4(1):01-3.
Gutierrez J, Barry-Ryan C, Bourke P. 2008. The
antimicrobial efficacy of plant essential oil
combinations and interactions with food ingredients.
International journal of food microbiology
124(1):91-7.
Haenen GR, Paquay JB, Korthouwer RE, Bast A. 1997.
Peroxynitrite scavenging by flavonoids. Biochemical
and biophysical research communications 236(3):591-
3.
Halliwell B, Gutteridge J. 1999. Free radicals in
medicine and biology. Clarendon: Oxford.
Hammerstone JF, Lazarus SA, Schmitz HH. 2000. Procyanidin
content and variation in some commonly consumed
foods. The Journal of nutrition 130(8):2086S-92S.
Harborne J, Baxter H, Moss G. 1999. Phytochemical
dictionary: a handbook of bioactive compounds from
plants–Taylor and Francis. London.
Hasegawa S, Bennett RD, Herman Z, Fong CH, Ou P. 1989.
Limonoid glucosides in citrus. Phytochemistry
28(6):1717-20.
Hasegawa S, Pelton VA, Bennett RD. 1983. Metabolism of
limonoids by Arthrobacter globiformis II: basis for
a practical means of reducing the limonin content of
orange juice by immobilized cells. Journal of
Agricultural and Food Chemistry 31(5):1002-4.

172
HASEGAWA S, VANDERCOOK CE, CHOI GY, HERMAN Z, OU P. 1985.
Limonoid debittering of citrus juice sera by
immobilized cells of Corynebacterium fascians.
Journal of Food Science 50(2):330-2.
Haug A, Høstmark AT, Harstad OM. 2007. Bovine milk in
human nutrition–a review. Lipids in health and
disease 6(1):1.
Hertog MG, Feskens EJ, Kromhout D, Hollman P, Katan M.
1993. Dietary antioxidant flavonoids and risk of
coronary heart disease: the Zutphen Elderly Study.
The Lancet 342(8878):1007-11.
Hirano R, Sasamoto W, Matsumoto A, Itakura H, Igarashi O,
Kondo K. 2001. Antioxidant ability of various
flavonoids against DPPH radicals and LDL oxidation.
Journal of nutritional science and vitaminology
47(5):357-62.
Hismath I, Wan Aida W, Ho C. 2011. Optimization of
extraction conditions for phenolic compounds from
neem (Azadirachta indica) leaves. International Food
Research Journal 18(3).
Hofmann T, Glabasnia A, Schwarz B, Wisman KN, Gangwer KA,
Hagerman AE. 2006. Protein binding and astringent
taste of a polymeric procyanidin, 1, 2, 3, 4, 6-
penta-O-galloyl-β-D-glucopyranose, castalagin, and
grandinin. Journal of agricultural and food
chemistry 54(25):9503-9.
Hollman PC, Bijsman MN, van Gameren Y, Cnossen EP, de
Vries JH, Katan MB. 1999. The sugar moiety is a
major determinant of the absorption of dietary
flavonoid glycosides in man. Free radical research
31(6):569-73.
Huang R, Lu Y, Inbaraj BS, Chen B. 2015. Determination of
phenolic acids and flavonoids in Rhinacanthus
nasutus (L.) kurz by high-performance-liquid-
chromatography with photodiode-array detection and
tandem mass spectrometry. Journal of Functional
Foods 12:498-508.
Huang Z, Shi P, Dai J, Du J. 2004. Protein metabolism in
Spodoptera litura (F.) is influenced by the
botanical insecticide azadirachtin. Pesticide
Biochemistry and Physiology 80(2):85-93.
Huxley RR, Neil H. 2003. The relation between dietary
flavonol intake and coronary heart disease
mortality: a meta-analysis of prospective cohort
studies. European Journal of Clinical Nutrition
57(8):904-8.
Hyldgaard M, Mygind T, Meyer RL. 2012. Essential oils in
food preservation: mode of action, synergies, and
interactions with food matrix components.
Ignat I, Volf I, Popa VI. 2011. A critical review of
methods for characterisation of polyphenolic

173
compounds in fruits and vegetables. Food Chemistry
126(4):1821-35.
Jaenson TG, Pålsson K, Borg-Karlson A-K. 2006. Evaluation
of extracts and oils of mosquito (Diptera:
Culicidae) repellent plants from Sweden and Guinea-
Bissau. Journal of Medical Entomology 43(1):113-9.
Jarvis AP, Morgan ED. 2000. Analysis of small samples of
limonoids of neem (Azadirachta indica) using solid
phase extraction from tissue culture. Phytochemical
Analysis 11(3):184-9.
Jeleń HH, Majcher M, Dziadas M. 2012. Microextraction
techniques in the analysis of food flavor compounds:
A review. Analytica chimica acta 738:13-26.
Jessup W, Mohr D, Gieseg SP, Dean RT, Stocker R. 1992.
The participation of nitric oxide in cell free-and
its restriction of macrophage-mediated oxidation of
low-density lipoprotein. Biochimica et Biophysica
Acta (BBA)-Molecular Basis of Disease 1180(1):73-82.
Jiménez‐Martínez C, Campos‐Mendiola R, Sánchez‐Espíndola M, Jiménez‐Aparicio A, Gutiérrez‐López G, Dávila‐Ortiz G. 2009. Microstructural changes in Lupinus campestris
seed in response to three thermal debittering
treatments. Journal of the Science of Food and
Agriculture 89(14):2399-404.
Johnson RL, Chandler BV. 1982. Reduction of bitterness
and acidity in grapefruit juice by adsorptive
processes. Journal of the Science of Food and
Agriculture 33(3):287-93.
Juliano C, Mattana A, Usai M. 2000. Composition and in
vitro antimicrobial activity of the essential oil of
Thymus herba-barona Loisel growing wild in Sardinia.
Journal of Essential Oil Research 12(4):516-22.
Juven B, Kanner J, Schved F, Weisslowicz H. 1994. Factors
that interact with the antibacterial action of thyme
essential oil and its active constituents. Journal
of applied bacteriology 76(6):626-31.
Kataoka H, Lord HL, Pawliszyn J. 2000a. Applications of
solid-phase microextraction in food analysis.
Journal of chromatography. A 880(1-2):35-62.
Kataoka H, Lord HL, Pawliszyn J. 2000b. Applications of
solid-phase microextraction in food analysis.
Journal of chromatography A 880(1):35-62.
Kaushik A, Tanwar R, Kaushik M. 2012. Ethnomedicine:
Applications of Neem (Azadirachta indica) in
dentistry. Dental Hypotheses 3(3):112.
Khosla P, Bhanwra S, Singh J, Seth S, Srivastava R. 2000.
A study of hypoglycaemic effects of Azadirachta
indica (Neem) in normal and alloxan diabetic
rabbits. Indian Journal of Physiology and
Pharmacology 44(1):69-74.

174
Kiran SR, Devi PS, Reddy KJ. 2007. Bioactivity of
essential oils and sesquiterpenes of Chloroxylon
swietenia DC against Helicoverpa armigera. Current
Science (00113891) 93(4).
Kita M, Hirata Y, Moriguchi T, Endo-Inagaki T, Matsumoto
R, Hasegawa S, Suhayda CG, Omura M. 2000. Molecular
cloning and characterization of a novel gene
encoding limonoid UDP‐glucosyltransferase in Citrus 1. Febs Letters 469(2-3):173-8.
Kitamura S. 2006. Transport of flavonoids: from cytosolic
synthesis to vacuolar accumulation. The Science of
Flavonoids: Springer. p. 123-46.
Knobloch K, Pauli A, Iberl B, Weigand H, Weis N. 1989.
Antibacterial and antifungal properties of essential
oil components. Journal of Essential Oil Research
1(3):119-28.
Kohmura M, Nio N, Kubo K, Minoshima Y, Munekata E,
Ariyoshi Y. 1989. Inhibition of angiotensin-
converting enzyme by synthetic peptides of human β-
casein. Agricultural and biological chemistry
53(8):2107-14.
Kola O, Kaya C, Duran H, Altan A. 2010. Removal of
limonin bitterness by treatment of ion exchange and
adsorbent resins. Food Science and Biotechnology
19(2):411-6.
Koul O. 2004. Biological activity of volatile di-n-propyl
disulfide from seeds of neem, Azadirachta indica
(Meliaceae), to two species of stored grain pests,
Sitophilus oryzae (L.) and Tribolium castaneum
(Herbst). Journal of economic entomology 97(3):1142-
7.
Kühnau J. 1976. The flavonoids. A class of semi-essential
food components: their role in human nutrition.
World review of nutrition and dietetics: Karger
Publishers. p. 117-91.
Kumar S, Suresh P, Vijayababu M, Arunkumar A, Arunakaran
J. 2006a. Anticancer effects of ethanolic neem leaf
extract on prostate cancer cell line (PC-3). Journal
of ethnopharmacology 105(1):246-50.
Kumar S, Suresh PK, Vijayababu MR, Arunkumar A,
Arunakaran J. 2006b. Anticancer effects of ethanolic
neem leaf extract on prostate cancer cell line (PC-
3). Journal of ethnopharmacology 105(1-2):246-50.
Kyle JA, Morrice PC, McNeill G, Duthie GG. 2007. Effects
of infusion time and addition of milk on content and
absorption of polyphenols from black tea. Journal of
Agricultural and Food Chemistry 55(12):4889-94.
Kyung KH. 2012. Antimicrobial properties of allium
species. Current opinion in biotechnology 23(2):142-
7.

175
Lalaguna F. 1993. Purification of fresh cassava root
polyphenols by solid-phase extraction with Amberlite
XAD-8 resin. Journal of chromatography A 657(2):445-
9.
Lambert R, Skandamis PN, Coote PJ, Nychas GJ. 2001. A
study of the minimum inhibitory concentration and
mode of action of oregano essential oil, thymol and
carvacrol. Journal of applied microbiology
91(3):453-62.
Langley-Evans SC. 2000. Antioxidant potential of green
and black tea determined using the ferric reducing
power (FRAP) assay. International journal of food
sciences and nutrition 51(3):181-8.
Lee H, Kim J. 2003. Effects of debittering on red
grapefruit juice concentrate. Food Chemistry
82(2):177-80.
Lee J-W, Jin C-L, Jang KC, Choi G-H, Lee H-D, Kim JH.
2013. Investigation on the insecticidal limonoid
content of commercial biopesticides and neem extract
using solid phase extraction. Journal of
Agricultural Chemistry and Environment 2013.
Leenen R, Roodenburg A, Tijburg L, Wiseman S. 2000. A
single dose of tea with or without milk increases
plasma antioxidant activity in humans. European
Journal of Clinical Nutrition 54(1):87-92.
Li P, Wang Y, Ma R, Zhang X. 2005. Separation of tea
polyphenol from green tea leaves by a combined
CATUFM-adsorption resin process. Journal of food
engineering 67(3):253-60.
Lin S, Zhang G, Liao Y, Pan J, Gong D. 2015. Dietary
Flavonoids as Xanthine Oxidase Inhibitors:
Structure–Affinity and Structure–Activity
Relationships. Journal of agricultural and food
chemistry 63(35):7784-94.
Liu A-L, Wang H-D, Lee SM, Wang Y-T, Du G-H. 2008a.
Structure–activity relationship of flavonoids as
influenza virus neuraminidase inhibitors and their
in vitro anti-viral activities. Bioorganic &
medicinal chemistry 16(15):7141-7.
Liu I-M, Liou S-S, Lan T-W, Hsu F-L, Cheng J-T. 2005.
Myricetin as the active principle of Abelmoschus
moschatus to lower plasma glucose in streptozotocin-
induced diabetic rats. Planta Medica 71(07):617-21.
Liu J, Mori A. 2005. Oxidative damage hypothesis of
stress-associated aging acceleration:
neuroprotective effects of natural and nutritional
antioxidants. RESEARCH COMMUNICATIONS IN BIOLOGICAL
PSYCHOLOGY PSYCHIATRY AND NEUROSCIENCES 30:B103.
Liu Q, Cai W, Shao X. 2008b. Determination of seven
polyphenols in water by high performance liquid

176
chromatography combined with preconcentration.
Talanta 77(2):679-83.
Luck G, Liao H, Murray NJ, Grimmer HR, Warminski EE,
Williamson MP, Lilley TH, Haslam E. 1994.
Polyphenols, astringency and proline-rich proteins.
Phytochemistry 37(2):357-71.
Lv F, Liang H, Yuan Q, Li C. 2011. In vitro antimicrobial
effects and mechanism of action of selected plant
essential oil combinations against four food-related
microorganisms. Food Research International
44(9):3057-64.
Lv H, Wang X, He Y, Wang H, Suo Y. 2015. Identification
and quantification of flavonoid aglycones in rape
bee pollen from Qinghai-Tibetan Plateau by HPLC-DAD-
APCI/MS. Journal of Food Composition and Analysis
38:49-54.
MacDonald‐Wicks LK, Wood LG, Garg ML. 2006. Methodology for the determination of biological antioxidant
capacity in vitro: a review. Journal of the Science
of Food and Agriculture 86(13):2046-56.
Madeira SV, Matos FJA, Leal-Cardoso JH, Criddle DN. 2002.
Relaxant effects of the essential oil of Ocimum
gratissimum on isolated ileum of the guinea pig.
Journal of Ethnopharmacology 81(1):1-4.
Maier VP, Brewster LC, Hsu AC. 1973. Ethylene-accelerated
limonoid metabolism in citrus fruits. Process for
reducing juice bitterness. Journal of Agricultural
and Food Chemistry 21(3):490-5.
Maithani A, Parcha V, Pant G, Dhulia I, Kumar D. 2011.
Azadirachta indica (neem) leaf: A review. J Pharm
Res 4(6):1824-7.
March RE, Miao X-S. 2004. A fragmentation study of
kaempferol using electrospray quadrupole time-of-
flight mass spectrometry at high mass resolution.
International Journal of Mass Spectrometry
231(2):157-67.
Martini S, Bonechi C, Rossi C. 2008. Interaction of
quercetin and Its conjugate quercetin 3-O-β-d-
glucopyranoside with albumin as determined by NMR
relaxation data. Journal of natural products
71(2):175-8.
Martinon F, Pétrilli V, Mayor A, Tardivel A, Tschopp J.
2006. Gout-associated uric acid crystals activate
the NALP3 inflammasome. Nature 440(7081):237-41.
Maruyama Y, Maruyama N, Mikami B, Utsumi S. 2004.
Structure of the core region of the soybean β-
conglycinin α′ subunit. Acta Crystallographica
Section D: Biological Crystallography 60(2):289-97.
Matsuda H, Morikawa T, Ando S, Toguchida I, Yoshikawa M.
2003. Structural requirements of flavonoids for
nitric oxide production inhibitory activity and

177
mechanism of action. Bioorganic & medicinal
chemistry 11(9):1995-2000.
McClure JW. 1975. Physiology and functions of flavonoids.
The flavonoids: Springer. p. 970-1055.
McDowell I, Bailey RG, Howard G. 1990. Flavonol
glycosides in black tea. Journal of the Science of
Food and Agriculture 53(3):411-4.
Melgosa M, Prez M, Hita E, Heredia F, Alba J, Moyano M.
2001. Reproducibility of the bromthymol blue
standards used for color specification of virgin
olive oil. Journal of the American Oil Chemists'
Society 78(3):265-70.
Merken HM, Beecher GR. 2000. Liquid chromatographic
method for the separation and quantification of
prominent flavonoid aglycones. Journal of
Chromatography A 897(1):177-84.
Michalkiewicz A, Biesaga M, Pyrzynska K. 2008. Solid-
phase extraction procedure for determination of
phenolic acids and some flavonols in honey. Journal
of chromatography A 1187(1):18-24.
Middleton E, Kandaswami C, Theoharides TC. 2000. The
effects of plant flavonoids on mammalian cells:
implications for inflammation, heart disease, and
cancer. Pharmacological reviews 52(4):673-751.
Miller EG, Fanous R, Rivera-Hidalgo F, Binnie WH,
Hasegawa S, Lam LK. 1989. The effects of citrus
limonoids on hamster buccal pouch carcinogenesis.
Carcinogenesis 10(8):1535-7.
Mira L, Tereza Fernandez M, Santos M, Rocha R, Helena
Florêncio M, Jennings KR. 2002. Interactions of
flavonoids with iron and copper ions: a mechanism
for their antioxidant activity. Free radical
research 36(11):1199-208.
Mishra A, Singh N, Sharma V. 1995. Use of neem oil as a
mosquito repellent in tribal villages of mandla
district, madhya pradesh. Indian journal of
malariology 32(3):99-103.
Miura K, Hughes MC, Arovah NI, van der Pols JC, Green AC.
2015. Black Tea Consumption and Risk of Skin Cancer:
An 11-Year Prospective Study. Nutr Cancer
67(7):1049-55.
Mongkolkul P, Rodart P, Pipatthitikorn T, Meksut L, Sa-
Nguandeekul R. 2006. Debittering of tangerine citrus
Reticulata blanco juice by β-cyclodextrin polymer.
Journal of inclusion phenomena and macrocyclic
chemistry 56(1-2):167-70.
Moon J-K, Shibamoto T. 2009. Antioxidant assays for plant
and food components. Journal of agricultural and
food chemistry 57(5):1655-66.
Moreira PI, Honda K, Liu Q, Santos MS, Oliveira CR, Aliev
G, Nunomura A, Zhu X, Smith MA, Perry G. 2005.

178
Oxidative stress: the old enemy in Alzheimer's
disease pathophysiology. Current Alzheimer Research
2(4):403-8.
Morel I, Lescoat G, Cogrel P, Sergent O, Pasdeloup N,
Brissot P, Cillard P, Cillard J. 1993. Antioxidant
and iron-chelating activities of the flavonoids
catechin, quercetin and diosmetin on iron-loaded rat
hepatocyte cultures. Biochemical pharmacology
45(1):13-9.
MORONEY MA, Alcaraz M, Forder R, Carey F, Hoult J. 1988.
Selectivity of neutrophil 5‐lipoxygenase and cyclo‐oxygenase inhibition by an anti‐inflammatory flavonoid glycoside and related aglycone flavonoids.
Journal of Pharmacy and Pharmacology 40(11):787-92.
Mukherjee A, Sengupta S. 2013. Characterization of
nimbidiol as a potent intestinal disaccharidase and
glucoamylase inhibitor present in Azadirachta indica
(neem) useful for the treatment of diabetes. Journal
of enzyme inhibition and medicinal chemistry
28(5):900-10.
Mukherjee AB, Zhang Z, Chilton BS. 2007. Uteroglobin: a
steroid-inducible immunomodulatory protein that
founded the Secretoglobin superfamily. Endocrine
reviews 28(7):707-25.
Müller L, Fattore E, Benfenati E. 1997. Determination of
aromatic amines by solid-phase microextraction and
gas chromatography–mass spectrometry in water
samples. Journal of chromatography A 791(1):221-30.
Myers KP, Sclafani A. 2003. Conditioned acceptance and
preference but not altered taste reactivity
responses to bitter and sour flavors paired with
intragastric glucose infusion. Physiol Behav
78(2):173-83.
Naczk M, Grant S, Zadernowski R, Barre E. 2006. Protein
precipitating capacity of phenolics of wild
blueberry leaves and fruits. Food Chemistry
96(4):640-7.
Nahak G, Sahu RK. 2010. In vitro antioxidative acitivity
of Azadirachta indica and Melia azedarach Leaves by
DPPH scavenging assay. Nat Sci 8(4):22-8.
Nathan SS, Kalaivani K, Murugan K. 2005. Effects of neem
limonoids on the malaria vector Anopheles stephensi
Liston (Diptera: Culicidae). Acta tropica 96(1):47-
55.
Nijveldt RJ, Van Nood E, Van Hoorn DE, Boelens PG, Van
Norren K, Van Leeuwen PA. 2001. Flavonoids: a review
of probable mechanisms of action and potential
applications. The American journal of clinical
nutrition 74(4):418-25.
Nomura T, Kikuchi M, Kubodera A, Kawakami Y. 1997. Proton‐donative antioxidant activity of fucoxanthin with 1,

179
1‐diphenyl‐2‐picrylhydrazyl (DPPH). IUBMB Life 42(2):361-70.
Noroozi M, Angerson WJ, Lean M. 1998. Effects of
flavonoids and vitamin C on oxidative DNA damage to
human lymphocytes. The American journal of clinical
nutrition 67(6):1210-8.
Nuutila A, Kammiovirta K, Oksman-Caldentey K-M. 2002.
Comparison of methods for the hydrolysis of
flavonoids and phenolic acids from onion and spinach
for HPLC analysis. Food Chemistry 76(4):519-25.
Odalo JO, Omolo MO, Malebo H, Angira J, Njeru PM, Ndiege
IO, Hassanali A. 2005. Repellency of essential oils
of some plants from the Kenyan coast against
Anopheles gambiae. Acta tropica 95(3):210-8.
Ooh K-F, Ong H-C, Wong F-C, Chai T-T. 2015. HPLC
PROFILING OF PHENOLIC ACIDS AND FLAVONOIDS AND
EVALUATION OF ANTI-LIPOXYGENASE AND ANTIOXIDANT
ACTIVITIES OF AQUATIC VEGETABLE LIMNOCHARIS FLAVA.
Acta poloniae pharmaceutica 72(5):973-9.
Oosterhaven K, Poolman B, Smid E. 1995. S-carvone as a
natural potato sprout inhibiting, fungistatic and
bacteristatic compound. Industrial Crops and
Products 4(1):23-31.
Oyama Y, Fuchs PA, Katayama N, Noda K. 1994. Myricetin
and quercetin, the flavonoid constituents ofGinkgo
biloba extract, greatly reduce oxidative metabolism
in both resting and Ca2+-loaded brain neurons. Brain
research 635(1-2):125-9.
Pacher P, Nivorozhkin A, Szabó C. 2006. Therapeutic
effects of xanthine oxidase inhibitors: renaissance
half a century after the discovery of allopurinol.
Pharmacological reviews 58(1):87-114.
Pandey G, Verma K, Singh M. 2014. Evaluation of
phytochemical, antibacterial and free radical
scavenging properties of Azadirachta indica (neem)
leaves. Int. J. Pharm. Pharm. Sci 6(2):444-7.
Parida M, Upadhyay C, Pandya G, Jana A. 2002. Inhibitory
potential of neem (Azadirachta indica Juss) leaves
on dengue virus type-2 replication. Journal of
ethnopharmacology 79(2):273-8.
Park JB. 1999. Flavonoids are potential inhibitors of
glucose uptake in U937 cells. Biochemical and
biophysical research communications 260(2):568-74.
Pathak P, Krishna S. 1991. Postembryonic development and
reproduction inCorcyra cephalonica
(Stainton)(Lepidoptera: Pyralidae) on exposure to
eucalyptus and neem oil volatiles. Journal of
chemical ecology 17(12):2553-8.
Pavanato A, Tuñón MJ, Sánchez-Campos S, Marroni CA,
Llesuy S, González-Gallego J, Marroni N. 2003.
Effects of quercetin on liver damage in rats with

180
carbon tetrachloride-induced cirrhosis. Digestive
diseases and sciences 48(4):824-9.
Paz-Elizur T, Sevilya Z, Leitner-Dagan Y, Elinger D,
Roisman LC, Livneh Z. 2008. DNA repair of oxidative
DNA damage in human carcinogenesis: potential
application for cancer risk assessment and
prevention. Cancer letters 266(1):60-72.
Perez JL, Jayaprakasha GK, Cadena A, Martinez E, Ahmad H,
Patil BS. 2010. In vivo induction of phase II
detoxifying enzymes, glutathione transferase and
quinone reductase by citrus triterpenoids. BMC
complementary and alternative medicine 10(1):51.
Perez-Gutierrez RM, Damian-Guzman M. 2012a. Meliacinolin:
a potent alpha-glucosidase and alpha-amylase
inhibitor isolated from Azadirachta indica leaves
and in vivo antidiabetic property in streptozotocin-
nicotinamide-induced type 2 diabetes in mice.
Biological & pharmaceutical bulletin 35(9):1516-24.
Perez-Gutierrez RM, Damian-Guzman M. 2012b. Meliacinolin:
a potent α-glucosidase and α-amylase inhibitor
isolated from Azadirachta indica leaves and in vivo
antidiabetic property in streptozotocin-
nicotinamide-induced type 2 diabetes in mice.
Biological and Pharmaceutical Bulletin 35(9):1516-
24.
Pietta P-G. 2000. Flavonoids as antioxidants. Journal of
natural products 63(7):1035-42.
Ponnusamy S, Haldar S, Mulani F, Zinjarde S, Thulasiram
H, RaviKumar A. 2015. Gedunin and Azadiradione:
Human Pancreatic Alpha-Amylase Inhibiting Limonoids
from Neem (Azadirachta indica) as Anti-Diabetic
Agents. PloS one 10(10):e0140113.
Popp P, Paschke A. 1997. Solid phase microextraction of
volatile organic compounds using carboxen-
polydimethylsiloxane fibers. Chromatographia 46(7-
8):419-24.
Poulose SM, Harris ED, Patil BS. 2006. Antiproliferative
effects of citrus limonoids against human
neuroblastoma and colonic adenocarcinoma cells.
Nutrition and cancer 56(1):103-12.
Pragst F, Auwaerter V, Sporkert F, Spiegel K. 2001.
Analysis of fatty acid ethyl esters in hair as
possible markers of chronically elevated alcohol
consumption by headspace solid-phase microextraction
(HS-SPME) and gas chromatography-mass spectrometry
(GC-MS). Forensic Science International 121(1):76-
88.
Preedy V, Reilly M, Mantle D, Peters T. 1998. Free
radicals and antioxidants in the pathogenesis of
alcoholic myopathy. Oxidative Stress in Skeletal
Muscle: Springer. p. 283-93.

181
Prigent SV, Gruppen H, Visser AJ, Van Koningsveld GA, De
Jong GA, Voragen AG. 2003. Effects of non-covalent
interactions with 5-O-caffeoylquinic acid
(chlorogenic acid) on the heat denaturation and
solubility of globular proteins. J Agric Food Chem
51(17):5088-95.
Psillakis E, Kalogerakis N. 2001. Application of solvent
microextraction to the analysis of nitroaromatic
explosives in water samples. Journal of
Chromatography A 907(1):211-9.
Pulido R, Bravo L, Saura-Calixto F. 2000. Antioxidant
activity of dietary polyphenols as determined by a
modified ferric reducing/antioxidant power assay.
Journal of agricultural and food chemistry
48(8):3396-402.
Puri M, Marwaha S, Kothari R, Kennedy J. 1996.
Biochemical basis of bitterness in citrus fruit
juices and biotech approaches for debittering.
Critical reviews in biotechnology 16(2):145-55.
Qiao-Hui D, ZHANG Q-Y, Ting H, JIANG Y-P, Cheng P, Hai-
Liang X. 2016. Dynamic changes of flavonoids in
Actinidia valvata leaves at different growing stages
measured by HPLC-MS/MS. Chinese journal of natural
medicines 14(1):66-72.
Raghavendra SS, Balsaraf KD. 2014. Antifungal efficacy of
Azadirachta indica (neem)-An in vitro study.
Brazilian Journal of Oral Sciences 13(3):242-5.
Raghuvanshi P, Bagga R, Malhotra D, Gopalan S, Talwar GP.
2001. Spermicidal & contraceptive properties of
Praneem polyherbal pessary. The Indian journal of
medical research 113:135-41.
Rahman AS, Chowdhury AA, Ali H-A, Raihan SZ, Ali MS,
Nahar L, Sarker SD. 2009. Antibacterial activity of
two limonoids from Swietenia mahagoni against
multiple-drug-resistant (MDR) bacterial strains.
Journal of natural medicines 63(1):41-5.
Rains JL, Jain SK. 2011. Oxidative stress, insulin
signaling, and diabetes. Free Radical Biology and
Medicine 50(5):567-75.
Ratledge C, Wilkinson S. 1988. Microbial lipids, vol. 1.
Academic Presss, London.
Rattanachaikunsopon P, Phumkhachorn P. 2010. Contents and
antibacterial activity of flavonoids extracted from
leaves of Psidium guajava. Journal of Medicinal
Plants Research 4(5):393-6.
Ray A, Banerjee B, Sen P. 1996. Modulation of humoral and
cell-mediated immune responses by Azadirachta indica
(Neem) in mice. Indian journal of experimental
biology 34:698-701.
Reto M, Figueira ME, Filipe HM, Almeida CM. 2007.
Analysis of vitamin K in green tea leafs and

182
infusions by SPME–GC-FID. Food chemistry 100(1):405-
11.
Ribeiro MH, Silveira D, Ferreira-Dias S. 2002. Selective
adsorption of limonin and naringin from orange juice
to natural and synthetic adsorbents. European Food
Research and Technology 215(6):462-71.
Riblett AL, Herald TJ, Schmidt KA, Tilley KA. 2001.
Characterization of β-conglycinin and glycinin soy
protein fractions from four selected soybean
genotypes. Journal of Agricultural and food
chemistry 49(10):4983-9.
Richardson N, MacFie H, Shepherd R. 1994. Consumer
attitudes to meat eating. Meat Science 36(1-2):57-
65.
Richelle M, Tavazzi I, Offord E. 2001. Comparison of the
antioxidant activity of commonly consumed
polyphenolic beverages (coffee, cocoa, and tea)
prepared per cup serving. Journal of Agricultural
and Food Chemistry 49(7):3438-42.
Romagnolo DF, Selmin OI. 2012. Flavonoids and cancer
prevention: a review of the evidence. Journal of
nutrition in gerontology and geriatrics 31(3):206-
38.
Routray W, Orsat V. 2012. Microwave-assisted extraction
of flavonoids: a review. Food and Bioprocess
Technology 5(2):409-24.
Roy A, Saraf S. 2006. Limonoids: overview of significant
bioactive triterpenes distributed in plants kingdom.
Biological and Pharmaceutical Bulletin 29(2):191-
201.
Roy MK, Kobori M, Takenaka M, Nakahara K, Shinmoto H,
Isobe S, Tsushida T. 2007. Antiproliferative effect
on human cancer cell lines after treatment with
nimbolide extracted from an edible part of the neem
tree (Azadirachta indica). Phytotherapy Research
21(3):245-50.
Ryan L, Petit S. 2010. Addition of whole, semiskimmed,
and skimmed bovine milk reduces the total
antioxidant capacity of black tea. Nutrition
Research 30(1):14-20.
Ryan L, Sutherland S. 2011. Comparison of the effects of
different types of soya milk on the total
antioxidant capacity of black tea infusions. Food
Research International 44(9):3115-7.
Sahu A, Kasoju N, Bora U. 2008. Fluorescence study of the
curcumin− casein micelle complexation and its
application as a drug nanocarrier to cancer cells.
Biomacromolecules 9(10):2905-12.
SaiRam M, Ilavazhagan G, Sharma SK, Dhanraj SA, Suresh B,
Parida MM, Jana AM, Devendra K, Selvamurthy W. 2000.
Anti-microbial activity of a new vaginal

183
contraceptive NIM-76 from neem oil (Azadirachta
indica). Journal of ethnopharmacology 71(3):377-82.
Sakakibara H, Honda Y, Nakagawa S, Ashida H, Kanazawa K.
2003. Simultaneous determination of all polyphenols
in vegetables, fruits, and teas. Journal of
Agricultural and Food Chemistry 51(3):571-81.
Sakihama Y, Cohen MF, Grace SC, Yamasaki H. 2002. Plant
phenolic antioxidant and prooxidant activities:
phenolics-induced oxidative damage mediated by
metals in plants. Toxicology 177(1):67-80.
Sánchez-González L, Pastor C, Vargas M, Chiralt A,
González-Martínez C, Cháfer M. 2011. Effect of
hydroxypropylmethylcellulose and chitosan coatings
with and without bergamot essential oil on quality
and safety of cold-stored grapes. Postharvest
Biology and Technology 60(1):57-63.
Sastry MS, Rao MN. 1990. Binding of chlorogenic acid by
the isolated polyphenol-free 11 S protein of
sunflower (Helianthus annuus) seed. Journal of
agricultural and food chemistry 38(12):2103-10.
Schmutterer H. 1990. Properties and potential of natural
pesticides from the neem tree, Azadirachta indica.
Annual review of entomology 35(1):271-97.
Schumacher M, Cerella C, Reuter S, Dicato M, Diederich M.
2011. Anti-inflammatory, pro-apoptotic, and anti-
proliferative effects of a methanolic neem
(Azadirachta indica) leaf extract are mediated via
modulation of the nuclear factor-κB pathway. Genes &
nutrition 6(2):149-60.
Serafini M, Ghiselli A, Ferro-Luzzi A. 1996. In vivo
antioxidant effect of green and black tea in man.
European journal of clinical nutrition 50(1):28-32.
Serafini M, Testa MF, Villaño D, Pecorari M, van Wieren
K, Azzini E, Brambilla A, Maiani G. 2009.
Antioxidant activity of blueberry fruit is impaired
by association with milk. Free Radical Biology and
Medicine 46(6):769-74.
Sestili P, Guidarelli A, Dachà M, Cantoni O. 1998.
Quercetin prevents DNA single strand breakage and
cytotoxicity caused by tert-butylhydroperoxide: free
radical scavenging versus iron chelating mechanism.
Free Radical Biology and Medicine 25(2):196-200.
Setzer WN. 2009. Essential oils and anxiolytic
aromatherapy. Natural product communications
4(9):1305-16.
Shahrzad S, Bitsch I. 1996. Determination of some
pharmacologically active phenolic acids in juices by
high-performance liquid chromatography. Journal of
Chromatography A 741(2):223-31.

184
Sharma V, Kumar HV, Rao LJM. 2008. Influence of milk and
sugar on antioxidant potential of black tea. Food
Research International 41(2):124-9.
Shaw PE, Buslig BS. 1986. Selective removal of bitter
compounds from grapefruit juice and from aqueous
solution with cyclodextrin polymers and with
Amberlite XAD-4. Journal of Agricultural and Food
Chemistry 34(5):837-40.
Shaw PE, Tatum JH, Wilson III CW. 1984. Improved flavor
of navel orange and grapefruit juices by removal of
bitter components with. beta.-cyclodextrin polymer.
Journal of Agricultural and Food Chemistry
32(4):832-6.
SHAW PE, WILSON CW. 1985. Reduction of Bitterness in
Grapefruit Juice with β‐Cyclodextrin Polymer in a
Continuous‐Flow Process. Journal of Food Science 50(4):1205-7.
Shimizu S, Shibata H, Karasawa De, Kozaki T. 1990.
Carvyl-and dihydrocarvyl-β-D-glucosides in spearmint
(Studies on terpene glycosides in Mentha plants,
Part II). Journal of Essential Oil Research 2(2):81-
6.
Shin M-G, Lee G-H. 2015. Optimization of Encapsulation
Conditions for Fermented Red Ginseng Extracts by
Using Cyclodextrin. Journal of the Korean Society of
Food Science and Nutrition 44(11):1708-14.
Sigge G, Hansmann C, Joubert E. 2001. Effect of storage
conditions, packaging material and metabisulphite
treatment on the color of dehydrated green bell
peppers (Capsicum annuum L.). Journal of Food
Quality 24(3):205-18.
Sikkema J, De Bont J, Poolman B. 1994. Interactions of
cyclic hydrocarbons with biological membranes.
Journal of Biological Chemistry 269(11):8022-8.
Singh M, Sharma R, Banerjee U. 2002a. Biotechnological
applications of cyclodextrins. Biotechnology
advances 20(5):341-59.
Singh N, Singh R, Bhunia A, Stroshine R. 2002b. Efficacy
of chlorine dioxide, ozone, and thyme essential oil
or a sequential washing in killing Escherichia coli
O157: H7 on lettuce and baby carrots. LWT-Food
Science and Technology 35(8):720-9.
Sirovina D, Oršolić N, Končić MZ, Kovačević G, Benković
V, Gregorović G. 2013. Quercetin vs chrysin Effect
on liver histopathology in diabetic mice. Human &
experimental toxicology:0960327112472993.
Skandamis P, Nychas GJ. 2001. Effect of oregano essential
oil on microbiological and physico‐chemical attributes of minced meat stored in air and modified
atmospheres. Journal of Applied Microbiology
91(6):1011-22.

185
Smith DA, Banks SW. 1986. Biosynthesis, elicitation and
biological activity of isoflavonoid phytoalexins.
Phytochemistry 25(5):979-95.
Stadler RH, Fay LB. 1995. Antioxidative reactions of
caffeine: formation of 8-oxocaffeine (1, 3, 7-
trimethyluric acid) in coffee subjected to oxidative
stress. Journal of Agricultural and Food Chemistry
43(5):1332-8.
Stein LJ, Nagai H, Nakagawa M, Beauchamp GK. 2003.
Effects of repeated exposure and health-related
information on hedonic evaluation and acceptance of
a bitter beverage. Appetite 40(2):119-29.
Stinco CM, Fernández-Vázquez R, Hernanz D, Heredia FJ,
Meléndez-Martínez AJ, Vicario IM. 2013. Industrial
orange juice debittering: Impact on bioactive
compounds and nutritional value. Journal of Food
Engineering 116(1):155-61.
Stojadinovic M, Radosavljevic J, Ognjenovic J, Vesic J,
Prodic I, Stanic-Vucinic D, Velickovic TC. 2013.
Binding affinity between dietary polyphenols and β-
lactoglobulin negatively correlates with the protein
susceptibility to digestion and total antioxidant
activity of complexes formed. Food chemistry
136(3):1263-71.
Subapriya R, Nagini S. 2003. Ethanolic neem leaf extract
protects against N-methyl-N'-nitro-N-
nitrosoguanidine-induced gastric carcinogenesis in
Wistar rats. Asian Pacific Journal of Cancer
Prevention 4(3):215-24.
Subapriya R, Nagini S. 2005. Medicinal properties of neem
leaves: a review. Current medicinal chemistry. Anti-
cancer agents 5(2):149-6.
Sukumar K, Perich MJ, Boobar L. 1991. Botanical
derivatives in mosquito control: a review. Journal
of the American Mosquito Control Association
7(2):210-37.
Szejtli J. 1998. Introduction and general overview of
cyclodextrin chemistry. Chemical reviews 98(5):1743-
54.
Szejtli J, Szente L. 2005. Elimination of bitter,
disgusting tastes of drugs and foods by
cyclodextrins. European Journal of pharmaceutics and
biopharmaceutics 61(3):115-25.
Taylor D. 1984. The chemistry of the limonoids from
Meliaceae. Fortschritte der Chemie organischer
Naturstoffe/Progress in the Chemistry of Organic
Natural Products: Springer. p. 1-102.
Thaipong K, Boonprakob U, Crosby K, Cisneros-Zevallos L,
Byrne DH. 2006. Comparison of ABTS, DPPH, FRAP, and
ORAC assays for estimating antioxidant activity from

186
guava fruit extracts. Journal of food composition
and analysis 19(6):669-75.
Tiwari V, Darmani NA, Yue BY, Shukla D. 2010. In vitro
antiviral activity of neem (Azardirachta indica L.)
bark extract against herpes simplex virus type‐1 infection. Phytotherapy Research 24(8):1132-40.
Tomás-Barberán FA, Gil MI, Cremin P, Waterhouse AL, Hess-
Pierce B, Kader AA. 2001. HPLC-DAD-ESIMS analysis of
phenolic compounds in nectarines, peaches, and
plums. Journal of Agricultural and Food Chemistry
49(10):4748-60.
Tsai P-J, She C-H. 2006. Significance of phenol-protein
interactions in modifying the antioxidant capacity
of peas. Journal of agricultural and food chemistry
54(22):8491-4.
Tsigarida E, Skandamis P, Nychas GJ. 2000. Behaviour of
Listeria monocytogenes and autochthonous flora on
meat stored under aerobic, vacuum and modified
atmosphere packaging conditions with or without the
presence of oregano essential oil at 5 C. Journal of
Applied Microbiology 89(6):901-9.
Tsimogiannis D, Samiotaki M, Panayotou G, Oreopoulou V.
2007. Characterization of flavonoid subgroups and
hydroxy substitution by HPLC-MS/MS. Molecules
12(3):593-606.
Tunón H, Thorsell W, Mikiver A, Malander I. 2006.
Arthropod repellency, especially tick (Ixodes
ricinus), exerted by extract from Artemisia
abrotanum and essential oil from flowers of Dianthus
caryophyllum. Fitoterapia 77(4):257-61.
Tuorila H, Cardello AV. 2002. Consumer responses to an
off-flavor in juice in the presence of specific
health claims. Food Quality and Preference
13(7):561-9.
Ultee A, Bennik M, Moezelaar R. 2002. The phenolic
hydroxyl group of carvacrol is essential for action
against the food-borne pathogen Bacillus cereus.
Applied and environmental microbiology 68(4):1561-8.
Urala N, Lähteenmäki L. 2003. Reasons behind consumers'
functional food choices. Nutrition & Food Science
33(4):148-58.
Urala N, Lähteenmäki L. 2004. Attitudes behind consumers'
willingness to use functional foods. Food Quality
and Preference 15(7):793-803.
Vaara M. 1992. Agents that increase the permeability of
the outer membrane. Microbiological reviews
56(3):395-411.
Vaks B, Lifshitz A. 1981. Debittering of orange juice by
bacteria which degrade limonin. Journal of
Agricultural and Food Chemistry 29(6):1258-61.

187
Van Houten B, Woshner V, Santos JH. 2006. Role of
mitochondrial DNA in toxic responses to oxidative
stress. DNA repair 5(2):145-52.
Vas G, Vekey K. 2004. Solid‐phase microextraction: a powerful sample preparation tool prior to mass
spectrometric analysis. Journal of mass spectrometry
39(3):233-54.
Vázquez PP, Mughari AR, Galera MM. 2008. Solid-phase
microextraction (SPME) for the determination of
pyrethroids in cucumber and watermelon using liquid
chromatography combined with post-column
photochemically induced fluorimetry derivatization
and fluorescence detection. Analytica chimica acta
607(1):74-82.
Wang H, Helliwell K. 2001. Determination of flavonols in
green and black tea leaves and green tea infusions
by high-performance liquid chromatography. Food
research international 34(2):223-7.
Wang H, Provan GJ, Helliwell K. 2003. HPLC determination
of catechins in tea leaves and tea extracts using
relative response factors. Food chemistry 81(2):307-
12.
Wardencki W, Michulec M, Curyło J. 2004. A review of
theoretical and practical aspects of solid‐phase microextraction in food analysis. International
journal of food science & technology 39(7):703-17.
Wendakoon CN, Sakaguchi M. 1995. Inhibition of amino acid
decarboxylase activity of Enterobacter aerogenes by
active components in spices. Journal of Food
Protection® 58(3):280-3.
Widmer WW. 1991. Improvements in the quantitation of
limonin in citrus juice by reversed-phase high-
performance liquid chromatography. Journal of
Agricultural and Food Chemistry 39(8):1472-6.
Wilson III CW, Wagner Jr CJ, Shaw PE. 1989. Reduction of
bitter components in grapefruit and navel orange
juices with. beta.-cyclodextrin polymers or XAD
resins in a fluidized bed process. Journal of
Agricultural and Food Chemistry 37(1):14-8.
Wu Q, Kohli M, Bergen HR, Cheville JC, Karnes RJ, Cao H,
Young CY, Tindall DJ, McNiven MA, Donkena KV. 2014.
Preclinical evaluation of the supercritical extract
of azadirachta indica (neem) leaves in vitro and in
vivo on inhibition of prostate cancer tumor growth.
Molecular cancer therapeutics 13(5):1067-77.
Xia J, Gao J, Inagaki Y, Kokudo N, Nakata M, Tang W.
2013. Flavonoids as potential anti-hepatocellular
carcinoma agents: recent approaches using HepG2 cell
line. Drug discoveries & therapeutics 7(1):1-8.
Xiao J, Mao F, Yang F, Zhao Y, Zhang C, Yamamoto K. 2011.
Interaction of dietary polyphenols with bovine milk
188
proteins: molecular structure–affinity relationship
and influencing bioactivity aspects. Molecular
nutrition & food research 55(11):1637-45.
Xie J, Schaich K. 2014. Re-evaluation of the 2, 2-
diphenyl-1-picrylhydrazyl free radical (DPPH) assay
for antioxidant activity. Journal of agricultural
and food chemistry 62(19):4251-60.
Yao LH, Jiang Y, SHI J, Tomas-Barberan F, Datta N,
Singanusong R, Chen S. 2004. Flavonoids in food and
their health benefits. Plant foods for human
nutrition 59(3):113-22.
Yassa N, Masoomi F, Rankouhi SR, Hadjiakhoondi A. 2015.
Chemical composition and antioxidant activity of the
extract and essential oil of Rosa damascena from
Iran, population of Guilan. DARU Journal of
Pharmaceutical Sciences 17(3):175-80.
Ye J, Fan F, Xu X, Liang Y. 2013. Interactions of black
and green tea polyphenols with whole milk. Food
research international 53(1):449-55.
Yen GC, Duh PD. 1994. Scavenging effect of methanolic
extracts of peanut hulls on free-radical and active-
oxygen species. Journal of Agricultural and Food
Chemistry 42(3):629-32.
Young V. 1991. Soy protein in relation to human protein
and amino acid nutrition. Journal of the American
Dietetic Association 91(7):828-35.
Yu J, Wang L, Walzem RL, Miller EG, Pike LM, Patil BS.
2005. Antioxidant activity of citrus limonoids,
flavonoids, and coumarins. Journal of agricultural
and food chemistry 53(6):2009-14.
Yuksel Z, Avci E, Erdem YK. 2010. Characterization of
binding interactions between green tea flavanoids
and milk proteins. Food Chemistry 121(2):450-6.
Zeringue H, Bhatnagar D. 1994. Effects of neem leaf
volatiles on submerged cultures of aflatoxigenic
Aspergillus parasiticus. Applied and environmental
microbiology 60(10):3543-7.
Zhang H, Wang X, Chen F, Androulakis XM, Wargovich MJ.
2007. Anticancer activity of limonoid from Khaya
senegalensis. Phytotherapy Research 21(8):731-4.
Zhao C, Li C, Liu S, Yang L. 2014. The galloyl catechins
contributing to main antioxidant capacity of tea
made from Camellia sinensis in China. The Scientific
World Journal 2014.
Zuo Y, Chen H, Deng Y. 2002. Simultaneous determination
of catechins, caffeine and gallic acids in green,
Oolong, black and pu-erh teas using HPLC with a
photodiode array detector. Talanta 57(2):307-16.
Zygadlo J, Juliani H, Majundar D, Govil J, Singh V. 2003.
Study of essential oil composition of aromatic

189
plants from Argentina. Recent progress in medicinal
plants 8:273-93.
190
VITA
Abhinandya Datta was born in Kolkata, India on 17th
January, 1987. He earned his Bachelor of Science degree
in Biochemistry at Rama Krishna mission Vivekananda
College, University of Madras, India in 2008. He
continued his graduate study in Biochemistry by pursuing
a Master of Science degree in Medical Biochemistry at
Manipal University, Karnataka, India. He graduated from
this course in 2011. In the fall of 2011, he joined the
Ph.D. program in the department of Food Science at the
University of Missouri, Columbia. He received his
doctoral degree in 2014.