Copyright © 2021 the authors
Research Articles: Cellular/Molecular
Functional microstructure of CaV-mediatedcalcium signaling in the axon initial segment
https://doi.org/10.1523/JNEUROSCI.2843-20.2021
Cite as: J. Neurosci 2021; 10.1523/JNEUROSCI.2843-20.2021
Received: 10 November 2020Revised: 15 February 2021Accepted: 9 March 2021
This Early Release article has been peer-reviewed and accepted, but has not been throughthe composition and copyediting processes. The final version may differ slightly in style orformatting and will contain links to any extended data.
Alerts: Sign up at www.jneurosci.org/alerts to receive customized email alerts when the fullyformatted version of this article is published.
1
1
2
3
Title: 4
Functional microstructure of CaV-mediated calcium signaling in the axon initial segment 5
6
Authors: 7
Anna M Lipkin1, Margaret M Cunniff1, Perry WE Spratt1, Stefan M Lemke1, Kevin J Bender1,2 8
9
Affiliations: 10
1 Neuroscience Graduate Program 11
2 Department of Neurology 12
Kavli Institute for Fundamental Neuroscience 13
Weill Institute for Neurosciences 14
University of California, San Francisco 15
16
Correspondence: 17
KJB: [email protected] 18
19
2
Abstract 20
The axon initial segment (AIS) is a specialized neuronal compartment in which synaptic 21
input is converted into action potential output. This process is supported by a diverse 22
complement of sodium, potassium, and calcium channels (CaV). Different classes of sodium and 23
potassium channels are scaffolded at specific sites within the AIS, conferring unique functions, 24
but how calcium channels are functionally distributed within the AIS is unclear. Here, we utilize 25
conventional 2-photon laser scanning and diffraction-limited, high-speed spot 2-photon imaging 26
to resolve action potential-evoked calcium dynamics in the AIS with high spatiotemporal 27
resolution. In mouse layer 5 prefrontal pyramidal neurons, calcium influx was mediated by a mix 28
of CaV2 and CaV3 channels that differentially localized to discrete regions. CaV3 functionally 29
localized to produce nanodomain hotspots of calcium influx that coupled to ryanodine-sensitive 30
stores, whereas CaV2 localized to non-hotspot regions. Thus, different pools of CaVs appear to 31
play distinct roles in AIS function. 32
33
34
Significance statement 35
The axon initial segment (AIS) is the site where synaptic input is transformed into action 36
potential output. It achieves this function through a diverse complement of sodium, potassium, 37
and calcium channels (CaV). While the localization and function of sodium channels and 38
potassium channels at the AIS is well-described, less is known about the functional distribution 39
of CaVs. We used high-speed 2-photon imaging to understand activity-dependent calcium 40
dynamics in the AIS of mouse neocortical pyramidal neurons. Surprisingly, we found that 41
calcium influx occurred in two distinct domains: CaV3 generates hotspot regions of calcium 42
influx coupled to calcium stores, whereas CaV2 channels underlie diffuse calcium influx between 43
hotspots. Therefore, different CaV classes localize to distinct AIS subdomains, possibly 44
regulating distinct cellular processes. 45
46
3
Introduction 47
Voltage-gated calcium channels (CaVs) occupy a unique functional niche in neurons, 48
affecting both electrical signaling across the membrane and initiating intracellular cascades that 49
regulate ion channel function, cellular processes, and gene expression. CaVs are distributed 50
broadly across somatodendritic and axonal compartments, but only recently have we come to 51
appreciate their role at the intersection of these two compartments, the axon initial segment 52
(AIS). The AIS is enriched with sodium and potassium channels scaffolded by a complex 53
intracellular skeleton and can be a site for specialized inhibitory synaptic input (Bender and 54
Trussell, 2012; Huang and Rasband, 2018; Kole and Stuart, 2012; Leterrier, 2018). Of all CaV 55
classes, low voltage-activated CaV3s appear to be most commonly expressed in the AIS. AIS 56
CaV3 channels were first shown to regulate the threshold and timing of APs in auditory 57
brainstem cartwheel interneurons, somatosensory cortex pyramidal cells, and cerebellar 58
Purkinje cells (Bender and Trussell, 2009; Bender et al., 2012). AIS-localized CaV3 channels 59
have also been identified at the AIS of cells in avian brainstem and murine cerebellum, 60
hippocampus, and frontal cortex (Clarkson et al., 2017; Dumenieu et al., 2018; Fukaya et al., 61
2018; Hu and Bean, 2018; Jing et al., 2018; Martinello et al., 2015). In many of these cells, CaV3 62
channels appear to be interspersed in the AIS with other CaV classes. This diversity is most 63
apparent in neocortical pyramidal cells, where calcium influx has been reported to be mediated 64
by a range of channel types, including CaV1, members of the CaV2 family, and CaV3 (Clarkson 65
et al., 2017; Hanemaaijer et al., 2020; Yu et al., 2010). 66
Across neuronal compartments, the spatial organization of CaVs shapes function by 67
linking spatially-restricted calcium influx to nearby calcium-sensitive processes. In 68
somatodendritic compartments, coupling of CaVs to calcium-activated potassium channels 69
regulates action potential (AP) dynamics (Bock and Stuart, 2016; Irie and Trussell, 2017), EPSP 70
amplitude and summation (Chen-Engerer et al., 2019; Wang et al., 2014), and calcium influx 71
(Jones and Stuart, 2013). In the soma, calcium influx through CaV1 channels influences activity-72
dependent transcription by nuclear transcription factors through activation of CREB via CaMKII 73
(Wheeler et al., 2012). And in axon terminals, the density and spatial arrangement of CaVs 74
relative to neurotransmitter release machinery determines release probability (Rebola et al., 75
2019; Scimemi and Diamond, 2012), shaping both the dynamics of short-term plasticity and its 76
regulation by neuromodulators (Bucurenciu et al., 2008; Burke et al., 2018; Vyleta and Jonas, 77
2014). However, the organization of CaVs within the AIS, and how they interact with calcium 78
sensitive signaling pathways, remains unclear. 79
4
The AIS serves multiple roles, acting both as a site of electrogenesis for APs as well as 80
a diffusion barrier between somatodendritic and axonal compartments (Bender and Trussell, 81
2012; Leterrier and Dargent, 2014). These functions are supported by a complex scaffold of 82
intracellular and membrane-bound proteins. Rings of actin connected by spectrins occur 83
periodically along the AIS, forming a scaffold for ankyrin-G to bind and anchor voltage-gated 84
sodium channels (NaV) and voltage-gated potassium (KV) KV7 channels (Leterrier, 2018). KV1.1 85
and KV1.2 are anchored by a complex that includes PSD-93 the paranodal protein Caspr and 86
typically cluster at actin rings (Ogawa and Rasband, 2008; Pinatel et al., 2017). KV2.1 channels 87
are found at yet another clustering domain enriched with the scaffolding protein gephyrin (King 88
et al., 2014). In neocortical pyramidal cells, these gephyrin-rich sites are punctate, occupying 89
small gaps in an otherwise continuous sheath of NaV-rich membrane. It is here that chandelier 90
cells form GABAergic synapses at the AIS (Inan and Anderson, 2014). Furthermore, a 91
specialized endoplasmic reticulum, termed the cisternal organelle, abuts these gephyrin-rich 92
regions. These cisternal organelles express ryanodine receptors (RyRs) (King et al., 2014), 93
which mediate calcium-induced calcium release from intracellular stores. Interestingly, we have 94
previously shown that RyR-dependent signaling is necessary for dopaminergic signaling 95
cascades that regulate AIS CaV3 function (Yang et al., 2016), but the local calcium source that 96
evokes calcium-induced-calcium-release at these sites has not been identified. Given the 97
differential distribution of other ion channel classes in the AIS (Lorincz and Nusser, 2008), we 98
hypothesized that a unique complement of CaVs may be localized to these regions and engage 99
RyRs. 100
Here, we developed diffraction-limited, high-frequency 2-photon imaging techniques to 101
explore the functional microstructure of AP-evoked calcium signaling in mouse prefrontal 102
pyramidal cell initial segments. We found that calcium influx occurred during AP repolarization, 103
and was distinct from sodium influx occurring during the rising phase of the AP (Filipis and 104
Canepari, 2021; Pressler and Strowbridge, 2019) but see (Hanemaaijer et al., 2020). Calcium 105
influx was mediated by a mix of CaV2.1, 2.2, 2.3 and CaV3-type calcium channels that were 106
distributed into distinct functional domains. In some regions, micron-wide “hotspots” of fast, 107
high-amplitude calcium influx occurred. These hotspots were dominated by CaV3-mediated 108
calcium influx, whereas non-hotspot regions were dominated by CaV2.1/2.2-mediated influx. 109
Furthermore, CaV3 channels were preferentially linked to RyR-dependent intracellular stores, 110
suggesting that AIS CaV3 channels, commonly expressed in many neuronal classes, are 111
complexed in pyramidal cells to regions associated with GABAergic synaptic transmission. 112
Thus, CaVs may play distinct roles in different subcompartments within the AIS. 113
6
METHODS 115
116
Ex vivo electrophysiological recordings. 117
All experiments were performed in accordance with guidelines set by the University of 118
California Animal Care and Use Committee. C57Bl/6 mice of both sexes aged P20 through P30 119
were anesthetized and 250 μm coronal sections containing medial prefrontal cortex were 120
collected. Cutting solution contained, in mM: 87 NaCl, 25 NaHCO3, 25 glucose, 75 sucrose, 2.5 121
KCl, 1.25 NaH2PO4, 0.5 CaCl2, and 7 MgCl2, bubbled with 5% CO2/95% O2. After cutting, slices 122
were incubated in the same solution for 30 min at 33°C, then at room temperature until 123
recording. Recording solution contained, in mM: 125 NaCl, 2.5 KCl, 2 CaCl2, 1 MgCl2, 25 124
NaHCO3, 1.25 NaH2PO4, and 25 glucose, bubbled with 5% CO2/95% O2. Recordings were done 125
at 32-34°C, with the exception of SBFI and Fluo4ff experiments, which were performed at room 126
temperature (22°C). Osmolarity of the recording solution was adjusted to ~310 mOsm. 127
Neurons were visualized using Dodt contrast optics for visually-guided whole-cell 128
recording. Patch electrodes were pulled from Schott 8250 glass (3-4 MΩ tip resistance) and 129
filled with a solution containing, in mM: 113 K-gluconate, 9 HEPES, 4.5 MgCl2, 14 Tris2-130
phoshocreatine, 4 Na2-ATP, 0.3 Tris-GTP, ~290 mOsm, pH 7.2-7.25. Calcium buffers, volume 131
filling dyes, and calcium or sodium indicators were included in the internal solution as follows: 132
for linescan calcium imaging experiments, 250 μM Fluo-5F and 20 μM Alexa 594 were added. 133
For fast (5.3kHz) linescan sodium imaging, 2 mM SBFI, 0.1 μM EGTA, and 20 μM Alexa 594 134
were added. For fast linescan calcium imaging, 500 μM Fluo-4FF and 0.1 μM EGTA were 135
added. For calcium imaging at single diffraction limited spots, 600 μM OGB-5N, 0.1 μM EGTA 136
and 20 μM Alexa 594 were added. For pointscan sodium imaging, 500 μM ING-2 was added. 137
Electrophysiological data were acquired using a Multiclamp 700B amplifier (Molecular 138
Devices). For fast linescan experiments, data were acquired at 50 kHz and filtered at 20 kHz. 139
For all other experiments, data were acquired at 20 kHz and filtered at 10 kHz. All recordings 140
were made using a quartz electrode holder to eliminate electrode drift within the slice, enabling 141
stable imaging of diffraction-limited spots in close proximity to the recording electrode (Sutter 142
Instruments). Cells were excluded if series resistance exceeded 20 MΩ or if the series 143
resistance changed by greater than 30%. All recordings were made from Layer 5b pyramidal 144
neurons in prefrontal or primary somatosensory cortex and data were corrected for a 12 mV 145
junction potential. 146
147
148
7
Two Photon Imaging. 149
Two photon laser scanning microscopy (2PLSM) was performed as described previously 150
(Bender and Trussell, 2009). A Coherent Ultra II laser was tuned to 810 nm for morphology and 151
calcium imaging and ING-2 based sodium imaging. The laser was tuned to 790 nm for SBFI-152
based imaging. Fluorescence was collected with either a 40x, 0.8 NA objective (data in Figs. 1-153
3) or a 60x, 1.0 NA objective (data in Figs. 4-6) paired with a 1.4 NA oil immersion condenser 154
(Olympus). Dichroic mirrors and band-pass filters (575 DCXR, ET525/70 m-2p, ET620/60 m-2p, 155
Chroma) were used to split fluorescence into red and green channels unless otherwise 156
specified. HA10770-40 photomultiplier tubes (PMTs, Hamamatsu) selected for >50% quantum 157
efficiency and low dark counts captured green fluorescence (Fluo-5F, Fluo-4FF). Red 158
fluorescence (AlexaFluor 594) was captured using R9110 PMTs. For ING-2 based imaging, the 159
epifluorescence filters were removed and the transfluorescence filters were replaced with a 160
single 535/150 bandpass filter (Semrock) and all fluorescence was collected on HA10770-40 161
PMTs. 162
Fluorescence data were collected either using linescan or pointscan configurations. In 163
linescan mode, the laser was repeatedly scanned over a region of axon at a rate of ~0.5 or 5.3 164
kHz. For 0.5 kHz calcium imaging, data were averaged over 20-40 trials and reported as 165
ΔG/Gsat, which was calculated as Δ(G/R)/(G/R)max*100 where G/Rmax is the maximal 166
fluorescence in saturating calcium (2 mM). For 5.3 kHz imaging, data were averaged over 50 167
trials and reported as the change in fluorescence detected by HA10770-40 PMTs (ΔG/G). In 168
pointscan mode, the laser was parked at a single diffraction-limited spot and calcium and 169
sodium influx were imaged with OGB-5N and ING-2, respectively, for 25 ms preceding and 100 170
ms following an AP. Fluorescence data were acquired at 20 kHz. Points were imaged in sets of 171
5, each sampling a single AP, spaced at 0.5 µm intervals along the visualized edge of the axon. 172
Individual points were imaged in a sequence of 2,4,1,3,5, with 2 being the point most proximal 173
to the soma. Pointscans were imaged between 2 and 35 microns from the axon hillock. 174
Individual APs within the set of 5 points were separated by 250 or 500 ms for calcium and 175
sodium imaging, respectively. Data were averaged over 20-50 repetitions and then smoothed 176
using a 40 point binomial filter in IgorPro before analysis. 177
178
Chemicals. 179
TTA-P2 was from Alomone Labs. ω-conotoxin-MVIIC, ω-conotoxin-GVIA, ω-agatoxin-180
TK, and SNX-482 were from Peptides International. Nifedipine was from Tocris. All calcium 181
channel antagonists were prepared as stock solutions in ddH20 in glass vials. Ryanodine was 182
8
from Tocris and was prepared as a stock solution (25 mM) in DMSO (0.08% final concentration 183
DMSO). Peptide toxins were applied in recording solution supplemented with 1% bovine serum 184
albumin to minimize peptide pre-absorption. Recording solution reservoirs and tubing 185
connecting the reservoir to the recording chamber were made of borosilicate glass, except for 186
30 mm lengths of Tygon tubing fed through the recirculation peristaltic pump (Ismatec Reglo). 187
Alexa Fluor 594 hydrazide Na+ salt, Fluo-5F pentapotassium salt, SBFI tetraammonium salt, 188
Fluo-4FF pentapotassium salt, and Oregon Green 488 BAPTA-5N hexapotassium salt were 189
from Invitrogen. ION NaTRIUM-Green-2 TMA+ salt (ING-2) was from Abcam. 190
191
Statistics: 192
All data are reported as medians with inter-quartile ranges in text and displayed with 193
box plots (medians, quartiles and 90% tails) or violin plots with individual data points overlaid. 194
For linescan experiments, n denotes cells. For pointscan experiments, n denotes point sets, and 195
the number of cells is reported in the text. For cells in Fig. 1-3, time-locked control cells were 196
interleaved with antagonist cells. Sample sizes were chosen based on standards in the field. No 197
assumptions were made for data distributions, and unless otherwise noted, two-sided, rank-198
based nonparametric tests were used. Significance level was set for an alpha value of 0.05, and 199
a Holm-Sidak correction was used for multiple comparisons when appropriate. Statistical 200
analysis was performed using Statview, IgorPro 8.0, and the Real Statistic Resource Pack 201
plugin for Microsoft Excel (Release 7.2). 202
203
9
RESULTS 204
While action potential-evoked CaV-mediated calcium influx has been observed in the AIS 205
of a range of cell classes, the channels that mediate such influx appear to vary from class to 206
class (Bender and Trussell, 2009; Clarkson et al., 2017; Hanemaaijer et al., 2020; Martinello et 207
al., 2015; Yu et al., 2010). To determine the relative contributions of different calcium channel 208
types during AP-evoked calcium influx in mouse prefrontal pyramidal cells, we made whole-cell 209
current-clamp recordings from layer 5 pyramidal neurons in slices prepared from mice aged 20-210
30 days old. Neurons were filled via whole cell dialysis with an internal solution containing Alexa 211
594 for morphological identification and the low-affinity calcium indicator Fluo-5F. The AIS was 212
identified by the absence of spines and its stereotyped placement opposite the apical dendrite. 213
Three action potentials (APs) were evoked by somatic current injection (1–1.5 nA, 5 ms 214
duration, 20 ms inter-AP interval), and resultant AIS calcium influx was imaged in linescan mode 215
~30 µm from the axon hillock (Fig. 1A). AP-evoked calcium transients were stable over 216
repeated linescan sets performed at time intervals used for subsequent pharmacological studies 217
(Fig. 1B, 1D-E, median normalized peak ΔG/Gsat = 92.1% of baseline, IQR = 88.4–104.4%, n = 218
38). This calcium influx was largely blocked by a cocktail of CaV antagonists that included 219
blockers of CaV2.1, CaV2.2, CaV2.3, and CaV3 channels (1 µM ω-conotoxin MVIIC, 1 µm ω-220
conotoxin GVIA, 0.2 µM agatoxin TK, 0.5 µM SNX-482, 2 µM TTA-P2) (Fig. 1B, 1D, median 221
normalized peak ΔG/Gsat = 34.6%, IQR = 22.9–48.4%, n = 7, p = 0.002). 222
Specific channel antagonists were then applied one-by-one to examine contributions 223
from individual CaV classes. Consistent with previous reports across a range of cell types 224
(Bender and Trussell, 2009; Clarkson et al., 2017; Fukaya et al., 2018; Martinello et al., 2015), 225
CaV3 channels were a substantial source of AIS calcium influx, as the specific antagonist TTA-226
P2 reduced calcium influx to 76.6% of baseline (Fig. 1C, 1E, IQR = 75.0–84.9%, n = 11, p = 227
0.002, Mann Whitney U-Test). Consistent with these results, application of 50 µM NiCl2 caused 228
a similar decrease in calcium influx (Fig. 1E, IQR = 77.5–86.9%, n = 6, p = 0.004). Additional 229
contributions were made from CaV2 channels, with the CaV2.3-preferring antagonist SNX-482 230
reducing AIS calcium influx to 77.6% of baseline (Fig. 1C, 1E, 500 nM; IQR = 72.4–88.4%, n = 231
9, p = 0.005). Application of the CaV2.1 channel antagonist ω-agatoxin-TK (200 nM) resulted in 232
variable blockade, with AIS calcium unaffected in some cells and reduced ~30% in others (Fig. 233
1E, median: 74.1% of baseline, IQR = 68.6–91.9%, n = 6, p = 0.067). The CaV2.2 antagonist ω-234
conotoxin GVIA (1 µM) had little to no effect on AIS calcium (Fig. 1E, median = 88.9%, IQR = 235
85.6–91.3%, n = 6, p = 0.137), but the dual CaV2.1/2.2 antagonist ω-conotoxin MVIIC (1 µM) 236
appeared to have an additive effect, blocking ~40% of total calcium influx (Fig. 1C, 1E, median 237
10
normalized peak ΔG/Gsat = 61.5%, IQR = 58.3–73.0%, n = 9, p = 4.03 x 10⁻⁶). The presence of 238
each of these CaV2.1/2.2 antagonists at the slice was confirmed by monitoring progressive 239
blockade of evoked EPSPs elicited by a glass bipolar stimulating electrode placed 200 µm 240
lateral to the soma in layer 5 (Table 1). Lastly, we applied the CaV1 antagonist nifedipine (10 241
µM), which had no effect on AIS calcium influx (Fig. 1E, median = 99.5%, IQR = 91.9–102.3%, 242
n = 7, p = 0.253). We observed no change in action potential peak, threshold, or half-width 243
throughout the recordings (Table 1). Together, these data indicate that AP-evoked calcium 244
influx in mouse prefrontal pyramidal cells is supported by a mix of CaV2 and CaV3 channels. 245
246
CaV3 channels couple to RyR-dependent stores at the AIS. 247
Calcium-containing cisternal organelles are found in pyramidal cell initial segments 248
throughout the neocortex (Antón-Fernández et al., 2015; Benedeczky et al., 1994; Sánchez-249
Ponce et al., 2012; Schlüter et al., 2017), but their role as a potential source of calcium during 250
APs is not well understood. These cisternal organelles localize to discrete sites within the AIS of 251
pyramidal cells (King et al., 2014; Schneider-Mizell et al., 2020) and express ryanodine 252
receptors (RyR) which gate calcium-induced calcium release (Chamberlain et al., 1984; Endo et 253
al., 1970; Van Petegem, 2012). Thus, they may boost AP-evoked calcium transients if they are 254
coupled to CaVs in the AIS. To determine whether calcium release from cisternal organelles is 255
recruited at the AIS during AP generation, we began by comparing AP-evoked calcium influx at 256
the AIS before and after ryanodine application, which at high concentrations (>10 µM) blocks 257
calcium-induced calcium release by preventing the opening of ryanodine receptors (Thomas 258
and Williams, 2012). In contrast to somatosensory cortex layer 5b pyramidal neurons, where 259
calcium stores account for ~50% of AP-evoked calcium transients (Hanemaaijer et al., 2020), 260
ryanodine (20 µM) had a more modest effect in prefrontal cortex, reducing AP-evoked calcium 261
transients to 85.4% of baseline (Fig. 2A-B, IQR = 79.2–89.4%, n = 17, p = 0.008). These RyR-262
dependent stores appear to be the sole source of intracellular calcium in the AIS, as subsequent 263
application of the SERCA-ATPase inhibitor cyclopiazonic acid (CPA, 20 µM), which completely 264
depletes calcium stores, did not lead to further decrements in AP-evoked calcium transients. 265
(Fig. 2A, 2C, ryanodine: 86.4% of baseline, IQR = 85.0–89.1%, ryanodine + CPA (30-min 266
application): 77.0% of baseline, IQR = 75.8–82.7%, n = 7, p = 0.108, Wilcoxon Signed-Rank 267
Test). This suggests that ryanodine receptors govern the majority of store-related calcium 268
release during AP activity in the AIS. 269
270
271
11
Ryanodine receptors can be coupled tightly to CaVs, either through direct physical coupling 272
or through indirect nanodomain proximity (Irie and Trussell, 2017; Johenning et al., 2015). In the 273
AIS, ryanodine-sensitive signaling is also important for D3 dopamine receptor-dependent 274
regulation of CaV3s (Yang et al., 2016). To test if RyR-dependent stores were preferentially 275
coupled to particular CaV classes present at the AIS, we performed sequential application of a 276
selective CaV antagonist followed by ryanodine (20 µM). With this approach, occlusion of any 277
ryanodine-mediated reductions in AIS calcium would suggest that the blocked CaV was the 278
source of calcium that induced subsequent RyR-dependent store release. Interestingly, we 279
found that block of CaV3 with TTA-P2 produced the clearest occlusion (Fig. 3A-B, TTA alone: 280
median = 77.6%, IQR = 74.7–85.5%, TTA plus ryanodine = 72.5%, IQR = 71.2–78.9%, n = 6, p 281
= 0.53, Wilcoxon Signed-Rank Test). Conversely, application of ryanodine after pre-application 282
of ω-conotoxin MVIIC resulted in a significant reduction in AIS calcium (Fig. 3A-B, conotoxin 283
alone: median = 65.4%, IQR = 59.7–74.3%, conotoxin plus ryanodine: median = 56.1%, IQR = 284
47.4–62.8%, n = 7, p = 0.03, Wilcoxon Signed-Rank Test). A mixed phenotype was observed 285
with CaV2.3 block by SNX-482; decrements in calcium influx after ryanodine were observed in 286
some cells, but the overall change was not significant (Fig. 3A-B, SNX alone: median = 73.8%, 287
IQR = 70.3–89.8%, SNX plus ryanodine: median = 69.8%, IQR = 52.9–87.8%, n = 7, p = 0.20, 288
Wilcoxon Signed-Rank Test). Overall, these data indicate that, of all CaV classes found in the 289
AIS, CaV3s are most likely to be in close proximity to cisternal organelles to evoke release of 290
calcium stores, though it is possible that CaV2.3s may also couple to ryanodine receptors. 291
292
Functional distribution of CaV3 and CaV2.1/2.2 in the AIS. 293
Ryanodine receptors are localized to discrete, ankyrin-G deficient regions of the AIS 294
(King et al., 2014). Given the tight association between CaV3 channels and RyR-dependent 295
release, we hypothesized that CaV3 channels may exhibit similar clustering at the functional 296
level, which could be observed using approaches for resolving nanodomain “hotspots” of 297
calcium. Such approaches have been utilized to examine discrete sites of calcium incursion at 298
presynaptic terminals using confocal microscopy entry (DiGregorio et al., 1999; Nakamura et al., 299
2015), but, to our knowledge, have not been applied at the AIS with two-photon imaging. 300
To test whether there are sites within the AIS that are hotspots for calcium entry, the 301
excitation laser was parked at one of 5 sites along the wall of the AIS membrane, each 500 nm 302
apart, and APs were evoked while imaging calcium influx at 20 kHz. Calcium influx was reported 303
with a recording solution containing the low-affinity calcium indicator Oregon Green BAPTA-5N 304
(600 µM) supplemented with the slow calcium chelator EGTA (0.1 µM) to restrict imaged signals 305
12
to sites experiencing rapid, high concentrations of calcium incursion (DiGregorio et al., 1999). 306
The derivative of these events, which corresponds to the time in which calcium fluxes through 307
channels (Sabatini and Regehr, 1999), corresponds to the rising phase of calcium transients 308
(Fig. 4C). Data were quantified by comparing isochronal influx amplitude at the peak within the 309
set of 5 points to the point (or average of points) 1 µm away on either flank. Using this 310
approach, we identified a range of responses, from small differences across all five sites, to 311
areas where certain locations had calcium incursions that were elevated relative to neighboring 312
sites. In initial experiments that averaged over 50 trials, we found that the majority of sites (46 of 313
59 sites imaged across 6 cells) fell within a normal distribution (Fig. 4D), with no appreciable 314
difference in peak calcium influx across all 5 sites. But in the remainder (13 of 59 sites across 6 315
cells; at least one site identified in each cell), calcium influx appeared to be more elevated and 316
have sharper kinetics, consistent with a hotspot for calcium entry. Indeed, calcium entry at these 317
sites was ~2x larger than in non-hotspot regions (Fig. 4E), while flanks 1 µm from the peak both 318
more proximal or more distal to the axon hillock were of comparable amplitude to non-hotspot 319
regions (Fig. 4F). 320
These hotspots may represent sites of concentrated calcium influx through CaVs or 321
reflect coupling to intracellular calcium stores. To test this, imaging was repeated (averages of 322
20 scans) in the presence of CaV3 antagonists, CaV2.1/2.2 antagonists, or with stores depleted 323
with CPA. TTA-P2 (2 µM), NiCl2 (50 µM), and conotoxin-MVIIC (1 µM) reduced overall calcium 324
influx by 33.6%, 32.6%, and 17.1%, respectively (Control median: 4.13 ΔG/Gsat, IQR: 3.19–5.60, 325
n= 61; TTA: 2.81, IQR: 2.37–3.66, n = 50; NiCl2: 3.11, IQR: 2.76–3.46, n = 28; MVIIC 2.99, IQR: 326
2.39–4.26, n = 36). Co-application of TTA-P2, NiCl2, and conotoxin-MVIIC reduced AP-evoked 327
calcium transients below the level at which we could perform hotspot analysis (data not shown; 328
average amplitude across 5 sites: 0.99 ± 0.11 G/Gsat; baseline RMS noise per site: 1.78 ± 0.16, 329
n = 29 sites over 5 cells). By contrast, CPA had no effect on peak amplitude when compared to 330
control sets acquired with identical approaches (Fig. 4G; CPA median: 3.88 IQR: 2.23–4.83, n = 331
37). This is consistent with the hypothesis that such imaging approaches using high 332
concentrations of calcium indicators supplemented with calcium buffers may uncouple CaV-333
mediated influx from intracellular stores (Collier et al., 2000). 334
To determine whether CaV3 or CaV2.1/2.2 channels preferentially contribute to hotspot 335
regions, amplitudes at the peak were compared to isochronal amplitudes 1 µm lateral for all 336
data. To determine hotspot frequency after pharmacological manipulation, hotspots were 337
defined as any set with a 1.5x difference between the peak and 1 µm lateral amplitudes. While 338
CPA had no effect on hotspot frequency, application of CaV antagonists changed hotspot 339
13
frequency dramatically. Application of TTA-P2 or NiCl2 eliminated hotspots almost entirely, 340
whereas conotoxin-MVIIC increased the fraction of observed hotspots (Fig. 4H). Taken 341
together, these data indicate that CaV3 channels are uniquely clustered in the AIS, producing 342
nanodomains of elevated calcium entry that then couple to RyR-dependent stores. These 343
regions likely account for hotspots that are eliminated upon CaV3 block. By contrast, CaV2.1/2.2 344
channels appear to reside outside of hotspots, perhaps interspersed with ankyrin-G rich regions 345
of AIS membrane. Consistent with this, hotspot frequency increases with CaV2.1/2.2 block, 346
consistent with the idea that hotspots are more easily resolved if calcium entry in non-hotspot 347
regions is attenuated (e.g., greater signal to noise for resolving hotspots over valleys in 348
between). 349
350
Temporally distinct AP-evoked sodium and calcium dynamics in the AIS 351
Imaging data above suggests that AIS calcium entry occurs during AP repolarization. 352
While this is consistent with CaV activity during APs in a range of imaging and 353
electrophysiological studies at various sites within the axon (Bischofberger et al., 2002; Díaz-354
Rojas et al., 2015; DiGregorio et al., 1999; Nakamura et al., 2015; Rowan et al., 2014), it has 355
recently been proposed that AIS calcium influx during APs is mediated by NaVs, not CaVs 356
(Hanemaaijer et al., 2020). If this is the case, then calcium and sodium influx should occur 357
simultaneously. To test this, we started by comparing AP-evoked sodium and calcium transients 358
using 5.3 kHz linescans that transected the AIS 30 µm from the hillock. Linescans were 359
collected at room temperature (22 °C) to best separate the rising and falling phase of the AP. 360
The low-affinity indicator Fluo-4FF was used for calcium imaging and the most commonly 361
utilized sodium indicator, SBFI, was used for sodium imaging. SBFI reports changes in sodium 362
concentration with a shift in emission spectra, which, with 2-photon excitation sources, is best 363
visualized as a reduction in fluorescence (Bender et al., 2010; Rose et al., 1999). Sodium and 364
calcium transients were fitted with sigmoid functions and event onset was defined as the time at 365
which the sigmoid fit first exceeded the amplitude of baseline root-mean-squared noise (RMS). 366
Similar to previous reports (Hanemaaijer et al., 2020), we found that the rising slope of sodium 367
and calcium transients were comparable (Fig. 5B, Na median = 0.07% ΔF/F per s, IQR = 0.06–368
0.08% ΔF/F per s, n = 11, Ca median = 0.07% ΔF/F per s, IQR = 0.04–0.08% ΔF/F per s, n = 9, 369
p = 0.6, Mann-Whitney); however, sodium influx typically occurred during the rising phase of the 370
AP whereas calcium influx occurred during the falling phase (relative to AP peak, Na median = -371
0.343 ms, IQR = -0.4045–0.063 ms, n = 11 cells, Ca median = 0.901 s, IQR = 0.622–1.284, n = 372
9 cells, p = 0.0007, Mann-Whitney). The mean difference in transient onset was 1.2 ms, 373
14
comparable to the duration of the rising phase of the AP in these recording conditions (median = 374
0.85 ms, IQR 0.76–0.94 ms, n = 20 cells). 375
SBFI typically reported ion influx with a higher signal-to-noise ratio than Fluo-4FF (peak 376
amplitude/baseline RMS). This alone may account for the earlier event onset for SBFI-based 377
signals. To test whether this was the case, we analyzed the subset of data in which signal-to-378
noise was comparable between sodium and calcium imaging scans (Fig. 5B). In these cases, 379
sodium influx still preceded calcium influx. Thus, these data suggest that sodium and calcium 380
influx occur through distinct mechanisms that can be separated temporally. 381
Previous work has suggested that the timing of calcium influx during an AP may shift to 382
earlier parts of the AP at high temperature, in part due to differences in gating kinetics between 383
NaVs and CaVs (Sabatini and Regehr, 1996). This would be best assayed with the temporal 384
fidelity of pointscan imaging. Unfortunately, we found the high basal fluorescence of SBFI 385
resulted in significant photo-toxicity when the laser was parked at single sites. Therefore, we 386
made use of a relatively new sodium-sensitive dye, ING-2, which reports increases in sodium 387
concentration with an increase in fluorescence intensity without a change in emission spectra 388
(Filipis and Canepari, 2021). Sodium influx was imaged in sets of 5 sites each 0.5 µm apart, as 389
done for calcium pointscan imaging. But in contrast to calcium imaging data, sodium influx did 390
not appear to occur with regions that could be defined as hotspots. Rather, data reporting the 391
relative amplitudes of the peak sodium transient relative to a neighbor 1 µm away could all be fit 392
within a normal distribution (Fig. 6B-C, Shapiro-Wilk test for normality, p = 0.36), consistent with 393
relatively constant NaV density throughout the AIS (Kole et al., 2008; Leterrier, 2018; Lorincz 394
and Nusser, 2008). 395
Similar to data obtained at 22 °C, sodium influx imaged 25-35 µm from the axon hillock 396
again preceded the peak of the AP at 32-34°C (median = -0.65 ms, IQR = -0.9625 – -0.5ms, n = 397
56 sites, 23 cells). Moreover, these events tended to precede AP onset as measured in the 398
soma (median = -0.05 ms, IQR = -0.3625–0.1 ms). This may be due in part to the conduction 399
delay between the AIS site of AP initiation and the soma (Kole et al., 2007; Rowan et al., 2014; 400
Spratt et al., 2021), and in part to subthreshold sodium influx before AP onset (Filipis and 401
Canepari, 2021). 402
Comparisons with onset kinetics of calcium transients imaged with pointscan 403
approaches again revealed marked differences between the onset of sodium and calcium entry. 404
Calcium influx was detectable 1.2 ms after sodium influx, typically during the first millisecond of 405
AP repolarization (Fig. 6D, median = 0.75, IQR =0.60–1.35 ms after AP threshold, median = 406
0.35, IQR = 0.10–0.85 ms after AP peak, n = 38 sites, 13 cells). Similar results were obtained in 407
15
conditions where CaV3 or CaV2.1/2.2 channels were blocked (TTA-P2: median = 1.1 ms, IQR = 408
0.8–1.6 ms after AP threshold, median = 0.6 ms, IQR = 0.3–1.1 ms after AP peak, n = 33 point 409
sets, 7 cells; NiCl2: 410
median = 1.1 ms, IQR = 0.5–1.7 ms after AP threshold, median = 0.63 ms, IQR = 0.13–1.3 ms 411
after AP peak, n = 28 point sets, 5 cells; ω-conotoxin MVIIC: median = 1.25 ms, IQR = 0.9625–412
1.575 ms after AP threshold, median = 0.7 ms, IQR = 0.375–1.1 ms after AP peak, n = 16 sites, 413
5 cells), and when intracellular stores were depleted with CPA (median = 0.7 ms, IQR = 0.4–414
0.9375 ms after AP threshold, median = 0.15 ms, IQR = -0.0375–0.4875 ms after AP peak, n = 415
20 point sets, 5 cells). 416
Overall, these data are most consistent with the hypothesis that CaVs are the sole 417
source of calcium influx from the extracellular space in the AIS. This contrasts with work in rat 418
somatosensory cortex (S1), where AP-evoked calcium transients were partially blocked by the 419
CaV3 antagonist TTA-P2 (1 µM at equilibrium in the extracellular solution), but, notably, not 420
affected by the CaV2 peptide antagonist ω-conotoxin MVIIC (2 µM, applied via pressure ejection 421
local to the AIS) (Hanemaaijer et al., 2020). Therefore, we tested whether mouse S1 pyramidal 422
cells differ from mouse prefrontal pyramidal cells in the expression of CaV2.1/2.2 channels in the 423
AIS by applying ω-conotoxin MVIIC (1 µM at equilibrium in the extracellular solution) to L5 424
pyramidal neurons in the somatosensory cortex, again imaging calcium influx resulting from 3 425
APs. Similar to mouse prefrontal cortex, block of CaV2.1/2.2 channels reduced peak calcium 426
influx by over 35% (Fig. 7A-B, median = 63.8%, IQR = 42.5–69.9%, n = 5; time-locked controls: 427
median = 90.9%, IQR = 79.6–95.5%, n = 5; p = 0.012, Mann Whitney U-Test). Thus, these data 428
indicate that pyramidal cells in multiple neocortical regions express a mix of CaV2 and CaV3 429
channels in their initial segments, at least in the mouse brain. 430
431
16
DISCUSSION 432
Here, we show that calcium channels are functionally distributed in distinct domains 433
within mouse prefrontal pyramidal cell initial segments. Low voltage-activated CaV3-mediated 434
calcium influx occurs in spatially restricted "hotspots" whereas high voltage-activated CaV2.1 435
and CaV2.2 channels provide a more diffuse source of calcium. CaV3-mediated hotspots 436
preferentially evoked additional calcium release from RyR-dependent intracellular stores, 437
suggesting that hotspots of CaV3-mediated influx localize to regions enriched with RyRs that are 438
also sites for GABAergic input and KV2.1 clustering (King et al., 2014). This suggests that 439
different CaV classes are functionally localized to discrete regions int the AIS. 440
441
Activity-dependent calcium sources in the AIS 442
Though AP-evoked calcium influx at the AIS is well-established (Callewaert et al., 1996; 443
Schiller et al., 1995), the sources of this calcium influx have only been investigated relatively 444
recently. These sources appear to be remarkably heterogeneous across neuronal classes and 445
species. In mouse auditory brainstem cartwheel cells, CaV3.2 and SNX-sensitive CaV2.3 446
account for ~90% of AP-evoked calcium influx, with no contributions from CaV2.1 or CaV2.2 447
(Bender and Trussell, 2009). By contrast, the first study of pyramidal cells in ferret neocortex 448
found that calcium influx was mediated by CaV2.1 and CaV2.2, but not CaV3 (Yu et al., 2010). 449
Here, we find that prefrontal pyramidal cells in mouse prefrontal cortex exhibit CaV3-mediated 450
influx, consistent with previous reports in rodent neocortex (Clarkson et al., 2017; Hanemaaijer 451
et al., 2020) and other brain regions (Gründemann and Clark, 2015; Jin et al., 2019; Martinello 452
et al., 2015). CaV2.1/2.2 and CaV2.3 were also found to contribute to calcium influx, highlighting 453
the relative complexity of calcium signaling in prefrontal pyramidal cell initial segments. 454
In addition to CaV-mediated calcium influx, we found that a small fraction of AP-evoked 455
calcium was released from ryanodine-sensitive intracellular stores in the AIS. Cisternal 456
organelles at the AIS were proposed to be involved in calcium sequestration due to their 457
expression of a calcium pump (Ca2+-ATPase) in pyramidal neurons of the hippocampus 458
(Benedeczky et al, 1994). Cisternal organelles were originally identified in the initial segments of 459
cortical principal neurons in sensory cortical regions (Benedeczky et al., 1994; Peters et al., 460
1968). In these regions, a subpopulation of layer 5 pyramidal neurons contain a giant saccular 461
organelle that extends through the entire AIS and accounts for a major fraction of AP-evoked 462
calcium signals (Antón-Fernández et al., 2015; Hanemaaijer et al., 2020; Sánchez-Ponce et al., 463
2012). Subsequent work has implicated both RyR-dependent and inositol 1,4,5-triphosphate 464
(IP3) receptor-dependent AIS-localized stores in a range of processes, including calcium influx 465
17
during APs, modulation of AIS-associated proteins, and experience-dependent structural 466
plasticity of the AIS compartment (Gomez et al., 2020; Irie and Trussell, 2017; Schlüter et al., 467
2017; Yang et al., 2016). These different effects may reflect diverse structures and functions in 468
AIS calcium stores across cell types. Conversely, different modes of calcium release from 469
intracellular stores may be recruited by different stimuli. 470
A recent study in rat somatosensory cortex layer 5b pyramidal cells found that a similar 471
fraction of AP-evoked calcium signaling was sensitive to CaV3 antagonists, whereas inhibition of 472
intracellular store calcium release reduced AP-evoked calcium transients to a far higher degree 473
than observed here, consistent with the presence of giant saccular organelle in somatosensory 474
cortical pyramidal neurons (Antón-Fernández et al., 2015; Hanemaaijer et al., 2020). Of note, 475
peptide antagonists of CaV2.x channels, puffed for 3s onto the AIS, did not affect AIS calcium 476
influx, despite almost completely blocking AP-evoked calcium signals in axonal boutons. It was 477
therefore proposed that the residual influx was through NaVs rather than CaVs, based in part on 478
the observations that influx was sensitive to NaV antagonists and that the rising kinetics of 479
sodium and calcium transients were similar (Hanemaaijer et al., 2020). Similar TTX-sensitivity 480
has been observed previously for AIS calcium transients largely blocked by subthreshold 481
depolarizations in auditory brainstem interneurons; however this sensitivity was attributed to a 482
failure to activate AIS-localized CaVs, rather than calcium influx through NaVs, as these 483
transients could be blocked completely by CaV antagonists in the absence of TTX (Bender and 484
Trussell 2009). 485
In contrast to work in rat, we observed a marked block of AP-evoked influx in mouse 486
prefrontal and somatosensory pyramidal cells from CaV2 antagonists when allowed to 487
equilibrate in the extracellular solution (Fig. 1, Fig. 7). Furthermore, we found that the kinetics of 488
sodium and calcium influx were indeed identical, but that calcium influx lagged sodium influx in 489
ways that were consistent with sodium and calcium influx occurring on the rising and falling 490
phases of the AP, respectively. These results are consistent with studies using high-speed 491
optical imaging, where sodium influx occurs during the rising phase of the AP (Filipis and 492
Canepari, 2021), whereas calcium influx occurs during the falling phase of the AP in the AIS or 493
AIS-like regions of AP initiation (Pressler and Strowbridge, 2019). Furthermore, we observed 494
consistent results at both room temperature and physiological temperatures with two different 495
sodium-sensitive indicators and two different calcium-sensitive indicators, suggesting that 496
calcium influx occurs during CaV-mediated tail currents on the falling phase of the AP in the 497
axon, regardless of temperature (Kawaguchi and Sakaba, 2015; Pressler and Strowbridge, 498
2019; Rowan et al., 2014; but see Sabatini and Regehr, 1996). Nevertheless, calcium influx, as 499
18
assayed with synthetic indicators, could not be blocked completely with CaV antagonists. This 500
may be due to several issues, including incomplete block of CaV2.3, or R-type calcium 501
channels, so named for their resistance to antagonist block. Indeed, careful pharmacological 502
studies across cell classes have shown that CaV2.3 channels in pyramidal cells are particularly 503
resistant to block by SNX-482 (Sochivko et al., 2002). Furthermore, block of CaVs by peptide 504
toxins can have relatively slow kinetics (McDonough et al., 1996), and while we made every 505
effort to allow for equilibration, with application times exceeding 20 min, this may not have been 506
sufficient for complete block. Regardless, the kinetics of AIS calcium transients, observed here 507
and in other reports (Fig. 5, Fig. 6, Pressler and Strowbridge, 2019), are most consistent with 508
influx predominantly through CaVs. 509
510
Functional compartmentalization of calcium influx within the AIS 511
In mature neocortical pyramidal cells, NaV1.6 channels cluster in the regions of the AIS 512
more distal to the soma, whereas NaV1.2 channels cluster in the region more proximal to the 513
soma (Hu et al., 2009). This subcompartmental distribution affects the integrative properties of 514
the AIS in health and disease (Hu et al., 2009; Spratt et al., 2019), and raised the question of 515
whether similar functional specializations are found in CaVs localized to the AIS. To test this, we 516
adapted spot imaging techniques used previously to observe calcium microdomains with single-517
photon sources for use with 2-photon microscopy (DiGregorio et al., 1999; Nakamura et al., 518
2015). This approach revealed that calcium influx in the AIS occurs in two domains, with 519
hotspots of calcium interspersed within regions of more consistent calcium influx (Fig. 4). These 520
calcium nanodomains are hypothesized to result from channel clustering, as isochronal calcium 521
measurements at increasing distances from the calcium source decreased in amplitude, a 522
consequence of calcium diffusing away from its entry site (DiGregorio et al., 1999). It is 523
plausible that the hotspots observed here represent points that are, by chance, closer to 524
clusters of CaVs; however, the differential pharmacological block of hotspots and non-hotspots 525
with selective CaV antagonists indicates that these hotspots indeed reflect a differential 526
organization of CaV channel types at the AIS. In future efforts, it will be important to develop 527
immunostaining methods sensitive enough to visualize these channels relative to other AIS 528
constituents to validate these functional observations. 529
The biophysics of different CaV channel types may shape calcium hotspot kinetics and 530
duration as well. Relative to currents measured by step-commands, proportionally more current 531
is carried by low voltage-activated than high voltage-activated channels during an AP waveform 532
(McCobb and Beam, 1991). Low voltage-activated channels, including CaV3, can exhibit rapid 533
19
activation kinetics when membrane voltage transitions quickly from rest to very depolarized 534
potentials (e.g., during an AP) (Chemin et al., 2001, 2002). As such, CaV3 channels open earlier 535
than other CaV isoforms in the course of the AP, and, due to their slower deactivation kinetics, 536
remain open longer than high voltage-activated channels, resulting in a longer duration of 537
calcium influx through these channels (Lambert et al., 1998; McCobb and Beam, 1991). Hotspot 538
calcium influx observed here is consistent with these biophysical aspects of AP-evoked CaV3-539
mediated currents. 540
Pharmacological block of RyR-dependent stores indicates that CaV3 channels couple to 541
intracellular sources of calcium in the AIS. CaV2.3 channels may also couple to these stores, but 542
data were less clear, perhaps due to incomplete block of CaV2.3 channels by SNX-482 543
(Sochivko et al., 2002). These ryanodine receptor-dependent stores are found at ankyrin-G 544
deficient regions of the axonal membrane (King et al., 2014), clustered with other AIS 545
constituents. The components of the cytoskeletal scaffolding machinery that tether NaV, KV 546
channels, and GABAA receptors in the AIS have been well-characterized (Leterrier, 2018), but 547
how CaVs are anchored at the AIS remains an open question. One possibility, at least for CaVs 548
clustered with RyRs, are KV2.1 channels. KV2.1 channels have been shown to tether CaV1 549
channels near junctions between the endoplasmic reticulum and plasma membrane (Fox et al., 550
2015), as well as to enhance the functional coupling of these channels to ryanodine receptors 551
(Vierra et al., 2019). However, whether or not KV2.1 channels tether CaVs near the cisternal 552
organelle at the AIS specifically has not been explored. Another candidate is amphiphysin 553
II/Bridging integrator 1 (BIN1), a T-tubule protein involved in localizing CaV1.2 channels in 554
cardiac myocytes (Hong et al., 2010). This protein shows specific localization to neuronal AIS 555
and nodes of Ranvier, but whether this protein interacts with AIS channels has not been 556
explored (Butler et al., 1997). Additionally, the presence of auxiliary subunits on CaV1 and CaV2 557
channels has been shown to affect localization and membrane expression (Arikkath and 558
Campbell, 2003). As CaV3 channels do not associate with auxiliary subunits (Simms and 559
Zamponi, 2014), CaV3 and CaV2 could acquire differential expression within the AIS through 560
differential association of auxiliary subunits with scaffolding elements. 561
562
Functional implications of calcium channel compartmentalization within the AIS 563
GABAA receptors cluster in ankyrin-G deficient pockets of the AIS and associate with 564
clustered non-conducting KV2.1 channels that stabilize junctions between cisternal organelles 565
and the plasma membrane (Benedeczky et al., 1994; King et al., 2014; Kirmiz et al.; Schneider-566
Mizell et al., 2020). These clustering domains appear across species and brain regions (King et 567
20
al., 2014). The coupling of CaV3 channels to ryanodine receptors, as well as the clustering of 568
these channels into hotspots, suggests that CaV3 channels co-localize with GABAergic 569
chandelier synapses in the AIS. Thus, AIS CaV3s may be particularly sensitive to chandelier cell 570
input. In mature neurons, hyperpolarizing inhibition has been shown to relieve CaV3 channels 571
from steady-state inactivation, thereby promoting rebound spike bursts immediately following an 572
inhibitory epoch (Molineux et al., 2006; Ulrich and Huguenard, 1997). Interestingly, chandelier 573
inputs switch from depolarizing to hyperpolarizing the AIS membrane relatively late in 574
development (Lipkin and Bender, 2020; Pan-Vazquez et al., 2020; Rinetti-Vargas et al., 2017), 575
corresponding to the emergence of synchronized higher-order rhythmicity in cortical networks 576
(Uhlhaas and Singer, 2011). Whether this tight coupling between AIS GABAerigic inputs and 577
CaV3s contributes to the development of these network phenomena remains to be explored. 578
In addition to regulation by chandelier inputs, calcium hotspots could enable precise 579
neuromodulatory control over spike properties, perhaps within select temporal windows relative 580
to neuromodulator signals. In striatal medium spiny neurons, a form of credit assignment for 581
synapses that encode information relevant to reward has been demonstrated based on 582
coincident dopaminergic and glutamatergic signaling (Yagishita et al., 2014). In cells that 583
express D3 dopamine receptors, including some prefrontal pyramidal cells, AIS CaV3 function 584
can be modulated in ways that hyperpolarize the voltage dependence of channel inactivation, in 585
turn lowering the number of channels available for activation during subsequent APs (Clarkson 586
et al., 2017; Yang et al., 2016), This process depends on RyR-dependent intracellular stores 587
(Yang et al., 2016). Thus, in D3 receptor-expressing neurons, CaV3 channels may be modulated 588
only when dopamine binding to D3 receptors coincides with neuronal activity that promotes 589
calcium influx through AIS CaV3s. This may result in preferential suppression of CaV3 function in 590
cells that are actively spiking, thereby modulating only the population of neurons that were 591
active during dopaminergic signaling. 592
593
21
Author contributions: 594
Conceptualization: AML, MMC, PWES, SLM, KJB. Data curation: AML, KJB. Formal 595
Analysis: AML, KJB. Funding acquisition: AML, PWES, MMC, SLM, KJB. Investigation: AML, 596
MMC, PWES, SLM, KJB. Methodology: AML, KJB. Software: AML, PWES, SLM, KJB. 597
Supervision: KJB. Writing — original draft: AML. Writing — review & editing: AML, MMC, 598
PWES, SLM, KJB. 599
600
Acknowledgements: 601
We are grateful to all members of the Bender Lab who provided input and comments on 602
this manuscript. This work was supported by grants to AML (NSF 1650113), PWES (NSERC 603
PGS-D Scholarship), MMC (NSF 1144247), and KJB (NIH AA027023, MH112729). 604
605
Disclosures: None 606
607 608
609
22
Figure 1. CaV2.1, CaV2.2, and CaV3 contribute to calcium influx at the axon initial segment. 610
A. Left: Two photon laser-scanning microscopy (2PLSM) z-stack of a Layer 5 pyramidal neuron 611
visualized with Alexa 594. AIS indicated by bracket. Right: example linescan of AIS 612
averaged over 20 trials. APs were evoked with somatic current injection (1 nA, 5 ms, 20 ms 613
interstimulus interval). 614
B. Left: Representative time-locked control cell. Linescan data displayed as mean ± standard 615
error. Baseline, black; post, gray. Right: Representative effects of CaV antagonist cocktail on 616
AIS calcium. Baseline, black; cocktail, yellow. 617
C. Representative examples of selective CaV antagonists on AIS calcium. Baseline, black; 618
antagonists, other colors. 619
D. Summary of the effects of the CaV antagonist cocktail on AIS calcium. 620
E. Summary of the effects of individual CaV antagonists on AIS calcium. Gray bar represents 621
95% confidence interval of control data. 622
623
Figure 2. Calcium stores contribute to AIS calcium during AP firing. 624
A. Left: Representative effect of ryanodine (20 µM) on AIS calcium. Right: Representative 625
effect of sequential ryanodine and cyclopiazonic acid (CPA, 20 µM) application on AIS 626
calcium. Linescan data presented as mean ± standard error. 627
B. Summary of the effects of ryanodine on AIS calcium. 628
C. Summary of the effects of sequential application of ryanodine and cyclopiazonic acid. 629
630
Figure 3. CaV3 channels couple to ryanodine receptors on calcium stores. 631
A. Representative effects of sequential block of individual CaV types and release from calcium 632
stores. Linescan data shown as mean ± standard error. 633
B. Summary of the effects of CaV antagonists and ryanodine block. n.s.: not significant. 634
635
Figure 4. CaV3 channels and CaV2.1/2.2 exhibit distinct functional distributions. 636
A. Schematic of 2PLSM point scan imaging protocol. Points were imaged in sets of 5, with 637
each point separated by 0.5 µm. The laser was parked at a single diffraction-limited point for 638
25 ms preceding and 100 ms following an AP and calcium influx was measured with OGB-639
5N. Points were scanned in the sequence 2, 4, 1, 3, 5 and each point sampled a single AP. 640
Data was averaged over 20-50 repetitions. 641
B. Isochronal calcium peaks from neighboring point sets. Calcium influx at each point is color-642
coded as in panel A. B1 shows a point set with a hotspot at point 5. B2 is the point set 643
23
immediately adjacent to B1 and shows equivalent calcium influx across all points. Gray bar 644
indicates the calcium transient onset and offset. 645
C. Average of calcium influx from a set of 5 points (bottom), its time derivative (middle), aligned 646
to somatic voltage recording (top). Grey bar defines transient onset/offset, which 647
corresponds to deviation of time derivative above baseline noise. 648
D. Distribution of point sets containing hotspots. Peak calcium influx at the brightest point was 649
divided by the isochronal calcium influx at the point(s) 1 µm away. 46 of 59 sites imaged fell 650
within a normal distribution, while 13 sites exhibited higher relative calcium influx. Black, 651
point sets containing a local hotspot; gray, point sets with no local hotspot. Red line 652
indicates the fit of a normal distribution. Total distribution fit for normality (Shapiro Wilk test p 653
= 0.0016). 654
E. Calcium influx at hotspots was approximately 2x higher than calcium influx at non-hotspot 655
points. Black, point sets containing a local hotspot; gray, point sets with no local hotspot. 656
Data are plotted as mean ± standard deviation. 657
F. Comparison of the flanks of point sets with a local hotspot and those without. Black, point 658
sets containing a local hotspot; gray, point sets with no local hotspot. Data are plotted as 659
mean ± standard deviation for each 0.5 µm increment from the brightest point of the set. 660
G. Influence of selective CaV antagonists or store depletion on peak calcium influx during point 661
scan imaging. Circles represent single point sets. Black, control; cyan, TTA-P2; red, NiCl2; 662
green, ω-conotoxin MVIIC; orange, CPA. * : p < 0.001, Kruskall-Wallis test with rank-sum 663
post hoc. 664
H. Influence of selective CaV antagonists or store depletion on calcium hotspots. Hotspots were 665
classified as points >1.5 times brighter than the point(s) 1 µm away. Dotted gray line 666
represents the distinction between point sets with a local hotspot (above) and those without 667
(below). Color code as in panel F. * : p < 0.001, Kruskall-Wallis test with rank-sum post hoc. 668
669
Figure 5. Fast linescan imaging reveals distinct temporal profiles of sodium and calcium 670
influx. 671
A. Schematic of fast linescan protocol. Left: Linescan imaging was performed transecting the 672
AIS at 5.3 kHz with either the sodium dye SBFI or the calcium dye Fluo-4FF. Middle: 673
representative example of sodium influx aligned to soma-evoked AP shows that sodium 674
influx begins during the rising phase of the AP. Right: representative example of calcium 675
imaging aligned to AP. Calcium influx occurs during AP repolarization. Blue, SBFI; green, 676
Fluo-4FF. Dashed vertical red line indicates imaging event onset. Gray bar represents rising 677
24
phase of the AP (threshold to peak). Black line is the sigmoid fit of the linescan. Solid red 678
line shows baseline noise of the linescan. 679
B. Comparison of sodium and calcium transient onset time, slope, and signal-to-noise ratio. 680
Left: summary of the timing of sodium and calcium transients relative to the peak of the AP. 681
Negative values represent transient onset that precedes the AP peak. Middle: The slope of 682
optically-recorded sodium and calcium transients. Slope was calculated using the sigmoid 683
fit. Right: signal-to-noise ratio for sodium and calcium transients. Circles represent individual 684
cells. Open circles are cells with similar signal-to-noise ratios. Blue, SBFI; green, Fluo-4FF. 685
686
Figure 6. Sodium and calcium influx occur on the rising and falling phases of the AP at 687
near-physiological temperatures, respectively. 688
A. Pointscan imaging protocol was performed as in Figure 4A. OGB-5N was replaced with the 689
sodium indicator ING-2, and Alexa-594 was excluded from the internal recording solution. 690
B. Representative ING-2 sodium imaging pointset. Points are color-coded as in Panel A. Gray 691
bar indicates the sodium transient onset and offset. 692
C. Distribution of sodium imaging point sets calculated as in Fig 4C. Red line represents the fit 693
of a normal distribution to the data. 694
D. Sodium and calcium transients from pointscan imaging temporally-aligned to AP threshold 695
and peak. Left: Sodium and calcium influx onset relative to AP threshold. Right: Sodium and 696
calcium influx onset relative to AP peak. Transient onset time was measured for the 697
brightest point in a point set. Circles are individual point sets. Gray dashed line shows AP 698
threshold (left) or peak (right) timing. Red, ING-2 sodium imaging; black, OGB-5N color 699
coded as in Fig. 4. * : p < 0.001, Kruskall-Wallis test with rank-sum post hoc. 700
701
Figure 7: CaV2.1/2.2 contribute to AIS calcium in the somatosensory cortex. 702
A. Representative effect of w-conotoxin MVIIC application on AIS calcium in L5b pyramidal 703
cells in the somatosensory cortex. Left: example time-locked control cell. Black, baseline; 704
gray, post. Right: example of the effect of w-conotoxin MVIIC. Black, baseline; green, w-705
conotoxin MVIIC. Linescan data are plotted as mean ± standard error. 706
B. Summary of the effects of w-conotoxin MVIIC on AIS calcium in somatosensory L5b 707
pyramidal neurons. Black, time-locked control cells; green, w-conotoxin MVIIC. 708
C. Decreases in EPSP amplitude confirm the presence of w-conotoxin MVIIC at the slice. Top: 709
representative examples of EPSPs in w-conotoxin MVIIC (right) or in time-locked control 710
25
cells (left). Bottom: Summary of the effects of w-conotoxin MVIIC on EPSP amplitude in 711
somatosensory cortex. Black, baseline; gray, time-locked control; green, w-conotoxin MVIIC. 712
713 714
Table 1: Changes in action potential waveform properties across the course of recording. 715
* denotes a p-value < 0.05. One-way ANOVAs or two-tailed t-tests were performed for 716
each waveform property, as appropriate. Paired t-tests were performed for EPSP 717
amplitudes. 718
719
26
References 720 721 Antón-Fernández, A., Rubio-Garrido, P., DeFelipe, J., and Muñoz, A. (2015). Selective 722
presence of a giant saccular organelle in the axon initial segment of a subpopulation of 723 layer V pyramidal neurons. Brain Struct. Funct. 220, 869–884. 724
Arikkath, J., and Campbell, K.P. (2003). Auxiliary subunits: Essential components of the 725 voltage-gated calcium channel complex. Curr. Opin. Neurobiol. 13, 298–307. 726
Bender, K.J., and Trussell, L.O. (2009). Axon initial segment Ca2+ channels influence action 727 potential generation and timing. Neuron 61, 259–271. 728
Bender, K.J., and Trussell, L.O. (2012). The Physiology of the Axon Initial Segment. Annu. Rev. 729 Neurosci. 35, 249–265. 730
Bender, K.J., Ford, C.P., and Trussell, L.O. (2010). Dopaminergic modulation of axon initial 731 segment calcium channels regulates action potential initiation. Neuron 68, 500–511. 732
Bender, K.J., Uebele, V.N., Renger, J.J., and Trussell, L.O. (2012). Control of firing patterns 733 through modulation of axon initial segment T-type calcium channels. J. Physiol. 590, 734 109–118. 735
Benedeczky, I., Molnár, E., and Somogyi, P. (1994). The cisternal organelle as a Ca2+-storing 736 compartment associated with GABAergic synapses in the axon initial segment of 737 hippocampal pyramidal neurones. Exp. Brain Res. 101, 216–230. 738
Bischofberger, J., Geiger, J.R.P., and Jonas, P. (2002). Timing and efficacy of Ca2+ channel 739 activation in hippocampal mossy fiber boutons. J. Neurosci. 22, 10593–10602. 740
Bock, T., and Stuart, G.J. (2016). The impact of BK channels on cellular excitability depends on 741 their subcellular location. Front. Cell. Neurosci. 10. 742
Bucurenciu, I., Kulik, A., Schwaller, B., Frotscher, M., and Jonas, P. (2008). Nanodomain 743 coupling between Ca2+ channels and Ca2+ sensors promotes fast and efficient 744 transmitter release at a cortical GABAergic synapse. Neuron 57, 536–545. 745
Burke, K.J., Keeshen, C.M., and Bender, K.J. (2018). Two Forms of Synaptic Depression 746 Produced by Differential Neuromodulation of Presynaptic Calcium Channels. Neuron 99, 747 969-984.e7. 748
Butler, M.H., David, C., Ochoa, G.C., Freyberg, Z., Daniell, L., Grabs, D., Cremona, O., and De 749 Camilli, P. (1997). Amphiphysin II (SH3p9; BIN1), a member of the amphiphysin/Rvs 750 family, is concentrated in the cortical cytomatrix of axon initial segments and nodes of 751 ranvier in brain and around T tubules in skeletal muscle. J. Cell Biol. 137, 1355–1367. 752
Callewaert, G., Eilers, J., and Konnerth, A. (1996). Axonal calcium entry during fast “sodium” 753 action potentials in rat cerebellar Purkinje neurones. J. Physiol. 495, 641–647. 754
Chamberlain, B.K., Volpe, P., and Fleischer, S. (1984). Inhibition of calcium-induced calcium 755 release from purified cardiac sarcoplasmic reticulum vesicles. J. Biol. Chem. 259, 7547–756 7553. 757
Chemin, J., Monteil, A., Bourinet, E., Nargeot, J., and Lory, P. (2001). Alternatively spliced α1G 758 (Cav3.1) Intracellular loops promote specific T-type Ca2+ channel gating properties. 759 Biophys. J. 80, 1238–1250. 760
Chemin, J., Monteil, A., Perez‐Reyes, E., Bourinet, E., Nargeot, J., and Lory, P. (2002). Specific 761
contribution of human T‐type calcium channel isotypes (α 1G , α 1H and α 1I ) to neuronal 762 excitability. J. Physiol. 540, 3–14. 763
Chen-Engerer, H.-J., Hartmann, J., Karl, R.M., Yang, J., Feske, S., and Konnerth, A. (2019). 764 Two types of functionally distinct Ca2+ stores in hippocampal neurons. Nat. Commun. 765 10, 3223. 766
Clarkson, R.L., Liptak, A.T., Gee, S.M., Sohal, X.V.S., and Bender, X.K.J. (2017). D3 Receptors 767 Regulate Excitability in a Unique Class of Prefrontal Pyramidal Cells. J. Neurosci. 37, 768 5846–5860. 769
Collier, M.L., Ji, G., Wang, Y.X., and Kotlikoff, M.I. (2000). Calcium-induced calcium release in 770
27
smooth muscle: Loose coupling between the action potential and calcium release. J. 771 Gen. Physiol. 115, 653–662. 772
Díaz-Rojas, F., Sakaba, T., and Kawaguchi, S.Y. (2015). Ca2+ current facilitation determines 773 short-term facilitation at inhibitory synapses between cerebellar Purkinje cells. J. Physiol. 774 593, 4889–4904. 775
DiGregorio, D.A., Peskoff, A., and Vergara, J.L. (1999). Measurement of action potential-776 induced presynaptic calcium domains at a cultured neuromuscular junction. J. Neurosci. 777 19, 7846–7859. 778
Dumenieu, M., Senkov, O., Mironov, A., Bourinet, E., Kreutz, M.R., Dityatev, A., Heine, M., 779 Bikbaev, A., and Lopez-Rojas, J. (2018). The low-threshold calcium channel Cav3.2 780 mediates burst firing of mature dentate granule cells. Cereb. Cortex 28, 2594–2609. 781
Endo, M., Tanaka, M., and Ogawa, Y. (1970). Calcium induced release of calcium from the 782 sarcoplasmic reticulum of skinned skeletal muscle fibres. Nature 228, 34–36. 783
Filipis, L., and Canepari, M. (2021). Optical measurement of physiological sodium currents in 784 the axon initial segment. J. Physiol. 599, 49–66. 785
Fox, P.D., Haberkorn, C.J., Akin, E.J., Seel, P.J., Krapf, D., and Tamkun, M.M. (2015). Induction 786 of stable ER-plasma-membrane junctions by Kv2.1 potassium channels. J Cell Sci 128, 787 2096–2105. 788
Fukaya, R., Yamada, R., and Kuba, H. (2018). Tonotopic Variation of the T-Type Ca2+ Current 789 in Avian Auditory Coincidence Detector Neurons. J. Neurosci. 38, 335–346. 790
Gomez, L.C., Kawaguchi, S.Y., Collin, T., Jalil, A., del Pilar Gomez, M., Nasi, E., Marty, A., and 791 Llano, I. (2020). Influence of spatially segregated IP3-producing pathways on spike 792 generation and transmitter release in Purkinje cell axons. Proc. Natl. Acad. Sci. U. S. A. 793 117, 11097–11108. 794
Gründemann, J., and Clark, B.A. (2015). Calcium-activated potassium channels at nodes of 795 Ranvier secure axonal spike propagation. Cell Rep. 12, 1715–1722. 796
Hanemaaijer, N.A.K., Popovic, M.A., Wilders, X., and Grasman, S. (2020). Ca2+ entry through 797 NaV channels generates submillisecond axonal Ca2+ signaling. Elife 9. 798
Hong, T.-T., Smyth, J.W., Gao, D., Chu, K.Y., Vogan, J.M., Fong, T.S., Jensen, B.C., Colecraft, 799 H.M., and Shaw, R.M. (2010). BIN1 localizes the L-type calcium channel to cardiac T-800 tubules. PLoS Biol. 8, e1000312. 801
Hu, W., and Bean, B.P. (2018). Differential control of axonal and somatic resting potential by 802 voltage-dependent conductances in cortical Layer 5 pyramidal neurons. Neuron 97, 803 1315-1326.e3. 804
Hu, W., Tian, C., Li, T., Yang, M., Hou, H., and Shu, Y. (2009). Distinct contributions of Na(v)1.6 805 and Na(v)1.2 in action potential initiation and backpropagation. Nat. Neurosci. 12, 996–806 1002. 807
Huang, C.Y.-M., and Rasband, M.N. (2018). Axon initial segments: structure, function, and 808 disease. Ann. N. Y. Acad. Sci. 1420, 46–61. 809
Inan, M., and Anderson, S.A. (2014). The chandelier cell , form and function. Curr. Opin. 810 Neurobiol. 26, 142–148. 811
Irie, T., and Trussell, L.O. (2017). Double-nanodomain coupling of calcium channels, ryanodine 812 receptors, and BK channels controls the generation of burst firing. Neuron 96, 856-813 870.e4. 814
Jin, X., Chen, Q., Song, Y., Zheng, J., Xiao, K., Shao, S., Fu, Z., Yi, M., Yang, Y., and Huang, Z. 815 (2019). Dopamine D2 receptors regulate the action potential threshold by modulating T‐816 type calcium channels in stellate cells of the medial entorhinal cortex. J. Physiol. 597, 817 3363–3387. 818
Jing, M., Zhang, P., Wang, G., Feng, J., Mesik, L., Zeng, J., Jiang, H., Wang, S., Looby, J.C., 819 Guagliardo, N.A., et al. (2018). A genetically encoded fluorescent acetylcholine indicator 820 for in vitro and in vivo studies. Nat. Biotechnol. 36, 726. 821
28
Johenning, F.W., Theis, A.-K., Pannasch, U., Rückl, M., Rüdiger, S., and Schmitz, D. (2015). 822 Ryanodine receptor activation induces long-term plasticity of spine calcium dynamics. 823 PLOS Biol. 13, e1002181. 824
Jones, S.L., and Stuart, G.J. (2013). Different calcium sources control somatic versus dendritic 825 SK channel activation during action potentials. J. Neurosci. 33, 19396–19405. 826
Kawaguchi, S. ya, and Sakaba, T. (2015). Control of inhibitory synaptic outputs by low 827 excitability of axon terminals revealed by direct recording. Neuron 85, 1273–1288. 828
King, A.N., Manning, C.F., and Trimmer, J.S. (2014). A unique ion channel clustering domain on 829 the axon initial segment of mammalian neurons. J. Comp. Neurol. 522, 2594–2608. 830
Kirmiz, M., Palacio, S., Thapa, P., King, A.N., Sack, J.T., and Trimmer, J.S. Organizing neuronal 831 ER-PM junctions is a conserved nonconducting function of Kv2 plasma membrane ion 832 channels. 833
Kole, M.H.P., and Stuart, G.J. (2012). Signal processing in the axon initial segment. Neuron 73, 834 235–247. 835
Kole, M.H.P., Letzkus, J.J., and Stuart, G.J. (2007). Axon initial segment Kv1 channels control 836 axonal action potential waveform and synaptic efficacy. Neuron 55, 633–647. 837
Kole, M.H.P., Ilschner, S.U., Kampa, B.M., Williams, S.R., Ruben, P.C., and Stuart, G.J. (2008). 838 Action potential generation requires a high sodium channel density in the axon initial 839 segment. Nat. Neurosci. 11, 178–186. 840
Lambert, R.C., McKenna, F., Maulet, Y., Talley, E.M., Bayliss, D.A., Cribbs, L.L., Lee, J.H., 841 Perez-Reyes, E., and Feltz, A. (1998). Low-voltage-activated Ca2+ currents are 842 generated by members of the Ca(v)T subunit family (α1G/H) in rat primary sensory 843 neurons. J. Neurosci. 18, 8605–8613. 844
Leterrier, C. (2018). The axon initial segment: an updated viewpoint. J. Neurosci. 38, 1922–17. 845 Leterrier, C., and Dargent, B. (2014). No Pasaran! Role of the axon initial segment in the 846
regulation of protein transport and the maintenance of axonal identity. Semin. Cell Dev. 847 Biol. 27, 44–51. 848
Lipkin, A.M., and Bender, K.J. (2020). Flipping the switch: homeostatic tuning of chandelier 849 synapses follows developmental changes in GABA polarity. Neuron 106, 199–201. 850
Lorincz, A., and Nusser, Z. (2008). Cell-type-dependent molecular composition of the axon 851 initial segment. J. Neurosci. 26, 7172–7180. 852
Martinello, K., Huang, Z., Lujan, R., Tran, B., Watanabe, M., Cooper, E.C., Brown, D.A., and 853 Shah, M.M. (2015). Cholinergic afferent stimulation induces axonal function plasticity in 854 adult hippocampal granule cells. Neuron 85, 346–363. 855
McCobb, D.P., and Beam, K.G. (1991). Action potential waveform voltage-clamp commands 856 reveal striking differences in calcium entry via low and high voltage activated calcium 857 channels. Neuron 7, 119–127. 858
McDonough, S.I., Swartz, K.J., Mintz, I.M., Boland, L.M., and Bean, B.P. (1996). Inhibition of 859 calcium channels in rat central and peripheral neurons by omega-conotoxin MVIIC. J. 860 Neurosci. 16, 2612–2623. 861
Molineux, M.L., Mcrory, J.E., Mckay, B.E., Hamid, J., Mehaffey, W.H., Rehak, R., Snutch, T.P., 862 Zamponi, G.W., and Turner, R.W. (2006). Specific T-type calcium channel isoforms are 863 associated with distinct burst phenotypes in deep cerebellar nuclear neurons. 103, 864 5555–5560. 865
Nakamura, Y., Harada, H., Kamasawa, N., Matsui, K., Rothman, J.S., Shigemoto, R., Silver, 866 R.A., DiGregorio, D.A., and Takahashi, T. (2015). Nanoscale distribution of presynaptic 867 Ca2+ channels and its impact on vesicular release during development. Neuron 85, 868 145–158. 869
Ogawa, Y., and Rasband, M.N. (2008). The functional organization and assembly of the axon 870 initial segment. Curr. Opin. Neurobiol. 18, 307–313. 871
Pan-Vazquez, A., Wefelmeyer, W., Gonzalez Sabater, V., Neves, G., and Burrone, J. (2020). 872
29
Activity-dependent plasticity of axo-axonic synapses at the axon initial segment. Neuron 873 106, 265-276.e6. 874
Van Petegem, F. (2012). Ryanodine receptors: Structure and function. J. Biol. Chem. 287, 875 31624–31632. 876
Peters, A., Proskauer, C.C., and Kaiserman-Abramof, I.R. (1968). The small pyramidal neuron 877 of the rat cerebral cortex. The axon hillock and initial segment. J. Cell Biol. 39, 604–619. 878
Pinatel, D., Hivert, B., Saint-Martin, M., Noraz, N., Savvaki, M., Karagogeos, D., and Faivre-879 Sarrailh, C. (2017). The Kv1-associated molecules TAG-1 and Caspr2 are selectively 880 targeted to the axon initial segment in hippocampal neurons. J. Cell Sci. 130, 2209–881 2220. 882
Pressler, R.T., and Strowbridge, B.W. (2019). Functional specialization of interneuron dendrites: 883 Identification of action potential initiation zone in axonless olfactory bulb granule cells. J 884 Neurosci 39, 9674–9688. 885
Rebola, N., Reva, M., Kirizs, T., Szoboszlay, M., Lőrincz, A., Moneron, G., Nusser, Z., and 886 DiGregorio, D.A. (2019). Distinct nanoscale calcium channel and synaptic vesicle 887 topographies contribute to the diversity of synaptic function. Neuron 104, 693-710.e9. 888
Rinetti-Vargas, G., Phamluong, K., Ron, D., and Bender, K.J. (2017). Periadolescent Maturation 889 of GABAergic Hyperpolarization at the Axon Initial Segment. Cell Rep. 20, 21–29. 890
Rose, C.R., Kovalchuk, Y., Eilers, J., and Konnerth, A. (1999). Two-photon Na+ imaging in 891 spines and fine dendrites of central neurons. Pflügers Arch - Eur J Physiol 439, 201–892 207. 893
Rowan, M.J.M., Tranquil, E., and Christie, J.M. (2014). Distinct Kv channel subtypes contribute 894 to differences in spike signaling properties in the axon initial segment and presynaptic 895 boutons of cerebellar interneurons. J. Neurosci. 34, 6611–6623. 896
Sabatini, B.L., and Regehr, W.G. (1996). Timing of neurotransmission at fast synapses in the 897 mammalian brain. Nature 384, 170–172. 898
Sabatini, B.L., and Regehr, W.G. (1999). Timing of synaptic transmission. Annu. Rev. Physiol. 899 61, 521–542. 900
Sánchez-Ponce, D., Blázquez-Llorca, L., Defelipe, J., Garrido, J.J., and Muñoz, A. (2012). 901 Colocalization of α-actinin and synaptopodin in the pyramidal cell axon initial segment. 902 Cereb. Cortex 22, 1648–1661. 903
Schiller, J., Helmchen, F., and Sakmann, B. (1995). Spatial profile of dendritic calcium 904 transients evoked by action potentials in rat neocortical pyramidal neurones. J. Physiol. 905 487, 583–600. 906
Schlüter, A., Del Turco, D., Deller, T., Gutzmann, A., Schultz, C., and Engelhardt, M. (2017). 907 Structural plasticity of synaptopodin in the axon initial segment during visual cortex 908 development. Cereb. Cortex 27, 4662–4675. 909
Schneider-Mizell, C.M., Bodor, A.L., Collman, F., Brittain, D., Bleckert, A.A., Dorkenwald, S., 910 Turner, N.L., Macrina, T., Lee, K., Lu, R., et al. (2020). Chandelier cell anatomy and 911 function reveal a variably distributed but common signal. bioRxiv 2020.03.31.018952. 912
Scimemi, A., and Diamond, J.S. (2012). The number and organization of Ca2+ channels in the 913 active zone shapes neurotransmitter release from Schaffer collateral synapses. J. 914 Neurosci. 32, 18157–18176. 915
Simms, B.A., and Zamponi, G.W. (2014). Neuronal voltage-gated calcium channels: Structure, 916 function, and dysfunction. Neuron 82, 24–45. 917
Sochivko, D., Pereverzev, A., Smyth, N., Gissel, C., Schneider, T., and Beck, H. (2002). The 918 Cav2.3 Ca2+ channel subunit contributes to R-type Ca2+ currents in murine 919 hippocampal and neocortical neurones. J. Physiol. 542, 699–710. 920
Spratt, P.W.E., Ben-Shalom, R., Keeshen, C.M., Burke, K.J., Clarkson, R.L., Sanders, S.J., and 921 Bender, K.J. (2019). The autism-associated gene Scn2a contributes to dendritic 922 excitability and synaptic function in the prefrontal cortex. Neuron 103, 1–13. 923
30
Spratt, P.W.E., Ben-Shalom, R., Sahagun, A., Keeshen, C.M., Sanders, S.J., and Bender, K.J. 924 (2021). Paradoxical hyperexcitability from NaV1.2 sodium channel loss in neocortical 925 pyramidal cells. bioRxiv 2021.02.02.429423. 926
Thomas, N.L., and Williams, A.J. (2012). Pharmacology of ryanodine receptors and Ca2+-927 induced Ca2+ release. Wiley Interdiscip. Rev. Membr. Transp. Signal. 1, 383–397. 928
Uhlhaas, P.J., and Singer, W. (2011). The development of neural synchrony and large-scale 929 cortical networks during adolescence: Relevance for the pathophysiology of 930 schizophrenia and neurodevelopmental hypothesis. Schizophr. Bull. 37, 514–523. 931
Ulrich, D., and Huguenard, J.R. (1997). Nucleus-specific chloride homeostasis in rat thalamus. 932 J. Neurosci. 17, 2348–2354. 933
Vierra, N.C., Kirmiz, M., List, D. Van Der, Santana, L.F., and Trimmer, J.S. (2019). Kv2.1 934 mediates spatial and functional coupling of L-type calcium channels and ryanodine 935 receptors in mammalian neurons. Elife 8, 1–42. 936
Vyleta, N.P., and Jonas, P. (2014). Loose coupling between Ca2+ channels and release 937 sensors at a plastic hippocampal synapse. Science (80-. ). 343, 665–670. 938
Wang, K., Lin, M.T., Adelman, J.P., and Maylie, J. (2014). Distinct Ca2+ sources in dendritic 939 spines of hippocampal CA1 neurons couple to SK and Kv4 channels. Neuron 81, 379–940 387. 941
Wheeler, D.G., Groth, R.D., Ma, H., Barrett, C.F., Owen, S.F., Safa, P., and Tsien, R.W. (2012). 942 CaV1 and CaV2 channels engage distinct modes of Ca2+ signaling to control CREB-943 dependent gene expression. Cell 149, 1112–1124. 944
Yagishita, S., Hayashi-Takagi, A., Ellis-Davies, G.C.R., Urakubo, H., Ishii, S., and Kasai, H. 945 (2014). A critical time window for dopamine actions on the structural plasticity of 946 dendritic spines. Science (80-. ). 345, 1616–1620. 947
Yang, S., Ben-Shalom, R., Ahn, M., Liptak, A.T.A.T., van Rijn, R.M.R.M., Whistler, J.L.J.L., and 948 Bender, K.J.K.J. (2016). β-Arrestin-dependent dopaminergic regulation of calcium 949 channel activity in the axon initial segment. Cell Rep. 16, 1518–1526. 950
Yu, Y., Maureira, C., Liu, X., and Mccormick, D. (2010). P/Q And N channels control baseline 951 and spike-triggered calcium levels in neocortical axons and synaptic boutons. J. 952 Neurosci. 30, 11858–11869. 953
954
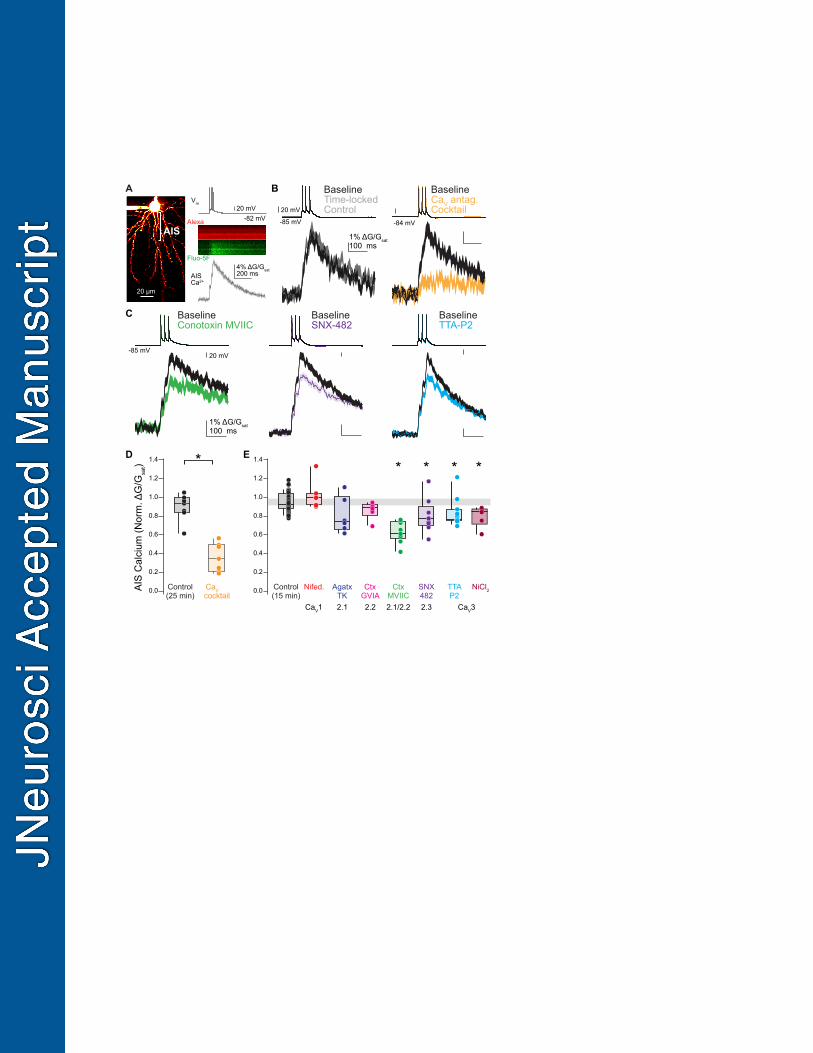
A B
C
-85 mV
-84 mV-82 mV
BaselineSNX-482
BaselineTTA-P2
BaselineCaV antag.Cocktail
BaselineTime-lockedControl
BaselineConotoxin MVIIC
20 mV
1% ΔG/Gsat100 ms
1% ΔG/Gsat100 ms
D E
AIS
Cal
cium
(Nor
m. Δ
G/G
sat)
Control(15 min)
1.4
1.2
1.0
0.8
0.6
0.4
0.2
0.0
1.4
1.2
1.0
0.8
0.6
0.4
0.2
0.0 Control(25 min)
CaVcocktail
* * **
AgatxTK
CtxGVIA
CtxMVIIC
TTAP2
SNX482
Nifed.
2.1 2.2 2.1/2.2 2.3 CaV3CaV1
20 µm
AIS
4% ΔG/Gsat200 ms
20 mV
-85 mV
20 mV
AISCa2+
Alexa
Fluo-5F
Vm
NiCl2
*
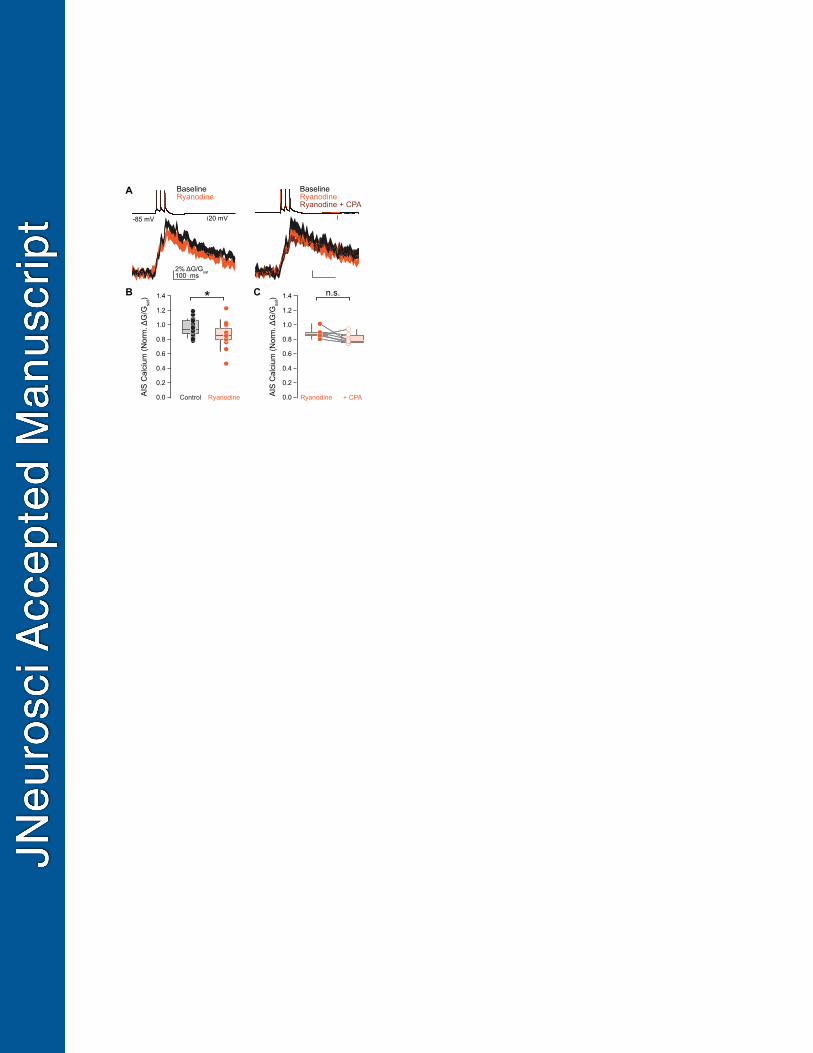
Control Ryanodine Ryanodine + CPA
B
A
C
AIS
Cal
cium
(Nor
m. Δ
G/G
sat)
AIS
Cal
cium
(Nor
m. Δ
G/G
sat)1.4 *
1.2
1.0
0.8
0.6
0.4
0.2
0.0
1.4
1.2
1.0
0.8
0.6
0.4
0.2
0.0
n.s.
-85 mV 20 mV
2% ΔG/Gsat100 ms
BaselineRyanodine
BaselineRyanodineRyanodine + CPA
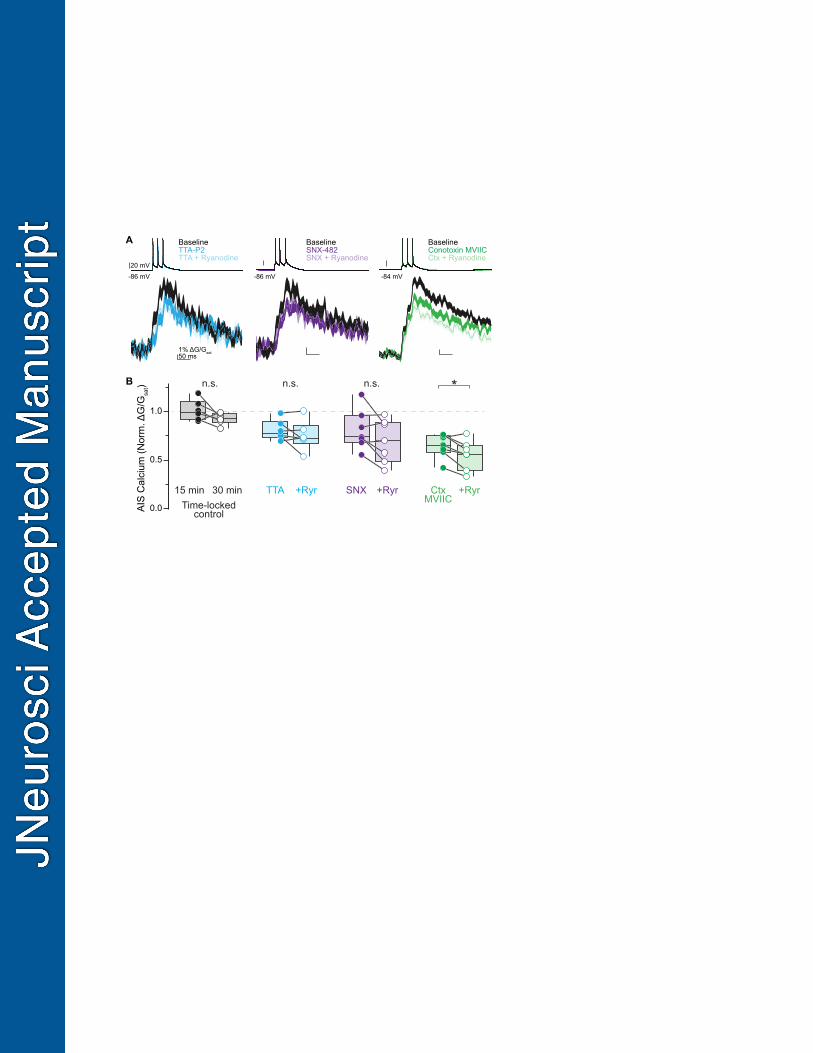
B
A
1.0
0.5
0.0
CtxMVIIC
TTATime-locked
control
SNX +Ryr+Ryr +Ryr
n.s. n.s. n.s. *
AIS
Cal
cium
(Nor
m. Δ
G/G
sat)
15 min 30 min
-86 mV -86 mV -84 mV
1% ΔG/Gsat50 ms
20 mV
BaselineConotoxin MVIICCtx + Ryanodine
BaselineSNX-482SNX + Ryanodine
BaselineTTA-P2TTA + Ryanodine
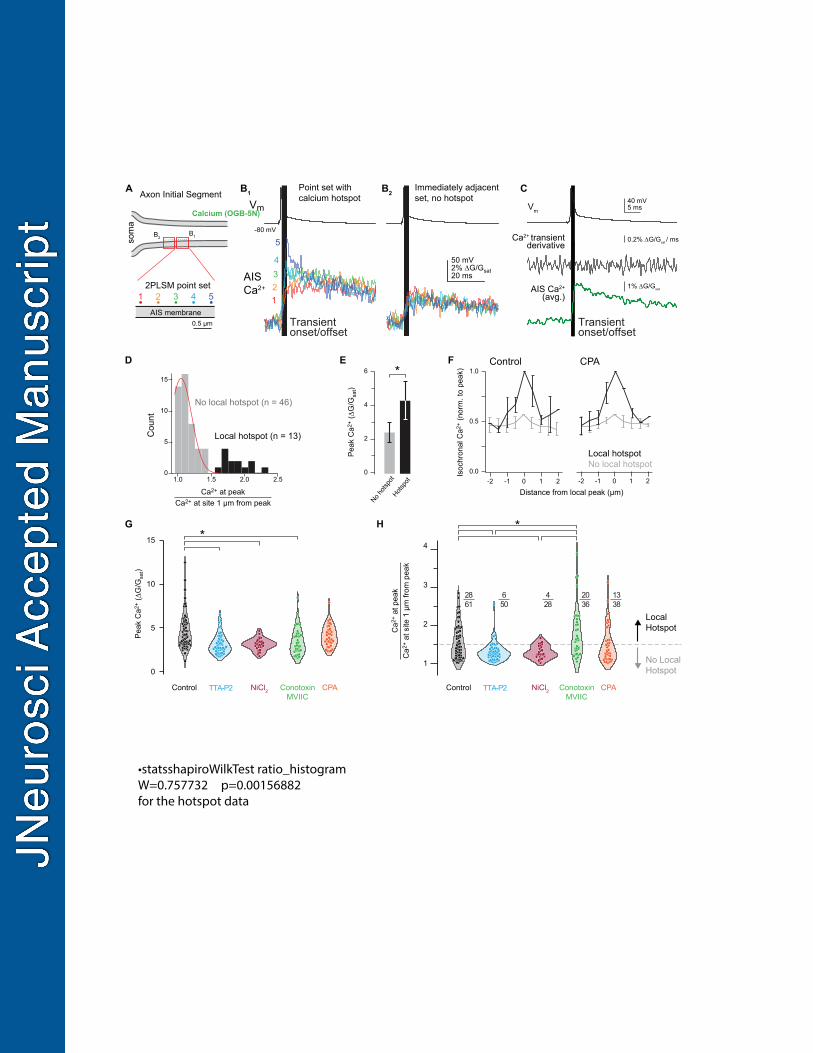
Axon Initial Segment
som
a
AIS membrane
2PLSM point set
Point set withcalcium hotspot
Immediately adjacent set, no hotspot
Control CPA
1 2 3 4 5 1234
5
0.5 µm
A B1
D E F
G H
*6
4
2
0
Peak
a
C2+
(∆G
/Gsa
t)
Peak
a
C2+
(∆G
/Gsa
t)
lanorhcosI
aC
2+ (
)kaep ot .mron
Hotspo
t
No hots
pot
Ca2+ at peakCa2+ at site 1 µm from peak
Distance from local peak (µm)
Local hotspot (n = 13)Cou
nt
No local hotspot (n = 46)
Local Hotspot
No LocalHotspot
Local hotspotNo local hotspot
Ca2
+ at
pea
kC
a2+
at s
ite 1
µm
from
pea
k
-2 -1 0 1 2
1.0
0.5
0.0-2 -1 0 1 2
50 mV2% ∆G/Gsat20 ms
Vm
-80 mV
AIS
Transientonset/offset
Transientonset/offset
Ca2+
Control TTA-P2 CPAConotoxinMVIIC
**
4
3
2
1
B2 C
B1B2
AIS Ca2+
(avg.)
Ca2+ transientderivative
Vm
NiCl2 Control TTA-P2 CPAConotoxinMVIIC
NiCl2
2861
650
428
1338
2036
15
10
5
0
15
10
5
02.52.01.51.0
•statsshapiroWilkTest ratio_histogram W=0.757732 p=0.00156882for the hotspot data
Calcium (OGB-5N)
1% ∆G/Gsat
0.2% ∆G/Gsat / ms
40 mV5 ms
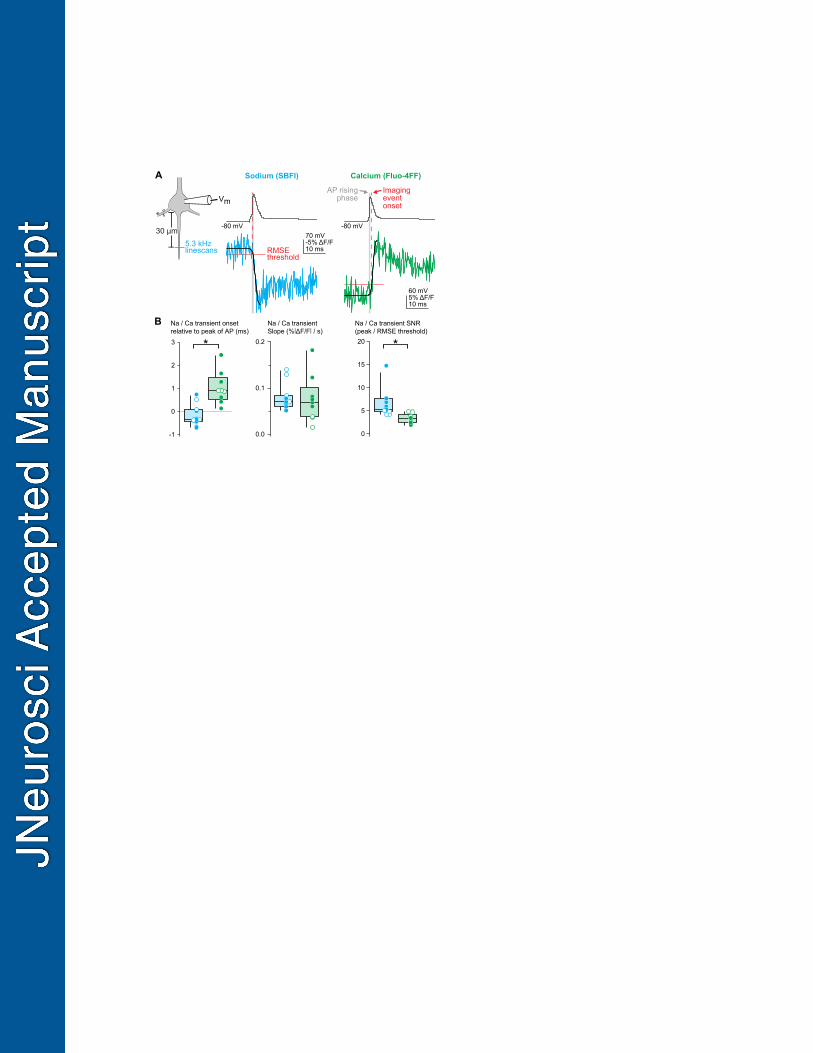
-80 mV-80 mV
A
B
60 mV5% ΔF/F10 ms
70 mV-5% ΔF/F10 ms
Sodium (SBFI) Calcium (Fluo-4FF)
RMSEthreshold
Imagingeventonset
AP risingphase
5.3 kHzlinescans
30 µm
Vm
3
2
1
0
-1
Na / Ca transient onset relative to peak of AP (ms)
* 0.2
0.1
0.0
Na / Ca transient Slope (%|ΔF/F| / s)
20
15
10
5
0
Na / Ca transient SNR(peak / RMSE threshold)
*
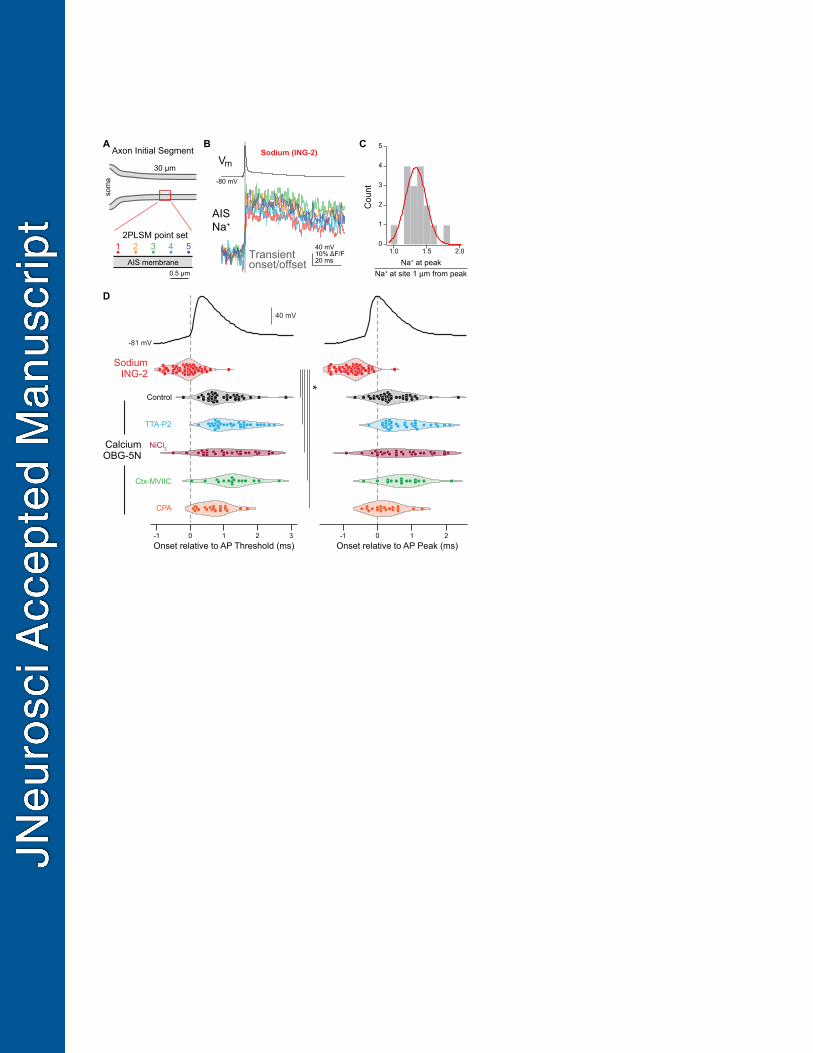
Sodium (ING-2)
amos
Axon Initial Segment
30 µm
AIS membrane
2PLSM point set1 2 3 4 5
0.5 µm
A
D
B C
40 mV10% ΔF/F20 ms
5
4
3
2
1
0
Na+ at peakNa+ at site 1 µm from peak
Cou
nt
2.01.51.0
Vm
-80 mV
AISNa+
Transientonset/offset
3210-1Onset relative to AP Threshold (ms)
210-1Onset relative to AP Peak (ms)
SodiumING-2
CalciumOBG-5N
Control
CPA
-81 mV
40 mV
Ctx-MVIIC
TTA-P2
*
NiCl2
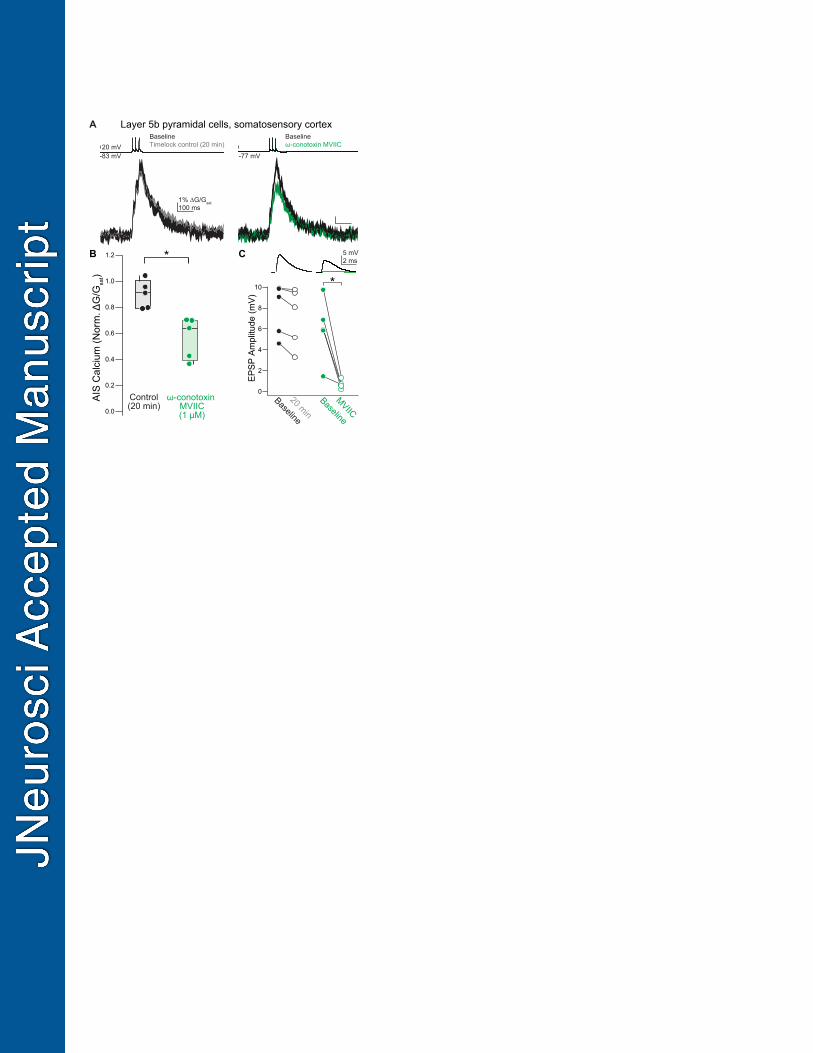
A
CB
MVIIC
20 min
1.2
1.0
0.8
0.6
0.4
0.2
0.0
Control(20 min)
20 mV
1% ∆G/Gsat100 ms
5 mV2 ms
BaselineTimelock control (20 min)
Baselineω-conotoxin MVIIC
10
8
6
4
2
0
EPSP
Am
plitu
de (m
V)
Baseline
Baseline
-83 mV -77 mV
*
*
ω-conotoxin MVIIC (1 μM)
AIS
Cal
cium
(Nor
m. Δ
G/G
sat)
Layer 5b pyramidal cells, somatosensory cortex
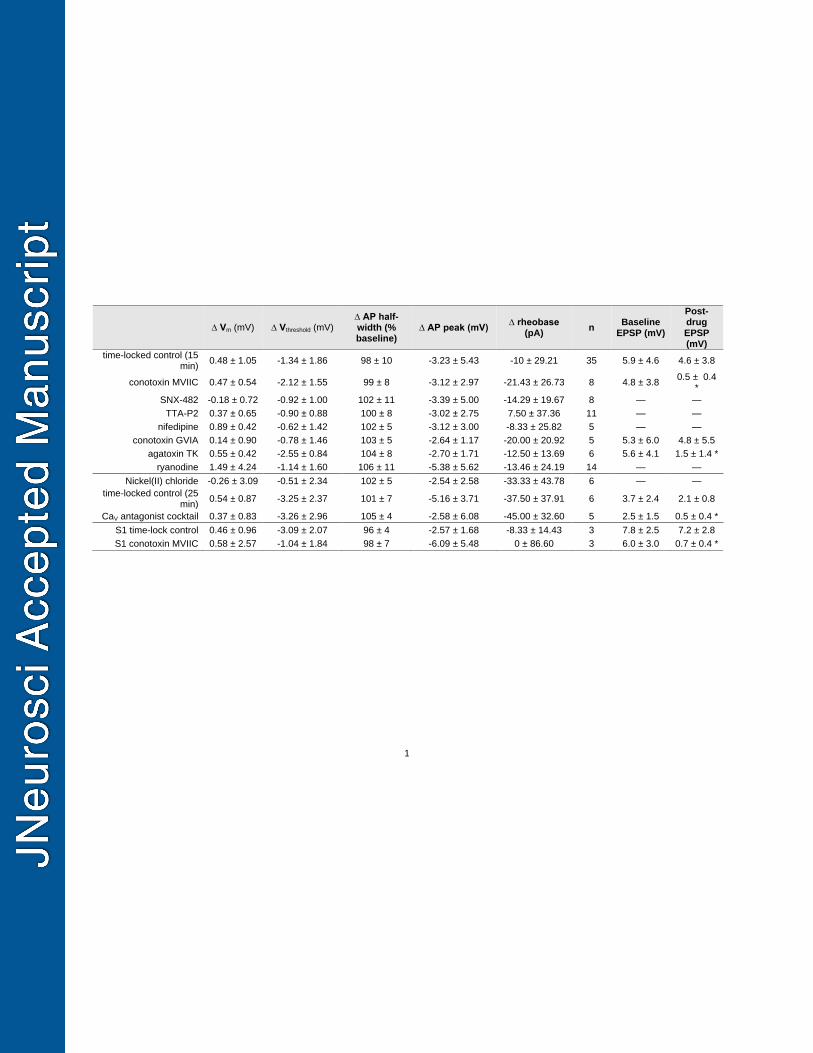
1
∆ Vm (mV) ∆ Vthreshold (mV) ∆ AP half-width (% baseline)
∆ AP peak (mV) ∆ rheobase
(pA) n
Baseline EPSP (mV)
Post-drug EPSP (mV)
time-locked control (15 min)
0.48 ± 1.05 -1.34 ± 1.86 98 ± 10 -3.23 ± 5.43 -10 ± 29.21 35 5.9 ± 4.6 4.6 ± 3.8
conotoxin MVIIC 0.47 ± 0.54 -2.12 ± 1.55 99 ± 8 -3.12 ± 2.97 -21.43 ± 26.73 8 4.8 ± 3.8 0.5 ± 0.4
*
SNX-482 -0.18 ± 0.72 -0.92 ± 1.00 102 ± 11 -3.39 ± 5.00 -14.29 ± 19.67 8 — —
TTA-P2 0.37 ± 0.65 -0.90 ± 0.88 100 ± 8 -3.02 ± 2.75 7.50 ± 37.36 11 — —
nifedipine 0.89 ± 0.42 -0.62 ± 1.42 102 ± 5 -3.12 ± 3.00 -8.33 ± 25.82 5 — —
conotoxin GVIA 0.14 ± 0.90 -0.78 ± 1.46 103 ± 5 -2.64 ± 1.17 -20.00 ± 20.92 5 5.3 ± 6.0 4.8 ± 5.5
agatoxin TK 0.55 ± 0.42 -2.55 ± 0.84 104 ± 8 -2.70 ± 1.71 -12.50 ± 13.69 6 5.6 ± 4.1 1.5 ± 1.4 *
ryanodine 1.49 ± 4.24 -1.14 ± 1.60 106 ± 11 -5.38 ± 5.62 -13.46 ± 24.19 14 — —
Nickel(II) chloride -0.26 ± 3.09 -0.51 ± 2.34 102 ± 5 -2.54 ± 2.58 -33.33 ± 43.78 6 — —
time-locked control (25 min)
0.54 ± 0.87 -3.25 ± 2.37 101 ± 7 -5.16 ± 3.71 -37.50 ± 37.91 6 3.7 ± 2.4 2.1 ± 0.8
CaV antagonist cocktail 0.37 ± 0.83 -3.26 ± 2.96 105 ± 4 -2.58 ± 6.08 -45.00 ± 32.60 5 2.5 ± 1.5 0.5 ± 0.4 *
S1 time-lock control 0.46 ± 0.96 -3.09 ± 2.07 96 ± 4 -2.57 ± 1.68 -8.33 ± 14.43 3 7.8 ± 2.5 7.2 ± 2.8
S1 conotoxin MVIIC 0.58 ± 2.57 -1.04 ± 1.84 98 ± 7 -6.09 ± 5.48 0 ± 86.60 3 6.0 ± 3.0 0.7 ± 0.4 *