Naval & Maritime Markets A Global & APAC Perspective
2011
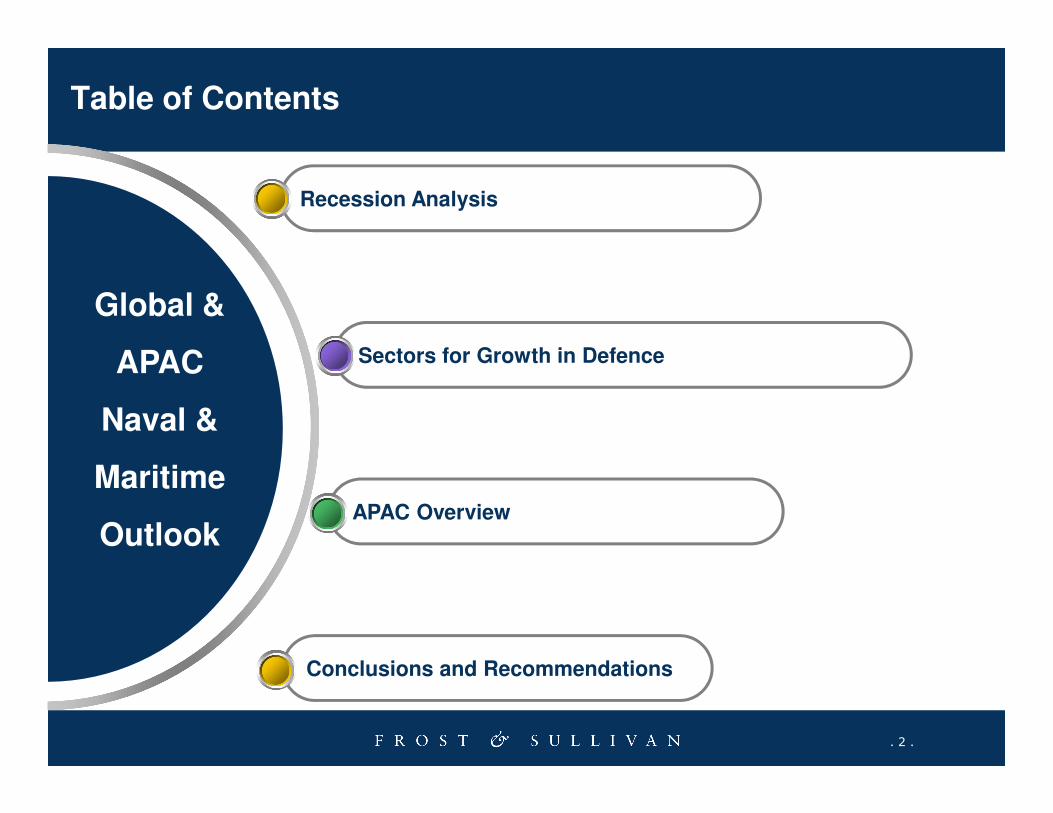
Table of Contents
Global &
APAC
Naval &
Recession Analysis
Sectors for Growth in Defence
. 2 .
Naval &
Maritime
OutlookAPAC Overview
Conclusions and Recommendations

Economic difficulty has had limited impact on global defence spending – other factors have greater influence
Defence Budgets (Global), 2007-2016
0
200
400
600
800
1,000
1,200
1,400
1,600
1,800
Bil
lio
n $
US$1.4 Trillion
21%
7%
3%
US$1.65
Trillion
30%
10%
4%
. 3 .
Global Defence Spending is expected to continue to grow at a steady rate over the next decade, with major growth centred in the Asia-Pacific region, much of which as a result of China’s incredible rise in spending
0
2008 2009 2010 2011 2012 2013 2014 2015 2016 2017
NORTH AMERICA EUROPE ASIA PACIFIC MIDDLE EAST ROW
2007
46%
23%
2016
34%
22%
2009-2012
Strong Growth Driven by Afghanistan & Iraq conflict
Significant spend on UORs
Market unpredictable and driven by events
2013-2016
Market stabilises as forces begin withdrawing from Afghanistan (such as Canada and The Netherlands)
Market increasingly driven by Asia-Pac
Unclear how futureUS-PRC rivalry will impact
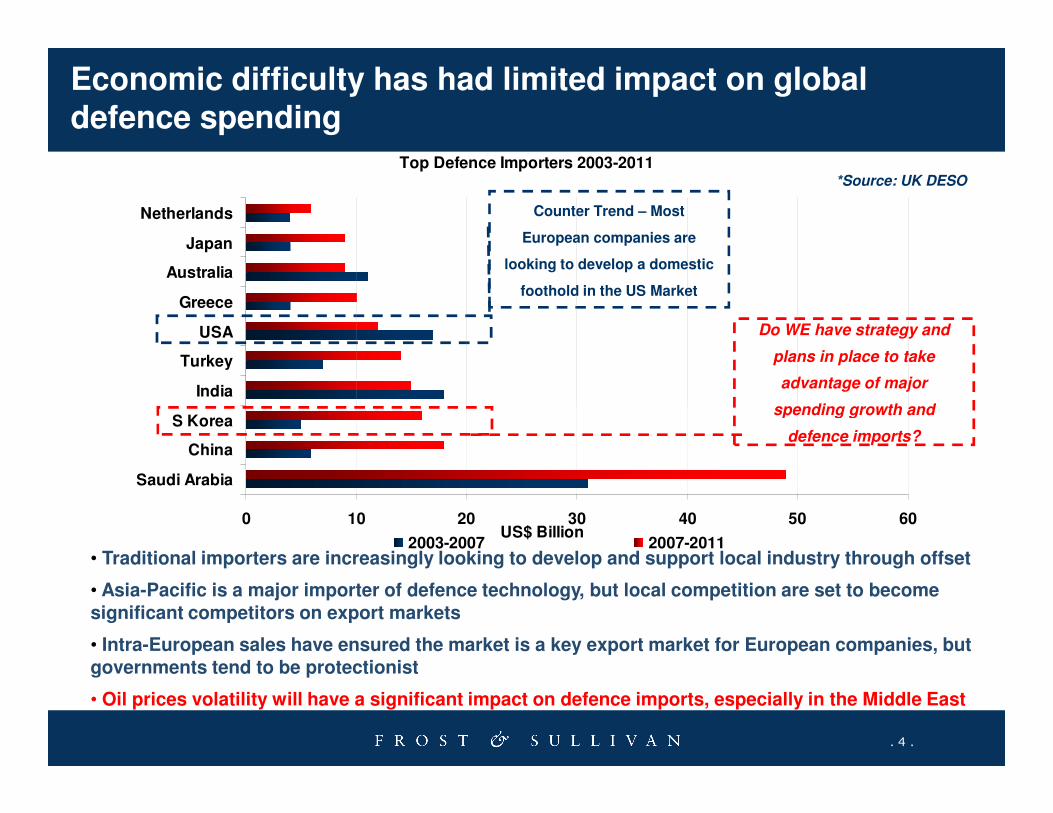
Economic difficulty has had limited impact on global defence spending
*Source: UK DESOTop Defence Importers 2003-2011
India
Turkey
USA
Greece
Australia
Japan
Netherlands Counter Trend – Most
European companies are
looking to develop a domestic
foothold in the US Market
Do WE have strategy and
plans in place to take
advantage of major
spending growth and
. 4 .
• Traditional importers are increasingly looking to develop and support local industry through offset
• Asia-Pacific is a major importer of defence technology, but local competition are set to become significant competitors on export markets
• Intra-European sales have ensured the market is a key export market for European companies, but governments tend to be protectionist
• Oil prices volatility will have a significant impact on defence imports, especially in the Middle East
0 10 20 30 40 50 60
Saudi Arabia
China
S Korea
US$ Billion2003-2007 2007-2011
spending growth and
defence imports?

Growth in Global Defence Spending is largely driven by growth in APAC, including China & South Asia
Top 20 Defence Budgets (excluding USA), 2008 vs 2018
0
50
100
150
200
250
300
CH
INA
UK
RU
SS
IA
FR
AN
CE
JA
PA
N
GE
RM
AN
Y
SA
UD
I AR
AB
IA
SO
UT
H K
OR
EA
IND
IA
ITA
LY
AU
ST
RA
LIA
SP
AIN
BR
AZ
IL
TU
RK
EY
CA
NA
DA
ISR
AE
L
NE
TH
ER
LA
ND
S
IND
ON
ES
IA
TA
IWA
N
GR
EE
CE
Billio
n $
2008 2018
US$1.4 Trillion US$1.65
Trillion
4%
3.4%
2.5%
2.9%
3.7%
2%
2.5%
1.8%
2.9%
1.6%
1.5%
. 5 .
Strong budgetary growth in markets like South Korea, India, Brazil and Turkey highlight where business opportunities will emerge and continue to drive and support the wider market growth
CH
INA
UK
RU
SS
IA
FR
AN
CE
JA
PA
N
GE
RM
AN
Y
SA
UD
I AR
AB
IA
SO
UT
H K
OR
EA
IND
IA
ITA
LY
AU
ST
RA
LIA
SP
AIN
BR
AZ
IL
TU
RK
EY
CA
NA
DA
ISR
AE
L
NE
TH
ER
LA
ND
S
IND
ON
ES
IA
TA
IWA
N
GR
EE
CE
2009 2018
10%
17%4.6%
4.1%
4.6%
4.3%
4.5%
4%
3.6%3.1%2.9%
CHINA UK RUSSIA FRANCE JAPANGERMANY SAUDI ARABIA SOUTH KOREA INDIA ITALY

Key Issues Impacting Industry Today
• Top line growth facing headwinds, Commercial aerospace and Defense cycles
peaking
• Change of US administration and shifting defense procurement priorities across
US and NATO
• Asian growth drives need for exposure across entire industry
• PMA and MRO models evolving
. 6 .
• Increasing industry consolidation, European firms building presence in US
defense market, Asian firms expanding globally
• Maintaining earnings growth as cycles slow, managing costs and margins
• Effective position in homeland security market to maximize opportunities

Sectors for Growth in Defence Markets
. 7 .
Sectors for Growth in Defence Markets

Defence Electronics Market worth cumulative US$ 314 Billion over the next decade
US$ 27 Billion US$ 35 BillionMarket Revenues by Segment (Global), 2007-2016
0
5000
10000
15000
20000
25000
30000
35000
40000
2007 2008 2009 2010 2011 2012 2013 2014 2015 2016
Millio
n $
17%
10%
8%
5%
10%
8%
16%
8%
5%
. 8 .
Major growth opportunities exist in C2, Communications and UAS segments
2007 2016
C2 Land Communications Land ISR Air ISR UAS Air T&S Land T&S
25%
25%
11%
12%
14%
8%5%
25%
23%
12%
25%
29%

Despite widespread procurement of new air platforms over the next decade, the total number of platforms in service will reduce significantly. Legacy systems will not be replaced on a 1 to 1 basis
Military Aircraft Procurement by Region (2008-2012)
0
50
100
150
200
250
300
350
400
2008 2009 2010 2011 2012
13%
30%
15%6%
1%
11%
11%
1%7% 1% 4%
Boeing Lockheed Martin Eurofighter Gmbh Dassault
SAAB Sukhoi EADS Alenia
BAE Systems Pilatus KAI
Aircraft Market Share by Company, 2008-2012 Lockheed will
continue to
dominate, but
consolidation
is a key
dynamic
. 9 .
Reducing numbers of air platforms combined with higher-tempo operations highlights the importance of through-life management of defence platforms
Air Platform Inventory (Europe), 2008-2017
0
2000
4000
6000
8000
10000
12000
2008 2009 2010 2011 2012 2013 2014 2015 2016 2017
Un
its
F/A F/W Other Rotary
10652
Air Platforms
9234
Air Platforms
Europe North-America Middle East Asia-Pacific

4000000
6000000
8000000
10000000
9, 449, 400 Personnel
8, 943, 998 PersonnelAsia-Pacific
A trend towards increased
professionalism in major
modernising Asia-Pacific
nations will see a strong
decrease in force numbers in
order to increase spend on
equipment.
Middle East
Middle-Eastern states will
generally be increasing in
size in response to significant
geo-political threats in the
region. Israel is an exception
in that it is expected to
reduce in size.
- +
Soldier Modernisation programmes and increasing use of electronics equipment could offer significant revenue potential in the form of support contracts and through life capability management
. 10 .
Top spenders on defence are reducing their force numbers to enable higher spend on equipment programmes, whilst a trend towards increased professionalism has meant a downturn in
conscription levels in developing countries
2000000
4000000
2008 2017
2007 2016
USA CHINA UK RUSSIA FRANCE JAPAN GERMANY
SAUDI ARABIA SOUTH KOREA INDIA ITALY AUSTRALIA SPAIN BRAZIL
TURKEY CANADA ISRAEL NETHERLANDS INDONESIA TAIWAN
Europe
European Countries are
tending to downsize their
militaries as part of plans to
modernise the force structure
and take advantage of next
generation technology and
outsourcing opportunities to
save money and maintain or
increase capability
North America
Both the US and Canada are
looking to significantly
increase the number of
military personnel they have
in response to shortages
observed as a result of high
operational commitments.
Spending per Soldier ratio
will likely suffer, however.

Continued Penetration of Tactical communications into lower force echelons will see the market grow at a rapid rate
Global Tactical Communications Unit Breakdown
600,000
700,000
800,000
900,000
1,000,000
Tactical Communications Installed Base, 2005
48%
17%
30%
2% 3%
2000
. 11 .
-
100,000
200,000
300,000
400,000
500,000
2005 2020
Un
its
Europe North America Latin America Africa M.East Asia Pac
Tactical Communications Installed Base, 2020
19%
15%
25%
36%
2% 3%
Vehicular Manpack Handheld Soldier Radio Airborne LOS Comms
2000

Global Unmanned Aerial Systems Market
US$2.8 Billion US$5.5 BillionUAS Market Revenues (Global), 2007-2016
0
1000
2000
3000
4000
5000
6000M
illio
n $
22%
21%
18%
. 12 .
Experience on operations will enable significant growth in the UAS market, with total spend of US$44.5 Billion over the next 10 years
2007 2008 2009 2010 2011 2012 2013 2014 2015 2016
US Europe Asia-Pac
2007 2016
61%21%
18%
62%
16%
61%

Key hot-topics in Defence
Unmanned
Systems
Unmanned
Systems
Weapons
Systems
Ground
Ships
• Increased focus on unmanned systems capabilities and less focus on the platform (Sensors, Data Links, Navigation, GCSs)
• Companies are looking to expand their Unmanned Systems product offerings through partnering and acquisition
• The UAS industry in the U.S. is increasingly becoming consolidated with approximately 80 percent of the market held by four
companies
• Significant budget resources will be allocated to upgrade programs for fire control systems
• Missiles will have improvements to the seeker and control technology and will have “re-pours” or new propulsion packages
procured
• Army vehicle reset is having a profound impact on the U.S. Defense vehicle industry for both manufacturers and suppliers
• Despite being on the chopping block for the last two years, programs such as the Navy’s Littoral Combat Ship (LCS) will have some
support from President Obama in 2009 and beyond
• It is expected however that the U.S. Navy’s acquisition system will change and this will have an impact on not only ship programs
but other naval acquisitions programs as well
. 13 .
Ground
Vehicles
Military
MRO
Training
Simulation
• Army vehicle reset is having a profound impact on the U.S. Defense vehicle industry for both manufacturers and suppliers
• Reset and refurbishment will positively impact vehicle procurement for the next 3-5 years
• The Joint Light Tactical Vehicle program could face setbacks however since the U.S. Army is consistently placing orders for new
HMMWVs
• Parts Manufacturing Authority (PMA) parts manufacturers are increasingly be challenged by original equipment manufacturers in
the military aircraft MRO space
• High aircraft engine cost in an emerging challenge for the military aircraft MRO market
• The aging military aircraft fleet however is increasing the potential for MRO revenue over the next 5-10 years
• Budget constraints and an inability to sustain funding sources for T&S programs has been restraining the market
• As resources are pulled to support ongoing conflicts in Iraq and Afghanistan, training and simulation has become less of a priority
• The growth in popularity of unmanned systems is helping to spur T&S for this market area, particularly in the UAS market segment
C4ISR
• Reequipping and expanding the ground forces and SOF will be key in 2009
• Technology focuses will be on communications, Intelligence, and Surveillance
• Possible funding shifts from the AF and the Navy to help rebuild the Army and the USMC
• Programs facing cutbacks in 2009 and beyond: FCS, TSAT, JTRS, and Manned Airborne ISR

Defence Budgets in selected Asia / Pacific Markets, 2009-2014
40
60
80
100
120
Billio
n U
S$
Asia/Pacific: Defence Budget Trends
US$ 75.86
Billion
US$ 103.54
Billion
. 14 .
0
20
2009 2010 2011 2012 2013 2014
Australia India S Korea Malaysia Pakistan Singapore
Asia/Pacific: Spending ratios 2010-2014
13%
34%
32%
6%
7%8%
The region is dominated by large-budget countries
such as India, South Korea and Australia
Even smaller
countries in the
region will
contribute to the
strong expected
growth
2009 2014
Solid growth in the Indian defence
budget – from $22 Billion to $36 Billion
from 2007-2014

. 15 .

. 16 .

. 17 .

. 18 .

Asia Pacific Maritime Security Market Assessment

. 20 .

. 21 .

. 22 .

. 23 .

. 24 .

. 25 .

Conclusions and Recommendations
. 26 .
Conclusions and Recommendations

The global recession will have an impact on defence, but other factors are likely to be more influential to the way the market will develop
1. The economic recession had less impact on security and defence markets
2.This is particularly the case in defence where budgets are committed to long-term programmes. However, there
are potential problems emerging:
• Introduction of new competitive forces to the market – If a country is reliant on IMF bailouts, defence
programmes are likely to be delayed significantly
• Long-term contradictions within under-funded defence equipment plans are presenting acute
problems in highly active military forces
• Wider economic slowdown and resulting fall in GDP will be a limiting factor on defence allocations
and potentially on wider related defence programme opportunities
. 27 .
• Prime contractors will have to consolidate their supply chains in critical areas to reduce the risk of a
key supplier failing
3. To overcome these challenges, and disrupt the opposition, it is more important than ever to:
• Look to expand in emerging markets such as India –Asia-Pacific will continue to grow at a relatively
high level
• Focus on after-market opportunities to access sustained revenue streams through PLC support
• Manage and look after the supply chain
• Match customer needs with innovative business models and solutions
After-market support and services are an attractive long-term recurring revenue stream to be addressed across the
defence market and limit the impact of delayed procurement

Speaker’s Details
Thank You
. 28 .
Ratan ShrivastavaDirector, Aerospace & Defence Practice
Hand Phone (Singapore) . +65 9175 1640
Hand Phone (India) Tel. + 91 98105 84849
Email: [email protected]

For Additional Information
Donna Jeremiah
Director
Corporate Communications
(603) 6204 5832
Carrie Low
Executive
Corporate Communications
(603)6204 5910
. 29 .
Jessie Loh
Manager
Corporate Communications
(65) 6890 0942