Fractional Aircraft Ownership Programs:
A Deeper Look into Why Operators Aren’t Profitable—Yet
J. Peter Fuchs
ADVISORY
KPMG LLP | Fractional Aircraft Ownership Programs 1
© 2006 KPMG LLP, a U.S. limited liability partnership and a member firm of the
1 Executive Summary
2 Introduction
3 Part 1: Revenue and Expenses3 This Is Not a Business for the Faint of Heart
3 Revenue Streams
7 Hourly Flight Expenses: A Very Slippery Line
10 Part 2: Adverse Selection10 Problem 1. The “Where” Factor:
Remote Customers
13 Problem 2. The “When” Factor: Demand Peaks
16 Part 3: Changing the Game
18 Part 4: In the Meantime, Efficiency and Cost Control
21 Conclusion
21 Contact Information
22 Notes
23 Appendix23 Charter Assumptions
24 Fractional Ownership Assumptions
Table of Contents
Executive SummaryFrom only a handful of jets in 1990, the fractional aircraft industry has grown to more than
1,000 aircraft and more than 8,000 owners in the United States, Europe, and the Middle East.
Revenue among the four largest operators now exceeds an estimated $4.0 billion annually,
and yet despite its popularity, the industry has been consistently unprofitable—even the
largest and most developed operators reported losses of more than $80 million in 2005. While
market demand for fractional aviation services is strong and the ownership base will continue
to grow, how long can these businesses endure without profits?
The industry’s poor financial performance is due not so much to inefficient operations manage-
ment but rather to a flawed pricing system. The major contributor to the problem is not high
fuel prices, excessive labor or capital equipment costs or most any of the other ills that plague
airlines, which are at best very distant cousins of fractional aircraft operators. The reasons—
and there are two—are far simpler. In what is truly a unique model, fractional shareowners are
charged rates that are “one size fits all,” and yet the costs to service them vary dramatically.
Originally established for the sake of simplicity, this undifferentiated pricing has led to a classic
adverse selection problem, where unprofitable customers are provided economic incentives
to choose fractional ownership over competing services, the prices of which might more
accurately reflect delivery costs.
Efficient operations will always be a necessary focus of management effort, especially in
inventory and logistics, fleet and crew planning and maintenance. These are areas where
operators can start now to leverage best practices and the knowledge they’ve accumulated
in the years since the industry was born to reduce costs and stem the “leakage” of money
from the P&L. Sustained profitability, however, will only come from a pricing system that
adequately recovers the costs incurred to service a customer.
KPMG network of independent member firms affiliated with KPMG International, a Swiss cooperative. All rights reserved. TYC 14846

KPMG LLP | Fractional Aircraft Ownership Programs 2
© 2006 KPMG LLP, a U.S. limited liability partnership and a member firm of the
…despite the continued
growth, for the most part
no one has made any
money in the fractional
aircraft business...
Why?
IntroductionIt started out as a great business idea: Get a bunch of people together who alone can’t justify
owning an entire private airplane, allow them to purchase a fraction of one, then let everyone
share access to the combined fleet. With enough participants and enough airplanes you
could cover the whole country with a network of private aircraft—a private airline, departing
anywhere for anyplace, anytime.
People liked the idea, and they still do. The fractional business model created in the late 1980s
by NetJets is now a multibillion-dollar industry operating nearly 1,000 aircraft in programs on
three continents. Customers include celebrities, executives, entrepreneurs, corporations
large and small, and even government agencies. Aircraft manufacturers continue to enjoy
unprecedented sales, and all types of support organizations, from caterers to fixed base
operators (FBOs), are enjoying the trickledown effect, thanks in no small part to the impact
of fractional operations.
There is no question that fractional ownership has been good for aviation. But despite the
continued growth, for the most part none of the major operators has made any money—at
least not with any consistency. Why? We can’t say for certain because of all of the fractional
operations are either privately held or subsidiaries of larger companies, so details are few.
But recent commentary in financial reports and a little bit of analysis of the fundamental
pricing structure can yield some clues. The answer is not because of high fuel prices,
excessive capital equipment costs or most any of the other ills that plague airlines, which are
at best very distant cousins of fractional aircraft operators. The reasons—and there are two—
are far simpler. In what is truly a unique model, fractional shareowners are charged rates that
are “one size fits all,” and yet the costs to service them vary dramatically. This undifferentiated
pricing has led to a classic adverse selection problem, where undesirable customers are
actually given incentives to choose fractional ownership for their private aviation needs. The
two characteristics that drive the profitability of a fractional customer, where they fly and
when they fly, are simply not considered. Together with a service standard that guarantees
availability, the result is a small group of customers that are so expensive to service that the
losses incurred to satisfy them can overwhelm the profits made from the remaining larger
group. These few customers simply do not pay enough to cover the costs to service their
business.
KPMG network of independent member firms affiliated with KPMG International, a Swiss cooperative. All rights reserved. TYC 14846

KPMG LLP | Fractional Aircraft Ownership Programs 3
© 2006 KPMG LLP, a U.S. limited liability partnership and a member firm of the
For a major fractional
aircraft management
company…the opportunity
to operate as an airline would
be like a walk in the park.
Part 1: Revenue and Expenses
This Is Not a Business for the Faint of HeartWhen one considers all of the moving parts of a major airline, most would agree that these
businesses face formidable logistical challenges every day. Each departure is a carefully
choreographed dance of schedulers, dispatchers, maintenance crews, pilots, and flight
attendants, and every flight is subject to the external influences of air traffic control delays
and weather. Every day is a veritable ballet with a cast of tens of thousands of employees,
passengers, aircraft and support equipment, spanning nations and continents.
For a major fractional aircraft management company, however, the opportunity to operate as an
airline would be like a walk in the park. With aircraft fleets often in the dozens and sometimes
well into the hundreds, these private airlines have all of the scale that even the largest airlines
have. In fact, the largest fractional operator, NetJets, operates more aircraft than Southwest
Airlines. What fractionals do not have, however, is a schedule. No regular routes, no hubs, no
timetable. Most airlines serve one or perhaps two hundred airports through a network of
regional service providers. Private aircraft can operate to more than 5,000 airports within the
United States alone, plus many more throughout the Caribbean, Mexico, Canada and through-
out the rest of the world. Every day for a fractional operator begins with aircraft and flight
crews spread among hundreds of airports. Yesterday was different, and tomorrow will be
different once again. In fact, it’s a new picture every day, and as clients make new trip
requests, aircraft break or weather interrupts, the picture changes—by the hour, and even
by the minute.
Despite the challenges, most of the fractionals do a remarkable job operating their networks.
With a safety record that surpasses even major air carriers, they show that they can get the
job done. But they often do so at a tremendous cost, and are often forced to literally “buy
their way” out of logistical corners. While success has provided several of the larger operators
some meaningful economies of scale, size alone cannot overcome the effect of a pricing
system that treats all customers the same.
Revenue StreamsRevenue streams and pricing structures for each of the fractionals are for the most part
identical, and grew out of a desire to provide a more simple solution to the confusing and
widely disparate charter market. Fractional operators sell an aircraft share, and then manage
the aircraft on the customer’s behalf. Its customers, who are really aircraft share owners,
typically commit to a five-year management agreement at the time of their purchase, during
which they pay the management company a flat monthly fee and an hourly flight charge.
KPMG network of independent member firms affiliated with KPMG International, a Swiss cooperative. All rights reserved. TYC 14846
KPMG LLP | Fractional Aircraft Ownership Programs 4
© 2006 KPMG LLP, a U.S. limited liability partnership and a member firm of th
Aircraft Share Sale Revenue
Upon joining a fractional program, the customer purchases an “undivided interest” in a specific
aircraft. The price is proportional to the share size, and for the most part it has to be a one-
sixteenth interest or greater. Fractional operators often buy aircraft at a discount from the
manufacturer, yet they are able to sell the share at a proportion of the full list price. During
economic cycles where growth in the fractional industry is strong, the margins can be
tremendous.1 During slow periods margins may thin and management may be faced with
unsold inventory challenges, but this is certainly not a unique business problem.
Expenses, specifically the cost of the aircraft and related selling expenses, are highly corre-
lated with revenues, so margins are relatively consistent. In fact, the profit generated from
share sales has to be spread out over several years to comply with GAAP, and this has the
effect of smoothing out the seasonality of fractional purchase activity. A stellar year-end sales
performance, or a dismal one for that matter, will be spread out over several years of financial
reporting. Assuming a favorable economic backdrop, decent brand, effective marketing and a
competitive product offering, the aircraft share sales department is a relatively straightforward
component of a fractional business’s financials.
But the organic growth of traditional fractionals has slowed over the last few years, and two
of the largest operators have even shown considerable contraction. Existing customers now
make up well over half of all new fractional sales as they trade to different aircraft or move to
other providers. Much of the new business coming into the fractional operators is through new
products such as membership cards. To be better insulated from the cyclical nature of aircraft
sales, over the long term management can’t rely on new aircraft sales to make up for operating
losses. Positive operating margins must be sustainable from management fees and hourly
flight fees alone.
Monthly Management Revenue
All fractionals also charge a monthly management fee, which is designed to cover the fixed
expenses associated with owning and operating an aircraft.2 These include hull and liability
insurance, pilot salaries, training, customer service, crew travel and per-diem expenses,
overhead and other miscellaneous support services. The retail rates are set in proportion to
the share size a customer owns, but also include a share of the expenses associated with
the extra “core” aircraft the operator must have available to be able to service higher demand
levels that are an inevitable part of the guaranteed access committment. More on this later,
but because the costs generally represent the more stable fixed expenses of aircraft
ownership and over the longer term can be scaled to a degree to offset a shrinking
customer base, fees can generally be set with confidence to ensure reasonable margins.
e KPMG network of independent member firms affiliated with KPMG International, a Swiss cooperative. All rights reserved. TYC 14846

KPMG LLP | Fractional Aircraft Ownership Programs 5
© 2006 KPMG LLP, a U.S. limited liability partnership and a member firm of th
al Profit vs. DemandM
D
Hourly Flight Revenue
This is where the rubber meets the road in fractional financials. While some twists are begin-
ning to develop, the basic revenue premise is simply that customers are billed an hourly fee
only for the time that they occupy the aircraft. The operator will typically add a bit of extra time
to cover taxi time for takeoff and landing, but does not invoice the customer for any of the
repositioning flight time that is required to meet the customer at the departure airport.3 That’s
only partially true, of course, because in the same way that management fee rates are set to
be able to cover a certain number of “core fleet” aircraft, hourly rates are also set to cover the
average expected repositioning costs. Nevertheless, hourly rates remain constant regardless
of a customer’s choice of:
• Departure point
• Destination
• Time of departure
• Day of departure
• Advance scheduling notice given
Looking at the cumulative revenue, the resulting math is pretty simple: hourly revenue earned
is in direct proportion to the number of hours flown. As demand increases, so does revenue.
A graph of the revenue line looks something like this:
Total Hourly Revenue vs. Demand
The interesting part comes into view when you consider the cost side of the equation. If those
five customer inputs didn’t have a direct impact on cost, then there wouldn’t be a need to vary
the fees charged to cover the associated expenses. But they do impact cost, and they impact
it dramatically.
Less Demand More(trips/period)
Less
Tota
lRev
enu
eM
ore
Cumulative Hourly Expenses vs. Demand
Operation
Less
Tota
lRev
enue
&E
xpen
se
e KPMG network of independent member firms affiliated with KPMG International, a Swiss cooperative. All rights reserved. TYC 14846
To
talE
xpen
seM
ore
L
Demand vs. Profit From Flight Operations
O
even
ue&
Exp
ense
KPMG LLP | Fractional Aircraft Ownership Programs 6
© 2006 KPMG LLP, a U.S. limited liability partnership and a member firm of th
S MNoon
Daily Demand
0
Typical demand
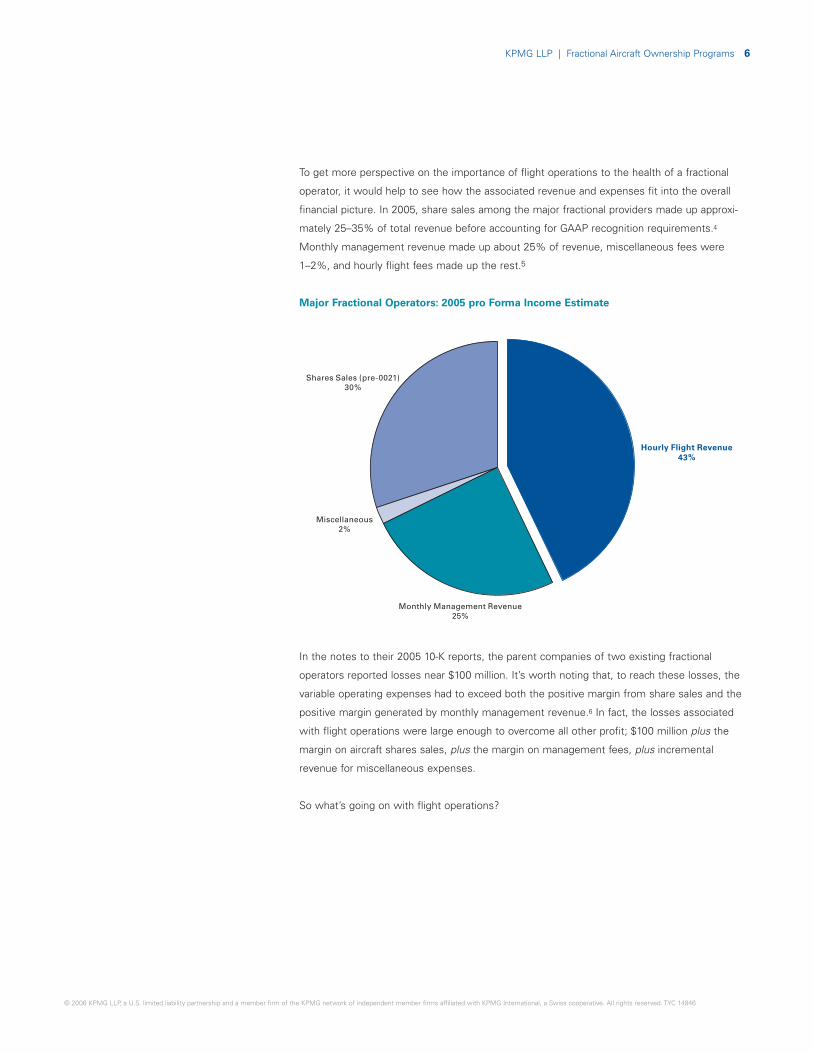
To get more perspective on the importance of flight operations to the health of a fractional
operator, it would help to see how the associated revenue and expenses fit into the overall
financial picture. In 2005, share sales among the major fractional providers made up approxi-
mately 25–35% of total revenue before accounting for GAAP recognition requirements.4
Monthly management revenue made up about 25% of revenue, miscellaneous fees were
1–2%, and hourly flight fees made up the rest.5
Major Fractional Operators: 2005 pro Forma Income Estimate
In the notes to their 2005 10-K reports, the parent companies of two existing fractional
operators reported losses near $100 million. It’s worth noting that, to reach these losses, the
variable operating expenses had to exceed both the positive margin from share sales and the
positive margin generated by monthly management revenue.6 In fact, the losses associated
with flight operations were large enough to overcome all other profit; $100 million plus the
margin on aircraft shares sales, plus the margin on management fees, plus incremental
revenue for miscellaneous expenses.
So what’s going on with flight operations?
Annual DemandWeekly Demand
Miscellaneous2%
Monthly Management Revenue25%
Hourly Flight Revenue43%
Shares Sales (pre-0021)30%
e KPMG network of independent member firms affiliated with KPMG International, a Swiss cooperative. All rights reserved. TYC 14846
Jan DecJunWT T SF
Excess capacity Excess demand

KPMG LLP | Fractional Aircraft Ownership Programs 7
© 2006 KPMG LLP, a U.S. limited liability partnership and a member firm of th
nal Profit vs. DemandM
. Profit From Flight Operations
D
ional Profit
O
Trip
s
Daily Demand
0.1292 in0.1292 in
Miscellaneous2%
Monthly Management Revenue25%
Hourly Flight Revenue43%
Shares Sales (pre-0021)30%
Hourly Flight Expenses: A Very Slippery Line
The Core Fleet
One of the key characteristics of fractional programs is that shareowners can request an
aircraft at any time, and the operator is obligated to provide an aircraft. If the operator doesn’t
have an aircraft available, it must present a substitute from an outside charter provider. This
comes at a significantly higher hourly cost for the operator, who often has to pay four to eight
times the direct operating costs for an equivalent amount of charter. To avoid these costs, the
operator has to keep extra aircraft and flight crews around for those times when more owners
want to fly than the customer-owned fleet will support. Those extra aircraft represent the
operator’s “core fleet.”
But how many core aircraft should be operated? Too many will lower the likelihood that charter
will be required but will result in higher-than-necessary fixed costs to keep them available.7
Too few aircraft will reduce the fixed costs but increase the risk of having to use charter.
In the end, it’s a strategic “make or buy” decision that the management of a fractional
program makes based on their estimates of demand and the predicted readiness of the
customer-owned fleet, as well as a determination of what level of charter will be acceptable
to customers.
Early calculations for the fractional business model theorized that for every four aircraft sold,
an operator would have to maintain one additional aircraft to maintain a charter rate of 2%.8
Reality has proven, however, that during periods of very high demand, the percentage can be
many times that rate.9 The impact on the cumulative costs is dramatic as demand increases.
Total Hourly Expenses vs. Demand
Less Demand More(trips/period)
Less
Tota
lRev
enu
eM
ore
Less Demand More(trips/period)
Less
To
talE
xpen
seM
ore
Cumulative Hourly Expenses vs. Demand
Operatio
Demand vs
Less
Tota
lRev
enue
&E
xpen
seTo
talR
even
ue&
Exp
ense
Operat
e KPMG network of independent member firms affiliated with KPMG International, a Swiss cooperative. All rights reserved. TYC 14846
L
e
Demand vs. Profit From Flight Operations
Operational Loss
Less M
Demand vs. Profit From Flight Operations
D
se
Noon
Typical demand Excess capacity Excess demand
Existing Demand
New Demand

KPMG LLP | Fractional Aircraft Ownership Programs 8
© 2006 KPMG LLP, a U.S. limited liability partnership and a member firm of t
Less Demand More
Less
To
talE
xpen
se
L
Tota
lRev
enue
&E
xpen
se
Operational Profit
O
M
. Profit From Flight Operations
ional Profit
O
More
Typical demand Excess capacity Excess demand
Existing Demand
New Demand
Miscellaneous2%
Monthly Management Revenue25%
Hourly Flight Revenue43%
Shares Sales (pre-0021)30%
At lower levels of demand, the slope of the cost line is relatively flat as trips are serviced
through internal aircraft. But as the operator runs out of capacity and is forced to use outside
charter, the costs mount rapidly.10 If you put the revenue and expense lines together, the
problem becomes pretty clear.
Operational Profit vs. Demand
Note the area between the two lines—demand along the horizontal axis that’s to the left of
the intersection represents profit, and the demand to the right would result in a loss. Let’s look
at it a bit closer, because this chart really illustrates the problem with fractional aviation in a
nutshell. It may help to think of this chart as a picture of what could happen with revenue or
expense during any sample period, given a certain level of demand. The period it represents
could be a day, a month, a week, a year—or even just an hour.
Most operators operate more than one fleet type, and in the event a trip cannot be met
with a customer’s specific fleet type, dispatch will usually try to service the mission on the
next larger fleet type. This is referred to as a complimentary upgrade (or forced upgrade).
Theoretically, total costs for the operator would be lowest when all demand is serviced by the
fleets in which owners are contract holders. This is the green arrow in the following graph. It
represents fiction of course, since this could only be the case if demand never exceeded
capacity within all fleets, there were no mechanical delays, and therefore no complimentary
upgrades or charter were necessary.
(trips/period)
Less Demand More(trips/period)
Tota
lRev
enue
&E
xpen
se
Demand vs. Profit From Flight Operations
Operational Profit
Operational Loss
Less
Demand vs
Tota
lRev
enue
&E
xpen
se
Operat
Less
he KPMG network of independent member firms affiliated with KPMG International, a Swiss cooperative. All rights reserved. TYC 14846

KPMG LLP | Fractional Aircraft Ownership Programs 9
© 2006 KPMG LLP, a U.S. limited liability partnership and a member firm of t
Demand More(trips/period)
L
Demand More(trips/period)
L
Hourly Expenses vs. Demand
L
Profit From Flight Operations
M
Daily Demand
But in the real world a fractional network will have to provide complimentary upgrades to
larger aircraft, and will have to use some charter during periods of peak demand. That
increases costs slightly as shown by the yellow arrow. With demand at the yellow arrow,
hourly flight revenue still exceeds variable operating expenses. The operator is using the
optimum mix of core aircraft and charter. Margin, represented by the difference between the
revenue and expense lines, is relatively thin, but there is some cushion available to absorb a
limited amount of additional upgrades and charter if demand increases a bit more. Again, the
use of some charter is not necessarily a bad thing, because the alternative is to maintain a
larger fleet of company-owned core aircraft to cover spikes in demand.
Operational Profit vs. Demand
But eventually the operator will run out of aircraft, and because core fleet cannot be rapidly
increased, the internal capacity becomes a hard ceiling over the short term. Demand beyond
this point, which we’ll call the “level of critical capacity” and shown by the red arrow, would
require nearly all additional trips to be flown by outside charter. As demand increases past the
level of critical capacity the impact of the higher expenses associated with charter eventually
reaches the breakeven point and losses mount rapidly.
Over the course of a year, most days are to the left side of the chart, but there are enough
to the right…some very far to the right, that the average is to the right. The reason is simply
that the current pricing arrangement offers the operator no ability to adjust the revenue line to
correlate with the increased costs associated with excessive demand. Just a few days with
demand levels above this point can wreak havoc on even a well-run business.
Operational Profit vs. Demand
Demand vs. Profit From Flight Operations
Less Demand More(trips/period)
Tota
lRev
enue
&E
xpen
se
Operational Profit
Operational Loss
otal
Rev
enue
&E
xpen
se
Operational Profit
Operational Loss
ber
ofTr
ips
he KPMG network of independent member firms affiliated with KPMG International, a Swiss cooperative. All rights reserved. TYC 14846
Demand(trips/period)
T
Less More
Demand vs. Profit From Flight Operations
D
Operational Loss
L
Num
KPMG LLP | Fractional Aircraft Ownership Programs 10
© 2006 KPMG LLP, a U.S. limited liability partnership and a member firm of the
Hartfordto White Plains(repositioning)
Seattleto Bozeman
(repositioning)
Salt Lake Cityto Las Vegas
(repositioning)
Bozeman toSalt Lake City
(revenue)
Part 2: Adverse Selection
The current fixed-rate, one-size-fits-all fractional aircraft ownership pricing system is a
downright bargain to a relatively small group of customers that drives a large proportion of an
operator’s costs. At the same time, the system charges unnecessarily high rates to the larger
group that ultimately should represent the bread and butter of fractional operators. Flat-rate
hourly pricing fails to consider the “where” and the “when” factor of a customer’s travel
characteristics, and together these are the biggest influences on fractional profitability.
Remember the five things that didn’t matter in the determination of retail pricing?
Let’s take a look at how they impact costs.
Problem 1.The “Where” Factor: Remote CustomersFractional operators only receive revenue for flights that are occupied. Repositioning flights are
a cost item with no redeeming qualities, and the fewer an operator has to do, the better its
margins will be. The benchmark statistic used across the industry to gauge performance is
called “occupied rate,” or sometimes “utility.” It is simply:
Owner Occupied Hours Flown
Total Hours Flown
The higher the ratio, the better financial performance is thought to be.11 The inverse would be
the “deadhead ratio.”
Consider an owner who wants to make a relatively short flight between two somewhat
remote airports. Longer repositioning legs can be expected, and if the owner’s aircraft type is
not nearby, the operator will have to either use a larger aircraft and absorb the accompanying
incremental cost or provide a charter aircraft. Once the trip is completed, this aircraft will
almost always have to be repositioned a longer-than-average distance to begin its next
revenue-generating leg.12
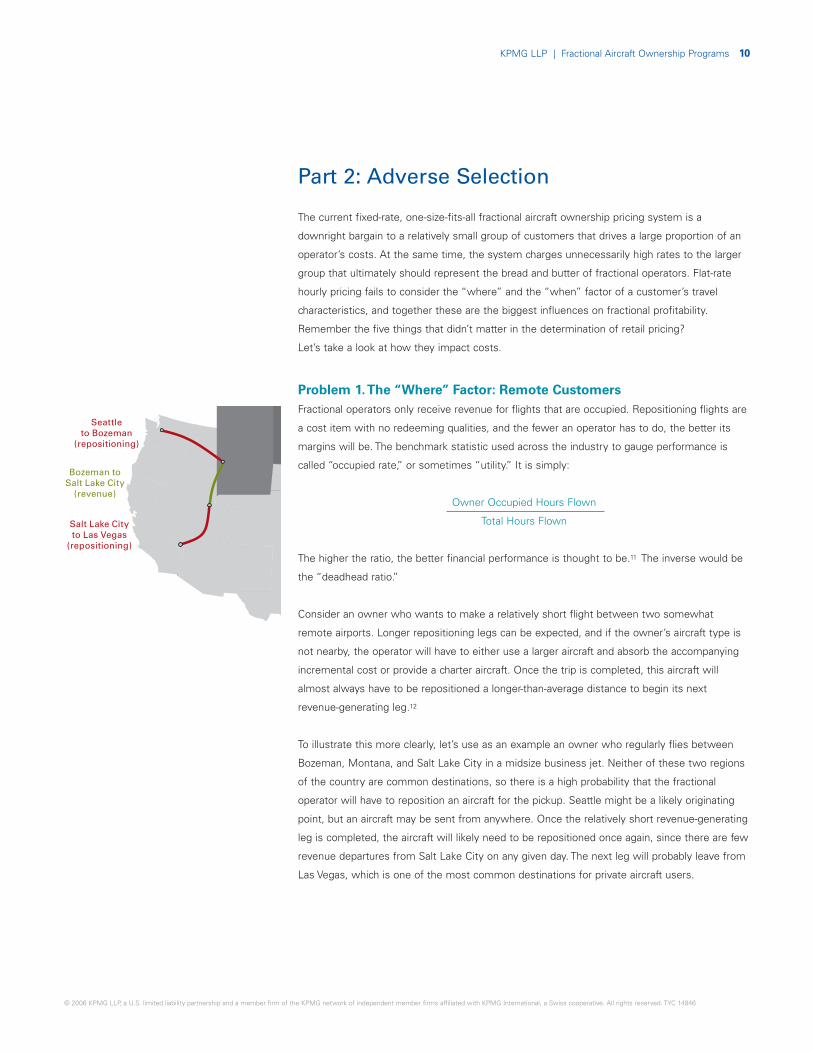
To illustrate this more clearly, let’s use as an example an owner who regularly flies between
Bozeman, Montana, and Salt Lake City in a midsize business jet. Neither of these two regions
of the country are common destinations, so there is a high probability that the fractional
operator will have to reposition an aircraft for the pickup. Seattle might be a likely originating
point, but an aircraft may be sent from anywhere. Once the relatively short revenue-generating
leg is completed, the aircraft will likely need to be repositioned once again, since there are few
revenue departures from Salt Lake City on any given day. The next leg will probably leave from
Las Vegas, which is one of the most common destinations for private aircraft users.
West Palm Beach to Naples
(repositioning)
White Plains to West Palm Beach
(revenue)
KPMG network of independent member firms affiliated with KPMG International, a Swiss cooperative. All rights reserved. TYC 14846
KPMG LLP | Fractional Aircraft Ownership Programs 11
© 2006 KPMG LLP, a U.S. limited liability partnership and a member firm of t
With as much non-revenue repositioning time as this trip represents, clearly it is not a desir-
able mission for the operator. When you consider the economics, it’s easy to see how only
a handful of these owners can undermine what would otherwise be a relatively profitable
operation.13 Yet in the current pricing structure there is nothing that allows the operator to
mitigate or recover the associated costs.
Let’s also look at it from the shareowner’s perspective. Aside from owning an entire aircraft,
the less-expensive alternative to fractional is usually going to be the use of a charter. Unlike
fractionals, however, the charter customer usually does pay for repositioning legs, often
making it an undesirable option for remote airports. Remember that fractional hourly rates are
set with some expected repositioning time built in, but the repositioning expenses presented
by a remote customer are more than the expected average. For these customers, fractional
can often be less expensive than charter. If that’s the case, why would such a customer ever
choose charter if fractional can be used for less?
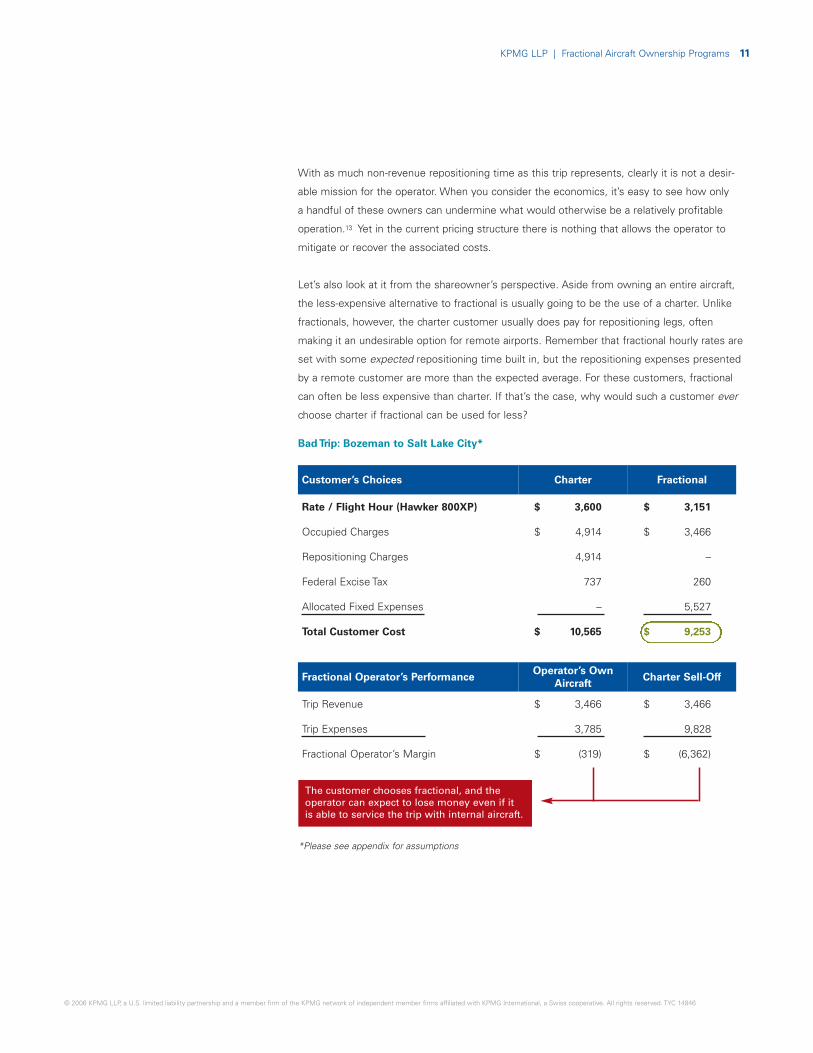
Bad Trip: Bozeman to Salt Lake City*
Customer’s Choices Charter Fractional
Rate / Flight Hour (Hawker 800XP) $ 3,600 $ 3,151
Occupied Charges $ 4,914 $ 3,466
Repositioning Charges 4,914 –
Federal Excise Tax 737 260
Allocated Fixed Expenses – 5,527
Total Customer Cost $ 10,565 $ 9,253
Fractional Operator’s PerformanceOperator’s Own
AircraftCharter Sell-Off
Trip Revenue $ 3,466 $ 3,466
Trip Expenses 3,785 9,828
Fractional Operator’s Margin $ (319) $ (6,362)
The customer chooses fractional, and theoperator can expect to lose money even if it is able to service the trip with internal aircraft.
*Please see appendix for assumptions
he KPMG network of independent member firms affiliated with KPMG International, a Swiss cooperative. All rights reserved. TYC 14846

KPMG LLP | Fractional Aircraft Ownership Programs 12
© 2006 KPMG LLP, a U.S. limited liability partnership and a member firm of t
Hartfordto White Plains(repositioning)
West Palm Beach to Naples
(repositioning)
White Plains to West Palm Beach
(revenue)
Long Trips, Better Airports—and Subsidizing the Remote Traveler
By contrast, let’s look at a customer who regularly flies from New York to south Florida, also in
a midsize business jet. Both regions are very popular among private aircraft travelers and are
frequented by the operator’s aircraft. The probability of having suitable and available aircraft
nearby is therefore higher, and expected repositioning expenses will be lower. In addition, a
long stage length like this is desirable for the operator because the repositioning costs that
are incurred on either end are spread over a larger number of revenue hours. But because of
undifferentiated pricing, customers who fly these profitable trips have just as compelling a
reason not to choose fractional as the geographically remote owner had to choose fractional.
Because so many people travel by private aircraft along the east coast, there are many charter
aircraft based at airports from Boston to Miami. Many of them would be suitable for a trip
between New York and south Florida. More availability will usually mean lower repositioning
costs will be charged to the customer, if any.14 Discounts can be negotiated with charter
operators for empty-leg returns, and buying block time can get that rate even lower. For this
type of trip, charter becomes a more competitive substitute, even after considering the
intangible benefits fractional offers.
Good Trip: White Plains to West Palm Beach*
Customer’s Choices Charter Fractional
Rate / Flight Hour (Hawker 800XP) $ 3,600 $ 2,871
Occupied Charges $ 10,584 $ 7,465
Repositioning Charges 5,670 –
Federal Excise Tax 1,219 560
Allocated Fixed Expenses – 11,904
Total Customer Cost $ 17,473 $ 19,929
Fractional Operator’s PerformanceOperator’s Own
AircraftCharter Sell-Off
Trip Revenue $ 7,465 $ 7,465
Trip Expenses 4,799 16,254
Fractional Operator’s Margin $ 2,667 $ (8,789)
The customer chooses charter, and fractionaloperator never has the opportunity to realizethe solid margin this type of trip provides.
*Please see appendix for assumptions
he KPMG network of independent member firms affiliated with KPMG International, a Swiss cooperative. All rights reserved. TYC 14846
KPMG LLP | Fractional Aircraft Ownership Programs 13
© 2006 KPMG LLP, a U.S. limited liability partnership and a member firm of th
The current fractional
ownership pricing model
encourages the profitable
customers who fly long trips
over densely traveled routes
to take their business to
competitors.
More(
More(
mand
L
tions
Operational Profit vs. DemandM
Monthly Management Rev22%
Fuel S
Demand vs. Profit From Flight Operations
oss
Less Demand More(trips/period)
Tota
lRev
enue
&E
xpen
se
Operational Profit
Operational Loss
Demand(trips/period)
Tota
lRev
enue
&E
xpen
se
Operational Profit
Operational Loss
Less More
Demand vs. Profit From Flight Operations
Tota
lRev
enue
&E
xpen
se
Operational Profit
Operational Loss
L
So for the remote customer, fractional ownership often offers a less expensive option to
charter, yet to the profitable east coast traveler, fractional is priced at a premium. This is the
flip side of the same adverse selection problem. The current fractional ownership pricing model
encourages the profitable customers who fly long trips over densely traveled routes to take
their business to competitors. These customers might be expected to get discounts, but
instead they are in effect subsidizing the expenses incurred to satisfy geographically remote
owners. The remote customer is receiving a far better value than the more profitable one on
the east coast.
What’s worse, many fractional customers are learning to game the system by using fractional
shares for their remote, short trips and use charter for the longer ones. This reduces fractional
operators’ share of the stronger margins provided by the best trips and leaves them with
many of the burdens of remote trips. Without systematic means to identify and either
screen or appropriately price owners, the “where” factor will continue to be a big source
of unnecessary cost.
As big as it is, however, it’s not as big as the other factor—the “when” factor.
Problem 2.The “When” Factor: Demand PeaksImagine you ran a golf club that was obligated to give its members the tee time they wanted,
even if they called late the night before they wanted to play. On a holiday weekend. Imagine
that if you didn’t have the requested time available, you had to cover all of the expenses to
take these members to another golf club. Your success would largely depend on how many
members you had in the club, and if you were lucky they wouldn’t all want to play at the same
time. Fractional aviation works in exactly that way. There are no sold-out flights, and there is
no overbooking.15
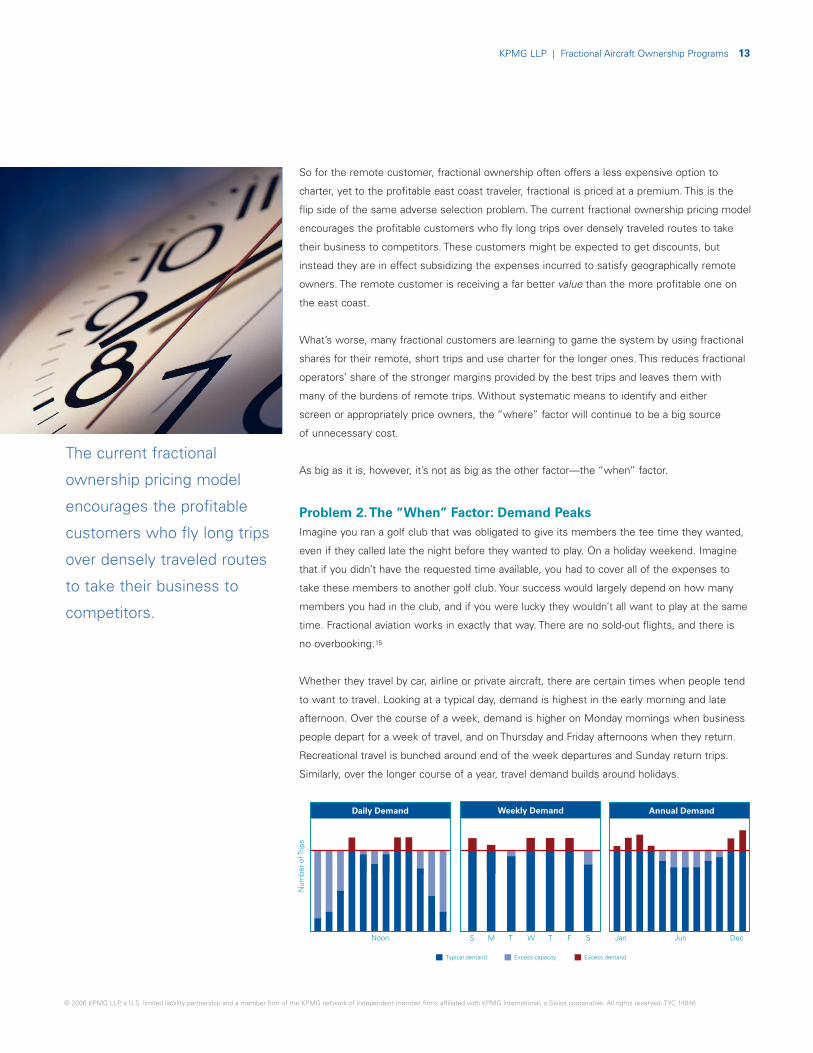
Whether they travel by car, airline or private aircraft, there are certain times when people tend
to want to travel. Looking at a typical day, demand is highest in the early morning and late
afternoon. Over the course of a week, demand is higher on Monday mornings when business
people depart for a week of travel, and on Thursday and Friday afternoons when they return.
Recreational travel is bunched around end of the week departures and Sunday return trips.
Similarly, over the longer course of a year, travel demand builds around holidays.
Jan DecJun
Annual Demand
S
Weekly Demand
WTM T SF
Num
ber
ofTr
ips
Noon
Daily Demand
0.1292 in0.1292 in
Typical demand Excess capacity Excess demand
Miscellaneous2%
Monthly Management Revenue25%
Hourly Flight Revenue43%
Shares Sales (pre-0021)30%
e KPMG network of independent member firms affiliated with KPMG International, a Swiss cooperative. All rights reserved. TYC 14846
man
d
Peak period demand as management hoped it would develop with smaller shares
Peak period demand as it has actually developed with smaller shares and membership cards
New Demand
KPMG LLP | Fractional Aircraft Ownership Programs 14
© 2006 KPMG LLP, a U.S. limited liability partnership and a member firm of th
Less Demand More(trips/period)
Lor
e
Cumulative Hourly Expenses vs. Demand
Demand vs. Profit From Flight Operations
Less D
ational Profit
O
M
vs. Profit From Flight Operations
ational Profit
O
More
%
Shares Sales (pre-0021)30%
Capacity
To meet that demand, fractional operators must predict when it will occur by fleet type, by day,
by time of day and by geographical concentration. The more advance notice managers have of
what the demand will be, the easier it will be to deploy assets to satisfy it most efficiently. But
because of the relatively long lead time required to add core fleet aircraft and hire the flight
crews needed to fly them, the short-term capacity of a fractional operator’s own fleet is for
the most part fixed. On the demand graphs shown on page 13, the network’s capacity is
shown as the red line, which must be set to optimize the cost of charter sell-off (peaks above
the line), and excess core fleet (valleys below the line).
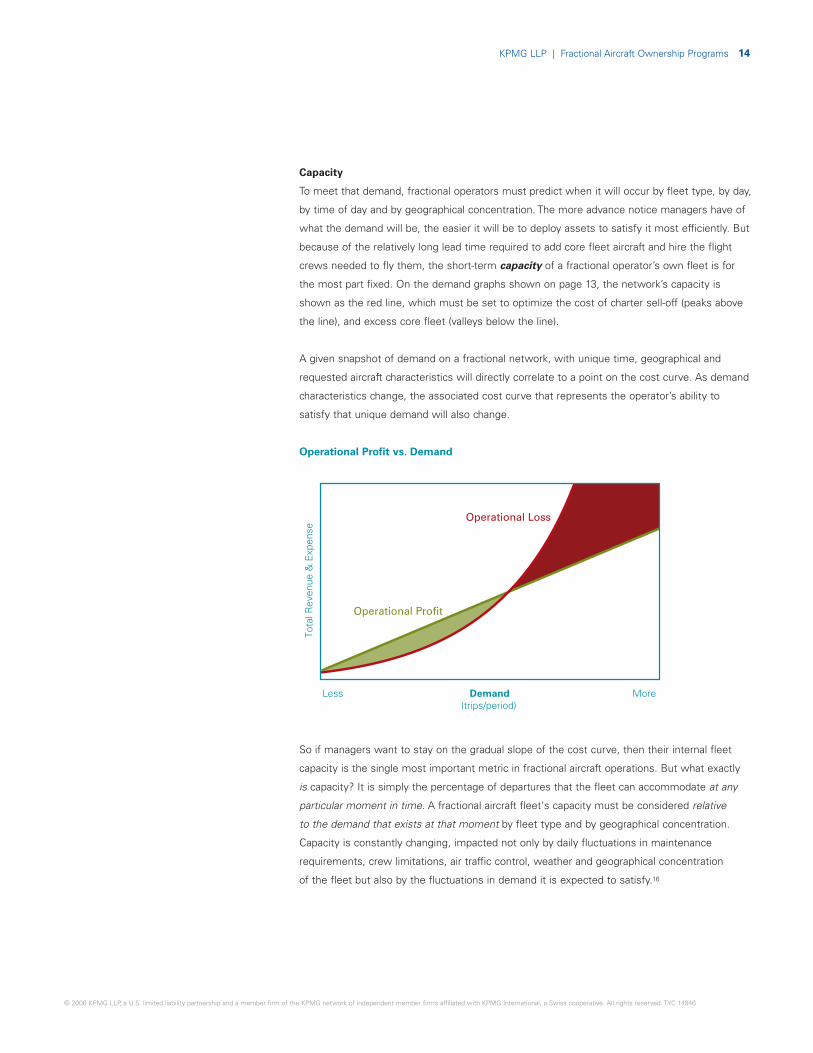
A given snapshot of demand on a fractional network, with unique time, geographical and
requested aircraft characteristics will directly correlate to a point on the cost curve. As demand
characteristics change, the associated cost curve that represents the operator’s ability to
satisfy that unique demand will also change.
Operational Profit vs. Demand
So if managers want to stay on the gradual slope of the cost curve, then their internal fleet
capacity is the single most important metric in fractional aircraft operations. But what exactly
is capacity? It is simply the percentage of departures that the fleet can accommodate at any
particular moment in time. A fractional aircraft fleet‘s capacity must be considered relative
to the demand that exists at that moment by fleet type and by geographical concentration.
Capacity is constantly changing, impacted not only by daily fluctuations in maintenance
requirements, crew limitations, air traffic control, weather and geographical concentration
of the fleet but also by the fluctuations in demand it is expected to satisfy.16
Less Demand More(trips/period)
Less
To
talE
xpen
seM
Less Demand More(trips/period)
Tota
lRev
enue
&E
xpen
se
Demand vs. Profit From Flight Operations
Operational Profit
Operational Loss
Tota
lRev
enue
&E
xpen
se
Oper
Less
Demand
Tota
lRev
enue
&E
xpen
se
Oper
Less
e KPMG network of independent member firms affiliated with KPMG International, a Swiss cooperative. All rights reserved. TYC 14846
KPMG LLP | Fractional Aircraft Ownership Programs 15
© 2006 KPMG LLP, a U.S. limited liability partnership and a member firm of t
More
More
Decn
Annual DemandWeekly Demand
Num
ber
ofTr
ips
Noon
Daily Demand
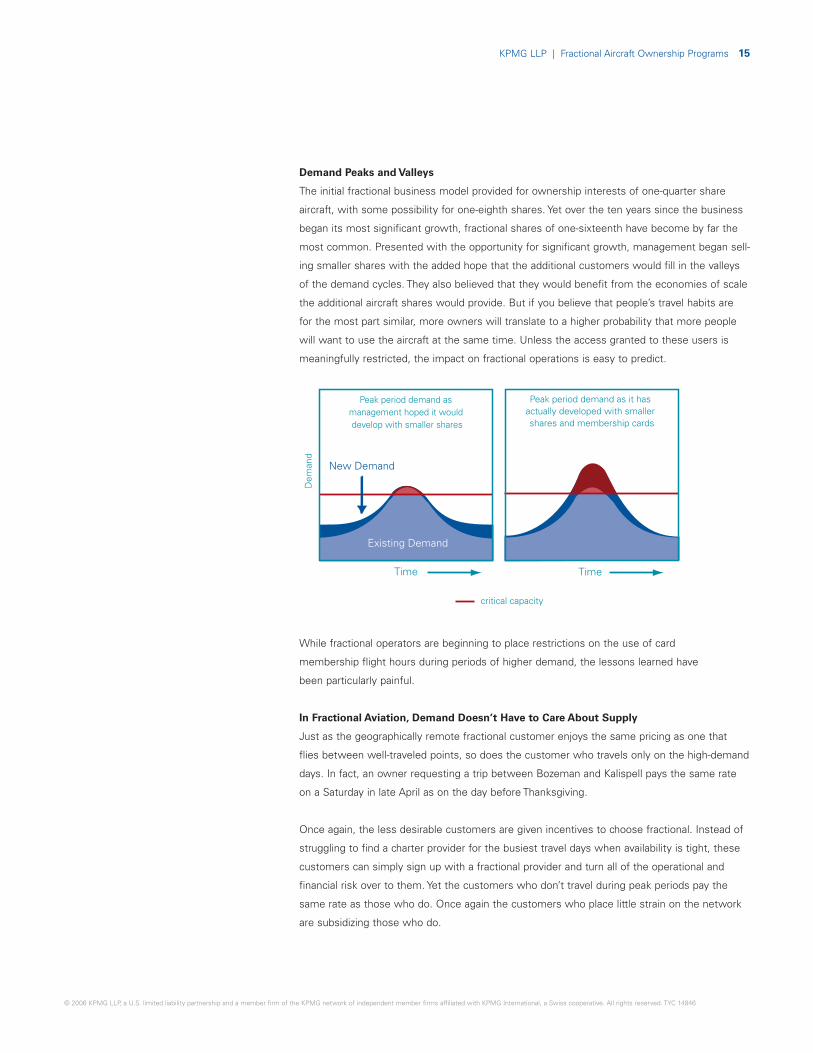
Demand Peaks and Valleys
The initial fractional business model provided for ownership interests of one-quarter share
aircraft, with some possibility for one-eighth shares. Yet over the ten years since the business
began its most significant growth, fractional shares of one-sixteenth have become by far the
most common. Presented with the opportunity for significant growth, management began sell-
ing smaller shares with the added hope that the additional customers would fill in the valleys
of the demand cycles. They also believed that they would benefit from the economies of scale
the additional aircraft shares would provide. But if you believe that people’s travel habits are
for the most part similar, more owners will translate to a higher probability that more people
will want to use the aircraft at the same time. Unless the access granted to these users is
meaningfully restricted, the impact on fractional operations is easy to predict.
While fractional operators are beginning to place restrictions on the use of card
membership flight hours during periods of higher demand, the lessons learned have
been particularly painful.
In Fractional Aviation, Demand Doesn’t Have to Care About Supply
Just as the geographically remote fractional customer enjoys the same pricing as one that
flies between well-traveled points, so does the customer who travels only on the high-demand
days. In fact, an owner requesting a trip between Bozeman and Kalispell pays the same rate
on a Saturday in late April as on the day before Thanksgiving.
Once again, the less desirable customers are given incentives to choose fractional. Instead of
struggling to find a charter provider for the busiest travel days when availability is tight, these
customers can simply sign up with a fractional provider and turn all of the operational and
financial risk over to them. Yet the customers who don’t travel during peak periods pay the
same rate as those who do. Once again the customers who place little strain on the network
are subsidizing those who do.
Time
Dem
and
Time
Peak period demand as management hoped it would develop with smaller shares
critical capacity
Peak period demand as it has actually developed with smaller shares and membership cards
Jan JuS WTM T SF
Typical demand Excess capacity Excess demand
Existing Demand
New Demand
he KPMG network of independent member firms affiliated with KPMG International, a Swiss cooperative. All rights reserved. TYC 14846
KPMG LLP | Fractional Aircraft Ownership Programs 16
© 2006 KPMG LLP, a U.S. limited liability partnership and a member firm of the
Demand More(trips/period)
L
Demand More(trips/period)
L
ourly Expenses vs. Demand
L Demand More(trips/period)
T
Profit From Flight Operations
onal Profit
Operational Loss
Tota
lRev
enue
&E
xpen
se
Operational Profit
Operational Loss
Daily Demand
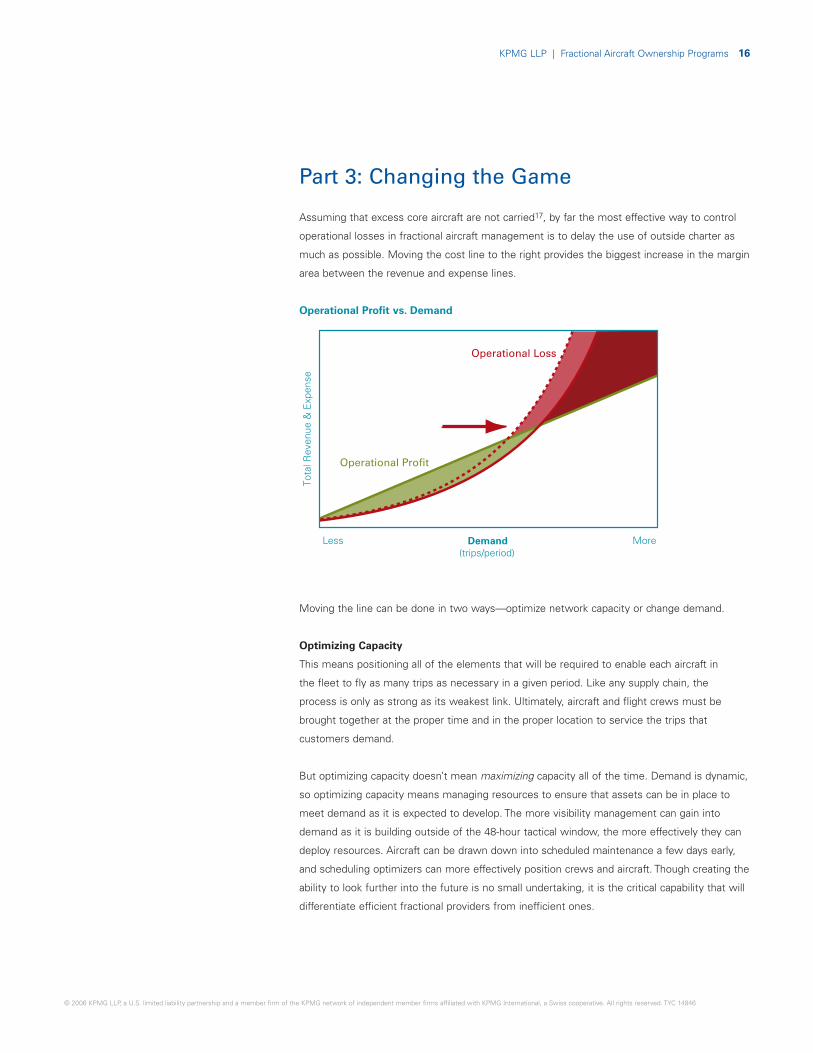
Part 3: Changing the Game
Assuming that excess core aircraft are not carried17, by far the most effective way to control
operational losses in fractional aircraft management is to delay the use of outside charter as
much as possible. Moving the cost line to the right provides the biggest increase in the margin
area between the revenue and expense lines.
Operational Profit vs. Demand
Moving the line can be done in two ways—optimize network capacity or change demand.
Optimizing Capacity
This means positioning all of the elements that will be required to enable each aircraft in
the fleet to fly as many trips as necessary in a given period. Like any supply chain, the
process is only as strong as its weakest link. Ultimately, aircraft and flight crews must be
brought together at the proper time and in the proper location to service the trips that
customers demand.
But optimizing capacity doesn’t mean maximizing capacity all of the time. Demand is dynamic,
so optimizing capacity means managing resources to ensure that assets can be in place to
meet demand as it is expected to develop. The more visibility management can gain into
demand as it is building outside of the 48-hour tactical window, the more effectively they can
deploy resources. Aircraft can be drawn down into scheduled maintenance a few days early,
and scheduling optimizers can more effectively position crews and aircraft. Though creating the
ability to look further into the future is no small undertaking, it is the critical capability that will
differentiate efficient fractional providers from inefficient ones.
Demand vs. Profit From Flight Operations
Less Demand More(trips/period)
Demand(trips/period)
Tota
lRev
enue
&E
xpen
se
Operational Profit
Operational Loss
Less More
Demand vs. Profit From Flight Operations
Demand(trips/period)
Tota
lRev
enue
&E
xpen
se
Operational Profit
Operational Loss
Less More
Num
ber
ofTr
ips
KPMG network of independent member firms affiliated with KPMG International, a Swiss cooperative. All rights reserved. TYC 14846

KPMG LLP | Fractional Aircraft Ownership Programs 17
© 2006 KPMG LLP, a U.S. limited liability partnership and a member firm of the
Changing Demand
Because hourly flight fees are set at the beginning of a five-year management agreement,
fractional operators have little opportunity to rapidly deploy a strategic pricing overhaul.
Surcharges cannot be introduced, and discounts would only benefit the customers that place
the least amount of strain on the system. Over the short term this would erode revenue
and do little for overall costs, as those enjoying discounts would be the customers who are
subsidizing the geographically remote and peak-demand customers.
Changing, and even shaping, demand requires management to challenge some of the
assumptions on which the fractional business was predicated, and in the end may be the
most difficult to implement. Variable pricing, preferred airports and even restricted capacity are
potential elements of an overhauled business model. Some of these are beginning to make
their way into fractional pricing plans, but nothing that alters the basic premise of the fractional
ownership business model. Changes that can be expected to have a meaningful financial
impact will require a paradigm shift—a strategy that questions current perceptions of
customers’ expectations and how they define value.
In the meantime, efforts to improve operational efficiency and increase capacity must be the
focus. While the shape of the cost curve is for the most part fixed, determined by the long-
term core fleet strategy, management can do things now to move it—and thereby widen the
gap between revenue and expense. As in any business, attention to operating expenses will
always be critical, and this is especially true in fractional aviation.
KPMG network of independent member firms affiliated with KPMG International, a Swiss cooperative. All rights reserved. TYC 14846
KPMG LLP | Fractional Aircraft Ownership Programs 18
© 2006 KPMG LLP, a U.S. limited liability partnership and a member firm of th
Demand More(trips/period)
L
Demand More(trips/period)
T
Profit From Flight Operations
Demand vs. Profit From Flight Operations
ional Profit
Operational Loss
L
Rev
enue
&E
xpen
se
Operational Loss
rof
Trip
s
Daily Demand
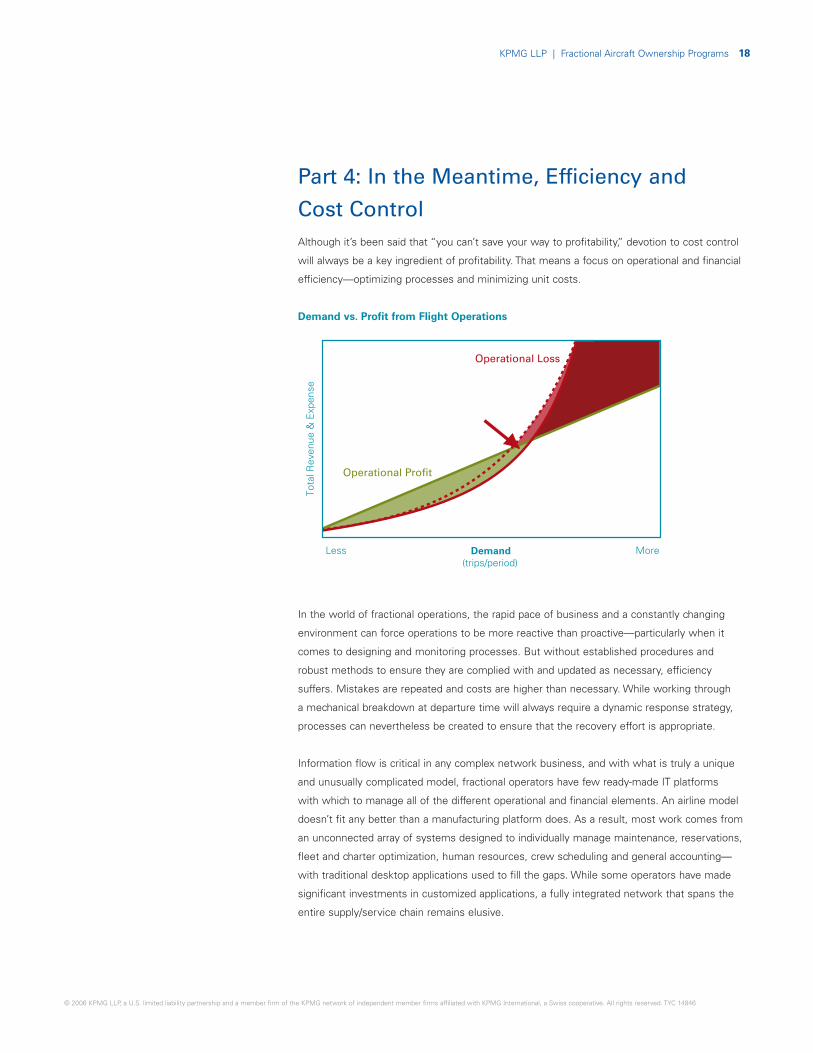
Part 4: In the Meantime, Efficiency and
Cost ControlAlthough it’s been said that “you can’t save your way to profitability,” devotion to cost control
will always be a key ingredient of profitability. That means a focus on operational and financial
efficiency—optimizing processes and minimizing unit costs.
Demand vs. Profit from Flight Operations
In the world of fractional operations, the rapid pace of business and a constantly changing
environment can force operations to be more reactive than proactive—particularly when it
comes to designing and monitoring processes. But without established procedures and
robust methods to ensure they are complied with and updated as necessary, efficiency
suffers. Mistakes are repeated and costs are higher than necessary. While working through
a mechanical breakdown at departure time will always require a dynamic response strategy,
processes can nevertheless be created to ensure that the recovery effort is appropriate.
Information flow is critical in any complex network business, and with what is truly a unique
and unusually complicated model, fractional operators have few ready-made IT platforms
with which to manage all of the different operational and financial elements. An airline model
doesn’t fit any better than a manufacturing platform does. As a result, most work comes from
an unconnected array of systems designed to individually manage maintenance, reservations,
fleet and charter optimization, human resources, crew scheduling and general accounting—
with traditional desktop applications used to fill the gaps. While some operators have made
significant investments in customized applications, a fully integrated network that spans the
entire supply/service chain remains elusive.
Demand(trips/period)
Tota
l Operational Profit
Less More
Demand vs. Profit From Flight Operations
Demand(trips/period)
Tota
lRev
enue
&E
xpen
se
Operational Profit
Operational Loss
Less More
Num
be
e KPMG network of independent member firms affiliated with KPMG International, a Swiss cooperative. All rights reserved. TYC 14846
KPMG LLP | Fractional Aircraft Ownership Programs 19
© 2006 KPMG LLP, a U.S. limited liability partnership and a member firm of t
But there are opportunities in the meantime. First, what will the information system look like
when it’s finished? Perhaps it will never really be “finished,” but what are the core capabilities
it must have? What processes can be designed and implemented now? Until such a network
is developed, it is even more critical that management establish and monitor the processes,
controls and reporting structures among business units. Operational and financial risks must
be identified, and mitigation strategies designed and implemented. The result will be a more
efficient operation, lower costs, and less “leakage” of money from revenue that has been
earned but not collected, and from expenses paid that have not been incurred. Some of the
more significant examples include:
• Third-Party Maintenance: Outsourcing of maintenance is playing a significant and growing
role in the fractional industry as operators identify scheduled work as a “non-core compe-
tency” and delegate it to third-party vendors. But which elements should be outsourced?
Where outsourcing has already occurred, management must periodically evaluate the
effectiveness of event scheduling and the integrity of the financial relationship. Monitoring
and oversight of these relationships can often become secondary in the fast-paced world
of fractional operations, yet it can be a significant source of waste as billing errors occur
and warranty claims go uncollected.
• Parts Management: The geographic challenges of relatively random flight operations and
fixed maintenance bases make inventory management a challenge. Some operators are out-
sourcing elements of parts procurement, while others maintain most control internally. In
either case, the design of robust processes and compliance oversight is a key to successful
cost control. Vendors’ internal processes must be reviewed and regularly audited to ensure
contracted pricing rates are honored, and to verify proper credit for warranty claims.
• Logistics and Procurement: The optimization of processes that support logistical elements
such as crew travel, accommodations, and meals as well as customer-related support func-
tions must be pursued with more than just the goal of absolute “lowest rate”. By working to
ensure that crews are in position, rested and fed, crew-supporting logistical functions are
critical in an operator’s ability to maximize available capacity. Low material cost is critical, but
the value-added elements that directly or indirectly improve capacity through better reliability
or management flexibility may far outweigh absolute unit cost. In an effort to verify lowest
rates, partnerships with airline, hotel, catering and general supply vendors may require
third-party independent review to ensure compliance while maintaining independence
and confidentiality.
• Customer Profitability Differentiation: Does the sales department have the ability to
know that it is proposing a contract that will probably lose money over the course of
the management agreement? To better understand the marginal and collective impact
of individual fractional shareowners, operators must develop processes to evaluate the
expected relative costs incurred to service them. Incentives for both sales personnel and
prospective customers should be aligned with the long-term interests of the company, and
must recognize that the profit realized in the initial share sale can be lost many times over
the course of the shareowner’s management contract.
he KPMG network of independent member firms affiliated with KPMG International, a Swiss cooperative. All rights reserved. TYC 14846
KPMG LLP | Fractional Aircraft Ownership Programs 20
© 2006 KPMG LLP, a U.S. limited liability partnership and a member firm of th
• Billing and Accounts Receivable: With hundreds if not thousands of individual owner con-
tracts against which a fractional operator must coordinate scheduling, operations and billing,
it is little wonder that “billing errors” has often been cited as a leading complaint among
fractional shareowners. Even if the customer relationship management (CRM) solution is
sufficiently robust, without effective processes and controls it is impossible to ensure that
credits are distributed appropriately, fleet upgrade and overuse charges are applied, fuel
surcharges are collected, and miscellaneous landing fees and concierge expenses are
passed through. Vendors, procurement, in-house maintenance and third-party support
providers must operate within a coordinated framework to ensure that data are accurate
and credits are properly applied.
• Labor Contracts: Unionization of pilot workforces has begun in the fractional industry, and
will likely continue across all national providers in the coming years. These contracts are
typically extremely complex, and the grievance awards that can be the result of noncompli-
ance can significantly increase labor expenses. Processes that ensure adherence to the
contract’s work rules and mitigate the impact of grievance awards can have significant
direct and indirect value.
• Charter Procurement: Advance purchase of block charter may reduce the unit cost as
network capacity is stretched, but can be an expensive proposition if demand does not
reach predicted levels and prepurchased charter capacity is not used. Strategic alliances
with charter operators may provide flexibility and an opportunity to reduce unit costs. But
like any vendor relationship, careful monitoring of the financial and accounting interactions is
important to ensure accurate billing and prevent overpayment. When dealing with a portfolio
of dozens of vendors, many of whom may not have robust financial control processes, it
becomes critical.
• Key Performance Metrics: Across many industries, finance and accounting functions are
often considered to be “backoffice support,” but accurate information flow to and from these
groups is absolutely critical to efficiency in a fractional operation. With hundreds of decisions
to make every day, managers and line personnel in every department must have the very
best information possible to ensure the resources they deploy are the right ones. Are
functional leaders getting the operational and financial information they need to manage
their businesses? Are crew scheduling, maintenance and flight scheduling managers using
the right key performance indicators? For example, when does the repositioning rate really
matter? What are the best ways to quantify maintenance department performance?
Improving efficiency and plugging the financial leaks are interim steps in the development of
fractional aviation, but mastery of internal processes is more critical now than ever. To improve
any or all of these also provides indirect benefits of enhanced Sarbanes-Oxley compliance and
improves return on invested capital (ROIC) and working capital metrics.
e KPMG network of independent member firms affiliated with KPMG International, a Swiss cooperative. All rights reserved. TYC 14846

KPMG LLP | Fractional Aircraft Ownership Programs 21
© 2006 KPMG LLP, a U.S. limited liability partnership and a member firm of the
Conclusion
Despite the financial challenges, fractional aviation is here to stay. Driven by the passion
and dedication of thousands of people, the outstanding level of service reported by the
vast majority of customers is remarkable. Customers clearly want this service.
Visionary fractional operators have an opportunity to redefine the business model just as
advances in airframe, engine, and navigation capabilities align in the most dramatic aerospace
convergence in decades. Many new markets will be opened from the portal offered by the
fractional aircraft ownership model, and to those prepared with a disciplined operation and
the vision to recognize and deliver value, the future is bright indeed.
Contact Information
J. Peter Fuchs
KPMG LLP
One Cleveland Center
Suite 2600
1375 East Ninth Street
Cleveland, Ohio 44114
Office: 216-875-8242
Fax: 216-803-5740
KPMG network of independent member firms affiliated with KPMG International, a Swiss cooperative. All rights reserved. TYC 14846
KPMG LLP | Fractional Aircraft Ownership Programs 22
Notes
1 Recent accounting pronouncements have
required that fractional operators recognize
share margin under the rules proscribed by
EITF-0021. Rather than booking revenues and
expenses associated with the sale of aircraft
shares at the time of the sale, operators must
spread them over the course of an expected
fractional contract life.
2 Source: http://www.netjets.com
/The%20NetJets%20Program/cost.asp
(May 2006)
3 Over the last few years most fractionals have
instituted a fuel surcharge to recover the cost of
rising fuel prices. The net impact of this, how-
ever, is simply to increase the hourly flight fee.
4 EITF-0021’s adjustments to the recognition of
share sale revenue can have a significant impact
on the relative weight of each revenue stream.
Also, membership cards can be accounted for a
number of ways, and here they are assumed to
be in hourly flight revenue.
5 In most programs, hourly flight revenue actually
consists of several parts:
• Base hourly revenue, which is based on the
contracted rates for hours flown in the fleet
that the shareowner holds an interest. The
operators average rate in any period is most
impacted by the mix of fleet types flown.
• Interchange revenue represents the pre-
mium rates paid by shareowners when they
request flights in a fleet other than the one
in which an interest is held.
• Fuel surcharge revenue seeks to recapture
the operator’s rising fuel costs. The expense
that exceeds the base fuel component
included in the contracted rate is passed to
the shareowner as an hourly surcharge.
• Miscellaneous revenue, such as supple-
mental catering, repositioning charges for
flights outside of predetermined service
areas, cancellations, etc.
© 2006 KPMG LLP, a U.S. limited liability partnership and a member firm of the
6 The fixed expenses are assumed to generate a
positive margin as previously mentioned. If an
operator were to maintain an excessive core
fleet, one might expect that monthly manage-
ment revenue would not be sufficient to over-
come the additional carrying costs. But an
excess core fleet would be expected to drive
lower charter sell-off expenses, and this was
not the case in 2005.
7 Remember that while some core expenses are
included, the management fees are set once at
the beginning of a customer’s five year contract
with a forecasted core fleet size built-in for the
entire term. A increase in the core fleet would
not be offset by any additional revenue.
8 Source: http://www.eclipseaviation.com
/index.php?option=com_newsroom&task
=viewarticle&id=138&Itemid=347
(May 2006)
9 In the first quarter of 2005 the major fractionals
experienced extremely high levels of demand,
and Warren Buffet, the Chairman of NetJets’
parent company Berkshire Hathaway, specifi-
cally blamed the expenses from charter sell-offs
for the dismal financial performance of the
period. Most fractional shareowners are willing
to pay a premium for the perceived benefits the
business model provides, including a perception
of enhanced safety, simplified pricing, and more
consistent service. For the most part, they will
not accept more than the very occasional sell-
off trip.
10 Same as previous.
11 For the most part, a higher occupied rate is
better, but it’s not always that simple. System
occupied rate can be inflated by using more
charter, as trips that are known to have low
occupied rates can be sold off. The result is
often higher total costs.
12 “Remote” is a relative term, as it describes the
proximity of an origin or destination relative to a
network’s typical service area. Fleet size can
mitigate some of the effects of remote opera-
KPMG network of independent member firms affiliated with KPMG Internatio
tions, as can a limited service area. In either
case, an operator is theoretically more likely
have aircraft in a position to be deployed
without excessive repositioning.
13 Same as previous.
14 Many charter operators have often enjoyed the
ability to “double dip” their customers, charging
one for the “repositioning” of an aircraft that
in reality was occupied by another paying cus-
tomer. This will continue, but increased compe-
tition, improved transparency and better insight
will allow many customers to avoid the practice
or pay reduced “empty-leg return” rates.
15 The industry has for the most part defined
certain days as “peak travel days” where
advance-booking notification requirements are
lengthened and where departure times can be
adjusted by the operator within given limits. But
even once capacity is reached, the operator still
has no ability to refuse flights.
16 Where the aircraft are positioned geographically
can also have an important impact on capacity.
A large proportion of aircraft positioned on the
west coast after a typical wave of late afternoon
east to west trips will leave a large proportion
out of position for early morning departures on
the east coast. This can be particularly true for
large cabin aircraft.
17 In this context, “excess” does not mean “any”
core aircraft, but any above and beyond what is
considered to be optimal for the target mix of
internally flown and chartered aircraft.
nal, a Swiss cooperative. All rights reserved. TYC 14846
KPMG LLP | Fractional Aircraft Ownership Programs 23
© 2006 KPMG LLP, a U.S. limited liability partnership and a member firm of the
Appendix
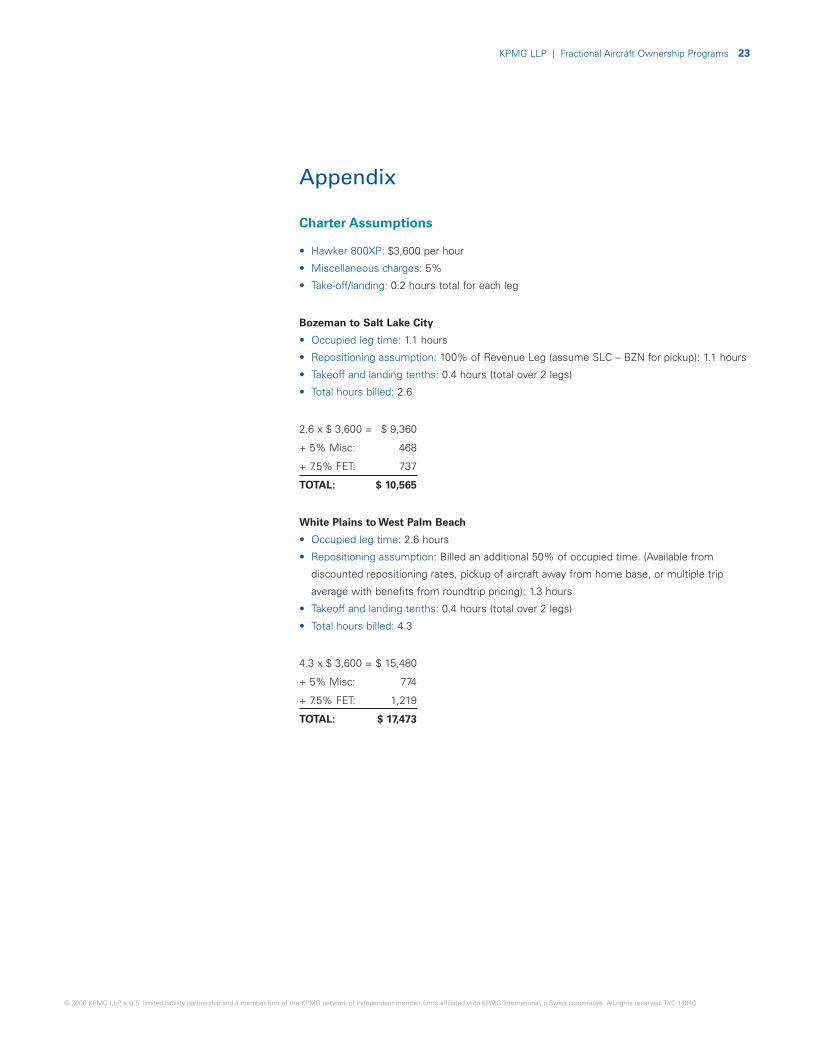
Charter Assumptions
• Hawker 800XP: $3,600 per hour
• Miscellaneous charges: 5%
• Take-off/landing: 0.2 hours total for each leg
Bozeman to Salt Lake City
• Occupied leg time: 1.1 hours
• Repositioning assumption: 100% of Revenue Leg (assume SLC – BZN for pickup): 1.1 hours
• Takeoff and landing tenths: 0.4 hours (total over 2 legs)
• Total hours billed: 2.6
2.6 x $ 3,600 = $ 9,360
+ 5% Misc: 468
+ 7.5% FET: 737
TOTAL: $ 10,565
White Plains to West Palm Beach
• Occupied leg time: 2.6 hours
• Repositioning assumption: Billed an additional 50% of occupied time. (Available from
discounted repositioning rates, pickup of aircraft away from home base, or multiple trip
average with benefits from roundtrip pricing): 1.3 hours
• Takeoff and landing tenths: 0.4 hours (total over 2 legs)
• Total hours billed: 4.3
4.3 x $ 3,600 = $ 15,480
+ 5% Misc: 774
+ 7.5% FET: 1,219
TOTAL: $ 17,473
KPMG network of independent member firms affiliated with KPMG International, a Swiss cooperative. All rights reserved. TYC 14846
KPMG LLP | Fractional Aircraft Ownership Programs 24
© 2006 KPMG LLP, a U.S. limited liability partnership and a member firm of t
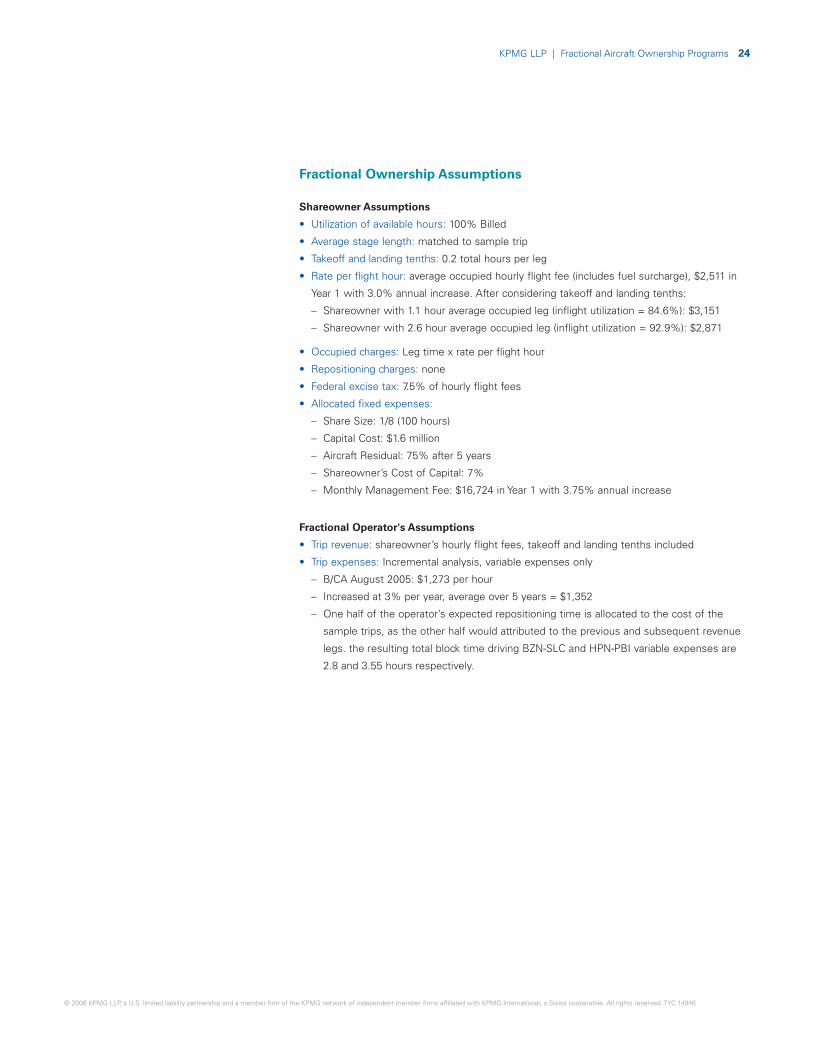
Fractional Ownership Assumptions
Shareowner Assumptions
• Utilization of available hours: 100% Billed
• Average stage length: matched to sample trip
• Takeoff and landing tenths: 0.2 total hours per leg
• Rate per flight hour: average occupied hourly flight fee (includes fuel surcharge), $2,511 in
Year 1 with 3.0% annual increase. After considering takeoff and landing tenths:
– Shareowner with 1.1 hour average occupied leg (inflight utilization = 84.6%): $3,151
– Shareowner with 2.6 hour average occupied leg (inflight utilization = 92.9%): $2,871
• Occupied charges: Leg time x rate per flight hour
• Repositioning charges: none
• Federal excise tax: 7.5% of hourly flight fees
• Allocated fixed expenses:
– Share Size: 1/8 (100 hours)
– Capital Cost: $1.6 million
– Aircraft Residual: 75% after 5 years
– Shareowner’s Cost of Capital: 7%
– Monthly Management Fee: $16,724 in Year 1 with 3.75% annual increase
Fractional Operator's Assumptions
• Trip revenue: shareowner’s hourly flight fees, takeoff and landing tenths included
• Trip expenses: Incremental analysis, variable expenses only
– B/CA August 2005: $1,273 per hour
– Increased at 3% per year, average over 5 years = $1,352
– One half of the operator’s expected repositioning time is allocated to the cost of the
sample trips, as the other half would attributed to the previous and subsequent revenue
legs. the resulting total block time driving BZN-SLC and HPN-PBI variable expenses are
2.8 and 3.55 hours respectively.
he KPMG network of independent member firms affiliated with KPMG International, a Swiss cooperative. All rights reserved. TYC 14846

The information contained herein is of a general nature and is not intended to address the circum-stances of any particular individual or entity. Although we endeavor to provide accurate and timelyinformation, there can be no guarantee that such information is accurate as of the date received orthat it will continue to be accurate in the future. No one should act upon such information withoutappropriate professional advice after a thorough examination of the particular situation.
© 2006 KPMG LLP, a U.S. limited liability partnership and a member firm of the KPMG network ofindependent member firms affiliated with KPMG International, a Swiss cooperative. All rightsreserved. All rights reserved. 14846TYC
KPMG and the KPMG logo are registered trademarks of KPMG International, a Swiss cooperative.