FORESTRY FOR SUSTAINABLE BIOMASS PRODUCTION ANDCARBON SEQUESTERATION IN INDIA
N.H. RAVINDRANATH1, P. SUDHA1 and SANDHYA RAO2
1Centre for Ecological Sciences, Indian Institute of Science, Bangalore – 560 012, India2Department of Civil Engineering, IIT, New Delhi, India
Abstract. A sustainable forestry scenario aimed at meeting the projected biomass demands, haltingdeforestation and regenerating degraded forests was developed and analyzed for additionality ofmitigation and cost-effectiveness for India. Similarly, mitigation potential of a commercial forestryscenario aimed at meeting the biomass demands from forestry activities on private land was assessed.India has a significant scale baseline scenario afforestation and effective forest conservation activities.India is afforesting at an average gross rate of 1.55 ×10⁶ ha yr−1 over the past 10 years, while thegross deforestation rate was 0.272 ×10⁶ ha yr−1 during the same period. The sustainable forestryscenario could lead to an additional carbon (C) stock of 237 ×106 Mg C during 2000 to 2012,while the commercial forestry scenario apart from meeting all the incremental biomass demands(estimated for 2000 to 2015) could potentially lead to an additional carbon stock of 78 ×106 MgC during 2000 to 2012. Short- and Long-rotation forestry activities are commercially viable. Withappropriate policies and financial incentives all the industrial wood, sawnwood and commercialfuelwood requirement could be met through commercial forestry, so that government funds couldbe dedicated for conserving state owned forests and meeting subsistence biomass demands. Thecommercial forestry activities could receive financial support under greenhouse gas (GHG) abate-ment programmes. The government, however, needs to develop institutions and guidelines to process,evaluate, approve and monitor forestry sector mitigation projects.
Keywords: additionality of carbon abatement, commercial forestry, cost-effectiveness, India
1. Introduction
The forestry sector, apart from being a source of carbon dioxide (CO2), also providesopportunity for reducing atmospheric CO2. Tropical countries, offer large oppor-tunities for reducing CO2, due to several factors such as: i) they have in the recentdecades experienced and continue to experience large deforestation rates (at 16×106 ha during the 1980s), thus offering potential for reducing deforestation andassociated carbon emissions; ii) part of the vast deforested areas and degradedpasture areas is available for reforestation and afforestation for meeting biomassdemands as well as carbon sequestration; iii) biomass demands of a growing popu-lation could be met through sustainable forestry. Several attempts have been madeto estimate the mitigation potential in developing countries and the potential isshown to be large (Sathaye and Ravindranath 1998). An earlier study for Indiashowed a mitigation potential in the range of 23 to 175 ×106 Mg C, requiring
Mitigation and Adaptation Strategies for Global Change 6: 233–256, 2001.© 2001 Kluwer Academic Publishers. Printed in the Netherlands.
234 N.H. RAVINDRANATH ET AL.
an annual investment of US$2.1 billion at 1994 prices over a six years period(Ravindranath and Somashekar 1995).
There is a need to reassess the climate change mitigation opportunities in Indiain the context of sustainable and commercial forestry strategies. Forestry sectoractivities need to be assessed with respect to issues such as cost-effectiveness,additionality, permanence, leakage, measurement and verifiability, if forestry sectorprojects are to be implemented for mitigation of climate change. The earlier studiesin India have not estimated the additionality of mitigation of the forestry sectormitigation activities considering a baseline scenario. Such an analysis would assistpolicy makers in developing countries and the donor agencies to take decisions onforestry sector activities for reducing greenhouse gases (GHGs) in the atmosphere.
The main goal of the forestry sector in India is to meet the current and projectedbiomass demands sustainably and conserve the existing natural forest for conserva-tion of biodiversity and watershed protection. In India, only 12% of the geographicarea is under dense forest (>40% cover). India has a long-term goal of enhancingits forest cover to 33% of the geographic area (MoEF 1999). It has an effectiveForest Conservation Act, 1980, which regulates conversion of forest land to non-forest uses and further, there is a ban on logging in reserve forests (Ravindranathand Hall 1994). Thus, the only option for meeting India’s biomass demands isthrough afforestation and reforestation coupled with sustainable plantation forestrymanagement practices. In this study, a sustainable forestry scenario and a commer-cial forestry scenario are developed; these aim at meeting the biomass demandsthrough plantation forestry and conserving the forests. The mitigation potentialand costs of the scenarios and activities are assessed. The specific objectives of thestudy are:
– to develop a sustainable forestry strategy to meet biomass demands, to con-serve and reforest degraded forest lands and halt deforestation,
– to develop a commercial forestry strategy to meet the biomass demand fromprivate lands,
– to assess the mitigation potential of the forestry sector activities included inthe sustainable and commercial forestry strategies,
– to assess the additionality, permanence and cost-effectiveness of the carbonabatement of forestry strategies, activities, and
– to consider barriers and policy options to promote forestry strategies in thecontext of greenhouse gas abatement programmes.
2. Land Use Pattern and Land Use Change
Land-use pattern in India is complex and different agencies use different landcategories for establishing the land use pattern. Further, understanding land-usechange or dynamics is even more complex in the absence of detailed data on peri-
FORESTRY FOR BIOMASS PRODUCTION AND CARBON SEQUESTERATION 235
TABLE I
Land use pattern: forest and degraded land in India(×106 ha)
Land categories 1990 1995
Agricultural land 143.00 142.80
Forest area 64.01 63.3
10–40% crown cover 25.45 26.61
> 40% crown cover 38.56 36.72
Non-agricultural uses land 21.09 21.09
Pasture land 11.8 11.30
Degraded land 73.37 71.99
Degraded forest land 11.80 12.10
Miscellaneous tree crops 3.82 3.63
Culturable waste 15.00 14.20
Current fallow 13.70 13.53
Other fallow 9.66 9.76
Barren unculturable 19.39 18.77
Miscellaneous 15.46 16.8
Total 328.73 328.73
CSE (1998); Forest area – FSI (1997).
odic land use shifts. Broad land use categories and changes in area in the recentyears are given in Table I.
Def
ores
tati
on r
ate
(103 h
a yr
-1)
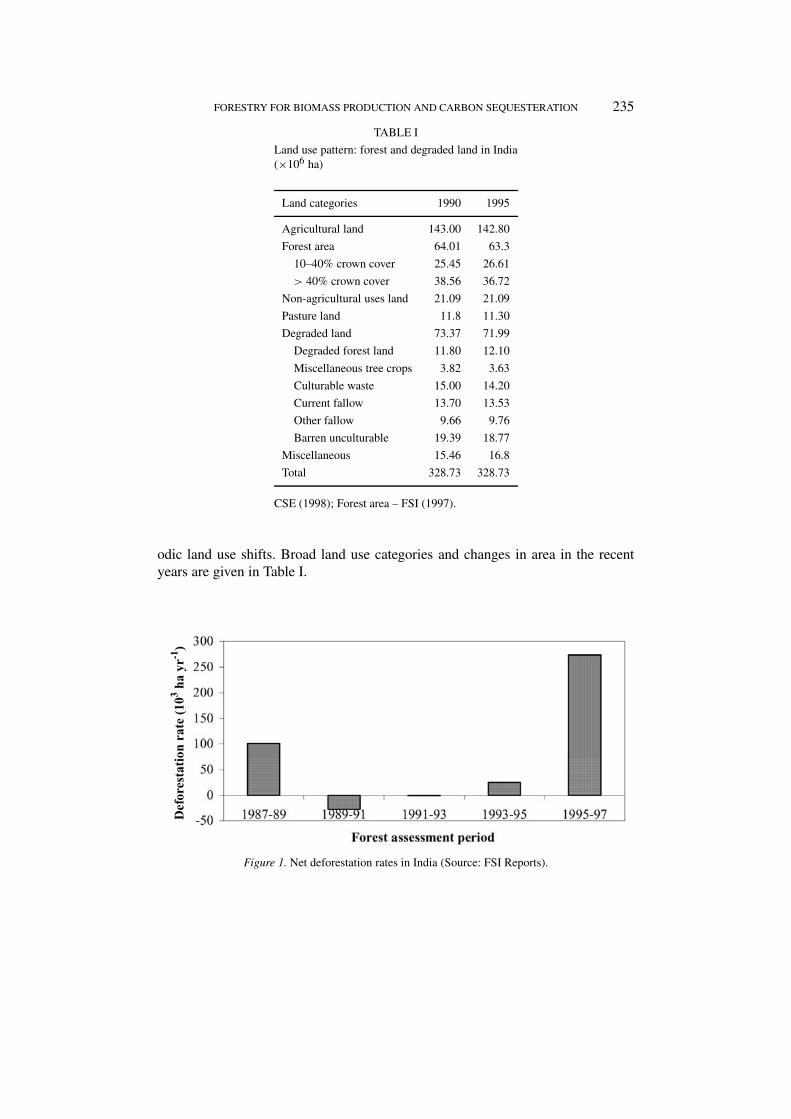
Figure 1. Net deforestation rates in India (Source: FSI Reports).
236 N.H. RAVINDRANATH ET AL.
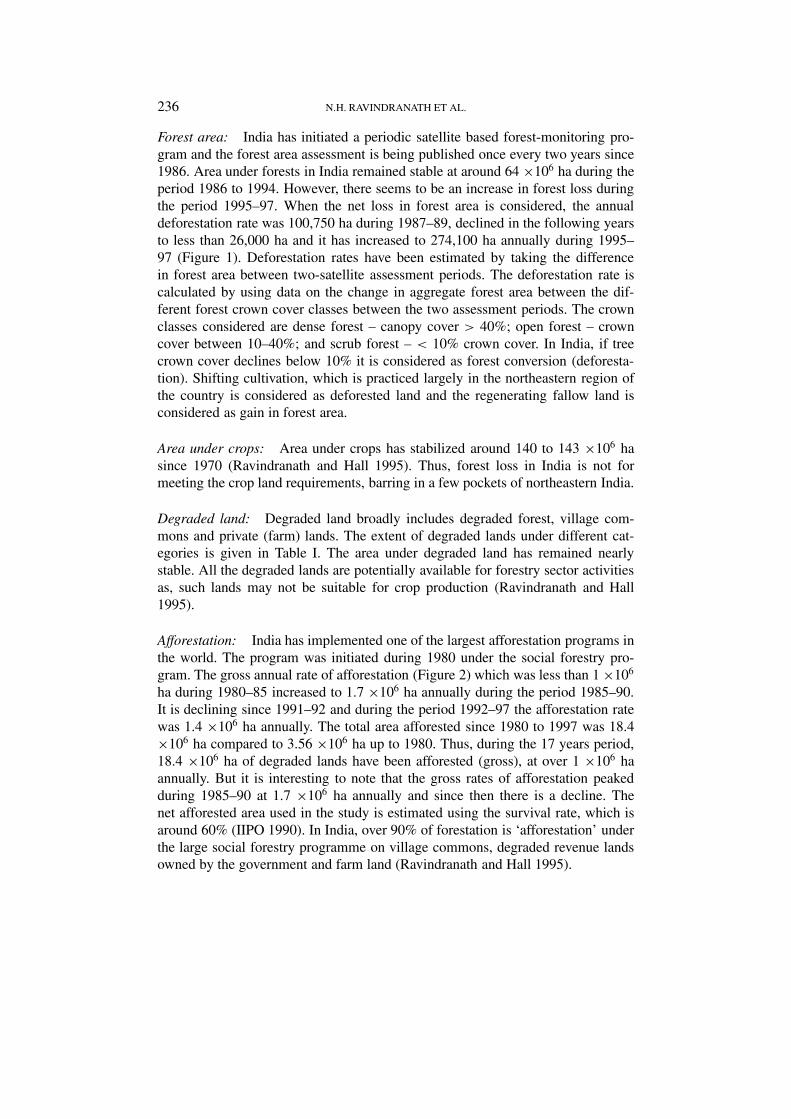
Forest area: India has initiated a periodic satellite based forest-monitoring pro-gram and the forest area assessment is being published once every two years since1986. Area under forests in India remained stable at around 64 ×106 ha during theperiod 1986 to 1994. However, there seems to be an increase in forest loss duringthe period 1995–97. When the net loss in forest area is considered, the annualdeforestation rate was 100,750 ha during 1987–89, declined in the following yearsto less than 26,000 ha and it has increased to 274,100 ha annually during 1995–97 (Figure 1). Deforestation rates have been estimated by taking the differencein forest area between two-satellite assessment periods. The deforestation rate iscalculated by using data on the change in aggregate forest area between the dif-ferent forest crown cover classes between the two assessment periods. The crownclasses considered are dense forest – canopy cover > 40%; open forest – crowncover between 10–40%; and scrub forest – < 10% crown cover. In India, if treecrown cover declines below 10% it is considered as forest conversion (deforesta-tion). Shifting cultivation, which is practiced largely in the northeastern region ofthe country is considered as deforested land and the regenerating fallow land isconsidered as gain in forest area.
Area under crops: Area under crops has stabilized around 140 to 143 ×106 hasince 1970 (Ravindranath and Hall 1995). Thus, forest loss in India is not formeeting the crop land requirements, barring in a few pockets of northeastern India.
Degraded land: Degraded land broadly includes degraded forest, village com-mons and private (farm) lands. The extent of degraded lands under different cat-egories is given in Table I. The area under degraded land has remained nearlystable. All the degraded lands are potentially available for forestry sector activitiesas, such lands may not be suitable for crop production (Ravindranath and Hall1995).
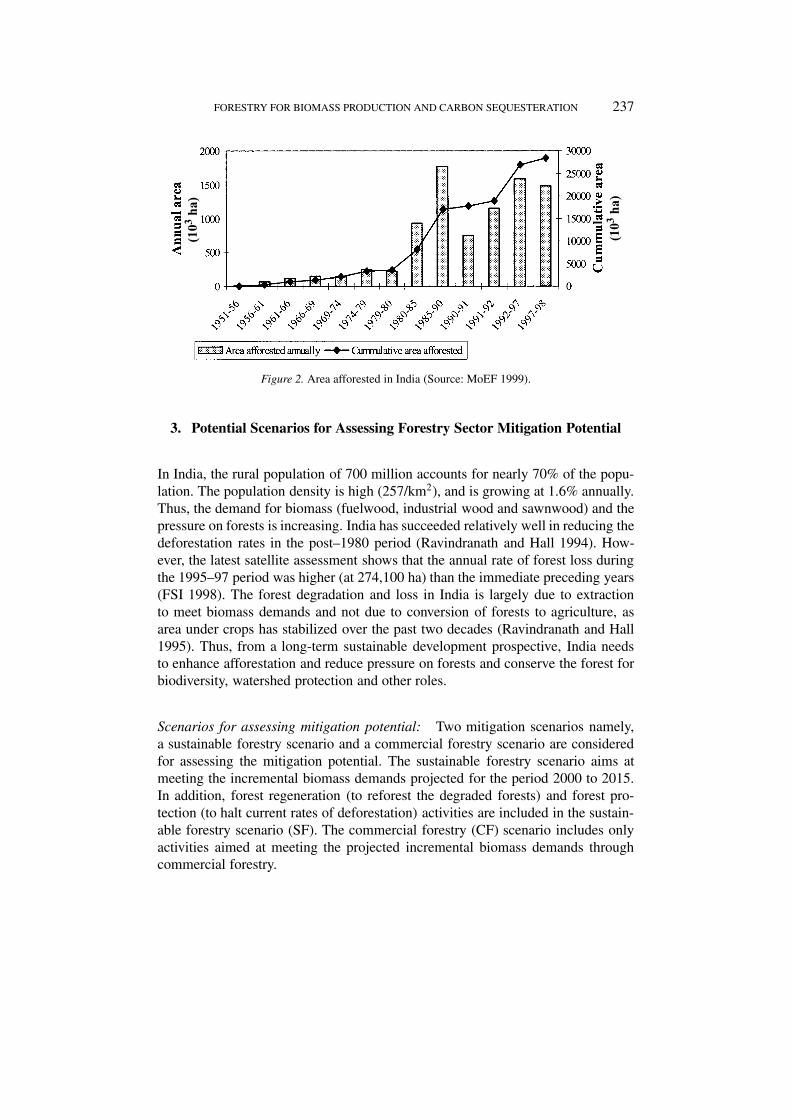
Afforestation: India has implemented one of the largest afforestation programs inthe world. The program was initiated during 1980 under the social forestry pro-gram. The gross annual rate of afforestation (Figure 2) which was less than 1 ×10⁶
ha during 1980–85 increased to 1.7 ×10⁶ ha annually during the period 1985–90.It is declining since 1991–92 and during the period 1992–97 the afforestation ratewas 1.4 ×10⁶ ha annually. The total area afforested since 1980 to 1997 was 18.4×10⁶ ha compared to 3.56 ×10⁶ ha up to 1980. Thus, during the 17 years period,18.4 ×106 ha of degraded lands have been afforested (gross), at over 1 ×10⁶ haannually. But it is interesting to note that the gross rates of afforestation peakedduring 1985–90 at 1.7 ×10⁶ ha annually and since then there is a decline. Thenet afforested area used in the study is estimated using the survival rate, which isaround 60% (IIPO 1990). In India, over 90% of forestation is ‘afforestation’ underthe large social forestry programme on village commons, degraded revenue landsowned by the government and farm land (Ravindranath and Hall 1995).
FORESTRY FOR BIOMASS PRODUCTION AND CARBON SEQUESTERATION 237
(103
ha)
(103
ha)
Figure 2. Area afforested in India (Source: MoEF 1999).
3. Potential Scenarios for Assessing Forestry Sector Mitigation Potential
In India, the rural population of 700 million accounts for nearly 70% of the popu-lation. The population density is high (257/km2), and is growing at 1.6% annually.Thus, the demand for biomass (fuelwood, industrial wood and sawnwood) and thepressure on forests is increasing. India has succeeded relatively well in reducing thedeforestation rates in the post–1980 period (Ravindranath and Hall 1994). How-ever, the latest satellite assessment shows that the annual rate of forest loss duringthe 1995–97 period was higher (at 274,100 ha) than the immediate preceding years(FSI 1998). The forest degradation and loss in India is largely due to extractionto meet biomass demands and not due to conversion of forests to agriculture, asarea under crops has stabilized over the past two decades (Ravindranath and Hall1995). Thus, from a long-term sustainable development prospective, India needsto enhance afforestation and reduce pressure on forests and conserve the forest forbiodiversity, watershed protection and other roles.
Scenarios for assessing mitigation potential: Two mitigation scenarios namely,a sustainable forestry scenario and a commercial forestry scenario are consideredfor assessing the mitigation potential. The sustainable forestry scenario aims atmeeting the incremental biomass demands projected for the period 2000 to 2015.In addition, forest regeneration (to reforest the degraded forests) and forest pro-tection (to halt current rates of deforestation) activities are included in the sustain-able forestry scenario (SF). The commercial forestry (CF) scenario includes onlyactivities aimed at meeting the projected incremental biomass demands throughcommercial forestry.
238 N.H. RAVINDRANATH ET AL.
Forestry activities for the scenarios: To achieve the goals of meeting the biomassrequirements sustainably, of regenerating and conserving the natural forests, a setof potential forestry activities is identified:
– Afforestation-short-rotation: to meet the fuelwood and industrial wood re-quirements.
– Afforestation-long-rotation: to meet the structural timber (sawnwood) require-ments.
– Forest regeneration (reforestation): to regenerate and reclaim the degradedforest lands through protection and promotion of forest succession.
– Forest protection: to conserve the biomass of natural forest by halting defor-estation.
Features of forestry activities: Some of the potential features and benefits ofdifferent forestry activities are given in Appendix, Table A II.
– Socio-economic impacts: all the proposed activities create rural employmentin establishing, protecting and maintaining forests or plantations and providediverse biomass products (fuelwood, fodder, timber and non-timber forestproducts, such as fruits, oil seeds, leaves, gum, honey, etc.) contributing tothe socio-economic development of rural areas.
– Environmental benefits: afforestation and reforestation in degraded lands andhalting deforestation with appropriate guidelines could lead to biodiversityconservation and watershed protection.
– GHG abatement: afforestation and reforestation activities will lead to conser-vation of forest C sinks, as biomass needs will be met from plantation forestryactivities. Further, forestry in degraded lands enhances the carbon sinks inthe soil, standing vegetation and stored wood products. Halting deforestationleads to conservation of forest carbon sinks.
Thus, all potential forestry sector activities, apart from meeting biomass needs,contribute to significant socio-economic and environmental benefits including re-ducing carbon emission or expanding carbon sinks.
Rationale for sustainable forestry scenario in India: The rationale for sustainableforestry scenario is as follows.
– The rate of deforestation seems to have increased for the latest years (1995–97) largely due to growing biomass demands; thus there is a need to halt forestloss.
– India has vast degraded lands varyingly estimated at 66 to 129 ×106 ha, po-tentially available for forestry sector activities (Ravindranath and Hall 1995).At current net rates of afforestation and reforestation (of less than 1 ×10⁶
ha), the degraded lands are unlikely to be fully revegetated in the near future,leading to further land degradation and loss of carbon.
– The current rates of afforestation are inadequate to meet biomass demands,leading to forest degradation. According to an assessment of biomass supply
FORESTRY FOR BIOMASS PRODUCTION AND CARBON SEQUESTERATION 239
and demand, large deficits leading to large scale imports are projected by 2015(MoEF 1999).
– Mitigation of climate change could be one of the initiatives to catalyze andsignificantly enhance the rate of reforestation, afforestation and adopt severalpotential additional activities such as agroforestry and bioenergy to reclaimdegraded lands and to meet the biomass demands.
The sustainable forestry initiative could include appropriate policy support and in-creased funding to conserve the existing forests and to expand reforestation and af-forestation on government -managed degraded lands, village commons and privatelands.
Rationale for commercial forestry (CF) scenario: In India (Table I) a large poten-tial exists for afforestation in private lands, such as farm fallow lands and marginalcroplands. The government supported afforestation, reforestation and conserva-tion activities could be largely on state or community owned forest and degradedlands. However, forestry activities aimed at meeting industrial wood, sawnwoodand urban fuelwood demand could potentially be carried out on a commercial basison private lands by involving farmers, timber plantation companies and commercialbanks. Thus, under the CF scenario, forestry activities aimed at meeting the incre-mental biomass demands over the 2000–2015 period are considered. The climatechange mitigation activities under the Clean Development Mechanism (CDM) arelikely to be significantly funded by the private sector, in addition to the traditionalbilateral and multilateral agency grants and concessional loans. Thus, it is appro-priate to focus on the commercial approach to forestry to meet the commercialdemands. The subsistence biomass demands will be met by grants from nationaland state government programmes.
4. Approach for Development and Assessment of Sustainable Forestry
The sustainable forestry strategy aimed at meeting biomass demands, conservingthe forests and reducing atmospheric CO2 is developed and assessed using thefollowing approach:
– Fuelwood, industrial wood and sawnwood demands are estimated for 2015,taking a medium-term scenario.
– Land use pattern is assessed and the surplus land available for forestry activ-ities is estimated.
– Forestry activities for meeting the biomass demands are identified.– Forestry activities are allocated to compatible land categories.– Area to be allocated to different forestry activities to meet the projected bio-
mass demands is estimated by taking sustainable harvest rates and thus a‘sustainable forestry strategy’ is defined,
240 N.H. RAVINDRANATH ET AL.
– Mitigation potential and cost effectiveness is assessed for each activity usingthe Comprehensive Mitigation Assessment Process (COMAP) model (Sathayeet al. 1995).
The additionality of the mitigation strategy is estimated by defining a baselinescenario based on the past and current rates of deforestation and afforestation inIndia, resulting in changes in carbon stocks. The commercial forestry scenario isalso analyzed using the same approach.
5. Baseline, Sustainable and Commercial Forestry Scenario
To estimate the mitigation potential of forestry sector activities, two mitigationscenarios are developed namely; sustainable forestry and commercial forestry scen-ario. The mitigation potential of these two scenarios is compared to the baselinescenario to assess the additionality of mitigation.
5.1. BASELINE SCENARIO
Baseline scenario is the most likely trend scenario based on the past and currenttrends. The feasible projections of land use change, deforestation and afforestationrates used in the model are presented below.
– Based on the trends of the recent past, the net rates of afforestation are ex-pected to decline, from a net annual rate of 0.84 ×10⁶ ha (1.4 ×10⁶ ha ofannual gross rate during 1992–97) to 745,000 ha beyond 2000 as observedfrom trends of decline from 1985–1990 onwards (Figure 2). The mean netannual rate of afforestation during 1985 to 1998 was 0.93 ×10⁶ ha. A survivalrate of 0.6 is used to estimate the net afforestation rate. ‘Afforestation’ isdefined using the FAO criteria. In India over 90% of forestation is ‘afforesta-tion’. Less than 10% of forestation could be ‘reforestation’. The annual grossafforestation rates in past two decades (1985–1998) is within a range of 1 to1.8 ×106 ha. In fact the rate is narrower when 1985–90 rates (1.8 ×10⁶ ha) arecompared with 1992–97 (1.4 ×10⁶ ha). The mean gross rate of afforesationis 1.55 ×10⁶ ha during the period 1985–1998, while the gross afforestationrate considered during 2000–2030 is 1.25 ×10⁶ ha yr−1, which accounts to745000 of net afforestation area with a survival a rate of 60%.
– The deforestation rates are expected to continue at the current (1995–1997)rates of 274,100 ha annually. The population in India increased from 683million in 1981 to 996 million by 2000 (TSL 1998). However, the rates ofdeforesation have not increased in any significant rate (Figure 1). Thus con-stant rates have been used. In fact the rates of deforestation used for the period2000–2030 is higher than the rate observed during 1987 to 1995 (Figure 1).
– The area under crops is assumed to continue to be around 142 ×106 ha, as itbeen since 1970.
FORESTRY FOR BIOMASS PRODUCTION AND CARBON SEQUESTERATION 241
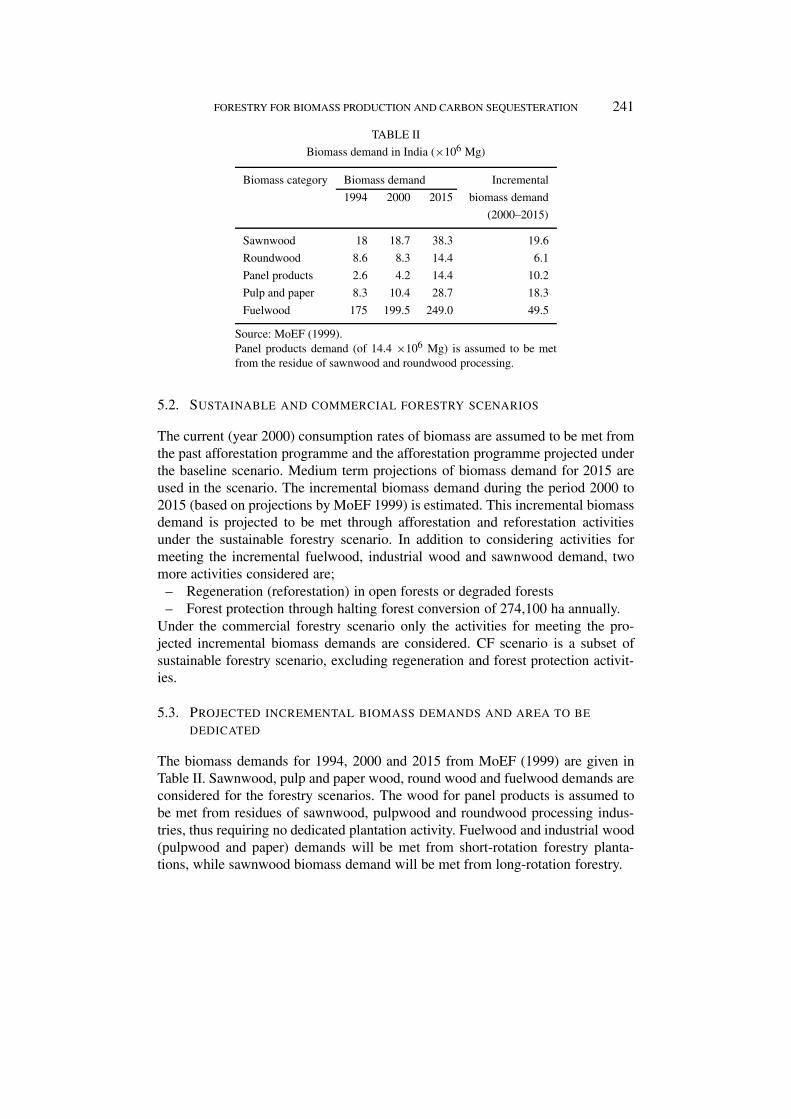
TABLE II
Biomass demand in India (×106 Mg)
Biomass category Biomass demand Incremental
1994 2000 2015 biomass demand
(2000–2015)
Sawnwood 18 18.7 38.3 19.6
Roundwood 8.6 8.3 14.4 6.1
Panel products 2.6 4.2 14.4 10.2
Pulp and paper 8.3 10.4 28.7 18.3
Fuelwood 175 199.5 249.0 49.5
Source: MoEF (1999).Panel products demand (of 14.4 ×10⁶ Mg) is assumed to be metfrom the residue of sawnwood and roundwood processing.
5.2. SUSTAINABLE AND COMMERCIAL FORESTRY SCENARIOS
The current (year 2000) consumption rates of biomass are assumed to be met fromthe past afforestation programme and the afforestation programme projected underthe baseline scenario. Medium term projections of biomass demand for 2015 areused in the scenario. The incremental biomass demand during the period 2000 to2015 (based on projections by MoEF 1999) is estimated. This incremental biomassdemand is projected to be met through afforestation and reforestation activitiesunder the sustainable forestry scenario. In addition to considering activities formeeting the incremental fuelwood, industrial wood and sawnwood demand, twomore activities considered are;
– Regeneration (reforestation) in open forests or degraded forests– Forest protection through halting forest conversion of 274,100 ha annually.
Under the commercial forestry scenario only the activities for meeting the pro-jected incremental biomass demands are considered. CF scenario is a subset ofsustainable forestry scenario, excluding regeneration and forest protection activit-ies.
5.3. PROJECTED INCREMENTAL BIOMASS DEMANDS AND AREA TO BE
DEDICATED
The biomass demands for 1994, 2000 and 2015 from MoEF (1999) are given inTable II. Sawnwood, pulp and paper wood, round wood and fuelwood demands areconsidered for the forestry scenarios. The wood for panel products is assumed tobe met from residues of sawnwood, pulpwood and roundwood processing indus-tries, thus requiring no dedicated plantation activity. Fuelwood and industrial wood(pulpwood and paper) demands will be met from short-rotation forestry planta-tions, while sawnwood biomass demand will be met from long-rotation forestry.
242 N.H. RAVINDRANATH ET AL.
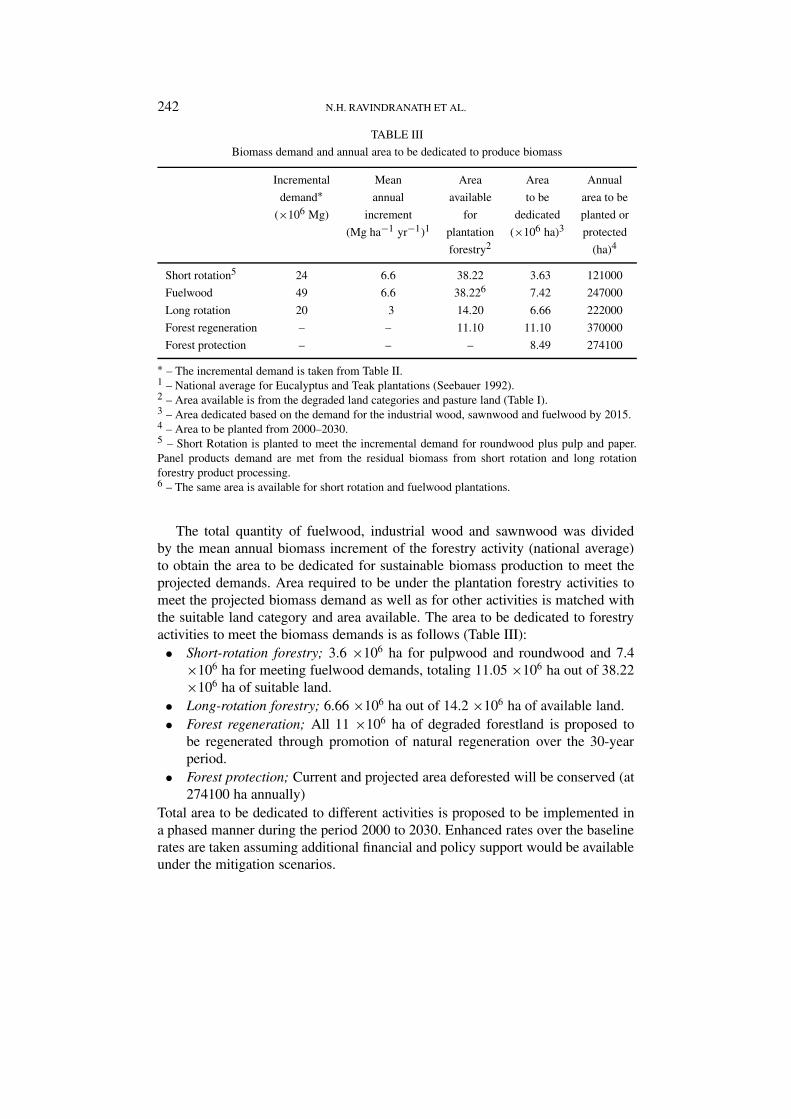
TABLE III
Biomass demand and annual area to be dedicated to produce biomass
Incremental Mean Area Area Annual
demand∗ annual available to be area to be
(×106 Mg) increment for dedicated planted or
(Mg ha−1 yr−1)1 plantation (×106 ha)3 protected
forestry2 (ha)4
Short rotation5 24 6.6 38.22 3.63 121000
Fuelwood 49 6.6 38.226 7.42 247000
Long rotation 20 3 14.20 6.66 222000
Forest regeneration – – 11.10 11.10 370000
Forest protection – – – 8.49 274100
∗ – The incremental demand is taken from Table II.1 – National average for Eucalyptus and Teak plantations (Seebauer 1992).2 – Area available is from the degraded land categories and pasture land (Table I).3 – Area dedicated based on the demand for the industrial wood, sawnwood and fuelwood by 2015.4 – Area to be planted from 2000–2030.5 – Short Rotation is planted to meet the incremental demand for roundwood plus pulp and paper.Panel products demand are met from the residual biomass from short rotation and long rotationforestry product processing.6 – The same area is available for short rotation and fuelwood plantations.
The total quantity of fuelwood, industrial wood and sawnwood was dividedby the mean annual biomass increment of the forestry activity (national average)to obtain the area to be dedicated for sustainable biomass production to meet theprojected demands. Area required to be under the plantation forestry activities tomeet the projected biomass demand as well as for other activities is matched withthe suitable land category and area available. The area to be dedicated to forestryactivities to meet the biomass demands is as follows (Table III):• Short-rotation forestry; 3.6 ×10⁶ ha for pulpwood and roundwood and 7.4
×106 ha for meeting fuelwood demands, totaling 11.05 ×10⁶ ha out of 38.22×10⁶ ha of suitable land.
• Long-rotation forestry; 6.66 ×10⁶ ha out of 14.2 ×10⁶ ha of available land.• Forest regeneration; All 11 ×106 ha of degraded forestland is proposed to
be regenerated through promotion of natural regeneration over the 30-yearperiod.
• Forest protection; Current and projected area deforested will be conserved (at274100 ha annually)
Total area to be dedicated to different activities is proposed to be implemented ina phased manner during the period 2000 to 2030. Enhanced rates over the baselinerates are taken assuming additional financial and policy support would be availableunder the mitigation scenarios.
FORESTRY FOR BIOMASS PRODUCTION AND CARBON SEQUESTERATION 243
5.4. COMAP MODELS FOR ASSESSMENT OF FORESTRY ACTIVITIES AND
SCENARIO
The COMAP models used include BIOMASS, REFROTN, REFREGN and FOR-PROT, for assessing the mitigation potential, impact on national C pools and cost-effectiveness (Sathaye et al. 1995).
BIOMASS: This is the national level comprehensive land use change – biomasspool model, used to assess the changes in national total carbon stock under thebaseline and mitigation scenarios, over different periods. The impacts of adoptionof forestry activities on the national biomass or carbon pool are linked to the BIO-MASS model through different COMAP modules such as REFROTN, REFREGNand FORPROT (Sathaye et al. 1995).
REFROTN: This module estimates the mitigation potential and cost-effectivenessof short-rotation and long-rotation forestry activities, where sustainable harvestingis permitted (Sathaye et al. 1995).
REFREGN: This module estimates mitigation potential and cost-effectiveness offorest regeneration through protection where logging is not permitted (Sathaye etal. 1995).
FORPROT: Estimates the mitigation potential of halting deforestation and redu-cing forest degradation (Sathaye et al. 1995).
Leakage and permanence: These are critical issues particularly for project activ-ities. The short-rotation and long-rotation activities under the commercial forestry(as well as the sustainable forestry) scenario assume harvesting at the end of therotation. The harvested wood products are expected to be used for meeting the bio-mass demands. The COMAP model considers the fate and life of wood harvested.Permanence of carbon sequestered is an issue for regeneration and forest protec-tion activities as no harvesting is considered in the COMAP model. In India thereare regulations on harvesting in reserve forest areas. Further, under the baselinescenario, the above ground biomass is very low in open or degraded forest land.Thus, permanence may not be a major issue in India for activities in the reserveforest areas. However, leakage and permanence are not serious issues for commer-cial forestry activities, because harvesting is included in the model to estimate thecarbon pool created.
5.5. DATA FOR ANALYSIS
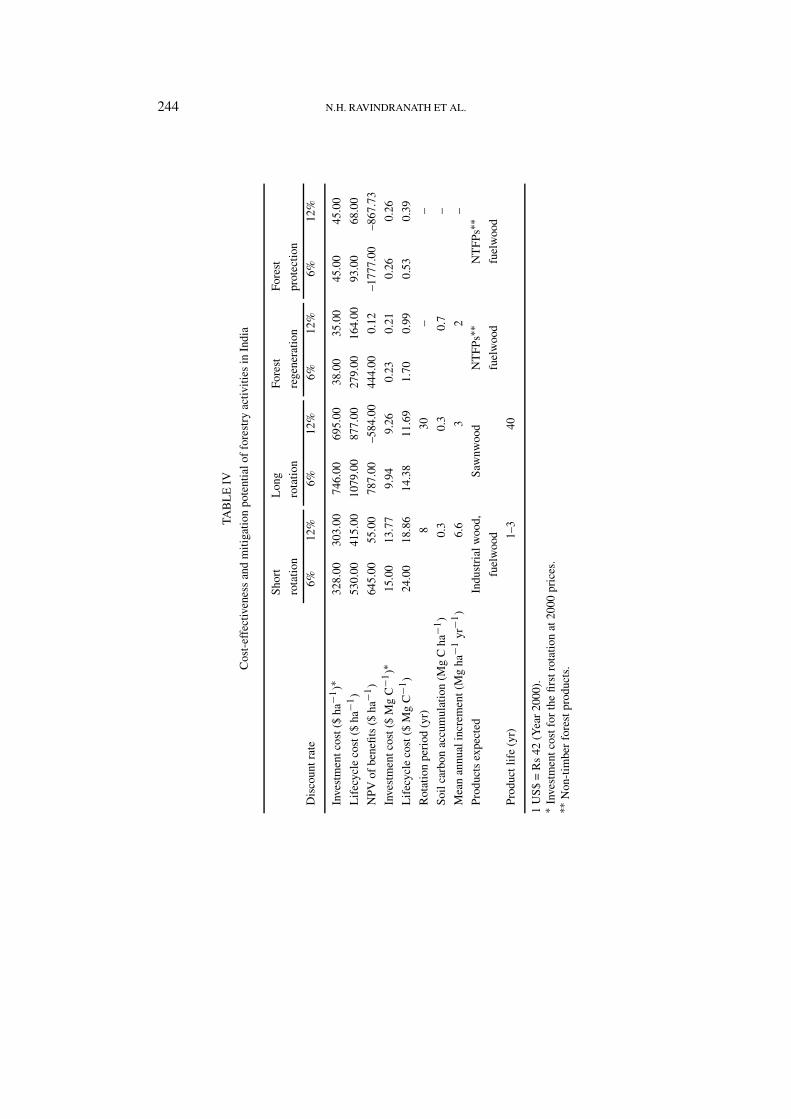
Data for assessment of mitigation potential and cost-effectiveness is given in TableIV and the rates of extraction (projected and sustainable) are given in AppendixTable AI. Analysis is carried out using discount rates of 12% and 6%. Sawnwood
244 N.H. RAVINDRANATH ET AL.
TAB
LE
IV
Cos
t-ef
fect
iven
ess
and
mit
igat
ion
pote
ntia
lof
fore
stry
activ
itie
sin
Indi
a
Sho
rtL
ong
Fore
stFo
rest
rota
tion
rota
tion
rege
nera
tion
prot
ecti
on
Dis
coun
trat
e6%
12%
6%12
%6%
12%
6%12
%
Inve
stm
entc
ost(
$ha
−1)∗
328.
0030
3.00
746.
0069
5.00
38.0
035
.00
45.0
045
.00
Lif
ecyc
leco
st($
ha−1
)53
0.00
415.
0010
79.0
087
7.00
279.
0016
4.00
93.0
068
.00
NP
Vof
bene
fits
($ha
−1)
645.
0055
.00
787.
00–5
84.0
044
4.00
0.12
–177
7.00
–867
.73
Inve
stm
entc
ost(
$M
gC
−1)∗
15.0
013
.77
9.94
9.26
0.23
0.21
0.26
0.26
Lif
ecyc
leco
st($
Mg
C−1
)24
.00
18.8
614
.38
11.6
91.
700.
990.
530.
39
Rot
atio
npe
riod
(yr)
830
––
Soi
lcar
bon
accu
mul
atio
n(M
gC
ha−1
)0.
30.
30.
7–
Mea
nan
nual
incr
emen
t(M
gha
−1yr
−1)
6.6
32
–
Pro
duct
sex
pect
edIn
dust
rial
woo
d,S
awnw
ood
NT
FP
s∗∗
NT
FP
s∗∗
fuel
woo
dfu
elw
ood
fuel
woo
d
Pro
duct
life
(yr)
1–3
40
1U
S$
=R
s42
(Yea
r20
00).
∗ Inv
estm
entc
ostf
orth
efi
rstr
otat
ion
at20
00pr
ices
.∗∗
Non
-tim
ber
fore
stpr
oduc
ts.
FORESTRY FOR BIOMASS PRODUCTION AND CARBON SEQUESTERATION 245
Mg
C h
a-1
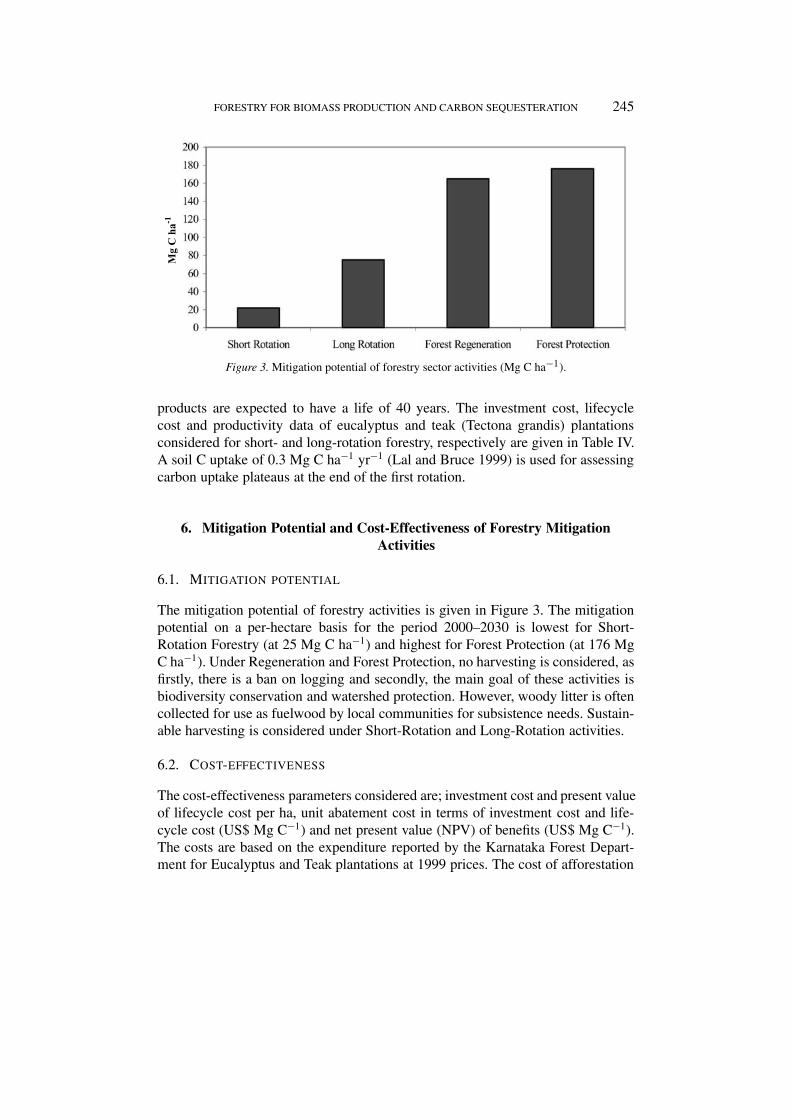
Figure 3. Mitigation potential of forestry sector activities (Mg C ha−1).
products are expected to have a life of 40 years. The investment cost, lifecyclecost and productivity data of eucalyptus and teak (Tectona grandis) plantationsconsidered for short- and long-rotation forestry, respectively are given in Table IV.A soil C uptake of 0.3 Mg C ha−1 yr−1 (Lal and Bruce 1999) is used for assessingcarbon uptake plateaus at the end of the first rotation.
6. Mitigation Potential and Cost-Effectiveness of Forestry MitigationActivities
6.1. MITIGATION POTENTIAL
The mitigation potential of forestry activities is given in Figure 3. The mitigationpotential on a per-hectare basis for the period 2000–2030 is lowest for Short-Rotation Forestry (at 25 Mg C ha−1) and highest for Forest Protection (at 176 MgC ha−1). Under Regeneration and Forest Protection, no harvesting is considered, asfirstly, there is a ban on logging and secondly, the main goal of these activities isbiodiversity conservation and watershed protection. However, woody litter is oftencollected for use as fuelwood by local communities for subsistence needs. Sustain-able harvesting is considered under Short-Rotation and Long-Rotation activities.
6.2. COST-EFFECTIVENESS
The cost-effectiveness parameters considered are; investment cost and present valueof lifecycle cost per ha, unit abatement cost in terms of investment cost and life-cycle cost (US$ Mg C−1) and net present value (NPV) of benefits (US$ Mg C−1).The costs are based on the expenditure reported by the Karnataka Forest Depart-ment for Eucalyptus and Teak plantations at 1999 prices. The cost of afforestation
246 N.H. RAVINDRANATH ET AL.
$ M
g C
-1
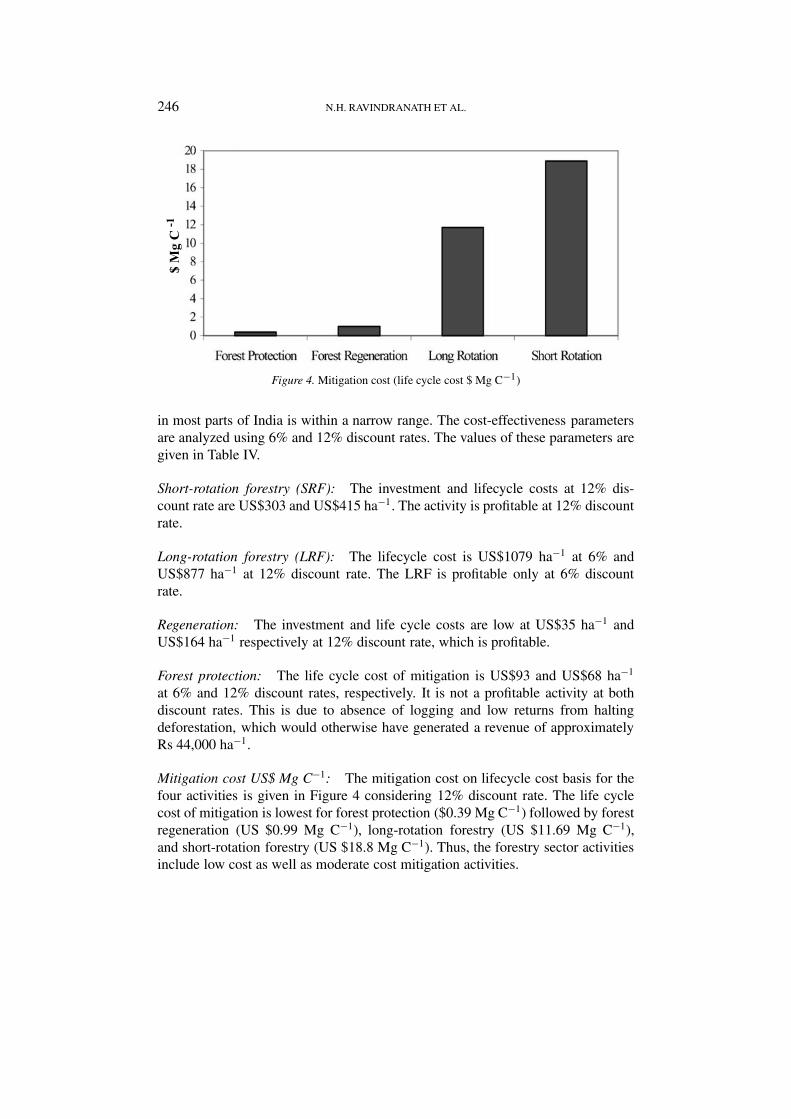
Figure 4. Mitigation cost (life cycle cost $ Mg C−1)
in most parts of India is within a narrow range. The cost-effectiveness parametersare analyzed using 6% and 12% discount rates. The values of these parameters aregiven in Table IV.
Short-rotation forestry (SRF): The investment and lifecycle costs at 12% dis-count rate are US$303 and US$415 ha−1. The activity is profitable at 12% discountrate.
Long-rotation forestry (LRF): The lifecycle cost is US$1079 ha−1 at 6% andUS$877 ha−1 at 12% discount rate. The LRF is profitable only at 6% discountrate.
Regeneration: The investment and life cycle costs are low at US$35 ha−1 andUS$164 ha−1 respectively at 12% discount rate, which is profitable.
Forest protection: The life cycle cost of mitigation is US$93 and US$68 ha−1
at 6% and 12% discount rates, respectively. It is not a profitable activity at bothdiscount rates. This is due to absence of logging and low returns from haltingdeforestation, which would otherwise have generated a revenue of approximatelyRs 44,000 ha−1.
Mitigation cost US$ Mg C−1: The mitigation cost on lifecycle cost basis for thefour activities is given in Figure 4 considering 12% discount rate. The life cyclecost of mitigation is lowest for forest protection ($0.39 Mg C−1) followed by forestregeneration (US $0.99 Mg C−1), long-rotation forestry (US $11.69 Mg C−1),and short-rotation forestry (US $18.8 Mg C−1). Thus, the forestry sector activitiesinclude low cost as well as moderate cost mitigation activities.
FORESTRY FOR BIOMASS PRODUCTION AND CARBON SEQUESTERATION 247
Car
bon
Poo
l (x
106 M
g C
)
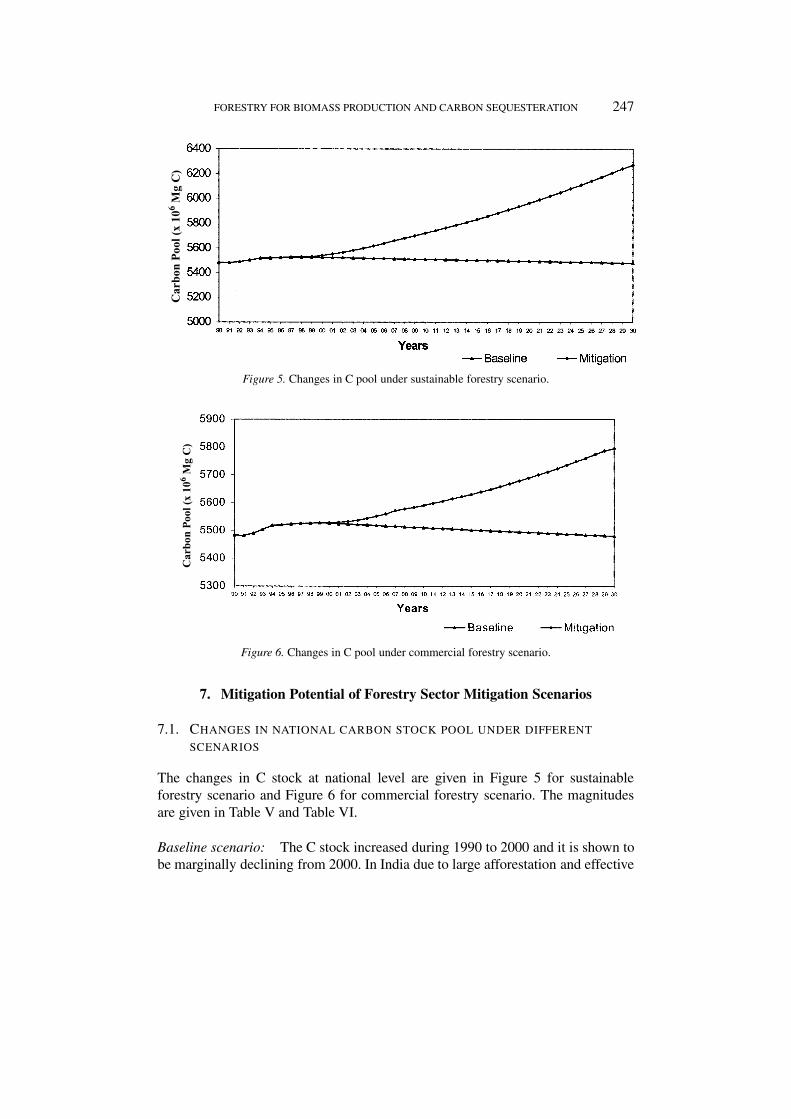
Figure 5. Changes in C pool under sustainable forestry scenario.
Car
bon
Poo
l (x
106 M
g C
)
Figure 6. Changes in C pool under commercial forestry scenario.
7. Mitigation Potential of Forestry Sector Mitigation Scenarios
7.1. CHANGES IN NATIONAL CARBON STOCK POOL UNDER DIFFERENT
SCENARIOS
The changes in C stock at national level are given in Figure 5 for sustainableforestry scenario and Figure 6 for commercial forestry scenario. The magnitudesare given in Table V and Table VI.
Baseline scenario: The C stock increased during 1990 to 2000 and it is shown tobe marginally declining from 2000. In India due to large afforestation and effective

248 N.H. RAVINDRANATH ET AL.
TABLE V
Mitigation potential of baseline, sustainable and commercialforestry mitigation scenarios (×106 Mg C)
Baseline scenario Mitigation scenario Increment
Sustainable forestry scenario
1990 5483 5483 0
2000 5527 5527 0
2008 5515 5662 147
2012 5507 5764 257
2030 5480 6270 790
Commercial forestry scenario
1990 5483 5483 0
2000 5527 5527 0
2008 5515 5571 56
2012 5507 5605 98
2030 5480 5795 315
TABLE VI
Incremental mitigation potential ( ×106 Mg C)
Sustainable forestry Commercial forestry
scenario scenario
Mitigation 2012 – Baseline 2000 237 78
Mitigation 2012 – Baseline 1990 281 122
forest conservation programmes, there is only a marginal decline in national Cstocks during the period 2000 to 2012 and 2000 to 2030.
Sustainable forestry scenario: The national C stock is projected to increase by237 ×106 Mg during 2000–2012 and 281 ×106 Mg during 1990–2012 (Table VI)over the baseline scenario.
Commercial forestry scenario: Under this scenario where only short-rotation andlong-rotation activities, which are commercial are included, the C stock is projectedto increase by 122 ×106 Mg C during 1990–2012 and by only 78 ×106 Mg Cduring 2000–2012 over the baseline scenario.
FORESTRY FOR BIOMASS PRODUCTION AND CARBON SEQUESTERATION 249
Annual increment of carbon pool: The mean annual increment of carbon poolduring the five year period of 2008–2012 is 51 ×106 Mg C for sustainable forestryscenario and 19 ×106 Mg C for the commercial forestry scenario. The annual in-crement over the period 2000 to 2012 is 21 × 106 Mg C for the sustainable forestryscenario and 8 ×10⁶ Mg C under the commercial forestry scenario.
Mitigation potential compared to energy sector emissions: The energy sector car-bon emission in India, during 1990 was 138 ×106 Mg C (ADB 1998). Thus, theadditional mitigation potential of the sustainable forestry and commercial forestryscenarios is marginal. The additional mitigation potential in India under the scen-arios is not large because of the inclusion of the large afforestation programmeand the effective forest conservation activities in the baseline scenario. An earlierstudy (Ravindranath and Somashekar 1995) has estimated a large annual mitigationpotential of 175 ×106 Mg C under a technical potential scenario, where all the de-graded lands are brought under afforestation, reforestation and additional activities(such as agroforestry and bioenergy).
8. Investment required for commercial forestry scenario
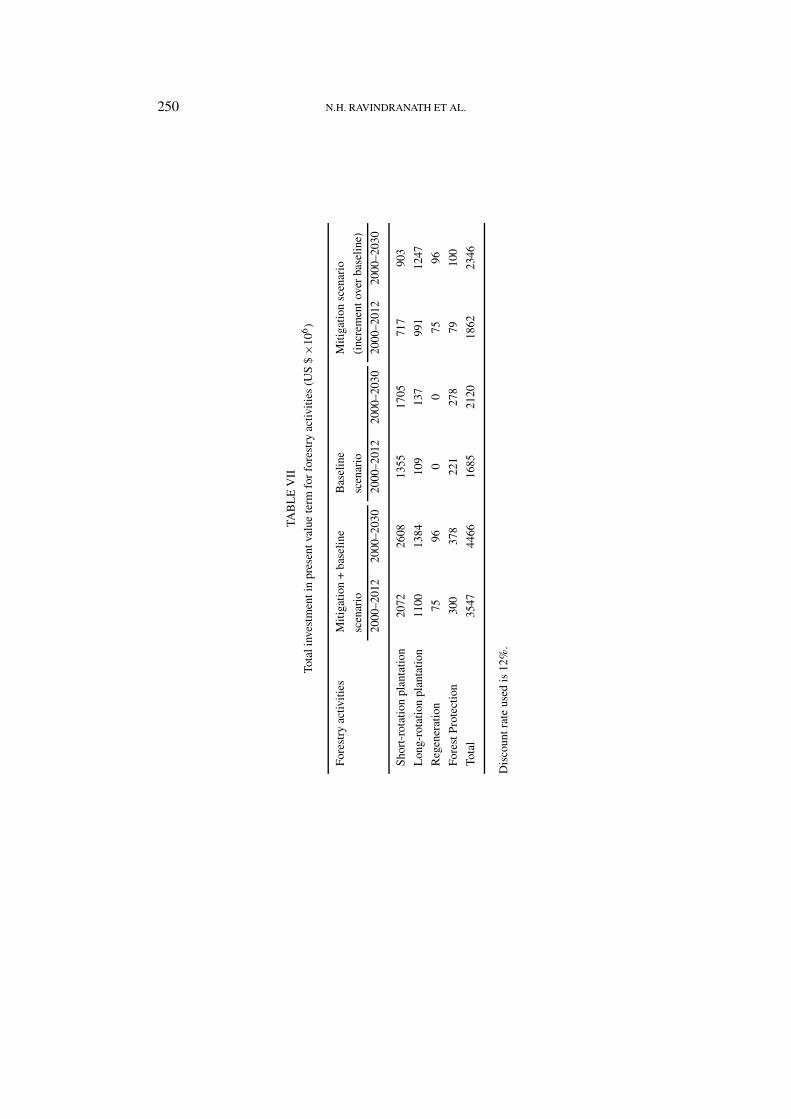
The investment capital is a barrier to enhancing the rate of afforestation and refor-estation. The investment on the baseline scenario activities during 2000 is estimatedto be US$ 228 million (MoEF 1999) (based on pervious years expenditure data)for afforestation programme. Further, during 2000 about $34 million is estimated tobe spent on forest protection activities. In present value terms the total investmentunder the baseline scenario over the 30-year period (2000 to 2030) is estimated tobe US$1842 million for afforestation programme of short rotation and long rotationplantations and US$2120 inclusive of forest protection activities (Table VII).
Sustainable forestry scenario: The total investment under this scenario is US$1.8billion for the period 2000 to 2012 and 2.3 billion for 2000 to 2030 (Table VII). Theannual incremental investment under the sustainable forestry scenario is US$150million per year.
Commercial forestry scenario: The incremental investment over baseline scen-ario under commercial forestry scenario is US$1708 (US$717 million for shortrotation and US$991 million for long rotation) for the period 2000 to 2012 andUS$2150 million (US$903 million for short rotation and US$1247 million for longrotation) for the period 2000 to 2030 (Table VII). The investment for long rotationplantation forestry is nine times higher compared to baseline scenario during 2000–2030. Thus, large additional investment is required for long rotation plantations.If the commercial forestry scenario is implemented in say 2000, the incrementalinvestment required is US$ 265 million compared to the baseline investment of
250 N.H. RAVINDRANATH ET AL.
TAB
LE
VII
Tota
linv
estm
enti
npr
esen
tval
uete
rmfo
rfo
rest
ryac
tivit
ies
(US
$×1
06)
Fore
stry
activ
itie
sM
itig
atio
n+
base
line
Bas
elin
eM
itig
atio
nsc
enar
io
scen
ario
scen
ario
(inc
rem
ento
ver
base
line
)
2000
–201
220
00–2
030
2000
–201
220
00–2
030
2000
–201
220
00–2
030
Sho
rt-r
otat
ion
plan
tati
on20
7226
0813
5517
0571
790
3
Lon
g-ro
tati
onpl
anta
tion
1100
1384
109
137
991
1247
Reg
ener
atio
n75
960
075
96
Fore
stP
rote
ctio
n30
037
822
127
879
100
Tota
l35
4744
6616
8521
2018
6223
46
Dis
coun
trat
eus
edis
12%
.
FORESTRY FOR BIOMASS PRODUCTION AND CARBON SEQUESTERATION 251
US$228 million during 2000. Thus, the commercial forestry scenario is feasibleif additional resources are available. The short-rotation and long-rotation forestryactivities are also commercially profitable activities, particularly at lower discountrates.
9. Policy Options to Promote Sustainable and Commercial Forestry
In India the current and projected rates of afforestation and reforestation underthe baseline scenario are inadequate to meet the biomass demands projected for2015 (MoEF 1999). Thus, India may have to adopt the sustainable or commer-cial forestry scenarios to meet the biomass demands and to conserve forests. Thegovernment budget support for the baseline scale of activities may continue but islikely to decline in real value terms. But additional support for sustainable forestryor commercial forestry scenario activities from domestic sources is limited. Fur-ther, the commercial forestry scenario is a subset of the sustainable forestry scen-ario, largely on privately owned fallow land or marginal crop land. Thus, govern-ment support would be marginal. The industrial wood, sawnwood and a part offuelwood is commercially traded. Thus, the government may have to develop ap-propriate policies to promote participation of industry, farmers, commercial banksand external agencies to promote commercial forestry activities. A detailed ana-lysis of barriers and policy options are beyond the scope of this paper. However,a few issues relevant to forestry sector opportunities under the UN FrameworkConvention on Climate Change (UNFCCC) are briefly presented.
Barriers to commercial forestry: India has implemented a significant scale farmforestry activity, where farmers have raised plantations of eucalyptus, casuarinaetc. for industrial and urban market. However, some of the barriers to large-scalecommercial forestry activities are:
– High cost of credit and lack of access to credit.– Long gestation period, particularly for long-rotation forestry.– Absence of market institutions.– Regulations on planting, harvesting and transportation of trees.– Import of timber, pulp and paper.– Lack of high yielding genetic planting material and silviculture practices.– Absence of forestry extension service to farmers.– External funding largely to forest department and not to support farmers or
plantation companies.– No foreign direct investment in forestry.
Policy options: Some of the policy options to promote sustainable forestry, par-ticularly the commercial forestry activities are as follows:
252 N.H. RAVINDRANATH ET AL.
– Provide access to credit: Promote financing mechanisms to provide easy ac-cess to credit to farmers and timber or plantation companies.
– Financial incentive: The cost of capital is very high in India, thus developfinancing policies to provide interest subsidy.
– Removal of regulations on planting, harvest and transportation: Promote freemarket and remove all restrictions on planting, harvesting and transportationof wood.
– Permit flow of foreign investment in forestry: Direct financing of farmers andplantation companies by external agencies could be permitted for commercialforestry activities. Reserve forests, protected areas and village commons couldbe excluded for foreign direct investment.
– Technology transfer for high yields: To motivate farmers and plantation com-panies, provide technology and information on quality genetic stock for plant-ing, species-mix and silvicultural practices for high yields and shorter rotationlength. There is a need to promote mixed cropping strategy where farmers canget financial returns during the rotation period such as growing annual cropsin teak plantations.
– Institutional arrangements for processing projects: Develop institutions andsimplified procedures for evaluating and approving externally funded projects,based on a set of guidelines. Climate change mitigation projects should alsobe covered under the guidelines. Clear policy statement and guidelines arenecessary so that project proponents are clear about what category of projectswould be endorsed by the government.
– Simplify land tenure policies to enable long-term contracts between farmersand industry (such as a paper mill). Promote policies to encourage ‘industry-farmer’ linkages, so that industry can provide credit, technology and market-ing service to farmers.
– Strengthen institutions for monitoring and verification of forestry sector mit-igation projects.
India has a long tradition of farm forestry (on farmland). Thus, with appropriatefinancial incentives, technology transfer and policies to promote ‘farmers-industry-trade’ linkages, large-scale commercial forestry could be implemented in Indialeading to local and global benefits.
The Kyoto Protocol potentially offers an opportunity for investment capital andtechnology transfer for commercial forestry, if land use change and forestry sectoractivities are included under the Clean Development Mechanism (Article 12). Indiacould consider the CDM to promote large-scale commercial forestry activities andthe limited state funds could be focussed on protected areas, reserve forest conser-vation and subsistence forestry activities aimed at meeting the biomass needs ofrural poor.
FORESTRY FOR BIOMASS PRODUCTION AND CARBON SEQUESTERATION 253
10. Conclusion
With the goal of meeting the projected incremented biomass demands (for theperiod 2000 to 2015) and to enhance forest conservation, a sustainable forestryscenario was developed. Further, a commercial forestry scenario aimed at onlymeeting the projected incremental biomass demand was developed. Comparison ofcommercial forestry scenario over the baseline scenario showed that an additional78 ×106 Mg C of mitigation potential, during the period 2000 to 2012. Simil-arly the additional mitigation potential was 237 ×106 Mg C for the sustainableforestry scenario. The forestry sector in India offers both low-cost (forest protec-tion and forest regeneration) as well as moderate-cost (short rotation) mitigationopportunities.
India has demonstrated the capacity to implement a large afforestation pro-gramme. However, financial and policy barriers exist even to implement a forestryscenario aimed at meeting the domestic commercial biomass demands. The mainconclusion from the study is that the state should dedicate all the financial resourcesto forest conservation and afforestation activities aimed at forest conservation andmeeting the subsistence needs. All the commercial sawnwood, industrial wood andeven fuelwood demand should be met through a commercial forestry strategy, withappropriate policies to promote participation of farmers, plantation companies,commercial banks and external funding agencies. If Clean Development Mech-anism (CDM) is adopted by the UNFCCC, it would provide a large opportunity toobtain external financial support and technology (for high yields), to promote thecommercial forestry strategy aimed at meeting the domestic biomass demands aswell as to reduce CO2 emissions and remove CO2 from atmosphere.
Acknowledgement
The authors acknowledge Jayant Sathaye, Willy Makundi and Ken Andrasko fortheir ideas, support and guidance. We also thank the colleagues of the F-7 groupfor their valuable contribution and suggestions. We also acknowledge the supportprovided by the Ministry of Environment and Forests to Centre for EcologicalSciences, Indian Institute of Science, for undertaking studies on climate change.
254 N.H. RAVINDRANATH ET AL.
Appendices
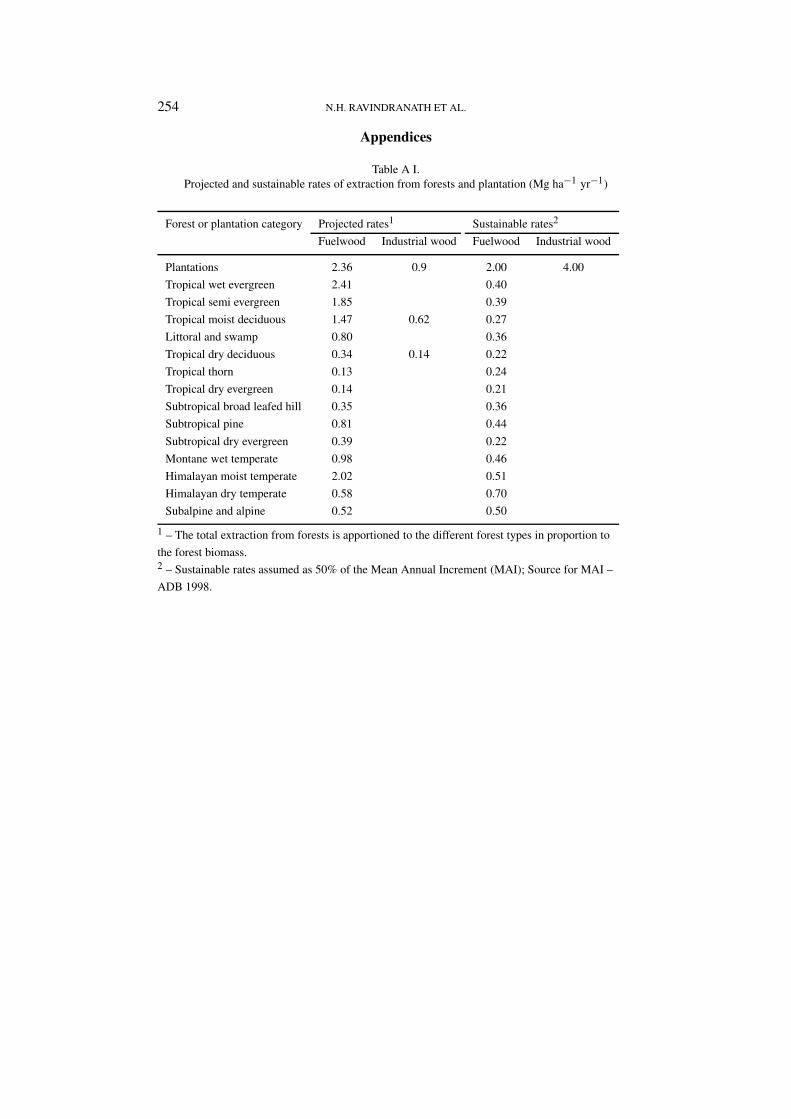
Table A I.Projected and sustainable rates of extraction from forests and plantation (Mg ha−1 yr−1)
Forest or plantation category Projected rates1 Sustainable rates2
Fuelwood Industrial wood Fuelwood Industrial wood
Plantations 2.36 0.9 2.00 4.00
Tropical wet evergreen 2.41 0.40
Tropical semi evergreen 1.85 0.39
Tropical moist deciduous 1.47 0.62 0.27
Littoral and swamp 0.80 0.36
Tropical dry deciduous 0.34 0.14 0.22
Tropical thorn 0.13 0.24
Tropical dry evergreen 0.14 0.21
Subtropical broad leafed hill 0.35 0.36
Subtropical pine 0.81 0.44
Subtropical dry evergreen 0.39 0.22
Montane wet temperate 0.98 0.46
Himalayan moist temperate 2.02 0.51
Himalayan dry temperate 0.58 0.70
Subalpine and alpine 0.52 0.50
1 – The total extraction from forests is apportioned to the different forest types in proportion to
the forest biomass.2 – Sustainable rates assumed as 50% of the Mean Annual Increment (MAI); Source for MAI –
ADB 1998.
FORESTRY FOR BIOMASS PRODUCTION AND CARBON SEQUESTERATION 255
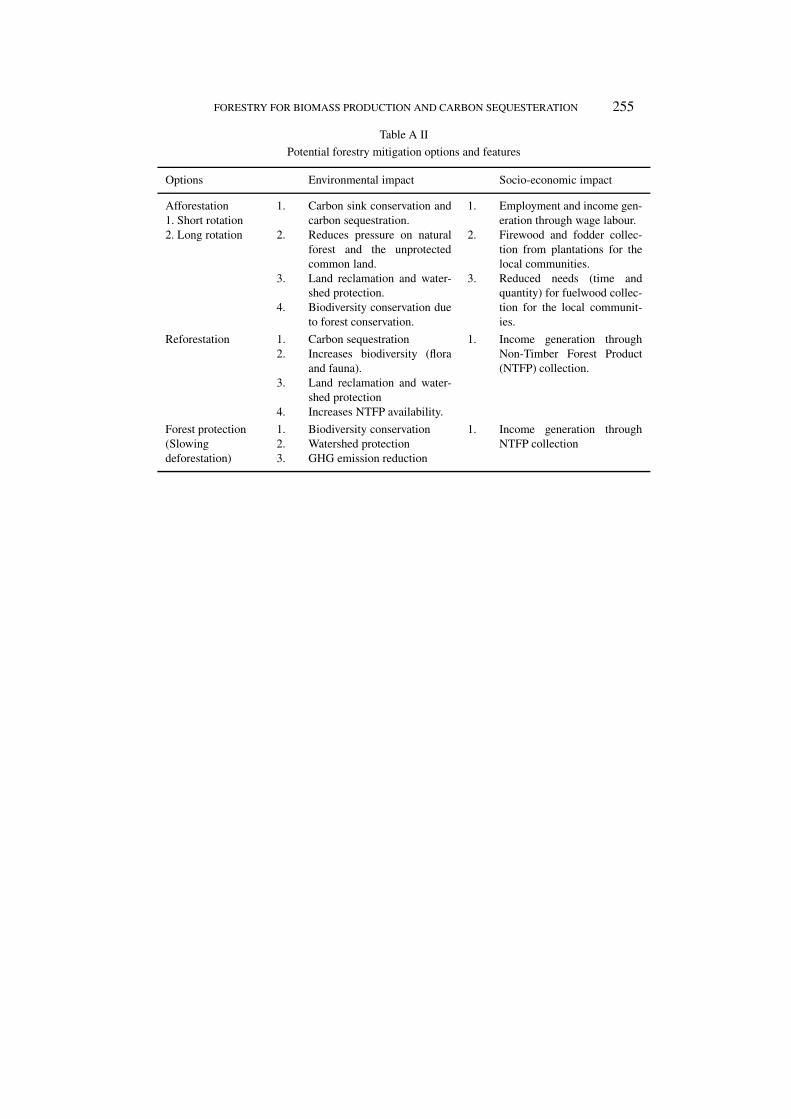
Table A II
Potential forestry mitigation options and features
Options Environmental impact Socio-economic impact
Afforestation1. Short rotation2. Long rotation
1.
2.
3.
4.
Carbon sink conservation andcarbon sequestration.Reduces pressure on naturalforest and the unprotectedcommon land.Land reclamation and water-shed protection.Biodiversity conservation dueto forest conservation.
1.
2.
3.
Employment and income gen-eration through wage labour.Firewood and fodder collec-tion from plantations for thelocal communities.Reduced needs (time andquantity) for fuelwood collec-tion for the local communit-ies.
Reforestation 1.2.
3.
4.
Carbon sequestrationIncreases biodiversity (floraand fauna).Land reclamation and water-shed protectionIncreases NTFP availability.
1. Income generation throughNon-Timber Forest Product(NTFP) collection.
Forest protection(Slowingdeforestation)
1.2.3.
Biodiversity conservationWatershed protectionGHG emission reduction
1. Income generation throughNTFP collection
256 N.H. RAVINDRANATH ET AL.
References
ADB: 1998, Asia Least-cost Greenhouse Gas Abatement Strategy, Asian Development Bank, GlobalEnvironment Facility, United Nations Development Programme.
CSE: 1998, State of India’s Environment, Centre for Science and Environment, New Delhi.FSI: 1998, State of Forest Report 1997, Forest Survey of India, Ministry of Environment and Forests,
Dehra Dun.IIPO: 1990, Report on the Survival Rate of Trees, Indian Institute of Public Opinion, New Delhi.Lal, R. and Bruce, J.P.: 1999, ‘The potential of world cropland soils to sequester carbon and mitigate
the greenhouse effect’, Env. Sci. Policy 2, 177–185.MoEF: 1999, National Forestry Action Plan, Ministry of Environment and Forests, Dehra Dun.Ravindranath, N.H. and Hall, D.O.: 1994, ‘Indian forest conservation and tropical deforestation’,
Ambio 23(8), 521–523.Ravindranath, N.H. and Hall, D.O.: 1995, Biomass, Energy and Environment; A Developing Country
Perspective from India. Oxford University Press.Ravindranath, N.H. and Somashekar, B.S.: 1995, ‘Potential and economics of forestry options for
carbon sequestration in India’, Biomass and Bioenergy 8(5), 323–336.Sathaye, J.A. and Ravindranath, N.H.: 1998, ‘Climate change mitigation in the energy and forestry
sectors of developing countries’, Ann. Rev. Energy & Env. 23, 387–437.Sathaye, J.A., Meyers, S., Allen-Diaz, B., Cirillo, R., Gibbs, M., Hillsman, E., Makundi, W. and Ohi,
J.: 1995, Greenhouse Gas Mitigation Assessment: A Guidebook, Kluwer Academic Publishers,Dordrecht.
Seebauer, M.: 1992, Review of Social Forestry Programmes in India, GWB Gesselschaft FurWalderhaltung und Waldbewirtschaftung GMBH, Michelstadt, Germany.
TSL: 1998, Statistical Outline of India, Tata Services Limited. Department of Economics andStatistics, Mumbai.