Q2FY18 RESULTS
FINOLEX INDUSTRIES LIMITED

Q2Y18 Results Summary
# P&F represents Pipes and Fittings
* Including inter segment transfer
2
Volumes (MT) P & F #
38,266 47,246
Q2FY17 Q2FY18
23.5%
Results Summary Financial Summary Appendix Operating Highlights Key Strategies
Volumes (MT) PVC resin*
39,902 40,539
Q2FY17 Q2FY18
1.6%
4,568 4,753
Q2FY17 Q2FY18
EBITDA (INR Mn)
870
496
Q2FY17 Q2FY18
43.0%
PAT (INR Mn)
513 283
Q2FY17 Q2FY18
44.8%
4.0%
Revenue (excl. duty and taxes) (INR Mn)
Management Comments: In the past five years, the PBT of Finolex Industries has shown a CAGR of 40% with pipes and fittings volume CAGR of 7%. During the last six months, we have consciously focused on volume growth for the pipe segment, initiated by a moderation in the net realization, which we will watch carefully over the next two quarters..

H1FY18 Results Summary
# P&F represents Pipes and Fittings
* Including inter segment transfer
2
Volumes (MT) P & F #
104,391 118,764
H1FY17 H1FY18
13.8%
Results Summary Financial Summary Appendix Operating Highlights Key Strategies
Volumes (MT) PVC resin*
102,337 115,537
H1FY17 H1FY18
12.9%
2,462 1,802
H1FY17 H1FY18
EBITDA (INR Mn)
26.8%
1,494
1,080
H1FY17 H1FY18
PAT (INR Mn)
27.7%
11,297
12,059
H1FY17 H1FY18
Revenue (excl. duty and taxes) (INR Mn)
6.7%
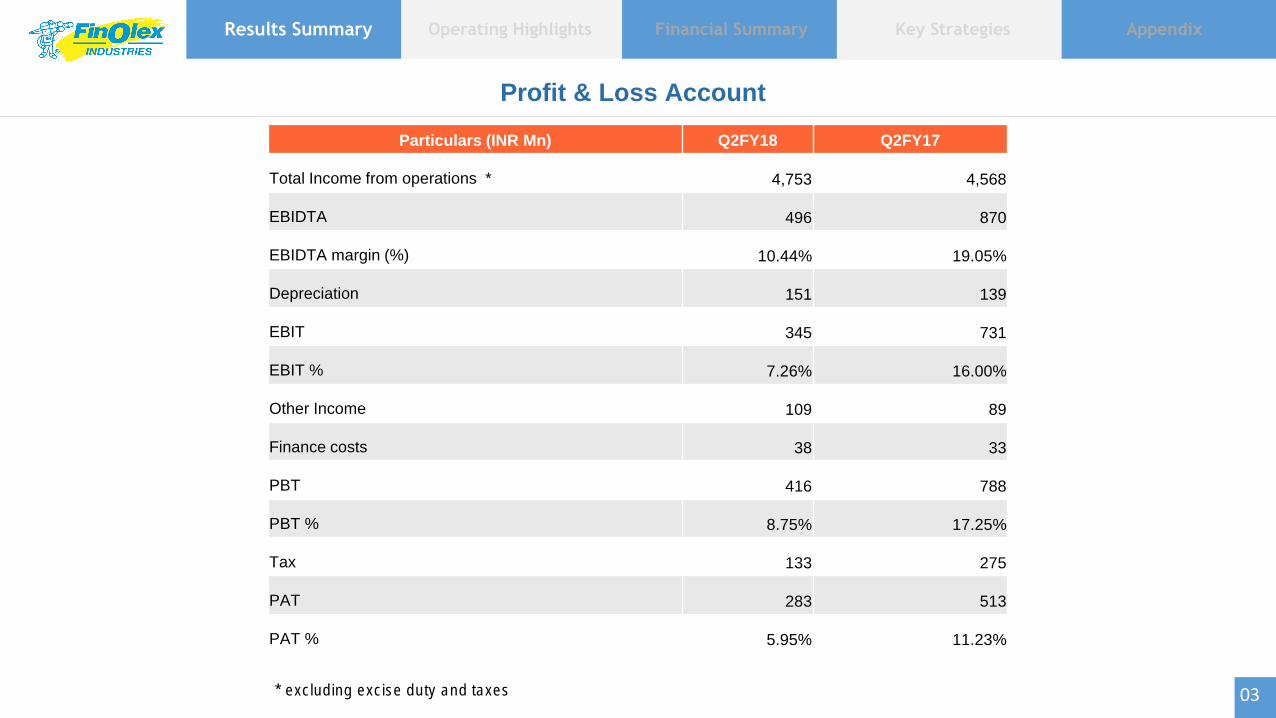
Particulars (INR Mn) Q2FY18 Q2FY17
Total Income from operations * 4,753 4,568
EBIDTA 496 870
EBIDTA margin (%) 10.44% 19.05%
Depreciation 151 139
EBIT 345 731
EBIT % 7.26% 16.00%
Other Income 109 89
Finance costs 38 33
PBT 416 788
PBT % 8.75% 17.25%
Tax 133 275
PAT 283 513
PAT % 5.95% 11.23%
Results Summary Financial Summary Appendix Operating Highlights Key Strategies
Profit & Loss Account
03 * excluding excise duty and taxes

Particulars (INR Mn) H1FY18 H1FY17
Total Income from operations * 12,059 11,297
EBIDTA 1,802 2,462
EBIDTA margin (%) 14.94% 21.79%
Depreciation 296 271
EBIT 1,506 2,191
EBIT % 12.49% 19.39%
Other Income 148 121
Finance costs 68 83
PBT 1,585 2,229
PBT % 13.14% 19.73%
Tax 505 736
PAT 1,080 1,494
PAT % 8.96% 13.22%
Results Summary Financial Summary Appendix Operating Highlights Key Strategies
Profit & Loss Account
03 * excluding excise duty and taxes

(INR Mn)
IND AS
Results Summary Financial Summary Appendix Operating Highlights Key Strategies
EBITDA Bridge Chart Q2FY18
05
870
185
-471
-31 -57
496
EBIDTA Q2FY17 Sales Cost of materialconsumed
Employee benefitexpenses
Other expenses EBIDTA Q2FY18
Note: Sales excludes excise duty and taxes.

So
urc
e: P
latt
s P
oly
me
rsca
n w
ee
kly
re
po
rts
PVC/EDC Delta (USD/MT)
Pipes & Fittings Volumes (MT)
PVC (USD/MT)
PVC Volumes (MT)
Results Summary Financial Summary Appendix Operating Highlights Key Strategies
Business Scenario
06
40688 42445
67693 66125
38266 40966
63982
71518
47246
Q2F
Y16
Q3F
Y16
Q4F
Y16
Q1F
Y17
Q2F
Y17
Q3F
Y17
Q4F
Y17
Q1F
Y18
Q2F
Y18
41512
60542
83093
62435
39902
56226
76541 74998
40539
Q2F
Y16
Q3F
Y16
Q4F
Y16
Q1F
Y17
Q2F
Y17
Q3F
Y17
Q4F
Y17
Q1F
Y18
Q2F
Y18
400
500
600
700
800
900
700
750
800
850
900
950
1000
1050
1100

Particulars (INR Mn) Q3FY16 Q4FY16 Q1FY17 Q2FY17 Q3FY17 Q4FY17 Q1FY18 Q2FY18
Total income from operations * 5,472 8,094 6,728 4,568 5,797 8,877 7,307 4,753
EBIDTA 841 1,156 1,592 870 1,329 1,785 1,306 496
EBIDTA margins (%) 15.4% 14.3% 23.7% 19.0% 22.9% 20.1% 17.9% 10.4%
Depreciation 127 127 133 139 140 139 145 151
Other Income 30 198 32 89 29 94 38 109
Finance costs 81 45 50 33 59 11 30 38
PBT 663 1,181 1,441 788 1,158 1,729 1,170 416
PBT margins (%) 12.1% 14.6% 21.4% 17.3% 20.0% 19.5% 16.0% 8.8%
Tax 238 361 461 275 416 496 372 133
PAT 424 820 980 513 742 1,233 798 283
EPS 3.4 6.6 7.9 4.1 5.9 9.9 6.4 2.3
07
Results Summary Financial Summary Appendix Operating Highlights Key Strategies
Quarterly - Profit & Loss
* excluding excise duty and taxes

Particulars (INR Mn) Q3FY16 Q4FY16 Q1FY17 Q2FY17 Q3FY17 Q4FY17 Q1FY18 Q2FY18
Segmental revenues *
PVC 3,567 4,538 4,048 2,564 4,043 5,572 5,137 2,742
PVC pipes & fittings 3,611 5,585 5,829 3,628 3,954 6,191 6,104 4,250
Power 357 355 388 321 378 361 382 259
Segmental profits
PVC 462 548 890 552 933 1,147 951 372
% of Revenues 13.0% 12.1% 22.0% 21.5% 23.1% 20.6% 18.5% 13.6%
PVC pipes & fittings 315 536 568 252 303 590 290 136
% of Revenues 8.7% 9.6% 9.7% 6.9% 7.7% 9.5% 4.8% 3.2%
Power 61 92 129 58 86 56 50 (7)
% of Revenues 17.1% 25.9% 33.3% 18.1% 22.8% 15.5% 13.1% (2.7%)
Capital employed
PVC 5,649 5,660 5,214 5,056 6,354 5,623 5,660 4,007
PVC pipes & fittings 4,730 4,337 5,210 5,218 5,860 5,683 5,449 5,939
Power 2,500 2,527 2,674 2,374 2,375 2,170 2,328 2,138
*excluding excise duty and taxes
08
Results Summary Financial Summary Appendix Operating Highlights Key Strategies
Quarterly segmental - Profit & Loss

Profit & loss account (INR Mn) FY12 FY13 FY14 FY15 FY16* FY17*
Revenue from Operations (excl. excise duty) 20,997 21,448 24,531 24,762 24,819 26,023
Growth in sales (YoY %) 6.16% 2.15% 14.37% 0.94% 0.23% 4.85%
EBIDTA before exceptional items 2,313 3,587 3,966 2,111 4,044 5,630
EBIDTA margins before exceptional items
(%) 11.02% 16.72% 16.17% 8.53% 16.29% 21.63%
EBIDTA after exceptional items 2,168 2,626 3,268 1,896 4,289 5,630
PBT 967 1,902 2,419 808 3,733 5,170
PBT Margin (%) 4.60% 8.87% 9.86% 3.26% 15.04% 19.87%
PAT 752 1,361 1,701 478 2,544 3,522
PAT Margin (%) 3.58% 6.35% 6.93% 1.93% 10.25% 13.53%
*Figures as per IndAS
09
Results Summary Financial Summary Appendix Operating Highlights Key Strategies
Profit & Loss - Key Indicators

*Figures as per IndAS
10
Balance sheet - Key Indicators
Results Summary Financial Summary Appendix Operating Highlights Key Strategies
Balance Sheet (INR Mn) FY12 FY13 FY14 FY15 FY16* FY17* H1FY18*
Equity and liabilities
Share capital 1,241 1,241 1,241 1,241 1,241 1,241 1,241
Reserves and surplus 5,381 5,971 6,656 6,633 14,458 21,673 21,499
Long term borrowings 1,896 1,397 2,322 1,837 - - -
Short term borrowings (incl. loans repayable in
one year) 8,528 6,997 4,812 4,534 1,117 942 2,094
Total borrowings 10,424 8,394 7,134 6,371 1,117 942 2,094
Assets
Fixed assets (Net block) 7,840 8,795 9,052 8,678 8,496 8,551 8,683
Capital WIP 854 506 325 104 66 217 473
Non current investments 1,221 1,274 1,274 1,246 6,485 11,656 12,115
Current investments 3,711 2,322 941 551 1,687 566 1,569

11.9% 11.0%
16.7% 16.2%
8.5%
16.3%
21.6%
FY11 FY12 FY13 FY14 FY15 FY16 FY17
EBITDA Margin*
1.20
1.60
1.20
0.90 0.80
0.13 0.04
FY11 FY12 FY13 FY14 FY15 FY16 FY17
Debt/Equity (x)
2.29 2.42
2.31
2.62 2.82
3.32 3.41
FY11 FY12 FY13 FY14 FY15 FY16 FY17
Fixed Asset Turnover (x)
*Standalone EBITDA Margin (EBITDA before Exceptional item and other income)
7,466
10,424
8,394
7,134 6,371
2,117
942
FY11 FY12 FY13 FY14 FY15 FY16 FY17
Gross Debt (INR Mn)
11
Key Ratios
Results Summary Financial Summary Appendix Operating Highlights Key Strategies

Results Summary Financial Summary Appendix Operating Highlights Key Strategies
Key Strategies
EXPANDING FOOTPRINT
Expand distribution
network in all geographies
with higher focus in the
northern and eastern
regions
CAPACITY EXPANSION Increase installed
capacities of PVC pipes
and fittings in order to
capture expected
increase in demand.
CASH-N-CARRY Follow Cash-n-carry
model to keep the
balance sheet light.
BRANDING Promote brand and
quality consciousness
amongst consumer.
12

Opportunities – Agriculture sector
Results Summary Financial Summary Appendix Operating Highlights Key Strategies
Total allocation for Rural,
Agriculture sector is
Rs.1,87,223 crores. MGNREGA
allocation has also increased to
its highest level at Rs.48,000
Cr this year. The Long Term
Irrigation Fund (LTIF) set up in
NABARD under Pradhan Mantri
Krishi Sinchai Yojana, for
financing and fast tracking the
implementation of incomplete
major and medium irrigation
projects has been allocated an
additional corpus of Rs. 20,000
Cr, thus doubling the corpus to
Rs. 40,000 Cr
Pradhan Mantri Krishi
Sinchai Yojana would
allow maximising the
reach of irrigation across
the country, thus
enhancing the ambit of
area covered under the
irrigation projects.
The coverage provided
under the Fasal Bima
Yojna Scheme has
increased to 40% in the
current year and 50% in
2018-19 to protect farmers
from any accidental
damage.
Over the next few
months 3 crore Kisan
credit cards will be
converted to RuPay
cards which shall enable
farmers to buy/sell
agricultural produce
directly through the
card and there will be
no need to rush to
banks.
13

Opportunities - Non - Agriculture sector
Surplus liquidity post
demonetisation,
government initiates to
provide houses in rural
and urban areas which
may have a fresh demand
for pipes. Affordable
housing to be given
infrastructure status.
Proposal to complete
construction of one crore
houses by 2019. Boost in
housing due to refinancing
by NHB.
Swachh Bharat Mission
(Gramin) has made
tremendous progress in
promoting safe sanitation.
Sanitation coverage in rural
India has gone up from 42%
in October 2014 to 64%.
Villages with sanitation
coverage are now being
given priority for piped
water supply.
Results Summary Financial Summary Appendix Operating Highlights Key Strategies
14
During the year, the
Company tied-up with the
American company Lubrizol
Corporation, inventors and
the largest manufacturers of
the CPVC compound
worldwide. The tie-up will
strengthen the Company’s
track record of providing
superior products for the
domestic market. The
products have been highly
appreciated and has brought
renewed interest among the
existing and new dealers.

Distribution reach
• FIL is on track in terms of expanding its scale of operations by
increasing production capacity and distribution reach
•Wide network of 18,000 retail touch points
Offices, Works and Warehouses
15
Results Summary Financial Summary Appendix Operating Highlights Key Strategies
Branch Office
Works
Corporate Office at Pune
Warehouse
Delhi
Indore
Cu ack
Pune
Ratnagiri
Urse
Masar

16
Branding & advertisements – some snapshots
Results Summary Financial Summary Appendix Operating
Highlights Key Strategies
16
Finolex Industries
participated in
‘E-TRANSACT - ET
ACETECH MUMBAI
CONNECT 2017’
Finolex Industries participated in
‘Agri Asia Exhibition’ in Ahemdabad
where we had our stall
Finolex Industries
participated in
‘Agri Intex Exhibition’ in
Coimbatore

16
Branding & advertisements – some snapshots
Results Summary Financial Summary Appendix Operating
Highlights Key Strategies
17
Finolex Industries associated with ‘Rally for
Rivers’ as National Support Partner
Learning and Development Programme - L&D
sessions conducted PAN India for Sales force to
provide training in Flowguard Plus product range.
TV branding in India vs. Australia series and Champions
Trophy - Finolex Industries Ltd. tied up with Star
Sports Network for branding during the matches-
L bands and Squeeze-ups.

16
Branding & advertisements – some snapshots
Results Summary Financial Summary Appendix Operating
Highlights Key Strategies
18
Branding at Ganpati, Navratri and Janmashtami festivals Branding at Durga Puja and Rath Yatra festivals

16
Branding & advertisements – some snapshots
Results Summary Financial Summary Appendix Operating
Highlights Key Strategies
19
In-shop branding at sub dealer outlets - 44 in West Bengal and 71 in Orissa.

Corporate Social Responsibility – some snapshots
Results Summary Financial Summary Appendix Operating
Highlights Key Strategies
20
40 trainees including the ANM & ASHA
workers were awarded certificates in
consultation with Symbiosis Nursing
School for successfully completing their
training at the Bhavdan Primary Health
Centre.
Donation of 2 wheelchairs to
2 children of Vidya Jyothi
School.
Finolex Pipes and Mukul Madhav
Foundation planted 3660 saplings of
different varieties in various areas of
Ratnagiri taluka with the support of 6
agencies.
Finolex Pipes and Mukul Madhav
Foundation along with Sancheti Hospital
sponsored surgery of Ms. Hirabai (cerebral
palsy patient). She is now able to stand
on her own.

Corporate Social Responsibility – some snapshots
Results Summary Financial Summary Appendix Operating
Highlights Key Strategies
21
In the loving memory of Late Shri.Pralhad
P Chhabria, Finolex Pipes and Mukul
Madhav Foundation provided financial
assistance to the tune of Rs.25 lakh
towards the Special Children Ward of
Savali Care Centre.
Finolex Pipes and Mukul
Madhav Foundation
organized 19th free medical
camp to ensure the well-
being of school students in
Ratnagiri.
Finolex Pipes and Mukul Madhav
Foundation contributed Rs. 10 lakhs
towards construction of 50 toilets for
the families of Sonale village, Thane
district.
Finolex Pipes and Mukul Madhav
Foundation supported the visually
impaired students of Niwant Organisation
and the specially abled children of Apang
Sanstha & Vidya Jyoti School to take part
in the ‘10th Yellow Ribbon NGO and
Artisan Fair’, 2017, organised by Ishyana.

Accolades and awards
India’s most Trusted
Brand in the category
“Manufacturing – Pipes”
awarded by Brand Trust
Report 2015.
The National Record
certificate by The Limca
Book of Records for
conducting the largest
number of plumbers meets
organised simultaneously
across 26 states and 58
cities on 11 March, 2016.
Global CSR Excellence &
Leadership Award at the
5th edition of Blue Dart
World CSR day initiative.
Results Summary Financial Summary Appendix Operating Highlights Key Strategies
19
Recently Awarded with
The Supply Chain
Enterprise Icon of the
Year – 2017” by Global
Logistics Excellence
Awards.
Finolex Pipes and Mukul
Madhav Foundation was
recently awarded ‘Best CSR
Integrated Business under
National Excellence for CSR
and Sustainability’ at the
‘National CSR Leadership
Congress & Awards’ held in
Bengaluru, September 2017.

Shareholding Pattern as on September 30, 2017
20
Results Summary Financial Summary Appendix Operating Highlights Key Strategies
4.02%
52.47%
8.18%
4.23%
35.12%
Promoters
Mutual Funds
Others
Foreign Portfolio Investors

FINOLEX INDUSTRIES LIMITED Mr. S. Krishnamoorthy (GM - Accounts & Finance)
D-1/10, M.I.D.C. Chinchwad, Pune 411 019
020 2740 8200 | 1-800-2003466
www.finolexwater.com
SAFE HARBOR STATEMENT: No part of this presentation is to be circulated, quoted, or reproduced for any distribution without prior written approval from Finolex Industries Limited, Chinchwad, Pune-411 019, India. Certain part of this presentation describing
estimates, objectives and projections may be a “forward looking statement” within the meaning of applicable laws and regulations. Actual results might differ materially from those either expressed or implied.
Agri Pipes and Fittings Column Pipes Casing Pipes ASTM Pipes and Fittings
CPVC Pipes and Fittings Sewerage Pipes Solvent Cement

Finolex Industries Ltd.Volume Data
Sr. No. Particulars Q3FY15 Q4FY15 Q1FY16 Q2FY16 Q3FY16 Q4FY16 Q1FY17 Q2FY17 Q3FY17 Q4FY17 Q1FY18 Q2FY18
1 Production in MT
a PVC Resin 82,034 78,125 60,048 38,815 67,892 80,147 59,756 40,937 83,266 67,751 63,805 34,528
b PVC pipes & fittings 29,780 57,983 57,129 41,801 45,089 63,144 66,693 40,416 44,844 55,808 74,054 52,672
2 Sales in MT
a PVC Resin-External 47,183 49,723 17,866 17,535 29,952 41,418 12,751 13,080 25,281 36,124 15,725 6,494
PVC Resin-Inhouse 14,643 47,782 45,164 23,977 30,590 41,675 49,684 26,822 30,945 40,417 59,273 34,045
Total PVC 61,826 97,505 63,030 41,512 60,542 83,093 62,435 39,902 56,226 76,541 74,998 40,539
b PVC Pipes 36,118 53,353 54,451 37,194 39,163 63,387 62,255 34,218 37,652 59,945 68,171 43,032
c PVC Fittings 2,738 3,613 3,487 3,494 3,282 4,306 3,870 4,048 3,314 4,117 3,347 4,214
Total Pipes and Fittings 38,856 56,966 57,938 40,688 42,445 67,693 66,125 38,266 40,966 64,062 71,518 47,246
In MWH
1 Power generated 13362 58018 53578 39428 49602 46180 55,243 46,909 55,710 53,640 57,999 36,277
Note: The above is subject to reconciliation