IEEE TRANSACTIONS ON INSTRUMENTATION AND MEASUREMENT 1
Abstract — This article has two main objectives. First, it
describes the practical challenges of field trials and proposes
a developed test method. Secondly, the test method is used to
compare uplink performance with different antenna
technologies when user equipment does not have a line of
sight to the evolved Node B. Both passive and active antenna
configurations were used in the performance evaluation.
Modern cellular networks have high demands for capacity,
reliability, and availability. The verification of a network's
configuration and technological features is essential to
guarantee network performance, and the performance of a
network must be verified by laboratory testing or field trials;
such trials produce experimental knowledge of technology
features and configurations. Technological and
environmental factors must also be considered before
performing mobile network field-testing. Our work showed
that moving user equipment produces more reliable and
repeatable results than measurements with stationary user
equipment. Our antenna configuration comparison study
revealed that in the uplink direction, active antenna system
beam control could significantly increase the uplink capacity
in non-line-of-sight conditions.
Index Terms— 2- and 4-way RX diversity, AAS, field trial,
horizontal beamforming, non-line-of-sight environment,
MIMO, uplink capacity improvement, vertical beamforming.
I. INTRODUCTION
This paper illustrates the practical challenges of measuring
dynamic cellular networks. This study describes a field test
method developed for antenna systems. Many of the recent
research activities relating to emerging 5G related testing is
concentrating methods based on emulating realistic
electromagnetic environment such as [1-3]. However, as
stated in [4] the measurements in an actual operating
environment is required to fully cover and compensate the
antenna configuration selections. Therefore, we focus on the
field measurements and the objective of this paper is to
introduce a drive test method and comparison of uplink (UL)
performance with different antenna technologies when
Marjo Heikkilä is with Centria University of Applied Sciences,
Vierimaatie 7, 84100 Ylivieska, Finland (email: [email protected]). Juha Erkkilä is with Centria University of Applied Sciences, Vierimaatie
7, 84100 Ylivieska, Finland (email: [email protected]).
Jouni K. Tervonen is with the University of Oulu, Kerttu Saalasti Institute, Nivala 85500, Finland. (e-mail: [email protected]).
Marjut Koskela is with Centria University of Applied Sciences,
Vierimaatie 7, 84100 Ylivieska, Finland (email: [email protected]). Joni Heikkilä is with Centria University of Applied Sciences, Vierimaatie
7, 84100 Ylivieska, Finland (email: [email protected]).
receiving non-line-of-sight (NLOS) signals in field tests. The
antenna configurations used included both a passive and an
active antenna system (AAS). A radiation pattern can be
controlled horizontally by changing its azimuth angle and
vertically by changing the tilt angle of the antenna. AAS
includes a flexible configuration that consists of diversity
beams and other features for beam control to improve
throughput [5]. The field trial benefitted 2-way and 4-way
receiver (RX) diversity in both antenna systems. The field
trial environment consisted of three macrocellular long-term
evolution (LTE) evolved Node Bs (eNBs) operating in the 2.1
GHz band. This trial environment had two AAS’s and one
passive antenna system used for the measurements. The
environment could encompass one macro cell. With vertical
control, it was possible to add an additional beam, while with
horizontal control, it was possible to steer the main beam
towards the user equipment (UE). In field trials, the mobile
network user had UE in drive testing to evaluate the network
quality from a mobile device’s point of view. The field trial
results indicated that AAS beam control could achieve
remarkable capacity gain in the uplink direction when the UE
did not have a line of sight to the eNB.
The remainder of the article is organized as follows:
Section II illustrates aspects that affect mobile networks
performance including some related works of the antenna
configuration-related field measurements. The measurement
setup and environment of our field measurement campaign
are described in Section III. Selection of the measurement
points is explained in Section IV, and the description of the
measurement case is shown in Section V. Section VI focuses
on the analysis of the measurement option, i.e., the
comparison of stationary and moving measurements, which
was recently presented in [6]. The actual key results of the
antenna configuration comparison via field measurements are
shown in Section VII, and the discussion and conclusion are
presented in Section VIII.
II. FACTORS AFFECTING PERFORMANCE AND FIELD
MEASUREMENT IN MOBILE NETWORKS
Several factors must be considered when verification
Tuomo Kupiainen is with Centria University of Applied Sciences,
Vierimaatie 7, 84100 Ylivieska, Finland (email: [email protected]).
Tero Kippola is with Centria University of Applied Sciences, Vierimaatie
7, 84100 Ylivieska, Finland (email: [email protected]). Asko Nykänen is with Nokia, Oulu, Finland (email:
Risto Saukkonen is with Nokia, Oulu, Finland (email: [email protected]).
Marco D. Migliore is with DAEIMI, University of Cassino, Cassino, Italy
(email: [email protected]) and ELEDIA@UniCAS research laboratory, Cassino, Italy.
Field Measurement for Antenna Configuration
Comparison in Challenging NLOS Locations
Marjo Heikkilä, Member, IEEE, Juha Erkkilä, Jouni K. Tervonen, Member, IEEE, Marjut Koskela,
Joni Heikkilä, Tuomo Kupiainen, Tero Kippola, Asko Nykänen, Risto Saukkonen,
and Marco Donald Migliore, Senior Member, IEEE
IEEE TRANSACTIONS ON INSTRUMENTATION AND MEASUREMENT 2
measurements of a mobile network are planned; the mobile
network and system parameters need specific attention.
Environmental factors significantly impact signal
propagation. When measurements are planned, they often
demand additional definition afterwards.
LTE Technology
LTE capacity depends on many issues, such as the data
transmission capability of single cells. The mobile network
and parameters need to be designed appropriately to obtain
optimal coverage and capacity. Network parameters such as
radiated power, frequency band, bandwidth, antenna design,
and power need to be considered. The capacity is closely
dependent on the number of LTE eNB elements and the
bandwidth each eNB offers. The distance between the eNB
and the UE also affects the capacity. The dynamic modulation
and coding scheme results in high data rates and capacity
when the UE is located near the eNB, whereas the cell edge
and inside building locations offer minimum capacity. As the
bit error rate increases along with the utilization level of the
network, it also influences the signal coverage areas of the
eNBs [7].
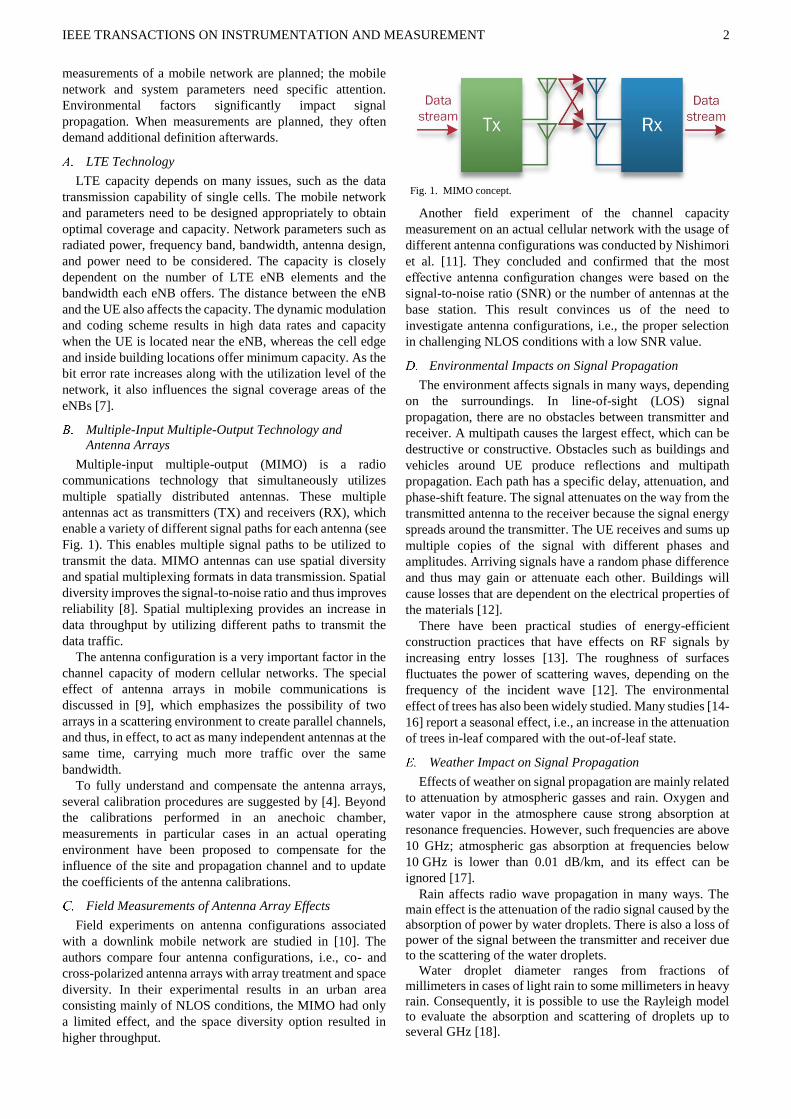
Multiple-Input Multiple-Output Technology and
Antenna Arrays
Multiple-input multiple-output (MIMO) is a radio
communications technology that simultaneously utilizes
multiple spatially distributed antennas. These multiple
antennas act as transmitters (TX) and receivers (RX), which
enable a variety of different signal paths for each antenna (see
Fig. 1). This enables multiple signal paths to be utilized to
transmit the data. MIMO antennas can use spatial diversity
and spatial multiplexing formats in data transmission. Spatial
diversity improves the signal-to-noise ratio and thus improves
reliability [8]. Spatial multiplexing provides an increase in
data throughput by utilizing different paths to transmit the
data traffic.
The antenna configuration is a very important factor in the
channel capacity of modern cellular networks. The special
effect of antenna arrays in mobile communications is
discussed in [9], which emphasizes the possibility of two
arrays in a scattering environment to create parallel channels,
and thus, in effect, to act as many independent antennas at the
same time, carrying much more traffic over the same
bandwidth.
To fully understand and compensate the antenna arrays,
several calibration procedures are suggested by [4]. Beyond
the calibrations performed in an anechoic chamber,
measurements in particular cases in an actual operating
environment have been proposed to compensate for the
influence of the site and propagation channel and to update
the coefficients of the antenna calibrations.
Field Measurements of Antenna Array Effects
Field experiments on antenna configurations associated
with a downlink mobile network are studied in [10]. The
authors compare four antenna configurations, i.e., co- and
cross-polarized antenna arrays with array treatment and space
diversity. In their experimental results in an urban area
consisting mainly of NLOS conditions, the MIMO had only
a limited effect, and the space diversity option resulted in
higher throughput.
Another field experiment of the channel capacity
measurement on an actual cellular network with the usage of
different antenna configurations was conducted by Nishimori
et al. [11]. They concluded and confirmed that the most
effective antenna configuration changes were based on the
signal-to-noise ratio (SNR) or the number of antennas at the
base station. This result convinces us of the need to
investigate antenna configurations, i.e., the proper selection
in challenging NLOS conditions with a low SNR value.
Environmental Impacts on Signal Propagation
The environment affects signals in many ways, depending
on the surroundings. In line-of-sight (LOS) signal
propagation, there are no obstacles between transmitter and
receiver. A multipath causes the largest effect, which can be
destructive or constructive. Obstacles such as buildings and
vehicles around UE produce reflections and multipath
propagation. Each path has a specific delay, attenuation, and
phase-shift feature. The signal attenuates on the way from the
transmitted antenna to the receiver because the signal energy
spreads around the transmitter. The UE receives and sums up
multiple copies of the signal with different phases and
amplitudes. Arriving signals have a random phase difference
and thus may gain or attenuate each other. Buildings will
cause losses that are dependent on the electrical properties of
the materials [12].
There have been practical studies of energy-efficient
construction practices that have effects on RF signals by
increasing entry losses [13]. The roughness of surfaces
fluctuates the power of scattering waves, depending on the
frequency of the incident wave [12]. The environmental
effect of trees has also been widely studied. Many studies [14-
16] report a seasonal effect, i.e., an increase in the attenuation
of trees in-leaf compared with the out-of-leaf state.
Weather Impact on Signal Propagation
Effects of weather on signal propagation are mainly related
to attenuation by atmospheric gasses and rain. Oxygen and
water vapor in the atmosphere cause strong absorption at
resonance frequencies. However, such frequencies are above
10 GHz; atmospheric gas absorption at frequencies below
10 GHz is lower than 0.01 dB/km, and its effect can be
ignored [17].
Rain affects radio wave propagation in many ways. The
main effect is the attenuation of the radio signal caused by the
absorption of power by water droplets. There is also a loss of
power of the signal between the transmitter and receiver due
to the scattering of the water droplets.
Water droplet diameter ranges from fractions of
millimeters in cases of light rain to some millimeters in heavy
rain. Consequently, it is possible to use the Rayleigh model
to evaluate the absorption and scattering of droplets up to
several GHz [18].
Fig. 1. MIMO concept.

IEEE TRANSACTIONS ON INSTRUMENTATION AND MEASUREMENT 3
Conducted studies showed that the attenuation is lower
than a 0.1 dB/km frequency up to 10 GHz in cases of
moderate rain (5 mm/h), while at 5 GHz, the attenuation is
also lower than 0.1 dB/km in cases of heavier rain (20 mm/h).
Regarding the scattering, its effect is small compared to that
related to power absorption. The depolarization effect is also
small [19]. Consequently, at ultra-high frequencies (UHF),
rain does not significantly affect signal propagation [20].
Water is also present in fog. However, fog droplets have
radii on the order of 1/100 mm, producing a negligible
absorption in UHF.
Finally, it is worth noting that rain can also affect the signal
in an “indirect way,” changing the electromagnetic
environment. In fact, wet surfaces have reflective properties
different from those of dry surfaces. Since the
electromagnetic environment depends on the reflecting
properties of the surfaces, wet surfaces modify the multipath
propagation and, hence, the communication channel between
transmitter and receiver.
III. MEASUREMENT ENVIRONMENT AND SETUP
Technology Solutions
All trial network antennas employed RX cross-polarization
diversity in addition to polarization diversity; passive
antennas using two columns also employed spatial diversity.
Different UL beamforming solutions were operated in this
field trial to compare their performance in an NLOS situation.
Usually, RX signals to eNBs arrive through various paths
such as direct LOS, reflections, and dispersions. The RX
diversity technique is used to improve communication in an
NLOS situation. RX diversity means using two or more
receiving antennas, and it is usually implemented as part of
spatial diversity, polarization diversity, or a combination
thereof. The signals from the antennas are combined in the
receiver, and a sensitivity gain is achieved. The aim of
beamforming is to increase the coverage of the cell.
In this field trial, the vertical beamforming used a main
beam and an additional beam, separated by applying a
different tilt angle. In the horizontal beamforming, the beam
was steered towards the UE. The beamforming methods are
shown in Fig. 2.
Network
Measurements were performed in a suburban/rural
environment within the field trial environment, located in
Ylivieska, Finland [21]. The field trial environment was
developed within the CORE, CORE+, and CORE++ projects
between 2011 and 2016. The AAS environment was part of a
cognitive radio trial environment (CORE) that was operated
to showcase the world’s first live licensed shared access
(LSA) trials, described in [22]. This environment has also
been used in several other public trials, such as [23, 24]. The
field trial environment network has a restricted connection to
the Internet or other public networks. This environment can
be operated only by the UEs acquired for the test purpose.
The field trial network is illustrated in Fig. 3 and described in
[6, 25]. The data traffic for testing was provided by file
transfer protocol (FTP) from UEs to the network and, more
specifically, by the FTP server located in the Nokia Networks
core network in Oulu. Table I presents the test parameters for
each antenna configuration in this trial. The Puuhkala site
operated two AAS and one passive antenna in the 2.1 GHz
LTE band. The only variations occurred when the antenna
height varied between 154 and 155 meters. The antenna
height was based on the global positioning system (GPS)
information.
Measurement Tools
Drive test software [26] was operated with the
measurements to evaluate performance. During the test, a test
car was driven very slowly, parallel to NLOS point buildings.
The car was equipped with the drive test software, an LTE
dongle [27], a test SIM card, and external antennas [28] that
minimized the effects from the vehicle’s structure. A laptop
with the measurement software was located on the front seat
of the car (Fig. 4). The transmitting antenna was located on
Fig. 3. Field trial network.
Fig. 2. Different antenna configurations in trial environment.
TABLE I.
TEST PARAMETERS
Configuration LTE FDD
AAS 2100
Vertical
Single
Column
LTE FDD
AAS 2100
Horizontal
Four Column
LTE FDD
Passive 2100
Two
Column
LTE system
Bandwidth 5 MHz
Carrier band 2100 MHz (LTE band 1)
Beamwidth (°) 59 30 64
eNB max TX
power 43 dBm
Antenna height
from GPS info 154 m 155 m 154 m
Number of
mobile UEs 1

IEEE TRANSACTIONS ON INSTRUMENTATION AND MEASUREMENT 4
the roof of the car and the RX only antenna on the dashboard
of the car. The LTE dongle used single-carrier FDMA (SC-
FDMA) in the uplink direction. When the channel state is
evaluated several factors such as SINR, RSRP and throughput
indicate the state [29]. During the measurements Key
Performance Indicator (KPI) values such as media access
control (MAC) throughput, reference signal received power
(RSRP), transmit (TX) power, reference signal received
quality (RSRQ) and signal-to-noise ratio (SNR) were
gathered. Our analysis focused on throughput because our
previous studies revealed that it is the most essential KPI to
compare different antenna technology features. The tests
were performed in a rather sparsely populated areas and the
frequency used was on a loan from a national operator who
does not use the frequency in the locations where the
performance measurements were made, nor do other
operators use the frequency and thus the interference from
other users and systems is negligible. We verified
interference impact by monitoring SNR. GPS was used to
identify the location, and during the measurements, files were
transferred by FTP.
Measurement Period
The conducted measurements took place from early June
to late September. During the four-month measurement
period, the only considerable changes in the measurement
circumstances were that the environment foliage decreased in
autumn, which caused a slight throughput increase in the
measurements [25]. The weather was visually observed
during the measurements, and it was established that weather
had no effects on the results.
IV. SELECTION OF THE MEASUREMENT POINTS
At the beginning of this study, it was important to find the
most suitable measurement points (MPs) with challenging
locations that could provide meaningful information on the
performance of a complex communication system. The
procedure began by defining the specifications for
challenging points between the UE and eNB. The objective
was to find locations with a challenging radio environment.
These points were chosen so the environment had NLOS
signal propagation to the Puuhkala eNB. Eleven different
measurement points were selected for the preliminary study,
according to assumptions about challenging environments
based on such aspects as surrounding buildings, the distance
and direction from the antenna mast, and the estimation of the
coverage area. The preliminary measurements provided more
accurate information with which to plan the actual
comparison measurements.
Preliminary Measurements
The Puuhkala eNB (brown point: eNB) and measurement
points are shown in Fig. 5. Three of the eleven measurement
points were located indoors (blue points: MP 9, MP 10,
MP 11). The remaining eight measurement points were
located outdoors (red points: from MP 1 to MP 8). Common
to the outdoor measurement points was that the material used
in the surrounding buildings included mainly brick and
concrete elements.
Two of the three indoor measurement points were located
in the proximity of the Puuhkala eNB, and MP 11 was located
inside Centria’s campus. After the first preliminary
measurements, it was concluded from the analysis that the
indoor measurement points, MP 9, MP 10, and MP 11, did
not meet the specific requirements for these measurements,
because these measurement points produced exceptionally
good UL throughput with every antenna configuration, even
while the points were located inside concrete buildings. It was
concluded that the good UL throughput was because these
indoor measurement points were located near the Puuhkala
eNB. The signal strength as well as signal-to-noise ratio was
good, and it enabled the best possible UL throughput with
these setups.
Outdoor measurement points MP 1, MP 2, and MP 3 were
also too close to the eNB and produced the best possible UL
throughput in the preliminary measurements. In the
preliminary analysis, it was concluded that these
measurement points did not meet the requirements set in the
specifications for these measurements, since they did not
offer a sufficiently challenging environment.
Accepted Measurement Points in Detail
Based on the analysis of the preliminary measurements, it
was concluded that five measurement points—MP 4, MP 5,
MP 6, MP 7, and MP 8—would be suitable for actual
measurements. Most of these measurement points have high
buildings obscuring the LOS from the Puuhkala eNB, and
they also have neighboring buildings near them. The height
difference between the Puuhkala eNB antenna element and
measurement points MP 4 to MP 8 has been calculated in
Table II. The height values of the eNB and MPs are based on
GPS information. The distances from the measurement points
Fig. 5. Puuhkala eNB and MP 1 to MP 11 locations.
Puuhkala eNB and MP 1 to MP 11 locations.
Fig. 4. Measurement setup.

IEEE TRANSACTIONS ON INSTRUMENTATION AND MEASUREMENT 5
to the Puuhkala eNB and the height of the buildings obscuring
the LOS at each measurement point are shown in Table II.
The building obscuring the LOS at MP 4 between the eNB
and UE is a four-story office building whose outer wall is
made of bricks. Behind this office building is a one-story
office building with a very large cone-shaped roof. The yard
has been coated with asphalt and serves as a parking lot for
the workers.
At MP 5, the building between the eNB and the
measurement point is a three-story apartment building whose
outer wall is made of bricks. The yard of this building has
been coated with asphalt. Behind this measurement point is
an apartment building whose outer wall is also made of
bricks. Near these buildings grow a number of birch and pine
trees.
The building between MP 6 and the eNB is a community
building whose outer wall is made of wood. This
measurement point is located in the courtyard of the
community building and a four-story office building. The
office building and other buildings around this measurement
point have outer walls made of bricks, and the courtyard is
coated with asphalt. This courtyard has parking places for the
workers’ cars, and the area was almost full of them during the
measurement.
The building between MP 7 and the eNB is a four-story
apartment building whose outer wall is made of bricks. Near
this building grow a number of birch trees. In the proximity
of MP 7 is an asphalt parking space for the residents.
MP 8 has a tennis hall with an arched roof between the UE
and eNB. In the immediate vicinity of the tennis hall are no
other tall buildings. A few hundred meters from the tennis
hall is an indoor ice rink. The asphalt-coated inner yard
between the tennis hall and the indoor ice rink serves as a
parking space.
V. DESCRIPTIONS OF MEASUREMENT CASE
In the chosen measurement points from MP 4 to MP 8,
repeatability, reliability, and good results in the challenging
radio environment were investigated in the measurements. At
each measurement point, the measurement began by placing
the UE in a predetermined location, which was evaluated
visually, and then the UL data transfer could be started.
One measurement data set lasted approximately one
minute, during which time the drive test software gathered
approximately two samples per second. During one
measurement date set, on average, the number of throughput
samples gathered was 150 ± 20. Ensuring reliability and
repeatability of the results in each MP several different data
sets were measured on different dates.
Stationary Measurements
The UE (the car) was stationary during the first phase of
measurements, i.e., the creation of several measurement data
set on different dates. Measurement analysis indicated that
the static UE measurements at the measurement points had
too much variation on the date sets measured on different
dates, and the results were not repeatable. This was due to the
signal reflections of the environment changed over time due
to the varying multipath propagation channel over the days
and the difficulty of placing the UE at the exactly same spot
for every measurement data set. It was concluded that the
measurement procedure should be further developed to obtain
statistical and reliable measurement results.
Moving Measurements
In NLOS conditions, the time variation of multipath
channel conditions is evident and unavoidable. Many
condition changes near the reception point cause changes on
the summing of all the received signal strengths. Those
changing conditions include the misplacement and
disorientation of the measurement device affecting the signal
path lengths, changes on the reflection coefficients of
surrounding buildings due to change in surface moisture,
placements and orientation of parked and moving vehicles
and people near the reception point. Beyond near the
reception point, the variation of the signal strength over the
whole propagation path could be affected via changes on
weather conditions or possible shadowing due to trees and
foliage.
Thus, in NLOS conditions with stationary measurements
repeated over the time, even a slight change or misplacement
and disorientation of the measurement device are plausible
sources of high variation between the received signal
strengths and thus affecting the throughput results. The aim
of moving measurements was to rid of that effect and to
achieve results that are less vague and less a possible source
of erroneous interpretation to the results of different antenna
configuration comparisons. The measurements were repeated
with moving UE. The car with the measurement equipment
was driven very slowly, parallel to NLOS point buildings.
The measurements were repeated forwards and backwards to
see whether the direction of movement influenced the results.
It appeared that the results were more reliable and repeatable
when the UE was moving slowly.
VI. COMPARISON OF THE MEASUREMENT METHOD
OPTIONS
We performed several moving and stationary
measurements with different antenna configurations. In this
section, we analyze the distributions of the measurements on
different dates or at different times. When the measurement
is reliable and repeatable, the distributions of different
measurements should not differ much. In the first analysis,
we calculated several boxplots. Since the difference between
moving and stationary measurements was particularly high at
points MP 5 and MP 6 for the V4 configuration, these
sites/methods were further studied. The results for MP 5 were
presented in [6], while here, we consider those for MP 6. An
example boxplot is given in Fig.6. In Fig. 6 as well as later in
Figs. 9 and 10, the box in the middle represents the
TABLE II. MEASUREMENT POINT INFORMATION
Measurement
points (MP)
Distance
to
Puuhkala
eNB
Height of
building
obscuring
LOS
Height
difference
between
eNB
antenna
and the
MP
RX
Azimuth
angle (°)
MP 4 830 m 18.5 m 57 -34°
MP 5 1014 m 14.5 m 60 -17
MP 6 1380 m 11.0 m 37 -2
MP 7 1547 m 12.0 m 56 4
MP 8 1271 m 10.0 m 47 23
IEEE TRANSACTIONS ON INSTRUMENTATION AND MEASUREMENT 6
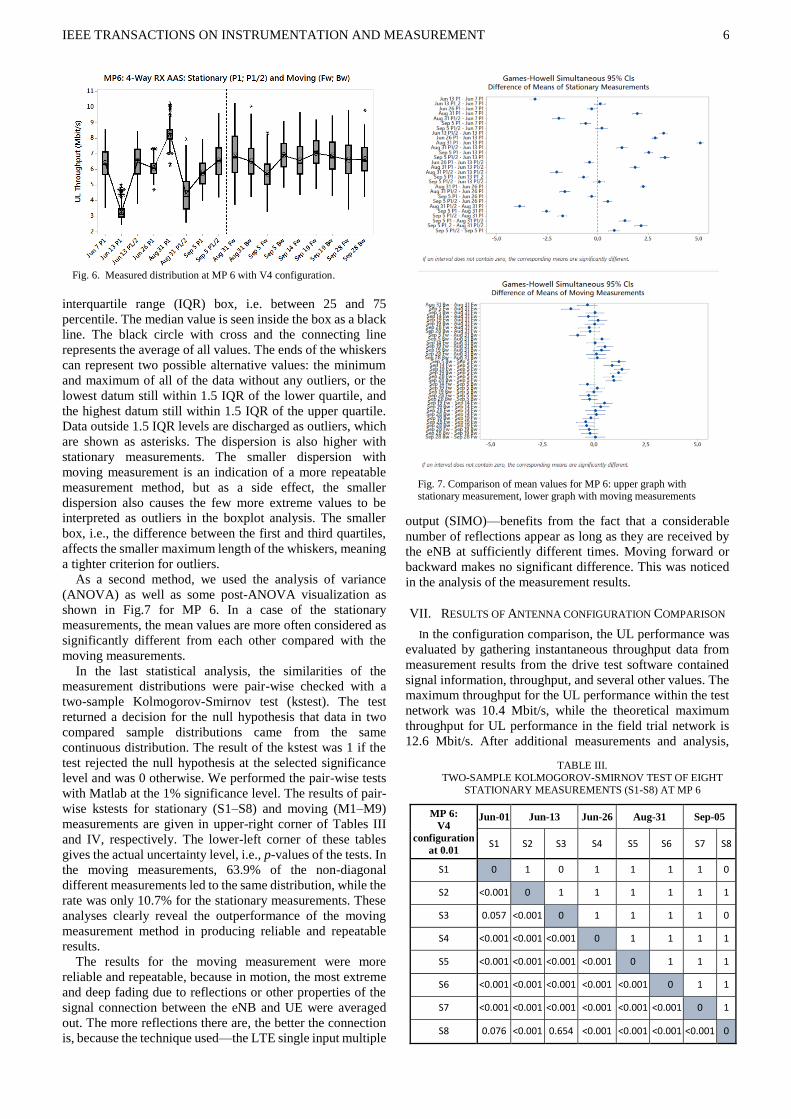
interquartile range (IQR) box, i.e. between 25 and 75
percentile. The median value is seen inside the box as a black
line. The black circle with cross and the connecting line
represents the average of all values. The ends of the whiskers
can represent two possible alternative values: the minimum
and maximum of all of the data without any outliers, or the
lowest datum still within 1.5 IQR of the lower quartile, and
the highest datum still within 1.5 IQR of the upper quartile.
Data outside 1.5 IQR levels are discharged as outliers, which
are shown as asterisks. The dispersion is also higher with
stationary measurements. The smaller dispersion with
moving measurement is an indication of a more repeatable
measurement method, but as a side effect, the smaller
dispersion also causes the few more extreme values to be
interpreted as outliers in the boxplot analysis. The smaller
box, i.e., the difference between the first and third quartiles,
affects the smaller maximum length of the whiskers, meaning
a tighter criterion for outliers.
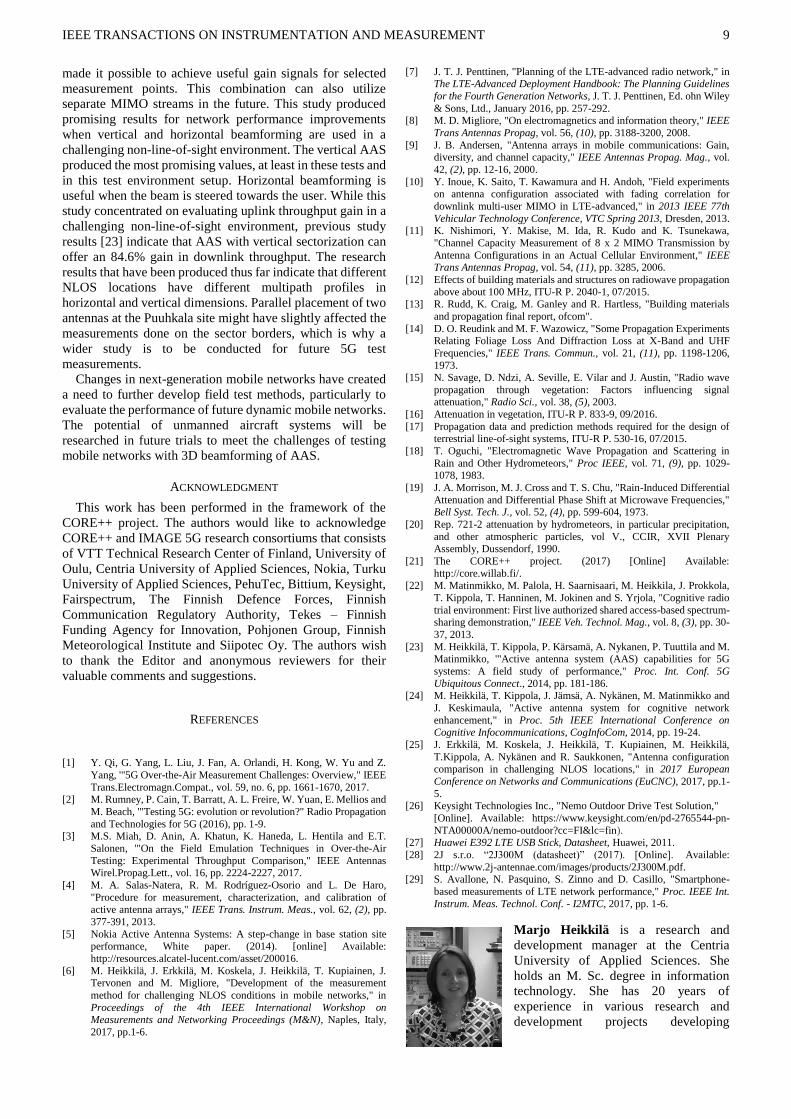
As a second method, we used the analysis of variance
(ANOVA) as well as some post-ANOVA visualization as
shown in Fig.7 for MP 6. In a case of the stationary
measurements, the mean values are more often considered as
significantly different from each other compared with the
moving measurements.
In the last statistical analysis, the similarities of the
measurement distributions were pair-wise checked with a
two-sample Kolmogorov-Smirnov test (kstest). The test
returned a decision for the null hypothesis that data in two
compared sample distributions came from the same
continuous distribution. The result of the kstest was 1 if the
test rejected the null hypothesis at the selected significance
level and was 0 otherwise. We performed the pair-wise tests
with Matlab at the 1% significance level. The results of pair-
wise kstests for stationary (S1–S8) and moving (M1–M9)
measurements are given in upper-right corner of Tables III
and IV, respectively. The lower-left corner of these tables
gives the actual uncertainty level, i.e., p-values of the tests. In
the moving measurements, 63.9% of the non-diagonal
different measurements led to the same distribution, while the
rate was only 10.7% for the stationary measurements. These
analyses clearly reveal the outperformance of the moving
measurement method in producing reliable and repeatable
results.
The results for the moving measurement were more
reliable and repeatable, because in motion, the most extreme
and deep fading due to reflections or other properties of the
signal connection between the eNB and UE were averaged
out. The more reflections there are, the better the connection
is, because the technique used—the LTE single input multiple
output (SIMO)—benefits from the fact that a considerable
number of reflections appear as long as they are received by
the eNB at sufficiently different times. Moving forward or
backward makes no significant difference. This was noticed
in the analysis of the measurement results.
VII. RESULTS OF ANTENNA CONFIGURATION COMPARISON
In the configuration comparison, the UL performance was
evaluated by gathering instantaneous throughput data from
measurement results from the drive test software contained
signal information, throughput, and several other values. The
maximum throughput for the UL performance within the test
network was 10.4 Mbit/s, while the theoretical maximum
throughput for UL performance in the field trial network is
12.6 Mbit/s. After additional measurements and analysis,
Fig. 7. Comparison of mean values for MP 6: upper graph with stationary measurement, lower graph with moving measurements
Fig. 6. Measured distribution at MP 6 with V4 configuration.
TABLE III.
TWO-SAMPLE KOLMOGOROV-SMIRNOV TEST OF EIGHT
STATIONARY MEASUREMENTS (S1-S8) AT MP 6
MP 6:
V4
configuration
at 0.01
Jun-01 Jun-13 Jun-26 Aug-31 Sep-05
S1 S2 S3 S4 S5 S6 S7 S8
S1 0 1 0 1 1 1 1 0
S2 <0.001 0 1 1 1 1 1 1
S3 0.057 <0.001 0 1 1 1 1 0
S4 <0.001 <0.001 <0.001 0 1 1 1 1
S5 <0.001 <0.001 <0.001 <0.001 0 1 1 1
S6 <0.001 <0.001 <0.001 <0.001 <0.001 0 1 1
S7 <0.001 <0.001 <0.001 <0.001 <0.001 <0.001 0 1
S8 0.076 <0.001 0.654 <0.001 <0.001 <0.001 <0.001 0

IEEE TRANSACTIONS ON INSTRUMENTATION AND MEASUREMENT 7
MP 4–MP 7 (Fig. 8) were selected for throughput gain
comparison. The average throughput value for each NLOS
measurement point is found in Table V. We originally
presented in [25] the results of comparisons that will be
elaborated in this Section.
In the results, both the forward (Fw) and backward (Bw)
moving UE samples have been combined, because it was
found that there was no significant difference between the
samples. Fig. 9 shows the similarities between the forward
and backward sample results at the MP 6 point.
Measurements were conducted during the morning and
midday hours. The repeated measurements indicate that the
time had no effect on the results. During the testing period in
late summer and autumn, shown in Fig. 10, the measurements
indicate that a slight throughput increase could be found in
some MP results when the environmental foliage decreased
during late autumn. This effect is expected as many studies
have reported the decrease of the attenuation of trees without
foliage e.g. [11-13]. The most notable changes in the
measurement results can be found at MP 7; in early
September, the average throughput was 4.23 Mbit/s, and in
late September, the throughput was 5.57 Mbit/s. The
throughput increase was approximately 32%. The statistical
significance of the throughput increase was studied with
2-sample t –test. Since the measurement sample sizes were
around 100 samples per measurement we examined the -
0,30 Mbit/s difference with uncertainty level p of 0.10. The
results of tests are given in Table VI. Table VI reveals that
the throughput of the first measurement day of September 13
is statistically significantly lower than the throughput of any
Fig. 9. MP 6 measurements back and forth with H2 configuration.
Fig. 10. MP 7 MAC throughput increase during September with H2
configuration.
Fig. 8. Puuhkala eNB and MP 4 to MP 7 NLOS measurement points.
TABLE V.
THROUGHPUT IN MP 4 to MP 7
Location
Configuration
P2 P4 V4 H2
H2
steering
MP 4
(Mbit/s) 5.51 7.57 8.11 2.09 8.57
MP 5
(Mbit/s) 3.91 5.77 7.32 3.00 6.94
MP 6
(Mbit/s) 4.08 5.49 6.60 5.65
MP 7
(Mbit/s) 3.90 5.55 6.08 4.87
TABLE VI.
RESULTS OF 2-SAMPLE t TEST FOR THROUGHPUT (TP)
MEAN AT MP7
Hypothesis Significantly
true
Diffrence
(Mbit/s)
p
𝐶Sep 13 Fw < 𝐶Sep 14 Fw
Yes -0.42 < 0.001
𝐶Sep 13 Fw < 𝐶Sep 19 Fw
Yes -0,53 < 0.001
𝐶Sep 13 Fw < 𝐶Sep 19 Bw
Yes -0,48 < 0.001
𝐶Sep 13 Fw < 𝐶Sep 28 Fw
Yes -1,01 < 0.001
𝐶Sep 13 Fw < 𝐶Sep 28 Bw
Yes -1,34 < 0.001
𝐶Sep 14 Fw < 𝐶Sep 19 Fw
No -0,11 0.140
𝐶Sep 14 Fw < 𝐶Sep 19 Bw
No -0,06 0.282
𝐶Sep 14 Fw < 𝐶Sep 28 Fw
Yes -0,59 < 0.001
𝐶Sep 14 Fw < 𝐶Sep 28 Bw
Yes -0.92 < 0.001
𝐶Sep 19 Fw < 𝐶Sep 28 Fw
Yes -0,48 < 0.001
𝐶Sep 19 Fw < 𝐶Sep 28 Bw
Yes -0,81 < 0.001
𝐶Sep 19 Bw < 𝐶Sep 28 Fw
Yes -0,53 < 0.001
𝐶Sep 19 Bw < 𝐶Sep 28 Bw
Yes -0,86 < 0.001
TABLE IV. TWO-SAMPLE KOLMOGOROV-SMIRNOV TEST OF NINE
MOVING MEASUREMENTS (M1–M9) AT MP 6
MP 6:
V4
at 0.01
Aug-31 Sep-05 Sep-14 Sep-19 Sep-28
M1 M2 M3 M4 M5 M6 M7 M8 M9
M1 0 1 1 0 0 0 0 0 0
M2 0.005 0 1 1 0 1 0 0 0
M3 <0.001 <0.001 0 1 1 1 1 1 1
M4 0.023 0.002 <0.001 0 0 0 0 0 0
M5 0.035 0.878 <0.001 0.016 0 1 0 0 0
M6 0.020 <0.001 <0.001 0.404 <0.001 0 0 0 1
M7 0.174 0.068 <0.001 0.423 0.039 0.180 0 0 0
M8 0.023 0.483 <0.001 0.136 0.664 0.020 0.272 0 0
M9 0.050 0.505 <0.001 0.095 0.710 0.003 0.169 0.822 0

IEEE TRANSACTIONS ON INSTRUMENTATION AND MEASUREMENT 8
subsequent measurement days. Similarly, the throughput
values at September 28 are statistically significantly higher
than the throughput of any previous measurement days. There
is a slight increase in throughput on September 19 versus the
throughput on September 14 even though this increase is not
statistically significant. The found increase of throughput in
some MP results can be explained via the environmental
foliage decreased during late autumn. This effect is expected
as many studies have reported the decrease of the attenuation
of trees without foliage e.g. [14-16].
NLOS Comparison
By comparing the different measurement points handling
different antenna configurations in Table V, one can identify
which NLOS points achieved the best throughput values. All
throughput values in Table V are average values of the
results. When the beam was steered towards UE, MP 4 had
a -34° azimuth and MP 5 had a -17° azimuth angle. MP 6 and
MP 7 were virtually in the same direction as azimuth 0°;
therefore, the azimuth angle was not changed for the MP 6
and MP 7 locations. MP 4 had the best throughput
performance with the H2 steering configuration. The
throughput was 8.57 Mbit/s. MP 5, MP 6, and MP 7 reached
the best throughput performance with the V4 configuration.
The throughput for MP 5 was 7.32 Mbit/s, for MP 6 it was
6.60 Mbit/s, and for MP 7 it was 6.08 Mbit/s.
During the analysis phase, it was noticed that there was
no single configuration feature that would produce the best
throughput for all measurement points.
Throughput Gain Comparison
Throughput gain comparison was performed for points
MP 4 to M P7 by comparing different configurations used for
these points. In order to evaluate the improvement of the
performance the Throughput Gain (TG) for each antenna
configuration was calculated according to the following
formula:
𝑇𝐺[%] = 100 (𝐶1−𝐶2
𝐶2) (1)
Wherein 𝐶1 [Mbit/s] is the throughput of the first
configuration and 𝐶2 [Mbit/s] is the throughput of the second
configuration. The results are reported in Table VII. When
comparing the different configurations in Table VII with each
other, one can see which antenna configuration had the most
percentage throughput gain. Measurement gain values were
gathered by comparing the throughput data with each
measurement setup. At each selected measurement point, the
two-column passive configuration measurements were better
when comparing the values with the single-column passive
configuration. The throughput gain values varied in this
comparison from 35% to 48%, depending on the
measurement point. When comparing the single-column
AAS with the single-column passive configuration, the
measurements indicated that all single-column AAS
measurements had better throughput gain results. In this
situation, the throughput gain varied from 47% to 87%,
depending on the measurement point. When comparing the
single-column AAS with the two-column passive
configuration, the throughput gain results indicate that for
most measurement points, there were positive throughput
gain values, especially for MP 5 and MP 6. The throughput
gain varied from 7% to 27%, depending on the measurement
point. The throughput gain results are positive for
measurement points when comparing the four-column AAS
beam steering with the single-column passive configuration.
The throughput gain results varied in this comparison from
25% to 78%. In four-column AAS steering, the azimuth angle
for MP 4 was -34°, and for MP 5, it was -17°. For the four-
column AAS steering and the two-column passive throughput
gain comparison, the results were mostly positive; only MP 7
produced negative throughput gain. The throughput gain
results varied in this comparison from -12% to 20%. When
comparing the four-column AAS steering with the single-
column AAS configuration, positive throughput gain results
were measured from MP 4, and the rest of the measurement
points produced negative throughput gain results. The results
varied in this comparison from -20% to 6%.
VIII. DISCUSSION AND CONCLUSION
This article describes the test method development for
dynamic cellular network and uplink throughput gain
evaluation in field trials. The field trial described in this
article evaluated uplink throughput gain in a non-line-of-sight
environment while using passive, 2-way and 4-way RX
diversity in horizontal and vertical beamforming in a
suburban/rural area of Ylivieska, Finland. The study, with
statistical analyses, clearly revealed that measurements in a
challenging radio propagation environment with moving UE
produced more reliable and repeatable results than
measurements with stationary located UE. From the
throughput gain results, it was concluded that there is no
single configuration feature that will provide the best
throughput for all measurement points. The vertical AAS was
shown to deliver a throughput gain up to 87.21% in the uplink
direction, while the horizontal beam steering was shown to
deliver a throughput gain up to 77.49% in the uplink
direction. The best configuration for MP 4 was the four-
column AAS steering, but the single-column AAS was almost
as good as four-column AAS steering. In MP 5, MP 6, and
MP 7, the AAS configuration with single-column 4-way RX
diversity produced the best measurement results. The UE-
specific beamforming feature can have effects on signaling
and additional information exchanges, for example, when the
eNB must estimate the location of the UE or the UE must
inform which beams are best for transmission. However, in
this beam steering measurement setup, there was no need for
any additional signaling or information exchange, because
the UE was in static locations, and the UL beam was steered
manually towards the selected measurement points. The use
of different elevation beams with the RX diversity feature
TABLE VII.
PERCENTAGE GAIN VALUES
Compared
configurations
Gain[%] measurements
Min Max Avg. St. Dev.
P4 vs P2 34.56% 47.57% 40.46% 5.72%
V4 vs P2 47.19% 87.21% 63.02% 17.21%
H2 steering vs P2 24.87% 77.49% 49.10% 22.71%
V4 vs P4 7.13% 26.86% 15.94% 9.24%
H2 steering vs P4 -12.25% 20.28% 6.04% 14.12%
H2 steering vs V4 -19.90% 5.67% -8.45% 11.20%
IEEE TRANSACTIONS ON INSTRUMENTATION AND MEASUREMENT 9
made it possible to achieve useful gain signals for selected
measurement points. This combination can also utilize
separate MIMO streams in the future. This study produced
promising results for network performance improvements
when vertical and horizontal beamforming are used in a
challenging non-line-of-sight environment. The vertical AAS
produced the most promising values, at least in these tests and
in this test environment setup. Horizontal beamforming is
useful when the beam is steered towards the user. While this
study concentrated on evaluating uplink throughput gain in a
challenging non-line-of-sight environment, previous study
results [23] indicate that AAS with vertical sectorization can
offer an 84.6% gain in downlink throughput. The research
results that have been produced thus far indicate that different
NLOS locations have different multipath profiles in
horizontal and vertical dimensions. Parallel placement of two
antennas at the Puuhkala site might have slightly affected the
measurements done on the sector borders, which is why a
wider study is to be conducted for future 5G test
measurements.
Changes in next-generation mobile networks have created
a need to further develop field test methods, particularly to
evaluate the performance of future dynamic mobile networks.
The potential of unmanned aircraft systems will be
researched in future trials to meet the challenges of testing
mobile networks with 3D beamforming of AAS.
ACKNOWLEDGMENT
This work has been performed in the framework of the
CORE++ project. The authors would like to acknowledge
CORE++ and IMAGE 5G research consortiums that consists
of VTT Technical Research Center of Finland, University of
Oulu, Centria University of Applied Sciences, Nokia, Turku
University of Applied Sciences, PehuTec, Bittium, Keysight,
Fairspectrum, The Finnish Defence Forces, Finnish
Communication Regulatory Authority, Tekes – Finnish
Funding Agency for Innovation, Pohjonen Group, Finnish
Meteorological Institute and Siipotec Oy. The authors wish
to thank the Editor and anonymous reviewers for their
valuable comments and suggestions.
REFERENCES
[1] Y. Qi, G. Yang, L. Liu, J. Fan, A. Orlandi, H. Kong, W. Yu and Z.
Yang, '"5G Over-the-Air Measurement Challenges: Overview," IEEE
Trans.Electromagn.Compat., vol. 59, no. 6, pp. 1661-1670, 2017. [2] M. Rumney, P. Cain, T. Barratt, A. L. Freire, W. Yuan, E. Mellios and
M. Beach, '"Testing 5G: evolution or revolution?" Radio Propagation
and Technologies for 5G (2016), pp. 1-9. [3] M.S. Miah, D. Anin, A. Khatun, K. Haneda, L. Hentila and E.T.
Salonen, '"On the Field Emulation Techniques in Over-the-Air
Testing: Experimental Throughput Comparison," IEEE Antennas Wirel.Propag.Lett., vol. 16, pp. 2224-2227, 2017.
[4] M. A. Salas-Natera, R. M. Rodríguez-Osorio and L. De Haro,
"Procedure for measurement, characterization, and calibration of active antenna arrays," IEEE Trans. Instrum. Meas., vol. 62, (2), pp.
377-391, 2013.
[5] Nokia Active Antenna Systems: A step-change in base station site performance, White paper. (2014). [online] Available:
http://resources.alcatel-lucent.com/asset/200016.
[6] M. Heikkilä, J. Erkkilä, M. Koskela, J. Heikkilä, T. Kupiainen, J. Tervonen and M. Migliore, "Development of the measurement
method for challenging NLOS conditions in mobile networks," in
Proceedings of the 4th IEEE International Workshop on Measurements and Networking Proceedings (M&N), Naples, Italy,
2017, pp.1-6.
[7] J. T. J. Penttinen, "Planning of the LTE-advanced radio network," in The LTE-Advanced Deployment Handbook: The Planning Guidelines
for the Fourth Generation Networks, J. T. J. Penttinen, Ed. ohn Wiley
& Sons, Ltd., January 2016, pp. 257-292. [8] M. D. Migliore, "On electromagnetics and information theory," IEEE
Trans Antennas Propag, vol. 56, (10), pp. 3188-3200, 2008.
[9] J. B. Andersen, "Antenna arrays in mobile communications: Gain, diversity, and channel capacity," IEEE Antennas Propag. Mag., vol.
42, (2), pp. 12-16, 2000.
[10] Y. Inoue, K. Saito, T. Kawamura and H. Andoh, "Field experiments on antenna configuration associated with fading correlation for
downlink multi-user MIMO in LTE-advanced," in 2013 IEEE 77th
Vehicular Technology Conference, VTC Spring 2013, Dresden, 2013. [11] K. Nishimori, Y. Makise, M. Ida, R. Kudo and K. Tsunekawa,
"Channel Capacity Measurement of 8 x 2 MIMO Transmission by
Antenna Configurations in an Actual Cellular Environment," IEEE Trans Antennas Propag, vol. 54, (11), pp. 3285, 2006.
[12] Effects of building materials and structures on radiowave propagation
above about 100 MHz, ITU-R P. 2040-1, 07/2015. [13] R. Rudd, K. Craig, M. Ganley and R. Hartless, "Building materials
and propagation final report, ofcom". [14] D. O. Reudink and M. F. Wazowicz, "Some Propagation Experiments
Relating Foliage Loss And Diffraction Loss at X-Band and UHF
Frequencies," IEEE Trans. Commun., vol. 21, (11), pp. 1198-1206,
1973. [15] N. Savage, D. Ndzi, A. Seville, E. Vilar and J. Austin, "Radio wave
propagation through vegetation: Factors influencing signal attenuation," Radio Sci., vol. 38, (5), 2003.
[16] Attenuation in vegetation, ITU-R P. 833-9, 09/2016.
[17] Propagation data and prediction methods required for the design of terrestrial line-of-sight systems, ITU-R P. 530-16, 07/2015.
[18] T. Oguchi, "Electromagnetic Wave Propagation and Scattering in
Rain and Other Hydrometeors," Proc IEEE, vol. 71, (9), pp. 1029-1078, 1983.
[19] J. A. Morrison, M. J. Cross and T. S. Chu, "Rain-Induced Differential
Attenuation and Differential Phase Shift at Microwave Frequencies," Bell Syst. Tech. J., vol. 52, (4), pp. 599-604, 1973.
[20] Rep. 721-2 attenuation by hydrometeors, in particular precipitation,
and other atmospheric particles, vol V., CCIR, XVII Plenary
Assembly, Dussendorf, 1990.
[21] The CORE++ project. (2017) [Online] Available:
http://core.willab.fi/. [22] M. Matinmikko, M. Palola, H. Saarnisaari, M. Heikkila, J. Prokkola,
T. Kippola, T. Hanninen, M. Jokinen and S. Yrjola, "Cognitive radio
trial environment: First live authorized shared access-based spectrum-sharing demonstration," IEEE Veh. Technol. Mag., vol. 8, (3), pp. 30-
37, 2013.
[23] M. Heikkilä, T. Kippola, P. Kärsamä, A. Nykanen, P. Tuuttila and M. Matinmikko, '"Active antenna system (AAS) capabilities for 5G
systems: A field study of performance," Proc. Int. Conf. 5G
Ubiquitous Connect., 2014, pp. 181-186. [24] M. Heikkilä, T. Kippola, J. Jämsä, A. Nykänen, M. Matinmikko and
J. Keskimaula, "Active antenna system for cognitive network
enhancement," in Proc. 5th IEEE International Conference on Cognitive Infocommunications, CogInfoCom, 2014, pp. 19-24.
[25] J. Erkkilä, M. Koskela, J. Heikkilä, T. Kupiainen, M. Heikkilä,
T.Kippola, A. Nykänen and R. Saukkonen, "Antenna configuration
comparison in challenging NLOS locations," in 2017 European
Conference on Networks and Communications (EuCNC), 2017, pp.1-
5. [26] Keysight Technologies Inc., "Nemo Outdoor Drive Test Solution,"
[Online]. Available: https://www.keysight.com/en/pd-2765544-pn-
NTA00000A/nemo-outdoor?cc=FI&lc=fin). [27] Huawei E392 LTE USB Stick, Datasheet, Huawei, 2011.
[28] 2J s.r.o. “2J300M (datasheet)” (2017). [Online]. Available:
http://www.2j-antennae.com/images/products/2J300M.pdf. [29] S. Avallone, N. Pasquino, S. Zinno and D. Casillo, "Smartphone-
based measurements of LTE network performance," Proc. IEEE Int.
Instrum. Meas. Technol. Conf. - I2MTC, 2017, pp. 1-6.
Marjo Heikkilä is a research and
development manager at the Centria
University of Applied Sciences. She
holds an M. Sc. degree in information
technology. She has 20 years of
experience in various research and
development projects developing

IEEE TRANSACTIONS ON INSTRUMENTATION AND MEASUREMENT 10
wireless communication systems and applications. She is a
member of the IEEE.
Juha Erkkilä is a Project Engineer at the
Centria University of Applied Sciences.
He holds a B. Eng. degree in information
technology. He has versatile expertise in
software development and networking.
His main research focuses are mobile
networks, IoT and drones.
Jouni K. Tervonen received the M. Sc.
(Tech) and D. Sc. (Tech) degrees in
electrical engineering from the Helsinki
University of Technology, Espoo,
Finland, in 1992 and 1997, respectively.
Previously, he has worked as researcher
at the Helsinki University of Technology
and senior specialist within Nokia
Networks. Between 2004 and 2018, he worked at the Kerttu
Saalasti Institute, the University of Oulu. His current research
interests are industry-driven solutions utilizing Internet-of-
Things, including data fusion, the data analysis of sensor data,
and wireless sensor and actuator networks. He is a member of
the IEEE.
Marjut Koskela is R&D Specialist at
the Centria University of Applied
Sciences. She holds a B. Eng. degree in
information technology. She is a project
manager of the IMAGE 5G project that,
for example, develops new kinds of 3D
measurement methods for mobile
networks.
Joni Heikkilä is a Project Engineer at
the Centria University of Applied
Sciences. He holds a B. Eng. degree in
information technology. His main
research focuses are embedded systems
and mobile networking and analyzing.
Tuomo Kupiainen is a Project Engineer
at the Centria University of Applied
Sciences. He holds a B. Eng. degree in
information technology. He has versatile
experience in test specification planning,
documentation, and work with mobile
networks.
Tero Kippola is an R&D Specialist in
the Centria Research and Development
Laboratory at the Centria University of
Applied Sciences. He has a B. Eng.
degree in information technology. One
of his research focuses is in the areas of
active antenna systems and shared
spectrum access development, in
particular LTE base station, active
antenna and core network functionalities and parameters, and
mobile communication network planning and
parametrization.
Asko Nykänen works as a R&D
specialist at Nokia. He holds M. Sc.
degree in telecommunications
technology. He has over 20 years of
experience from various research and
development projects on wireless
communication systems and
applications.
Risto Saukkonen received the M. Sc.
degree in electrical engineering from the
University of Oulu, Finland, in 1986. He
is a program manager at Nokia, Mobile
Networks architecture and technology
development. He has 30 years’
experience of product and technology
development projects for mobile
communications.
Marco Donald Migliore received the
Laurea (Hons) and Ph. D. degrees in
electronic engineering from the
University of Naples, Naples, Italy. He is
currently an Associate Professor with the
University of Cassino and Southern
Lazio, Cassino, Italy. His main scientific
interests currently include the
connection between electromagnetism
and information theory, the analysis, synthesis, and
characterization of antennas in complex environments,
multiple-input multiple-output antennas and propagation, ad
hoc wireless networks, antenna measurements, and energetic
applications of microwaves. Dr. Migliore is a member of the
IEEE, the Italian Electromagnetic Society (SIEM), the
National Interuniversity Consortium for Telecommunication
(CNIT), and the ELEDIA@UniCAS research laboratory.
He serves as a referee for many scientific journals,
including the IEEE Transactions on Antennas and
Propagation, the IEEE Antennas and Wireless Propagation
Letters, the IEEE Transactions on Vehicular Technology, the
Journal of Optical Society of America, the IEEE Transactions
on Signal Processing, and the IEEE Transactions on
Information Theory. He has served as an Associate Editor for
the IEEE Transactions on Antennas and Propagation. He is
currently the Director of the Microwave Laboratory in
Cassino and Director of studies of the ITC courses of the
University of Cassino and Southern Lazio.