NORTH SEA STUDY OCCASIONAL PAPER
No. 136
Field Development Tax Incentives
for the UK Continental Shelf (UKCS)
Professor Alexander G. Kemp
and
Linda Stephen
March, 2016
Aberdeen Centre for Research in Energy Economics and
Finance (ACREEF) © A.G. Kemp and Linda Stephen
ii
ISSN 0143-022X
NORTH SEA ECONOMICS
Research in North Sea Economics has been conducted in the Economics Department
since 1973. The present and likely future effects of oil and gas developments on the
Scottish economy formed the subject of a long term study undertaken for the Scottish
Office. The final report of this study, The Economic Impact of North Sea Oil on
Scotland, was published by HMSO in 1978. In more recent years further work has
been done on the impact of oil on local economies and on the barriers to entry and
characteristics of the supply companies in the offshore oil industry.
The second and longer lasting theme of research has been an analysis of licensing and
fiscal regimes applied to petroleum exploitation. Work in this field was initially
financed by a major firm of accountants, by British Petroleum, and subsequently by
the Shell Grants Committee. Much of this work has involved analysis of fiscal
systems in other oil producing countries including Australia, Canada, the United
States, Indonesia, Egypt, Nigeria and Malaysia. Because of the continuing interest in
the UK fiscal system many papers have been produced on the effects of this regime.
From 1985 to 1987 the Economic and Social Science Research Council financed
research on the relationship between oil companies and Governments in the UK,
Norway, Denmark and The Netherlands. A main part of this work involved the
construction of Monte Carlo simulation models which have been employed to
measure the extents to which fiscal systems share in exploration and development
risks.
Over the last few years the research has examined the many evolving economic issues
generally relating to petroleum investment and related fiscal and regulatory matters.
Subjects researched include the economics of incremental investments in mature oil
fields, economic aspects of the CRINE initiative, economics of gas developments and
contracts in the new market situation, economic and tax aspects of tariffing,
economics of infrastructure cost sharing, the effects of comparative petroleum fiscal
systems on incentives to develop fields and undertake new exploration, the oil price
responsiveness of the UK petroleum tax system, and the economics of
decommissioning, mothballing and re-use of facilities. This work has been financed
by a group of oil companies and Scottish Enterprise, Energy. The work on CO2
Capture, EOR and storage was financed by a grant from the Natural Environmental
Research Council (NERC) in the period 2005 – 2008.
For 2016 the programme examines the following subjects:
a. Decommissioning Tax Relief
b. Further Research on Economics of EOR with Emphasis on Tax
c. Collaborative Agreements among Licensees: Cluster Developments
d. Collaborative Agreements among Licensees and Contractors
e. Facilitation of Decommissioning Cost Reductions including by Collaboration
f. Prospects for Activity in the UKCS to 2050

iii
The authors are solely responsible for the work undertaken and views expressed. The
sponsors are not committed to any of the opinions emanating from the studies.
Papers are available from:
The Secretary (NSO Papers)
University of Aberdeen Business School
Edward Wright Building
Dunbar Street
Aberdeen A24 3QY
Tel No: (01224) 273427
Fax No: (01224) 272181
Email: [email protected]
Recent papers published are:
OP 98 Prospects for Activity Levels in the UKCS to 2030: the 2005
Perspective
By A G Kemp and Linda Stephen (May 2005), pp. 52
£20.00
OP 99 A Longitudinal Study of Fallow Dynamics in the UKCS
By A G Kemp and Sola Kasim, (September 2005), pp. 42
£20.00
OP 100 Options for Exploiting Gas from West of Scotland
By A G Kemp and Linda Stephen, (December 2005), pp. 70
£20.00
OP 101 Prospects for Activity Levels in the UKCS to 2035 after the
2006 Budget
By A G Kemp and Linda Stephen, (April 2006) pp. 61
£30.00
OP 102 Developing a Supply Curve for CO2 Capture, Sequestration and
EOR in the UKCS: an Optimised Least-Cost Analytical
Framework
By A G Kemp and Sola Kasim, (May 2006) pp. 39
£20.00
OP 103 Financial Liability for Decommissioning in the UKCS: the
Comparative Effects of LOCs, Surety Bonds and Trust Funds
By A G Kemp and Linda Stephen, (October 2006) pp. 150
£25.00
OP 104 Prospects for UK Oil and Gas Import Dependence
By A G Kemp and Linda Stephen, (November 2006) pp. 38
£25.00
OP 105 Long-term Option Contracts for CO2 Emissions
By A G Kemp and J Swierzbinski, (April 2007) pp. 24
£25.00
OP 106 The Prospects for Activity in the UKCS to 2035: the 2007
Perspective
By A G Kemp and Linda Stephen (July 2007) pp.56
£25.00

iv
OP 107 A Least-cost Optimisation Model for CO2 capture
By A G Kemp and Sola Kasim (August 2007) pp.65
£25.00
OP 108 The Long Term Structure of the Taxation System for the UK
Continental Shelf
By A G Kemp and Linda Stephen (October 2007) pp.116
£25.00
OP 109 The Prospects for Activity in the UKCS to 2035: the 2008
Perspective
By A G Kemp and Linda Stephen (October 2008) pp.67
£25.00
OP 110 The Economics of PRT Redetermination for Incremental
Projects in the UKCS
By A G Kemp and Linda Stephen (November 2008) pp. 56
£25.00
OP 111 Incentivising Investment in the UKCS: a Response to
Supporting Investment: a Consultation on the North Sea Fiscal
Regime
By A G Kemp and Linda Stephen (February 2009) pp.93
£25.00
OP 112 A Futuristic Least-cost Optimisation Model of CO2
Transportation and Storage in the UK/ UK Continental Shelf
By A G Kemp and Sola Kasim (March 2009) pp.53
£25.00
OP 113 The Budget 2009 Tax Proposals and Activity in the UK
Continental Shelf (UKCS)
By A G Kemp and Linda Stephen (June 2009) pp. 48
£25.00
OP 114 The Prospects for Activity in the UK Continental Shelf to 2040:
the 2009 Perspective
By A G Kemp and Linda Stephen (October 2009) pp. 48
£25.00
OP 115 The Effects of the European Emissions Trading Scheme (EU
ETS) on Activity in the UK Continental Shelf (UKCS) and CO2
Leakage
By A G Kemp and Linda Stephen (April 2010) pp. 117
£25.00
OP 116 Economic Principles and Determination of Infrastructure Third
Party Tariffs in the UK Continental Shelf (UKCS)
By A G Kemp and Euan Phimister (July 2010) pp. 26
OP 117 Taxation and Total Government Take from the UK Continental
Shelf (UKCS) Following Phase 3 of the European Emissions
Trading Scheme (EU ETS)
By A G Kemp and Linda Stephen (August 2010) pp. 168
OP 118 An Optimised Illustrative Investment Model of the Economics
of Integrated Returns from CCS Deployment in the UK/UKCS
BY A G Kemp and Sola Kasim (December 2010) pp. 67

v
OP 119 The Long Term Prospects for Activity in the UK Continental
Shelf
BY A G Kemp and Linda Stephen (December 2010) pp. 48
OP 120 The Effects of Budget 2011 on Activity in the UK Continental
Shelf
BY A G Kemp and Linda Stephen (April 2011) pp. 50
OP 121 The Short and Long Term Prospects for Activity in the UK
Continental Shelf: the 2011 Perspective
BY A G Kemp and Linda Stephen (August 2011) pp. 61
OP 122 Prospective Decommissioning Activity and Infrastructure
Availability in the UKCS
BY A G Kemp and Linda Stephen (October 2011) pp. 80
OP 123 The Economics of CO2-EOR Cluster Developments in the UK
Central North Sea/ Outer Moray Firth
BY A G Kemp and Sola Kasim (January 2012) pp. 64
OP 124 A Comparative Study of Tax Reliefs for New Developments in
the UK Continental Shelf after Budget 2012
BY A G Kemp and Linda Stephen (July 2012) pp.108
OP 125 Prospects for Activity in the UK Continental Shelf after Recent
Tax Changes: the 2012 Perspective
BY A G Kemp and Linda Stephen (October 2012) pp.82
OP 126 An Optimised Investment Model of the Economics of Integrated
Returns from CCS Deployment in the UK/UKCS
BY A G Kemp and Sola Kasim (May 2013) pp.33
OP 127 The Full Cycle Returns to Exploration in the UK Continental
Shelf
BY A G Kemp and Linda Stephen (July 2013) pp.86
OP 128 Petroleum Taxation for the Maturing UK Continental Shelf
(UKCS)
BY A G Kemp, Linda Stephen and Sola Kasim (October 2014)
pp.94
OP 129 The Economics of Enhanced Oil Recovery (EOR) in the UKCS
and the Tax Review
BY A G Kemp and Linda Stephen (November 2014) pp.47
OP 130 Price Sensitivity, Capital Rationing and Future Activity in the
UK Continental Shelf after the Wood Review
BY A G Kemp and Linda Stephen (November 2014) pp.41
vi
OP 131 Tax Incentives for CO2-EOR in the UK Continental Shelf
BY A G Kemp and Sola Kasim (December 2014) pp. 49
OP
132
The Investment Allowance in the Wider Context of the UK
Continental Shelf in 2015: A Response to the Treasury
Consultation
BY A G Kemp and Linda Stephen (February 2015) pp. 27
OP 133 The Economics of Exploration in the UK Continental Shelf: the
2015 Perspective
BY A G Kemp and Linda Stephen (August 2015) pp. 71
OP 134 Prospective Returns to Exploration in the UKCS with Cost
Reductions and Tax Incentives
BY A G Kemp and Linda Stephen (December 2015) pp.81
OP 135 Maximising Economic Recovery from the UK Continental
Shelf: A Response to the Draft DECC Consultation Strategy
BY A G Kemp (January 2016) pp. 16
OP 136 Field Development Tax Incentives for the UK Continental Shelf
(UKCS)
BY A G Kemp and Linda Stephen (March 2016) pp.66
vii
Field Development Tax Incentives
for the UK Continental Shelf (UKCS)
Professor Alexander G. Kemp and Linda Stephen
Contents Page
1. Introduction………………………………………..……………1
2. Methodology and Data…………………………………………2
3. R e s u l t s … … … … … … … … … … … … . . … … … … … … … 5
(a) Pre-Tax Returns………………………………………………..5
(b) Post-Tax Returns……………………………………………….7
(i) CNS – Oil ……………………………………………….7
(ii) CNS – Gas …………………………………………….30
(iii) W of S – Oil …….……………………………………..40
(iv) W of S – Gas …………………………………………..48
(v) NNS – Oil ……………………………………………..48
(vi) NNS – Gas …………………………………………….56
(vii) SNS – Gas ……………………………………………..58
4. Conclusions……………………………………………………62
1
Field Development Tax Incentives
for the UK Continental Shelf (UKCS)
Professor Alex Kemp and Linda Stephen
Aberdeen Centre for Research in Energy Economics and Finance (ACREEF)
1. Introduction
The persistent collapse in the oil price has led to a major decline in
exploration and new project investment in the UKCS. The aggregate net
cash flows of the industry have been negative for some time. A
significant number of producing fields are experiencing losses. The ONS
has calculated that the pre-tax return on aggregate investment has fallen
to 3.2% in the third quarter of 2015. Cost reductions have been
implemented which have resulted in many thousands of job losses. Many
prospective investment projects have been put on hold or even cancelled.
The present majority view is that the current low levels of oil and gas
prices could well persist for some months and perhaps for much longer.
This is the sombre context in which Budget 2016 should be seen as far as
the UKCS is concerned. Of course, in Budget 2015 significant tax
reductions were introduced, namely (1) a reduction in the rate of
Petroleum Revenue Tax (PRT), levied on fields with development
approval prior to 16th March 1993, from 50% to 35%, (2) a reduction in
the rate of Supplementary Charge (SC) from 32% to 20%, and (3) the
introduction of an investment allowance (IA) for SC at the rate of 62.5%.
The total headline rates are now 67.5% on PRT-paying fields and 50% on
other fields. But circumstances have changed markedly since Budget
2015 with further falls in both oil and gas prices. Investment in
exploration and development has clearly stalled further. It is thus

2
appropriate to examine the question of whether further tax incentives
could enhance new field activity levels. Accordingly the modelling work
in this study concentrates on fields which are not subject to PRT.
2. Methodology and Data
The study has been undertaken with the employment of financial
simulation models incorporating the tax system currently applicable to
new field developments, plus several modifications to it. The specific
variations from the present tax system are as follows:
1. Investment Allowance (IA) for Supplementary Charge allowed to
be activated against a different project’s income giving earlier effective
relief
2. Interest on IA at the RFES rate to be allowed from the time when
the IA can be activated but cannot be used because of insufficient income
to absorb the allowance
3. Reductions in headline rate of SC with CT unchanged
4. Reductions in headline rate of CT with SC unchanged
5. Combinations of the above, particularly reductions in CT and SC
rates
The modelling has been undertaken separately for investors in two
different tax positions. The first is where he is currently in a tax-paying
position and can claim relief for his investment costs against income from
other fields. This situation is termed “ongoing investor” for short. The
second is where he is not in a tax-paying position at the time of the
investment. This situation is termed “project investor” for short. In this
case the investor makes use of the Ring Fence Expenditure Supplement
(RFES).
3
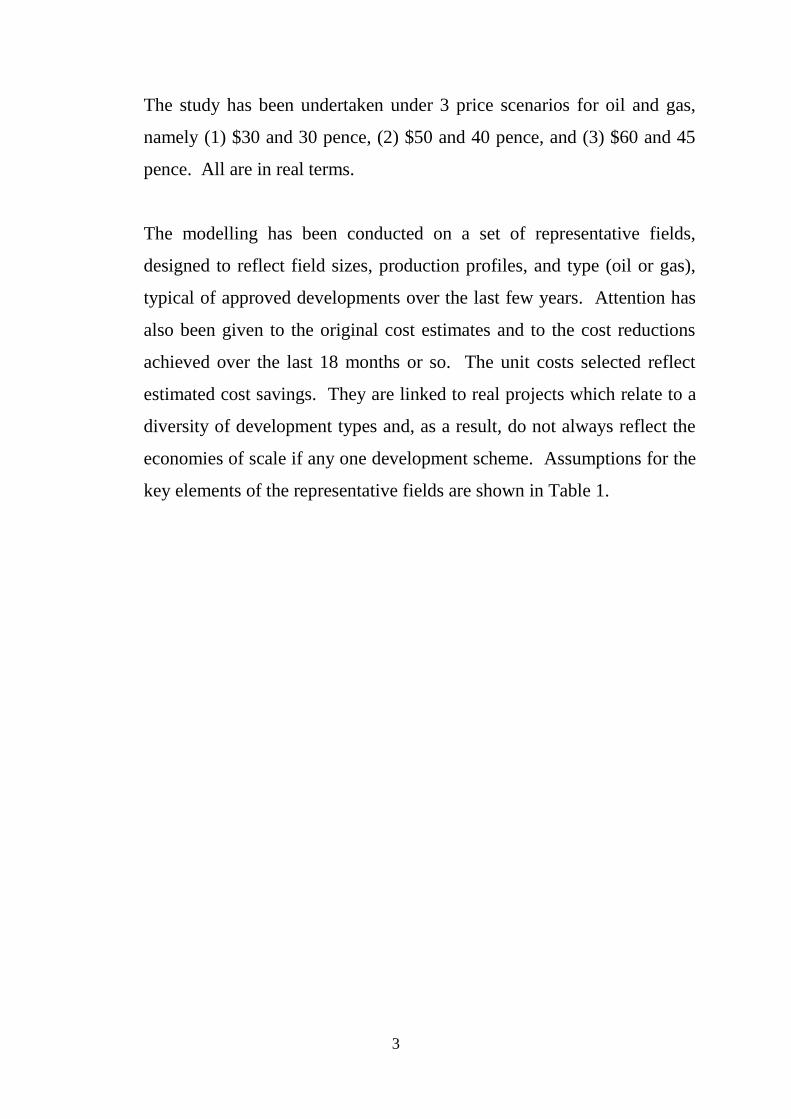
The study has been undertaken under 3 price scenarios for oil and gas,
namely (1) $30 and 30 pence, (2) $50 and 40 pence, and (3) $60 and 45
pence. All are in real terms.
The modelling has been conducted on a set of representative fields,
designed to reflect field sizes, production profiles, and type (oil or gas),
typical of approved developments over the last few years. Attention has
also been given to the original cost estimates and to the cost reductions
achieved over the last 18 months or so. The unit costs selected reflect
estimated cost savings. They are linked to real projects which relate to a
diversity of development types and, as a result, do not always reflect the
economies of scale if any one development scheme. Assumptions for the
key elements of the representative fields are shown in Table 1.
4
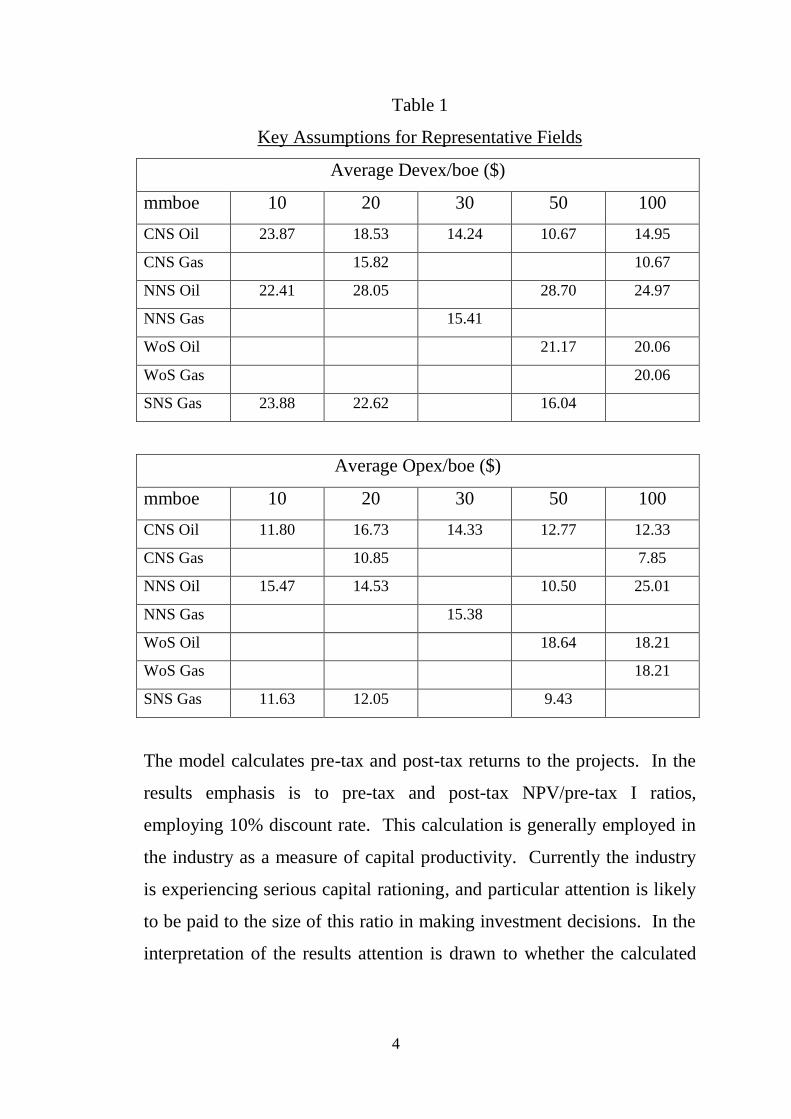
Table 1
Key Assumptions for Representative Fields
Average Devex/boe ($)
mmboe 10 20 30 50 100
CNS Oil 23.87 18.53 14.24 10.67 14.95
CNS Gas 15.82 10.67
NNS Oil 22.41 28.05 28.70 24.97
NNS Gas 15.41
WoS Oil 21.17 20.06
WoS Gas 20.06
SNS Gas 23.88 22.62 16.04
Average Opex/boe ($)
mmboe 10 20 30 50 100
CNS Oil 11.80 16.73 14.33 12.77 12.33
CNS Gas 10.85 7.85
NNS Oil 15.47 14.53 10.50 25.01
NNS Gas 15.38
WoS Oil 18.64 18.21
WoS Gas 18.21
SNS Gas 11.63 12.05 9.43
The model calculates pre-tax and post-tax returns to the projects. In the
results emphasis is to pre-tax and post-tax NPV/pre-tax I ratios,
employing 10% discount rate. This calculation is generally employed in
the industry as a measure of capital productivity. Currently the industry
is experiencing serious capital rationing, and particular attention is likely
to be paid to the size of this ratio in making investment decisions. In the
interpretation of the results attention is drawn to whether the calculated
5
NPV/I ratio exceeds or is less than 0.3 which could be a hurdle rate in the
industry.
3. Results
(a) Pre-Tax Returns
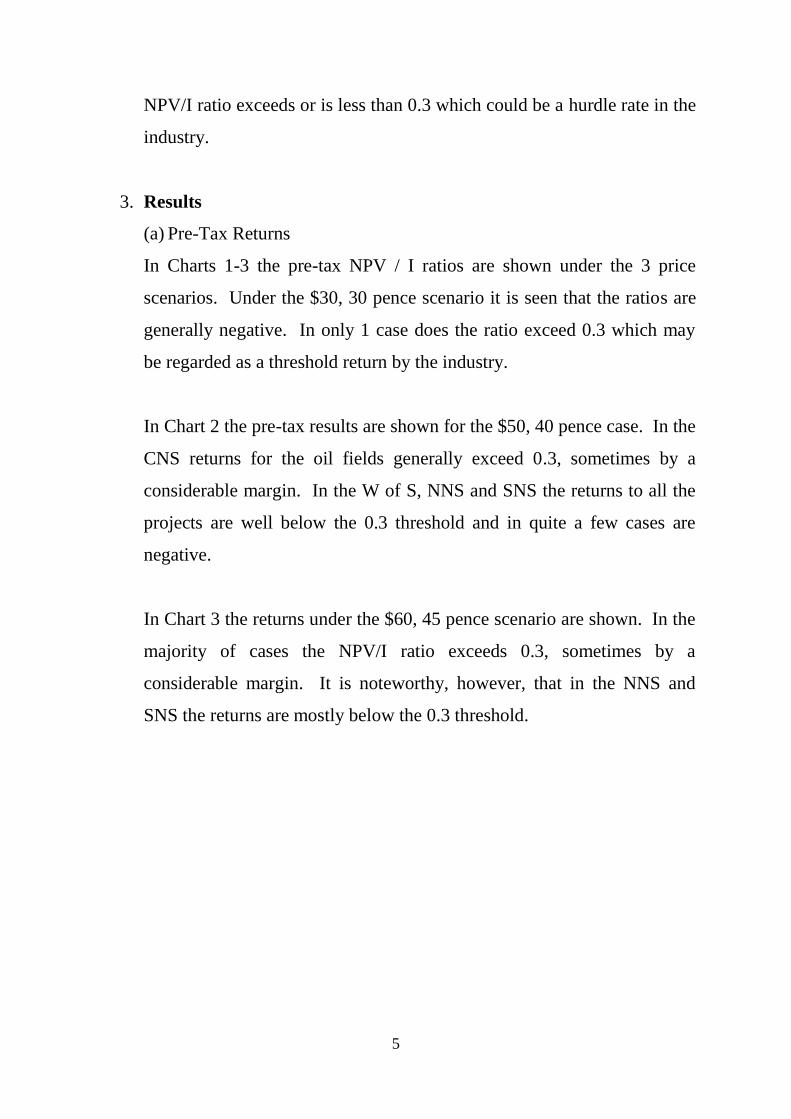
In Charts 1-3 the pre-tax NPV / I ratios are shown under the 3 price
scenarios. Under the $30, 30 pence scenario it is seen that the ratios are
generally negative. In only 1 case does the ratio exceed 0.3 which may
be regarded as a threshold return by the industry.
In Chart 2 the pre-tax results are shown for the $50, 40 pence case. In the
CNS returns for the oil fields generally exceed 0.3, sometimes by a
considerable margin. In the W of S, NNS and SNS the returns to all the
projects are well below the 0.3 threshold and in quite a few cases are
negative.
In Chart 3 the returns under the $60, 45 pence scenario are shown. In the
majority of cases the NPV/I ratio exceeds 0.3, sometimes by a
considerable margin. It is noteworthy, however, that in the NNS and
SNS the returns are mostly below the 0.3 threshold.
6
Chart 1
Chart 2
-0.8
-0.6
-0.4
-0.2
0
0.2
0.4
10 OilCNS
20 OilCNS
30 OilCNS
50 OilCNS
100Oil
CNS
20 GasCNS
100GasCNS
50 OilWoS
100Oil
WoS
100GasWoS
10 OilNNS
20 OilNNS
50 OilNNS
100Oil
NNS
30 GasNNS
10 GasSNS
20 GasSNS
50 GasSNS
%
Real Pre-tax NPV @ 10% / Real Devex @ 10% Oil Price $30/bbl Gas Price 30p/therm
Real Pre-tax @ 10%/ Real Devex @ 10%
-0.6
-0.4
-0.2
0
0.2
0.4
0.6
0.8
1
1.2
1.4
1.6
1.8
10 OilCNS
20 OilCNS
30 OilCNS
50 OilCNS
100Oil
CNS
20 GasCNS
100GasCNS
50 OilWoS
100Oil
WoS
100GasWoS
10 OilNNS
20 OilNNS
50 OilNNS
100Oil
NNS
30 GasNNS
10 GasSNS
20 GasSNS
50 GasSNS
%
Real Pre-tax NPV @ 10% / Real Devex @ 10% Oil Price $50/bbl Gas Price 40p/therm
Real Pre-tax @ 10%/ Real Devex @ 10%

7
Chart 3
(b) Post-Tax Returns
(i) CNS – Oil
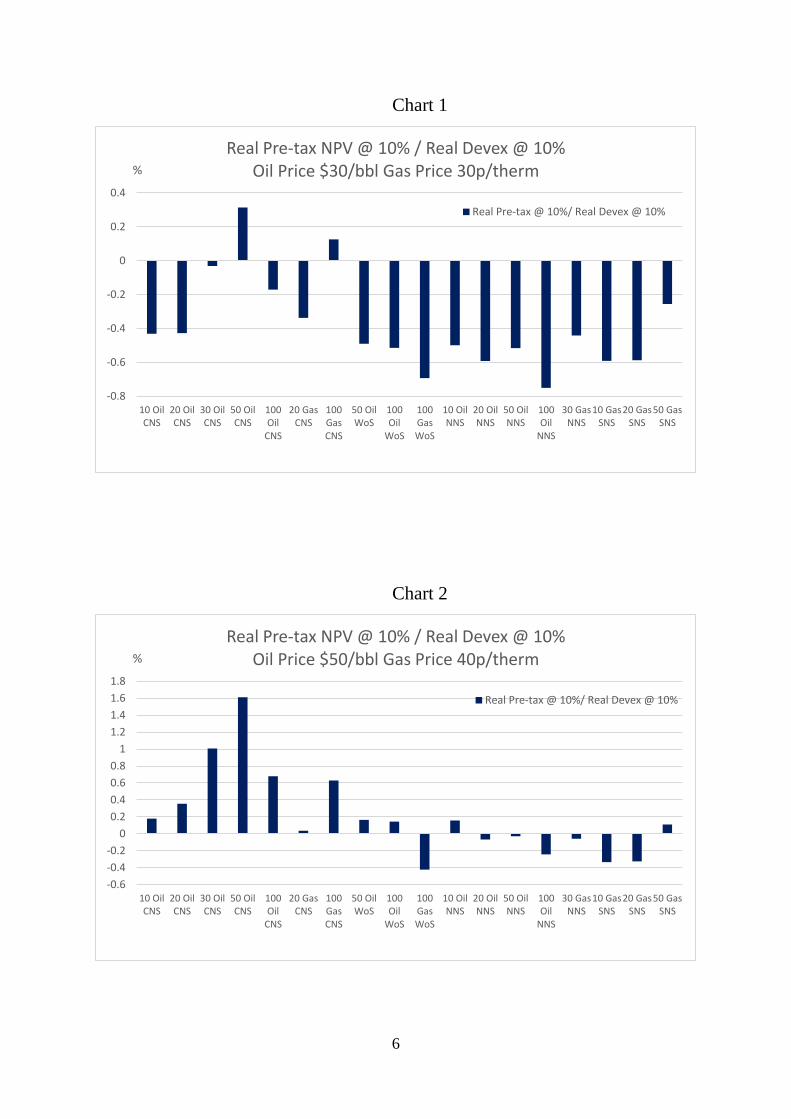
In Chart 4 the post-tax returns to the 10 mmbbls oil fields in the
CNS are shown under the $50, 40 pence scenario under a
variety of tax rates of CT and SC with the existing allowances.
In no case does the NPV/I ratio approach 0.3 but, as the pre-tax
value, is also under 0.3 this is to be expected. Under the present
tax system the ratio is below 0.2 for the ongoing investor and
0.11 for the project investor. The difference between the pre-
tax and post-tax ratios is substantial for most tax combinations
except the case of 0% SC. A noteworthy feature of the results
is that, for a given combination of CT and SC rates, the returns
to the investor are higher with a lower CT rate compared to the
SC rate. This follows because the value of the investment
allowance (IA) for the SC is reduced the lower the SC rate.
With SC = 20% the value of the IA in terms of tax saved is
-0.5
0
0.5
1
1.5
2
2.5
10 OilCNS
20 OilCNS
30 OilCNS
50 OilCNS
100Oil
CNS
20 GasCNS
100GasCNS
50 OilWoS
100Oil
WoS
100GasWoS
10 OilNNS
20 OilNNS
50 OilNNS
100Oil
NNS
30 GasNNS
10 GasSNS
20 GasSNS
50 GasSNS
%
Real Pre-tax NPV @ 10% / Real Devex @ 10% Oil Price $60/bbl Gas Price 45p/therm
Real Pre-tax @ 10%/ Real Devex @ 10%
8
12.5% of the investment. If SC were 10% the value of the IA in
terms of tax saved is 6.25% of the investment.
Chart 4
Chart 5
9
In Chart 5 the post-tax returns to the ongoing investor in the 10
mmbbls field with the $50 price are shown when instant relief
for the IA is available. Under the present tax system the effect
is substantial. The NPV/I ratio increases from 0.19 to 0.22.
With CT at 20% and SC at 20% there is a worthwhile increase
from just over 0.21 to 0.24.
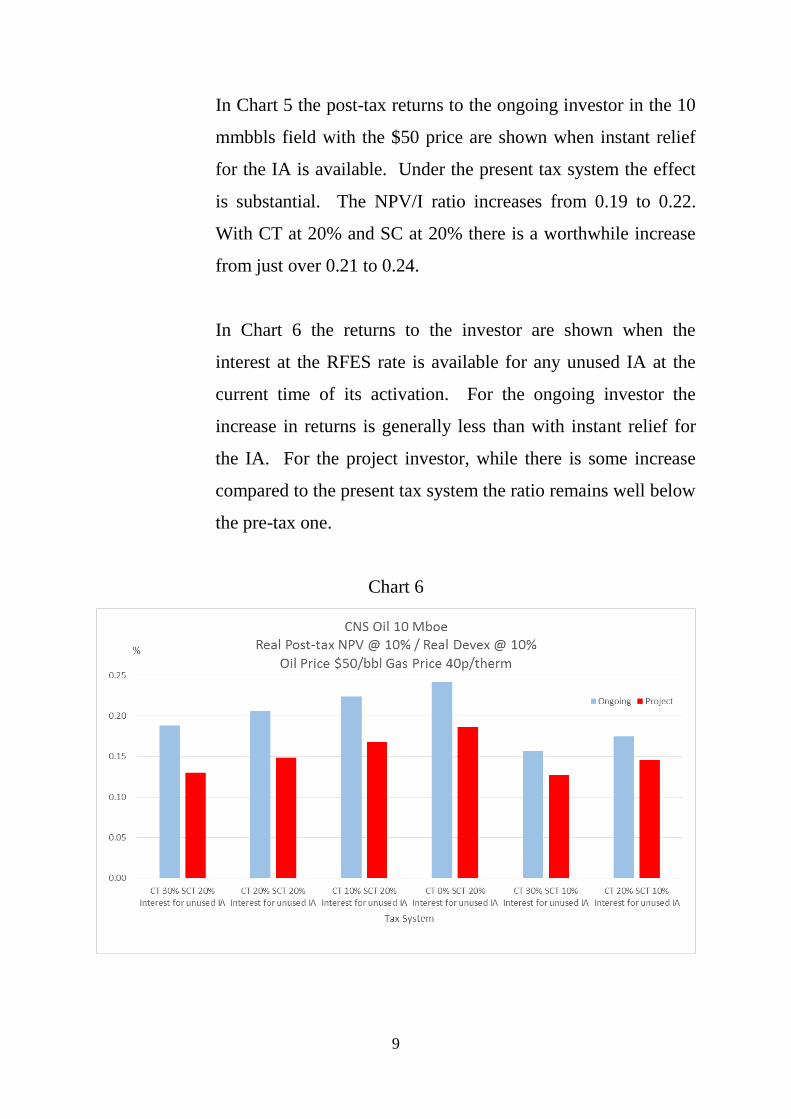
In Chart 6 the returns to the investor are shown when the
interest at the RFES rate is available for any unused IA at the
current time of its activation. For the ongoing investor the
increase in returns is generally less than with instant relief for
the IA. For the project investor, while there is some increase
compared to the present tax system the ratio remains well below
the pre-tax one.
Chart 6
10
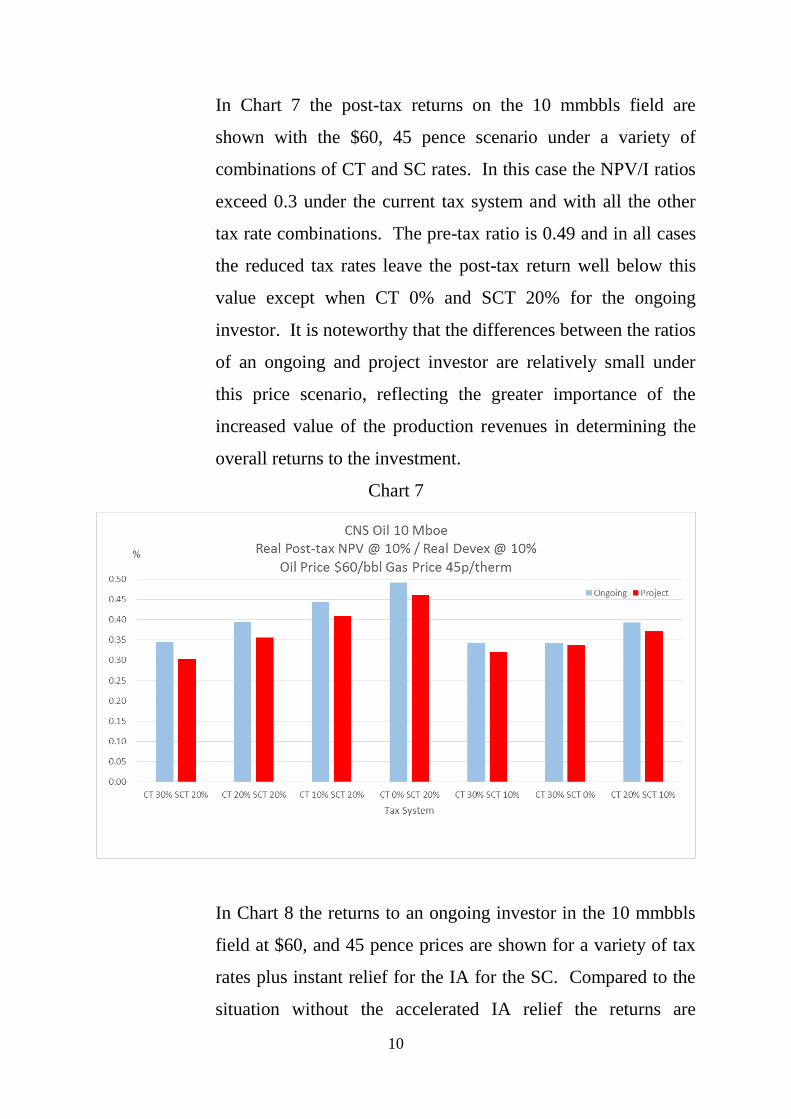
In Chart 7 the post-tax returns on the 10 mmbbls field are
shown with the $60, 45 pence scenario under a variety of
combinations of CT and SC rates. In this case the NPV/I ratios
exceed 0.3 under the current tax system and with all the other
tax rate combinations. The pre-tax ratio is 0.49 and in all cases
the reduced tax rates leave the post-tax return well below this
value except when CT 0% and SCT 20% for the ongoing
investor. It is noteworthy that the differences between the ratios
of an ongoing and project investor are relatively small under
this price scenario, reflecting the greater importance of the
increased value of the production revenues in determining the
overall returns to the investment.
Chart 7
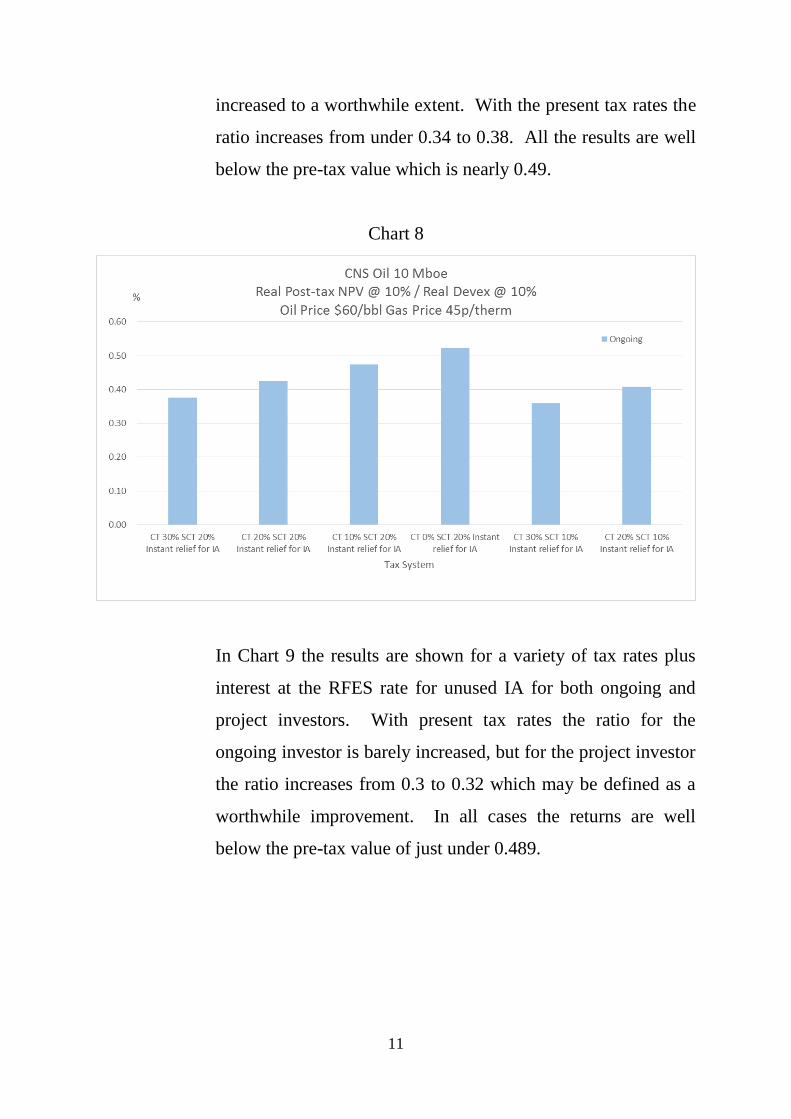
In Chart 8 the returns to an ongoing investor in the 10 mmbbls
field at $60, and 45 pence prices are shown for a variety of tax
rates plus instant relief for the IA for the SC. Compared to the
situation without the accelerated IA relief the returns are
11
increased to a worthwhile extent. With the present tax rates the
ratio increases from under 0.34 to 0.38. All the results are well
below the pre-tax value which is nearly 0.49.
Chart 8
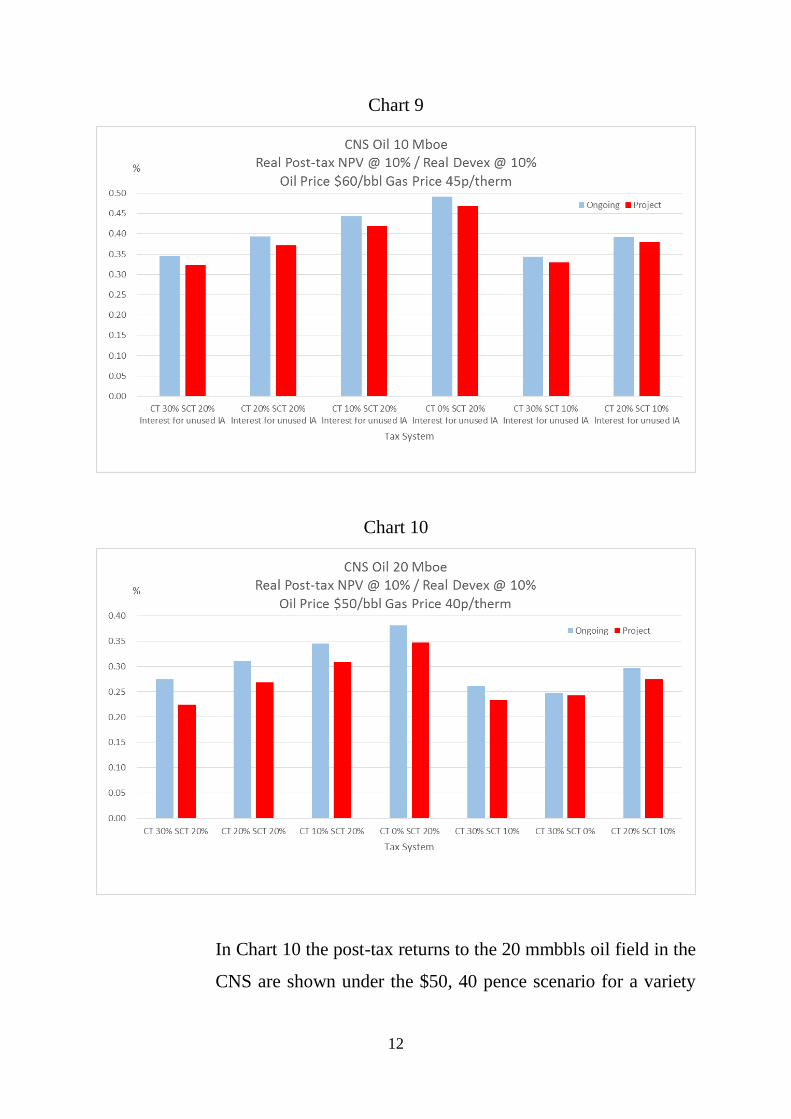
In Chart 9 the results are shown for a variety of tax rates plus
interest at the RFES rate for unused IA for both ongoing and
project investors. With present tax rates the ratio for the
ongoing investor is barely increased, but for the project investor
the ratio increases from 0.3 to 0.32 which may be defined as a
worthwhile improvement. In all cases the returns are well
below the pre-tax value of just under 0.489.
12
Chart 9
Chart 10
In Chart 10 the post-tax returns to the 20 mmbbls oil field in the
CNS are shown under the $50, 40 pence scenario for a variety

13
of CT and SC rates. Under the current tax system the ratio for
the ongoing investor is 0.27 and for the project investor 0.2.
Before tax it was 0.35. Reducing the CT rate to 20% brings the
ratio comfortably above 0.31 for the ongoing investor and so
could incentivise the project. But reducing SC to 10% with CT
at 30% still leaves the ongoing investor with a ratio below 0.3.
This also happens when the lower SC rate is combined with CT
at 20% as well as when combined with CT at 30%. For the
project investor an NPV/I ratio ˃ 0.3 can only be obtained with
CT at 10% and SC at 20%, apart from the unrealistic case of
zero CT and 20% SC.
Chart 11
In Chart 11 the results for the 20 mmbbls oil field are shown for
a variety of tax rates plus instant relief for IA for the ongoing
investor at the $50, 40 pence scenario. Interestingly, at current
tax rates this extra relief is sufficient to tip the ratio from 0.27 to

14
just over 0.309. The extra relief could trigger the investment.
With 20% CT and 20% SC the ratio becomes over 0.34
compared to under 0.31 without the relief. Similarly, with CT
at 20% and SC at 10% the ratio comfortably exceeds 0.3 while
it was just below this value without the extra relief.
Chart 12
In Chart 12 the post-tax returns are shown for the 20 mmbbls
field at the $50, 40 pence scenario with a variety of tax rates
plus interest at the RFES rate on unused IA. For the ongoing
investor the increase in returns for the extra allowance is quite
small. Under the present tax system the ratio remains well
below 0.3. Only with a combination of CT at 20% and SC at
10% does the ratio reach 0.3. Without the allowance it was just
under this value. Returns to project investors are enhanced to a
more noticeable extent from the allowance under the present tax
system. But it is noteworthy that, when lower SC rates are also
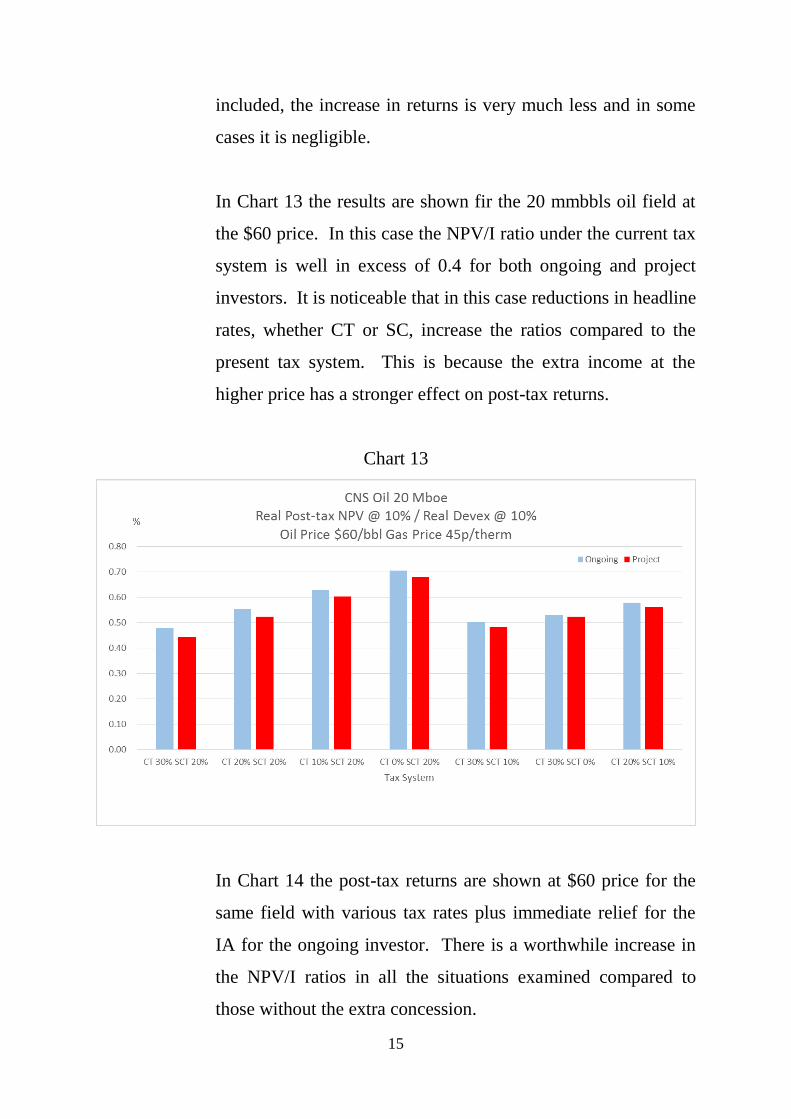
15
included, the increase in returns is very much less and in some
cases it is negligible.
In Chart 13 the results are shown fir the 20 mmbbls oil field at
the $60 price. In this case the NPV/I ratio under the current tax
system is well in excess of 0.4 for both ongoing and project
investors. It is noticeable that in this case reductions in headline
rates, whether CT or SC, increase the ratios compared to the
present tax system. This is because the extra income at the
higher price has a stronger effect on post-tax returns.
Chart 13
In Chart 14 the post-tax returns are shown at $60 price for the
same field with various tax rates plus immediate relief for the
IA for the ongoing investor. There is a worthwhile increase in
the NPV/I ratios in all the situations examined compared to
those without the extra concession.

16
Chart 14
Chart 15

17
In Chart 15 the results are shown for the same field at the $60
price with the addition of interest at the RFES rate for unused
IA at the time of current eligibility for its use. For both the
ongoing and project investors this makes little or no difference
to the post-tax NPV/I ratios. This is because, at the $60 price,
there is generally adequate field income against which to set the
IA without the need to carry forward unutilised amounts.
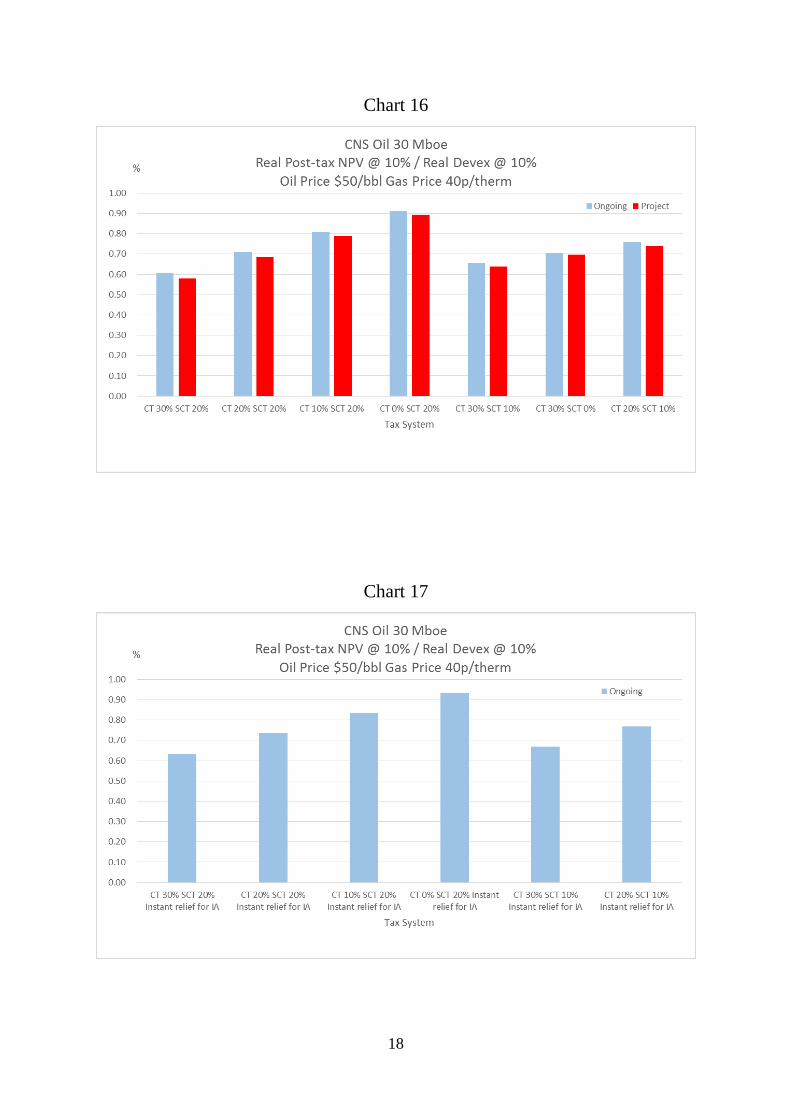
In Charts 16, 17 and 18 the returns to the 30 mmbbls field under
the various assumptions discussed above are shown under the
$50 price. In this case the returns under the present tax system
are clearly acceptable with the NPV/I ratio exceeding 0.61 for
the ongoing investor and 0.58 for the project investor.
Reductions in tax rates clearly enhance returns. It is again
noticeable that reductions in the CT rate are more powerful than
comparable reductions in the SC rate. It is seen that the
introduction of instant relief for the IA increases returns to a
worthwhile extent under the present tax system. When reduced
rates of tax are also considered the increase in returns is
relatively modest at the $50 price. A comparison of Charts 16
and 18 indicates that the addition of interest on unused IA has
negligible effect on returns as the higher income at $50 price
means that relief can more readily be attained without reverse to
interest.
18
Chart 16
Chart 17

19
Chart 18
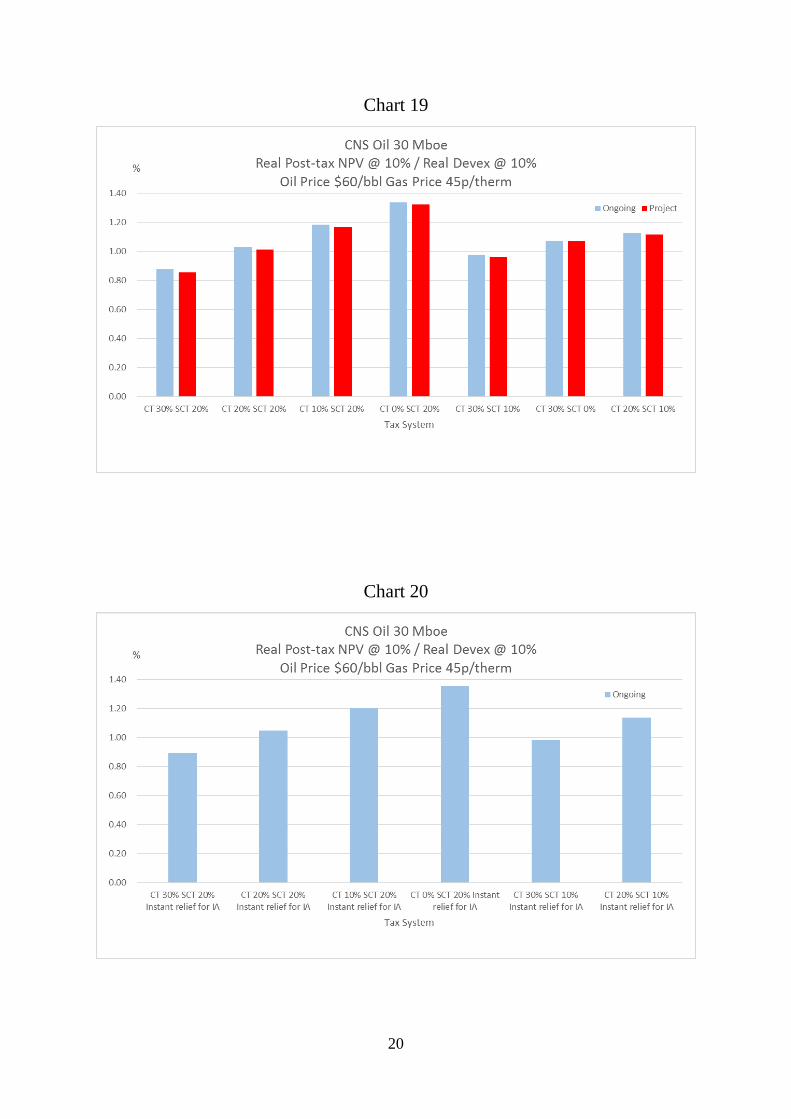
The returns to the 30 mmbbls oil field at the $60 price under the
various tax rate and tax allowance assumptions are shown in
Charts 19, 20 and 21. The project is clearly profitable under the
present tax system. Reductions in headline rates clearly
increase the NPV/I ratios. Instant relief for the IA and interest
on unused IA have negligible effects. This latter finding
indicates that the extra allowances are progressive in their
effects. Thus they can make a significant, positive difference to
marginal projects but only a minor or even zero effect on quite
profitable ones.
20
Chart 19
Chart 20

21
Chart 21
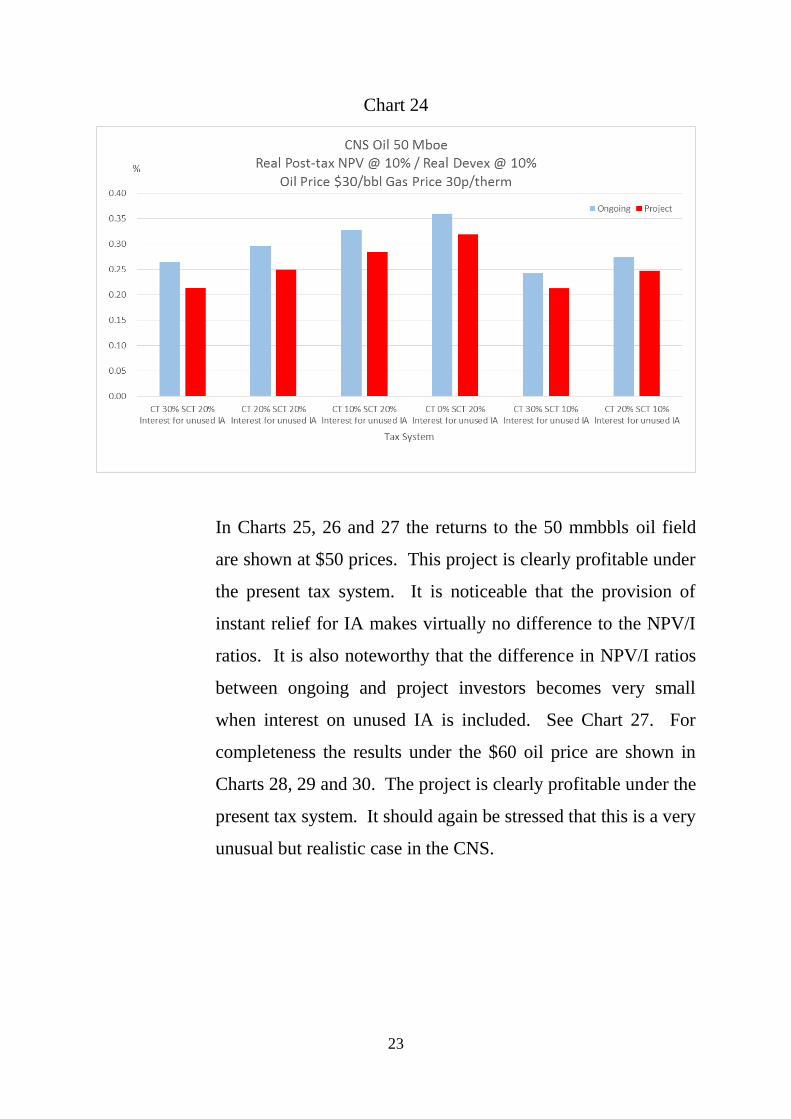
In Charts 22, 23 and 24 the returns to the 50 mmbbls oil field
under the various tax arrangements are shown at the $30 price.
Very unusually, this is a project which exhibited a pre-tax
NPV/I ratio just exceeding 0.3. Under the present tax system
the ratio is 0.25 for an ongoing investor and 0.19 for the project
investor. It is seen from Chart 22 that only major reductions in
the CT rate can produce a ratio exceeding 0.3 for the ongoing
investor, while some of the rate changes examined bring the
ratio close to 0.3 for the project investor. It is also seen from
Chart 23 that the availability of instant relief for the IA
produces a substantial improvement to the ratio for the ongoing
investor, but it remains short of the 0.3 threshold unless CT is
less than 30% and SCT is 20%. However, it is noteworthy that
a combination of 20% CT and 20% SC plus instant relief for the
IA is sufficient to produce returns clearly in excess of 0.3. See
Chart 23. The availability of interest on unused IA is not so

22
powerful and the 0.3 threshold is only achieved when, in
addition, there are major reductions in the CT rate. See Chart
24.
Chart 22
Chart 23
23
Chart 24
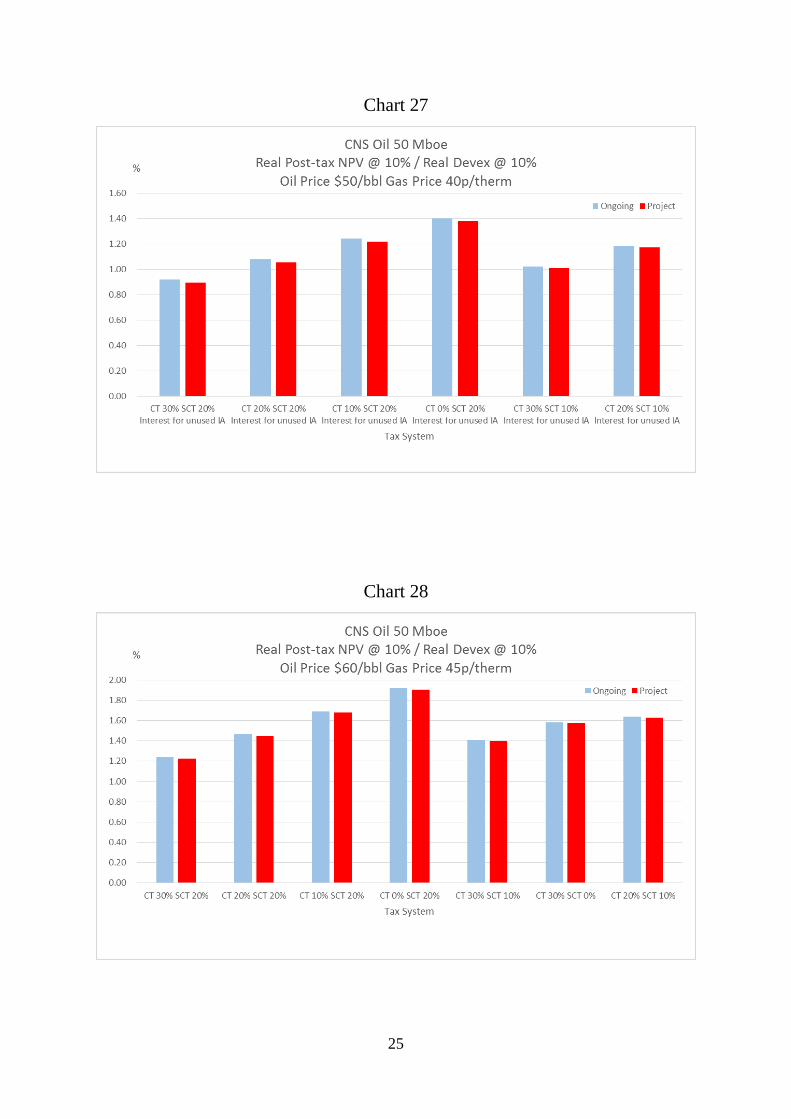
In Charts 25, 26 and 27 the returns to the 50 mmbbls oil field
are shown at $50 prices. This project is clearly profitable under
the present tax system. It is noticeable that the provision of
instant relief for IA makes virtually no difference to the NPV/I
ratios. It is also noteworthy that the difference in NPV/I ratios
between ongoing and project investors becomes very small
when interest on unused IA is included. See Chart 27. For
completeness the results under the $60 oil price are shown in
Charts 28, 29 and 30. The project is clearly profitable under the
present tax system. It should again be stressed that this is a very
unusual but realistic case in the CNS.

24
Chart 25
Chart 26
25
Chart 27
Chart 28

26
Chart 29
Chart 30

27
Chart 31
Chart 32
28
Chart 33
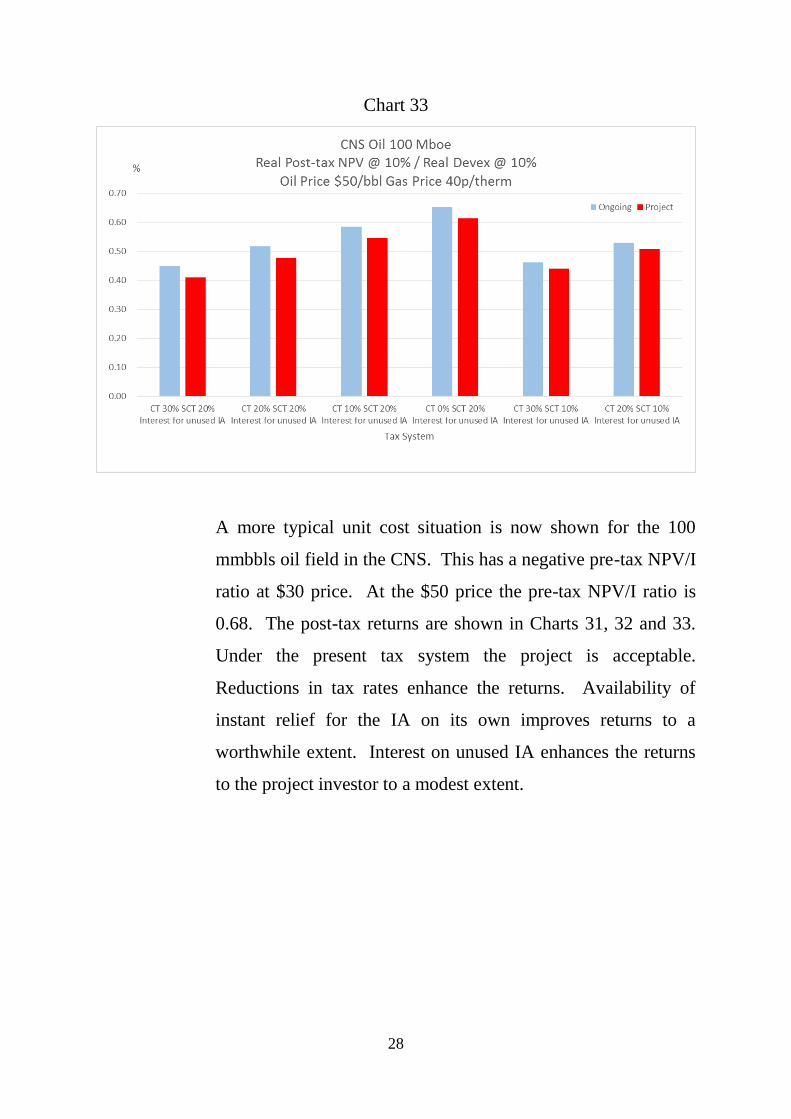
A more typical unit cost situation is now shown for the 100
mmbbls oil field in the CNS. This has a negative pre-tax NPV/I
ratio at $30 price. At the $50 price the pre-tax NPV/I ratio is
0.68. The post-tax returns are shown in Charts 31, 32 and 33.
Under the present tax system the project is acceptable.
Reductions in tax rates enhance the returns. Availability of
instant relief for the IA on its own improves returns to a
worthwhile extent. Interest on unused IA enhances the returns
to the project investor to a modest extent.
29
Chart 34
Chart 35
30
Chart 36
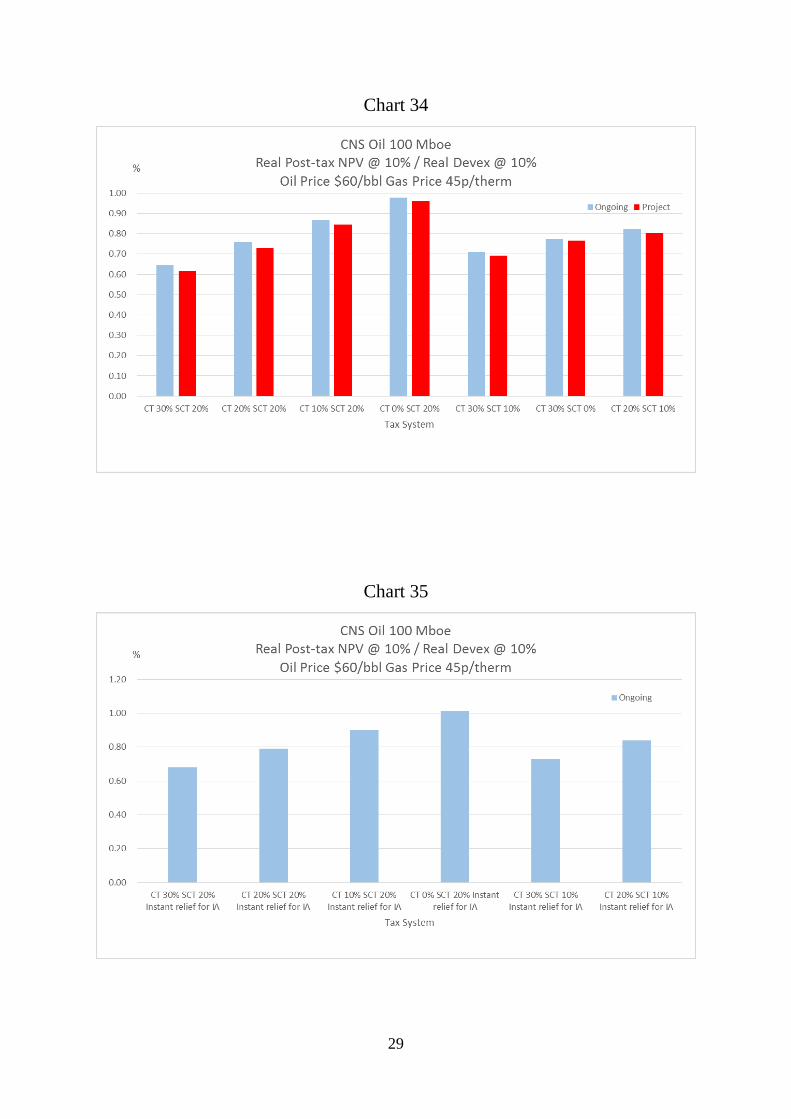
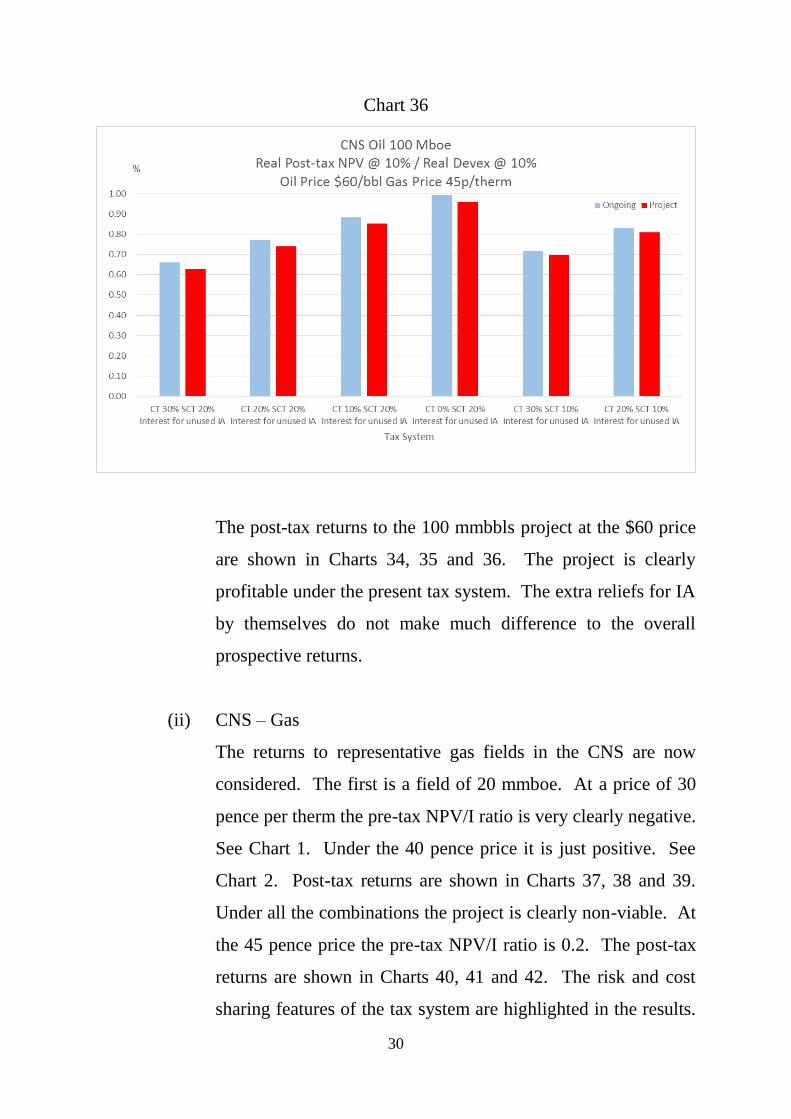
The post-tax returns to the 100 mmbbls project at the $60 price
are shown in Charts 34, 35 and 36. The project is clearly
profitable under the present tax system. The extra reliefs for IA
by themselves do not make much difference to the overall
prospective returns.
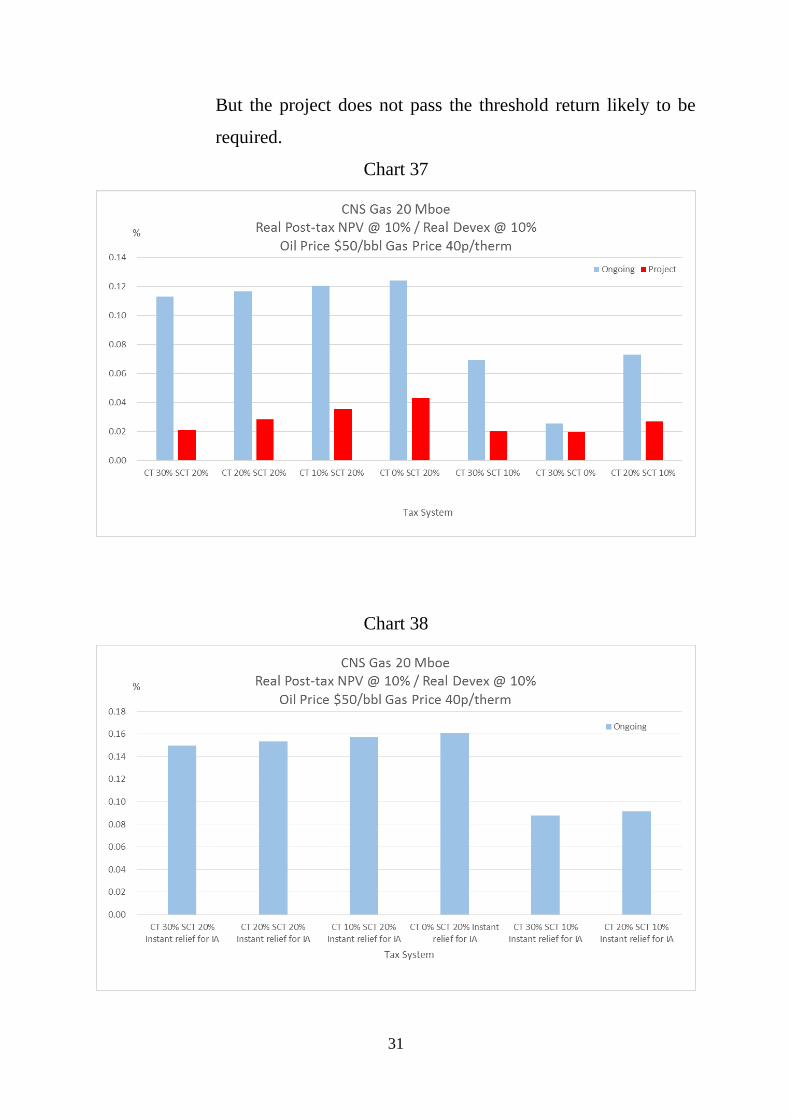
(ii) CNS – Gas
The returns to representative gas fields in the CNS are now
considered. The first is a field of 20 mmboe. At a price of 30
pence per therm the pre-tax NPV/I ratio is very clearly negative.
See Chart 1. Under the 40 pence price it is just positive. See
Chart 2. Post-tax returns are shown in Charts 37, 38 and 39.
Under all the combinations the project is clearly non-viable. At
the 45 pence price the pre-tax NPV/I ratio is 0.2. The post-tax
returns are shown in Charts 40, 41 and 42. The risk and cost
sharing features of the tax system are highlighted in the results.
31
But the project does not pass the threshold return likely to be
required.
Chart 37
Chart 38

32
Chart 39
Chart 40

33
Chart 41
Chart 42

34
The results for the 100 mmboe gas field at the 30 pence price
indicate a pre-tax NPV/I ratio of 0.135. Post-tax returns are
shown in Charts 43, 44 and 45. While the cost and risk sharing
features of the tax system are highlighted, especially with
instant relief for the IA, the NPV/I ratios are generally well
below the threshold of 0.3.
Chart 43

35
Chart 44
Chart 45
36
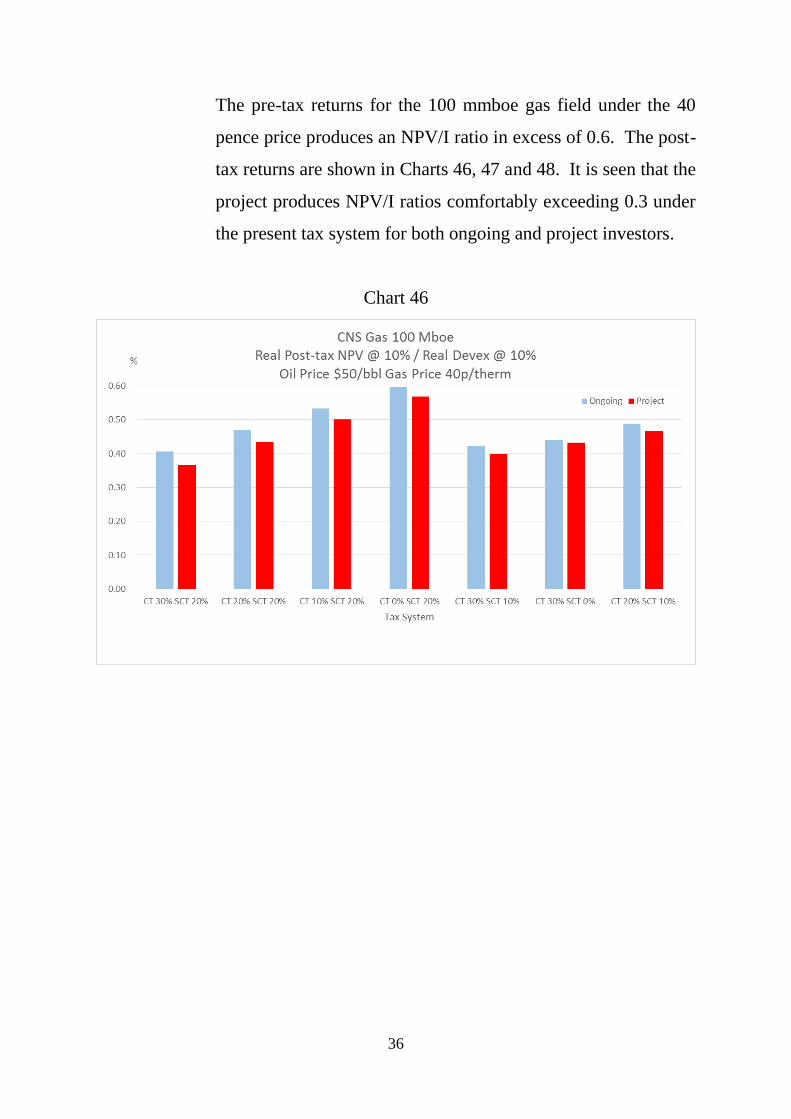
The pre-tax returns for the 100 mmboe gas field under the 40
pence price produces an NPV/I ratio in excess of 0.6. The post-
tax returns are shown in Charts 46, 47 and 48. It is seen that the
project produces NPV/I ratios comfortably exceeding 0.3 under
the present tax system for both ongoing and project investors.
Chart 46

37
Chart 47
Chart 48

38
Under the 45 pence price case the 100 mmboe field produces a
pre-tax NPV/I ratio of 0.88. The Charts 49, 50 and 51 it is seen
that, under the present tax system, the post-tax ratio for an
ongoing investor is 0.54 while for a project investor it is 0.5.
Chart 49

39
Chart 50
Chart 51

40
(iii) W of S – Oil
The case of oil fields in the W of S region is now considered.
The field of 50 mmbbls was found to be uneconomic before tax
at $30 price. The NPV/I ratio is seriously negative. See Chart
1. At the $50 price, however, the pre-tax NPV/I ratio exceeds
0.165. See Chart 2. The post-tax returns are shown in Charts
52, 53 and 54. Under the present tax system the NPV/I ratio is
0.171 for an ongoing investor and less than 0.1 for a project
investor. Tax rate reductions do not always enhance NPV/I
ratios because the reductions in the rate of relief for the investor
(including the IA) are worth more than the reduced rate of tax
on the income. Only major reductions in the CT rate can
enhance returns compared to the present tax system. The
returns to project investors are far below those to ongoing
investors.
Chart 52

41
Chart 53
Chart 54
42
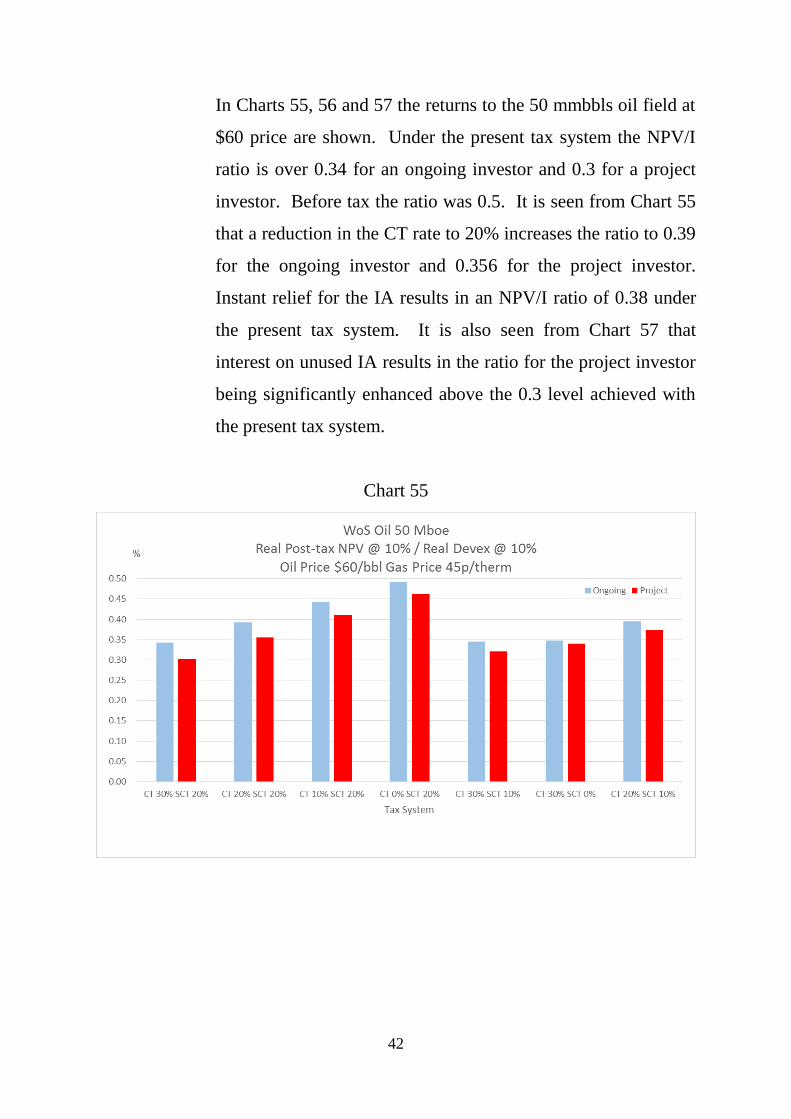
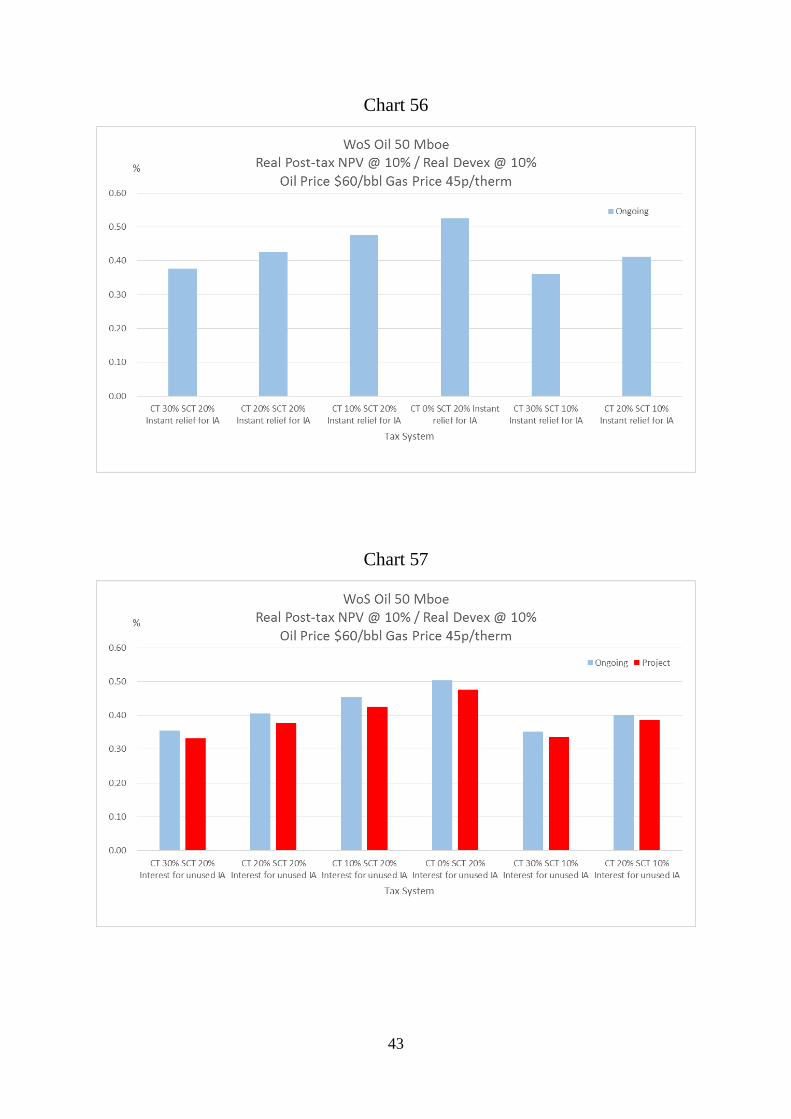
In Charts 55, 56 and 57 the returns to the 50 mmbbls oil field at
$60 price are shown. Under the present tax system the NPV/I
ratio is over 0.34 for an ongoing investor and 0.3 for a project
investor. Before tax the ratio was 0.5. It is seen from Chart 55
that a reduction in the CT rate to 20% increases the ratio to 0.39
for the ongoing investor and 0.356 for the project investor.
Instant relief for the IA results in an NPV/I ratio of 0.38 under
the present tax system. It is also seen from Chart 57 that
interest on unused IA results in the ratio for the project investor
being significantly enhanced above the 0.3 level achieved with
the present tax system.
Chart 55
43
Chart 56
Chart 57
44
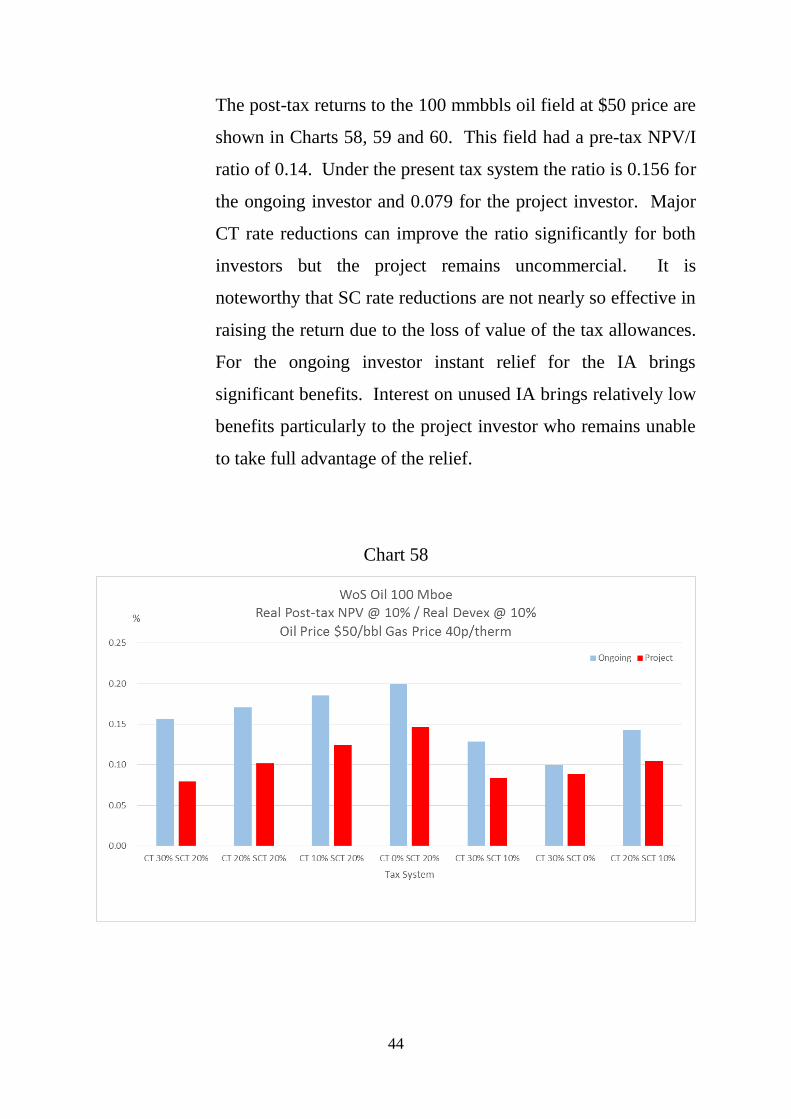
The post-tax returns to the 100 mmbbls oil field at $50 price are
shown in Charts 58, 59 and 60. This field had a pre-tax NPV/I
ratio of 0.14. Under the present tax system the ratio is 0.156 for
the ongoing investor and 0.079 for the project investor. Major
CT rate reductions can improve the ratio significantly for both
investors but the project remains uncommercial. It is
noteworthy that SC rate reductions are not nearly so effective in
raising the return due to the loss of value of the tax allowances.
For the ongoing investor instant relief for the IA brings
significant benefits. Interest on unused IA brings relatively low
benefits particularly to the project investor who remains unable
to take full advantage of the relief.
Chart 58

45
Chart 59
Chart 60

46
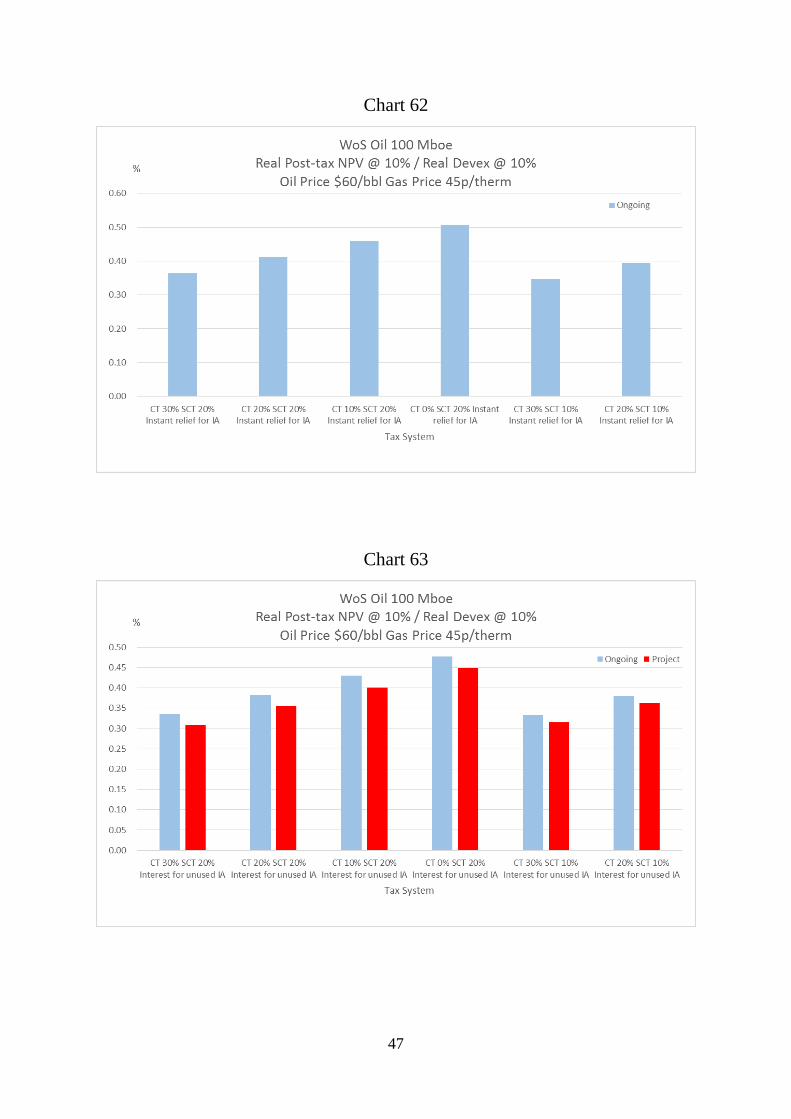
The post-tax returns to the 100 mmbbls oil field at $60 price are
shown in Charts 61, 62 and 63. The pre-tax NPV/I ratio is 0.47.
The post-tax ratio under the current tax system is 0.325 for the
ongoing investor and for the project investor it is 0.28. From
Chart 61 it is seen that reducing the CT rate to 20% increases
these ratios to 0.37 and 0.33 respectively. Reducing the SC rate
to 10% or even 0% does not have such a strong effect on the
NPV/I ratios. It is seen from Chart 62 that instant relief for IA
has quite a strong effect on the returns to the ongoing investor.
From Chart 63 it is seen that interest on unused IA has a very
worthwhile effect on returns to the project investor. He can
now take fuller advantage of the relief with the larger income
received at $60 compared to $50 oil price.
Chart 61
47
Chart 62
Chart 63

48
(iv) W of S – Gas
The returns for the 100 mmboe gas field were found to be
negative under all 3 prices of 30 pence, 40 pence and 45 pence.
See Charts 1, 2 and 3 for pre-tax returns.
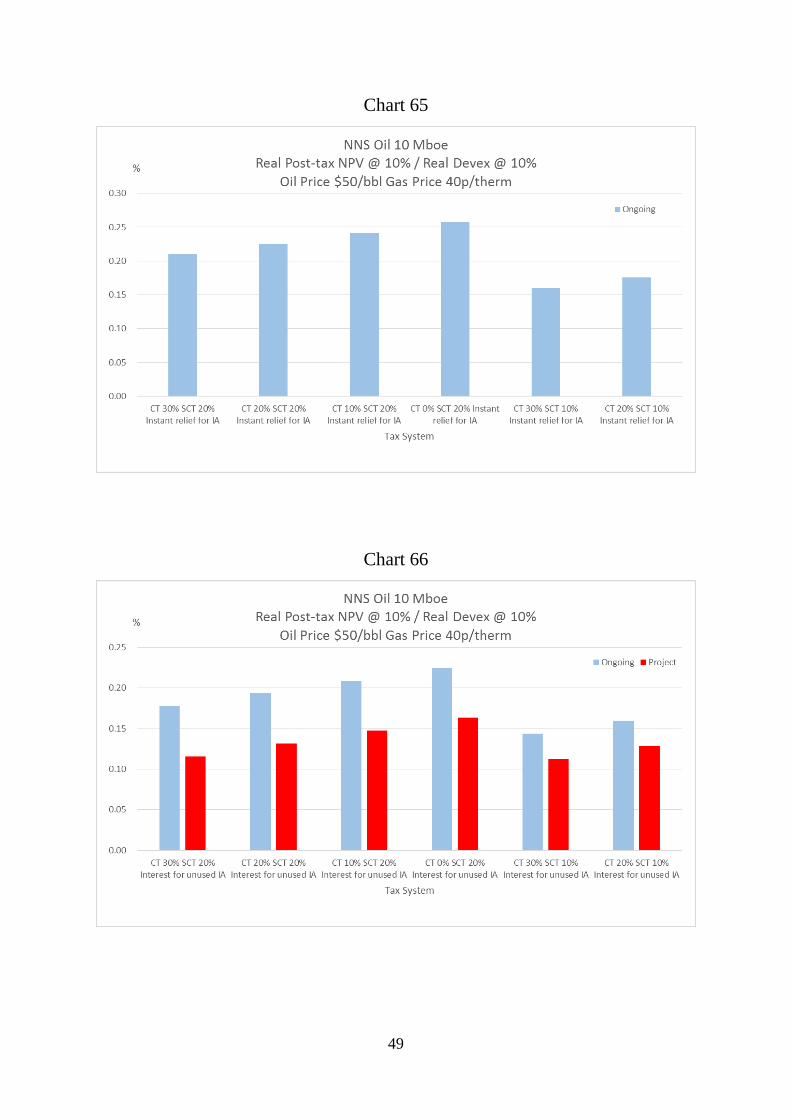
(v) NNS – Oil
The post-tax returns to the 10 mmbbls oil field in the NNS are
shown in Chart 64, 65 and 66 for the $50 price. The pre-tax
NPV/I ratio is 0.158. It is seen from Chart 64 that the post-tax
ratio for the ongoing investor is 0.18. But It is only 0.1 for the
project investor. Major tax rate reductions, particularly to CT,
increase the returns but they remain uneconomic. From Chart
65 it is seen that instant relief for the IA has a substantial
beneficial effect on returns to the ongoing investor. From Chart
66 it is seen that interest on unused IA has little effect on the
returns to the project investor because he has inadequate income
against which to obtain the full relief.
Chart 64
49
Chart 65
Chart 66

50
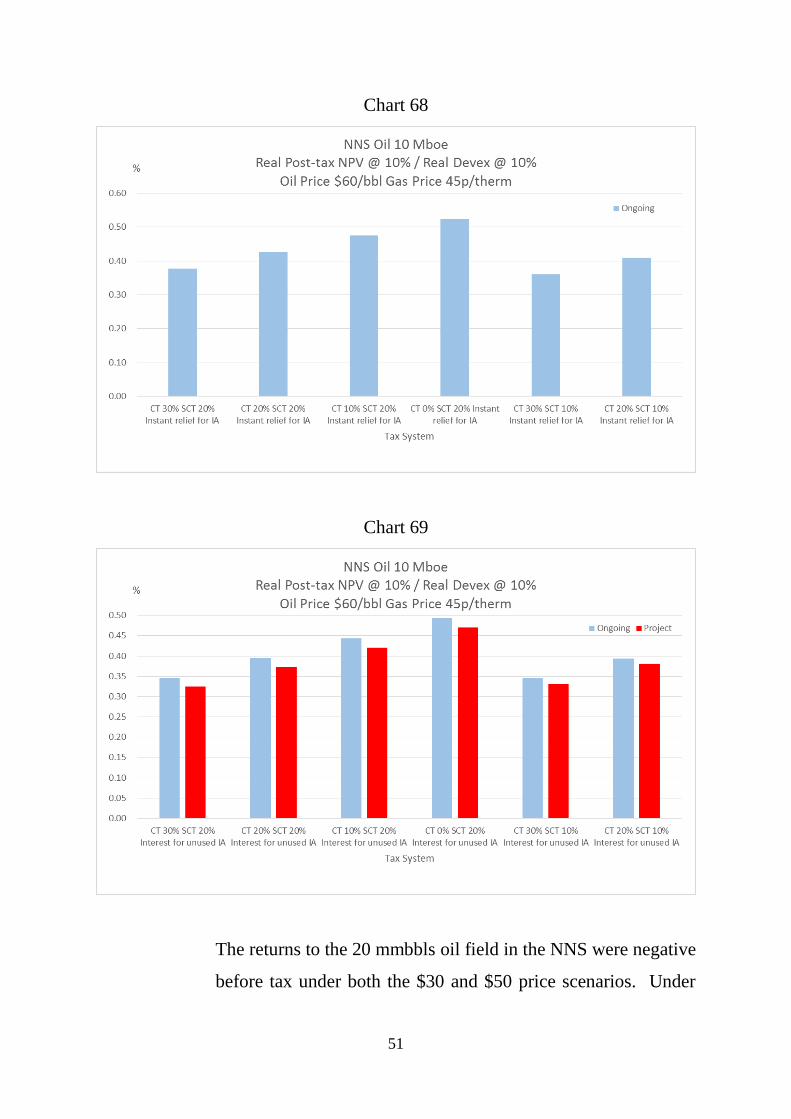
The post-tax returns to the 10 mmbbls oil field with $60 price
are shown in Charts 67, 68 and 69. The pre-tax NPV/I ratio is
nearly 0.5. It is seen from Chart 67 that the ongoing investor
can obtain a post-tax NPV/I ratio of nearly 0.35. The project
investor has a ratio of 0.3. Tax rate reductions increase the
returns to a worthwhile extent for both investors. From Chart
68 it is also seen that immediate relief for IA significantly
enhances the returns to ongoing investors. From Chart 69 it is
seen that interest on unused IA can ensure that the returns to the
project investor comfortably exceed 0.3.
Chart 67
51
Chart 68
Chart 69
The returns to the 20 mmbbls oil field in the NNS were negative
before tax under both the $30 and $50 price scenarios. Under
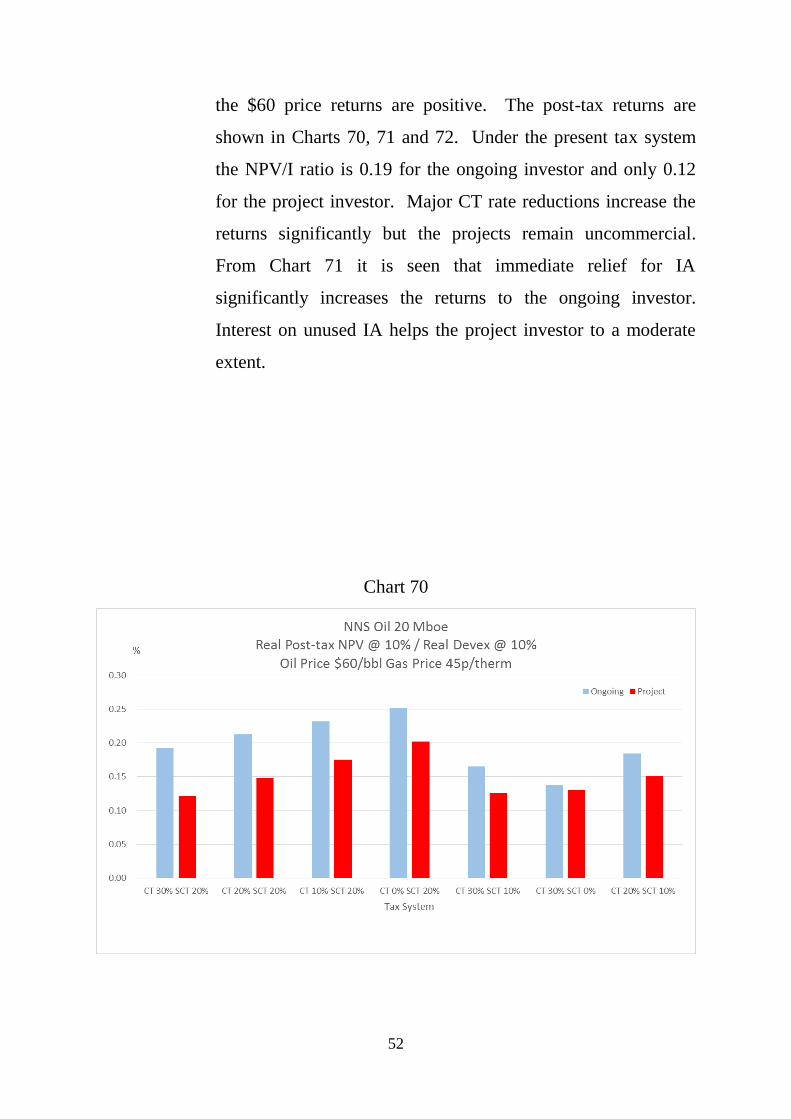
52
the $60 price returns are positive. The post-tax returns are
shown in Charts 70, 71 and 72. Under the present tax system
the NPV/I ratio is 0.19 for the ongoing investor and only 0.12
for the project investor. Major CT rate reductions increase the
returns significantly but the projects remain uncommercial.
From Chart 71 it is seen that immediate relief for IA
significantly increases the returns to the ongoing investor.
Interest on unused IA helps the project investor to a moderate
extent.
Chart 70

53
Chart 71
Chart 72

54
The 50 mmbbls oil field was found to be uneconomic at $30
and $50 prices. At $60 price the returns are positive but non-
commercial. The post-tax NPV/I ratios are shown in Charts 73,
74 and 75. The ratio for the ongoing investor under the current
tax system is 0.19 and for the project investor 0.12. Major CT
rate reductions enhance the returns but they are still
uncommercial. Again it was found that instant relief for IA
substantially enhanced returns for the ongoing investor.
The 100 mmbbls oil field was found to be uneconomic at $30
and $50 prices. At $60 prices, while post-tax NPVs at 10%
were positive, the NPV/I values were extremely low and far
below the 0.3 threshold.
Chart 73

55
Chart 74
Chart 75

56
(vi) NNS – Gas
The 30 mmboe gas field in NNS was found to generate negative
or very low returns at 30 pence and 40 pence prices. At 45
pence price the NPVs at 10% are positive but the NPV/I ratios
are very low. The results are shown in Charts 76, 77 and 78. It
is seen that, under the present tax system, the NPV/I ratio is
0.16 for an ongoing investor and 0.076 for a project investor.
Major reductions to the CT rate can enhance returns. For the
ongoing investor instant relief for the IA brings substantial
benefits.
Chart 76

57
Chart 77
Chart 78
58
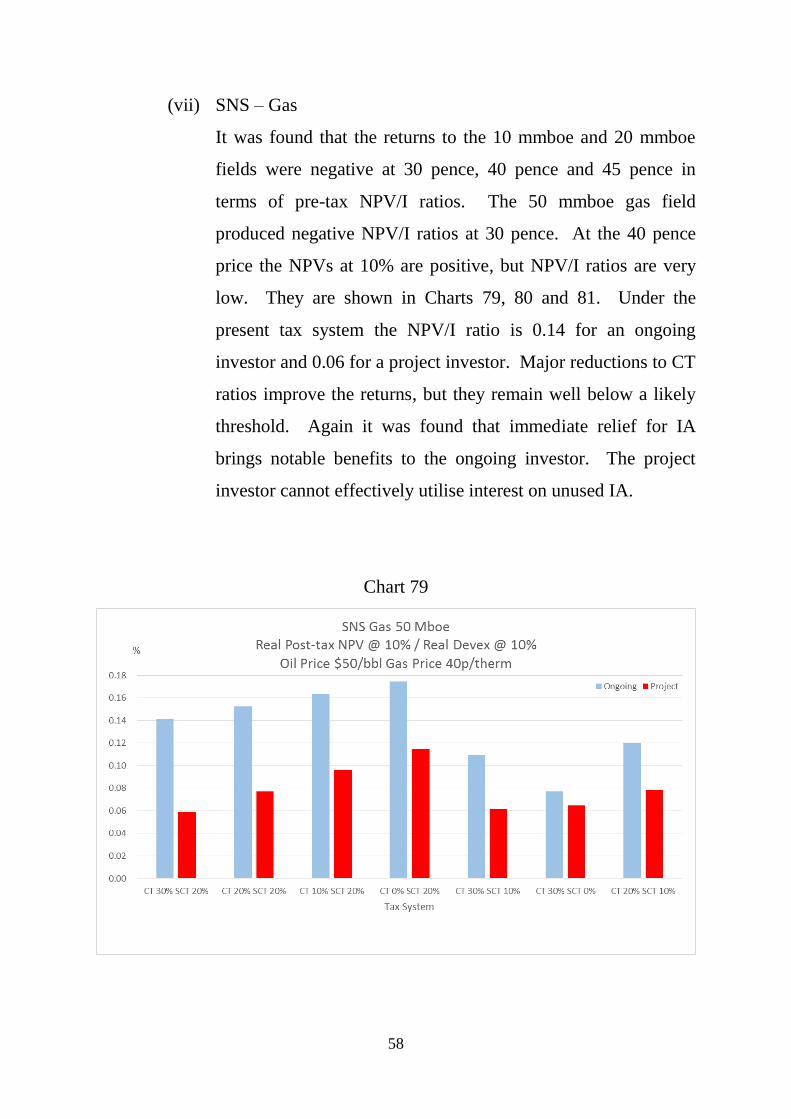
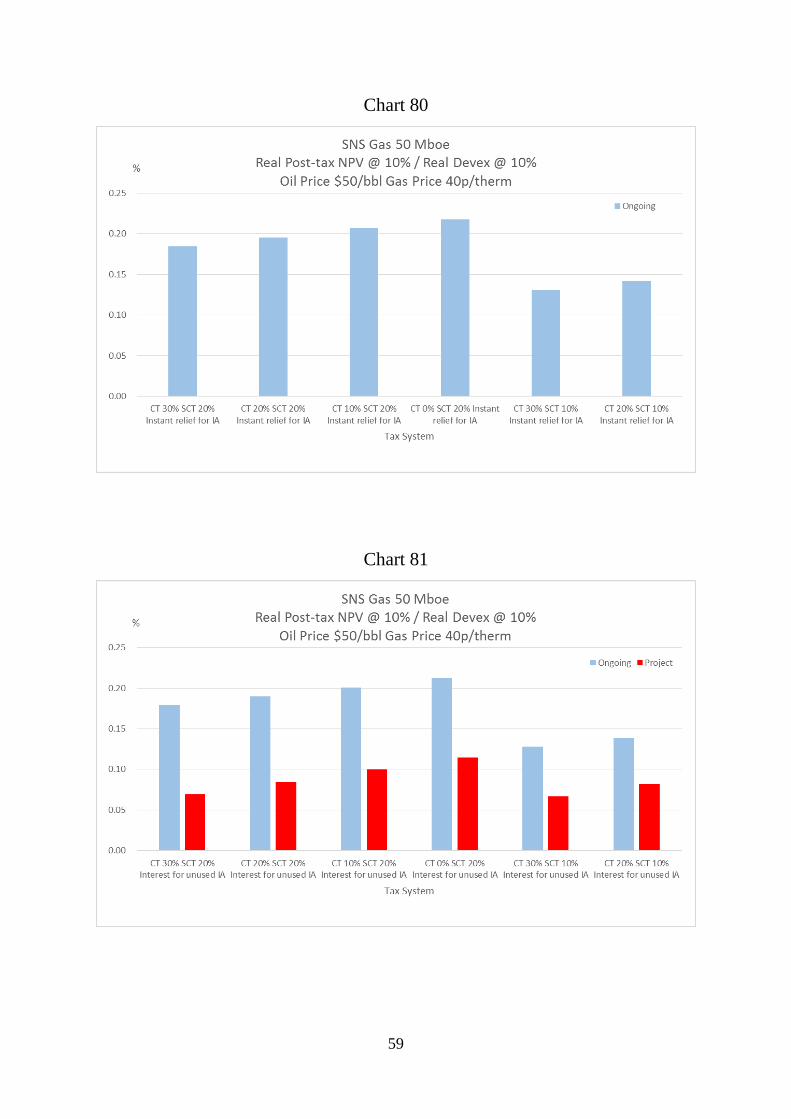
(vii) SNS – Gas
It was found that the returns to the 10 mmboe and 20 mmboe
fields were negative at 30 pence, 40 pence and 45 pence in
terms of pre-tax NPV/I ratios. The 50 mmboe gas field
produced negative NPV/I ratios at 30 pence. At the 40 pence
price the NPVs at 10% are positive, but NPV/I ratios are very
low. They are shown in Charts 79, 80 and 81. Under the
present tax system the NPV/I ratio is 0.14 for an ongoing
investor and 0.06 for a project investor. Major reductions to CT
ratios improve the returns, but they remain well below a likely
threshold. Again it was found that immediate relief for IA
brings notable benefits to the ongoing investor. The project
investor cannot effectively utilise interest on unused IA.
Chart 79
59
Chart 80
Chart 81

60
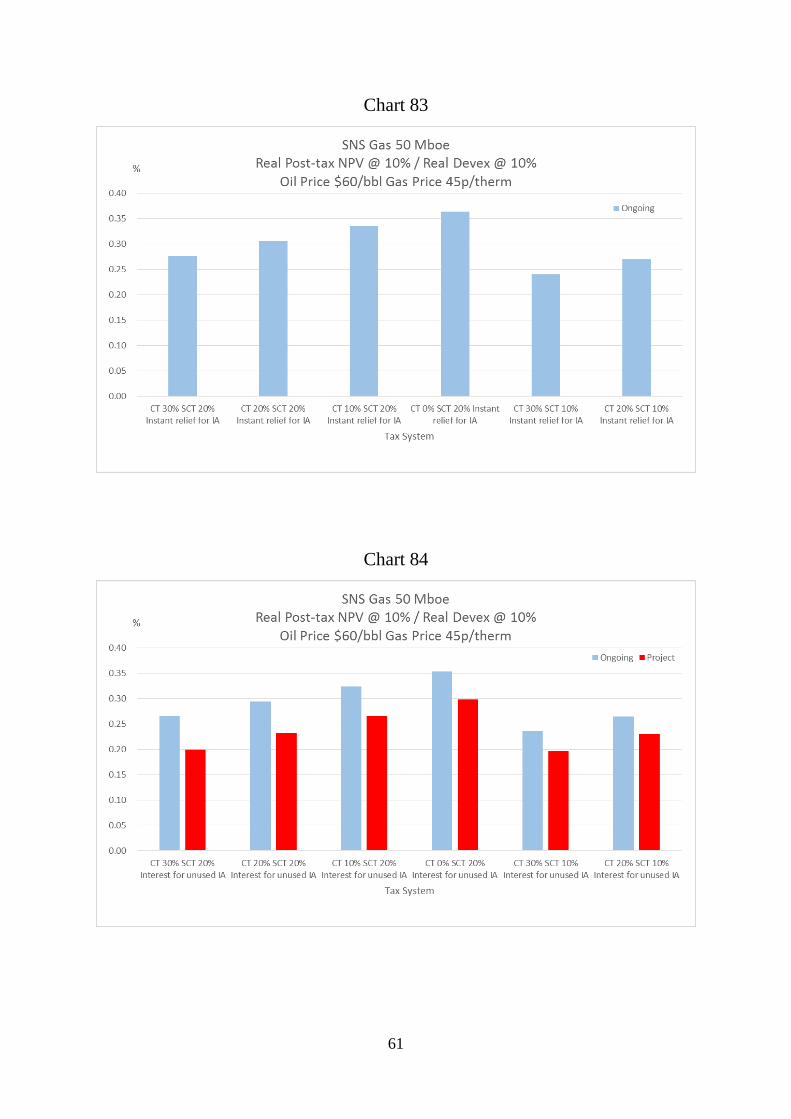
The post-tax returns to the 50 mmboe gas project with 45 pence
price are shown in Charts 82, 83 and 84. Under the present tax
system the ratio is 0.24 for the ongoing investor and 0.178 for
the project one. Large reductions in CT rates can enhance
returns, but probably not to make projects commercial. It is
noteworthy that instant relief for IA significantly helps the
ongoing investor. The project investor obtains worthwhile help
from interest on unused IA.
Chart 82
61
Chart 83
Chart 84
62
4. Conclusions
In this study the prospective pre-tax and post-tax returns for a
representative number of new oil and gas fields in the UKCS have been
modelled under a range of oil and gas prices and various tax schemes.
The sizes of the representative fields are based on those given
development approval over the past few years in the 4 main regions of the
UKCS, namely Central North Sea (CNS), Northern North Sea (NNS),
West of Shetlands (W of S), and Southern North Sea (SNS). The
development and operating costs for the fields have been adjusted to
reflect the cost reductions undertaken by the industry. Altogether 18
fields were modelled, with the objective being to separately reflect the
current conditions in the 4 main sectors of the UKCS.
Three oil and gas price scenarios were employed in the modelling. These
are (1) $30 per barrel and 30 pence per therm, (2) $50 and 40 pence, and
(3) $60 and 45 pence. All are in real terms.
Several tax schemes were modelled. Apart from the present system the
following were also modelled:
1. Investment Allowance (IA) for Supplementary Charge allowed to
be activated against a different project’s income giving earlier effective
relief
2. Interest on IA at the RFES rate to be allowed from the time when
the IA can be activated but cannot be used because of insufficient income
to absorb the allowance
3. Reductions in headline rate of SC with CT unchanged
4. Reductions in headline rate of CT with SC unchanged
5. Combinations of the above, particularly reductions in CT and SC
rates

63
The financial modelling calculates pre-tax and post-tax returns for all the
fields under the various price and tax conditions. Returns were measured
in terms of net present values (NPVs), internal rates of return (IRRs), and
NPV/I ratios. A 10% real discount rate was employed. In the study the
presentation of the results highlights the NPV/I ratios. In the current
investment climate with capital rationing being a considerable problem
NPV/I ratios appropriately emphasise the capital productivity of
investments and enable ready comparisons to be made. In the industry a
value of post-tax NPV@10% / pre-tax I@10% of 0.3 is often regarded as
a threshold.
The detailed results of this study are complex, reflecting the varied
returns to the projects before tax and the complexities of the tax
arrangements. Thus at $30 and 30 pence prices the great majority of
projects are found to be uneconomic before tax. The tax system shares in
the losses through the various allowances.
At the $50 price several of the representative oil fields in the CNS were
found to be commercially viable before tax. After tax the 10 mmbbls
field remained extremely marginal even with major reductions in tax
rates. The 20 mmbbls field was clearly viable before tax but exhibited
NPV/I ratios below 0.3 under the present tax system. Reductions to the
CT rate and instant relief for the IA were found to raise returns above the
0.3 threshold. The representative 30 mmbbls field was found to be viable
under the present tax system. The 50 and 100 mmbbls fields were found
to be viable before and after the current tax at the $50 price. The 20
mmboe gas field was found to be non-viable at 40 pence before tax. The
tax system shares in the losses.

64
The 100 mmboe gas field was found to be viable before tax at the 40
pence price and remained so after the present tax.
In the W of S region at the $50 price both the 50 and 100 mmbbls fields
were found to be non-viable. The tax system shares in the losses. A
similar finding applies to the 100 mmboe gas field at the 40 pence price.
In the NNS the 10, 20, 50 and 100 mmbbls oil fields were found to be
uneconomic before tax as was the 30 mmboe gas field.
In the SNS it was found that the 10, 20, and 50 mmboe gas fields were
uneconomic before tax at the 40 pence price.
At the $60 price it was found that in the CNS the 10, 20, 30, 50 and 100
mmbbls oil fields were all viable before tax. After the current tax system
the 10 mmbbls field remained commercially viable for the ongoing
investor but marginal for the project investor. Instant relief for the IA
helped the ongoing investor significantly as did interest on unused IA for
the project investor. These extra allowances could incentivise the
development of this field. The 20, 30, 50 and 100 mmbbls fields were
found to be viable after the present tax at the $60 price. The 20 mmboe
gas field in the CNS remained very marginal at the 45 pence price. But
CT rate reductions plus instant relief for the IA and interest on unused IA
considerably enhanced post-tax returns compared to the present tax
system.
At the 45 pence price the 20 mmboe gas field was found to be very
marginal for the ongoing investor and clearly sub-marginal for the project
65
investor. Major CT rate reductions plus immediate relief for IA and
interest on unused IA improve the project returns but they remain below
the 0.3 threshold. The 100 mmboe gas field is clearly profitable after the
current tax with the 45 pence price.
At the $60 price the 50 mmbbls oil field in the W of S region was found
to achieve an NPV/I ratio of 0.34 for the ongoing investor and 0.3 for the
project investor under the current tax system. CT rate reductions plus
immediate relief for IA significantly enhance the returns. For the project
investor interest on unused IA can ensure that the development becomes
commercial. The 100 mmbbls oil field was found to produce an NPV/I
ratio of 0.325 for the ongoing investor and 0.278 for the project investor.
Immediate relief for the IA enhances the return to the ongoing investor
while interest on unused IA brings the return to the project investor to a
ratio of 0.31.
In the NNS at $60 price the 10 mmbbls oil field produces an NPV/I ratio
of 0.346 for the ongoing investor and 0.3 for the project investor.
Immediate relief for IA helps the ongoing investor to a worthwhile extent
while interest on unused IA ensures that the ratio becomes 0.32. The
project becomes more clearly acceptable to investors.
The 20 mmbbls oil field in the NNS was found to be uncommercial at
$60 price under the present tax system. The NPV/I ratio was particularly
low for the project investor. Reductions in the CT rate plus instant relief
for IA for the ongoing investor improves the returns substantially, but left
the project still very marginal with the NPV/I ratio being below 0.3. The
returns to the project investor remain well below this threshold. Similar
findings were made for the 50 mmbbls oil field in the NNS regions.

66
In the SNS it was found that at the 45 pence gas price the 10 and 20
mmboe gas fields were uneconomic. The 50 mmboe gas field remained
uneconomic with the present tax system. Major reductions in the CT rate
plus immediate relief for IA enhances the returns but they remain
marginal and below the 0.3 threshold.
The conclusions to be drawn from the detailed analysis are that there are
many marginal and sub-marginal new development projects in the UKCS
under likely oil/gas price scenarios, cost conditions, and field sizes. The
evidence from the modelling is that a combination of headline tax rate
reductions plus immediate relief for the IA plus interest on unused IA can
have a significant positive effect on investment in new fields. Immediate
relief for the IA and interest on unused IA are progressive in their effects.
That is, they produce relatively more benefits to marginal projects or
those of relatively low profitability, than to higher profitability ones.
Reductions in the rate of CT are clearly more powerful than equivalent
reductions in the SC rate. A package incorporating lower CT rate,
immediate relief for IA, and interest on unused IA is thus recommended.