Draft- One WASH Program Document Phase II Updating- May 2010
NATIONAL WASH COORDINATION OFFICE 1
FEDERAL DEMOCRATIC REPUBLIC OF
ETHIOPIA
ONE WASH NATIONAL PROGRAM
A Multi-Sectoral SWAp
PHASE 2 Program Document
First Draft
May 2018

Draft- One WASH Program Document Phase II Updating- May 2010
NATIONAL WASH COORDINATION OFFICE 2
Draft- One WASH Program Document Phase II Updating- May 2010
NATIONAL WASH COORDINATION OFFICE
3
Table of Contents Abbreviations and Acronyms .......................................................................................................... 8
Glossary ......................................................................................................................................... 10
1. Executive Summary ................................................................................................................. 13
1.1 Introduction .................................................................................................................................... 13
1.2 Program Description ......................................................................................................................... 13
1.3 Guiding Principles ............................................................................................................................ 13
1.4 Program Pillars ................................................................................................................................ 13
1.5 Phasing ............................................................................................................................................ 14
1.6 Unit Cost for component................................................................................................................. 15
1.7 Capacity Building and Advocacy ...................................................................................................... 15
1.8 Sanitation and Hygiene behavior change ....................................................................................... 15
1.9 Appropriate Technology ................................................................................................................. 15
1.10 Program Components ..................................................................................................................... 16
OWNP - Program Components ............................................................................................................... 16
1.11 Targets and Costs ............................................................................................................................ 18
1.12 Roles and Responsibilities ............................................................................................................... 18
2. Introduction and Background ................................................................................................. 20
2.1 Introduction ...................................................................................................................................... 20
2.2 The Global Context ........................................................................................................................... 20
2.3 The National Context on WASH ........................................................................................................ 22
2.4 Policy and Program Initiatives .......................................................................................................... 23
2.5 The Evolution of WASH in Ethiopia ................................................................................................... 23 2.5.1 Introduction 23 2.5.2 Evolution of the One WASH National Program 24
3. Institutional Roles .................................................................................................................... 26
3.1 Institutional Context ......................................................................................................................... 26 3.1.1 Introduction 26 3.1.2 Obligations of Signatory Ministries 26 3.1.3 Obligation and role of Civil Society Organizations 27 3.1.4 Obligation and Roles of the Program (NWCO) 28 3.1.5 Obligation and Role of Private Sector 28 3.1.6 Role of Banks and microfinance institutions (MFI) 29 3.1.7 Obligation and Roles of Community Organizations 29
3.2 Enhancing Ownership of WASH Services .......................................................................................... 29
4. Program Description ................................................................................................................ 30
4.1 Introduction ...................................................................................................................................... 30 4.2.1 Development Objective 30 4.2.2 Long Term Objective 30 4.2.3 Intermediate Term Objective 30 4.2.4 Short Term Objective 31
4.3 Guiding Principles ............................................................................................................................. 31

Draft- One WASH Program Document Phase II Updating- May 2010
NATIONAL WASH COORDINATION OFFICE
4
4.4 Program Pillars .................................................................................................................................. 31 4.4.1 Enabling Environment/Good Governance 31 4.4.2 Maximizing availability and efficient use of human and financial resources to create demand for better WASH
services 31 4.4.3 Capacity development for improved delivery of WASH services 32
4.5 Phasing .............................................................................................................................................. 32 4.5.1 Introduction 32 4.5.2 Phase II 33
4.6 Risk Assessment ................................................................................................................................ 34
4.7 Safeguards ........................................................................................................................................ 37 4.7.1 Description 37 4.7.2 Special Conditions 38
4.8 Enhancing Equity and inclusion in WASH ........................................................................................ 39 4.8.1 Why focus on MHM 39
5. Component Description .......................................................................................................... 40
5.1 Rural Water Supply ........................................................................................................................... 40 5.1.1 Introduction 40 5.1.2 Implementation modalities 41 5.1.3Pastoralist Rural Water 44
5.2 Rural Sanitation and Hygiene Promotion ......................................................................................... 44 5.2.1 Introduction 44 5.2.2 Implementation 45 5.2.3 Pastoralist Sanitation and Hygiene 47 5.2.5 Targeted Subsidy 48 5.2.6 Manuals, Guidelines and Information Materials 48
5.3 Urban Water Supply ......................................................................................................................... 49 5.3.1 Introduction 49 5.3.2 Implementation 50 5.3.3 Improving Efficiency in Construction and Operation of Water Supply Systems 52 5.3.4 Construction Supervision 52 5.3.5 Sustainability 53
5.3.6 Water Quality ................................................................................................................................ 54 5.3.6.1 Introduction 54 5.3.6.2 Implementation 55 5.3.6.3 Standards and Guidelines 55
5.4. Urban Sanitation and Hygiene ......................................................................................................... 55
5.5 Institutional WASH............................................................................................................................ 57 5.5.1 School WASH 57 5.5.2 WASH in Health Facilities 59
6. Readiness Criteria and Targeting ............................................................................................ 61
6.1 Introduction ................................................................................................................................... 61
6.2 Targeting and Equity ......................................................................................................................... 62
6.3 Program Implementation Process .................................................................................................... 64
7. Program Organization and Partnerships ................................................................................. 65
7.1 Program Organization ....................................................................................................................... 65
7.2 Partnership and partnership arrangement ....................................................................................... 66
7.3 Minimum Staffing Package ............................................................................................................. 68
Draft- One WASH Program Document Phase II Updating- May 2010
NATIONAL WASH COORDINATION OFFICE
5
8. Assessing Capacity ................................................................................................................... 70
8.1 Introduction ...................................................................................................................................... 70
8.2 Approach to Capacity Building.......................................................................................................... 71
8.3 Guidelines and manuals .................................................................................................................... 72
8.4 Systems and Institutions ................................................................................................................... 72
8.5 Operation and Management (O&M) ................................................................................................ 73
8.6 Planning, procurement, financial management and monitoring ..................................................... 73
8.7 Strengthening private sector capacity .............................................................................................. 74
8.8 Gender Equity and Mainstreaming ................................................................................................... 74
9. One WASH National Program Phase II Strategy (and beyond) ............................................... 74
9.1 Background ....................................................................................................................................... 74
9.2 Current state of WaSH in Ethiopia .................................................................................................... 75
9.3 Strategy formulation ......................................................................................................................... 76
9.4 Organizational Direction ................................................................................................................... 77
9.5 GTP II and Sustainable Development Goals (SDG) ........................................................................... 77
9.8 OWNP Facilitation Modality ............................................................................................................. 89
9.9 OWNP Results Based Framework-2018-2020 .................................................................................. 89
9.10 OWNP Stage 2 Structure................................................................................................................. 90
9.11 Guidelines ....................................................................................................................................... 90
10. Existing and New Strategic Approach to WASH (2018 to 2030) ............................................. 91
10.1 Short Term Recommendation ........................................................................................................ 91 10.1.1 Enhancing the Enabling Environment 91 10.1.2 Strengthening Integration, Harmonization, Alignment and Partnership 94 10. 1.3. Maximizing availability and efficient use of human and financial resources 95 10.1.4 Capacity development for improved delivery of WASH services at all levels 95 10.1.5 Water Utilities 96 10.1.6. Strengthening NWCO and RWCOs 96 10.1.6 Organize Zone Coordination Offices 97 10.1.7 Strengthen Advocacy for WASH 98 10.1.8 Behavior Change Communication (BCC) 99 10.1.9 Develop Efficient Program Communication Strategy 100 10.1.10 Strengthen Monitoring and Evaluation for WASH 101 10.1.11 Strategize for Sustainable H&S Development in Rural and Urban Areas 101 10.1.12 Strengthen Community Involvement/Participation and Empowerment 102 10.1.13 Ensure Water Safety 103 10.1.14Involvethe Private Sectors in WASH 104
10.2 Long term recommendations ....................................................................................................... 104 10.2.1 Knowledge Management 104 10.2.2 Strengthen Groundwater and Surface Water Development 105 10.2.3 WASH Sector Reform 106 10.2.4 Resilient and Sustainable WASH Programme in Arid and Semi-Arid Drought Prone Areas of Ethiopia 107 10.2.5 Enhance the use of Renewable Energy 108
11. Technical Assistance and Academia Support ........................................................................ 110
11.1 Enhancing Technical Assistance.................................................................................................... 110
11.2 Enhancing the integration of WASH Training Centers of Excellence ............................................ 110

Draft- One WASH Program Document Phase II Updating- May 2010
NATIONAL WASH COORDINATION OFFICE
6
11.2.1 Introduction 110 11.2.2 Ethiopian Water Technology Institute (EWTI) 111 11.2.3 TVETCs and HSCs 111 11.2.5 Health and technology Universities 113
12. Program Monitoring and Review .......................................................................................... 114
12.1 Introduction .................................................................................................................................. 114
12.2 Key Performance Indicators ......................................................................................................... 114 12.2.1 Introduction 114
12.3 Reviews and Reporting Process .................................................................................................... 118 12.3.1 Review 118 12.3.2 Progress Meetings and Reporting 118
12.4 Reporting ...................................................................................................................................... 118 12.4.1 Reporting from Kebele to federal level 118 12.4.2 Reporting at federal level 119
12.5 Mobile Technology for Transmission of Data and Information ................................................. 121
13. Funding and Financial Management ..................................................................................... 122 13.1Introduction 122 13.2 Principles 122 13.3Assumptions 122
13.4 Funding Contributions .................................................................................................................. 123 13.5 Mitigation measures for budget availability and utilization risks 124
13.6 Financial management ................................................................................................................. 125 13.6.1 Introduction 125 13.6.2 Sources of Funding 125 13.6.3 Financial Management – Roles and Responsibility 126 13.6.4 Fund Flow and Channeling of Funds 128 13.6.5 Fund Allocation 130 13.6.6 Budgeting 131 13.6.7 Consolidated WASH Account at federal level 133 13.6.8 Bank Accounts 135 13.6.9 Financial Reporting 135 13.6.10 Fixed Assets 136 13.6.11 Preservation of Financial Documents 136 13.6.12 Internal Controls 136 13.6.13 Auditing 137 13.6.14 Taxation 138 13.6.15 Per diems 138
14. Procurement and Contract Management ............................................................................. 139
14.1 Introduction .................................................................................................................................. 139
14.2 Procurement Methods ................................................................................................................. 140
14.3 Program Procurement Requirements .......................................................................................... 141
14.4 Program Interventions .................................................................................................................. 143
15. OWNP Phase 2 Completion Program Costs and Budget ....................................................... 144
15.1 Introduction .................................................................................................................................. 144
15.2 Program Planning Process ............................................................................................................ 144
15.2Program Planning Process ............................................................................................................. 144 15.2.1 Introduction 144
Draft- One WASH Program Document Phase II Updating- May 2010
NATIONAL WASH COORDINATION OFFICE
7
15.2.2 Planning Parameters 145 15.2.3 Planning Criteria 145 15.2.4 Price Inflation 146
15.3 Access ........................................................................................................................................... 146 15.3.1 Rural and Urban Water Supply 146 15.3.2 Water Supply Beneficiaries 147 15.3.3 Rural water supply analysis methodology 148
15.4. Physical and Financial Plan .......................................................................................................... 151
15.5 Scenario -2 Physical Plan and Financial requirement for Rural Water Supply ............................. 154 15.5.1-New Rural Water Supply Facilities 154 15.5.2 Rural Water Supply Facilities to be rehabilitated 157 15.5.3-Financial Requirement for Water Supply 157
15.6 Institutional WASH ....................................................................................................................... 159
15.7 Urban Water Supply Physical and Financial Plan ......................................................................... 163
15.8 Rural and Peri-urban Sanitation Physical Plan .............................................................................. 171
15.9 Urban sanitation ........................................................................................................................... 172
List of Annexes ............................................................................................................................. 180
Annex 1 Scenario 1 ............................................................................................................................... 181
Annex 2 Scenario-II ............................................................................................................................... 195
ANNEX IV Strategic Action Plan, Phase II, OWNP-2018-2020 ............................................................. 232
ANNEX V WASH sector reform principles ............................................................................................. 246
ANNEX VI OWNP Result Framework-2018-2020 .................................................................................. 246
Draft- One WASH Program Document Phase II Updating- May 2010
NATIONAL WASH COORDINATION OFFICE
8
Abbreviations and AcronymsAAWSA Addis Ababa Water and Sewerage
Authority
AFD Action for Development
AfDB African Development Bank
AMREF African Medical and Research
Foundation
AWD Acute Watery Diarrhea
BADEA Arab Development Bank
BC Behavior Change
BoFED Bureau of Finance and Economic
Development
BOQ Bill of Quantities
BoWR Bureau of Water Resources
CAP Consolidated Annual WASH Plan
CFT Community Facilitation Team
CLTSH Community-Led Total Sanitation and Hygiene
CMP Community Managed Project
CSA Central Statistical Agency
CSO Civil Society Organization
CWA Consolidated WASH Account
DAG Development Assistance Group
DFID Department for International Development
(UK)
DRMFSS Disaster Relief Management and Food
Security Sector
EC Ethiopian Calendar
EMIS Education Management Information System
EPRU Emergency Preparedness and Response Unit
ESA Ethiopian Standards Authority
ESDP Education Sector Development Program
ETB Ethiopian Birr
EU European Union
EWTI Ethiopian Water Technology Institute
(formerly EWTEC)
EWTF Emergency WASH Task Force
FLOWS Forum for Learning and Sharing on Water
Supply and Sanitation
FMR Financial Monitoring Report
FRA Fiduciary Risk Assessment
FY Fiscal Year
GDP Gross Domestic Product
GIS Geographic Information System
GOE Government of Ethiopia
GLASS Water global annual assessment of
Sanitation and Drinking Water
GLoWS Guided Learning on Water and Sanitation
GPS Global Positioning System
GTP Growth and Transformation Plan
Ha Hectare
HCS Hararghe Catholic Secretariat
had Health Development Army
HEP Health Extension Program
HEW Health Extension Worker
HH Households
HMIS Health Management Information System
HOAREC Horn of Africa Regional Environmental
Center
HP Hand pump
HSC Health Science College
HSDP Health Sector Development Plan
IA Implementing Agency
ICB International Competitive Bidding
ICT Information and Communication Technology
IFMIS Integrated Financial Management
Information System
IPP Indigenous Peoples Plan
IP Implementing Party
IRC International Reference Center
IT Information Technology
JICA Japan International Cooperation Agency
JFA Joint Financing Agreement
JMP Joint Monitoring Program
JTR Joint Technical Review
KPI Key Performance Indicator
KWT Kebele WASH Team
Lcpd Liters per capita per day
M&E Monitoring and Evaluation
MDG Millennium Development Goal
MIS Management Information System
MFI Microfinance Institution
MOE Ministry of Education
MOFEC Ministry of Finance and Economic
Cooperation
MOH Ministry of Health
MOWE Ministry of Water and Energy
MOU Memorandum of Understanding
MSF Multi-Stakeholder Forum
MWA Millennium Water Alliance
NBE National Bank of Ethiopia
NCB National Competitive Bidding
Draft- One WASH Program Document Phase II Updating- May 2010
NATIONAL WASH COORDINATION OFFICE
9
NGO Non-government Organization
NWCO National WASH Coordination Office
NWI National WASH Inventory
NWTT National WASH Technical Team
O&M Operation and Maintenance
OCHA Office for Coordination of Humanitarian
Assistance
ODF Open Defecation Free
OFAG Office of Federal Auditor General
OWNP One WASH National Program
PASDEP Plan for Accelerated and Sustained
Development to End Poverty
PCDP Pastoralist Community Development Project
PDA Personal Digital Assistant/Tablets
PFM Public Financial Management
PMU Program Management Unit
PoA Power of Attorney
PTA Parent Teacher Association
PV
QA
Photovoltic
Quality Assurance
RiPPLE Research-inspired Policy and Practice
Learning in Ethiopia
RFP Request for Proposals
RPF Resettlement Policy Framework
RWCO Regional WASH Coordination Office
RWPMU Regional WASH Program Management Unit
SAP Strategic Action Plan (Sanitation)
SLTSH School-led Total Sanitation and Hygiene
SNNPR Southern Nations and Nationalities People’s
Republic
SNV Netherlands Development Organization
SP Service Provider
SSAP Self-Supply Accelerated Program
SSWG Self-Supply Working Group
SWAp Sector wide Approach
TA Technical Assistance
ToFED Town Finance Office
TOR Terms of Reference
TSG Town Support Group
TVETC Technical and Vocational Training College
TWB Town Water Board
TWU Town Water Utility
UAP Universal Access Plan
UNESCO United Nations Education, Science and
Cultural Organization
UNICEF United Nations Children’s Fund
USD United States Dollar
UWSSP Urban Water Supply and Sanitation Project
WASH Water, Sanitation and Hygiene
WASHCO Water, Sanitation and Hygiene Committee
WASH
MIS
Water, Sanitation and Hygiene Management
Information System
WHO World Health Organization
WIF WASH Implementation Framework
WoFEC Woreda Finance and Economic Cooperation
WPMU WASH Program Management Unit
WRDF Water Resources Development Fund
WSG Woreda Support Group
WSP Water and Sanitation Program (World Bank)
WSSP Water Supply and Sanitation Project
WWT Woreda WASH Team
Draft- One WASH Program Document Phase II Updating- May 2010
NATIONAL WASH COORDINATION OFFICE 10
Glossary
Advocacy - activities undertaken to persuade and mobilize people/decision makers to take action.
Behavior change - in hygiene and sanitation, behavior change refers to practicing safe disposal of feces through
the construction and consistent use of improved latrines by all family members, handwashing with soap (or
substitute) and water at critical times, and safe transport, treatment, storage and handling of household drinking
water.
Borehole depths - The term “shallow” in Ethiopia is used to refer to a borehole up to about 60m in depth;
“medium” depth refers to 60-150m; “deep” boreholes are drilled up to about 450m or more.
CLTSH - Community-Led Total Sanitation and Hygiene is Ethiopia’s version of CLTS is a triggering tool to mobilize
communities embark on construction of improved latrine and use, promotion of hand-washing practices with
soap (or substitute) and water at critical times, and safe water handling and treatment at the household level,
are also addressed along with the drive to achieve ODF status.
CMP – Community Managed Project - WASH projects managed by trained and recognized WASHCOs with
support from service providers such as MFIs.
Gender – the socially constructed definition of men and women, to be differentiated from sex, which is the
biological characteristics of males and females and does not only refer to females. Gender is determined by tasks,
functions and roles attributed to males and females in society and in public and private life.
Hygiene - practices associated with ensuring good health and cleanliness. This includes safe human excreta
disposal (ODF), hand washing with soap at critical times most notably after defecation or before contact with
food and strict observation of the safe drinking water chain.
Ignition (also called triggering) - the process wherein an outside facilitator mobilizes communities to take action
to change their hygiene and sanitation behavior.
Improved drinking water supply- Water supply system such as -well or bore hole or protected spring, protected
dug well and rain water-collection, properly constructed, treated and piped into dwelling yard or plot, public tap,
or standpipe, tube
Improved Sanitation Facility - A sanitation system that is safe, clean and cleanable, sealed to discourage
exposure to the flies, other animals and the environment as well as promote dignity and privacy.
Joint Technical Review - a semi-annual review process that brings together the government and major WaSH
Development Partners to review program implementation including progress and challenges. These reviews
provide an excellent opportunity for “big picture” learning and strategic problem solving
Model Household - a household that fulfils at least 11 of the 16 HEP packages that include access to and use of
latrine, preparation of waste water seepage pits, hand washing, water storage and treatment facilities.
Multi-Stakeholder Forum - an annual event that brings together stakeholders from government (including
representatives from the four signatory Ministries), Development Partners, civil society organizations, and the
private sector to review progress in the WASH sector and to agree on key strategic undertakings to be jointly
pursued during the year ahead. The MSF is designed to improve communication between stakeholders, as well
Draft- One WASH Program Document Phase II Updating- May 2010
NATIONAL WASH COORDINATION OFFICE 11
as supporting the mutual objectives of coordination, harmonization and alignment among partners across the
implementing sectors
Offsite Sanitation. A water-borne sanitation system linked to a sewer or septic tank/cesspool whereby the sludge
deposit of human excreta is pumped or otherwise transferred to a treatment system at a different location.
Onsite Sanitation - A sanitation system whereby excreta are contained at the same location as the toilet; either
in a pit, chamber, vault or septic tank.
Open defecation free (ODF) - an environment wherein no feces is openly exposed to the air. It describes a state
in which all community members practice use of latrine at all times and a situation wherein no open defecation
is practiced at all. ODF is a term used in CLTSH to describe the attainment of 100 percent latrine coverage and
use by all families in a village, including small children.
Procurement “contract”: WASH program Consultancy, Goods and Works legally binding procurement
arrangement entered into on behalf of the region, Woreda and or Zone. This can range from a very formal and
structured contractual agreement document, to a hardcopy for electronic for service, contract and purchase
order, to a binding verbal commitment, and so on.
Pre-ignition/triggering - A process comprises preparations made to mobilize villagers. Pre-ignition activities
include a strategic selection of kebeles and villages, meeting local gatekeepers and fixing appropriate date, time
& place for community ignition.
Resettlement Area – An area where people have been recently resettled as a result of actions by government
agencies or private entities for agricultural, industrial or infrastructure development.
Sanitation Action Plan SAP –A plan to promote or activate sanitation program in rural and urban areas and in
domestic and institutional settings.as well as hand washing and safe drinking water handling in the home. The
urban aspects of the SAP address peri-urban areas, small towns and informal settlements where on-site solutions
can be applied.
Social/ Sanitation marketing - an approach that focuses on improving formal and informal supply chains,
products and services to expand the delivery of affordable basic sanitation, coupled with the application of
commercial marketing techniques to stimulate demand to increase the number of households investing their
own resources to build and maintain an improved sanitation facility.
Safe water: Safe water is that drinking water which is free from pathogenic organisms, toxic substances, an
over dose of minerals and organic materials as well as that with pleasant taste, free of color, turbidity and odor.
Safe water chain - Protecting water at the source is the first critical step in a multiple-barrier approach including
application of household water transport, point of use treatment and safe storage of drinking water until
consumption.
Safe water management – The protection of water at source, operation and management of systems and
management of drinking water at home (including the practices of household water treatment, safe storage and
use).
Self-Supply - Improvement to water supplies developed largely or wholly through user investment by households
or small groups of households”. Self-supply involves households taking the lead in their own development and
investing in the construction, upgrading and maintenance of their own water sources, lifting devices and storage
Draft- One WASH Program Document Phase II Updating- May 2010
NATIONAL WASH COORDINATION OFFICE 12
facilities. A key characteristic of Self Supply is the ladder of incremental improvements in steps that are easily
replicable and affordable to users, linked when necessary to microfinance and/or water from productive use.
Sub-city/Kebele Development Committee - The Sc/KDC is an institution that will be engaged in WASH activities
in its respective Sub-city or Kebele. The composition is: Representative of Kebele administration, Health
Extension Worker, School community members, representatives of youth and women associations
Total sanitation - A situation where no open defecation is practiced and in which the cycle of fecal contamination
through vectors including flies, fingers, animals, feet, wind, flood and rain runoff has been broken.
Town/City WaSH Steering Committee (T/CWSC) - The Town/City cabinet serves as the WASH Steering
Committee.
Town/City Water Board (T/CWB) - The T/CWB is established as per regional proclamations and functions as the
board of management for town/city water supply and sewerage (liquid waste management) services. In most
instances, the Utility Manager is a member of the Board and serves as Board Secretary.
Town/City WaSH Technical Team (T/CWTT) - The T/CWTT is established by the town/city administration or
town/city WASH Steering Committee and consists of mainly representative from the town/city administration
(municipality), the Water Board, Town’s Finance and Economic Development, utility for WSS, health and
education desk personnel. The Chairperson is designated by the establishing authority.
Water Supply and Sewerage Utilities (WSSU) - The WSSU is an existing institution that is responsible for the day-
to-day operation and management of water supply and liquid waste management systems.
Unimproved water supply - use of unprotected dug well, unprotected spring, cart with small tank, or drum,
tanker truck, surface water (river, Dam, Lake, pond, stream, canal, irrigation, and channel).
Unimproved sanitation facility - A fixed point traditional latrine system made from local materials with an
unsustainable feature and that which does not satisfy the criteria for an improved sanitation facility.
Verification - a process of endorsing that a given Village/Kebele/Community is totally free of open defecation
practices (ODF).
WaSH Strategic Plan - The WASH Strategic Plan sets out woreda strategies, targets and schedules for achieving
WaSH coverage over a 5-year period.
WaSH Annual Planned Budget - The Annual WaSH Plan sets out the specific activities, outputs and expenditures
for the year ahead. It incorporates the planned WaSH activities, investments and targets of all WaSH
implementers – including other government programs, and the programs of NGOs that are active in the sector.
The Woreda WASH Budget includes funds coming to, or allocated by, the Woreda Administration for WASH
activities.
Water Quality Monitoring - systematic verification of water quality standards through laboratory/or spot
analysis of samples taken at critical points of the water supply system.
Water Quality Surveillance - watching and protecting drinking water from potential source of contamination
through sanitary survey and water quality analysis of samples taken at different points.
Draft- One WASH Program Document Phase II Updating- May 2010
NATIONAL WASH COORDINATION OFFICE 13
1. Executive Summary
1.1 Introduction
Before and after Phase I significant changes have taken place especially after the transition reached to a more
integrated water, sanitation and hygiene program. The most important is the signing of MoU by sector ministries
to work together for One WASH National Program, the design of a guiding document, an implementation
framework and a Consolidated WASH Account together with prominent partners in WASH improvement. The
necessary organizations at all levels, the necessary human, material and financial resources and systems have
been gradually established.
The One WASH National Program (OWNP), hereafter referred to as the Program, operationalizes the
Memorandum of Understanding (MoU) and the WASH Implementation Framework (WIF) signed by the
Ministries of Water and Energy, Health, Education and Finance and Economic Development in November 2012
and March 2013, respectively. The Program is the Government of Ethiopia’s (GoE) main instrument for achieving
the goals set out in the Growth and Transformation Plan (GTP). In the GTP, targets for access to safe water
supply are 98%, 100% for rural and urban areas, respectively.
The targets for sanitation and hygiene set out in the Universal Access Plan (UAP) are that all Ethiopians will have
access to basic sanitation, while 77% of the population practice handwashing at critical times, safe water
handling and water treatment at home, and that 80% of communities in the country achieve open defecation
free (ODF) status.
1.2 Program Description
1.2.1 Development Objective
The Program’s Development objective is to contribute to improving the health and well-being in rural and urban
areas by increasing water supply and sanitation access and the adoption of good hygiene practices in an
equitable and sustainable manner.
1.2.2 Intermediate Objective
The intermediate Objective of the Program is to achieve increased coverage of water supply and sanitation in
rural and urban areas in Ethiopia in line with the GTP 2010-2015.
1.3 Guiding Principles
The WIF sets out four guiding principles that will govern the implementation of the Program:
• Integration of the water, health, education and finance sectors
• Alignment of partners’ activities with those of the Government of Ethiopia
• Harmonization of partners’ approaches and activities
• Partnership between implementing parties at all levels
1.4 Program Pillars
The Program’s activities rest on three overarching domains or pillars:
1. Creating an enabling environment and good governance
Draft- One WASH Program Document Phase II Updating- May 2010
NATIONAL WASH COORDINATION OFFICE 14
2. Maximizing availability and efficient use of human and financial resources to create demand for better
WASH services
3. Capacity development for improved delivery of WASH services at all levels
The Program will be implemented as a multispectral SWAp involving the water, education, health and finance
and economic cooperation sectors as well as CSO and the private sector. During Phase II attempts will be made
for more and increasing alignment by partners with Government systems for planning, budgeting, procurement,
financial management, and monitoring and reporting.
The Program will address disparities in WASH coverage among and within regions and urban areas. Moreover,
it will seek to improve aid effectiveness and promote institutional reforms, with particular focus on capacity
development at all level but more so at woreda, kebele and community levels. WASH training will be increasingly
professionalized and institutionalized through the establishment of capacity building units at regional level to
support and train sector staffs at all levels.
The Program will be implemented in a cascading, stepped approach according to agreed prioritization criteria,
which include present water supply and sanitation coverage, size and type of WASH activities, capacity needs
and present resources, among others.
1.5 Phasing
The Program was planned to have two Phases: Phase I from July 2013 to June 2015 and Phase II from July 2015
to June 2020. Phase I is the result of the evolution of WASH in Ethiopia where programmatic approach has
started to be implemented. During Phase I remarkable development have taken place with respect to the
establishment of institutions at Federal, regional, woreda levels and systems for increasing harmonization and
alignment among and between development partners and GoE. Although limited to only CWA supported areas
working procedures are fully established and become operational at all levels. It is during phase I that
consolidated WASH account (CWA) was established through contribution by government and development
partners. Accordingly, and based on the planning process established fund was dispersed to all federal, regional
and woredas administration to execute their plans. Physical plans, utilization of funds, preparation for phase II
based on the learning from phase I was successfully carried out.
The Phase I duration is already finalized and the program reviewed. As planned the learning and
recommendation from Phase I is used to design Phase II OWNP plan. Phasing have allowed to adjust the
program based on new development such as government policies goals and strategies. During Phase II, the
program will follow GTP II strategic directions which indicate higher service levels than Phase I. Phase II of the
Program will also follow a mixed approach between what has been learned from Phase I which would take into
consideration in completing work began in Phase I and reaching any unachieved targets
During Phase II partners including CSOs, will be cajoled to increasingly align or harmonize their targets, plans
and activities, submit annual reports and participate in all OWNP established forums, joint reviews etc.. New
WASH programs/projects or new initiatives will be expected to be aligned with the Program’s principles,
approaches and plans.
The guiding principle of Phase II just like that of Phase I will be, “some for all, not all for some”, meaning that
unserved areas, communities and households will receive sustainable and resilient WASH services supported by
selecting perennial water sources and using resilient technology for pumping, storage and distribution of water
with O&M system established

Draft- One WASH Program Document Phase II Updating- May 2010
NATIONAL WASH COORDINATION OFFICE 15
1.6 Unit Cost for component
Unit cost for phase II is calculated for each technology mix using information and practices and average unit
rates collected from different international, bilateral and CSO organizations. Based on the average unit costs
analysis which was determined for each region, the regional cost for each technology is also calculated (see
Annex 1 for details) and table 32 for regional summery.
1.7 Capacity Building and Advocacy
During Phase II, capacity building activities will receive high priority starting from establishing a capacity building
unit at federal and regional level so that. Institutionalization will support systematic development of capacity
building initiatives in supporting regions, zones, towns, woredas, kebeles and communities to meet
implementation “readiness” criteria and to establish effective procurement, contract management and
supervision procedures and robust monitoring, information management and reporting systems.
Advocacy for the purpose of popularizing the OWNP and its principle, harnessing more partners to join the
OWNP, expanding learning and knowledge and enhancing participation of all sectors at all levels for one
common effort to promote behavior change activities.
Phase II will follow different policy priorities, targets, institutional roles and responsibilities and/or
implementation modalities; newly developed sector strategies such as the National Hygiene and Environmental
Health Strategy, Education Sector WASH Strategy, newly revised draft of the Water Resource Development
policy and strategy, Integrated Urban Hygiene and Environmental Health strategy and other relevant and timely
directives. Phase II will have a broadened Program scope to include such related activities as watershed and
water resources management, productive uses of water, environmental protection, climate resilience, etc. as
also stressed during the Phase I validation workshop.
1.8 Sanitation and Hygiene behavior change
Looking back at the development of sanitation and hygiene services, we found that the approaches which has
been used was not fully integrated with multi-sectoral programs such as nutrition and did not empower
communities themselves for a sustainable change. During phase II it is planned to establish a community
centered approach where prominent residents of the community such as religious leaders, women groups,
teachers and students will be fully engaged to spearhead the behavior change process, maintain changes and
ultimately make their community Open Defecation Free. (see guideline 10)
1.9 Appropriate Technology
The type of technologies used for water supply especially in rural areas may have to be diversified and simplified
with sustainability and resilience in focus. The focus only on wells/pumps and capping springs has limited the
potentials of other technologies and the use of other water resources such as surface water from rivers/streams,
from flood water and from the rain. Some of the water resources and technology that can be used to make
water accessible even if they are not resilient are rain water harvesting especially for schools with ample roof
area for harvesting; subsurface dams especially in the low lands where huge amount of flood water flaw during
the rainy season and self-supply. Solar energy has also proved to be useful in rural areas as it poses no or minor
operation and maintenance work compared with hand pumps or diesel pumps.

Draft- One WASH Program Document Phase II Updating- May 2010
NATIONAL WASH COORDINATION OFFICE 16
1.10 Program Components
OWNP - Program Components
The Program will include the following components:
1. Component 1: Rural and Pastoral WASH
1.1. Rural and Pastoral Water Supply
1.2. Rural and Pastoral Sanitation
2. Component 2: Urban WASH
2.1. Urban Water Supply
2.2. Urban Sanitation
3. Component 3: Institutional WASH
3.1. Health Facilities WASH
3.2. School WASH
4. Component 4: Enabling Environment, Program Management and Capacity Building
5. Component 5: Sustainable and climate resilient WASH services
5.1. Emergency preparedness, response and recovery WASH
5.2. Sustainable and Climate Resilient WASH
Rural and Pastoral Water supply
Estimated cost for rural and pastoralist water supply is 2,096 billion USD of which 934 million USD is for CR-
WASH. Activities by the water bureaus will include construction of new conventional water points and water
supply schemes and rehabilitating existing schemes. Furthermore, household dug wells and community dug
wells are expected to be constructed by households and communities through self-supply.
Rural and Pastoralist Sanitation
Estimated cost for rural and pastoralist hygiene and environmental sanitation is 286 million USD, of which 69
million USD is for CR-WASH.
Hygiene and environmental sanitation activities include motivating households and supporting institutions to
improve access to improved and unimproved latrines. Health Extension Workers and community-level members
of the Health Development Army will be instrumental in achieving sanitation and hygiene improvements at
household level.
Implementation of the Pastoral WASH sub-component will require close coordination and collaboration with
NGOs and emergency or CR-WASH activities to avoid duplication of effort and to make efficient use of available
experience and resources.
Urban and Pastoralist Water Supply
Estimated cost for urban and pastoralist water supply is USD 1,013 billion, of which 219 million USD is for CR-
WASH. Main activities include study and design, environmental and resettlement safeguards, immediate service
improvements and expansion and augmentation of water supplies.
Urban and Pastoralist Sanitation
Draft- One WASH Program Document Phase II Updating- May 2010
NATIONAL WASH COORDINATION OFFICE 17
Estimated cost for Urban and Pastoralist Sanitation is USD 500 million, of which 160 million USD for CR-WASH.
Sanitation and urban environmental improvements will include looking at sustainable, simple and affordable
systems such as constructing public toilet with multiple functions (cloth washing, bathing services in addition to
clean toilets) desludging equipment and facilities, management of wastewater, awareness creation and
empowering communities to look at their communities hygiene and sanitation conditions..
Institutional WASH - Estimated cost for institutional WASH for new construction and rehabilitation is 558 million
USD, of which 179 million USD is for CR.WASH. Activities include support to improving water supply and
sanitation facilities and hygiene practices at health institutions, which will be the responsibility of the Ministry
of Health (MoH) and regional and city health bureaus and woreda health office. The Ministry of Education (MoE)
and regional and city education bureaus and woreda education offices will be responsible for planning and
implementing WASH activities in schools. Regional/city water bureaus may provide technical assistance in the
design, construction and supervision of water supplies in institutions. The indicated amount includes USD to be
used for water quality monitoring. Doing so is expected to increase economy of scale and ease out
administration arrangements.
6.
Enabling Environment, Program Management and Capacity Building
- Estimated cost is 1.59 billion USD including M&E, advocacy and strengthening private institution in WASH
program, of which 491 million USD is for CR-WASH. This component includes support to improve skills and
capacity of the Program’s organizations and implementing parties at all levels to plan, manage and monitor
Program activities through training, post-construction management support, equipment, tools, and support to
monitoring and reporting. The Program will support a minimum staffing and resource package necessary to
effectively implement the Program at all levels to be determined by a capacity assessment at federal,
regional/city and town/woreda level.
Capacities of TVETCs and HSCs will be enhanced as one program of capacity building aimed to support training
of trainers, curriculum development and purchasing training equipment for workshops and laboratories.
Teaching institutions such as the Ethiopian Water Technology Institute (EWTI) and Universities will be involved
to train WASH professionals.
Sustainable and climate resilient WASH services
Emergency WASH
Emergency is an unfortunate happening in a country or society manifested in different ways. The most common
emergencies are flood, fire, draught, etc. In Ethiopia common emergencies are created during draught and
flood. . “Droughts” in Ethiopia have become a more frequent than used to be in the past. This creates water
shortages usually requiring water trucking which is estimated to be 35 times more costly, per year, than
annualized capital and O&M costs of fixed water systems, often involving very deep boreholes. Details of what
preparation needed is indicated under emergency component section 10.4.2.
Climate Resilient WASH:
This is a new component which has objectives focusing on health and well-being of draught affected rural and
urban areas. Although the program is also designed to address draught affected areas in the past, it will have
prominence and focus during phase II. In the process, attention will be given to look for more reliable water
Draft- One WASH Program Document Phase II Updating- May 2010
NATIONAL WASH COORDINATION OFFICE 18
source, use of modern and cost-effective techniques for assessing ground water potentials and expand service
levels not only for humans but also consider animals.
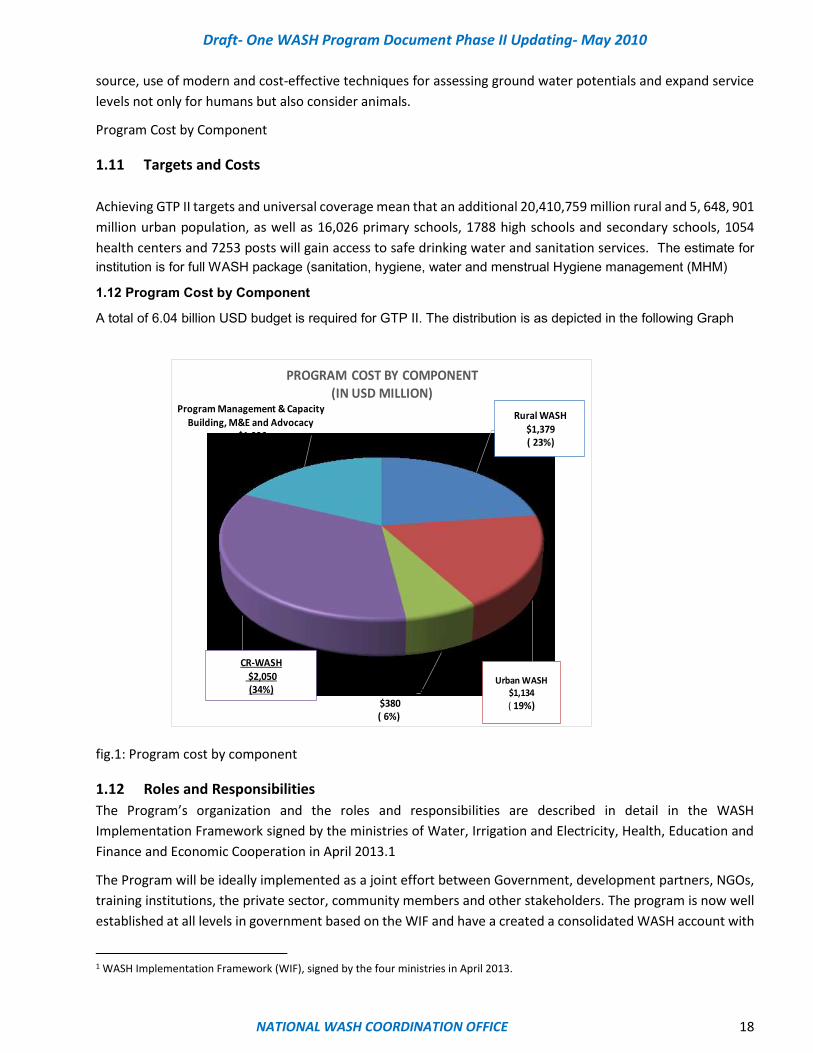
Program Cost by Component
1.11 Targets and Costs
Achieving GTP II targets and universal coverage mean that an additional 20,410,759 million rural and 5, 648, 901
million urban population, as well as 16,026 primary schools, 1788 high schools and secondary schools, 1054
health centers and 7253 posts will gain access to safe drinking water and sanitation services. The estimate for
institution is for full WASH package (sanitation, hygiene, water and menstrual Hygiene management (MHM)
1.12 Program Cost by Component
A total of 6.04 billion USD budget is required for GTP II. The distribution is as depicted in the following Graph
fig.1: Program cost by component
1.12 Roles and Responsibilities
The Program’s organization and the roles and responsibilities are described in detail in the WASH
Implementation Framework signed by the ministries of Water, Irrigation and Electricity, Health, Education and
Finance and Economic Cooperation in April 2013.1
The Program will be ideally implemented as a joint effort between Government, development partners, NGOs,
training institutions, the private sector, community members and other stakeholders. The program is now well
established at all levels in government based on the WIF and have a created a consolidated WASH account with
1 WASH Implementation Framework (WIF), signed by the four ministries in April 2013.
Rural WASH $1,379( 23%)
Urban WASH$1,134
( 19%)
Institutional WASH $380( 6%)
CR-WASH$2,050(34%)
Program Management & Capacity Building, M&E and Advocacy
$1,096( 18%)
PROGRAM COST BY COMPONENT(IN USD MILLION)

Draft- One WASH Program Document Phase II Updating- May 2010
NATIONAL WASH COORDINATION OFFICE 19
contribution by partners and government. Other partners, including bilateral and multilateral aid organizations
and NGOs, are expected to support the Program through other funding arrangements, as well as through
provision of technical assistance, supplies and other means.
• A National WASH Coordination Office (NWCO) is responsible for coordinating the planning and
implementation of the Program at federal, regional levels and harmonizing with bilateral, multilateral
and CSO organizations, which will consist of preparing a consolidated annual WASH plan, budget and
periodic reports. The NWCO will report to a National Steering Committee chaired by the Minister of the
Ministry of Water Irrigation and Electricity (MoWIE) and supported by the National WASH Technical
Team (NWTT). Implementation of the Program will be the responsibility of WASH Program Management
Units (WPMUs) in the ministries of Water Irrigation and Electricity, Health, Education and Finance and
Economic Cooperation.
• This arrangement extends down to the regions which has the same structure with that of the federal
level.
• Strengthening the roles of the Zonal structure has become mandatory In order to systematize
intervention programs, monitoring results, organizing capacity building programs, reviewing sector
progress and coordinate learning to woredas and kebeles. Zonal structures will play an important
intermediary role between the region and the towns and woredas for planning, monitoring, reporting,
disseminating information and providing technical assistance. For best result zones will also have a Zonal
WASH Coordination Office and Zonal WASH Management Team with similar functions as their regional
counterparts.
• In woredas and towns, planning and implementation of the Program will be coordinated by a dedicated
Woreda WASH Team (WWT) consisting of members from the water, health, education, finance offices,
agriculture, women’s affairs and NGO representatives. The Woreda WASH Team will report to a WASH
Steering Committee appointed by the Woreda Cabinet or Town Board. The WWT also supports the
Kebele WASH Team (KWT) in the preparation of annual plans and render capacity building to HEWs and
WHDA and others at that level
• At community level, WASH Committees (WASHCOs) consisting of elected community members will be
formed to undertake planning, O&M and in some cases construction of small scale improved water
supply and sanitation facilities. It is important that women are well-represented and are elected to serve
as officers in WASHCOs.
• Other stakeholders such as CSO/NGOs and community members will be involved in planning,
monitoring and contribution of labor and finance for effective implementation of the OWNP in Ethiopia.
Draft- One WASH Program Document Phase II Updating- May 2010
NATIONAL WASH COORDINATION OFFICE 20
2. Introduction and Background
2.1 Introduction
This Program Document has been prepared with the support of the Government of Ethiopians intended to serve
as a guide to implementing the OWNP, hereafter referred to as the Program. This document is not in itself a
detailed implementation manual for all aspects of the program but provides for technical assistance to adapt or
prepare implementation strategy, guidelines and manuals as required in financial management, procurement,
scaling up hygiene and sanitation behavior change and M&E, among others. In addition, provision is made for
preparing detailed strategies and implementation plans based on GTP II targets and have considered gender
equity, climate screening, social inclusion and communication, among others. A set of Annexes are also included
to assist with implementation of the program.
2.2 The Global Context
Global milestones in the development of approaches that form the legacy of today’s WASH policies and programs
include the so-called Dublin Principles, followed by the UN MDG targets and now the SDG goals which were
presented and ratified at the World Summit in Rio de Janeiro in 1992at the UN General Assembly in 2000 and
2015 respectively. The premises for the international concern is that Safe water and basic sanitation are basic
needs of people’s daily life and they have become urgent requirements for protection and improvement of people’
health and living conditions, as well as for national economic development. Water-related diseases are the most
common causes of illness and death among the poor of developing countries.
In response to the above challenges, the UN General Assembly has recognized that the supply of safe and clean
drinking water and basic sanitation facilities are not only human rights, but also essential to the full enjoyment of
life.”2.
Although quite a remarkable change was recorded globally during MDG period, the effort was not fully successful;
especially with sanitation. For this reason the global program for WASH services has to extend the effort up to
2030 and the program name is changed from Millennium Development Goals (MDG) to Sustainable Development
Goals (SDG) with 17 goals and 169 targets.
Goal 6 aims to ‘Ensure availability and sustainable management of water and sanitation for all’ comprising six
technical targets relating to:
a) Drinking water: (Target 6.1), “by 2030, achieve universal and equitable access to safe and affordable
drinking water for all,”
b) sanitation and hygiene: (Target 6.2), By 2030, achieve access to adequate and equitable sanitation and
hygiene for all and end open defecation, paying special attention to the needs of women and girls and
those in vulnerable situations
2Ibid, 2010
Draft- One WASH Program Document Phase II Updating- May 2010
NATIONAL WASH COORDINATION OFFICE 21
c) wastewater management (Target 6.3,)by 2030, improve water quality by reducing pollution, eliminating
dumping and minimizing release of hazardous chemicals and materials, halving the proportion of
untreated wastewater and substantially increasing recycling and safe reuse globally
The 2030 global agenda for water and sanitation services is not merely for the sector but also to support the
achievement of other targets through WASH services.
Table 1: SDG Goals supported by WASH
No Goals SDG targets
1 Reducing poverty and achieving universal access to basic services (Targets 1.1
and 1.2); ending all forms of malnutrition
2.2
2 Ending preventable child deaths, combating neglected tropical diseases and
waterborne diseases, and achieving universal health coverage
3.2,3.3,3.8,3.9
3 Providing safe and inclusive learning environments 4a
4 Ending violence against women and girls and reducing gender inequality 5.2,5.4
5 Ensuring adequate, safe and affordable housing for all 11.1
6 Reducing deaths caused by disasters.3 11.5
During MDG, global monitoring has focused on access to drinking water, sanitation and hygiene at the household
level. While household access remains the primary concern, the SDG program has recommended monitoring the
institutional settings, including schools, health care facilities and workplaces. The SDG targets 6.1 and 6.2 referring
to ‘universal access and ‘for all’ further reinforce the importance of WASH in all settings, not only the household.
Government of Ethiopia has a plan to join the lower middle-income countries by 2025, which in essence has
become a driving force for the water supply and sanitation sub sector.4
As stated in several studies, the supply of improved water hygiene and sanitation facilities (WASH) not only
facilitates health and values (dignity, equity, compassion solidarity and respect) but also contributes in economic
and financial savings such as in reducing absence from work, health care costs, protecting the environment and
reducing time spent collecting and transporting water.
A study by WHO revealed that each USD 1 invested would yield an economic return of between USD 3 and USD
34. Households with improved water and sanitation services suffer less morbidity and mortality from water,
sanitation and hygiene related diseases.
3United Nations General Assembly, ‘Resolution adopted by the General Assembly on 25 September 2015: 70/1.
Transforming our world: The 2030 Agenda for Sustainable Development’
, A/RES/70/1, 21 October 2015, <www.un.org/ga/search/view_doc.asp?symbol=A/RES/70/1&Lang=E>. 3 See
<www.unwater.org/publications/publications-detail/en/c/429651>. 4 See <www.unwater.org/gemi/en>. 5 See
<www.who.int/water_sanitation_health/monitoring/investments/glaas/en
4MDG report (2010), MOH
Draft- One WASH Program Document Phase II Updating- May 2010
NATIONAL WASH COORDINATION OFFICE 22
2.3 The National Context on WASH
In Ethiopia, the coverage of water, sanitation and hygiene is very low compared with other African countries.
According to the National WASH Inventory (NWI)5, in 2011 national access to water supply was 52.1% and to
sanitation was 63%. This figure has changed for water supply as it has reached 67% by 2015 and mate the MDG
goals but sanitation did not. According to studies by EDHS 2016, the improved sanitation access for Ethiopia is
very low. In both cases there is still a significant gap between the above targets and actual coverage in that millions
of Ethiopians still lack improved water and basic sanitation facilities, and very few people regularly wash their
hands with soap and water at critical times
Water supply, sanitation and hygiene are no longer addressed separately, but as an integrated package aimed at
achieving agreed targets. Government is now committed to implementing a Sector Wide Approach (SWAp)
through the One WASH National Program, which is also supported by a number of Development Partners and
NGOs.
According to a recent report by the JMP6 Ethiopia is among the 45 countries in the world with sanitation coverage
status below 50% and one of 27 countries in the world where more than a quarter of the population still practice
open defecation. However, since 1990, the proportion of the population practicing open defecation has declined
at a rate of around 3.5% annually. Introduction of the Community Led Total Sanitation and Hygiene (CLTSH)
approach and the HEP effort in promoting community and household sanitation and hygiene has provided a
strategy to reach more communities to end open defecation through self-built toilets and promoting hand
washing and safe water handling.
GoE has set out its goals in the GTP, which identifies water and sanitation as priority areas for achieving sustainable
growth and poverty reduction. In line with the GTP II, GoE has prepared a Universal Access Plan (UAP), with the
following targets:
• Provide rural water supply access with GTP II minimum service level of 25 l/c/d within a distance of 1 km
from the water delivery point for 85%of the rural population of which 20% are provided with RPS.
• Provide urban water supply access with GTP II minimum service level of 100 l/c/d for category 1 town/city,
80 l/c/d for category 2 town/city, 60 l/c/d for category 3 town/city, 50l/c/dfor category 4 towns/cities up
to the premises and 40l/c/d for category 5 towns/cities within a distance of 250 meters with piped system
for 75% of the urban population. Carry out study and design of urban waste water management system
for 36 category 1,2,3 towns/cities and build waste water management infrastructure for 36 towns /cities
with a population of 200,000 and more.
• Decrease rural water supply schemes non-functionality rates to 7%and decrease NRW from 39 % to 20%
To facilitate achievement of the GTP and UAP targets, GoE has prepared a WASH Implementation Framework
(WIF) to provide guidance for implementing the Program defining the roles and responsibilities of major
stakeholders in the WASH sector.
5The National WASH Inventory is described in more detail in Section 3.5.
6Progress on Sanitation and Drinking Water-2013 update, JMP.
Draft- One WASH Program Document Phase II Updating- May 2010
NATIONAL WASH COORDINATION OFFICE 23
2.4 Policy and Program Initiatives
The Ministry of Water Irrigation and Electricity has introduced policies, legislation and strategies such as National
Water Resource Management Policy (1998), Water Sector Strategy (2000), Water Sector
Development Program (2002), Water and Sanitation Access Plan (UAP) (2005), Memorandum of Understanding
signed by three sector ministers (MoU, 2006) and a revised MoU, signed by four sector ministers in November
2012. MoWIE has also prepared guidelines for gender mainstreaming in the water and energy sectors (2012).
Health Sector Development Programs (HSDPl, ll, lll and lV) in line with the Plan for Accelerated and Sustained
Development to End Poverty (PASDEP), and now the Growth and Transformation Plan of 2011-2015 (GTP I) and
2015-2020 (GTP II) has been introduced to address the water, hygiene and sanitation problems of the country.
One of the main innovations of the HSDP has been the Health Extension Program (HEP) that aims to reach
universal coverage of primary health care and improve the quality of health services in rural areas and partly in
the urban areas.
Recently, the 5th Education Sector Development Plan was launched with the aim to reach universal access to WASH
in Schools as per the GTP II standard. The Government is prepared to continue efforts to expand access to WASH
in a bid to achieve universal primary education. Over the years, considerable progress has been made to expand
the reach of WASH facilities by constructing schools to reduce the distance between schools and homes.7
In the last 10 years, GoE has accelerated its commitment to address the country’s water, sanitation and hygiene
issues. The first UAP in Amharic and English (2005), the second UAP (2011), the National Sanitation Action Plan-
SAP in 2011, National WASH Inventory (2013) and the National Drinking Water Quality Monitoring Strategy (2010)8
, the national Urban Hygiene and Environmental Health Strategy (20116), the National Hygiene and Environmental
Health Strategy (2017) and the school WASH Strategy have been prepared and are operational to support the
OWNP action plans set at all levels in the country
2.5 The Evolution of WASH in Ethiopia
2.5.1 Introduction
The demand for water supply and the management of sanitation is directly influenced with the population growth,
industrial development and settlement pattern.
As per the forecast made by CSA, the Ethiopian population is growing at an average rate of 2.6 percent per year
implying that with this rate the population may exceed 130 million by 2030 (CSA, 2013) and 142 million by 2037,
seven years after the SDG. The urban population is also growing at a rate of 4.8 percent and doubling time to be
only fifteen years. New job opportunities in the services sector, construction, and industry believed to hasten the
rural urban migration contributing to the increment on the number of small towns from 534 in 1994 to about 973
in 2011.9
7 School WASH Strategy, 2017 8As of July 2013, the National Drinking Water Quality Monitoring Strategy has not yet been approved by the ministries of Health and
Water and Energy. 9 Background paper for water resource management policy review, Draft, 2017
Draft- One WASH Program Document Phase II Updating- May 2010
NATIONAL WASH COORDINATION OFFICE 24
2.5.2 Evolution of the One WASH National Program
Background
The Ethiopian government has been very keen to have a fundamental change in people’s health and wellbeing for
decades. This natural wish is manifested through its design of the national constitution, issuance of different
policies developed by different ministries echoing their contribution toward improvement in water, sanitation,
health, nutrition and control of communicable and non-communicable diseases.
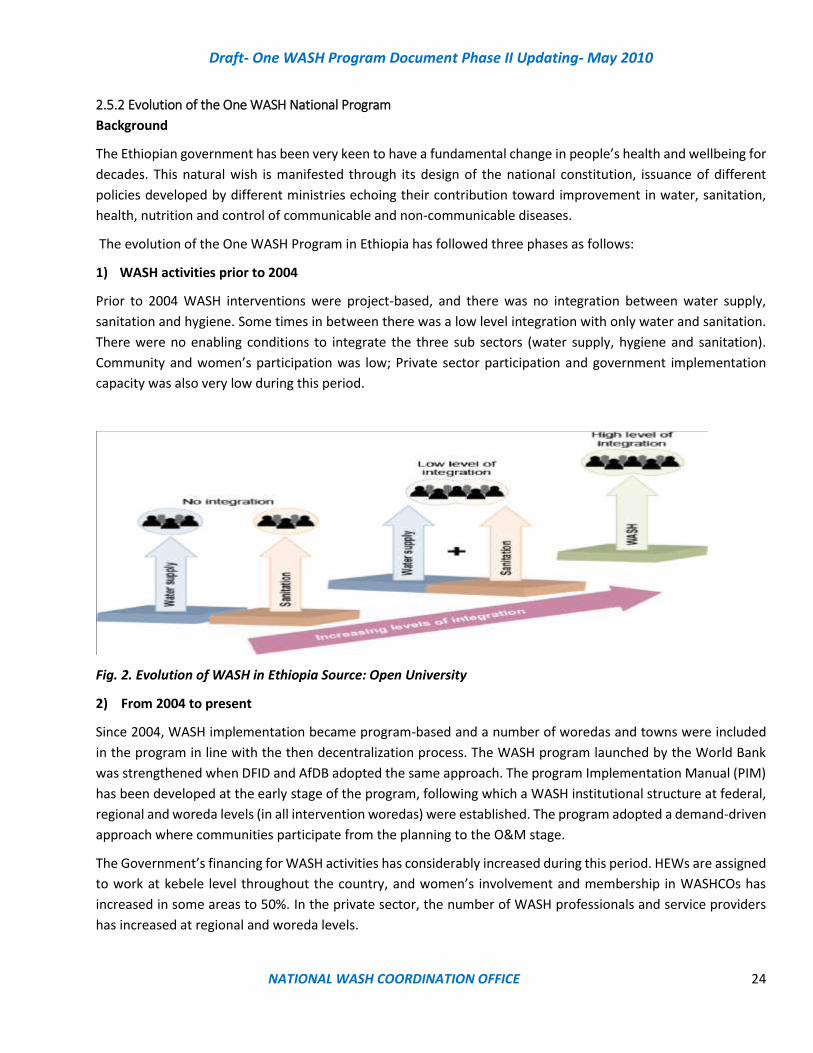
The evolution of the One WASH Program in Ethiopia has followed three phases as follows:
1) WASH activities prior to 2004
Prior to 2004 WASH interventions were project-based, and there was no integration between water supply,
sanitation and hygiene. Some times in between there was a low level integration with only water and sanitation.
There were no enabling conditions to integrate the three sub sectors (water supply, hygiene and sanitation).
Community and women’s participation was low; Private sector participation and government implementation
capacity was also very low during this period.
Fig. 2. Evolution of WASH in Ethiopia Source: Open University
2) From 2004 to present
Since 2004, WASH implementation became program-based and a number of woredas and towns were included
in the program in line with the then decentralization process. The WASH program launched by the World Bank
was strengthened when DFID and AfDB adopted the same approach. The program Implementation Manual (PIM)
has been developed at the early stage of the program, following which a WASH institutional structure at federal,
regional and woreda levels (in all intervention woredas) were established. The program adopted a demand-driven
approach where communities participate from the planning to the O&M stage.
The Government’s financing for WASH activities has considerably increased during this period. HEWs are assigned
to work at kebele level throughout the country, and women’s involvement and membership in WASHCOs has
increased in some areas to 50%. In the private sector, the number of WASH professionals and service providers
has increased at regional and woreda levels.
Draft- One WASH Program Document Phase II Updating- May 2010
NATIONAL WASH COORDINATION OFFICE 25
However, implementing WASH activities in Ethiopia face a number of challenges:
• Activities are not fully harmonized, as some NGOs and other organizations are implementing WASH
projects as a free service without community or user contributions;
• Fulfilling individual donor’s financial and procurement procedures are difficult and time consuming;
3) The One WASH National Program
To address the challenges faced by the WASH sector, the Government has initiated and supported the
establishment of the Program. The program design which features one plan, one budget and one report has
become functional since 2013. During phase I, therefore the four principles stated in the WIF: - establishing the
organization, defining the roles and responsibilities of sectors and partners; creation of a consolidated WASH
account; planning; budgeting, distribution of fund, procurement and reporting mechanisms are firmly established.
During Phase II the program will follow the GTP II plans and targets and will also address some of the pertinent
activities that were not addressed in Phase II. Some of the areas which needs further strengthening are capacity
building, bringing all NGOs working in WASH to be more aligned with the NW program; enhancing joint
participatory planning practices at all levels; etc.
• The program will seek horizontal coordination with stakeholders outside the MOU signatories to work
together to support sustainable and resilient WASH services to all people in Ethiopia. These includes
Ministry of Agriculture and Natural Resources; Ministry of Livestock and Fishery; Ministry of Environment,
Forest and Climate Change; Ministry of Federal and Pastoralist Development Affairs; and National Disaster
Risk Leadership Commission, the new institutional arrangement that requires broader engagement of
stakeholders is indicated in the following figure: 10
• The WIF provides the framework and guidelines for implementing the Program, which is in turn based on
the Growth and Transformation Plan (GTP) and updated resource requirements in the WASH Universal
Access Plan (UAP), including the SAP. It is expected that donor funding will to an increasing extent be on-
plan and on-budget and channeled through a Consolidated WASH Account (CWA) at federal level.
• The cornerstone of the Program is the Consolidated Annual WASH Plan (CAP), which includes a budget.
Progress in achieving the plan goals will be reported in quarterly and annual progress and utilization reports
at federal, regional, city, zone, woreda and town levels.
10 MoWIE (2017) Development of sustainable water supply, sanitation and hygiene program in draught prone areas of Ethiopia, final version ,

Draft- One WASH Program Document Phase II Updating- May 2010
NATIONAL WASH COORDINATION OFFICE 26
3. Institutional Roles
3.1 Institutional Context
3.1.1 Introduction
A unique feature of the WIF is that it has been agreed between four ministries whose roles and responsibilities
are further defined in an Memorandum of Understanding (MoU) signed in November 2012, to support an
integrated and resilient One WASH National Program that addresses the needs of rural, urban and pastoralist
communities, schools and health posts in a more integrated manner and reduces the administrative
fragmentation of WASH service delivery.
3.1.2 Obligations of Signatory Ministries
The specific roles and responsibilities of the four ministries in implementing the Program are described in the
MOU where MoWIE, MoH, MoE and MoFEC have committed themselves to:
• Assign an appropriate representative to the National WaSH Technical Team (NWTT)
• Establish a WASH Program Management Unit (WPMU) and designate a WASH focal person to liaise
between the WPMU and the National WASH Coordination Office (NWCO)
• Prepare and submit to the NWCO and to NWTT an annual WASH Plan of Actions
• Conduct joint review and monitoring of programs
3.1.2.1 Ministry of Water Irrigation and Electricity
The Ministry of Water Irrigation and Electricity (MoWIE) at federal level is responsible for water policy,
coordination and monitoring. Implementation is decentralized to regional, woreda and in some cases community
level. In general design and contracting of piped water supply schemes are managed at regional water bureau
level, before handing over maintenance responsibility to woredas or towns11. Implementation of schemes such as
hand-dug wells or spring catchments is managed by the Woreda Water Offices or communities in Community
Managed Projects (CMP).
11 Top-down designed schemes with limited consultation that are then handed over to woredas or towns for O&M without
proper preparation are an important issue affecting sustainability of water supply scheme.,
Draft- One WASH Program Document Phase II Updating- May 2010
NATIONAL WASH COORDINATION OFFICE 27
3.1.2.2 Ministry of Health
The Ministry of Health (MoH) has prepared a Health Sector Development Plan, HSDP IV, to achieve the health
MDGs by 2015. The plan, implemented by regional health bureaus, aims to scale up delivery of primary health
care services at district (woreda) level and through the health extension programme organized at the kebele level.
Over 38,000 health extension workers (HEWs) have been trained and deployed to health posts at kebele level in
both rural and urban areas. HEWs work with communities and househols through members of the Health
Development Army (HDA) to promote behaviour change, including use of improved sanitation facilities, hygiene
promotion and eradicating open defectaion.
3.1.2.3 Ministry of Education
The Ministry of Education’s (MoE) mission is to build an education and training system which assures quality and
equity education that aims at producing competent and productive citizens. MoE seeks to improve the capacity
and quality of education and training, design and assure standards of efficiency, expand well equipped higher and
technical education to ensure productive, equitable, and participatory and quality education and training at all
levels. In addition Ministry of Education has to design a focused hygiene and sanitation curriculum where a weekly
hygiene promotion learning and activity is allocated to the program, establish or Strengthen environment or
hygiene/health club, mini-media, promoting school vegetable gardening and establishing latrine and class room
cleaning culture in the schools and allocate budget to supplement donor funding to support actions towards
Menstrual Hygiene management (MHM) and for enhancing access of improved sanitation for male and female
student and students with need (disabilities)
3.1.2.4 Ministry of Finance and Economic Cooperation
The Ministry of Finance and Economic Cooperation (MoFEC), besides implementing the National Development
Program and determining and allocating budget to all public institutions, is responsible for implementing
efficient ways of utilizing resources in both federal and regional governments.
MoFEC has recently undertaken a reform of the PFM system by implementing the Integrated Financial
Management Information System (IFMIS) which will generate accurate, accessible and timely government-
wide financial information and reports, support public bodies and regions in improving the quality of PFM.
MoFEC, as the most recent signatory of the MoU and WIF, will be responsible for the financial management of the
Program using its experience in SWAps in other sectors. As the national coordinator of GTP implementation,
MoFEC will play an important role in allocating and channeling resources and monitoring fund utilization (Ref. WIF
for details)
3.1.3 Obligation and role of Civil Society Organizations
It is estimated that there are over 100 CSOs that work with WASH activities throughout the country. CSOs play an
important role in delivering water and sanitation services, hygiene promotion, piloting new approaches, reaching
remote areas and groups, and supporting learning and knowledge sharing. . CSOs play a number of important
roles in Program implementation. CSOs participate in sector reviews and evaluations such as the semi-annual Joint
Technical Review (JTR), an annual Multi-Stakeholder Forum (MSF),. WASH CSOs also implement WASH projects
Draft- One WASH Program Document Phase II Updating- May 2010
NATIONAL WASH COORDINATION OFFICE 28
and undertake studies, evaluations and other activities for international multilateral and bilateral organizations
such as the European Union, UNICEF, DFID and others.
CSOs support implementation of the Program at all levels, from federal level to communities. This support will be
included in consolidated WASH plans at all levels and reported in quarterly and annual consolidated progress and
utilization reports. The roles of CSOs will vary, but their resources, activities and outputs will be included under
the umbrella of the One WaSH National Program.
The valuable contribution of CSOs is recognized in the WASH Implementation Framework (WIF), where CSO
projects are included as one of the four implementation modalities.
CSOs working with WASH activities are members of the Water and Sanitation Forum (WSF), which meets annually.
The WSF has an executive body and a secretariat, which presently are World Vision and the Consortium of
Christian Relief and Development Associations (CCRDA), respectively. The WSF currently has 56 members. WASH
CSOs are also represented on a number of Task Forces in MoWIE, MoH and MoE, as well as membership in WASH-
related working groups under the Development Assistance Group (DAG).
In the regions, WASH CSOs collaborate with sector bureaus by participating in technical working groups and
forming WASH Forums to coordinate planning and implementation.
3.1.4 Obligation and Roles of the Program (NWCO)
The NWCO will stimulate WASH ministries at the federal level, regional and zonal bureaus, woredas and towns to
carry out a resource mapping exercise to identify WASH CSOs working in their areas. This will be the responsibility
of the WASH Coordination Offices at the various levels, and in the case of woredas and towns, the responsibility
of the woreda or town WASH Teams. CSOs will be requested to provide information about the scope, location,
type of interventions and number of facilities to be provided as well as the resources available for implementing
WASH activities. This information will be maintained by the unit responsible for coordination at each level and
updated at least quarterly.
The Program provides the framework for harmonizing Government and donor approaches to planning,
procurement, implementation and financing and serves as the platform on which a closer partnership between
planners, implementers, development partners and others to achieve common goals can be built.
3.1.5 Obligation and Role of Private Sector
The private sector plays a key role as implementors of Program activities, as most construction of water supplies
is undertaken by private contractors and artisans.
The private sector also provides consulting services for studies and designs in construction supervision for urban
waters uppply schemes. Private suppliers, artisans and other service providers will have an increasingly important
role to play in the Program in establishing and servicing supply chains for WASH products, spare parts and repair
services and in supporting self supply activities. They could also be engaged in social/sanitation marketing in
promoting improved sanitation, making available important latrine components at local level through the
establihment of supply chains.
Since the capacity of the private sector to provide the required servics is a serious constraint for the
implementation of the Program, capacity building to increase the capacity of the private sector to provide works,

Draft- One WASH Program Document Phase II Updating- May 2010
NATIONAL WASH COORDINATION OFFICE 29
goods and services and in preparing manuals, guidelines, technology options is necessary to be carried out by the
program. In addition, to encourage private sector to take up the WASH business and stay in the busines,
government should make the enabling environment such as contract mangement activities, reliable
hydrogeological studies, incentives etc very attractive.
3.1.6 Role of Banks and microfinance institutions (MFI)
Banks and MFIs can also play a useful role in providing financial services to communities, particularly for CMP,
self-supply activities and sanitation marketing. These service include financing through WASHCOs for
procurement and construction, maintenace, rehabilitaton/augmentation, replacement/ reinvestment,
insurance, and credit to SMEs for providing WASH services and suppliess. In some regions O&M insurance
schemes have been started using MFIs, a development which should be closely followed for possible replication
3.1.7 Obligation and Roles of Community Organizations
At community level, the two main structures relevant in implementation of the Program are WASH Committees
(WASHCOs) and in some cases associations of WASHCOs, who are expected to plan, manage, operate and
maintain water points, and the Health Extension Workers (HEW) and Women Health Development Army (WHDA).
Community ownership and management of the improved WASH facilities is important for enhancing the impact
and sustainability of the Program’s interventions. Projects such as the WSSP, COWASH and those implemented by
a number of NGOs have developed strategies and procedures for capacity development at community level,
including training and designing guidelines and manuals which will be a useful resource for the Program.
Members of the Health Development Army (HDA) working with HEWs, will be important in promoting sanitation
and hygiene practices among households in communities. HEWs and the HDA have been assigned 16 tasks, of
which 7 are WASH-related.
It is planned in Phase II to organize a community centered hygiene and sanitation program (CCHSP) through
organizing and providing focused training to permanent, respected and trusted community residents which
include teachers, religious leaders, elders/clan leaders with a view that empowered communities will make a rapid
and sustained changes in behaviors (see annex for detail) and make them responsible in WASH in their
communities. (see guideline 10, annex 4)
3.2 Enhancing Ownership of WASH Services
One of the problems in WASH programs is lack of sustainability. Sustainability equates with ownership of WASH
programs and services by all WASH actors at all level. Regional bureaus have not progressed to the desired level,
as programs are still seen as belonging to a donor or sponsoring organization. Ownership has many dimensions
Vs
1. All sector staff should see CWA as part of the whole package-OWNP. It may be necessary to train or
orient new and old staff members about the evolution, current status and future aspiration of
OWNP.
2. The sector actors at all level should understand that their employment and expertise is to make a
change in their areas of employment or profession and are obliged to deliver to the best they can as
long as they are working in that section.
Draft- One WASH Program Document Phase II Updating- May 2010
NATIONAL WASH COORDINATION OFFICE 30
3. Ownership can also be enhanced by involving Beneficiaries starting from conception to
implementation of the project. They should also contribute in terms of cash, materials and labor for
the project.
4. Project hand over and training to organized local leaders is another way of creating ownership.
4. Program Description
4.1 Introduction
This Program Document operationalizes the principles, organization and procedures contained in the MOU and
WIF through a coherent set of activities aimed at achieving the GTP II targets for water supply and sanitation in
Ethiopia.
To achieve this aim, the Program makes use of data from the first phase review report of 2017, updated planning
models and data received from the regions and other sources to establish a baseline for access to water supply
and sanitation in rural and urban areas in the country. The program will use new developments that took place
with partner organization since 2013. There are new strategies designed to strengthen a coordinated activity in
improving urban hygiene and environmental health conditions (IUHEH); hygiene and environmental health
programs (NHEHS); School WASH strategy and the revised water resource management policy and strategy
documents. The Program also uses information from a recent capacity assessment12 to identify human and
physical resources, population projections from CSA and updates of physical and financial models used and tested
in the preparation of the WASH UAP. The Program budget includes sector allocations to water, health and
education and addresses factors affecting the functioning of institutions and management, including identifying
human, technical and financial resources requirements to meet GTP targets.
4.2 Program Objectives
4.2.1 Development Objective
The Program’s Development objective is to contribute to improving the health and well-being of population in
rural and urban areas by increasing sustainable and climate resilient water supply and sanitation access and the
adoption of good hygiene practices in an equitable and sustainable manner.
4.2.2 Long Term Objective
By 2030, achieve universal, sustainable, climate resilient and equitable access to safe and affordable drinking
water for all
4.2.3 Intermediate Term Objective
The Intermediate Objective of the Program is to achieve increased and sustained coverage of safely managed
water supply and sanitation in rural and urban areas.
12Evaluation of WASHCapacity Building Interventions in Ethiopia, Final Report, June 2013.
Draft- One WASH Program Document Phase II Updating- May 2010
NATIONAL WASH COORDINATION OFFICE 31
4.2.4 Short Term Objective
The Short-Term Objective of the Program is to achieve increased and sustained coverage of water supply and
sanitation in rural and urban areas with basic water supply service levels in Ethiopia in line with the GTPII targets
(2015-2020)
4.3 Guiding Principles
The Program is guided by the Memorandum of Understanding (MoU) and WASH Implementation Framework
(WIF), signed by the Federal Ministries of Water and Energy, Health, Education and Finance and Economic
Cooperation in November 2012 and April 2013, respectively. The following four guiding principles of the Program
as stated in these documents are:
1. Integration of water, health education and finance
2. Alignment of partners’ planning and management systems and procedures with those of GOE
3. Harmonization of partners’ approaches and activities
4. Partnership between implementing parties
4.4 Program Pillars
The Program’s activities will be organized around three domains or pillars:
4.4.1 Enabling Environment/Good Governance
An Enabling Environment and Good Governance form the foundation and prerequisite for the Program’s success.
It includes legal instruments, policies, strategies and frameworks, institutional arrangements, program
methodology, implementation capacity, availability of products and tools, finance, cost effective implementation
and M&E, formal agreements, the commitment and integrity of personnel at all levels and access to information.
This pillar also includes compliance with agreed norms and standards, establishing WASHCOs as legal entities and
contractual relations between implementing parties.
Analysis of the enabling environment for sanitation and hygiene revealed that important policy such as a
standalone policy for sanitation is still lacking; although sanitation options are already designed but private sectors
are not on board to make sanitation a business; the monitoring indicators in the HMIS are very limited to reflect
the real situations.
The water policy that has been issued about 20 years ago will need a review and updating so that it reflect the
existing situations such as the OWNP principles, implementation modalities and capacities.
4.4.2 Maximizing availability and efficient use of human and financial resources to create demand for better WASH
services
The emphasis is on efficient use of resources rather than only the availability of resources. During consultations
with the regions and cities, human resources and capacity were mentioned more frequently than funding and
other resources as constraints to effective implementation of WASH activities on the ground.
Technical and logistic resources and their efficient use are also important to enhance the performance and
effectiveness of Program implementation.
Draft- One WASH Program Document Phase II Updating- May 2010
NATIONAL WASH COORDINATION OFFICE 32
Using the principle, “Everything counts, count everything.”, resources available from all sources, including CSO,
CR-WASH and emergency WASH programs, WRDF and self-supply activities will be considered and included when
determining resource availability, gaps and needs.
Creation of demand for better WASH facilities and services will be promoted through targeted information and
communication activities, advocacy and motivation at all levels, offering appropriate and affordable technical
solutions, services and products.
4.4.3 Capacity development for improved delivery of WASH services
Capacity gaps at all levels have been identified as one of the most pervasive threats to the successful
implementation of the Program. Therefore, capacity development of IPs at all levels will receive priority attention
by the Program. The Program will continue to support the development of human resources, organizations and
systems and logistics and equipment.
The ultimate purpose of One WASH and an important indicator of its success is its ability to deliver better and
Climate resilient WASH services to people in rural and urban areas in Ethiopia. Services include improved water
supply, sanitation and hygiene promotion for communities, households and institutions, effective supply chains
for WASH products and services, skills training and logistic support to Program managers and implementers.
Due to the substantial gap in coverage and resources, a mass mobilization strategy will be necessary to achieve
the GTP WASH targets. In recognition of this, MoWIE has prepared a manual on mass mobilization to support
implementation of the UAP13. To support community mobilization and empowerment approach, the Program will
select respected, trusted, educated, community members such as religious leaders, teachers, HEWs, HDAs, and
train them to facilitate and follow up changes in sanitation and hygiene and water safety activities at source and
at household level. Training drilling and civil contractors, and mobilization of NGO resources and the private sector
through promotion and scaling up of self-supply will also be part of the community mobilization approach.
4.5 Phasing
4.5.1 Introduction
The program was originally designed for three years (2013-2015) basically to establish the OWNP based on the
WIF with an anticipated extension to Phase II which will run from 2015 to 2020 operating under GTPII principles,
targets and indicators.
Phase I program was designed for three years (2013-2015) with an anticipated extension to Phase II. Phase I has
been instrumental in increasing harmonization and alignment among and between development partners and
GoE, during which WASH organizations and procedures have been fully established and become operational at all
levels.
13 Implementation Manual for Ignition of Mass Mobilization on the Universal Access Plan for Water and Sanitation Program, Ministry of
Water and Energy, Addis Ababa, August 2008.

Draft- One WASH Program Document Phase II Updating- May 2010
NATIONAL WASH COORDINATION OFFICE 33
4.5.2 Phase II
The actual Phase II Program duration will be three years, (2018-2020) with possible extension up-to 2030. There
can be changes in important GoE policies, strategies and plans after GTP II and UAP. MDG is already replaced by
SDG.
Phase II of the Program will follow the Phase I approaches and attending to plans not materialized with no changes
to the organization/institutional arrangement, implementation modalities but Phase II will fall on to GTPII period
and will follow the indicators in GTP II.
In Phase II the program will focus on newly developed strategies, directives, and indicators in GTP II. Consideration
will be given to broadening the Program’s scope to include such related activities as watershed and water
resources management, productive uses of water, environmental protection, climate resilience, WASH in
emergency etc. as agreed during Phase I review with stakeholders.
In Phase II, Unit costs are calculated using averages from regions, international organizations, CSOs determining
the unserved population in each region. The unit cost has also considered regional variations, accessibility,
capacity, and other relevant parameters. (see chapter 15 for details)
a. Rural Water supply
An indicative plan for Phase II can be prepared using guidance from the national WASH Steering Committee, the
national WASH Coordination Office and the regional annual plans. This plan will reach additional unserved
population and consider population growth rate between 2018 and 2020 including improving existing service
levels (see tables and graphs in chapter 16 for details)
b. Rural, peri-urban and institutional sanitation
In Phase II construction and capacity development activities will continue. Institutional water supply and
sanitation and some communal and shared sanitation interventions in urban areas will be planned and cost
calculated.
c. Urban Water supply
Urban water supply indicative plans for Phase II will consider increasing service levels from public taps to yard taps
and yard taps to house connections by 2020. The 2017 regional WASH plans will be used as the basis for identifying
requirements for Phase II.
d. Urban Sanitation
In Phase II towns with population less than and greater than or equal to 50,000 will be specifically targeted. Low-
cost decentralized wastewater schemes can also be considered for regional capitals.
e. Appropriate technologies
Simple and appropriate especially for rural conditions will have focus in Phase II.
The type of technologies used for water supply especially in rural areas may have to be diversified and simplified
with sustainable use in focus. The focus only on wells/pumps and capping springs has limited the potentials of
other technologies and the use of other water resources such as surface water from rivers/streams, from flood
water and from the rain.
Draft- One WASH Program Document Phase II Updating- May 2010
NATIONAL WASH COORDINATION OFFICE 34
Rain Water: Theoretically, about 800 ml of water can be collected from 1 square meter of surface area if it rains
only 1 mm per year. Considering the surface area (harvester area) of schools and the amount of average rain fall
in Ethiopia it can be said that all schools in Ethiopia should not be short of water throughout the year. However,
harvester area cleanliness, storage and delivery need care
Sub-surface dam: Low land areas such as Afar and Somali and the lowland areas of Borena in Oromia have many
large dry river beds that are perpetually carrying large amount of flood water from the highlands. These dry river
beds can be converted into an underground reservoir provided that we construct a dam structure across a
convenient location along the length of the dry river beds. The water stored which is cooler and clean as a result
of the natural filtration can be exploited using pumps or gravity pipes. The water stored in such manner could also
recharge the underground aquifer.
Solar Pump: Solar pump is also the latest technology being introduced in Ethiopia. With a minimum of 10 hours
of sunshine in Ethiopia a solar pump installed in at least shallow wells can very easily replace the hand pump which
is problematic for communities as it demands careful operation and periodic preventive or actual maintenance.
Ecological sanitation: The use of simple ecological sanitation system such as Arborloo which can safely manage
human excreta and the filled-up pit used to plant fruit trees. The arborloo, is small in size (60x60x1.5 meters),
cleanable and management is only adding ash or soil after defection to desiccate moisture and discourage fly
breeding and avoiding smell.
4.6 Risk Assessment
The risk analysis and rating for the Program is shown below. Potential aspects of the Program that may pose a
reputational risk for partners, GoE or others include national programs operating in resettlement areas. This places
additional onus on ensuring that social safeguards are adequate for marginalized groups to ensure no reputational
risk.
Major risks that may affect achievement of the Program’s development objective and results are summarized in
the following table, along with measures for minimizing or mitigating the identified risks.
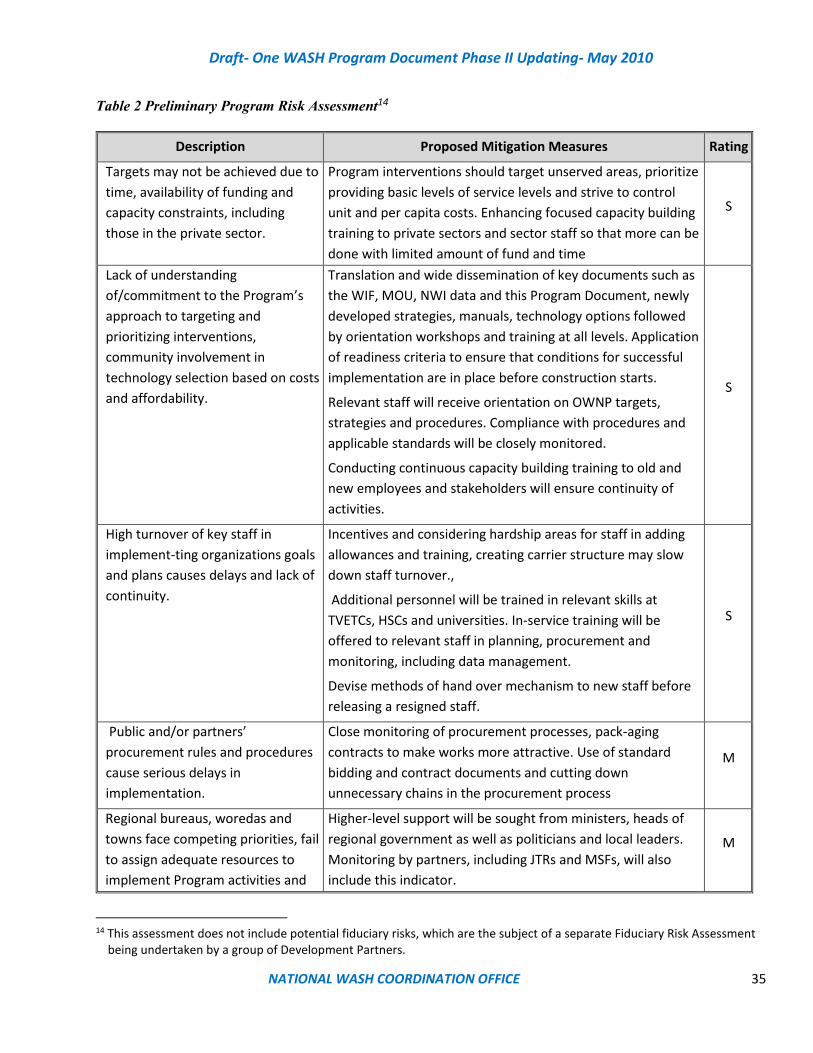
Draft- One WASH Program Document Phase II Updating- May 2010
NATIONAL WASH COORDINATION OFFICE 35
Table 2 Preliminary Program Risk Assessment14
Description Proposed Mitigation Measures Rating
Targets may not be achieved due to
time, availability of funding and
capacity constraints, including
those in the private sector.
Program interventions should target unserved areas, prioritize
providing basic levels of service levels and strive to control
unit and per capita costs. Enhancing focused capacity building
training to private sectors and sector staff so that more can be
done with limited amount of fund and time
S
Lack of understanding
of/commitment to the Program’s
approach to targeting and
prioritizing interventions,
community involvement in
technology selection based on costs
and affordability.
Translation and wide dissemination of key documents such as
the WIF, MOU, NWI data and this Program Document, newly
developed strategies, manuals, technology options followed
by orientation workshops and training at all levels. Application
of readiness criteria to ensure that conditions for successful
implementation are in place before construction starts.
Relevant staff will receive orientation on OWNP targets,
strategies and procedures. Compliance with procedures and
applicable standards will be closely monitored.
Conducting continuous capacity building training to old and
new employees and stakeholders will ensure continuity of
activities.
S
High turnover of key staff in
implement-ting organizations goals
and plans causes delays and lack of
continuity.
Incentives and considering hardship areas for staff in adding
allowances and training, creating carrier structure may slow
down staff turnover.,
Additional personnel will be trained in relevant skills at
TVETCs, HSCs and universities. In-service training will be
offered to relevant staff in planning, procurement and
monitoring, including data management.
Devise methods of hand over mechanism to new staff before
releasing a resigned staff.
S
Public and/or partners’
procurement rules and procedures
cause serious delays in
implementation.
Close monitoring of procurement processes, pack-aging
contracts to make works more attractive. Use of standard
bidding and contract documents and cutting down
unnecessary chains in the procurement process
M
Regional bureaus, woredas and
towns face competing priorities, fail
to assign adequate resources to
implement Program activities and
Higher-level support will be sought from ministers, heads of
regional government as well as politicians and local leaders.
Monitoring by partners, including JTRs and MSFs, will also
include this indicator.
M
14 This assessment does not include potential fiduciary risks, which are the subject of a separate Fiduciary Risk Assessment
being undertaken by a group of Development Partners.
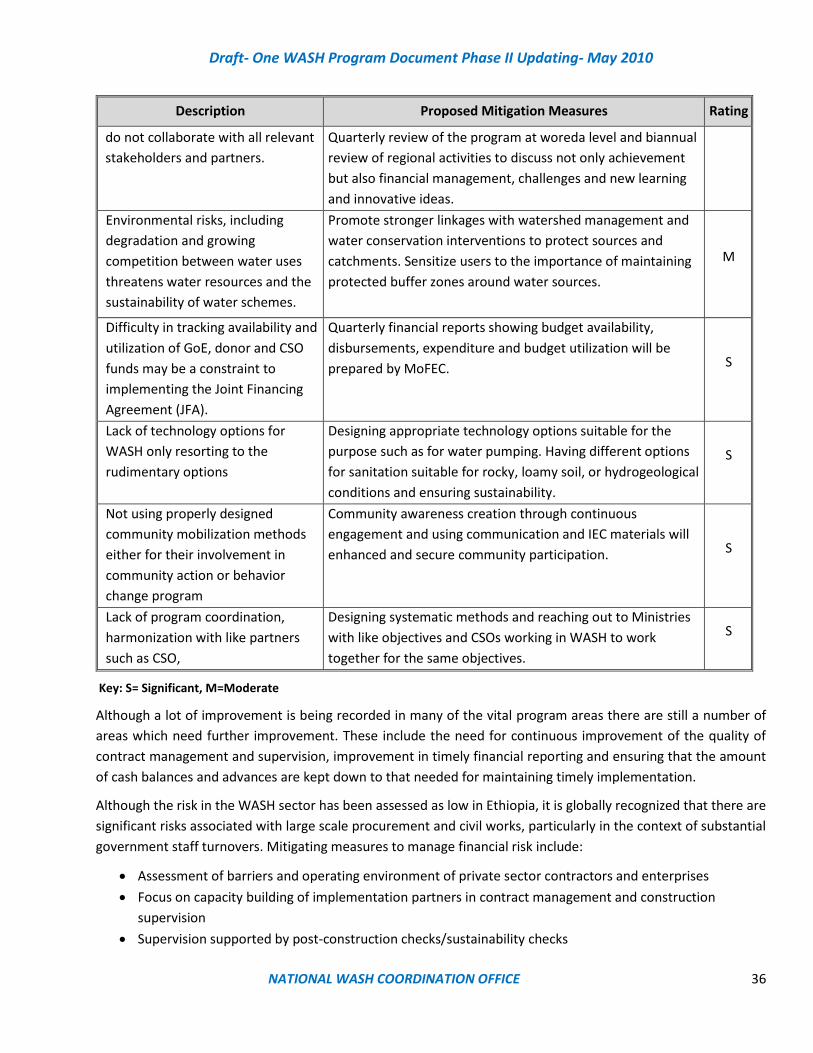
Draft- One WASH Program Document Phase II Updating- May 2010
NATIONAL WASH COORDINATION OFFICE 36
Description Proposed Mitigation Measures Rating
do not collaborate with all relevant
stakeholders and partners.
Quarterly review of the program at woreda level and biannual
review of regional activities to discuss not only achievement
but also financial management, challenges and new learning
and innovative ideas.
Environmental risks, including
degradation and growing
competition between water uses
threatens water resources and the
sustainability of water schemes.
Promote stronger linkages with watershed management and
water conservation interventions to protect sources and
catchments. Sensitize users to the importance of maintaining
protected buffer zones around water sources.
M
Difficulty in tracking availability and
utilization of GoE, donor and CSO
funds may be a constraint to
implementing the Joint Financing
Agreement (JFA).
Quarterly financial reports showing budget availability,
disbursements, expenditure and budget utilization will be
prepared by MoFEC. S
Lack of technology options for
WASH only resorting to the
rudimentary options
Designing appropriate technology options suitable for the
purpose such as for water pumping. Having different options
for sanitation suitable for rocky, loamy soil, or hydrogeological
conditions and ensuring sustainability.
S
Not using properly designed
community mobilization methods
either for their involvement in
community action or behavior
change program
Community awareness creation through continuous
engagement and using communication and IEC materials will
enhanced and secure community participation. S
Lack of program coordination,
harmonization with like partners
such as CSO,
Designing systematic methods and reaching out to Ministries
with like objectives and CSOs working in WASH to work
together for the same objectives.
S
Key: S= Significant, M=Moderate
Although a lot of improvement is being recorded in many of the vital program areas there are still a number of
areas which need further improvement. These include the need for continuous improvement of the quality of
contract management and supervision, improvement in timely financial reporting and ensuring that the amount
of cash balances and advances are kept down to that needed for maintaining timely implementation.
Although the risk in the WASH sector has been assessed as low in Ethiopia, it is globally recognized that there are
significant risks associated with large scale procurement and civil works, particularly in the context of substantial
government staff turnovers. Mitigating measures to manage financial risk include:
• Assessment of barriers and operating environment of private sector contractors and enterprises
• Focus on capacity building of implementation partners in contract management and construction
supervision
• Supervision supported by post-construction checks/sustainability checks
Draft- One WASH Program Document Phase II Updating- May 2010
NATIONAL WASH COORDINATION OFFICE 37
• Capacity strengthening in Public Financial Management at all levels
• Strengthening M&E systems and procedures at all levels
• Through PBS work with the Construction Sector Transparency Initiative (COST Ethiopia), increase
transparency in tendering and procurement processes through a public disclosure program
Additional information on risks associated with the Program can be found in Annex 3.
4.7 Safeguards
4.7.1 Description
Environmental safeguard includes environmental assessment, natural habitats, cultural property, etc…and social
safeguards include aspects such as involuntary resettlements. Social and Environmental Safeguard Section/Unit
within the MoWIE are facilitating effective enforcement, capacity building and monitoring of adherence to the
social and environmental policies and guidelines. There is also a need to have a unit responsible for environmental
and social safeguards in regions.
Outline for a safeguard assessment
• Describe the types of subprojects that will be supported under the project and information on the location
in which they will occur.
• Analyze the main likely adverse impacts of representative samples of sub projects with reference to the
requirement of the safeguard policies and procedures
• Analyze the potential cumulative impact of all subprojects that will be funded under the project
• Propose possible changes/modifications in project design to help prevent adverse impacts
• Assess the existing institutional arrangements and organizational capacity to implement mitigation
measures and monitor outcomes.15
Projects are will have different types of risks ranging from low risk to high risk. According to the World Bank
guideline, high risk sub projects are those that require a site specific environmental assessment (EA) or detailed
environmental management plan (EMP) as they may present potential adverse environmental and social risks.
The table below provides the extent of risks for each sub activities in a project.
First step in environmental and social safeguard Assessment include the following important areas
• It is very important to have discussion with beneficiary communities to inform the public about the
upcoming project and also to get pertinent information, ideas and concerns. In targeting stakeholders, it
is best t first identify the stakeholders, set date, time and place and inform them about the project and
get information about their views and opinions.
• Focus group who are selected from the community is also another way of in-depth discussion to get
dissenting or consenting decisions
• Public meeting is also another method and an opportunity to get more people together and discus all
subprojects coming in their communities
15 Manual for safeguard compliance, World Bank, March 2004
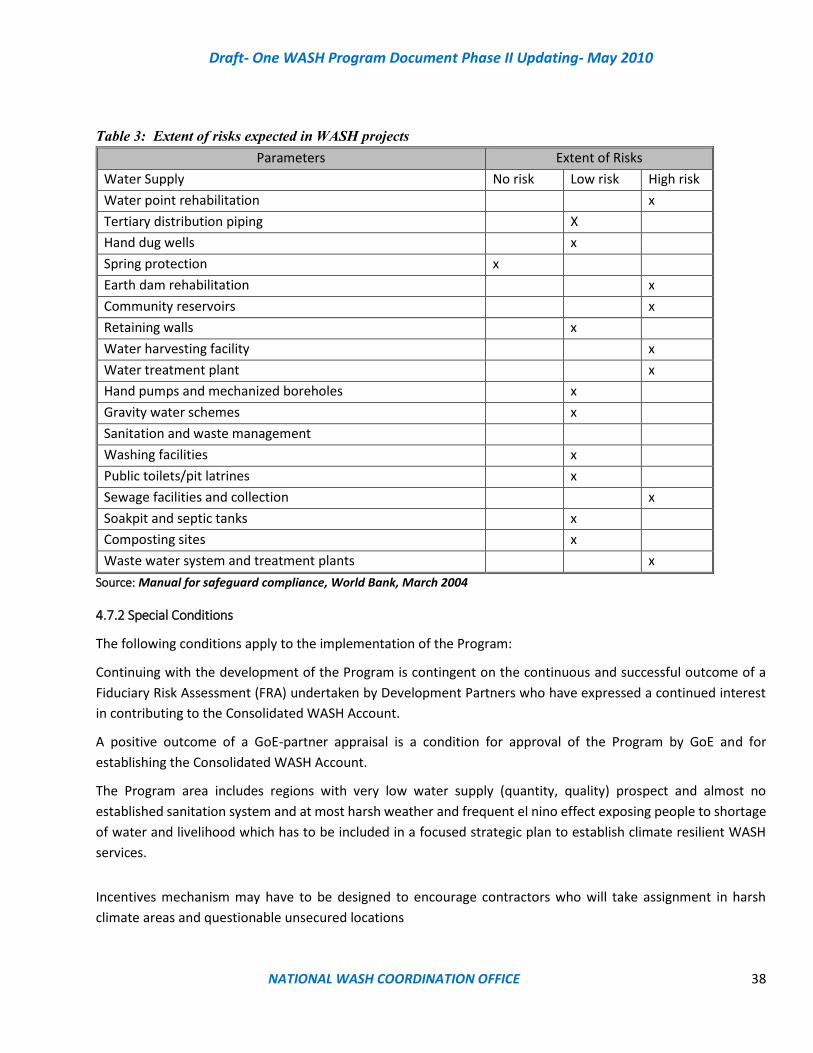
Draft- One WASH Program Document Phase II Updating- May 2010
NATIONAL WASH COORDINATION OFFICE 38
Table 3: Extent of risks expected in WASH projects
Parameters Extent of Risks
Water Supply No risk Low risk High risk
Water point rehabilitation x
Tertiary distribution piping X
Hand dug wells x
Spring protection x
Earth dam rehabilitation x
Community reservoirs x
Retaining walls x
Water harvesting facility x
Water treatment plant x
Hand pumps and mechanized boreholes x
Gravity water schemes x
Sanitation and waste management
Washing facilities x
Public toilets/pit latrines x
Sewage facilities and collection x
Soakpit and septic tanks x
Composting sites x
Waste water system and treatment plants x
Source: Manual for safeguard compliance, World Bank, March 2004
4.7.2 Special Conditions
The following conditions apply to the implementation of the Program:
Continuing with the development of the Program is contingent on the continuous and successful outcome of a
Fiduciary Risk Assessment (FRA) undertaken by Development Partners who have expressed a continued interest
in contributing to the Consolidated WASH Account.
A positive outcome of a GoE-partner appraisal is a condition for approval of the Program by GoE and for
establishing the Consolidated WASH Account.
The Program area includes regions with very low water supply (quantity, quality) prospect and almost no
established sanitation system and at most harsh weather and frequent el nino effect exposing people to shortage
of water and livelihood which has to be included in a focused strategic plan to establish climate resilient WASH
services.
Incentives mechanism may have to be designed to encourage contractors who will take assignment in harsh
climate areas and questionable unsecured locations
Draft- One WASH Program Document Phase II Updating- May 2010
NATIONAL WASH COORDINATION OFFICE 39
4.8 Enhancing Equity and inclusion in WASH
The Program promotes and supports social inclusion as an important strategy to enhance equity and reduce
disparities in access to WASH services. Social inclusion includes gender equity and mainstreaming, resettlement
areas and areas with high concentrations of ethnic minorities and pastoralists and institutional WASH facilities
that do not restrict access to handicapped and disabled persons.
Creating equity in WASH program is an important cross-cutting issue to be supported and promoted by the
Program. Women already occupy important managerial roles in the health and education sectors, but less so in
the water and finance sectors. A WASH gender audit undertaken by the Women’s Affairs Directorate, MoWIE,
provides useful knowledge and guidance as well as a baseline for assessing change during the Program.
The Program’s support to EWTI will include promoting and supporting the reintroduction of the gender training
modules prepared by MoWIE. Other gender-related aspects of the Program include but are not limited to planned
support to women and youth-led supply chains, construction of latrines at schools for girl students and the use of
gender disaggregated indicators to monitor Program results.
There are at least 34% or about 34 million people where most are in rural areas in Ethiopia who have no latrine of
any kind. Ethiopia did not achieve the Millennium Development Goal (MDG) and now Ethiopia is expected to
address the more stringent Sustainable Development Goal. Sanitation development have multiple challenges
including poverty, weak support but only lip service, poor awareness and knowledge, lack of appropriate
technology options for all type of geographical, and hydrogeological conditions etc. Above all this, there is the
exclusion factor where different categories of people such as the poor, marginalized, chronically ill (HIV-AIDS)
disables, those in hard to reach areas etc. It is therefore important that the approach for a universal access must
be based on the principles of equity addressing three important barriers16 which are 1) attitudinal barriers
(isolation, prejudice, stigma, etc); 2) environmental barriers (physical accessibility to infrastructure, toilet or squat
hole design,) and 3) Institutional barriers (policies,)
WASH program should be conscious of designing and promoting appropriate technology to meet different needs
of the WASH beneficiaries including provision of MHM and disability access; child friendly taps; urinals;
conveniently located hand washing facilities; adequate light and ventilation in latrines. Inclusive access designed
for life cycle disability including pregnancy, old age etc would make facilities accessible for all 17
4.8.1 Why focus on MHM
MHM directly affect a good proportion of adolescent girls in school or women visiting health facilities. MMM
facilities are nonexistent in schools and health facilities/health posts and as a result tens of thousands of students
are affected and continue to lack access to the facilities. When girls stay home from school during menstruation
due to inadequate products, clean private facilities for at least five days a month it means that they are out of
school for at least 50 learning days a year. This impacts their academic performance, future educational
attainment, good paying job opportunity and economic opportunities.
16 Sanitation and hygiene in Africa, Analysis from the Africa San conference, Kigali, Rwanda, 2014; Piers Cross and Yolande Coombs editors. 17 Do

Draft- One WASH Program Document Phase II Updating- May 2010
NATIONAL WASH COORDINATION OFFICE 40
The hygiene and human right advocacy statement states “the ability to be clean and to address MHM in an
appropriate way are matters of human dignity, and are included in the right to nondiscrimination, equality, bodily
integrity, health, privacy …etc.”18
5. Component Description
5.1 Rural Water Supply
5.1.1 Introduction
An estimated 80% of the population in Ethiopia live in rural areas with a high dependence on mixed and pastoral
farming, often under harsh and variable climate. Many small towns provide market and rural support functions,
as well as labor pools for agricultural activities.
Any new Implementation and Operational Modality needs to integrate with, or allow for, existing Woreda and
WASHCO management and rural support structures.
In 2008 EFY: i) 47.3 million or 63% rural population have got access to improved water supplies; ii) average non-
functionality has been reduced to 11%; iii) 61% have some form of latrine facility. The big achievements made in
Rural WaSH service delivery over the past 20years indicate that 35 million people have gained access from
improved water source and 40 million people have built and used basic sanitation19.
To address the low access to water supply in rural areas, the Water Resource Management Policy (1999), supports
decentralized management and integrated and participatory approaches to providing improved water supply
services. The need to include all stakeholders, NGOs, communities and the recovery of O&M costs is also
recognized and supported by this Policy.
Water source development should be based on best available hydrological and hydrogeological information,
interpreted by qualified professionals. Alternative water supply and energy sources should be studied at each
project site to meet present and future water, fully taking into account the impact to/from other existing and
proposed projects in the same surface and subsurface catchment zones.
The Program’s rural water supply activities include studies, construction of new point sources or small pipe
schemes with distribution systems, including multi-village schemes where appropriate, rehabilitation of existing
point sources and expanding small pipe schemes.
Point source rural water supply will remain under formal or informal WASHCOs with little or no outside assistance,
except encouragement of the private sector by implementing agencies.
The sustainability of the majority of rural water supply schemes has proved to be low, due to unaffordability, lack
of post construction support and reliance on management through part time WASHCO members. This situation
18 Global Public- Private partnership for hand washing (PPPHW) post 2015 advocacy tool kit, 2025
19WB (2017), WASH (Poverty Diagnostic Report) IN:Development of sustainable water supply, sanitation and hygiene in draught prone aras, a Suib program document, final version, 2017
Draft- One WASH Program Document Phase II Updating- May 2010
NATIONAL WASH COORDINATION OFFICE 41
calls for effective capacity development through training of WASHCOs and supply them with tools to do preventive
maintenance of the systems so that whatever technology is used local people will be in a position to manage it.
However, sustainable and resilient water supply service demands higher technology than the common spot supply
from wells and gravity springs which may demand the service of also higher level, technical and permanently
employed staff than relying on WASHCOMs in the future.
5.1.2 Implementation modalities
The planning and implementation process for rural water supply will vary according to implementation modality,
(RMP, WMP, CMP, NGO or self-supply) but in all cases it will be expected to conform with Program requirements
and GoE policies regarding the Program organization, preparing annual WASH plans and budgets, reporting
requirements, use of common monitoring indicators, cost-sharing policies, and technical standards, including
water quality standards.
a. Regional Modality
Regions are generally responsible for WASH program in the region whether government budgeted, CWA
supported or CSOs. Regions are organized and have more qualified staff in all bureaus of water, health and
education to design, support and evaluate program. They also see to it that procurement is done on time; budget
is utilized effectively and efficiently and reported timely.
Regions will support appraising program, conducting in depth study on ground water potentials, conducting
capacity building to staff and private sectors, supervise and commission major projects, support strengthening
monitoring, learning and knowledge exchange program etc. Higher level water construction such as deep wells
are designed, contracted, supervised, inspected and commissioned by the regions or zones when delegated.
However, there is a need to develop a guideline for regions so that others would also know who is responsible for
what in water construction.
b. WMP Modality
The distinguishing feature of WMPs is that the woreda WASH Team (WWT) is responsible for administering funds
allocated to a kebele or community) through a Grant Agreement for capital expenditures and software expenses
on water supply and sanitation programs. Although the Kebele Administration and WASHCOs are involved in
project planning, implementation, monitoring and commissioning the project supported by the WWC, the WWT
is the Project Manager and is responsible for contracting, procurement, inspection, quality control and handover
to the community. Construction is supervised by woreda staff.
WMP projects will be implemented according to procedures and guidelines established for Woreda Managed
Projects, with modifications to comply with the Program organization, reporting requirements and monitoring
indicators.
c. CMP Modality
The CMP is a rural WASH implementation modality where communities are supported to initiate, plan, implement
and manage their priority water and sanitation projects using funds that are transferred to and managed by the
community.
Funds for physical construction are transferred to the communities from woredas or through intermediaries
selected by the communities, thus making communities responsible during the full project cycle, from planning,
Draft- One WASH Program Document Phase II Updating- May 2010
NATIONAL WASH COORDINATION OFFICE 42
implementation (including procurement of most materials and labor) and O&M. The WASHCO is directly
responsible for contracting, procurement, quality control and financial accountability to the community, the
Kebele and the Woreda Administration. There is no handing over of scheme to communities, since the community
already owns the project.
One drawback of the CMP is the fact that the focuses on development of water supplies using low-cost
technologies such as hand-dug wells and springs which are not providing in many cases resilient and sustainable
services. When communities are dependent on these sources, sectors at the woreda level should support the
communities get the best out of the sources and technology through capacity building in O&,M, hygiene
promotion for safe management of water at household level and periodically testing the water and advising
consumers on point-of-use water treatment where necessary.
The Government focus now is developing a sustainable climate resilient source and using appropriate and
economical and robust technology for water delivery
d. NGO (CSO) Modality
NGOs are important stakeholders in the Program as donors, implementers and knowledge disseminators. NGOs
funding and management arrangements vary considerably. However, in concert with national WASH principles
and practices, they foster community initiative, develop community leadership and require community
investment in water point projects. In some cases, NGOs administer external resources on behalf of the
community (as in WMPs). In other instances, they make external resources available to the community directly or
through MFIs to support construction and management.
NGOs have flexibility and are able to increase community involvement, ownership and accountability. NGO-
supported projects will follow procedures agreed between the NGO, its partners, GoE and the region or woreda
where activities are located but, in any case, should comply with policies on cost-sharing, community
contributions, reporting and monitoring indicators.
It is intended that NGOs are included in resource mapping at all levels and are requested to provide information
for the preparation of consolidated Annual WASH plans and budgets. NGOs are also requested to provide periodic
progress and utilization reports to WASH Coordinators at various levels.
However, this reporting aspect of OWNP has not worked well so far. As proposed in Section 11, it is intended that
the role of government staff be strengthened and incentivized to follow up on NGO activities.
Although NGOs could be a valued member for WASH in providing trained human resources, experience, much
needed fund to increase service and the proximity to the people who need the service, they have not been
adequately integrated into the OWNP. In Phase II however, recommendations are made to make them part of the
program in all areas of planning, implementation, monitoring and reporting.
d. Self-Supply
Self-supply through increasing access to improved water supply with maximum participation and contribution
from beneficiaries, thereby frees scarce public resources that can be used for other purposes. There has been
Draft- One WASH Program Document Phase II Updating- May 2010
NATIONAL WASH COORDINATION OFFICE 43
steady development, expansion and popularity of the family wells and a Self-Supply approach in Ethiopia over
previous decade’s.20.
Self-supply or private wells are usually not adequately protected to supply clean and safe water to the households
or neighbors. The problem is the site, water abstraction methods and lack of the necessary protection mechanisms
such as raised apron, water tight casing etc.
There is a need to think to more safe and adequate water supply coverage with less emphasis to self-supply. The
whole one WASH program objectives is to supply safe water and sanitation and hygiene to all people in a
community using a robust and sustainable water systems. In Phase II the technology mix is more focusing on those
which provide sustainable supply and resilient service.
e. Multi-village Water Supply Schemes
Multi-village water supply schemes will be supported under certain conditions provided that feasibility studies
verify that the proposed sources are adequate and that the schemes can be socially, technically and financially
sustainable. MVS has been the subject of important recent discussion within GOE supported by external
consultancy21 where it has been decided to:
a) “establish independent sector regulator including performance monitoring and benchmarking of
service providers”22
b) “formally recognize and support rural public utility management for complex large multi- village
schemes”
c) “establish post-construction … capacity … capital maintenance … cross subsidy …”
d) “professionalize” … “standardize” … “shift from community management to community
participation”, but “while other modes of implementation ... remain in place where appropriate and
successful (CMP, self-supply, NGO, woreda)”
e) “clarify roles and responsibilities for rural public utility service providers … accountability to existing
sector institutions”
f) “delegate functions”
g) Cluster the Rural MVS Scheme with the strong town water utility instead of establishing Rural public
utility management where appropriate
Discussion includes how to cover O&M costs for rural systems since “sustainable water supply is beyond the ability
to pay for users” and suggestions are made regarding government or donor subsidy and “improvement of
economic situation of population”.
As stated by many stakeholders WASHCOs are volunteer committees and, with growing demands for quality and
quantity of water supply and sanitation, it may not be realistic to continue managing the scheme by WASHCOs. It
is believed that there is a need to devise another alternative mechanism, such as external regulatory body, to
solve the O&M problems. All this would appear to be generally in line with the suggested “WASH Sector Reform
20Mammo, 2010; UNICEF, 2010. 21Rural Public Utility O&M Implementation Manual for Multi Village Water Supply Schemes 22 The Ministry of Finance is emphasizing the need for an independent regulator … “particularly in urban settings but increasingly in rural settings as well … (which) should include complex rural water supply scheme management”

Draft- One WASH Program Document Phase II Updating- May 2010
NATIONAL WASH COORDINATION OFFICE 44
Principles” listed in the table under Sub-section 11.6, including the longer-term concept of combining the
management of MVWS schemes with clustered large and small schemes
5.1.3Pastoralist Rural Water
Access to improved water supply and sanitation facilities in pastoralist areas of Afar, Somali, Benishangul Gumuz
and Gambella and pastoralist areas in Oromiya and SNNPR are relatively low compared to other areas and the
national average. Access levels for water and sanitation in pastoralist regions and woredas ranges from 39.5% to
61%, and from 6.5% to 21% respectively, while in the other parts of the country water and sanitation coverage
ranges from 62% to 95% and 41% to 76%, respectively.
The most common sources of drinking water in pastoralist areas are rivers, lakes, unprotected wells, springs,
hafirs, ponds, public and privately-owned taps. Due to the scarcity of water, poor sanitation and hygiene, some of
the pastoralist regions has experienced Acute Watery Diarrhea (AWD) and other hygiene related diseases,
commonly known as water washed diseases.
The major problems cited for poor sanitation development by HEWs, school officials, woreda health personnel
and community members are lifestyle of the pastoralists which are mobile in search of animal fodder and water,
shortage of resources, lack of commitment and awareness, weak inter sectoral collaboration, uncoordinated and
ineffective sanitation promotion efforts and lack of affordable construction materials for latrines.
Water supply schemes in lowland pastoralist areas should be constructed close to pasture lands and along
migration routes as hydrological and hydrogeological conditions permit. Involving clan leaders like Aba Ella (the
“Father of Water Wells” in Borana) in siting and technology selection can enhance the impact and sustainability
of water supplies in pastoral areas.
5.2 Rural Sanitation and Hygiene Promotion
5.2.1 Introduction
Since 2004 GoE, with development partners, have paid substantial attention to rural hygiene and sanitation by
implementing the program through the Health Extension Program who are promoting sanitation and hygiene at
grassroots level. Constructing and using pit latrines in rural Ethiopia has become more common after the
deployment of more than 38,000 HEWs in over 15,095 health posts at kebele level (2 HEW/kebele).
Promotion of sanitation and hygiene in Ethiopia follows a government endorsed Community Led Total Sanitation
and Hygiene (CLTSH) implementation guideline. Facilitation and community mobilization using this tool is usually
carried out by woreda level trained professionals with very limited follow up and demonstration. By design CLTSH
triggering will require prior planning and appointment for a convenient day with target communities, triggering
to adults and children in a well-controlled setting and a do-able action plan. There should be a persistent follow
up arrangement to ensure that communities are truly acting on their action plan designed on triggering day, give
technical support when digging latrines or upgrading existing latrines.
However, although the annual rate of reduction of open defecation in the country is recognized as the fastest
globally, the majority of toilets build are considered unimproved. In order to move up in the sanitation ladder and
increase the percentage of households using safely managed sanitation infrastructures, there is need to include
Draft- One WASH Program Document Phase II Updating- May 2010
NATIONAL WASH COORDINATION OFFICE 45
other strategies such as sanitation marketing which support the supply chains and improve the quality of the
facilities built by households.
Undeniably, the HEP has helped mobilizing households to build latrines and hand washing facilities in communities
where CLTSH has been conducted. There is considerable change especially in latrine construction but there is still
much work regarding latrine design and usage as many latrines are without superstructure or a squat hole cover,
have non-washable floors, do not provide adequate privacy, allow fly breeding and impart offensive smell and
overall there are about 38 million open defecators in Ethiopia.
Other key areas which are not fully addressed and require further attention in the second phase of the OWNP are
as:
• Personal hygiene integrated into sanitation interventions,
• Baby WASH, including the safe management of child faeces and a clean and safe environment for under
5 children
• Promoting the safe water chain including household water storage and safe use,
• Hygiene practices such as hand washing at critical times,
• Inclusion of MHM (Menstrual Hygiene Management) in shools (as part of the institutional WASH
component) but also supported with interventions at community level
• Sanitation and Environmental health of the immediate housing environment including safe solid and liquid
waste management as well as vector control measures
The fourth National Health Sector Development Program target in the GTP II period 82% improved sanitation
facilities and the National Hygiene and Sanitation Strategic Action Plan (NHSSAP), on the other hand, has indicated
to reach to 100%, 77% of household to practice hand washing with soap (or its equivalence) at critical times; 80%
of kebeles to become open defecation-free (ODF) areas; and 77% of households get either water treatment or
access to safe water.
5.2.2 Implementation
In order for the program to be effective a pragmatic program design and that which would strengthen the existing
initiative must be used in communities throughout the country. The new initiative is to design a “Community
Centered” planning and action program which would train and empower permanent residents in the community
including, religious leaders, women, HEW, WHDAs, development agents, teachers, students, and other community
leaders. Three major actors including: 1) community members 2) sector actors (HEW, WHDA, EHW, PHCU staff)
and the 3) political and administrative institutions [Woreda and Kebele leaders, Woreda WASH Team members
(Health, education, water, women and youth and agriculture)] must work together for one common end at the
kebele level.
There were sector actors who had advocated to focus on household centered approach (Roland Schertenleib) 23 .
Households produce some types of waste but unless all waste producing institutions in a community such as
institutions, industries, shops, markets etc… are not included the community will still be unclean and unhealthy.
Without undermining efforts on individual households, sustainable sanitation and hygiene programs is ensured
with mass action and mass responsibility which warrants empowering the whole community and enhance
23 Swiss center for development cooperation in technology and management, june 2000
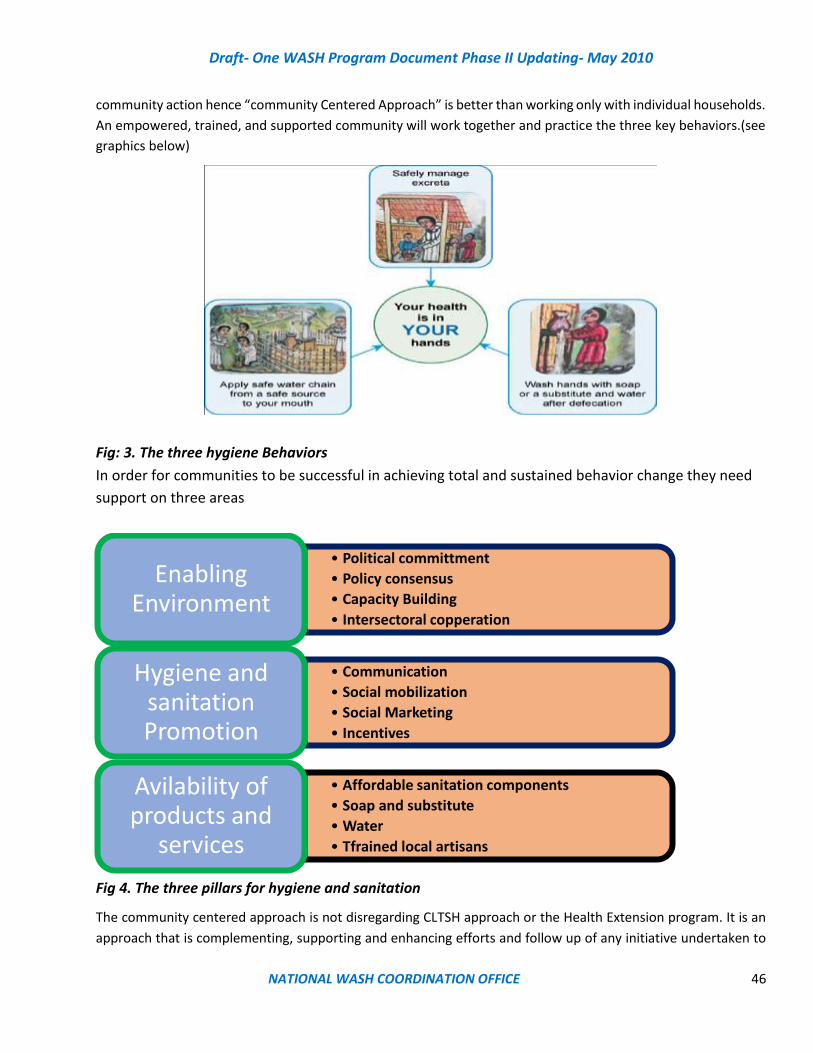
Draft- One WASH Program Document Phase II Updating- May 2010
NATIONAL WASH COORDINATION OFFICE 46
community action hence “community Centered Approach” is better than working only with individual households.
An empowered, trained, and supported community will work together and practice the three key behaviors.(see
graphics below)
Fig: 3. The three hygiene Behaviors
In order for communities to be successful in achieving total and sustained behavior change they need
support on three areas
Fig 4. The three pillars for hygiene and sanitation
The community centered approach is not disregarding CLTSH approach or the Health Extension program. It is an
approach that is complementing, supporting and enhancing efforts and follow up of any initiative undertaken to
• Political committment
• Policy consensus
• Capacity Building
• Intersectoral copperation
Enabling Environment
• Communication
• Social mobilization
• Social Marketing
• Incentives
Hygiene and sanitation Promotion
• Affordable sanitation components
• Soap and substitute
• Water
• Tfrained local artisans
Avilability of products and
services
Draft- One WASH Program Document Phase II Updating- May 2010
NATIONAL WASH COORDINATION OFFICE 47
make the change in WASH behave. Community centered approach is bringing the passive onlookers or the
beneficiaries themselves to the center of action and make them more responsible to make their communities
clean, healthy and dignified.
Lasting or sustained behavior change in sanitation and hygiene requires not only well tested tools like CLTSH,
community centered approach but also multi sectorial support, approach, systematized advocacy such as :multi-
level advocacy ;multilevel communication; strengthened household outreach; media support; increased
availability and affordability of hygiene and sanitation products through private commercial and NGO sector
initiatives; enhanced and systematized school hygiene and sanitation program; promotion and demonstration as
means of rapid change in behaviors.
With this arrangement and all the enabling environment in place the sanitation and hygiene program in
communities will be able to work to improve:
1. The unimproved and unsustainable latrine conditions will be transformed and newly constructed
latrines will follow the principles and construction methods of an improved latrine system.
2. That all households will have a functional and improved latrine used by everyone in the family and all
latrines will have a hand washing facility with soap or other substitute.
3. That all households especially with children wash infant babies and all children under five years of age.
4. All households consider child feces as harmful as adults and take proper action of disposing in latrines
immediately after child defecates.
5. That the community will be open defecation free
6. With proper behavior change and practice in using clean latrine and hand washing facilities,
communities could control the most prevalent and persistent tropical diseases such as trachoma,
ascariases, hookworm, filariasis, schistosomiasis etc.
5.2.3 Pastoralist Sanitation and Hygiene
At present hundreds of settlements are being established in pastoralist areas. However, the seasonal movement
is still practiced but women, the elderly and children are remaining behind in the village. This condition is allowing
for establishing schools and strengthening HEP in the settled village.
Hygiene, sanitation and water safety promotion in such pastoralist village may have to follow a different
methodology than the CLTSH approach which depends on creating disgust and fear. The pastoralist tradition is
very serious on privacy during defecation. Male and female open defecation areas are located in two different
opposing direction within a community making it difficult for the household to dig latrine near the house.
Hygiene, sanitation and water safety promotion should use simple and small do-able-actions first. Small do-able
actions are practices that have less demand for resources such as for example practicing hand washing using ash,
covering feces with soil, separating animals from human habitation, conducting sanitation campaign every week to
clean up the settlement and using simple pictorial communication methods such as MIKIKIR card used in Amhara
region. (Pictorial do-able action areas annex)
5.2.4 Sanitation Marketing
The Program will support the scaling-up of sanitation marketing as described in the National Sanitation Marketing
Guideline of June 2013. It is important that sanitation marketing is conceptually and programmatically integrated

Draft- One WASH Program Document Phase II Updating- May 2010
NATIONAL WASH COORDINATION OFFICE 48
and closely coordinated with related WASH activities, such as training artisans and establishing supply chains so
that both water supply and sanitation services and products are promoted as an integrated package.
Training for private sectors who would be taking sanitation as a business was developed by TVET. They have also
developed Occupational Standard (OS) so that sanitation marketing will be included in the 800 existing OS of
which some are of relevance to the different sections of the training manual designed which are now defined as
1) sanitation and hygiene, 2) latrine technology options, 3) business management and 4) marketing and
promotion. Quality control and standard for sanitation is the responsibility of Ministry of Health while Federal
Micro and Small Enterprise Development Agency (FEMSEDA) and TVET are responsible for the design and
construction of the product.
In regard to sanitation facilities, a study made by WSP and SNV on sanitation supply chain study in Amhara Region
published in February 2012 by WSP and SNV identified the following three business models:
i. ''Nisuhe lehulume’’ (clean for all) – for household latrines in rural areas. Affordable technologies such as
slabs/plastic pans are developed or adapted and promoted with distribution and services.
ii. ''Nisuhe lesferu" (clean for local) – adapted/expanded latrines to local contexts. Low-cost technologies in
design and slab production at local level are promoted. Masons and businesses are linked with health
workers and supported by service providers.
iii. Promotion, distribution and service modalities for existing products like San-plants and Turkish pans are
supported to extend outreach to rural areas.
To this end an on-site household latrine technology option planning, design and construction manual is published
and distributed for wider use. What need to be strengthened will be to establish sanitation marketing following the
four “p” principles and supported by the Micro-Finance Institutions.
5.2.5 Targeted Subsidy
It is the policy of the government that sanitation being a private matter should be financed by each individual
household. The objective of sanitation development is however to prevent disease, promote health, ensure
sanitary living fulfilling the cardinal objectives of the Ethiopian Federal Constitution. However, the poor, the old,
and the disabled who can’t afford to have safe sanitation system will be obliged to defecate in the open. This
practice therefore, makes the community in general vulnerable to health problems emanating from poor
environmental sanitation practices.
This warrants the establishment of financing or subsidy option for the poorest and the old who can’t afford to
build basic sanitation system. Subsidies that are targeted to the poor, old and the disables through community
selection process may be effective not only reaching the poor and the creation of equity but also the promotion
of public health and environmental safety.
5.2.6 Manuals, Guidelines and Information Materials
To date there are many resources that can be used to carry successful WASH program. In addition to the strategies,
there are also guidelines developed by sector ministries and partners. Of particular relevance are the following
documents issued by the Ministry of Health: Implementation Guideline for CLTSH Programming, January 2012;
CLTSH Facilitation Training Guide, Jan. 2011, and CLTSH Verification and Certification Protocol (2012), National
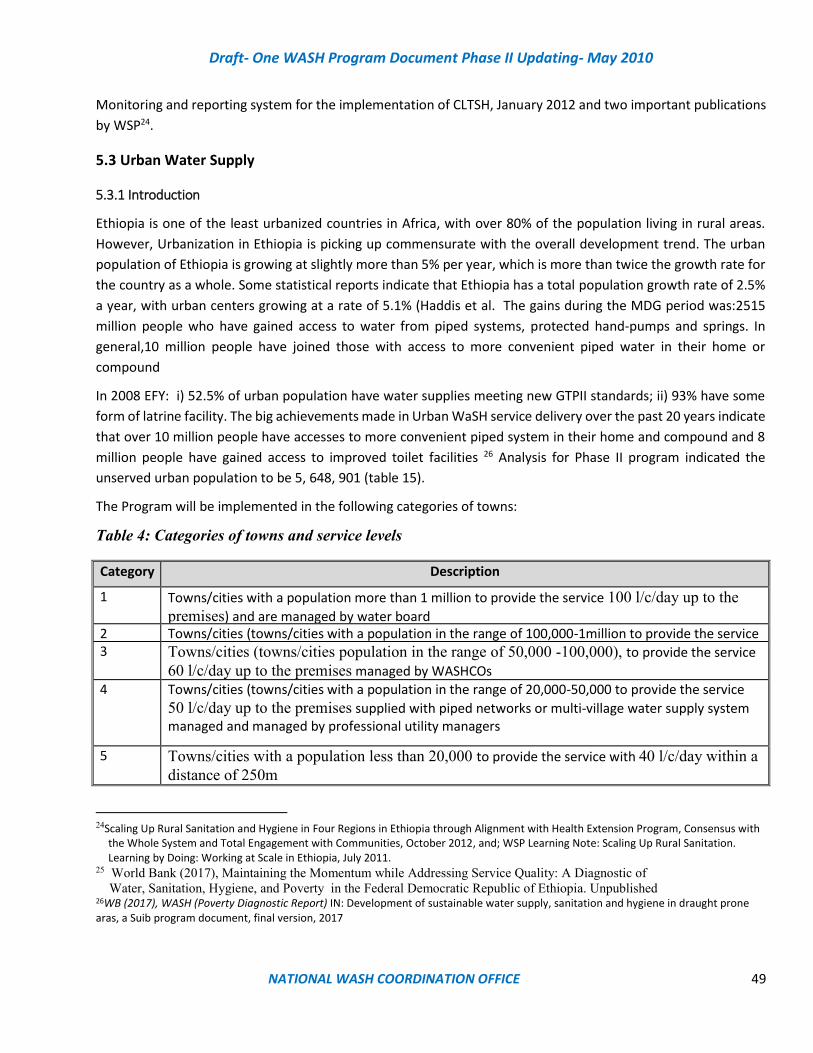
Draft- One WASH Program Document Phase II Updating- May 2010
NATIONAL WASH COORDINATION OFFICE 49
Monitoring and reporting system for the implementation of CLTSH, January 2012 and two important publications
by WSP24.
5.3 Urban Water Supply
5.3.1 Introduction
Ethiopia is one of the least urbanized countries in Africa, with over 80% of the population living in rural areas.
However, Urbanization in Ethiopia is picking up commensurate with the overall development trend. The urban
population of Ethiopia is growing at slightly more than 5% per year, which is more than twice the growth rate for
the country as a whole. Some statistical reports indicate that Ethiopia has a total population growth rate of 2.5%
a year, with urban centers growing at a rate of 5.1% (Haddis et al. The gains during the MDG period was:2515
million people who have gained access to water from piped systems, protected hand-pumps and springs. In
general,10 million people have joined those with access to more convenient piped water in their home or
compound
In 2008 EFY: i) 52.5% of urban population have water supplies meeting new GTPII standards; ii) 93% have some
form of latrine facility. The big achievements made in Urban WaSH service delivery over the past 20 years indicate
that over 10 million people have accesses to more convenient piped system in their home and compound and 8
million people have gained access to improved toilet facilities 26 Analysis for Phase II program indicated the
unserved urban population to be 5, 648, 901 (table 15).
The Program will be implemented in the following categories of towns:
Table 4: Categories of towns and service levels
Category Description
1 Towns/cities with a population more than 1 million to provide the service 100 l/c/day up to the
premises) and are managed by water board 2 Towns/cities (towns/cities with a population in the range of 100,000-1million to provide the service
80 l/c/day up to the premises and are managed by water board 3 Towns/cities (towns/cities population in the range of 50,000 -100,000), to provide the service
60 l/c/day up to the premises managed by WASHCOs 4 Towns/cities (towns/cities with a population in the range of 20,000-50,000 to provide the service
50 l/c/day up to the premises supplied with piped networks or multi-village water supply system managed and managed by professional utility managers
5 Towns/cities with a population less than 20,000 to provide the service with 40 l/c/day within a
distance of 250m
24Scaling Up Rural Sanitation and Hygiene in Four Regions in Ethiopia through Alignment with Health Extension Program, Consensus with
the Whole System and Total Engagement with Communities, October 2012, and; WSP Learning Note: Scaling Up Rural Sanitation. Learning by Doing: Working at Scale in Ethiopia, July 2011.
25 World Bank (2017), Maintaining the Momentum while Addressing Service Quality: A Diagnostic of
Water, Sanitation, Hygiene, and Poverty in the Federal Democratic Republic of Ethiopia. Unpublished 26WB (2017), WASH (Poverty Diagnostic Report) IN: Development of sustainable water supply, sanitation and hygiene in draught prone aras, a Suib program document, final version, 2017
Draft- One WASH Program Document Phase II Updating- May 2010
NATIONAL WASH COORDINATION OFFICE 50
5.3.2 Implementation
The Urban WASH component is implemented through two modalities. The capacity building, planning and service
improvement are implemented through grant financing. Finance for water supply expansion will be provided on
a soft loan basis. Accordingly, the process and institutional arrangements differ. At town level there are two WASH
structures and processes; one for water supply and one for urban sanitation and hygiene. Both will be integrated
in the Consolidated Annual WASH Plan which will be approved by the City Council or Town Board.

Draft- One WASH Program Document Phase II Updating- May 2010
NATIONAL WASH COORDINATION OFFICE 51
The following diagram shows the organization and process for implementation of urban water supply:
Federal
Region
Town
Figure 5: Organization and Process for Urban Water Supply
Key: RWCO - Regional WASH Coordination Office
CAP - Consolidated Annual (WASH) Plan
CAP
NWCO
RWCO
PMUs (4)
PMUs (4)
City WASH Team
CAP
NWSC
TA
TA
TA
City Council
CAP
Appraisal
Water Board
Water Utility
Drilling
Appraisal
Citizen Forums
Construction
Loan
Loan
Loan
WRDF
TA
Draft- One WASH Program Document Phase II Updating- May 2010
NATIONAL WASH COORDINATION OFFICE 52
5.3.3 Improving Efficiency in Construction and Operation of Water Supply Systems
Many urban water supply projects in Ethiopia encounter significant delays in planning and implementation due to
lengthy identification and selection process, procurement procedures, poor performance of contractors, cost
escalation and budget overruns, among other reasons.
To address these constraints, transaction times and costs can potentially be reduced or controlled by one or more
of the following means:
1. Offering contracts in larger lots, for example for studies, borehole drilling, source development for more
than one town with similar types of sources, civil works, electro-mechanical installations, wastewater
treatment facilities, etc.
2. Turnkey contracts combining feasibility studies, detailed designs, business planning, construction
supervision and post-construction support. Turnkey contracts combining civil works and electro-
mechanical installation have already been awarded by the Water Resources Development Fund (WRDF).
It is reported that the implementation period has been reduced from over two years to around one year.
3. Framework contracts with a consortium of firms/organizations to provide a suite of services to a group of
towns over a longer time period also has a potential to significantly reduce transaction costs and time.
4. Service contracts between town utilities and private operators to operate completed water supply
schemes can also be considered where town utilities have limited capacity to operate and maintain
systems can also be considered. In such arrangements, supervision/regulation of the operator is very
important.
5.3.4 Construction Supervision
Effective supervision of construction projects is essential to ensure the quality and functionality of works.
However, construction supervision has typically not received sufficient attention in water supply projects, and the
ultimate responsibility for supervision has been diffuse and unclear. As a result, deficient works in some schemes
had to be redone by abandoning the earlier structures or required excessive maintenance without delivering the
intended service. This resulted in increased project costs as well as negatively affecting the integrity, safety and
functionality of the schemes.
In water supply projects, especially in rural areas and small towns, supervision has been carried out by the regional
bureaus. Supervision of water supply works in medium and large town is usually outsourced to the private sector.
Supervision is not typically done through daily on-site inspections, but rather through periodic site visits.
• The capacity for adequate supervision of construction projects needs strengthening. Inspections should
assess the validity of design assumptions; identify variations between actual site conditions and designs,
to adjust designs according to changed parameters if required. Supervision should help to ensure that
construction is carried out according to plans, design and specifications and certify that work is
progressing according to schedule, and that quality and costs are monitored.
• Appropriate supervision skills are essential if projects are to be completed on time, within budget and
meet quality standards. The Program will promote measures to address existing shortcomings in
construction supervision practices through supporting preparation of standardized
supervision/inspection reports and guidelines.

Draft- One WASH Program Document Phase II Updating- May 2010
NATIONAL WASH COORDINATION OFFICE 53
• Supervisors must have adequate knowledge in water supply/civil designs and construction methods,
materials, manpower requirements as well as time scheduling and costing. At woreda, zonal and town
levels, construction supervision and contract management will be strengthened through the provision of
professional training to supervisors and provision of technical assistance to prepare manual and guidelines
for supervision of medium and large water supply schemes. Training will be provided by qualified trainers
from a recognized training institute and should also include the private sector; TSGs and WSGs and
supervision of drilling as well as civil works, electro-mechanical instillation, pipes, pumps and other
materials, manpower and input and cost control.
5.3.5 Sustainability
Regarding sustainability of rural and urban water supply management systems, a more enabling environment is
needed as detailed below
• Clustering of urban and rural piped systems for economy and scale and sharing resources and for
facilitation of future utilities regulatory bodies. This may be on voluntary basis in short to medium
term and formal basis in medium to long term dependent on government strategy yet to be agreed
(the principle of clustering is described IUSHS&SAP and is widely used informally in Ethiopia for
sharing limited resources)
Fig.6 Clustering potential in WASH
• Develop/update the business plans of individual or clustered utilities and develop use of performance
agreements that incentivization plans to retain and motivate skilled and highly trained personnel.
• All urban systems should be electricity grid connected. Diesel generators should be installed, but only
for back-up of critical system components, such as source pumping to elevated tanks. For small towns,
alternative cheaper energy sources should be considered to supplement grid supply, so as to improve
affordability27.
27 Learning from national and regional research into alternative renewable energy technologies
Draft- One WASH Program Document Phase II Updating- May 2010
NATIONAL WASH COORDINATION OFFICE 54
• Tariffs set at “ability to pay” levels following project socio-economic, financial and technical analyses
(See Guidelines Annex 2), and not set through regional or Woreda directives. Tariffs may also be
influenced by willingness to pay so that the formation and involvement of Water User Groups in tariff
setting is also necessary. Where tariffs do not match the costs of the desired service level, then either
the service levels have to be decreased (but not below 30 l/c/d) and/or subsidies have to be found.
• Water available when needed, that is, 16-hour supply for house connections, water points should be
open based on demand with short waiting time (street rotas can be introduced if necessary)
• ESIA (environmental and social impact assessment) carried out at project feasibility stage to as to
understand what impact the project may have in 5 or 15 years’ time and to mitigate negative impacts.
• It is essential that urban water supplies are matched by faecal sludge management (FSM) services,
solid waste management and surface water drainage. Without these components the health impact
of new or improved water supply may in fact be negative. Hence urban water funding should be
conditional on sanitation to mitigate health and environmental impact. (See guidelines of
sustainability planning, Annex 2, and also the experience in the 8 towns under One WASH+).
• Reduce wastage by consumers in the home, at water points, during transport, etc. Less wastage will
reduce standing water
• Quick response to mechanical breakdown and quick response to leaks (so as to reduce NRW and
overall costs).
• Install computerized information system for asset and data management and bill collection systems,
appropriate to the size of the utility, taking advantage of sharing (point 1 above)
• Consumers are willing to pay for a good service, which will depend upon many of the points above.
“Willingness to pay”, unlike “ability to pay”, cannot be determined from data as a particular figure;
however, experience from elsewhere is that low income customers are willing to pay a higher
percentage of household income for water than middle and high-income customers. This is partly due
to the significant improvement with previous reliance on poor quality water provided through
vendors at high cost or long distances to collect water and time and risk involved for young family
members.
5.3.6 Water Quality
5.3.6.1 Introduction
The Ministry of Health has prepared a National Drinking Water Quality Monitoring and Surveillance Strategy
(2011). The two main sectors responsible for drinking water quality, MoH and MoWIE and their regional bureaus,
have operated primarily within their own sectoral priorities and mandates. After the signing the MoU and WIF,
the roles of the two sectors have been further clarified and the importance of coordination is affirmed. The
Ministry of Health is responsible for periodic monitoring of water quality after water supply schemes are
commissioned through their regional bureaus and woreda offices. MoWIE will test water quality of proposed
surface water and groundwater sources before construction and commissioning of the schemes and will be
responsible for identifying and implementing mitigation measures in areas with naturally occurring water
chemistry issues such as high fluoride, iron, arsenic and salinity. Urban water utilities level 1-3 are expected to
establish a laboratory and carry out water quality monitoring on daily bases. Utilities level 4-5 and rural water
supply schemes are also expected to be checked on regular bases.
Draft- One WASH Program Document Phase II Updating- May 2010
NATIONAL WASH COORDINATION OFFICE 55
Priority has to be given for water safety plan by each project during study and design stage of water supply to
assist the water quality monitoring which will be performed by the Utility and OR WASHCo and other concerned
sector office.
5.3.6.2 Implementation
The Program provides an opportunity to move the above Strategy forward by first obtaining approval of the
ministries of health and water and energy and thereafter supporting implementation of the Strategy, primarily
through strengthening water quality monitoring and surveillance, particularly in urban water supplies and in acute
hot spots28, data collection and database design and management, publication and dissemination of information,
communication and performance assessments.
There is a need for technical and logistic support to strengthen already functioning public health laboratories at
least for cluster of towns and woredas. Due to the limitation of transportation taking sample from a site to the
laboratories may be a daunting task as a bacteriological sample has to reach a laboratory within 6 hours. Such
problems can be solved through the use of portable water testing kits especially for rural areas.
The establishment water surveillance program using kits is being promoted by government and through support
from UNICEF and other partners. Training, designing a protocol or guideline and a system of work and reporting
may be necessary to establish water quality surveillance as one important WASH program for Ethiopia.
5.3.6.3 Standards and Guidelines
The applicable standard for drinking water quality in Ethiopia is the Ethiopian Drinking Water Quality Standard:
ES2601:2001 (second edition), which includes reference values for bacteriological, chemical and physical water
quality parameters.
It is estimated that by 2020, the volume of wastewater generated from Addis Ababa alone, much of which enters
the Awash and Akaki Rivers, will exceed 200,000 m3/day or 73 M m3/year, of which an estimated 10% is industrial
wastewater29. At present there are no national standards for industrial and domestic wastewater. Developing such
guidelines and associated directives and regulation as a collaborative effort between the Environmental
Protection Authority (EPA) and MoWE is an urgent priority.
5.4. Urban Sanitation and Hygiene
Urban sanitation has been re-emphasized many times since the start of the OWNP as being a key development
objective (GTP II, IUSHS&SAP, WB WS&S new project proposal (PAD), etc.). Urban sanitation problem sources are
from sewerage, septic tanks/ cesspits, pit latrines, domestic solid wastes and industrial, institutional and
commercial liquid and solid wastes30. Mitigation factors among other things include capacity building, institutional
reform, hygiene education and promotion and regulatory actions.
28Hot spots include areas where the risk of contamination of drinking water and related disease transmission are high. 29Urban sanitation and wastewater treatment in Addis Ababa, Ethiopia, D. Van Rooijen and G. Taddesse, Addis Ababa, 2009.
30SDG6.3: By 2030, improve water quality by reducing pollution, eliminating dumping and minimizing release of hazardous chemicals and
materials, halving the proportion of untreated wastewater and substantially increasing recycling and safe reuse globally
Draft- One WASH Program Document Phase II Updating- May 2010
NATIONAL WASH COORDINATION OFFICE 56
Since the responsibility lies with many stakeholders in government, community, and private stakeholders which
are outside the direct influence or control of the four key ministries which are current signatories to the WIF31. It
is therefore necessary to establish holistic coordination mechanism with the relevant stakeholders.
Inclusion of sanitation should be ensured at local level: With some exceptions, all urban WASH projects proposed
for funding should include sanitation as a pre-condition for finance. In addition, “sustainability master plans and
feasibility studies” must clearly demonstrate how the operational and financing costs of the chosen levels of
technology can and will be funded; through direct charges/tariffs, cross subsidy to sanitation from water sales,
municipal rates, central government grants, etc.
When considering GTPII targets for sewerage (6 cities where at least 100 l/c/d would be required to flush sewers
to off-site treatment) then this would increase urban water investment very much more32. However, the
IUSHS&SAP recommends decentralized wastewater treatment and this appears to be the direction taken under
the new WB33 Ethiopia Second WS&S project PAD March 2017 proposals; except for Addis Ababa where sewerage
will be expanded. DEWWATs allow for minimal pour flush using waste water so can be used with current urban
water supply availability (less than 30 l/c/d34).
It is difficult to consider “urban sanitation” without also including SWM, since human health and environmental
degradation may be significantly impacted, besides the associated aesthetic and public and international
perceptions. Domestic SWM as well as industrial liquid and solid are not included in the OWNP short-term
measures (GTP2, Section 15) but the necessary involvement of the Ministry of Urban Development and
Construction and the Ministry of Environment has been highlighted in GTPII35 and other stakeholders36.For
guidance on urban sanitation refer to Annex 6.
Some of the principles or critical steps for urban water and MVWS schemes(See Sub-sections 5.1 and 6.4)are also
applicable to urban sanitation:
It is common for septic “holding” tanks in urban areas to (illegally) be made leaky, even where soil soak away
capacity is limited or where there is insufficient land for safe liquid effluent treatment. This is understood to avoid
the high cost and/or unavailability of vacuum trucks. Planning for new schemes should involve ground
vulnerability maps to determine which areas are suitable for septic tank and soak away and which areas should
stay as dry toilets (VIP latrines) until off-site sewerage (or alternative DEWWATs) is available.
For a full description or urban sanitation implementation and O&M, refer to the IUSHS&SAP as well as relevant
parts of Annexes 5 and 6.
31 GTPII Goal 4.5: Strengthen WaSH integration to meet the objectives of OWNP and establish coordination with MoUDC and its affiliates at all levels in urban WaSH intervention 32See Section 7 for potential impact of this on high level cost estimates 33As stated by WB, the huge budget needed for urban sanitation is not allocated in the Consolidated WASH Account 34 COWASH: With the current consumption of 30l/c/d, implementing GTPII will be a challenge 35Goal 4.5: Strengthen WaSH integration to meet the objectives of OWNP and establish coordination with the MoUDC and its affiliates at all levels in urban WaSH interventions 36As stated by DFID, the Ministry of Urban Development and Ministry of Environment is crucial for OWNP to be coordinated

Draft- One WASH Program Document Phase II Updating- May 2010
NATIONAL WASH COORDINATION OFFICE 57
5.5 Institutional WASH
5.5.1 School WASH
WHO defines a healthy school as one that constantly strengthens its capacity as a healthy setting for living,
learning, and working37. A healthy school environment is one that protects students and staff against immediate
injury or disease and promotes prevention activities and attitudes against known risk factors that might lead to
future diseases or disability.38
In Ethiopia schools often have inadequate water and sanitation facilities. In 2015:
➢ 11% of primary schools had appropriate water facilities and 3.2% have all WaSH facilities
➢ 24% of primary schools had appropriate water facilities and 10% have all WaSH facilities
The provision of safe water and sanitation facilities combined with hygiene education contributes to improving
school enrolment and attendance, and can potentially lower the drop-out rate, especially of girls. Educating girls
is the single most effective tool for raising economic productivity, girls who are denied education are not only
more vulnerable to poverty, hunger, violence, abuse and exploitation, but they are also more likely to die in
childbirth and are at greater risk of diseases.
To address the problem of inadequate water supply and sanitation in schools, MoE has developed the following
working documents:
• Developing a School WASH Strategy and action plan
• Developing guidelines for water and sanitation needs of school children
• Develop gender and age sensitive curriculum on sanitation and hygiene
• Establish standards for construction of school latrines and hand washing facilities
• Upgrade life skills of school children and teachers on sanitation and hygiene education
• Establish health/environmental/school WASH clubs and promote children as agents of change
Latrine to stance ratio: The general recommended ratio set by Ministry of Education is:
• one stance/cubicle per 50 girls and one toilet for female staffs in rural schools
• one stand/cubicle and one urinal per 75 boys and one toilet for male staffs in rural schools
• In the case of regional capital cities and city administration towns, the number of seat to student ratio
should be one stance for every 25 girls and one toilet for female staffs and one stance plus one urinal for
every 50 boys and one toilet for male staffs
At least one toilet cubicle should be accessible for staff, boys and girls with disabilities, preferably one
for females and one for males. This includes level or ramped access, wide door and sufficient space inside
for a wheelchair user or helper to maneuver, and the provision of support structures such as a handrail
and toilet seat.39
37 WHO. Healthy Nutrition: an Essential Element of a Health-promoting School, Information Series on School Health. WHO, 1998. 38 American Academy of Paediatrics. Committee on School Health, School Health Policy and Practice, Fifth Edition, 1993.
39 Federal MoE, (October 2017), National School Water, Sanitation and Hygiene Implementation Guideline
Draft- One WASH Program Document Phase II Updating- May 2010
NATIONAL WASH COORDINATION OFFICE 58
The design and construction manual for water supply and sanitary facilities in primary schools40and the
production of a package of multi-media materials designed to promote sanitation and hygiene in schools has been
produced by the Ministry of Education with support from UNICEF.
The Program will support the review, updating and/or adaptation, translation and dissemination of relevant
materials to ensure consistency with the Program’s organization, planning procedures, reporting requirements
and monitoring indicators.
Currently, health and education WASH capital works and operational costs are poorly funded through regular
sector budgets (since WASH is not ring-fenced) and are (inadequately) “temporarily” financed through the CWA.
This system should be changed within the short term (to 2020) to ensure that that all in-premises institutional
WASH facilities are built and operated through regular ministry budgets (whatever the source of funds; GOE, loans,
grants, CSO, private, etc. OWNP (including CWA) funding should be confined to services to the boundary of
institutional premises (including prisons, churches, government offices, education and health).
The role of health and education under the OWNP will then be primarily one of promotion of WASH practices and
advocacy for better services and community involvement (see IUSHS&SAP and H&EHS).
MoE is understood to be currently drafting an institutional framework for school WASH for effective and efficient
implementation of the OWNP. Integral to this strategy should be central (ministry) budget ring-fenced funding for
all “in-premises” capital, operational and maintenance/replacement WASH costs. It has been proposed to
leverage additional finance for Institutional WASH interventions by integrating with Health Care Financing
Initiative, CASH, and mobilizing resources from communities and private investors.
The school WASH program demands more attention because the facilities and proper practices are considered to
be a major life skill learning to children. Children practicing good hygiene behavior in schools may also transfer
the behavior to the family members. It is therefore a way of changing the generation for good and it is
recommended that: BY principle school WASH should have:
• Institutions should be provided with full package of WASH services (latrine, hand washing, MHM facilities,
urinals, drinking water fountains/taps)
• The latrine facilities should be male/female separated usually located at two corners of the school
compound.
• Latrines, hand washing facilities and drinking water taps must be designed considering disability,
children’s age and height to ensure easy accessibility
• The MHM facilities which will consist of a separate structure with running water or water from Jerry can,
floor drainage, pad washing, disposal facility and drying rack and supply of pads with resting facility for
adolescent girls should be available in all schools.
• School WASH forums at regional and Woreda level should be formed in order to reduce the lack of
awareness on OWNP from federal to lower level, and for knowledge exchange, experience sharing and
learning.
• Having the facilities is not enough but the operation and management aspects of WASH facilities especially
in cleaning the sanitation, hygiene and water facilities must be strengthened.
40Design and Construction Manual for Water Supply and Sanitary Facilities in Primary Schools, MoE, MoWIE, UNICEF, 2012.

Draft- One WASH Program Document Phase II Updating- May 2010
NATIONAL WASH COORDINATION OFFICE 59
• One of a new initiative recommended to schools is the use of vacuum truck to pump out sludge from the
school latrine. Construction of safe and cleanable latrine with secured doors and solid walls for privacy
costs a lot of money. Instead of abandoning such latrines and dig a new one each time it is filled, pumping
out the sludge and renewing the pit is cost effective. 6.5.2. Manuals, Guidelines and Information Materials
• Allocate budget to support strengthening of WASH services in schools.
5.5.2 WASH in Health Facilities
Lack of improved drinking water, sanitation and hygiene facilities in health centers, health posts, Clinics and public
hospitals are particularly un acceptable. Absence or inadequate hand washing before and after patient contact or
after using the toilet leads to preventable infections in the health care environment41.
In Ethiopia there are 15,095 health posts, 2,660 health centers, 122 public hospitals and 4,000 private for-profit
and not-for-profit clinics. The water, hygiene and sanitation situation in the health facilities is poor, it is estimated
that as many as 80% of the health facilities are without adequate water and sanitation facilities, and 97% are
without hand washing facilities. The Program will support construction or rehabilitation of water supply facilities
and latrines at health centers and health posts. MoH, through regional/city bureaus and woreda and town health
offices, will be responsible for WASH construction activities in health facilities. Implementation may be through
WMP or CMP.
A design and construction manual for WASH facilities in health institutions42 has been produced by the Ministry
of Health with support from UNICEF. This manual has been distributed to all regions and should be used in
planning WASH facilities in health institutions.
5.6 Enabling Environment, Sector Coordination and Program Management
Program management and capacity building component aimed at facilitating other components to effectively
implement the OWNP. Capacity development efforts are targeted to achieve more effective and quality WASH
program implementation and to sustain outcomes at all levels. In order to achieve OWNP objectives we need to
enhance institutional and management capacity of the WASH to solve challenges and address development needs
of WASH sectors in a sustainable manner.
This component includes support to improve skills and capacity of WASH organizations and implementing parties
at federal, regional/city, woreda/town and kebele and community levels to plan, manage and monitor Program
activities as well as strengthening M&E capacity at all levels and support to qualitative research and studies. This
will be done through provision of training, equipment, tools, and, where required, software for monitoring and
reporting, GIS and accounting and billing systems and post-construction management and technical support.
The capacity building intervention areas include strengthening the legal and regulatory framework, strengthening
safeguard and fiduciary management, establishment of WASH MIS, working tools [office equipment, vehicles,
guidelines and manuals], recruitment of the much-needed sector personnel to fill gaps and development of
human resources skills in different areas.
41 Rehfuess EQ. Bruce N.Bartram JK (2009). More health for your buck: health sector functions to secure environmental health. Bulletin of
the World Health Organization, 87: 880-882(http:/www.wh.in/bulleting/volumes/87/11/08-059865/en/index.html, accessed 12 January 2012).
42Design and Construction Manual for WASH Facilities in Health Institutions, MoH and MoWIE in collaboration with UNICEF, 2012

Draft- One WASH Program Document Phase II Updating- May 2010
NATIONAL WASH COORDINATION OFFICE 60
WASH manuals, guidelines and other relevant training materials for capacity building will be reviewed, updated
and adopted. Technical manuals including operation and maintenance are required for different types and
components of urban and rural WASH; manuals will be both in English and different local languages as appropriate
for the intended user group.
5.7: Sustainable and climate resilient WASH services
5.7.1. Emergency preparedness, response and recovery WASH
Emergency is an unfortunate happening in a country or society manifested in different ways. The most common
emergencies are flood, fire, draught, etc. In Ethiopia common emergencies are created during draught and flood.
The most common and frequent is draught. During emergency people in the affected areas may have to move to
a different presumably safe location. In this instance the most affected are children, women, and the elderly. The
most important need of this affected population in such instances is food, water, sanitation and hygiene services
and shelter which are difficult to have in place unless prior preparedness is made.
According to UNICEF Preparedness for emergencies include
▪ Planning for emergency staff deployment
▪ Pre-positioning of strategic supplies
▪ Preparation of pre-approved contracts with local implementation partners (such as water trucking
companies) and suppliers
▪ Advance coordination arrangements with government partners and other stakeholders through the cluster
approach.
Ethiopia is in a better position in tackling emergencies due mainly of its infrastructure and mix of professionals
that can be deployed for emergencies at any level. However, to be better prepared:
1. Sector staff should have appropriate basic training
2. A manual for WASH emergency which will include application of:
▪ Chlorination, storage and distribution of safe water
▪ Construction of safe latrine, hand washing station, shower services and operation and management
arrangements
▪ Solid waste collection and disposal facilities
These demand a budget set aside for emergencies with the necessary financial procedures to follow during
emergencies.
5.7.2. Sustainable and Climate Resilient WASH
This is a new component which has objectives focusing on health and well-being of draught affected rural and
urban areas. Although the program is also designed to address draught affected areas in the past, it will have
prominence and focus during phase II. In the process, attention will be given to look for more reliable water
source, use of modern and cost-effective techniques for assessing ground water potentials and expand service
levels not only for humans but also consider animals.
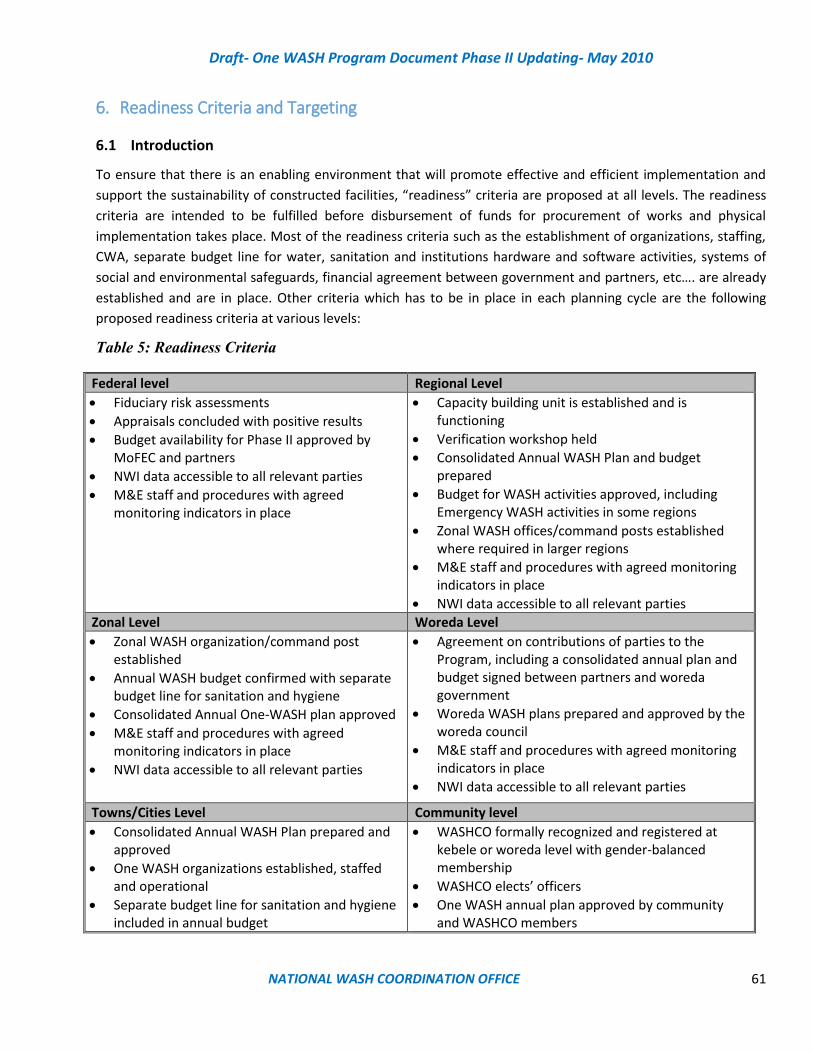
Draft- One WASH Program Document Phase II Updating- May 2010
NATIONAL WASH COORDINATION OFFICE 61
6. Readiness Criteria and Targeting
6.1 Introduction
To ensure that there is an enabling environment that will promote effective and efficient implementation and
support the sustainability of constructed facilities, “readiness” criteria are proposed at all levels. The readiness
criteria are intended to be fulfilled before disbursement of funds for procurement of works and physical
implementation takes place. Most of the readiness criteria such as the establishment of organizations, staffing,
CWA, separate budget line for water, sanitation and institutions hardware and software activities, systems of
social and environmental safeguards, financial agreement between government and partners, etc…. are already
established and are in place. Other criteria which has to be in place in each planning cycle are the following
proposed readiness criteria at various levels:
Table 5: Readiness Criteria
Federal level Regional Level
• Fiduciary risk assessments
• Appraisals concluded with positive results
• Budget availability for Phase II approved by MoFEC and partners
• NWI data accessible to all relevant parties
• M&E staff and procedures with agreed monitoring indicators in place
• Capacity building unit is established and is functioning
• Verification workshop held
• Consolidated Annual WASH Plan and budget prepared
• Budget for WASH activities approved, including Emergency WASH activities in some regions
• Zonal WASH offices/command posts established where required in larger regions
• M&E staff and procedures with agreed monitoring indicators in place
• NWI data accessible to all relevant parties
Zonal Level Woreda Level
• Zonal WASH organization/command post established
• Annual WASH budget confirmed with separate budget line for sanitation and hygiene
• Consolidated Annual One-WASH plan approved
• M&E staff and procedures with agreed monitoring indicators in place
• NWI data accessible to all relevant parties
• Agreement on contributions of parties to the Program, including a consolidated annual plan and budget signed between partners and woreda government
• Woreda WASH plans prepared and approved by the woreda council
• M&E staff and procedures with agreed monitoring indicators in place
• NWI data accessible to all relevant parties
Towns/Cities Level Community level
• Consolidated Annual WASH Plan prepared and approved
• One WASH organizations established, staffed and operational
• Separate budget line for sanitation and hygiene included in annual budget
• WASHCO formally recognized and registered at kebele or woreda level with gender-balanced membership
• WASHCO elects’ officers
• One WASH annual plan approved by community and WASHCO members
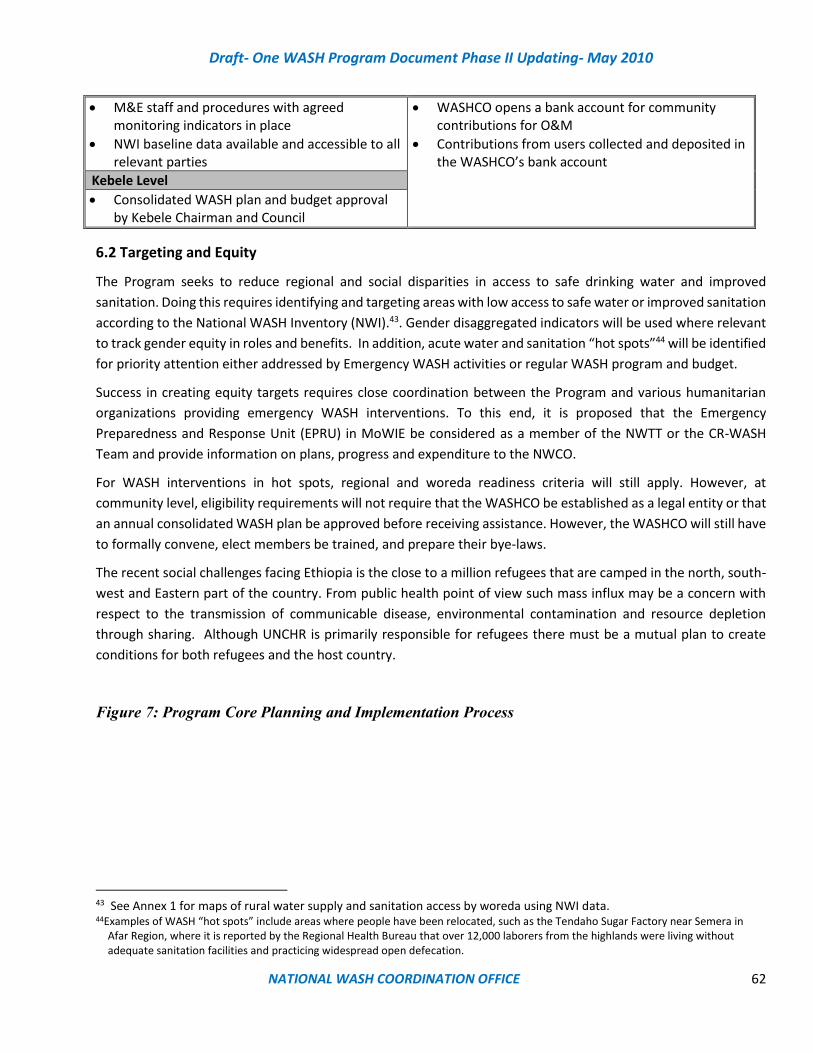
Draft- One WASH Program Document Phase II Updating- May 2010
NATIONAL WASH COORDINATION OFFICE 62
• M&E staff and procedures with agreed monitoring indicators in place
• NWI baseline data available and accessible to all relevant parties
• WASHCO opens a bank account for community contributions for O&M
• Contributions from users collected and deposited in the WASHCO’s bank account Kebele Level
• Consolidated WASH plan and budget approval by Kebele Chairman and Council
6.2 Targeting and Equity
The Program seeks to reduce regional and social disparities in access to safe drinking water and improved
sanitation. Doing this requires identifying and targeting areas with low access to safe water or improved sanitation
according to the National WASH Inventory (NWI).43. Gender disaggregated indicators will be used where relevant
to track gender equity in roles and benefits. In addition, acute water and sanitation “hot spots”44 will be identified
for priority attention either addressed by Emergency WASH activities or regular WASH program and budget.
Success in creating equity targets requires close coordination between the Program and various humanitarian
organizations providing emergency WASH interventions. To this end, it is proposed that the Emergency
Preparedness and Response Unit (EPRU) in MoWIE be considered as a member of the NWTT or the CR-WASH
Team and provide information on plans, progress and expenditure to the NWCO.
For WASH interventions in hot spots, regional and woreda readiness criteria will still apply. However, at
community level, eligibility requirements will not require that the WASHCO be established as a legal entity or that
an annual consolidated WASH plan be approved before receiving assistance. However, the WASHCO will still have
to formally convene, elect members be trained, and prepare their bye-laws.
The recent social challenges facing Ethiopia is the close to a million refugees that are camped in the north, south-
west and Eastern part of the country. From public health point of view such mass influx may be a concern with
respect to the transmission of communicable disease, environmental contamination and resource depletion
through sharing. Although UNCHR is primarily responsible for refugees there must be a mutual plan to create
conditions for both refugees and the host country.
Figure 7: Program Core Planning and Implementation Process
43 See Annex 1 for maps of rural water supply and sanitation access by woreda using NWI data. 44Examples of WASH “hot spots” include areas where people have been relocated, such as the Tendaho Sugar Factory near Semera in
Afar Region, where it is reported by the Regional Health Bureau that over 12,000 laborers from the highlands were living without adequate sanitation facilities and practicing widespread open defecation.

Draft- One WASH Program Document Phase II Updating- May 2010
NATIONAL WASH COORDINATION OFFICE 63
Federal
Region/Zone/City
Woreda/Town
Kebele/Community
Approved Consolidated
Annual WASH Plan/Budget
Quarterly Disbursement from
MOFEC to Ministries
Implementation Plan/ Budget Approved
Progress Report/Fund
Request Verified
Progress Report/Request
Submitted to Ministries Approved Consolidated
Annual WASH
Plan/Budget
Disbursement from
BoFEC to
Bureaus/IPs/SPs
Quarterly Disbursement
from MOFEC to BoFECs
Regional/City Readiness
Criteria Fulfilled
Woreda/Town Readiness
Criteria Fulfilled
Approved Consolidated Annual
WASH Plan/Budget
Quarterly Transfers from BoFEC to WoFEC/Town
Board/IPs/SPs
Transfers from WoFED to
WASHCOs/IPs/SPs
Community Readiness Criteria Fulfilled
Progress Report/Request
Submitted to Bureaus
Key: IP-Implementing
Federal Readiness Criteria
Fulfilled

Draft- One WASH Program Document Phase II Updating- May 2010
NATIONAL WASH COORDINATION OFFICE 64
6.3 Program Implementation Process
The following diagram shows the organization and sequence of activities for the Program’s core planning and
implementation process at federal, regional, city, zone, woreda, kebele and community levels. The keystone of
Program planning and implementation is the Consolidated WASH Plan at woreda, region, city/town and federal
levels. These plans will include a budget and procurement plan. (see fig 5.1)

Draft- One WASH Program Document Phase II Updating- May 2010
NATIONAL WASH COORDINATION OFFICE 65
7. Program Organization and Partnerships
7.1 Program Organization
The highest governing body in the Program is the National WASH Steering Committee (NWSC) whose members
include Ministers and State Ministers from the ministries of Water, Irrigation and Energy, Health, Education and
Finance and Economic Development. The NWSC is chaired by the Minister of Water and Energy.
The technical arm of the NWSC is the National WASH Technical Team (NWTT) consisting of Directors from the four
WASH ministries. A similar structure is prescribed at regional level. The lowest level of WASH governance is the
woreda. At woreda level WASH activities are implemented by the (District) Woreda WASH Team led by the
Woreda (District) Administrator. Its members are from the four WASH sector offices (Water, Health, Education,
and Finance, with additional members from the Women Affairs and Agriculture offices). Development partners
are presently represented by the Development Assistance Group – Water Technical Working Group.
A National WASH Coordination Office (NWCO) will be responsible for coordinating, planning and oversight of
Program implementation at federal level and regional level and to stimulate and attract other partners to join the
OWNP implementation plan in both the planning and reporting process. The NWCO will report to a National
Steering Committee chaired by the Minister of Water and Energy and supported by a National WASH Technical
Team consisting of representatives from participating ministries and partners. Implementation of the Program in
the sector ministries will be the responsibility of WASH Program Management Units (PMUs) in the ministries of
Water and Energy, Health, Education and Finance and Economic Development, respectively.
At regional, zonal and city levels, planning and implementation of the Program will be coordinated by a Regional
WASH Coordination Office which will report to a Regional WASH Steering Committee and to the National
Coordination Office and be supported by a WaSH Technical Team. Implementation will be managed by WASH
PMUs in the bureaus of water resources, health, education and finance and economic cooperation.
The same process is replicated at the zonal, (zonal coordination office) woreda (Woreda WASH Team consisting
of water, health, education, finance, women and woreda administration), kebele (kebele
chairman/administrator).and at community level by the WASHCOMs.
This diagram shows the institutional arrangements and functions for implementing the Program:

Draft- One WASH Program Document Phase II Updating- May 2010
NATIONAL WASH COORDINATION OFFICE 66
7.2 Partnership and partnership arrangement
The Program will be implemented as a joint effort between Government, Development Partners, NGOs, training
institutions, the private sector, community members and other stakeholders through contributions to a
Consolidated WASH Account at federal level. Other partners, including bilateral aid organizations and CSOs, will
support the Program through other funding arrangements, as well as through the provision of technical assistance,
supplies and other means.

Draft- One WASH Program Document Phase II Updating- May 2010
NATIONAL WASH COORDINATION OFFICE 67
In the WaSH Implementation Framework (WIF) the Program will have three types of partnership-include the
following partnership arrangements:
1. Partners - organizations contributing to the Consolidated WASH Account (CWA) at federal level. In this
category are international, bilateral and finance organizations who have together with government
established the consolidated WASH account.
2. Associated Partners – organizations funding construction of water supply and sanitation facilities,
technical assistance, supplies and other support to OWNP, but not using the CWA. These are essentially
CSOs who plan and budget WASH services in various parts of the country which actually taken for granted
that any NGO contribute some resources to WASH. There is a need to map these partners in order to
document their contribution and to harmonize their activities with OWNP.
3. Collaborating Partners – organizations providing other types of assistance to OWNP, i.e. training, studies,
manuals, communication products, participation in the Multi-Stakeholder Forum, etc. These categories
could be the international, bilateral and financial organization who are also supporting OWNP in hiring
consultants to augment staff shortage and provide expert service, support organizing forums, workshops,
training and preparing and printing manuals and guidelines.
The program focuses on strengthening the guiding principles of OWNP to enhance the interaction and
cooperation of WASH stakeholders [implementing partners, donor agencies, private sector and other
institutions). The important partners for OWNP are not only financial contributors but also others who
can support in various other ways other than finance. For this reason, OWNP should design a strategy
whereby it can attract more partners to join the program in one of the categories mentioned and in other sectors.
The tactic for this will be:
1. To introduce the program scope through written or mass media
2. Inviting would be partners to forums, meeting and workshops to make them part of the discussion and
let them see how aligned their program is with the WASH program and see whether they can benefit by
joining hand s with.
3. Sending out quarterly, biannual or annual activity and financial reports to wider audiences indicating that
WASH is a cross cutting social service that demands the contribution of all such as media, financing
organizations, teaching and research organizations, etc.
There is clear evidence that the OWNP will soon need to be expanded to include the inter-relationship with
stakeholders outside of the original four OWNP signatory ministries.).
For CR-WaSH it may be necessary to design a coordination mechanism to work together the broader non-MOU
signatory stakeholders which includes new and relevant ministries like Ministry of Agriculture and Natural
Resources; Ministry of Livestock and Fishery; Ministry of Environment, Forest and Climate Change; Ministry of
Federal and Pastoralist Development Affairs; and National Disaster Risk Leadership Commission, Key Development
Partners and others as needed. The new institutional arrangement that requires broader engagement of
stakeholders is indicate would be partners
1. Ministry of urban development and construction who can be engaged or partner in utilities, sanitation
services and in protection of water resources
2. Ministry of agriculture who are major water users and also promote afforestation program which has
direct relationship with water conservation and water resource management element in their activities.
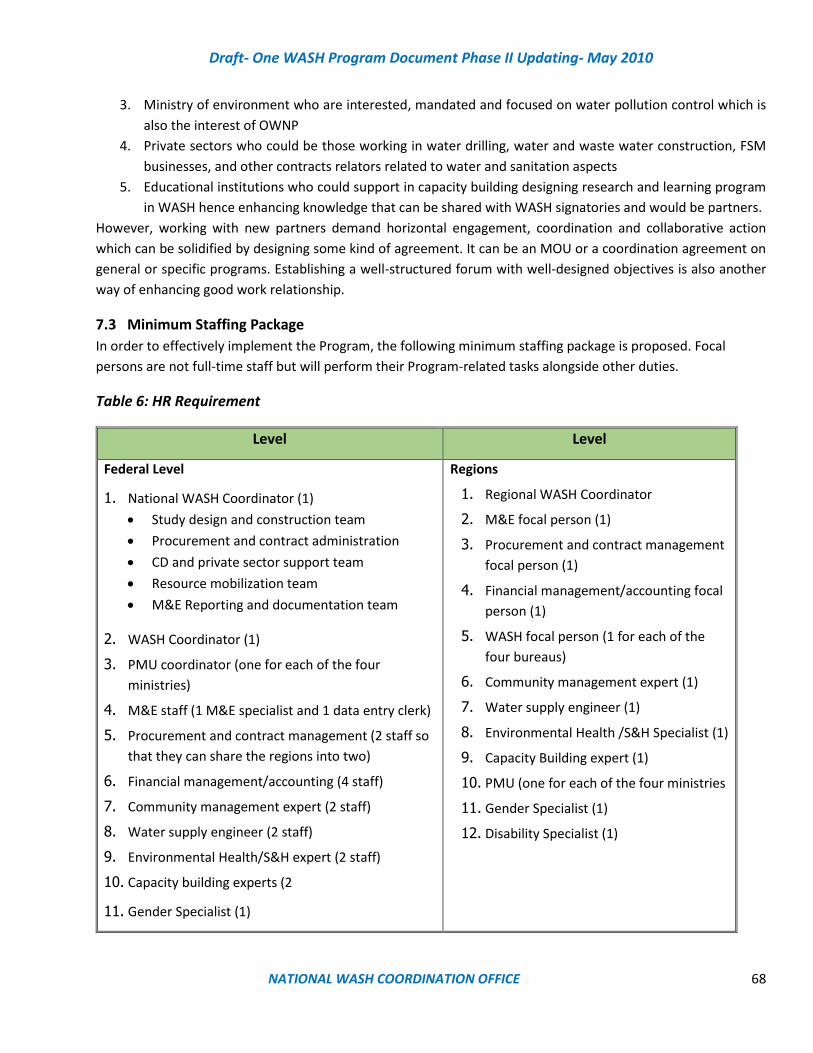
Draft- One WASH Program Document Phase II Updating- May 2010
NATIONAL WASH COORDINATION OFFICE 68
3. Ministry of environment who are interested, mandated and focused on water pollution control which is
also the interest of OWNP
4. Private sectors who could be those working in water drilling, water and waste water construction, FSM
businesses, and other contracts relators related to water and sanitation aspects
5. Educational institutions who could support in capacity building designing research and learning program
in WASH hence enhancing knowledge that can be shared with WASH signatories and would be partners.
However, working with new partners demand horizontal engagement, coordination and collaborative action
which can be solidified by designing some kind of agreement. It can be an MOU or a coordination agreement on
general or specific programs. Establishing a well-structured forum with well-designed objectives is also another
way of enhancing good work relationship.
7.3 Minimum Staffing Package
In order to effectively implement the Program, the following minimum staffing package is proposed. Focal
persons are not full-time staff but will perform their Program-related tasks alongside other duties.
Table 6: HR Requirement
Level Level
Federal Level
1. National WASH Coordinator (1)
• Study design and construction team
• Procurement and contract administration
• CD and private sector support team
• Resource mobilization team
• M&E Reporting and documentation team
2. WASH Coordinator (1)
3. PMU coordinator (one for each of the four
ministries)
4. M&E staff (1 M&E specialist and 1 data entry clerk)
5. Procurement and contract management (2 staff so
that they can share the regions into two)
6. Financial management/accounting (4 staff)
7. Community management expert (2 staff)
8. Water supply engineer (2 staff)
9. Environmental Health/S&H expert (2 staff)
10. Capacity building experts (2
11. Gender Specialist (1)
Regions
1. Regional WASH Coordinator
2. M&E focal person (1)
3. Procurement and contract management
focal person (1)
4. Financial management/accounting focal
person (1)
5. WASH focal person (1 for each of the
four bureaus)
6. Community management expert (1)
7. Water supply engineer (1)
8. Environmental Health /S&H Specialist (1)
9. Capacity Building expert (1)
10. PMU (one for each of the four ministries
11. Gender Specialist (1)
12. Disability Specialist (1)
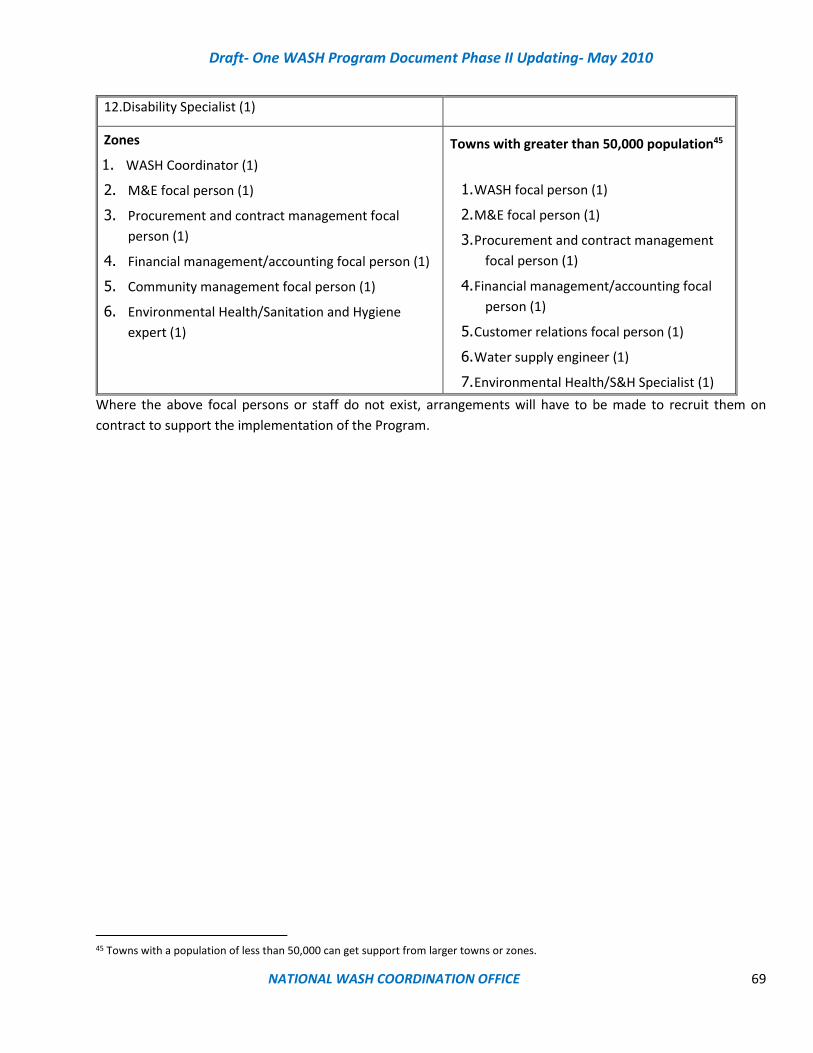
Draft- One WASH Program Document Phase II Updating- May 2010
NATIONAL WASH COORDINATION OFFICE 69
12.Disability Specialist (1)
Zones
1. WASH Coordinator (1)
2. M&E focal person (1)
3. Procurement and contract management focal
person (1)
4. Financial management/accounting focal person (1)
5. Community management focal person (1)
6. Environmental Health/Sanitation and Hygiene
expert (1)
Towns with greater than 50,000 population45
1. WASH focal person (1)
2. M&E focal person (1)
3. Procurement and contract management
focal person (1)
4. Financial management/accounting focal
person (1)
5. Customer relations focal person (1)
6. Water supply engineer (1)
7. Environmental Health/S&H Specialist (1)
Where the above focal persons or staff do not exist, arrangements will have to be made to recruit them on
contract to support the implementation of the Program.
45 Towns with a population of less than 50,000 can get support from larger towns or zones.
Draft- One WASH Program Document Phase II Updating- May 2010
NATIONAL WASH COORDINATION OFFICE 70
8. Assessing Capacity
8.1 Introduction
Capacity is about the ability of organizations and people to function in their environment. Institutional capacity is
about mandates & the rules of the game. It establishes who does what, and to what standards. An organization’s
capacity rests on its structure methods of functioning & on its decision-making processes, as well as the skills &
values of its staff.
Strengthening capacity means more than training. Service development at lower level is a factor of skilled,
motivated staff, organizational capacity, including resources and the laws and policies that contribute to the sector
environment.
Past experiences on the implementation success rate of OWNP at regional and woreda level indicate lack of
capacity, system development, community involvement, planning based on evidences and need assessment and
using simplified tools and guidelines, monitoring, learning and knowledge management, enhanced operation and
management internally and lack of support (material and logistics), timely financial release, delayed procurement
process externally.
As per the WASHBAT workshop held on June 6-8, 2017 at Capital Hotel in Addis Ababa, the following points are
found to be the main bottlenecks of capacity building issues.
• No systems for rewarding individuals/households that use sustainable technologies for rural sanitation
• No incentives for private sector (such as tax exemption or loans)
• No full package capacity development plan (including training, monitoring, coaching, software, hardware)
Based on needs assessment
• Weak stakeholders’ coordination mechanism
• Inadequate budget and weak utilization
• Lack of a system to enable users and stakeholders to validate plans
• Lack of attention at regional level for scaling up best practices & new technologies
• Lack of clear roles and lines of accountability between different stakeholders within the sector and across
relevant sectors
• Absence of clearly defined procedures and channels for user participation in the planning process
• Lack of strategy and guidelines for implementation: to be customized to different schemes and service
provision
• Lack of policy and strategy to engage the private sector in management and provision of service
• Absence of consumers rights enforcement mechanism

Draft- One WASH Program Document Phase II Updating- May 2010
NATIONAL WASH COORDINATION OFFICE 71
Figure 9: OWNP -Phase II Implementation Framework
Phase II which has7 components including 1) rural and pastoralist Water supply, 2) Rural and pastoralist sanitation
3) Urban and pastoralist water supply 4) urban and pastoralist sanitation 5) Institutional WASH, 6) Emergency
WASH 7) Program Management and Capacity Building will be expected to apply the directives mentioned in the
framework while implementing GTP II targets.
8.2 Approach to Capacity Building
The adequacy of existing capacity among woredas and towns depends on several factors; the size and population
of the areas covered, the number of water supply and sanitation facilities and the amount and type of work
remaining to achieve the desired targets, present staffing levels and skills, availability of logistic support,
equipment, etc.
A format for self-assessment of capacity at woreda level is available and includes size of the woreda, present
number and coverage of WASH facilities, ongoing WASH activities, human resources, logistics and the work to be
done to achieve or maintain WASH targets.
Capacity assessments and capacity building activities will be based on the results of a diagnostic capacity
assessment and be implemented according to agreed priorities. The following steps will be followed in
determining a minimum capacity building package and the Program implementation process in woredas:
The composition of the capacity building package will be determined one case-by-case basis considering the
specific capacity building requirements for each woreda or town Capacity building is necessary to improve the
ability of WASH sector professionals and service providers to better plan and manage water supply and sanitation.
Capacity building interventions, especially training of WASH staffs at lower level on planning, procurement and
financial management plays a major role in ensuring effective project implementation based on a capacity
OWNP Phase II Implementation
Plan
Need Assessment
Capacity Building
Strengthen systems and institutions
Design program methodology,
tools and guidelines
Desin basded on hydrogeological and feasebility
studies
Focus on equity and Inclusion
Draft- One WASH Program Document Phase II Updating- May 2010
NATIONAL WASH COORDINATION OFFICE 72
development need assessment. There is a need to design a human resource strategy covering both urban, rural
and pastoralist areas. Human resources (HR) capacity building should be provided on a continuous basis and
include intensive initial training as well as refresher training, coaching and follow up.
Although each WASH sector is planning and implementing its own training activities, a capacity development unit
under National WASH Coordination/Regional WASH Coordination/Woreda WASH Team should be established
from federal to woreda levels to coordinate capacity enhancements of implementing WASH institutions and for
sustainable development of human resource.
The units could facilitate procedures for new staff orientation, refresher training programs, regional workshops,
etc. The unit could also support the Regional WASH Coordinator in the development of training materials based
on latest development, new approaches, new learning from the field and use the training program to stimulate
actions, innovations, and create momentum to go forward
A cascaded training approach should be used for rural water supply and sanitation. For urban water supply and
sanitation, it will also be relevant to use a cascaded training approach for promotion of good hygiene practices
and improved on-site sanitation. A cascaded training approach is less relevant for urban water and sewerage
utilities, whose capacity needs, should be addressed through formal courses and on-the-job training by relevant
training institutions, NGOs and others.
8.3 Guidelines and manuals
WASH guidelines, manuals and other relevant training materials need to be reviewed, adapted and updated, and
any new ones shall be prepared as required. Operation and maintenance manuals are required for different types
and components of urban water supply schemes and equipment. Manuals should be translated to Amharic and
other major regional languages as appropriate for the intended user group.
8.4 Systems and Institutions
Assistance is required to introduce procedures for handing over responsibilities, manuals, guidelines and data
when WASH staff leave their positions.
HR capacity building should focus on the supply side (training institutions) as well as creating demand from
potential beneficiaries. Focus should be on institutionalizing and professionalizing training capacity by supporting
EWTI, TVETCs, HSCs, universities and other training institutions to provide quality and demand-responsive long-
term courses as well as tailor-made short-term courses. Universities and training institutes have a major role to
play in training water professionals and in organizational and institutional capacity development.
Research and development on WASH should also be supported in sector wide identified priorities; and promoting
innovation and knowledge management in the WASH sector through learning and sharing events and other
appropriate measures. More research should be done to demonstrate the real costs and the impact of capacity
development.
Coordination and partnership with EWTI, TVETCs, HSCs and universities should be enhanced as well as knowledge
sharing should also be promoted on the challenge of the WASH sector in an effort to bridge the gaps that will
facilitate in achieving the GTP 2 target.
Draft- One WASH Program Document Phase II Updating- May 2010
NATIONAL WASH COORDINATION OFFICE 73
Particular attention should be given to ensuring effective capacity building at the community level using
approaches and procedures established by the WSSP, CMP or NGO assisted projects. By doing so, we can
strengthen decentralized capacities and provide complementary support and monitoring. The capacity building
unit which will be established under NWCO/RWCO office will address sector-wide capacity building requirements
in an integrated manner and to thereby enable the training centers to increasingly become a "center of
excellence” with state-of-the-art skills, knowledge and competence
8.5 Operation and Management (O&M)
High priority should be given to capacity building in O&M for both rural and urban water supply and sanitation.
This should initially focus on addressing the significant number of rural piped water schemes which appear to have
been constructed without sufficient community and woreda involvement and ownership and which now have
serious O&M problems.
Appropriate and sustainable solutions should be identified so as communities have access to affordable spare
parts and maintenance services within a reasonable distance, preferably by the private sector. We should also
establish post construction support units for schemes that cross multiple villages in remote arid and semi- arid
areas.
We shall also build the capacity of utilities through provision of human resource, improving working environment,
facilitating operation and maintenance activities, improving revenue collection through provision of billing
software devices, facilitation to improve water demand management and customer care and management skills.
Pilot clustering of water utilities shall be started for small towns to create a larger customer base, improve revenue
collection, share experiences in management and technical operations and reduce operating costs.
Management of community water supply systems through private water operators shall be started to be effective
in improving functionality of water supply systems. Such a model, however, requires significant investment in
capacity building of the private water operators and establishment of adequate mechanism for monitoring the
performance of the private operators. The water supply systems constructed or upgraded can be handed over to
private water operators (PWOs) for operation and maintenance under public-private-partnership arrangements.
The private water operators will be trained and provided operation and maintenance tool kits. This will enhance
capacity of the PWOs to manage the systems, collect revenue and undertake timely repairs, and greatly contribute
to high functionality and hence increases sustainability. Training of private water operators and water user
committees will contribute to effective management of water supply systems and increase functionality.
8.6 Planning, procurement, financial management and monitoring
Training and support in integrated and harmonized WASH planning and budgeting will be provided at woreda,
zonal and regional levels as well as at federal level.
Capacity building is needed in procurement and financial management, particularly at water utility, woreda and
regional levels. Training in fiduciary management will contribute significantly in improving financial management
of WASH sectors.
So as to improve slow procurement processes, periodical contract execution monitoring by NWCO/RWCO/PMU,
tailored trainings on contract management, supervision of consultants and implementation of works and
Draft- One WASH Program Document Phase II Updating- May 2010
NATIONAL WASH COORDINATION OFFICE 74
strengthening the coordination of procurement processes of WASH sector offices should be done. Selection
criteria for choosing a contractor and measuring qualifications of consultants should be defined and adhered
to during the planning phase Procurement units should be strengthened with trainings for speeding up bid
processing and strengthening contract management by technical assistance services to bring procurement
efficiency. Priority will be given to capacity building in monitoring progress and impact and use of monitoring data
for planning.
8.7 Strengthening private sector capacity
Information, training and business opportunities should be offered to the private sector to strengthen its
involvement in and contribution to the WASH sector. Initial priority should be increasing capacity in drilling,
hydrogeology, design and construction of piped water schemes, contract management and construction
supervision, environmental and social impact assessments and quality standards for construction.
8.8 Gender Equity and Mainstreaming
The Program recognizes the importance of gender equity and mainstreaming as a cross-cutting issue that is related
to social inclusion, participation and sustainability of Program benefits. The Program will require that the Women’s
Affair’s Directorate prepare a detailed gender equity strategy for the Program using among others, the results of
its recent gender assessment in the water sector.
The Women’s Affairs Directorate will also be tasked with conducting orientation sessions in implementing the
Program’s gender equity strategy for the regional and city Program organization.
MoWIE’s Gender Mainstreaming Guideline46 should be used in training at different levels, including training of
teachers in TVETCs, HSCs and other training institutions.
9. One WASH National Program Phase II Strategy (and beyond)
9.1 Background
The Ethiopian government has been very keen to have a fundamental change in people’s health and wellbeing for
decades. This natural wish is manifested through its design of the national constitution, issuance of different
policies developed by different ministries echoing their contribution toward improvement in water, sanitation,
health, nutrition and control of communicable and non-communicable diseases. The government water,
sanitation and hygiene program evolved from a single water program to water and sanitation program and now
to water, sanitation and hygiene program as depicted below.
The One Wash National Program has the potential to scale up WASH intervention to the whole of Ethiopia through
fast-tracking activities in water, sanitation and hygiene to a point where all people have sustainable, safe, and
affordable access to water and sanitation services; make effective use of these services; and adopt improved
hygiene practices.
46Gender Mainstreaming Implementation Guideline for the Water and Energy Sector, MoWE, October 2012.
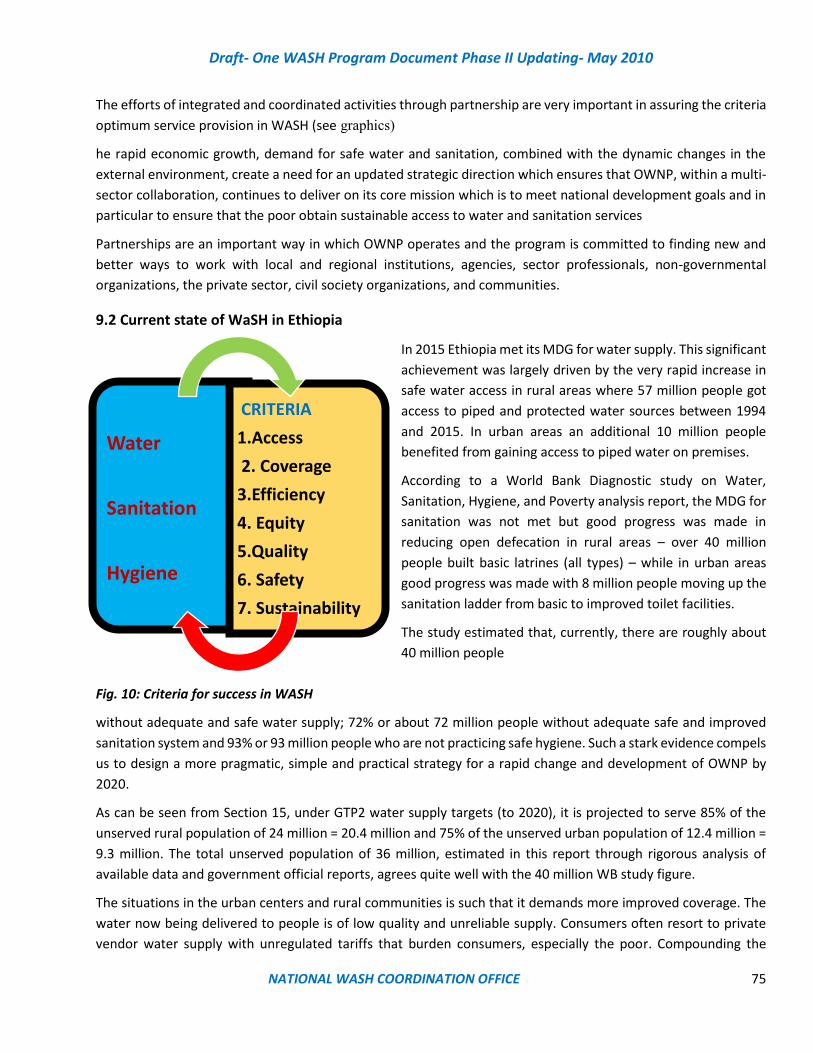
Draft- One WASH Program Document Phase II Updating- May 2010
NATIONAL WASH COORDINATION OFFICE 75
The efforts of integrated and coordinated activities through partnership are very important in assuring the criteria
optimum service provision in WASH (see graphics)
he rapid economic growth, demand for safe water and sanitation, combined with the dynamic changes in the
external environment, create a need for an updated strategic direction which ensures that OWNP, within a multi-
sector collaboration, continues to deliver on its core mission which is to meet national development goals and in
particular to ensure that the poor obtain sustainable access to water and sanitation services
Partnerships are an important way in which OWNP operates and the program is committed to finding new and
better ways to work with local and regional institutions, agencies, sector professionals, non-governmental
organizations, the private sector, civil society organizations, and communities.
9.2 Current state of WaSH in Ethiopia
In 2015 Ethiopia met its MDG for water supply. This significant
achievement was largely driven by the very rapid increase in
safe water access in rural areas where 57 million people got
access to piped and protected water sources between 1994
and 2015. In urban areas an additional 10 million people
benefited from gaining access to piped water on premises.
According to a World Bank Diagnostic study on Water,
Sanitation, Hygiene, and Poverty analysis report, the MDG for
sanitation was not met but good progress was made in
reducing open defecation in rural areas – over 40 million
people built basic latrines (all types) – while in urban areas
good progress was made with 8 million people moving up the
sanitation ladder from basic to improved toilet facilities.
The study estimated that, currently, there are roughly about
40 million people
Fig. 10: Criteria for success in WASH
without adequate and safe water supply; 72% or about 72 million people without adequate safe and improved
sanitation system and 93% or 93 million people who are not practicing safe hygiene. Such a stark evidence compels
us to design a more pragmatic, simple and practical strategy for a rapid change and development of OWNP by
2020.
As can be seen from Section 15, under GTP2 water supply targets (to 2020), it is projected to serve 85% of the
unserved rural population of 24 million = 20.4 million and 75% of the unserved urban population of 12.4 million =
9.3 million. The total unserved population of 36 million, estimated in this report through rigorous analysis of
available data and government official reports, agrees quite well with the 40 million WB study figure.
The situations in the urban centers and rural communities is such that it demands more improved coverage. The
water now being delivered to people is of low quality and unreliable supply. Consumers often resort to private
vendor water supply with unregulated tariffs that burden consumers, especially the poor. Compounding the
Water
Sanitation
Hygiene
CRITERIA
1.Access
2. Coverage
3.Efficiency
4. Equity
5.Quality
6. Safety
7. Sustainability
Draft- One WASH Program Document Phase II Updating- May 2010
NATIONAL WASH COORDINATION OFFICE 76
problem is the rapid urbanization and emergence of peri-urban unplanned settlements creating slums and
homelessness and those out of reach to the existing urban water and sanitation services.
In rural areas, inefficient water resource management and inadequate infrastructure combined with poor
sanitation and hygiene coverage, has a high health and economic impact on people. Moreover, there is continuous
slippage from ODF back to OD in sanitation in rural areas and to some extent in water supply owing to depletion
in groundwater tables and often poor maintenance. To improve sustainability and efficiency therefore, the focus
should be on set criteria illustrated in the Figure … above.
Therefore, the program should focus and strive to achieve sustainable equitable access and coverage with efficient
O&M. (see fig. 10 for criteria in WASH)
9.3 Strategy formulation
It is now considered that the OWNP has become more complex, with more and more multi-sector interfaces, and
will benefit from an overall 10 to 15-year OWNP WASH Strategy. The strategy is:
➢ Initially “directed” by the Government of Ethiopia Growth and Transformation Plan 2015-2020
➢ Facilitated by means of an “enabling environment” for water supply, sanitation and hygiene (WASH)
➢ Incorporating new initiatives: utility regulation, clustering, CR-WASH, refugee areas, delegated
management, very deep wells, micro-sanitation plans, etc.
➢ Integrated and inter-dependent multi-sector approach with IWRM, SWM, Industrial waste control (liquid
gas, solid), MHM, baby WASH, employment, gender, etc.
➢ Implemented by national, regional, zonal, woreda and urban authorities in collaboration with DPs, CSOs
and private enterprise
For details of Phase II WASH, I strategy relevant to the WASH sector based on the GTP II goals and indicators is
depicted in Annex I where reference for details can be made. The proposed enabling environment, new initiatives,
multi sector approach and proposed implementation modalities are described in Section 9.
The purpose is to provide a strategic approach to reaching OWNP objectives based on an in-depth analysis of
internal factors and external influences such as the 1) 2013 OWNP document 2) WIF document 3) GTPII document
and indicators 4) OWNP Phase I review report 5) SDG indicators and challenges that are influencing integrated
WASH approaches for sustainability.
A strategic action plan for WASH is envisaged to provide a roadmap for accomplishing specified goals. Strategy
looks at why certain steps should be taken, whereas a plan outlines the “how” of the strategy.
Strategy provide clear communication to stakeholders such as financiers, partners and staff engaged in the change
process. Strategic planning is based on identified gaps or challenges, deal with the challenges and plan where we
want to be.

Draft- One WASH Program Document Phase II Updating- May 2010
NATIONAL WASH COORDINATION OFFICE 77
Adopted from https://www.google.com.et search=strategic actions
Figure 11: Strategic Planning Approach
9.4 Organizational Direction
Vision - to see that all people in rural, urban and institutions are supplied with sustainable, climate resilient, safe
and clean water and sanitation services.
Mission - to mobilize adequate resources through engaging multiple partners and donors with interest and use
the human and financial resources efficiently for a lasting change in water and sanitation program in Ethiopia.
Goals -Lack of clean and safe water in quantity and Quality, proper human waste disposal, and liquid wastes
management at point of generation are some of the focus areas for the OWNP strategy. The GTP Goal is to reach
out to 85% of the rural population and 75% of the urban population with clean and safe water and 82% with
improved sanitation. (See annex)
In order to meet this government ambitious program, the followings are the key points to be considered during
planning and implementation for both urban and rural water supplies and sanitation
• Develop capacity building strategy and implementation plan including a comprehensive technical support
system to improve the functionality of schemes.
• Develop and implement cost effective alternative scheme management (Ownership) models
• Develop and implement professionalize management and leverage sector capabilities
9.5 GTP II and Sustainable Development Goals (SDG)
OWNP keep at both the GTP II and SDG Goals in focus as the program develops to go forward in ensuring a
sustainable WASH service to all people in Ethiopia. Phase II however is more focused in achieving GTPII goals
(Annex IV). The strategic overview of SDG for rural and urban water supply is depicted in the following tables.
Table 7: Strategic Overview for Rural Water Supply
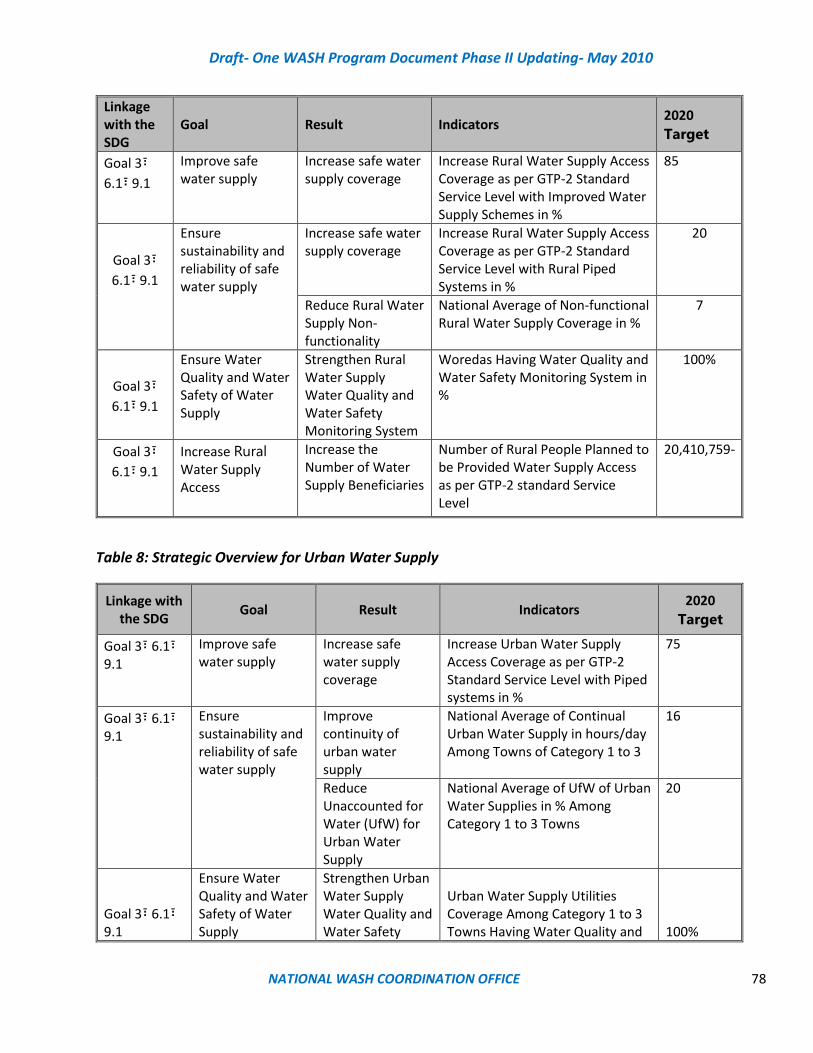
Draft- One WASH Program Document Phase II Updating- May 2010
NATIONAL WASH COORDINATION OFFICE 78
Linkage with the SDG
Goal Result Indicators 2020
Target
Goal 3፣
6.1፣ 9.1
Improve safe water supply
Increase safe water supply coverage
Increase Rural Water Supply Access Coverage as per GTP-2 Standard Service Level with Improved Water Supply Schemes in %
85
Goal 3፣
6.1፣ 9.1
Ensure sustainability and reliability of safe water supply
Increase safe water supply coverage
Increase Rural Water Supply Access Coverage as per GTP-2 Standard Service Level with Rural Piped Systems in %
20
Reduce Rural Water Supply Non-functionality
National Average of Non-functional Rural Water Supply Coverage in %
7
Goal 3፣
6.1፣ 9.1
Ensure Water Quality and Water Safety of Water Supply
Strengthen Rural Water Supply Water Quality and Water Safety Monitoring System
Woredas Having Water Quality and Water Safety Monitoring System in %
100%
Goal 3፣
6.1፣ 9.1
Increase Rural Water Supply Access
Increase the Number of Water Supply Beneficiaries
Number of Rural People Planned to be Provided Water Supply Access as per GTP-2 standard Service Level
20,410,759-
Table 8: Strategic Overview for Urban Water Supply
Linkage with the SDG
Goal Result Indicators 2020
Target
Goal 3፣ 6.1፣ 9.1
Improve safe water supply
Increase safe water supply coverage
Increase Urban Water Supply Access Coverage as per GTP-2 Standard Service Level with Piped systems in %
75
Goal 3፣ 6.1፣ 9.1
Ensure sustainability and reliability of safe water supply
Improve continuity of urban water supply
National Average of Continual Urban Water Supply in hours/day Among Towns of Category 1 to 3
16
Reduce Unaccounted for Water (UfW) for Urban Water Supply
National Average of UfW of Urban Water Supplies in % Among Category 1 to 3 Towns
20
Goal 3፣ 6.1፣ 9.1
Ensure Water Quality and Water Safety of Water Supply
Strengthen Urban Water Supply Water Quality and Water Safety
Urban Water Supply Utilities Coverage Among Category 1 to 3 Towns Having Water Quality and 100%
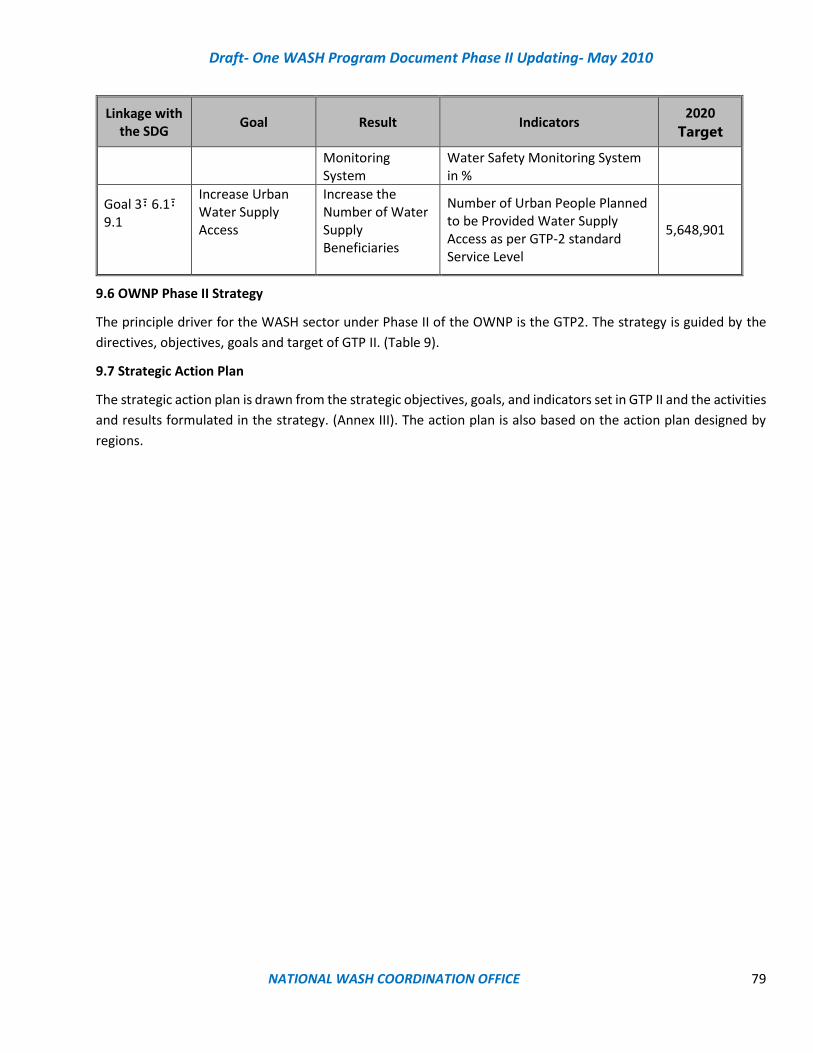
Draft- One WASH Program Document Phase II Updating- May 2010
NATIONAL WASH COORDINATION OFFICE 79
Linkage with the SDG
Goal Result Indicators 2020
Target
Monitoring System
Water Safety Monitoring System in %
Goal 3፣ 6.1፣ 9.1
Increase Urban Water Supply Access
Increase the Number of Water Supply Beneficiaries
Number of Urban People Planned to be Provided Water Supply Access as per GTP-2 standard Service Level
5,648,901
9.6 OWNP Phase II Strategy
The principle driver for the WASH sector under Phase II of the OWNP is the GTP2. The strategy is guided by the
directives, objectives, goals and target of GTP II. (Table 9).
9.7 Strategic Action Plan
The strategic action plan is drawn from the strategic objectives, goals, and indicators set in GTP II and the activities
and results formulated in the strategy. (Annex III). The action plan is also based on the action plan designed by
regions.
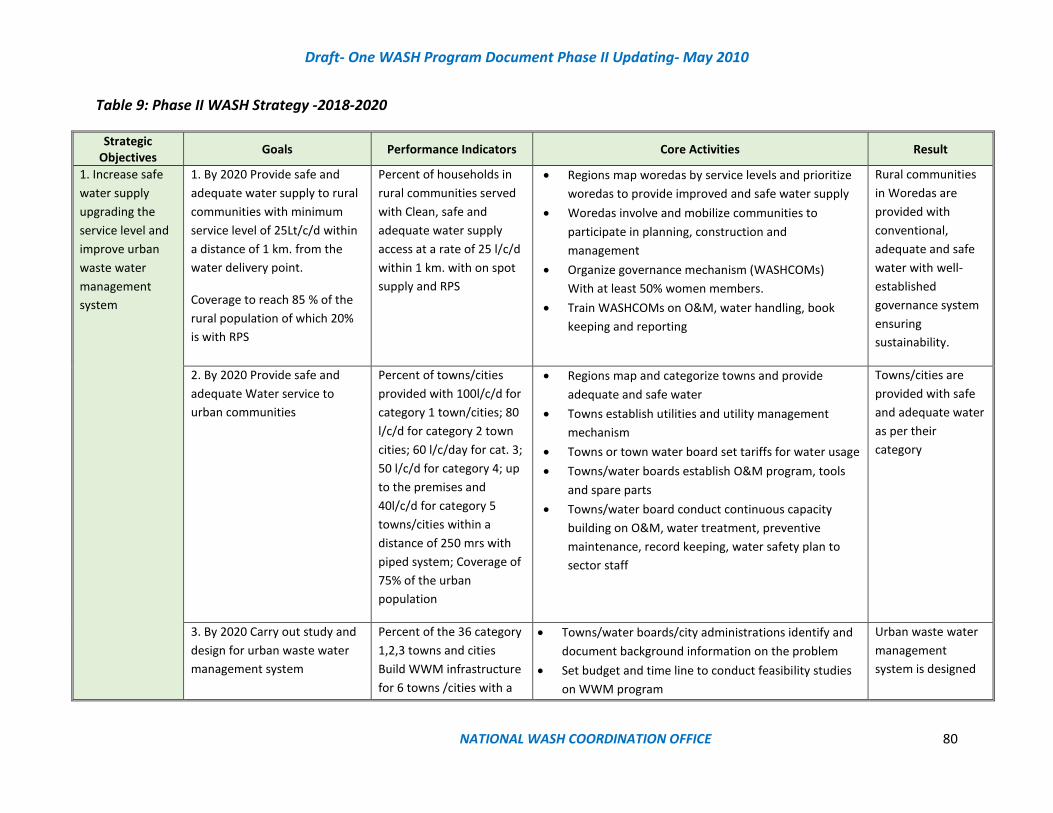
Draft- One WASH Program Document Phase II Updating- May 2010
NATIONAL WASH COORDINATION OFFICE 80
Table 9: Phase II WASH Strategy -2018-2020
Strategic Objectives
Goals Performance Indicators Core Activities Result
1. Increase safe
water supply
upgrading the
service level and
improve urban
waste water
management
system
1. By 2020 Provide safe and
adequate water supply to rural
communities with minimum
service level of 25Lt/c/d within
a distance of 1 km. from the
water delivery point.
Coverage to reach 85 % of the
rural population of which 20%
is with RPS
Percent of households in
rural communities served
with Clean, safe and
adequate water supply
access at a rate of 25 l/c/d
within 1 km. with on spot
supply and RPS
• Regions map woredas by service levels and prioritize
woredas to provide improved and safe water supply
• Woredas involve and mobilize communities to
participate in planning, construction and
management
• Organize governance mechanism (WASHCOMs)
With at least 50% women members.
• Train WASHCOMs on O&M, water handling, book
keeping and reporting
Rural communities
in Woredas are
provided with
conventional,
adequate and safe
water with well-
established
governance system
ensuring
sustainability.
2. By 2020 Provide safe and
adequate Water service to
urban communities
Percent of towns/cities
provided with 100l/c/d for
category 1 town/cities; 80
l/c/d for category 2 town
cities; 60 l/c/day for cat. 3;
50 l/c/d for category 4; up
to the premises and
40l/c/d for category 5
towns/cities within a
distance of 250 mrs with
piped system; Coverage of
75% of the urban
population
• Regions map and categorize towns and provide
adequate and safe water
• Towns establish utilities and utility management
mechanism
• Towns or town water board set tariffs for water usage
• Towns/water boards establish O&M program, tools
and spare parts
• Towns/water board conduct continuous capacity
building on O&M, water treatment, preventive
maintenance, record keeping, water safety plan to
sector staff
Towns/cities are
provided with safe
and adequate water
as per their
category
3. By 2020 Carry out study and
design for urban waste water
management system
Percent of the 36 category
1,2,3 towns and cities
Build WWM infrastructure
for 6 towns /cities with a
• Towns/water boards/city administrations identify and
document background information on the problem
• Set budget and time line to conduct feasibility studies
on WWM program
Urban waste water
management
system is designed
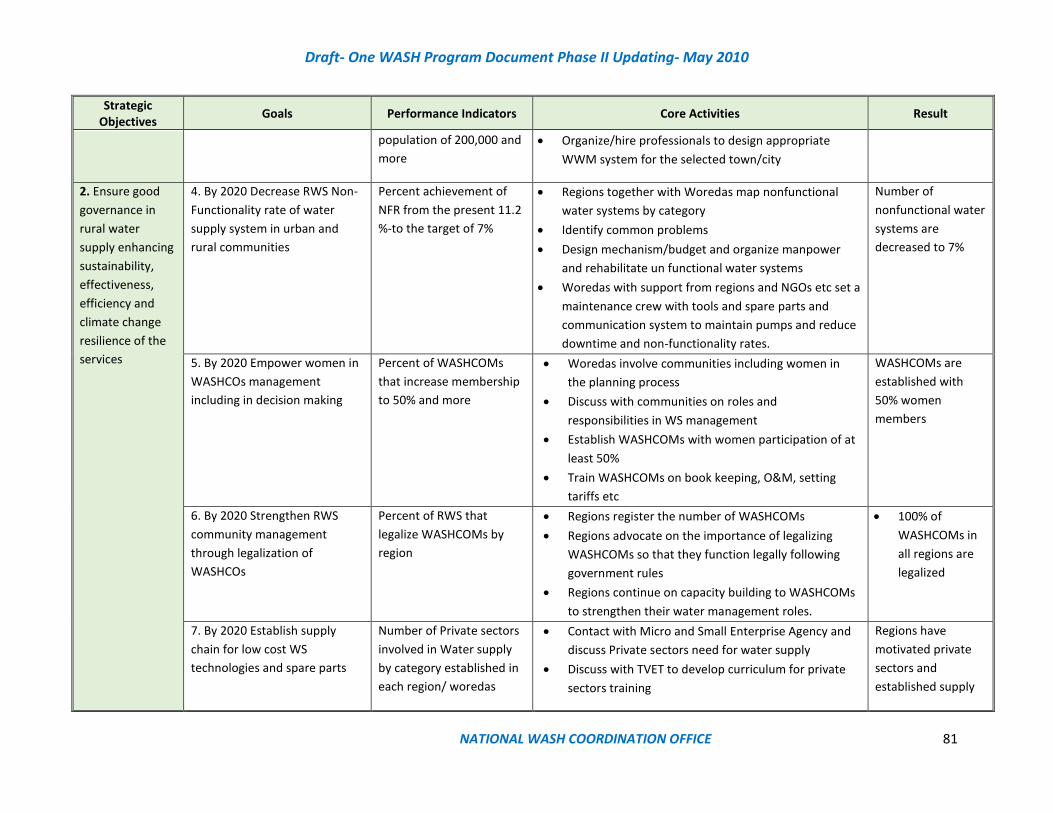
Draft- One WASH Program Document Phase II Updating- May 2010
NATIONAL WASH COORDINATION OFFICE 81
Strategic Objectives
Goals Performance Indicators Core Activities Result
population of 200,000 and
more
• Organize/hire professionals to design appropriate
WWM system for the selected town/city
2. Ensure good
governance in
rural water
supply enhancing
sustainability,
effectiveness,
efficiency and
climate change
resilience of the
services
4. By 2020 Decrease RWS Non-
Functionality rate of water
supply system in urban and
rural communities
Percent achievement of
NFR from the present 11.2
%-to the target of 7%
• Regions together with Woredas map nonfunctional
water systems by category
• Identify common problems
• Design mechanism/budget and organize manpower
and rehabilitate un functional water systems
• Woredas with support from regions and NGOs etc set a
maintenance crew with tools and spare parts and
communication system to maintain pumps and reduce
downtime and non-functionality rates.
Number of
nonfunctional water
systems are
decreased to 7%
5. By 2020 Empower women in
WASHCOs management
including in decision making
Percent of WASHCOMs
that increase membership
to 50% and more
• Woredas involve communities including women in
the planning process
• Discuss with communities on roles and
responsibilities in WS management
• Establish WASHCOMs with women participation of at
least 50%
• Train WASHCOMs on book keeping, O&M, setting
tariffs etc
WASHCOMs are
established with
50% women
members
6. By 2020 Strengthen RWS
community management
through legalization of
WASHCOs
Percent of RWS that
legalize WASHCOMs by
region
• Regions register the number of WASHCOMs
• Regions advocate on the importance of legalizing
WASHCOMs so that they function legally following
government rules
• Regions continue on capacity building to WASHCOMs
to strengthen their water management roles.
• 100% of
WASHCOMs in
all regions are
legalized
7. By 2020 Establish supply
chain for low cost WS
technologies and spare parts
Number of Private sectors
involved in Water supply
by category established in
each region/ woredas
• Contact with Micro and Small Enterprise Agency and
discuss Private sectors need for water supply
• Discuss with TVET to develop curriculum for private
sectors training
Regions have
motivated private
sectors and
established supply

Draft- One WASH Program Document Phase II Updating- May 2010
NATIONAL WASH COORDINATION OFFICE 82
Strategic Objectives
Goals Performance Indicators Core Activities Result
• Establish systems, linkage mechanisms of the private
sectors to funding agencies
chain for Water
supply.
8. By 2020 Establish WS
extension supporting system at
kebele level to enhance
implementation of household
and communal level self-supply
water and improve O&M of
RWS
Number of woredas in
each region that
established support
mechanisms for self-
supply in woredas
• Woredas discuss the advantage of self-supply and the
support they can get from woredas
• Woredas organize kebels and communities to
undertake enhancing self-supply water supply system
• Woredas with support from regions prepare O&M
manuals
• Establish water safety mechanism from the source to
use with community using self-supply and other on
spot water systems
Water supply
extension system to
enhance self-supply
water supply is
established
9. By 2020 Ensure rural water
supply safety through water
quality monitoring and water
safety planning and
implementation
Number of woredas in e
ach region that established
water quality monitoring
program urban and rural
areas
• Train selected water surveillance officers from among
the staff
• Purchase portable water analysis kits with adequate
supply of reagents
• Prepare a protocol on frequency of testing, recording
and reporting
• Have in stock water disinfecting chemicals
Regions have
established
mechanisms for
water quality
monitoring
10. By 2020 Establish ground
water monitoring and
catchment protection system
around water supply sources to
be implemented by rural
WASHCOs.
Number of WASHCOMs
that has establish
catchment protection and
monitoring mechanism in
woredas in each region
• Conduct surveys on all water systems and identify
areas of concern
• Plan and design protection mechanisms such as
protecting from flood, animals, open defecation etc …
Regions have made
ground water
monitoring and
catchment
protection a well-
organized activity.
3. Ensure good
governance in
UWS enhancing
11. By 2020 Decrease Non-
Revenue Water for urban
communities
Number of towns that
decrease NRW from the
39% to 20% by 2020 for
• Establish a water policing mechanism to identify NRW
hot spot areas
Nonfunctional
water for urban
areas is decreased.
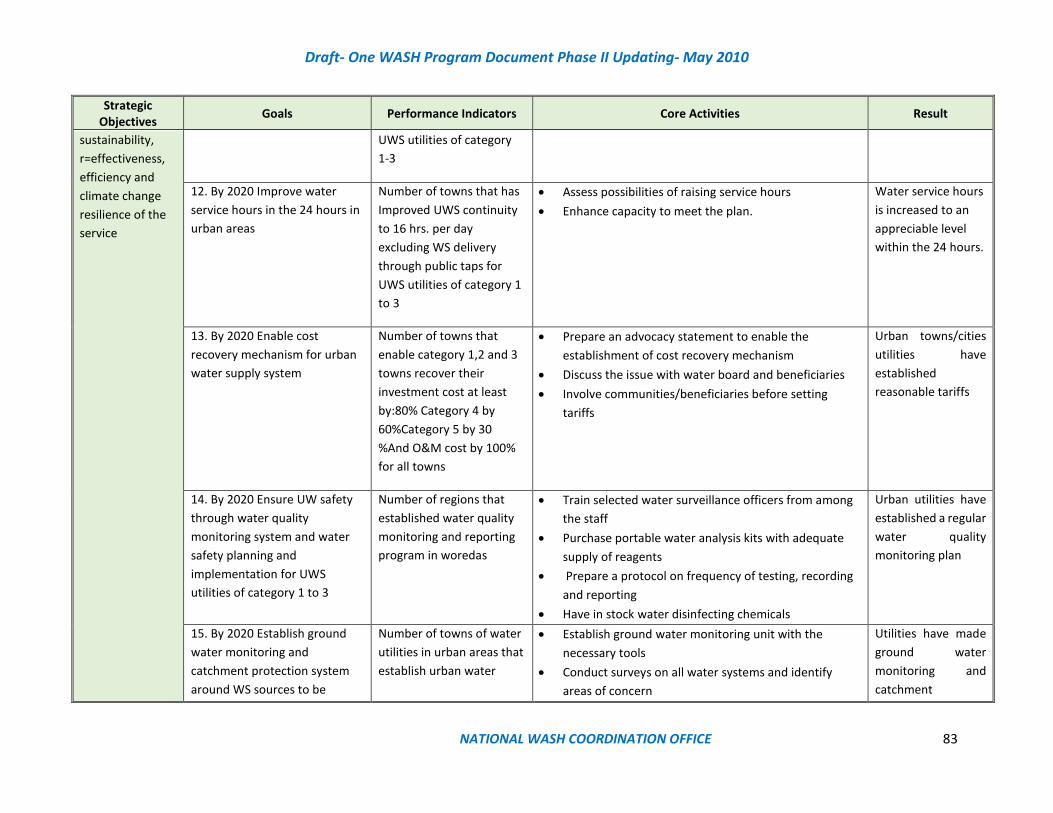
Draft- One WASH Program Document Phase II Updating- May 2010
NATIONAL WASH COORDINATION OFFICE 83
Strategic Objectives
Goals Performance Indicators Core Activities Result
sustainability,
r=effectiveness,
efficiency and
climate change
resilience of the
service
UWS utilities of category
1-3
12. By 2020 Improve water
service hours in the 24 hours in
urban areas
Number of towns that has
Improved UWS continuity
to 16 hrs. per day
excluding WS delivery
through public taps for
UWS utilities of category 1
to 3
• Assess possibilities of raising service hours
• Enhance capacity to meet the plan.
Water service hours
is increased to an
appreciable level
within the 24 hours.
13. By 2020 Enable cost
recovery mechanism for urban
water supply system
Number of towns that
enable category 1,2 and 3
towns recover their
investment cost at least
by:80% Category 4 by
60%Category 5 by 30
%And O&M cost by 100%
for all towns
• Prepare an advocacy statement to enable the
establishment of cost recovery mechanism
• Discuss the issue with water board and beneficiaries
• Involve communities/beneficiaries before setting
tariffs
Urban towns/cities
utilities have
established
reasonable tariffs
14. By 2020 Ensure UW safety
through water quality
monitoring system and water
safety planning and
implementation for UWS
utilities of category 1 to 3
Number of regions that
established water quality
monitoring and reporting
program in woredas
• Train selected water surveillance officers from among
the staff
• Purchase portable water analysis kits with adequate
supply of reagents
• Prepare a protocol on frequency of testing, recording
and reporting
• Have in stock water disinfecting chemicals
Urban utilities have
established a regular
water quality
monitoring plan
15. By 2020 Establish ground
water monitoring and
catchment protection system
around WS sources to be
Number of towns of water
utilities in urban areas that
establish urban water
• Establish ground water monitoring unit with the
necessary tools
• Conduct surveys on all water systems and identify
areas of concern
Utilities have made
ground water
monitoring and
catchment
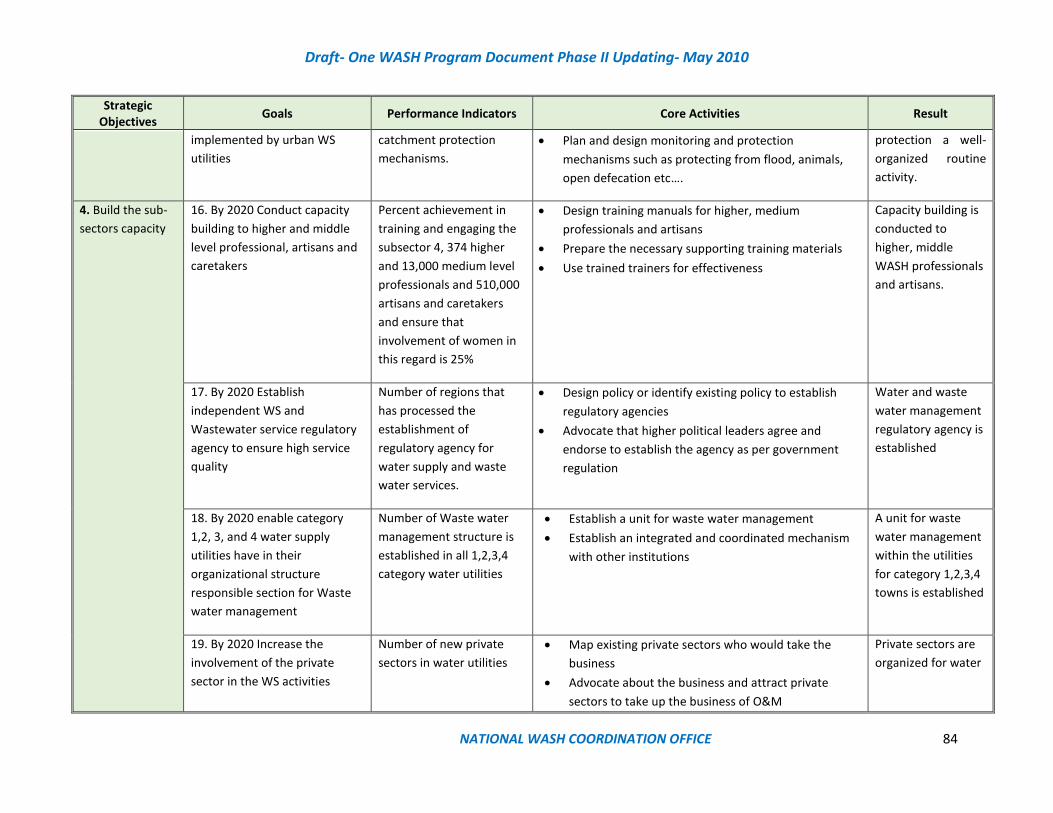
Draft- One WASH Program Document Phase II Updating- May 2010
NATIONAL WASH COORDINATION OFFICE 84
Strategic Objectives
Goals Performance Indicators Core Activities Result
implemented by urban WS
utilities
catchment protection
mechanisms.
• Plan and design monitoring and protection
mechanisms such as protecting from flood, animals,
open defecation etc….
protection a well-
organized routine
activity.
4. Build the sub-
sectors capacity
16. By 2020 Conduct capacity
building to higher and middle
level professional, artisans and
caretakers
Percent achievement in
training and engaging the
subsector 4, 374 higher
and 13,000 medium level
professionals and 510,000
artisans and caretakers
and ensure that
involvement of women in
this regard is 25%
• Design training manuals for higher, medium
professionals and artisans
• Prepare the necessary supporting training materials
• Use trained trainers for effectiveness
Capacity building is
conducted to
higher, middle
WASH professionals
and artisans.
17. By 2020 Establish
independent WS and
Wastewater service regulatory
agency to ensure high service
quality
Number of regions that
has processed the
establishment of
regulatory agency for
water supply and waste
water services.
• Design policy or identify existing policy to establish
regulatory agencies
• Advocate that higher political leaders agree and
endorse to establish the agency as per government
regulation
Water and waste
water management
regulatory agency is
established
18. By 2020 enable category
1,2, 3, and 4 water supply
utilities have in their
organizational structure
responsible section for Waste
water management
Number of Waste water
management structure is
established in all 1,2,3,4
category water utilities
• Establish a unit for waste water management
• Establish an integrated and coordinated mechanism
with other institutions
A unit for waste
water management
within the utilities
for category 1,2,3,4
towns is established
19. By 2020 Increase the
involvement of the private
sector in the WS activities
Number of new private
sectors in water utilities
• Map existing private sectors who would take the
business
• Advocate about the business and attract private
sectors to take up the business of O&M
Private sectors are
organized for water
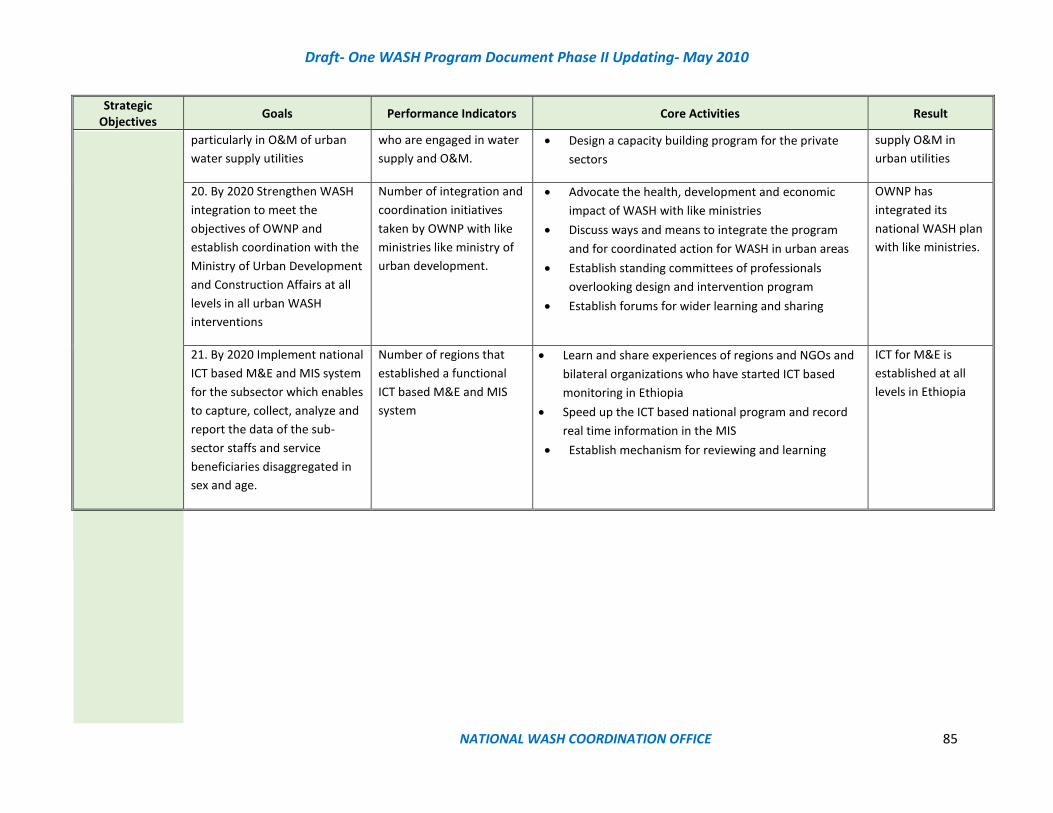
Draft- One WASH Program Document Phase II Updating- May 2010
NATIONAL WASH COORDINATION OFFICE 85
Strategic Objectives
Goals Performance Indicators Core Activities Result
particularly in O&M of urban
water supply utilities
who are engaged in water
supply and O&M.
• Design a capacity building program for the private
sectors
supply O&M in
urban utilities
20. By 2020 Strengthen WASH
integration to meet the
objectives of OWNP and
establish coordination with the
Ministry of Urban Development
and Construction Affairs at all
levels in all urban WASH
interventions
Number of integration and
coordination initiatives
taken by OWNP with like
ministries like ministry of
urban development.
• Advocate the health, development and economic
impact of WASH with like ministries
• Discuss ways and means to integrate the program
and for coordinated action for WASH in urban areas
• Establish standing committees of professionals
overlooking design and intervention program
• Establish forums for wider learning and sharing
OWNP has
integrated its
national WASH plan
with like ministries.
21. By 2020 Implement national
ICT based M&E and MIS system
for the subsector which enables
to capture, collect, analyze and
report the data of the sub-
sector staffs and service
beneficiaries disaggregated in
sex and age.
Number of regions that
established a functional
ICT based M&E and MIS
system
• Learn and share experiences of regions and NGOs and
bilateral organizations who have started ICT based
monitoring in Ethiopia
• Speed up the ICT based national program and record
real time information in the MIS
• Establish mechanism for reviewing and learning
ICT for M&E is
established at all
levels in Ethiopia

Draft- One WASH Program Document Phase II Updating- May 2010
NATIONAL WASH COORDINATION OFFICE 86
Table 10 GTP2 Sanitation and Hygiene Strategy (Rural/Urban/Institutional) 1
1Strategic Objectives Goals Performance
Indicators Activities Result
1. Establish community
centered approach to
enhance sustainable
sanitation and hygiene
services and behaviors
Kebeles in all regions
1. By 2020 introduce community
centered approach to sector
staff at all levels particularly to
woreda level (Primary Health
Care Unit staff, Kebele WASH
team, Kebele leaders, HEWs,
HDAs, Limat Budins, WASHCOS
and Agricultural extension
agents in all Kebeles in the
country)
Number of advocacy
initiatives undertaken
to establish common
ground with sector
staff and other
stakeholders.
• Prepare advocacy package prepared to suit the
level of local residents, sector staff and officials
• Include in the advocacy meetings stakeholders
such as local NGOs, religious leaders and schools
• Conduct a number of meetings to form common
ground on the need of involving communities for
behavior change program
Common ground with
sectors and stakeholders
and community
members established.
2. Improve access and
equitable improved
sanitation and hand
washing practices
2. By 2020 Increase the
availability and consistent use of
improved latrine from the
present 28% to 82% In rural
areas.
Percent of improved
sanitation coverage in
each region by
woreda
• Identify respected, trusted and prominent
residents, teachers and women affairs of a
community together with HEW, WHDA
• Create awareness on the problem of poor
sanitation and hygiene to health and development
• Train them on how successfully they carry out and
sustain changes if committed and make their
community ODF
• Demonstrate simple improved sanitation
construction and hand washing devise using job
aides/pictures
• Select community chairperson preferably women
or religious leader and secretary (preferably HEW)
for the committee
• Design an action plan on the way forward
Improved sanitation
system with hand
washing increasing in all
regions
3. By 20 20 Increase
proportion of ODF communities
In kebeles from 18 to 82%
Percent of kebeles in
each region who have
achieved ODF
• Design a follow up mechanism and a support
program to the committee established in
communities in all kebeles
ODF Kebeles are
increasing in number in
all woredas in Ethiopia.
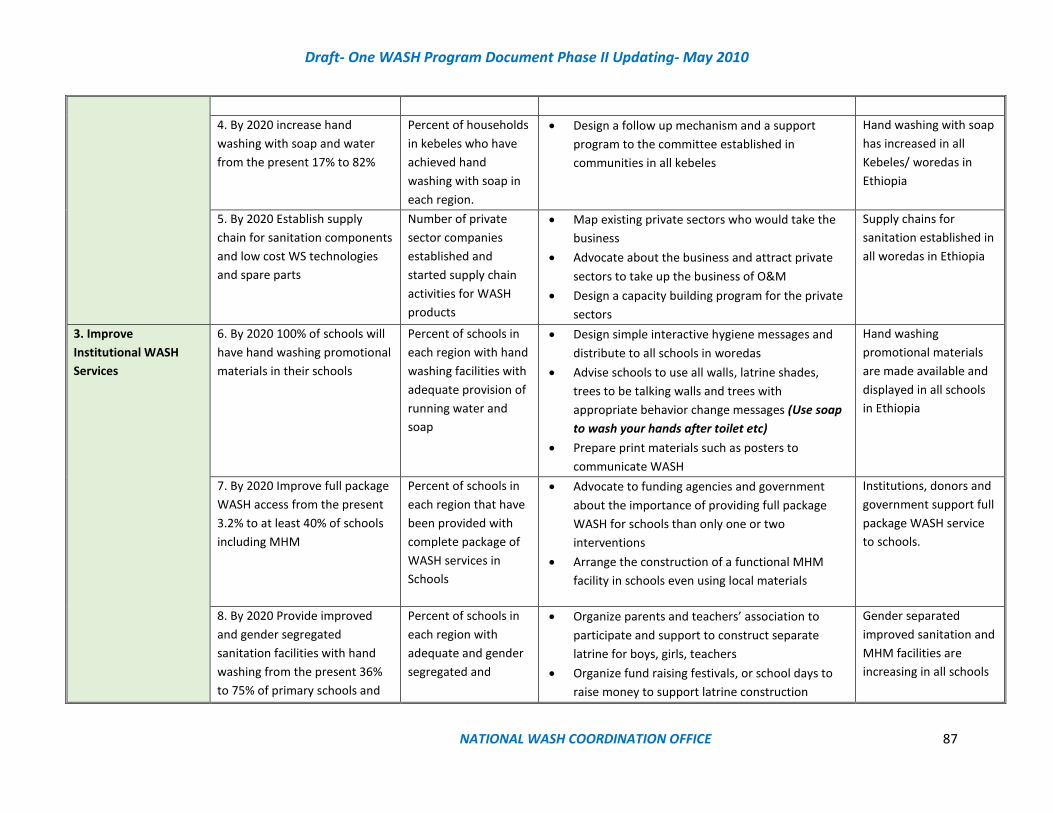
Draft- One WASH Program Document Phase II Updating- May 2010
NATIONAL WASH COORDINATION OFFICE 87
4. By 2020 increase hand
washing with soap and water
from the present 17% to 82%
Percent of households
in kebeles who have
achieved hand
washing with soap in
each region.
• Design a follow up mechanism and a support
program to the committee established in
communities in all kebeles
Hand washing with soap
has increased in all
Kebeles/ woredas in
Ethiopia
5. By 2020 Establish supply
chain for sanitation components
and low cost WS technologies
and spare parts
Number of private
sector companies
established and
started supply chain
activities for WASH
products
• Map existing private sectors who would take the
business
• Advocate about the business and attract private
sectors to take up the business of O&M
• Design a capacity building program for the private
sectors
Supply chains for
sanitation established in
all woredas in Ethiopia
3. Improve
Institutional WASH
Services
6. By 2020 100% of schools will
have hand washing promotional
materials in their schools
Percent of schools in
each region with hand
washing facilities with
adequate provision of
running water and
soap
• Design simple interactive hygiene messages and
distribute to all schools in woredas
• Advise schools to use all walls, latrine shades,
trees to be talking walls and trees with
appropriate behavior change messages (Use soap
to wash your hands after toilet etc)
• Prepare print materials such as posters to
communicate WASH
Hand washing
promotional materials
are made available and
displayed in all schools
in Ethiopia
7. By 2020 Improve full package
WASH access from the present
3.2% to at least 40% of schools
including MHM
Percent of schools in
each region that have
been provided with
complete package of
WASH services in
Schools
• Advocate to funding agencies and government
about the importance of providing full package
WASH for schools than only one or two
interventions
• Arrange the construction of a functional MHM
facility in schools even using local materials
Institutions, donors and
government support full
package WASH service
to schools.
8. By 2020 Provide improved
and gender segregated
sanitation facilities with hand
washing from the present 36%
to 75% of primary schools and
Percent of schools in
each region with
adequate and gender
segregated and
• Organize parents and teachers’ association to
participate and support to construct separate
latrine for boys, girls, teachers
• Organize fund raising festivals, or school days to
raise money to support latrine construction
Gender separated
improved sanitation and
MHM facilities are
increasing in all schools

Draft- One WASH Program Document Phase II Updating- May 2010
NATIONAL WASH COORDINATION OFFICE 88
Note: the sanitation and hygiene strategic objectives and target is adopted from the NHEHS and SAP, 2017
100% of high schools including
MHM
improved sanitation
systems
• Plan to use revenues usually from coffee, crop,
grass, and wood sales to support latrine
construction.
9. By 2020 100% of health
facilities with full package of
WASH facilities including MHM
facilities 100%
Percent of health
facilities with full
package of WASH
services
• Advocate for the need of providing full package to
health facilities
Institutions, donors and
government support full
package WASH service
to schools
4. Water Safety and
water quality control
10. By 2020 Increase proportion
of households using correct and
consistent water treatment and
safe storage from 10 to 35%
Percent of households
practicing point of use
(POU) water
treatment.
• Discuss the need of enhancing point of use
treatment with the community centered
committee
• Discuss with water safety supply chains (Wuha
agar, wuha telel) to make water disinfectant to the
locality
• Arrange with local drug store to also have wuha
agar etc for sale to communities
Point of use treatment
of water is practiced in
households in Ethiopia
5. Improve outreach
communication for
behavior change using
communication
support materials
11. By 2020 prepare and
provide pictorial job aides,
operational manuals,
implementation guidelines for
use by Health Extension
Workers to support facilitation
of behavior change in
communities
Percent of Kebeles
provided with set of
job aides including
latrine construction,
hand washing, water
safety measures,
personal and
environmental
hygiene materials
• Explore WASH communication materials
availability in the sector ministries
• Evaluate the content and determine whether to
use it or not
• Design new or additional communication products
• Kebele level HEW will need pictorial job aides
which are available in the ministry of health
Outreach do-able
behavior change
program is enhanced
using job aides in
Kebeles in Ethiopia.

Draft- One WASH Program Document Phase II Updating- May 2010
NATIONAL WASH COORDINATION OFFICE 89
9.8 OWNP Facilitation Modality
The strategy will be facilitated with different approaches and inputs (see graphics below) and implemented by
national, regional, zonal, woreda and urban authorities in collaboration with DPs, CSOs and private enterprise
Figure.12. Program Facilitation Modality
New initiatives have been developed since conception of the OWNP and as developed through the OWNP review
process involving as many as possible national, regional, development partner and other stakeholders. Existing
and new approaches are described in Section 11below to cover the period from 2018 to 2030 (10 to 15 years
horizon). These are enhanced by Guidelines fully described in the Annexes.
9.9 OWNP Results Based Framework-2018-2020
The result framework is set out in ANNEX III and is designed to address the main focus areas as stipulated by the
GTP II plan. The framework indicates the level of success (outcomes and outputs) , the result chain, goals and
indicators. This framework is also the basis for all the OWNP activities in Phase II. It also guides the design
process for the technology, process approach, setting of strategies and action plans as quantified in Section 16.
•Implementation capacity
•Strengthen institution
•Focused progarm methodology
•Adequate finance
•Monitoring, learning, benchmarking, knowledge sharing
Enhancing the Enabling
Environment
•Utility regulation
•Using clustering modality
•Strengthening CR-WASH
•Deligated management
•Addressing refugees WASH
•considering deep wells for R and SWS
•Enahncing teh supply chain for WASH
Incorporating new initiatives
•Integrated Water Resource management
•Integarted solid and liquid waste Mangement
•Institutional full package WASH management
•Establishing robust and sustainable community centered sanitationa and Hygiene program program
Integrated and inter-dependant multi-sector approach
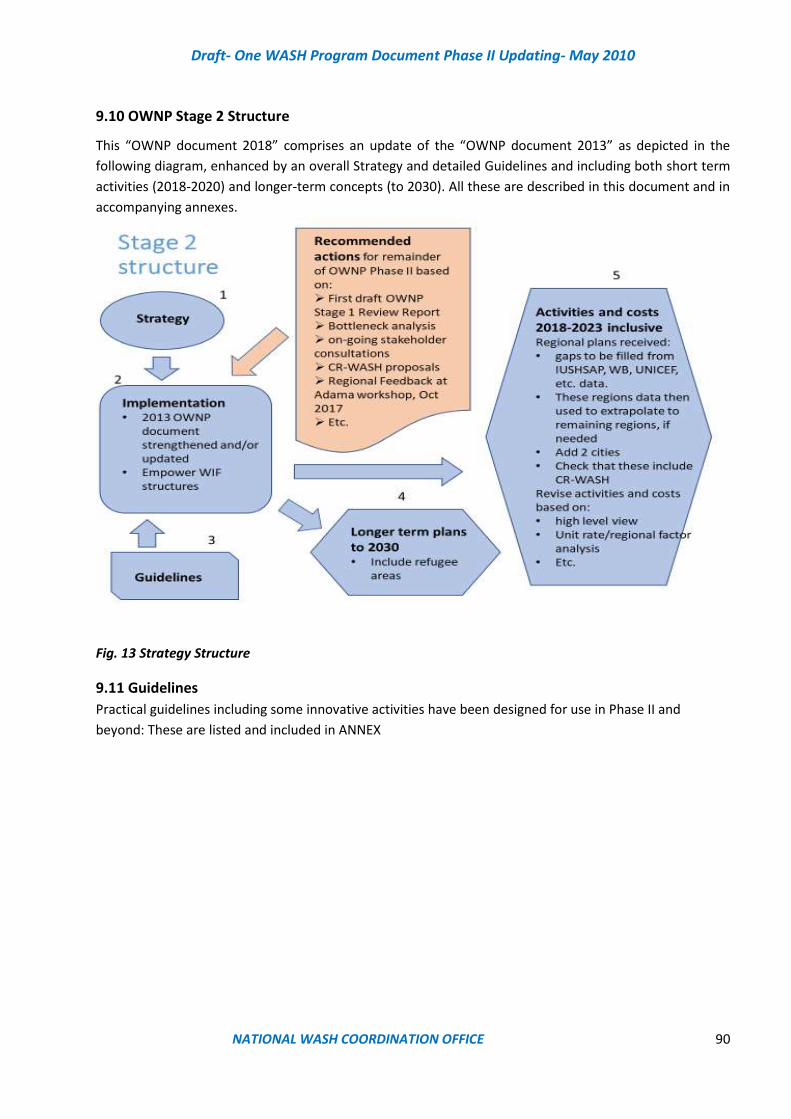
Draft- One WASH Program Document Phase II Updating- May 2010
NATIONAL WASH COORDINATION OFFICE 90
9.10 OWNP Stage 2 Structure
This “OWNP document 2018” comprises an update of the “OWNP document 2013” as depicted in the
following diagram, enhanced by an overall Strategy and detailed Guidelines and including both short term
activities (2018-2020) and longer-term concepts (to 2030). All these are described in this document and in
accompanying annexes.
Fig. 13 Strategy Structure
9.11 Guidelines
Practical guidelines including some innovative activities have been designed for use in Phase II and
beyond: These are listed and included in ANNEX
Draft- One WASH Program Document Phase II Updating- May 2010
NATIONAL WASH COORDINATION OFFICE 91
10. Existing and New Strategic Approach to WASH (2018 to 2030)
10.1 Short Term Recommendation
10.1.1 Enhancing the Enabling Environment
This sub-section suggests ways in which the OWNP may be moved on to more holistic, long term,
approaches. It suggests generic structures and approaches (both for implementation and operational) for
the Ethiopian WASH sector for the next decade.
In order to tackle bottlenecks identified in the Phase I review and to lay a stable foundation for the Ethiopia
WASH sector, then a strong “Enabling Environment” will be needed. It is envisaged that various WASH
strategies and action plans, formulated over the coming years, will use this section, together with the WASH
Guidelines (see Sub-section 10.6and Annexes), as key pointers, along with GTP updates and other policies
and guides as they are issued.
Section 15 has identified 6.04 billion USD in hardware and software activities to achieve GTP2 WASH
targets. The total estimated costs to meet GTP2 targets is 3.99 billion USD to be funded under the existing
funding routes (CWA, WRDF, DPs direct, Government sector budgets, CSOs, community, etc.) and 2.05
billion USD under the CR WASH Program.
As illustrated in the figure below high-level strategy approach so as to fully understand the complexity of
WASH and what is really required at multi-sector level to ensure WASH service delivery to all citizens of
Ethiopia in as short a time as possible.
1. There has been some success with establishing the three pillars supporting efforts towards coverage
of improved water, hygiene and sanitation services across Ethiopia, but efforts now to be quadrupled
in order to attempt to bridge the widening gap between current situation and targets. For instance,
it is indicated in Section 15 that around USD 6.04 billion will be required to achieve GTP2 WASH
targets while current absorption capacity is only around USD 0.5 billion per year.
2. MoWIE is now shifting its focus from construction of new schemes to ensuring the sustainability of
existing schemes and the proportion of rehabilitation to new build appears to be increasing with
time. Behavior (or awareness) change is needed as much at policy and management levels as it is at
community and household levels, particularly for urban sanitation. Similarly, awareness of business
planning and accountability across all sectors is low and needs to be improved and promoted.
3. The Integrated Urban Sanitation and Hygiene Strategy and Action Plan (IUSHS&SAP) has been
introduced to address the increasingly critical urban sanitation situation. Similarly, the Hygiene and
Environmental Health Strategy (HEHS) is a high impact intervention that addresses WASH as one of
the most important causes of morbidity and mortality.
4. There is an urgent need to review water tariff strategy, since tariffs in many cases are currently set
at town or Woreda levels that are well below the ability to pay. There will, however, be cases,
particularly for piped water supply system involving deep boreholes with associated high-power
costs, where operational subsidies will be required to ensure minimum levels of service are
maintained (at least 15 l/c/d).
5. In the longer term it will be the role of woredas to levee or approve tariffs proposed by utilities. The
regulator will assess tariffs based on technical performance and financial analysis, free from political
interference (as is normal for utility regulators worldwide).

Draft- One WASH Program Document Phase II Updating- May 2010
NATIONAL WASH COORDINATION OFFICE 92
6. National guidelines and manuals are required to proscribe design standard and technology selection
appropriate to levels of service. The Guidelines in the Annexes are intended as a start on this
process; to be updated from time to time based on such things as sharing of good practice, research
and development, progress on groundwater exploration mapping, water safety, solar power, CR-
WASH, urban sanitation, pastoral sanitation, etc.
7. Currently there is a move to legalize WASHCOs and strengthened the capacity of the committee to
properly manage the scheme and to introduce a rural utility approach and “professionalization”47.
WASHCOs will remain in place for point source schemes. However, longer term, Rural Pipe Supply
systems could be absorbed into large (approximately zonal sized) publicly owned utilities for both
urban and rural to ensure economy of scale for reasons that include regulation, fast-tracked
procurement and implementation, operation, inventories, asset management, quality control,
monitoring and evaluation, investment leverage, etc.
8. There is a need to reduce the time for revising and finalizing designs and bidding documents since,
on average, the actual time between the hiring of implementation consultants and the start of
bidding has been more than two years. These delays have been due to many factors including, most
importantly: (i) the review, revision, and approval of changes in project scope, especially major
reductions in scope necessitated by large cost escalations due to inflation, (ii) lengthy review and
approval of final designs and bid documents and (iii) long-drawn-out bidding processes.
9. Although transparency in bidding for both consultants and contractors is essential and should not
be compromised, the regional bureaus should take immediate steps to (a) reduce time for review
and approvals and (b) ensure a pipeline of well prepared “bankable” projects (see Guidelines,
Annexes 3 and 5) able to both attract funding and also ensure timely delivery of services. At federal
level (MoFEC), (1) the rules should be changed to allow autonomy of regions to deal directly with
funders, but in collaboration with regional BoFECs and (2) delays in financial reimbursement to the
regions at the beginning of each EFY should be eliminated.
10. Government needs to provide swift additional funding or for the program to embed more realistic
price and physical contingencies based on past project records and performance. Alternatively, as
it has proposed from the regions, the plan budget for imported equipment should be reserved in
Euro or US dollar to manage budget scarceness due to escalation.
11. The aspect of unit rates and regional variations across the dozens of technologies that are currently
in use and planned is addressed in detail in Section 15 so as to be able to give improved reliability
to planning and funding.
12. It is also extremely important for government (MoFEC) to give tax breaks and quick letter of credit
approvals for import of critical WASH plant and equipment, where these are not manufactured in
Ethiopia to the required specifications. Such equipment includes water drilling machines, pumps,
generators, vacuum trucks, laboratory equipment, etc.
13. DBO (Design, Build and Operation) contracts should be considered by the regional bureaus as a
possible means to deliver projects in line with time, cost and quality.
14. The majority of water projects in Ethiopia are based on groundwater so that the current program
of hydrogeology mapping needs to be accelerated and expanded to all parts of the country but
prioritizing areas where high borehole failure rates are occurring. Where groundwater sources are
known to be limited, then (1) artificial aquifer recharge needs to be considered in collaboration with
47 Rural Public Utility O&M Implementation Manual for Multi Village water Supply Schemes
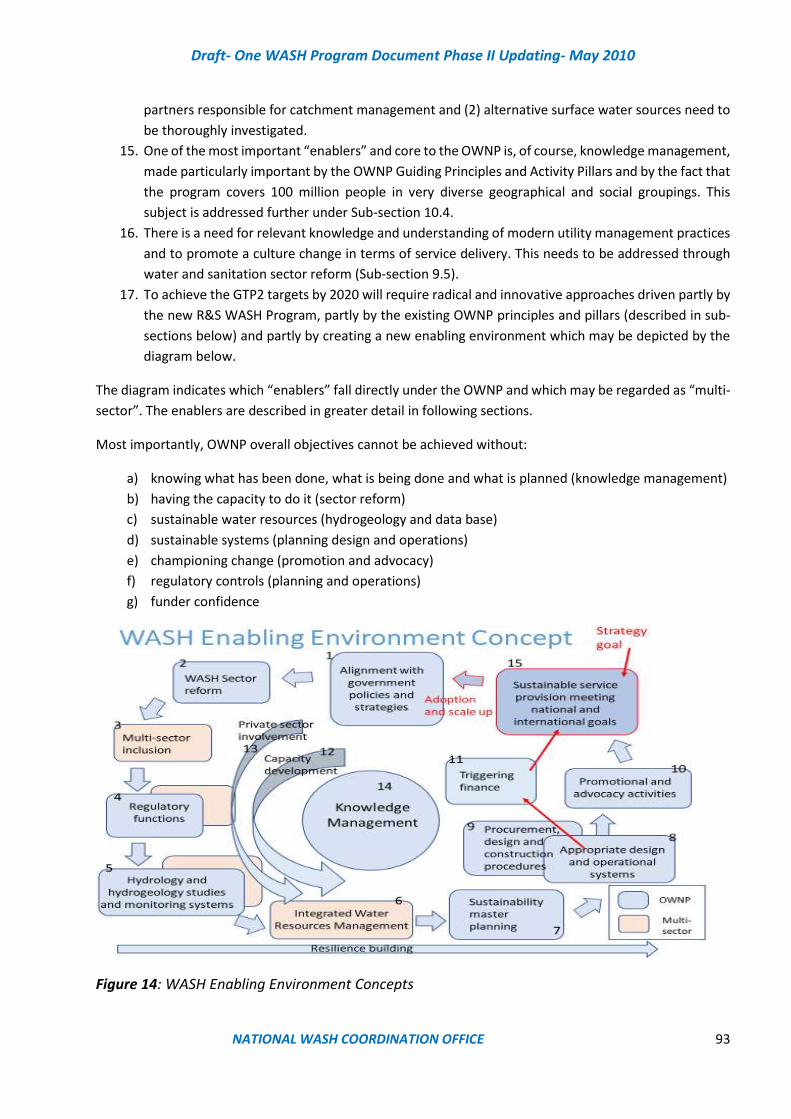
Draft- One WASH Program Document Phase II Updating- May 2010
NATIONAL WASH COORDINATION OFFICE 93
partners responsible for catchment management and (2) alternative surface water sources need to
be thoroughly investigated.
15. One of the most important “enablers” and core to the OWNP is, of course, knowledge management,
made particularly important by the OWNP Guiding Principles and Activity Pillars and by the fact that
the program covers 100 million people in very diverse geographical and social groupings. This
subject is addressed further under Sub-section 10.4.
16. There is a need for relevant knowledge and understanding of modern utility management practices
and to promote a culture change in terms of service delivery. This needs to be addressed through
water and sanitation sector reform (Sub-section 9.5).
17. To achieve the GTP2 targets by 2020 will require radical and innovative approaches driven partly by
the new R&S WASH Program, partly by the existing OWNP principles and pillars (described in sub-
sections below) and partly by creating a new enabling environment which may be depicted by the
diagram below.
The diagram indicates which “enablers” fall directly under the OWNP and which may be regarded as “multi-
sector”. The enablers are described in greater detail in following sections.
Most importantly, OWNP overall objectives cannot be achieved without:
a) knowing what has been done, what is being done and what is planned (knowledge management)
b) having the capacity to do it (sector reform)
c) sustainable water resources (hydrogeology and data base)
d) sustainable systems (planning design and operations)
e) championing change (promotion and advocacy)
f) regulatory controls (planning and operations)
g) funder confidence
Figure 14: WASH Enabling Environment Concepts
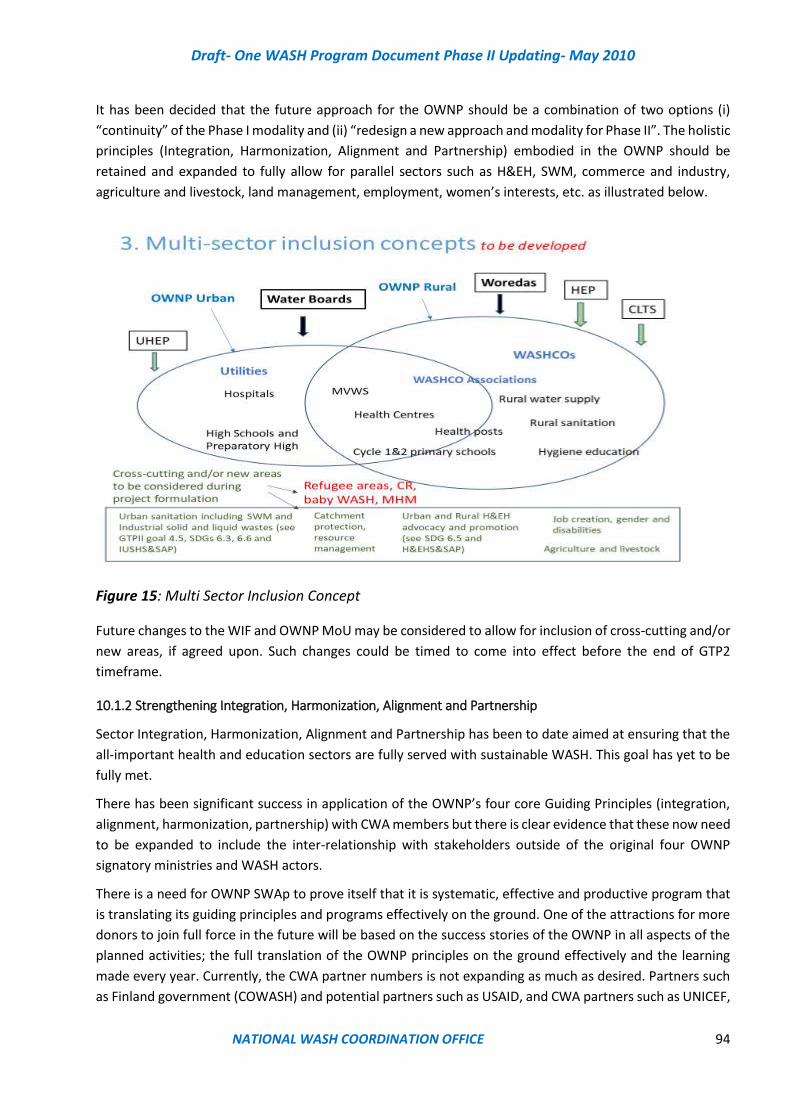
Draft- One WASH Program Document Phase II Updating- May 2010
NATIONAL WASH COORDINATION OFFICE 94
It has been decided that the future approach for the OWNP should be a combination of two options (i)
“continuity” of the Phase I modality and (ii) “redesign a new approach and modality for Phase II”. The holistic
principles (Integration, Harmonization, Alignment and Partnership) embodied in the OWNP should be
retained and expanded to fully allow for parallel sectors such as H&EH, SWM, commerce and industry,
agriculture and livestock, land management, employment, women’s interests, etc. as illustrated below.
Figure 15: Multi Sector Inclusion Concept
Future changes to the WIF and OWNP MoU may be considered to allow for inclusion of cross-cutting and/or
new areas, if agreed upon. Such changes could be timed to come into effect before the end of GTP2
timeframe.
10.1.2 Strengthening Integration, Harmonization, Alignment and Partnership
Sector Integration, Harmonization, Alignment and Partnership has been to date aimed at ensuring that the
all-important health and education sectors are fully served with sustainable WASH. This goal has yet to be
fully met.
There has been significant success in application of the OWNP’s four core Guiding Principles (integration,
alignment, harmonization, partnership) with CWA members but there is clear evidence that these now need
to be expanded to include the inter-relationship with stakeholders outside of the original four OWNP
signatory ministries and WASH actors.
There is a need for OWNP SWAp to prove itself that it is systematic, effective and productive program that
is translating its guiding principles and programs effectively on the ground. One of the attractions for more
donors to join full force in the future will be based on the success stories of the OWNP in all aspects of the
planned activities; the full translation of the OWNP principles on the ground effectively and the learning
made every year. Currently, the CWA partner numbers is not expanding as much as desired. Partners such
as Finland government (COWASH) and potential partners such as USAID, and CWA partners such as UNICEF,
Draft- One WASH Program Document Phase II Updating- May 2010
NATIONAL WASH COORDINATION OFFICE 95
AfDB etc. are running a parallel WASH program indicating that OWNP CWA must deliver to attract more
partners.
10. 1.3. Maximizing availability and efficient use of human and financial resources
It is paramount that available permanent and contractual sector staff and consultants are fully exploited
through the institutionalizing of accountability and encouraging innovation. The program staff should
understand that such social services are cross cutting and have to learn to involve as much stakeholders
(the common and the uncommon) for one common end which is ensuring sustainable and resilient WASH
services.
Release and/or utilization of funds at regional and federal/national levels has been slow. A national
framework for fund raising purposes has been suggested whereby regions could do their own planning and
implementation based on regional proclamations, directives and implementation modalities.
Capacity development efforts should be targeted to achieve more effective and quality WASH programme
implementation and to sustain outcomes at all levels. Due to absence of systematic and coherent
approaches, the activities undertaken by WASH stakeholders might have not been as effective as expected
in order to meet the OWNP objectives. In order to achieve OWNP objectives, institutional and management
capacity of the WASH sectors should be enhanced to solve challenges and address development needs of
WASH sectors in a sustainable manner.
10.1.4 Capacity development for improved delivery of WASH services at all levels
One element necessary to reduce delays in implementation and to shorten procurement is to strengthen
the capacity and skills of PMUs through intensive, sustained TA, and to prepare more realistic
implementation schedules. Improved skills and retained staff with the necessary skills and resources to
manage consultants and contractors are key to reducing project start-up time, implementation on time and
on budget.
Capacity building resources should also be accessible to the private sector, but at a fee. Insistence on
certified engineers, sociologists, financial analysts, quantity surveyors, environmentalists, etc. to be key
positions in consultant scoping and feasibility studies and detail designs will (a) improve WASH
implementation and (b) provide income to the education establishments to ensure they retain highly
qualified staff as well as hardware and software resources.
Capacity of regional laboratories should be strengthened in manpower, equipment and consumables, but
as important is to have more laboratories and all large towns and cities to ensure better access and to
improve reliability and standardization through inter-laboratory benchmarking48. Skilled manpower for
water treatment and quality control and, where appropriate, wastewater quality control should be available
at all town and Woredas. Training and operational manuals are required for water supply laboratory
facilities and for water treatment control and monitoring.
For continuous capacity building there is a need to assess the available human resources pool in each region
and where favorable train the individual to lead the program or in the absence of such resources employ
new staff and establish regional human resource development units”
48For instance, it is understood that Oromiya region and 65,000 schemes but only one centralised laboratory, in Adama
Draft- One WASH Program Document Phase II Updating- May 2010
NATIONAL WASH COORDINATION OFFICE 96
In the short term, before professionalization of RPSs and then absorption into clustered operations,
continuous trainings should be given to WASHCOs. Additionally, spare parts supply chains need to be
established and maintained initially through DPs, regional governments and CSOs with rapid handover to
the private sector.
It is understood that the health and education sectors have conducted a number of hygiene, sanitation and
institutional WASH capacity building activities such as development of strategies and implementation
guidelines to create the enabling environment for implementation of the OWNP interventions. However, to
get these strategies and guidelines into the public domain and, importantly, translated into practical training
syllabi, needs significant investment in training establishments and teachers.
10.1.5 Water Utilities
Urban and MVWS utilities need continuous training and to receive technical assistance to improve utility
management, administration, and operations to reach in full cost recovery status. This capacity will be
enhanced by proposed clustering and formation of large (perhaps zonal) utilities with oversight from
national of regional utility regulators. (See sustainability above)
As technologies and associated business models are developed, trialed and included in master planning and
become established within service delivery systems, then lessons can be learnt from both success and
failures and these need to be shared within and between regions so as to stimulate improvements in
practice and also to avoid any duplication of effort or the repetition of less successful ways of working. For
examples of good practice (GP) to be shared it is essential that the chosen examples are appropriately
analyzed and understood.
10.1.6. Strengthening NWCO and RWCOs
In order to address the weak regional level coordination between the four WASH sectors, lack of integrated
WASH plans, limited effort to coordinate WASH interventions implemented by civil society organizations,
lack of awareness and understanding at regional levels about the OWNP concepts and principles and the
differences between the broader OWNP and CWA, the NWCO and RWCO should be given greater powers
and technical capacity, either in-house or through its contracted agents.
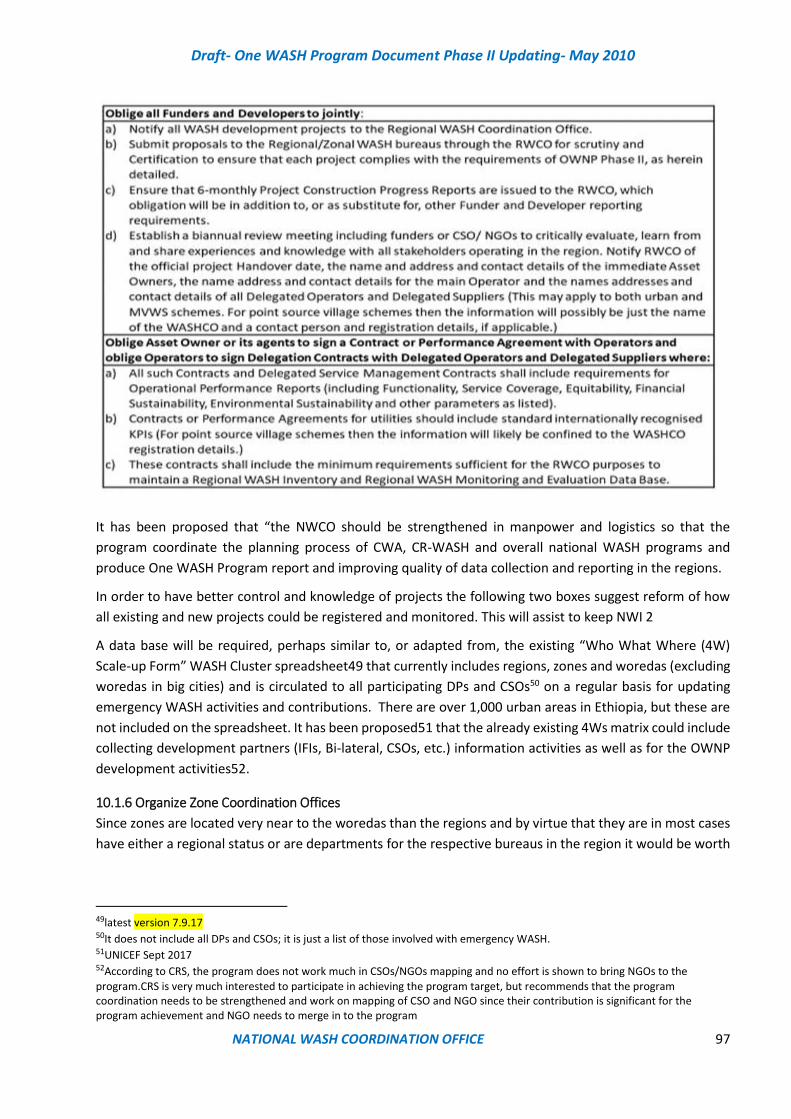
Draft- One WASH Program Document Phase II Updating- May 2010
NATIONAL WASH COORDINATION OFFICE 97
It has been proposed that “the NWCO should be strengthened in manpower and logistics so that the
program coordinate the planning process of CWA, CR-WASH and overall national WASH programs and
produce One WASH Program report and improving quality of data collection and reporting in the regions.
In order to have better control and knowledge of projects the following two boxes suggest reform of how
all existing and new projects could be registered and monitored. This will assist to keep NWI 2
A data base will be required, perhaps similar to, or adapted from, the existing “Who What Where (4W)
Scale-up Form” WASH Cluster spreadsheet49 that currently includes regions, zones and woredas (excluding
woredas in big cities) and is circulated to all participating DPs and CSOs50 on a regular basis for updating
emergency WASH activities and contributions. There are over 1,000 urban areas in Ethiopia, but these are
not included on the spreadsheet. It has been proposed51 that the already existing 4Ws matrix could include
collecting development partners (IFIs, Bi-lateral, CSOs, etc.) information activities as well as for the OWNP
development activities52.
10.1.6 Organize Zone Coordination Offices
Since zones are located very near to the woredas than the regions and by virtue that they are in most cases
have either a regional status or are departments for the respective bureaus in the region it would be worth
49latest version 7.9.17 50It does not include all DPs and CSOs; it is just a list of those involved with emergency WASH. 51UNICEF Sept 2017 52According to CRS, the program does not work much in CSOs/NGOs mapping and no effort is shown to bring NGOs to the
program.CRS is very much interested to participate in achieving the program target, but recommends that the program coordination needs to be strengthened and work on mapping of CSO and NGO since their contribution is significant for the program achievement and NGO needs to merge in to the program
Draft- One WASH Program Document Phase II Updating- May 2010
NATIONAL WASH COORDINATION OFFICE 98
utilizing their capacity, human power and time for OWNP. It is therefore imperative that ZCO, ZPMUs,
monitoring and capacity building units be established at that level
10.1.7 Strengthen Advocacy for WASH
Popularizing OWNP is one aspect of advocacy need. It is only with systematic reach out mechanism that
SWPa can be attractive to donors, bilateral and the government itself as results speak louder than mere
talk.
The other advocacy need to mobilize all concerned including beneficiaries for a sustainable change is by
designing a communication system which is based on facts. For example, with regard to hygiene and
sanitation the following facts speak for themselves.
The sanitation status according to the WHO and JMP updates in 2015 improved sanitation coverage stands
at 28% the rest being unimproved and shared latrine. EDHS in 2016 reported that improved sanitation is
only 6% (16 urban and 4% rural) and unimproved and shared sanitation together amount to 62% leaving
32% as open defectors.
A global sustainable rural sanitation study (SURS) indicate that the acceleration rate for Ethiopia during the
MDG period was 1.2% per year which was why MDG was not met in Ethiopia. The scenario can also be used
to see if we will be able to meet the GTP II plan of 82% by year 2020 with the present trend of 1.2%
acceleration. As per the graphics below even if we are able to accelerate improved sanitation by 3.0% we
can reach to 80% by 2030 indicating that more efforts greater than 3% acceleration rate is required to reach
to the target of 82%
The urban population of Ethiopia is growing at slightly more than 5% per year, which is more than twice the
growth rate of 2.5 for the country as a whole. (Haddis et al., 2013)53. It is expected that by 2020, one in five
Ethiopians will be living in urban areas, and by 2030, half of the country’s population will be living in urban
centers (Teller et al., 2007).54 Ethiopia’s urban population has doubled and is predicted to triple from 15.2
million in 2012 to 42 million by 203755. Indicating for more efforts for urban WASH program
The Water and sanitation related diseases are also cause of death to adults and children. According to the
Health and Health related annual report since 2008, diarrhea, dysentery and parasitic infections which are
always one of the top 10 diseases
Child feces disposal practices in Ethiopia is poor as 69% of families with children of under five years reported
that the feces of their youngest child under three were not disposed safely but thrown everywhere.56
With regard to other tropical diseases Ethiopia is estimated to have the highest burden of trachoma,
podoconiosis and cutaneous leishmaniasis in sub-Saharan Africa (SSA); the second highest burden in terms
53Haddis, A., Getahun, T., Mengistie, E., Jemal, A., Smets, I. and Van der Bruggen, B. (2013) ‘Challenges
to surface water quality in mid sized African cities: conclusions from Awetu Kito Rivers in Jimma, south
west Ethiopia’, Water and Environment Journal, vol. 28, no. 2.
54Teller, C.H., Gebreselassie, T. and Hailemariam, A. (2007) ‘ ‘Population growth and poverty linkages in Africa’,
Fifth African Population Conference, 10–14 December, Arusha, Tanzania [Online]. Available at
http://uaps2007.princeton.edu/papers/70214(Accessed 13 July 2015). 55(World Bank, (2016), A transformational approach to urban sanitation improvement in Ethiopia; Briefing
note 56Godana, W. and B. Mengistie“Determinants of Acute DiarrhoeaAmongChildren Under Five Years of Age in Derashe District, Southern Ethiopia”. Rural and Remote Health13: 2329. (Online Version: http://www.rrh.org.au, 2013)
Draft- One WASH Program Document Phase II Updating- May 2010
NATIONAL WASH COORDINATION OFFICE 99
of ascariasis; leprosy and visceral leishmaniasis, and the third highest burden of hookworm. Infections such
as schistosomiasis, trichuriasis, lymphatic filariasis and rabies are also common. A third of Ethiopians are
infected with ascariasis, one in eight Ethiopians lives with hookworm or is infected with trachoma (Kebede
D.,et’al, 2012)57. It is believed that these diseases are preventable through mass drug administration (MDA)
and proper hygiene and sanitation (FMOH, 2013)58.Helminthic and other infections exposing children to
malnutrition is well documented. Children infected with worms are 3.7 times more likely to be underweight
and are typically anemic and less physically fit59 It is believed that these diseases are preventable through
mass drug administration (MDA) and proper hygiene and sanitation (FMOH, 2013)60.
According to WSP (2015) study on economics of sanitation in Ethiopia indicates that poor sanitation costs
Ethiopia Birr 13.5 billion each year, equivalent to about Birr 170 per person per year or 2.1% of the national
GDP..61
Wealth plays a determinant factor in health and educational development and conversely behavior change
process is rapid with education and available wealth. According to EDHS 62under five mortality rate and
education are correlated with wealth quintiles. The data indicate that the poorer societies are less educated
and mortality of under five children also increase. People in rural areas are also poorer than the urban
residents.
The facts warrant that continuous advocacy and awareness creation has to be major OWNP efforts not only
to communities to those who are affected but also political leaders and managers.
10.1.8 Behavior Change Communication (BCC)
Behavior change communication can only be effective if it is built on facts as indicated in the advocacy
package. Conducting formative research will also indicate social norms, behavior barriers, motivators and
also existing approximate behaviors that people practice although not perfect.
Furthermore, it is understood63 that the current CLTS approach (ODF and latrine construction) is in many
instances not practical or affordable in the pastoralist physical and economic environment (lack of
construction materials such as timber and clay, predominance of animal faeces around dwellings, loose soil,
grazing patterns, etc.) and that alternatives need to be researched (for instance, collection and burial of
faeces in arable land or as part of preparation conservation tree planting64).
Behavior change communication should therefore follow the following for effectiveness.
• Set Clear goals measurable progress: A successful advocacy, no matter how we define it has got to
begin with very clear, realistic, measurable goals. Advocacy must be measured and evaluated so
that we can see where we have made mistakes on what we need to do more for more success
57Kebede D, Kadu M, Teshome G, et’al. 2012. The burden of neglected tropical diseases in Ethiopia, and
opportunities for integrated control and elimination
58 FMOH, 2013 59 IRC (2007), Technical paper series 48, International water and sanitation center, Delft, the Netherlands 60 FMOH, 2013 61 Ibid 62 EDHS (2011) Ethiopia demographic and Health Survey.
63Discussions with USAID Lowlands March 2018 64As practiced in South Africa Natal area
Draft- One WASH Program Document Phase II Updating- May 2010
NATIONAL WASH COORDINATION OFFICE 100
• Audience identification and segmentation: Don’t try to reach out to the general public but
persuade the small group of people such as community representatives rather than the whole
woreda people.
• Design clear, simple, concise message: Example “wash hands with soap or substitute after visiting
the latrine”
• Planning: There are a lot of campaigns in WASH. Think how yours is adding to the landscape.
Assess what others are doing, review who is doing what in research or advocacy campaigns and
identify gaps and or duplication. Think on what can add value to the existing campaigns, think
strategies before moving to Tactics
• Specify what people should do: examples could be use of latrine, hand washing etc
• Make the case: tell why certain behavior is prescribed to the audience. If addressing mothers
talk about childhood diarrhea, its transmission routes and how to control it.
• Match strategy and tactics to your target audience: Apply the rule of three that applies to act on
a cause you believe. “If they hear about it once, they may ignore it; if the hear it from another
person or source they stop and think; if they hear it from someone once more they may actually
do something about it.
In Phase II communication for behavior change and practice should not continue as “business as usual”.
Communities have to be organized and information and communication efforts must be systematized and
involve all means and ways to communicate for a sustainable change. This will involve: Multi-level advocacy,
strengthened household outreach, enhancing community-based approaches for change, enhancing media
support, increased availability and affordability of hygiene and sanitation products through private
commercial and NGO sector initiatives, school hygiene and sanitation, demonstration latrines and hand
washing stations
10.1.9 Develop Efficient Program Communication Strategy
The NWCO should develop Program Communication Strategy to create sustainable buy-in of the wide range
of stakeholders and partners towards the achievement of the OWNP objectives. It should also ensure
appropriate publicity and dissemination of policies, programs, strategies, water legislation, guidelines,
technical standards, regulations. Orders, etc.
So far, the OWNP vision, mission and guiding principles are not well known to people at all levels. At least
beneficiaries should know the program and support it.. High level government officials should also know
about the program, the effort being made, the financial implication put forward and the outcome. It would
be imperative that communication at scale to popularize the program and harnessing much more donors
be one of the focus areas in OWNP Phase II.
To expand public awareness, knowledge of and commitment to the Program, the Program should move
beyond its institutional framework and appeal to the public as potential beneficiaries. This will be achieved
through support to a multilevel multimedia communication strategy that will include:
• Formative research, “customer journeys”, communication plans, etc. as detailed in Annex 2 and
Annex 4
• A “One WASH” logo, mascot and slogan
• Topical spots aired on regional radio stations
• Short programs with health and hygiene messages on ETV and educational broadcasting
• Posters, billboards, banners, pamphlets, stickers and flyers commemorating special events
Draft- One WASH Program Document Phase II Updating- May 2010
NATIONAL WASH COORDINATION OFFICE 101
• WASH educational kit for use in schools
• Use of Goodwill Ambassador(s) and national celebrities to create awareness and spread relevant
messages
Profiling the Program at World Water Day, Earth Day, through photo and art contests and other events in
collaboration with the WASH Media Forum.
10.1.10 Strengthen Monitoring and Evaluation for WASH
The program should have a strong monitoring and evaluation framework, which includes high-level review
meetings, external reviews, and independent sustainability checks, among other measures. This plays a key
role in ensuring effective project implementation by identifying bottlenecks in a timely manner and defining
adequate measures to address challenges that will impact the progress and sustainability of the project.
A comprehensive WASH sector monitoring framework supported by an information system should be
established. MIS enhancements to cover output reporting requirements should be given emphasis in
phase 2 to ensure comprehensive real-time OWNP phase 2 progress reporting.
There is limited conceptual understanding on monitoring and evaluation at management level and weak
capacity to support town water boards to effectively participate in monitoring water supply schemes; the
benefits of project evaluation during implementation are either not appreciated or the OWNP-CWA
reporting formats are seen as being too cumbersome.
It is understood that under NWI 2, 11 KPIs for water and 1 KPI for waste water are being considered along
with 26 supplementary KPIs. It is very important for regional, national and international benchmarking and
regulatory use that these include the 10 internationally accepted KPIs for utility performance. See example
from 6 East and Southern Africa countries above
It is considered that the immediate recommendation of strengthening the NWCO and RWCOs (along the
lines indicate above) should go some way to simplify and improve the NWI and M&E going forward, although
considerable research and data acquisition is still needed to understand the current baseline.
In order to have WASH sector monitoring framework supported by an information system, tailored
trainings for proper data and information inputs for enhanced MIS system users (national and regional
levels) should be prioritized.
Computer hardware and software, as well as training, should be provided to strengthen management
information at region and Woreda level sector offices. This should include financial management and
accounting, and commercial systems for town WSSE at least for category 1-3 towns and for all voluntarily
clustered urban/rural utilities.
The MoE has put in place governance mechanisms through which performances of the school WASH
strategy can be tracked and monitored as integral part of the Educational Management Information System
(EMIS). Performance indicators need to be expanded for School WASH so as to improve the value of the
EMIS.
WASH sectors at national level should provide special support to emerging regions so as to be able to
perform their planned activities and monitor their performances in human, technical and financial
management aspects to the delivery of services
10.1.11 Strategize for Sustainable H&S Development in Rural and Urban Areas
Rural Areas

Draft- One WASH Program Document Phase II Updating- May 2010
NATIONAL WASH COORDINATION OFFICE 102
There is considerable change in rural areas especially in latrine construction but there is still much work
regarding latrine design and usage as many latrines are without superstructure or a squat hole cover, have
non-washable floors, do not provide adequate privacy, allow fly breeding and impart offensive smell and
overall there are about 38 million open defecators in Ethiopia. (Details in section 5.2 above)
Urban Areas
This subject is “multi-sectoral” since it involves labor, women’s rights, solid waste management, economic
impact of poor sanitation, etc. It has been noted that neither the 2013 OWNP document nor GTPII pays
enough attention to hygiene and sanitation in urban areas.
There are a number of on-site and off-site sanitation options for human waste management system in urban
areas. The most practical and affordable on-site system for slum areas in Ethiopia is to construct an
improved pit latrine or a VIP latrine, which can have very good features of clean ability, less smell and long
lasting. However, public and shared latrines demand good operation and management practices.
Providing equitable, gender sensitive and disability conscious public latrines with hand washing facilities,
shower facilities and cloth washing slabs to residents in urban areas is an essential public service. These can
be based on viable business models when combined with other services (shop, water sales, and mobile
phone top up, rest area). They also offer a platform to promote safe water, good sanitation and hygienic
practices.
Having in place full time attendant, trained with simple maintenance and providing tools for maintenance
will sustain the service and boost efficiency.
10.1.12 Strengthen Community Involvement/Participation and Empowerment
a. Community participation
Community participation is essential in project planning, in operation oversight roles for both urban and
rural water supply, sanitation and hygiene awareness, as well as promotion of services and willingness to
pay. Communities, particularly low income communities, should ideally have a sense of “symbolic
ownership” (but not physical ownership of assets) and must have a role to play from inception to completion
of projects and later in operation and management.
Because communities contribute some money or come for a meeting does not mean an end by itself.
Community participation is possible only if communities are organized in some form.
In the urban and MVWS setting, community involvement with service delivery may be as oversight role
(Water User Groups, etc.) or as delegated operators of ring-fenced supply areas (single kiosk, street, low
income area, etc.).
In the single village low tech system, it is anticipated that the WASHCO management system will prevail. It
is stated65 that community participation in project planning and construction will facilitate the “user
community engagement in the post-implementation management of the WASH systems”. It is then stated
that (limited) external support will be required until “the community has developed a capacity to do these
activities itself” and that “it is obvious that a rural community cannot take care of the overall management
65Comparison of community managed projects and conventional approaches in rural water supply (2016)
Draft- One WASH Program Document Phase II Updating- May 2010
NATIONAL WASH COORDINATION OFFICE 103
without the support of the local governments, private actors and NGOs. These external supporters should
establish an enabling environment for post-implementation management activities.”
b. Community empowerment
Ethiopia has been following the CLTSH triggering approach and use of health extension workers as the
primary contact in households. Age-old and almost culture-bound hygiene and sanitation behaviors will
need a more engaging approach based on knowledge on behaviors and practices among the different tribes
in the country.
An innovative approach for a sustainable and improved sanitation and hygiene practice in the future can
only be enhanced through the empowerment of women and the communities at large.
Selected, respected, trusted and prominent residents of a community should be trained to support the HEP
and undertake community mobilization and follow up actions to ensure sustained behavior changes for their
own community.
There are Health Development Army and Health Extension Workers permanently available in villages
throughout the country but they have to be supported, their skills enhanced and provided with tools and
aides for successful communication.
See also Annex 4 for guidance on community empowerment in the urban setting.
10.1.13 Ensure Water Safety
The majority of properties in Ethiopia, both urban and rural, rely on in-property water storage of one sort
or another (roof tanks, ground level tanks, open containers, etc.): Such water will be bacteriologically
contaminated due to negative mains pressures, crowding around wells, open jerry cans, etc. and due to
ineffectiveness of chemical disinfection under these conditions. This indicates the need at all service levels
for “point-of-use water treatment systems” as complementary actions to ensure safety of water66.
In general principle, there will be a need to establish a Water Safety Plan (WSP) by instituting water
surveillance program to prevent pollution sources, such as fencing the catchment area in rural areas.
Another safety measure is to establish and or strengthen water quality monitoring program in the regions
and woredas (but see limitations on laboratories described above). Procuring the necessary field kits and
reagents to be distributed to each woreda, designing monitoring manual and reporting protocol is essential.
Infrequent source chlorination may not be either feasible or protective especially if it is a well or spring
water, because disinfection is only to the volume of water available at the time of chlorination. If
chlorination is done in reservoirs the water will always be clean until new water is added. In both cases it is
advisable to popularize “Point-of-Use Treatment” which may include boiling, filtration in addition to
chlorination.
Introducing other treatment options for chemical removal, softening hard water, treating high fluoride
water with bonechar or clay can be introduced in communities.
66USAID (PSI) have pointed out that point of use treatment may conflict with “safe-at-source” strategies, but may be pragmatic at
short to medium (to long?) term measure.
Draft- One WASH Program Document Phase II Updating- May 2010
NATIONAL WASH COORDINATION OFFICE 104
10.1.14Involvethe Private Sectors in WASH
The low demand for hand pump spare parts makes it difficult for communities and artisans to access spare
parts within a reasonable distance and at an affordable price. MoWIE has made an assessment of supply
chains in 2010.67 This study showed that supply chains for hand pumps and spare parts, largely driven by
market forces, were still in their infant stage in Ethiopia. The study recommended that procurement of hand
pumps and spare parts be combined and private suppliers be motivated to open and operate sub-regional
outlets. The practice of providing spare parts free to communities should be discouraged in order to increase
the incentives for private suppliers to enter this market.
To promote economies of scale, sanitation and hand pump supply chains can be combined and piloted using
trained women and youth entrepreneurs that, if successful, could be considered for scaling up. To make
supply chains more commercially viable products relating to a healthy household environment like
household water treatment and safe storage could also be combined with hand pump spare parts and
sanitary products.
The relationships between microfinance institutions and the water and sanitation sector needs to be
developed in order to jointly build sustainable access to affordable credit. There is the potential for the poor
to better meet their water and sanitation needs through affordable micro-finance loans. However, the
business case would have to be developed through case studies and trials to establish affordability for
customers and profit for entrepreneurs and suppliers. At the same time, supply chain assessment can be
done by directly involving the various actor and stakeholders of the WaSH sector. Business development is
covered in Annex 2 and Annex 5.
It is crucial to identify the degree to which these opportunities are constrained by poor quality or lack of
access to financial services, identify WaSH supply actors and stakeholders that will benefit from the
intervention and finally bring these players together with those who possess the incentives, knowledge,
skills and resources to develop and deliver appropriate financial products and services.
10.2 Long term recommendations
10.2.1 Knowledge Management
The fundamental “Core” or “Enabler” of the OWNP is Knowledge Management, particularly in terms of (a)
what is already installed, (b) what is being built, (c) who is operating, (d) who has “ownership”, (e) what is
functional, (f) what is the performance, (g) what are the gaps, etc.? The OWNP Phase I Review Report
comments upon the current status of the National WASH Inventory and current M&E systems.
A primary “enabler” is Knowledge Management (KM): It is imperative to know the status of WASH through
WASH Inventories and M&E.
67Region Specific Supply Chains for Hand pumps and Spare Parts in Ethiopia, MoWIE, May 2010.

Draft- One WASH Program Document Phase II Updating- May 2010
NATIONAL WASH COORDINATION OFFICE 105
The National WASH Inventory (NWI 1) was based on a combination of WASH related data from 12 million
households and scheme inventories of communal water supplies and WASH facilities at health institutions
and schools for rural and urban areas68.
It is suggested that a new, or complimentary, way to achieve M&E and NWI may be through regular
collection from, and tighter control of, data from woreda, towns, institutions, developers and operators,
possibly by strengthening of the NSCO/RWCO hierarchy and their agents. One suggestion for how this could
be achieved is illustrated in two boxes in Sub-section 11.4.
A data base will be required, perhaps similar to, or adapted from, the existing “Who, What, Where, why
(4W) Scale-up Form” WASH Cluster spreadsheet69 that currently includes regions, zones and woredas
(excluding woredas in big cities) and is circulated to all participating DPs and CSOs70 on a regular basis for
updating emergency WASH activities and contributions. There are over 1,000 urban areas in Ethiopia, but
these are not included on the spreadsheet. It has been proposed71 that the already existing 4Ws matrix
could include collecting development partners (IFIs, Bi-lateral, CSOs, etc.) information activities as well as
for the OWNP development activities72.
10.2.2 Strengthen Groundwater and Surface Water Development
Water Source Development be based on best available hydrological and hydrogeological information,
interpreted by qualified professionals. Alternative water supply and energy sources should be studied at
each project site to meet present and future water, fully taking into account the impact to/from other
existing and proposed projects in the same surface and subsurface catchment zones.
Water utility staff need continuous specialist training and to receive technical assistance to improve utility
management, administration, and operations to ensure sustainable operations, including full cost recovery.
This subject is “multi-sectoral” since there are many competing pulls on water resources (agriculture,
hydropower, pastoral, urban and rural) and many risks (industrial, commercial and domestic liquid and solid
wastes, refugees, IDPs and climate influenced emergencies). Although water resource management and
monitoring are vested in the MoWIE and regional water bureaus, in practice both water and environment
bureaus have little control over public and private water resource exploitation and over pollution of aquifers
and rivers.
The majority of water projects in Ethiopia are based on groundwater so that the current program of
hydrogeology mapping needs to be accelerated and expanded to all parts of the country, but prioritizing
areas where high borehole failure rates are occurring. Where groundwater sources are known to be limited,
then (1) artificial aquifer recharge needs to be considered in collaboration with partners responsible for
catchment management and (2) alternative surface water sources need to be thoroughly investigated.
68 Summary of a seminar 8.4.13 by Katherine Welle on NWI, “lessons learned and maximizing value” which in turn refers to data from Butterworth et al 2013 and Debela 2013 69latest version 7.9.17 70It does not include all DPs and CSOs; it is just a list of those involved with emergency WASH. 71UNICEF Sept 2017 72According to CRS, Sub-section 4.2, the program does not work much in CSOs/NGOs mapping and no effort is shown to bring
NGOs to the program.CRS is very much interested to participate in achieving the program target, but recommends that the program coordination needs to be strengthened and work on mapping of CSO and NGO since their contribution is significant for the program achievement and NGO needs to merge in to the program

Draft- One WASH Program Document Phase II Updating- May 2010
NATIONAL WASH COORDINATION OFFICE 106
Groundwater development should be done in parallel with innovative systems for catchment protection to
improve recharge, involving agriculture, irrigation and livestock authorities and enterprises. Long term
monitoring stations (purpose-built piezometer tubes, capped wells and pumped wells with flow meters) will
be required to monitor levels, quality and discharge to check on long term resource depletion or
improvement. Trials may be undertaken on artificial recharge to improve sustainability of relatively shallow
aquifers not topped by aquicludes.
Supply chains need to be improved that better anticipate procurement needs and to create stocks of most
common spare parts for drilling equipment to avoid delays. This will likely involve easing of import
restrictions (approvals of letter of credit) and applying tax breaks: Import taxes held at government level do
not benefit WASH implementation where funding will come from a multitude of sources.
10.2.3 WASH Sector Reform
The question has been asked73 as to whether it is “realistic to monitor and regulate the existing large
number of schemes … 280,000 at present, with an additional 50,000 per year anticipated”? To this remark
may added that there are over 1,000 urban areas, over 450 woredas, and large number of villages and
pastoral communities, in 9 autonomous regions and two cities divided into over 70 zones.
In order to monitor and regulate WASH operations (and implementation) in Ethiopia, it has become clear
that the water sector will need to undergo some reorganization. GTPII approaches this through (a)
establishment of independent water supply and wastewater service regulatory agency (Goal 4.2), (b) ensure
good governance in rural water supply (Objective 2), and (c) increase the involvement of private sector (Goal
4.4). Such changes will need to allow for increased catchment protection (Goal 3.5) and be able to conserve
water through reduction in NRW (Goal 3.1).
The IUSHS&SAP approaches WASH sector reform principally through voluntary and formal clustering of
urban service providers and delegation of ring-fenced operations and services to private and community
enterprises. On the rural side, it has recently been decided74 to establish independent sector regulator
including performance monitoring and benchmarking of service providers, formally recognize and support
rural public utility management for complex large multi village schemes, shift from community management
to community participation, allow for cross-subsidies and delegate certain functions.
The Ministry of Finance is emphasizing the need for an independent regulator, particularly in urban settings
but increasingly in rural settings as well to include complex rural water supply scheme management.
In view of the above, the Guidelines (Sub-section 10.6 and Annexes) suggest possible new implementation
and operation modalities both for urban and rural WASH service delivery75.
The primary “WASH Sector Reform” principles that may be applicable in the Ethiopia situation and identified
so far include, but are not limited to, the list in Table 18… below. Some sort of new “Implementation and
Operational Modality” is envisaged that is guided by this list and which will (a) address the bottlenecks
73Dr Geremew 74Rural Public Utility O&M Implementation Manual for Multi Village Water Supply Schemes 75 COWASH: Clustering of weak water utilities might be good to make them financially and technically viable but this can happen or be implemented in a step wise approach. To start with private sector maintenance service then to proceed with operation of the whole system. It can be applicable where there is enabling environment and readiness criteria that utilities have financially feasible business plan and are technically viable to support the adjacent utility.
Draft- One WASH Program Document Phase II Updating- May 2010
NATIONAL WASH COORDINATION OFFICE 107
identified under Phase I review, (b) take on board GTP and SDG goals and (c) allow as far as possible for new
strategies, guidelines and directives as they are adopted/issued.
As discussed above, the Ethiopia WASH sector is complex and the OWNP rightly addresses it through the
“Framework”, or process, of Integration, Harmonization, Alignment and Partnership. This process will
become more complex when the “Cross-cutting and/or new areas” are taken into consideration.
Water and sanitation sector reform is an essential component of creating an enabling environment for both
urban WASH and for MVWS systems. However, this will necessarily involve an extended change process
(beyond 2020) although, as described, there are actions that can be continued or initiated in the short term,
such as clustering and delegated management. (Principles in ANNEX)
10.2.4 Resilient and Sustainable WASH Programme in Arid and Semi-Arid Drought Prone Areas of Ethiopia
10.2.4..1 Rural and urban WASH Resilience
Rural WASH presents particular challenges from water stress, related to population and livestock increases,
deforestation, climate change, over-pumping of wells, etc. Industrial scale irrigation may also significantly
impact on traditional village and pastoral water practices. Where there are towns and cities nearby, the
demand for water for domestic, commercial and industrial uses may also compete/impact surrounding
village water supplies (see GTPII Goal 3.5 related to catchment protection).
Low reliability of shallow wells is currently being tackled through “networked villages” whereby several
villages and livestock watering points are served from a single deep borehole. Where sustainable recharge
is insufficient then consideration is being given to very deep boreholes to tap geological water reserves. One
of the main challenges is affordability, which signifies the need for sustainability master planning and
feasibility studies, or viable business models, as described in Annex 2. Electricity production through diesel
generators to power down-hole submersible pumps is expensive and use of alternatives (such as solar
power and hand powered deep pumps) need to be expanded for rural areas, particularly where hydro-
power (or large scale solar and wind generated) grid electricity is out of reach.
SDG 6.4 calls for a substantial increase in water-use efficiency across all sectors, to ensure that water
withdrawals are sustainable in order to substantially reduce the number of people suffering from water
scarcity. In the urban context this means 100% metering, equitable but sustainable tariffs, economy of scale,
low NRW, supportive management, etc.
All these measures would improve both WASH sustainability and WASH resilience.
10.2.4.2Emergency WASH
Emergency is an unfortunate happening in a country or society manifested in different ways. The most
common emergencies are flood, fire, draught, etc. In Ethiopia common emergencies are created during
draught and flood. . “Droughts” in Ethiopia have become a more frequent than used to be in the past. This
creates water shortages usually requiring water trucking which is estimated to be 35 times more costly, per
year, than annualized capital and O&M costs of fixed water systems, often involving very deep boreholes.
Details of what preparation needed is indicated under emergency component above.
During emergency people in the affected areas may have to move to a different presumably safe location.
In this instance the most affected are children, women, and the elderly. The most important need of this
affected population in such instances is food, water, sanitation and hygiene services and shelter which are
difficult to have in place unless prior preparedness is made.
Draft- One WASH Program Document Phase II Updating- May 2010
NATIONAL WASH COORDINATION OFFICE 108
According to UNICEF Preparedness for emergencies include
• Planning for emergency staff deployment
• Pre-positioning of strategic supplies
• Preparation of pre-approved contracts with local implementation partners (such as water trucking
companies) and suppliers
• Advance coordination arrangements with government partners and other stakeholders through the
cluster approach.
Ethiopia is in a better position in tackling emergencies due mainly of its infrastructure and mix of
professionals that can be deployed for emergencies at any level. However, to be better prepared:
• Sector staff should have appropriate basic training
• A manual for WASH emergency which will include application of :
- Chlorination, storage and distribution of safe water
- Construction of safe latrine, hand washing station, shower services and operation and
management arrangements
- Solid waste collection and disposal facilities
These demand a budget set aside for emergencies with the necessary financial procedures to follow during
emergencies.
10.2.4.3 Climate screening for WASH
To improve year-round water security and resilience of schemes to drought, the Program will promote and
support better understanding of available water resources and climate risk and improved design and siting
of schemes. This will include:
• developing linkages between WASH and water resources assessment and monitoring
• mapping and understanding of groundwater resources
• development and use of simple climate risk screening and assessment tools – including
catchment screening to assess the balance between available supply and projected demand
• development and training on sizing and siting of rural water points to reduce vulnerability to
dry seasons and drought periods
• Meetings held with relevant stakeholders in agricultural and environmental departments to
ensure coordination with natural resource management (NRM) interventions and watershed
committees in vulnerable areas.
10.2.5 Enhance the use of Renewable Energy
Depending on the hydraulic power and total power needed, there is a range of pumping system, for which
a power source is economical. Photovoltaic is estimated to be the most economical for small power system.
PV systems are currently considered when the hydraulic power is from 200 to 1500 m-m3/day and a power
rating of 0.5kW or less: In this case the PV system has been found to be viable.76
Rural populations in Ethiopia are still, largely, not reached by the national grid. Although hydropower, wind
farms, and solar arrays are, to a greater or lesser extent already major contributors to the national grid,
probably only solar energy offers the potential for localized remote systems. Biogas has potential at
76 MOH and MoWIE (2012) Design and construction Manual for WASH facilities in Health Institutions
Draft- One WASH Program Document Phase II Updating- May 2010
NATIONAL WASH COORDINATION OFFICE 109
intensive livestock centers. Rural Afar and Somali area has extremely high solar irradiation and very limited
grid access in remote areas on top of power interruption. Access to water in the same regions is also a
critical issue due to limited borehole capacity both quality and quantity.
Renewables, especially solar PV, can provide a solution, but more trials need to be undertaken to establish
viability for large multi-village schemes where very large land area is needed for the arrays.
While the upfront investment on solar based water supply schemes is higher than for generator driven
systems, the financial costs on a life cycle basis are often more favorable since the much lower running
costs, both due to the free supply of energy, improved reliability of photovoltaic and less moving parts to
be maintained. There is also experience in Ethiopia77 that solar pumping systems are more reliable that
conventional hand pump systems, although walking distances will be increased due to more centralized
installation.
World Vision uses three levels of solar pumping systems:
• 1.5 l/s system powered by 2 solar panels
• 2.5 l/s system powered by 4 solar panels
• Large systems for extracting deep groundwater (>250m) powered by up to 200 solar panels
Such type of scheme can be applied both for point source rural scheme (with small size overhead tank and
standpipe) and piped water supply with distribution pipeline network.
77World Vision and USAID (lowland) discussions March 2018
Draft- One WASH Program Document Phase II Updating- May 2010
NATIONAL WASH COORDINATION OFFICE 110
11. Technical Assistance and Academia Support
11.1 Enhancing Technical Assistance
The Program is pursuing ambitious targets while at the same time seeking to fill gaps in capacity at a number
of levels. This, coupled with the relative size and complexity of the Program, the many new roles and
responsibilities it entails at all levels, the absence of a robust regulatory and monitoring framework and the
promotion of new organizational framework, contracting modalities and technologies, make the provision
of relevant and timely Technical Assistance (TA) in addition to what are locally available. The technical
assistance relevant for Phase II will include:
1. Support to establish a robust capacity building program to contextually design, deliver, evaluate,
learn and document result
2. Facilitate support in hydrogeological mapping/ground water mapping
3. Support in establishing mobile technology for real time monitoring and data collection mechanism
in regions and woredas.
4. Introduce new technologies in water and sanitation such as wind and solar and other energy
sources and facilitate demonstration on the ground whenever possible.
5. Support regions and woredas conduct simple applied research on WASH with a view to support
enhancement of sustainable and equitable services.
TA will be provided at federal, regional, city, zonal, woreda and town levels. Planning, coordination,
management and quality assurance of TA will be the responsibility of GoE through its contacting entity.
The modalities for the Technical assistance will include
(i) by GoE through WPMUs in participating ministries and bureaus at federal, regional or city levels
using funds from the Program budget; or
(ii) Directly by a partner, which can be a bilateral or multilateral aid agency, CSO or other
organization.
In both modalities, TA will be provided according to a consolidated annual WASH plan and budget, including
a procurement plan as approved by the NWCO. Any Technical assistance will be short term and output must
include hand-on training to local actors.
11.2 Enhancing the integration of WASH Training Centers of Excellence
11.2.1 Introduction
There is significant peer-reviewed academic research published both within and outside Ethiopia related to
and impacting on rural and urban WASH; for instance, pollution of rivers and lakes through industrial,
commercial, domestic solid and liquid wastes.
However, the link between this research and those involved with policy making, regulation, enforcement,
service delivery, community engagement, etc. may be weak. The enabling environment can be strengthened
through establishing strong links with academia, particularly through advocacy, capacity building, sharing
good practice, professionalization, etc.

Draft- One WASH Program Document Phase II Updating- May 2010
NATIONAL WASH COORDINATION OFFICE 111
11.2.2 Ethiopian Water Technology Institute (EWTI)
A Proclamation was issued in June 2013 establishing the EWTI (formerly the EWTEC) as a research and
training institute with an Advisory Board appointed by GoE. The Institute prepares and conducts short term
practical training on courses designed to fill identified skill gaps of manpower working at different levels in
water development and related activities. It will also conduct long term trainings as per the national
technical and vocational education and training (TVET) qualification framework on higher level programs in
accordance with the manpower requirement of the sector.
The Institute will offer higher-level training to graduates from TVETCs and other institutions as well as the
private sector. The Institute also offers training to TVETC teachers. The Institute is also in a position to
support the improvement of skills to micro and small enterprises that can in turn provide WASH products
and services.
The Program will make use of the services of EWTI to provide training to WASH staff, TVETCs and the private
sector to increase the availability of skilled personnel to provide services to the WASH sector. The Program
will enable EWTI to increasingly become a center of excellence with state of the art skills, knowledge and
competence. It will also support research and development on WASH sector wide identified priorities; and
promoting innovation and knowledge management in the WASH sector through learning and sharing events
and other appropriate measures.
11.2.3 TVETCs and HSCs
In WASH capacity assessments of 16 TVETCs and HSCs conducted by partners before the OWNP 2013
document published/circulated, the following capacity gaps were identified and these capacity gaps are still
existing:
In WASH capacity assessments of 16 TVETCs and HSCs conducted through SNV and Water Aid, the following
capacity gaps are identified:
• Limited and/or non-existence of essential physical and training resources, including equipment and
tools, reference books, logistics and support facilities
• Not adequately consulting relevant WASH stakeholders when planning training

Draft- One WASH Program Document Phase II Updating- May 2010
NATIONAL WASH COORDINATION OFFICE 112
Federal
Region/City
Institution
Figure16: Organizational Diagram for Support to TVETCs and HSCs
Key: CAP - Consolidated Annual (WASH) Plan
WPMU- WASH Program Management Unit
• Deficiencies in assessing and responding to their environments and developing appropriate training
strategies and programs
• Skill gaps among instructors in conducting practical training, with only a few teachers having completed
teaching methodology courses
• Limited knowledge of WASH policies and strategies
To further institutionalize and professionalize the training of much-needed skilled technicians for the WASH
sector, the Program will seek to replicate and scale up the support to TVETCs and HSCs provided through
UNICEF, SNV, Water Aid and other organizations to additional TVETCs and HSCs. This assistance will include
CAP
CAP
NWCO
WASH Coordinator
PMU (MoE)
WPMU (MoE)
WPMU (MoE)
HSC Board TVETC Board
TA
TA
Graduates
Students
Teachers
Job Placement
WASH sectors

Draft- One WASH Program Document Phase II Updating- May 2010
NATIONAL WASH COORDINATION OFFICE 113
support to curriculum development and lesson planning, teacher training and basic training equipment and
tools for workshops and laboratories.
11.2.5 Health and technology Universities
The graduate level study on WaSH (offering Master of Science in WASH) which is established at Wollo
University is one area where collaborative actions will be a good capacity building resource in the future.
Other universities and institutes that are training engineers, environmental health, environmental
engineering, water engineering etc… are good resources that can be used in many types of technical
assistance, research, design and consultancy services.
Draft- One WASH Program Document Phase II Updating- May 2010
NATIONAL WASH COORDINATION OFFICE 114
12. Program Monitoring and Review
12.1 Introduction
Due to the size and scope of the Program and its new elements, procedures and organizational
arrangements, it is essential to establish during Phase II a monitoring program to evaluate the planning,
learning, implementation and evaluation process through:
1. Monthly and quarterly progress and financial reports from kebeles, woredas/towns78, regions/cities
and zones using WASH MIS
2. Status/issues reports by the NWCO and WASH Coordinators to quarterly meetings of the One WASH
Steering Committees at federal and regional levels
3. Semi-annual Joint Technical Reviews (JTR) and follow-up actions track the level of implementation
of the undertakings agreed in the MSF
4. Annual Multi-Stakeholder Forums (MSF) and follow-up actions at national and regional level
5. Infrastructure Audits/Sustainability Checks and follow-up actions
6. Joint supervision visits to Program sites
7. TA and hardware support to strengthen Program monitoring and reporting systems at all levels
8. Service delivery surveys, assessments, research and evaluation for advocacy
9. Learning exchanges by preparing an annual calendar of events
12.2 Key Performance Indicators
12.2.1 Introduction
The Program’s main instruments for monitoring, verification and impact assessment consist of a results
framework and key performance indicators. The Program’s Results Framework contains outputs, outcomes,
indicators and impacts for each Program component and for the Program as a whole. The Program’s results
framework is presented in Annex ….
Key performance indicators (KPIs) will have the following characteristics:
• Related to important policies, issues and objectives
• Clearly defined and easily measurable and consistently applied
• Few, manageable for regular reporting and provide required information for decision-making
• Allow performance to be assessed regularly and tracked over time to inform key decisions
The following key performance indicators (KPIs) will be used in the Program:
78 Numerical Monthly reports from kebeles, woredas and towns may be done by mobile phone or if mobile system is established from the server.
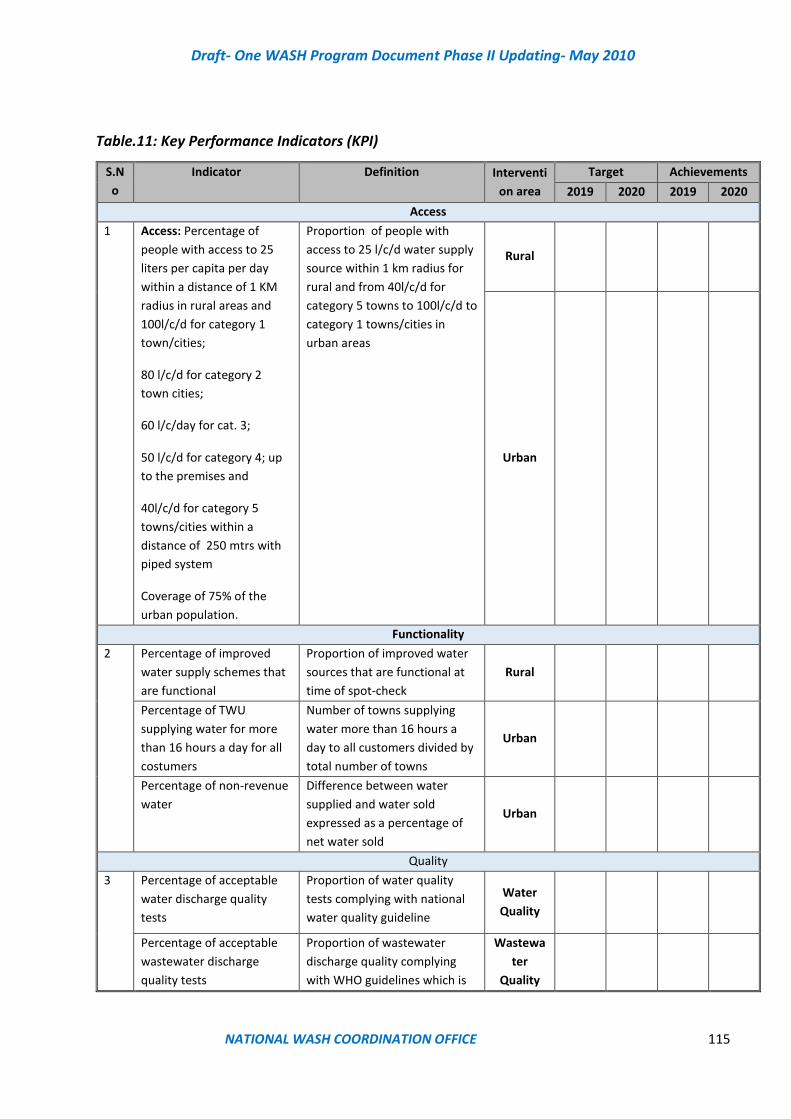
Draft- One WASH Program Document Phase II Updating- May 2010
NATIONAL WASH COORDINATION OFFICE 115
Table.11: Key Performance Indicators (KPI)
S.N
o
Indicator Definition Interventi
on area
Target Achievements
2019 2020 2019 2020
Access
1 Access: Percentage of
people with access to 25
liters per capita per day
within a distance of 1 KM
radius in rural areas and
100l/c/d for category 1
town/cities;
80 l/c/d for category 2
town cities;
60 l/c/day for cat. 3;
50 l/c/d for category 4; up
to the premises and
40l/c/d for category 5
towns/cities within a
distance of 250 mtrs with
piped system
Coverage of 75% of the
urban population.
Proportion of people with
access to 25 l/c/d water supply
source within 1 km radius for
rural and from 40l/c/d for
category 5 towns to 100l/c/d to
category 1 towns/cities in
urban areas
Rural
Urban
Functionality
2 Percentage of improved
water supply schemes that
are functional
Proportion of improved water
sources that are functional at
time of spot-check
Rural
Percentage of TWU
supplying water for more
than 16 hours a day for all
costumers
Number of towns supplying
water more than 16 hours a
day to all customers divided by
total number of towns
Urban
Percentage of non-revenue
water
Difference between water
supplied and water sold
expressed as a percentage of
net water sold
Urban
Quality
3 Percentage of acceptable
water discharge quality
tests
Proportion of water quality
tests complying with national
water quality guideline
Water
Quality
Percentage of acceptable
wastewater discharge
quality tests
Proportion of wastewater
discharge quality complying
with WHO guidelines which is
Wastewa
ter
Quality
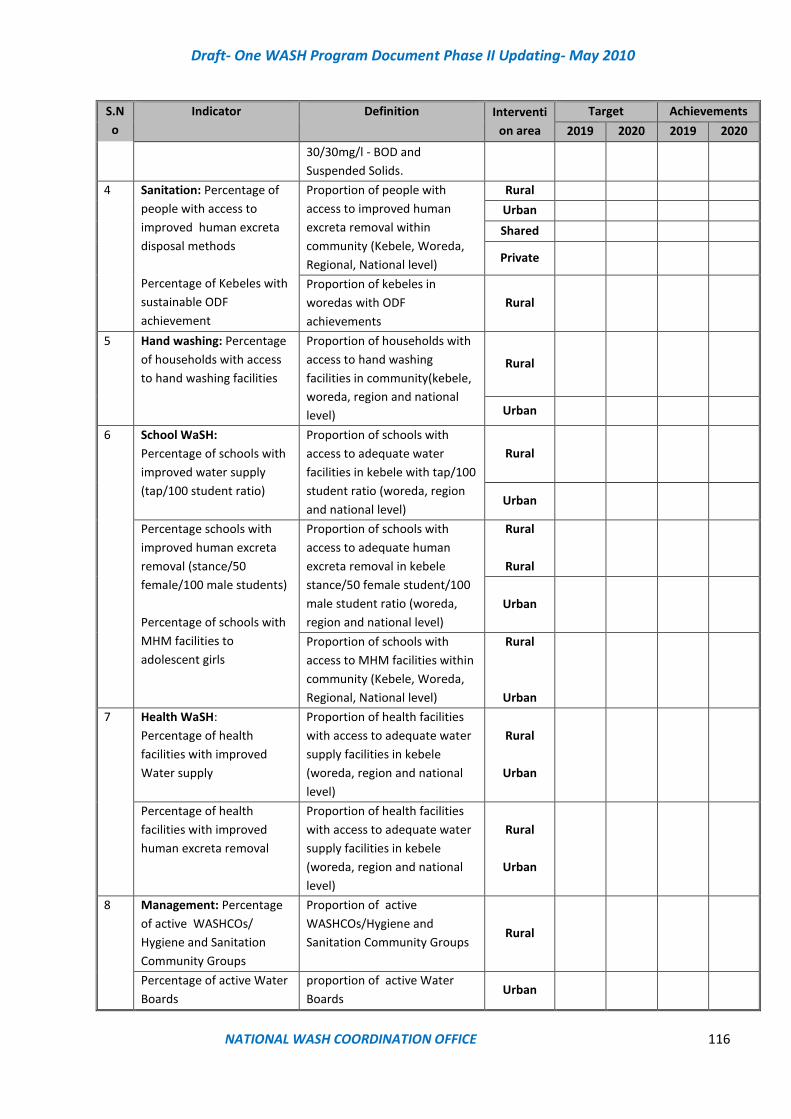
Draft- One WASH Program Document Phase II Updating- May 2010
NATIONAL WASH COORDINATION OFFICE 116
S.N
o
Indicator Definition Interventi
on area
Target Achievements
2019 2020 2019 2020
30/30mg/l - BOD and
Suspended Solids.
4 Sanitation: Percentage of
people with access to
improved human excreta
disposal methods
Percentage of Kebeles with
sustainable ODF
achievement
Proportion of people with
access to improved human
excreta removal within
community (Kebele, Woreda,
Regional, National level)
Rural
Urban
Shared
Private
Proportion of kebeles in
woredas with ODF
achievements
Rural
5 Hand washing: Percentage
of households with access
to hand washing facilities
Proportion of households with
access to hand washing
facilities in community(kebele,
woreda, region and national
level)
Rural
Urban
6
School WaSH:
Percentage of schools with
improved water supply
(tap/100 student ratio)
Proportion of schools with
access to adequate water
facilities in kebele with tap/100
student ratio (woreda, region
and national level)
Rural
Urban
Percentage schools with
improved human excreta
removal (stance/50
female/100 male students)
Percentage of schools with
MHM facilities to
adolescent girls
Proportion of schools with
access to adequate human
excreta removal in kebele
stance/50 female student/100
male student ratio (woreda,
region and national level)
Rural
Rural
Urban
Proportion of schools with
access to MHM facilities within
community (Kebele, Woreda,
Regional, National level)
Rural
Urban
7 Health WaSH:
Percentage of health
facilities with improved
Water supply
Proportion of health facilities
with access to adequate water
supply facilities in kebele
(woreda, region and national
level)
Rural
Urban
Percentage of health
facilities with improved
human excreta removal
Proportion of health facilities
with access to adequate water
supply facilities in kebele
(woreda, region and national
level)
Rural
Urban
8 Management: Percentage
of active WASHCOs/
Hygiene and Sanitation
Community Groups
Proportion of active
WASHCOs/Hygiene and
Sanitation Community Groups Rural
Percentage of active Water
Boards
proportion of active Water
Boards Urban

Draft- One WASH Program Document Phase II Updating- May 2010
NATIONAL WASH COORDINATION OFFICE 117
S.N
o
Indicator Definition Interventi
on area
Target Achievements
2019 2020 2019 2020
9 Gender: Percentage of
WASHCOs/ Hygiene and
Sanitation Community
Groups with 50% + of
members women at
decision making position
Proportion of women members
at decision making position of
WASHCOs/health and
sanitation community groups Rural
Percentage of water boards
with 50% of members'
with women at decision
making position
Proportion of women members
at decision making position of
Water Boards Urban
10 Equity: Woreda/kebele
deviation from the national
average
Mean deviation from the
average number of persons per
improved water point by
kebele and woreda. Same way
by woreda and region as well
as region by the national
Rural
11 Capital Cost: Per capita
investment cost
Difference between per capita
costs for rural water supply at
the beginning of Program and
at intervals during the Program
Rural
Difference between per capita
costs for urban water supply at
the beginning of Program and
at intervals during the Program
Urban
12 O&M : Percentage of
WASHCOs covering O&M
costs,
percentage of water
utilities covering O&M and
replacement costs
Proportion of WASHCOMs who
are able to cover O&M costs
from among the total number
of organized WASHCOMs in the
region
Rural
Proportion of water utilities
who are able to cover their
O&M and replacement costs
through tariffs from among the
certified utilities in the
towns/cities
Urban
13 Percentage of under-5
children mortality rate
decrease
Proportion of Under-5 child
mortality within a given time
period divided by the number
of under- 5 children in theat
time period in the region
Rural
Urban
14 Percentage of under-5
children with diarrheal
disease decreased
Proportion of under-5 children
with diarrheal diseases within a
given time period (usually 15
days) divided by the total
number of under- 5 children in
that time period in the region
Rural
Urban
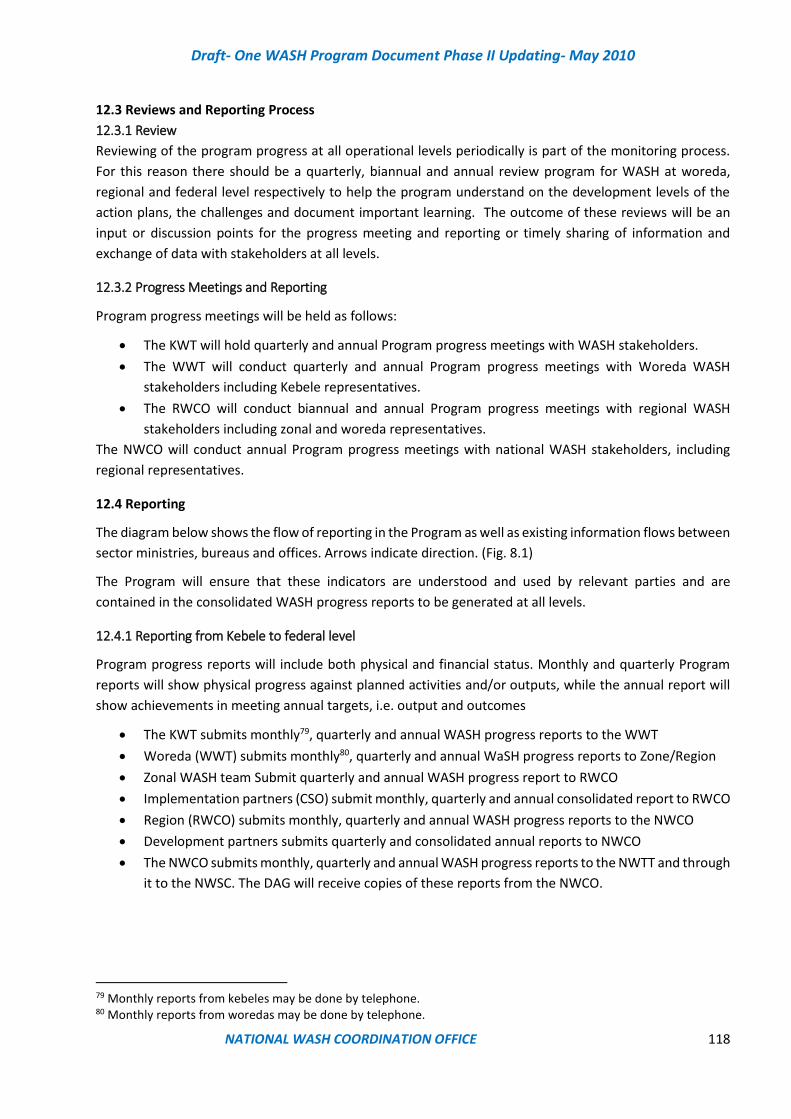
Draft- One WASH Program Document Phase II Updating- May 2010
NATIONAL WASH COORDINATION OFFICE 118
12.3 Reviews and Reporting Process
12.3.1 Review
Reviewing of the program progress at all operational levels periodically is part of the monitoring process.
For this reason there should be a quarterly, biannual and annual review program for WASH at woreda,
regional and federal level respectively to help the program understand on the development levels of the
action plans, the challenges and document important learning. The outcome of these reviews will be an
input or discussion points for the progress meeting and reporting or timely sharing of information and
exchange of data with stakeholders at all levels.
12.3.2 Progress Meetings and Reporting
Program progress meetings will be held as follows:
• The KWT will hold quarterly and annual Program progress meetings with WASH stakeholders.
• The WWT will conduct quarterly and annual Program progress meetings with Woreda WASH
stakeholders including Kebele representatives.
• The RWCO will conduct biannual and annual Program progress meetings with regional WASH
stakeholders including zonal and woreda representatives.
The NWCO will conduct annual Program progress meetings with national WASH stakeholders, including
regional representatives.
12.4 Reporting
The diagram below shows the flow of reporting in the Program as well as existing information flows between
sector ministries, bureaus and offices. Arrows indicate direction. (Fig. 8.1)
The Program will ensure that these indicators are understood and used by relevant parties and are
contained in the consolidated WASH progress reports to be generated at all levels.
12.4.1 Reporting from Kebele to federal level
Program progress reports will include both physical and financial status. Monthly and quarterly Program
reports will show physical progress against planned activities and/or outputs, while the annual report will
show achievements in meeting annual targets, i.e. output and outcomes
• The KWT submits monthly79, quarterly and annual WASH progress reports to the WWT
• Woreda (WWT) submits monthly80, quarterly and annual WaSH progress reports to Zone/Region
• Zonal WASH team Submit quarterly and annual WASH progress report to RWCO
• Implementation partners (CSO) submit monthly, quarterly and annual consolidated report to RWCO
• Region (RWCO) submits monthly, quarterly and annual WASH progress reports to the NWCO
• Development partners submits quarterly and consolidated annual reports to NWCO
• The NWCO submits monthly, quarterly and annual WASH progress reports to the NWTT and through
it to the NWSC. The DAG will receive copies of these reports from the NWCO.
79 Monthly reports from kebeles may be done by telephone. 80 Monthly reports from woredas may be done by telephone.
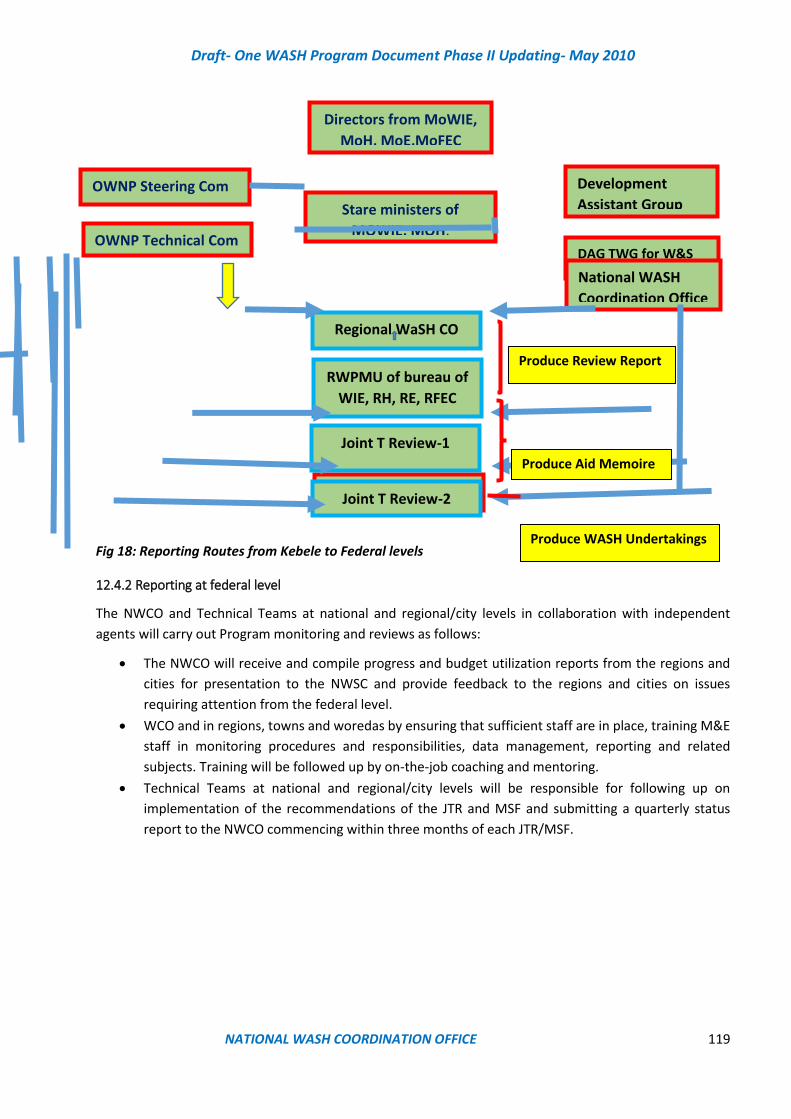
Draft- One WASH Program Document Phase II Updating- May 2010
NATIONAL WASH COORDINATION OFFICE 119
Fig 18: Reporting Routes from Kebele to Federal levels
12.4.2 Reporting at federal level
The NWCO and Technical Teams at national and regional/city levels in collaboration with independent
agents will carry out Program monitoring and reviews as follows:
• The NWCO will receive and compile progress and budget utilization reports from the regions and
cities for presentation to the NWSC and provide feedback to the regions and cities on issues
requiring attention from the federal level.
• WCO and in regions, towns and woredas by ensuring that sufficient staff are in place, training M&E
staff in monitoring procedures and responsibilities, data management, reporting and related
subjects. Training will be followed up by on-the-job coaching and mentoring.
• Technical Teams at national and regional/city levels will be responsible for following up on
implementation of the recommendations of the JTR and MSF and submitting a quarterly status
report to the NWCO commencing within three months of each JTR/MSF.
Stare ministers of
MOWIE, MOH,
MOE,MOFEC
OWNP Steering Com Development
Assistant Group
Directors from MoWIE,
MoH, MoE,MoFEC
Multi S Forum
RWPMU of bureau of
WIE, RH, RE, RFEC
Regional WaSH CO
OWNP Technical Com DAG TWG for W&S
National WASH
Coordination Office
Joint T Review-1
Joint T Review-2
Produce Aid Memoire
Produce Review Report
Produce WASH Undertakings
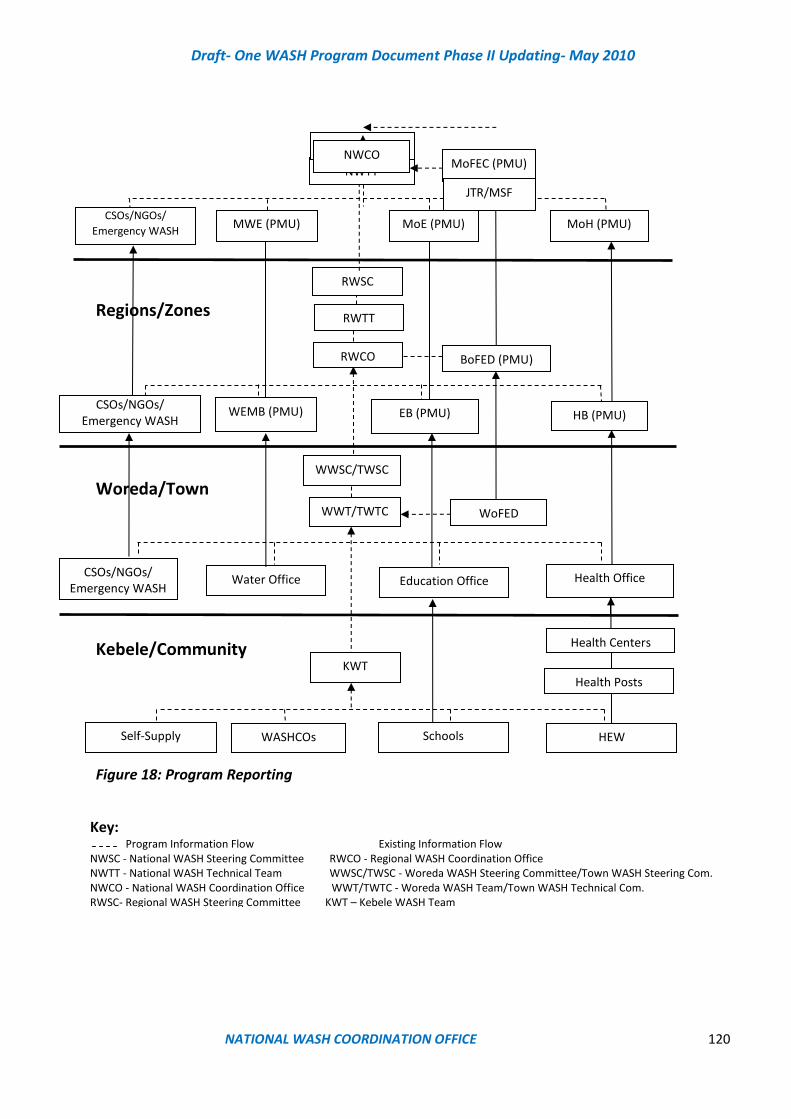
Draft- One WASH Program Document Phase II Updating- May 2010
NATIONAL WASH COORDINATION OFFICE 120
Regions/Zones
Woreda/Town
Kebele/Community
Figure 18: Program Reporting
WWT/TWTC
WASHCOs
WWSC/TWSC
KWT
CSOs/NGOs/ Emergency WASH
Education Office Water Office
HEW Self-Supply
Health Posts
Health Centers
RWSC
MoFEC (PMU)
Water Office
BoFED (PMU)
Water Office
NWTT
NWSC
RWTT
MWE (PMU)
RWCO
Schools
Self Supply
WoFED
NWCO
CSOs/NGOs/
Emergency WASH
CSOs/NGOs/ Emergency WASH
PMU
EB (PMU)
WEMB (PMU)
MoE (PMU)
MoH (PMU)
JTR/MSF
Water
Office
HB (PMU)
Health Office
Key: Program Information Flow Existing Information Flow
NWSC - National WASH Steering Committee RWCO - Regional WASH Coordination Office NWTT - National WASH Technical Team WWSC/TWSC - Woreda WASH Steering Committee/Town WASH Steering Com. NWCO - National WASH Coordination Office WWT/TWTC - Woreda WASH Team/Town WASH Technical Com. RWSC- Regional WASH Steering Committee KWT – Kebele WASH Team RWTC – Regional WASH Technical Committee KWT - Kebele WaSH Team Remark: WaSH consolidated reports are prepared monthly quarterly and annual

Draft- One WASH Program Document Phase II Updating- May 2010
NATIONAL WASH COORDINATION OFFICE 121
12.5 Mobile Technology for Transmission of Data and Information
The National WASH Inventory (NWI) represents a large and important step forward in the understanding of
the water supply and sanitation situation in Ethiopia. The NWI is a standard, national survey of WASH
coverage in Ethiopia. The NWI 1 was a major undertaking of the MOWIE. The NWI was implemented by the
National WASH Inventory Project Office (NWIPO) at the Ministry of Water and Irrigation and Electricity,
during 2010-11. All regions and cities were included in the NWI.
NWI2 is expected to be finalized during Phase II of OWNP. It will be using the experience gained in
conducting WASH inventories in 2010-11 (2013-14 EFY) using mobile phones to transmit and collect
information.
The NWI 2 will involve as has been done for NWI 1 all community water schemes in rural areas and all urban
water supply systems in the regions where each water point will be identified according to its coordinates
and Information collected, including the number of users in woredas and kebeles in the country. Information
on WASH in schools and health institutions will be also collected. NWI 2 results are expected to be officially
released by MoWIE which is currently the chairperson for OWNP Steering Committee to WASH stakeholders
during the Phase II period.
The continued rapid expansion of mobile technology in rural and remote areas of Ethiopia creates unique
opportunities for applications that support transmission of near real time information. This development
opens up the possibility for community level monitoring using cell phones.
To harness this potential, the Program will support:
1. A One WASH website with access to current WASH plans, budgets, progress reports, WASH inventory
data, information on upcoming events and relevant documents and maps.
2. Training in use of GPS devices and PDAs/tablets for generating and storing WASH data
3. Expanded internet connectivity for woredas
4. IT service and troubleshooting contracts
5. Training in use of MS Excel for data entry and reporting
6. Dedicated links to MIS and databases in MoWIE, MoH, MoE and MoFEC
These services will be provided by a firm procured through NCB and monitored and supervised by the
NWCO. Experience from implementing the NWI in Somali Region using mobile phones and software for
data entry and transmission will be very useful in this regard.

Draft- One WASH Program Document Phase II Updating- May 2010
NATIONAL WASH COORDINATION OFFICE 122
13. Funding and Financial Management
13.1Introduction
The total funding required to achieve the GTP II water supply, sanitation and hygiene targets is USD 5.0
billion (Section 16).
To achieve such GTP targets in the set timeframe (to 2020) will be entirely dependent on:
➢ much greater sector capacity
➢ involvement of a much stronger NWCO (and associated RWCOs)
➢ a more facilitated and streamlined fund distribution system, that is, procedures in place to ensure
the smooth flow of funds
➢ fast-track procurement processes
➢ contracting of consultants, suppliers and contractor at scale (large packages) and on an
international procurement basis
➢ timely availability of adequate financial resources
➢ systems in place to track implementation progress and fund utilization
See Section 15for details of plans to improve procurement and contract management.
13.2 Principles
The guiding principles for Program financing are:
• The cost recovery strategies promulgated in the water resource management policy
• Different financing sources for urban water, urban WASH, rural WASH and CR-WASH
• Institutional WASH ring-fenced and channeled through sector budgets
• Consideration of existing financing practices
• Consideration of the available financial resources
• Consideration of the CSO (NGO) contribution in WASH, especially in rural areas
• Considerations of all bilateral, regional and international organizations contribution for WASH
• Urban residents through utility funding should contribute at least the same share of costs as rural
communities
13.3Assumptions
The assumptions for Program financing are:
• To determine the total financial contributions from Government, budgets at federal, regional and
woreda/city levels are included
• Community contributions are assumed to be 10% for both urban and rural communities. Rural
communities will contribute 5% in cash and 5% in kind (labor, materials, etc.) Community
contributions for low and high technology systems will vary during implementation considering the
ability of communities to contribute. The fact that rural water services is aiming at MVS and rural
pipe system may need to set up a tariff system than only depend only on 5% contribution. The
contribution of urban residents is also assumed to be 10% and will come from the utility’s own

Draft- One WASH Program Document Phase II Updating- May 2010
NATIONAL WASH COORDINATION OFFICE 123
earnings. By larger utilities higher proportion of co- financing will be attempted while by smaller
towns maximum contribution will be limited to 10% because of their current financial situation.
However, the program encourages utilities in urban and rural areas to attain higher cost recovery
ratios. In Phase II higher cost recovery ratios will be set.
• Federal and regional government contributions are assumed to increase during the Phase II
planning period.
• City administration contributions are computed by assessing current matching fund allocations for
water supply and wastewater projects. It is also assumed that these contributions will increase.
• Donor contributions are estimated by assessing individual donor commitments.
• WASH contributions from NGOs are assumed to continue at the present level.
• Investment funding from water utilities are assumed as user contributions.
• Water Resource Development Fund will be accessed by towns and cities in Phase II better than what
was contributed in Phase I.
13.4 Funding Contributions
Sources and size of projected funding for the Program are shown in the graph below. During Phase I there
was a funding gap of 32% which amount to 0.778 billion USD. According to present Phase II estimates the
required budget will be 6.04 million USD (see graph below).
Unless funding sources from government. NGOs, grant, loan or partner contribution is not fully available
the program anticipates even more gaps during Phase II. Such conditions will definitely compromise the
process of achieving the target set by GTP II.
1.8 of the 6,040 billion USD is identified as required under the R&S WASH Programme (Resilient and
Sustainable Water Supply, Sanitation and Hygiene programme in Arid and Semi-Arid Drought Prone Areas
of Ethiopia). This figure falls within the 2.0 billion USD to be allocated under a ring-fenced “CR-WASH”
funding drive.
The remaining 3.2 billion USD needs to be found for the many other funding stream discussed in sub-
sections below.
Fig. 19: Sources of fund for WASH program
Community, $906(15%)
Government $2,416 ( 40%)
Doonors, $2,718,
(45%)
PROGRAM SOURCE OF FUND IN MILLION USD

Draft- One WASH Program Document Phase II Updating- May 2010
NATIONAL WASH COORDINATION OFFICE 124
Primary drivers to funding may be:
a) reliable data bases and reporting (KM)
b) groundwater and surface water resource mapping
c) Regulatory enactment and enforcement (urban planning, pollution control, abstraction licensing,
etc.)
d) plans based on sustainable master plans
e) Large package contracts for study and design, supply and implementation involving international
bidding and facilitated letters of credit, etc.
f) Water and sanitation sector reform – utility regulation (urban and MVWS), clustering of operational
economy of scale utility, performance contract and KPIs, delegation, PPP, etc.
g) country economic state, GDP (internal funding)
h) Geo-politics (external funding)
Also:
• Strengthening performance-based program funding; creating awareness and encouraging
government at all levels to allocate additional funds to WASH activities
Fund allocation to priority activities and financial disbursements for implementation of activities in
accordance to approved financial plan and disbursement schedules improving incentives for the private
sector to provide WASH services
• Appealing to committed donors to provide additional funding
• Appealing to interested but uncommitted donors to contribute to the Program
• Introducing cost-effective designs; water supply, drilling and borehole construction methods; low-
cost technologies, cost saving measures by using renewable energy sources, etc.
• Increased emphasis on self-supply, and in urban areas on reducing demand through water efficiency
audits, water conservation, reuse and other demand-management measures.
• Minimizing non-revenue water and improving revenue collection
13.5 Mitigation measures for budget availability and utilization risks
The following measures can reduce the risk of interruptions and shortfalls in budget allocation:
• Introduce a mechanism in the Joint Financing Agreement with a specific section stating that all
parties should ensure the timely availability of committed funds.
• Design project financing so that the sequence of works to be financed by the GOE comes first to
force GoE WASH structures to avail the committed budget
• Use all available forums to create awareness on the importance of GoE’s budget allocation
• Introduce biannual forums to review availability of funds and ensure that corrective actions are
taken.
• Designing mechanisms that ensure SPG (special purpose grants) dedicated to WASH are actually
spent on WASH activities.
• Matching funds from water utilities, cities and regions should be on-budget and captured in budget
proclamation
• National WASH Steering Committee to take steps to ensure that national authorities allocate the
committed budget

Draft- One WASH Program Document Phase II Updating- May 2010
NATIONAL WASH COORDINATION OFFICE 125
• In cases where part of committed GOE budget cannot be made available for justifiable reasons,
bring donor funding forward with the agreement that next fiscal year the GoE will increase its
budget allocation.
• Move away from non-sustainable systems that demand perpetual budget allocation to water
systems and pumping technologies that can serve communities for many years. (Shallow wells and
hand pump technology has been tested for many years and its failure rate has demanded new wells
and pumps every year.)
13.6 Financial management
13.6.1 Introduction
In line with the principle of alignment with Government systems, the Program will follow GoE’s financial
management rules and policies. MoFEC will be responsible for the overall financial management of the
Program and will carry out financial management in accordance with sound financial management
procedures including internal control mechanisms in line with GoE’s financial management policies and
guidelines.
13.6.2 Sources of Funding
Program funding comes from the following sources:
• Government of Ethiopia
• External Financing Agencies (investors/Development Partners)
• Non-Governmental Organizations (NGOs)
• Participating communities in rural areas
• Water utilities’ earnings
• Woreda municipal rates, tariffs, taxes etc.
• Cross subsidy from other sectors (for instance, surcharge on electricity, mobile phones, luxury
good, etc.)
• Internal subsidies (for instance, from water revenue to sanitation)
• CSR and other private sector funding
• Religious organizations (parish work, including software such as BCC and clean-ups)
Government of Ethiopia
The Government of Ethiopia’s contributions come from federal, regional, town and woreda level.
Government financial support for WASH is, for the most part, by way of the Block Grant that is channeled
from the Federal to the Regional governments for both recurrent and investment costs.
While the block grant amount will be allocated to WASH at regional level as regional contribution, federal
government contributions come as special purpose grants like the MDG fund, Food Security Program, etc.
that will come to regions and then part of the fund is allocated to WASH at regional level.
Institutional (schools, health facilities, government offices, prisons, etc.) WASH should be increasing
financed from ring-fenced sector budgets and less from CWA and CSO sources.
City administration also put substantial amount of contributions as direct grant to utilities or as co-finance
to donor financing.
External Financing Agencies

Draft- One WASH Program Document Phase II Updating- May 2010
NATIONAL WASH COORDINATION OFFICE 126
Donor contributions made specifically for the Program constitute the core budget (including the
Consolidated WASH Account). Donors that will contribute to the Program but not through CWA will be
considered in the consolidated annual plan resource mapping.
Non-Government Organizations (Civil Society Organizations)
NGOs are investors in, and implementers of, the WASH program. Their funds, however, do not flow through
government channels and are therefore “off-budget”. However, NGO planned expenditures on WASH are
also included in consolidated annual plan resource mapping.
Communities
All communities undertaking WASH projects make a cash/in-kind contribution to construction/installation
costs. These contributions are also “off-budget” but are recorded and reported and included in the resource
mapping that initiates annual WASH budgeting in the woredas. Community contributions to the Program
include contributions from rural communities and urban residents.
Water Utility Earnings
Urban resident’s contribution is through water service charges. Consequently, the water utilities contribute
in OWNP from own earnings in the WASH fund. It will be accounted at town level for grant programs while
for loan financed projects it will be included in to CWA at federal level through transfers as co-financing.
13.6.3 Financial Management – Roles and Responsibility
Federal Level
MoFEC is responsible for the financial management of GoE and CWA funds. Specifically, MoFED. During
Phase I activities such as opening foreign currency accounts for Development Partners and the request and
receiving funds process, opening of a birr account and transferring development partners’ fund in to CWA,
and transferring funds on the basis of approved plans, budgets and reports is well established.
What should be followed and strengthened hereafter are:
• Ensures that adequate internal controls are in place and adhered to
• Reports on use of WASH funds to government, Development Partners and other stakeholders
• Ensures timely replenishment of the Consolidated WASH Account and fund disbursement to
implementing agencies (WPMUs and BoFEDs) and NWCO through MoWIE.
Sectoral ministries are responsible for reporting to MoFEC on all Program financial matters.
Regional Level
BoFEC is responsible for management of GoE and CWA funds at regional level. Specifically, BoFEC. At this
level also opening special account, maintaining the budget of regional sector bureaus and disbursement;
transferring funds on the basis of approved plans and budgets to special accounts are well established.
What should be followed and strengthened hereafter are:
• Monitors performance and receives reports from WoFEC
• Provides technical support to ensure that proper accounting systems established are being
maintained in each implementing agency;
• Provides internal auditing,

Draft- One WASH Program Document Phase II Updating- May 2010
NATIONAL WASH COORDINATION OFFICE 127
• Issue of necessary detailed guidelines to all implementing agencies in the management and
administration of OWNP funds
• Maintains regular communication with the implementing agencies
• Ensures timely replenishment of the regional WASH account and fund disbursement to the
implementing agencies (RWCO, RWPMUs, WoFEC and towns).
• Prepares and submits financial reports to MoFEC and regional government
Woreda Level
WoFEC is responsible for managing GoE and CWA funds at the woreda level. At this level also opening special
account to receive WASH funds from BoFEC is well established. What should be followed and strengthened
hereafter are:
• Ensuring that proper accounting systems and competent accounting staff are established and
maintained
• As a member of WWT assists the WWT in the planning and budgeting process
• Facilitates timely fund replenishment
• Provides the WWT with regular financial reports
• Collects and aggregates required financial data and information and submits reports to the
Woreda Administrative Council (Cabinet) and BoFED each quarter
• Disburse payments to WASHCOs based on authorization of the WWT
Town Level
(a) Loan Component
Water utilities are directly responsible for administering the loan component transferred for water supply
expansion. The system of opening accounts and transferring contribution to WRDF is established in some
towns but need to be accessible to all towns and cities where all who are able to access loans should follow
the following procedures.
• Opens a special account to receive loan from WRDF
• Transfers the own contribution amount to WRDF as per agreed schedule
• Ensures that proper accounting systems and competent accounting staff are established and
maintained
• Provides the WRDF with regular financial reports
• Collects and aggregates required financial data and information and submits reports to the
WRDF each quarter
(b) Grant Component
The grant component is transferred from BoFEC to ToFEC office. The ToFEC office disaggregates the WASH
fund in water supply and sanitation component based on the approved budget. The grant for water supply
improvement is transferred to the water utility. Other WASH components are managed by Town Finance
and Economic Development Office.
If small town utilities recognize lack of capacity to implement the WASH fund they can delegate the
regional/zonal water office in writing. They will request BoFEC to transfer the grant amount to the

Draft- One WASH Program Document Phase II Updating- May 2010
NATIONAL WASH COORDINATION OFFICE 128
regional/zonal water sector institution to implement their activities. The regional/zonal institutions should
execute the plan according to their agreement and or facilitate the private sector to take part in the
implementation of the approved town plan.
13.6.4 Fund Flow and Channeling of Funds
a) Fund Flow
The preferred and primary fund flow will be Channel 1b through CWA.
Channelling of Development Partners’ funds will be as follows:
• Development Partners will confirm their precise contributions within the bilateral agreements
between MoFEC and the individual Donors.
• Development Partners will inform MoFEC of their annual contribution not later than November
for the next fiscal year based on the annual work plan agreed in October.
• Donor contributions will be channeled to special foreign currency accounts at the National
Bank of Ethiopia (NBE) for each financing partners.
• Development Partners contributions are transferred from a Foreign Special Account into the
Consolidated WASH Account (CWA) administered by MoFEC and
• Flow only through Channel 1b to the governmental WASH implementing agencies at federal
level, through BOFEC to regional implementing agencies and to WoFEC.
Channeling of funds will be aligned to the Government’s financial management system. Government
contributions from federal level are channeled to BOFEC either as SPG or block grants. In both cases the
regions decide the amount of money to be used for WASH. The budgeted amount at regional level will either
be transferred from BoFEC to regional implementing agencies or WoFEC.
At the Woreda level WoFEC manages the WASH fund. WoFEC will open a special account for WASH funds.
In Woredas where CMP projects are implemented. The WoFEC will also open another account dedicated for
CMP or can outsource the channeling of the fund to a service provider (Cooperative Bank, MFI). In either
case the responsibility for managing Program funds will be WoFEC.
The following figure shows the flow of funds in the Program.
B) Channeling of WASH Funds outside of CWA
B1) Channeling of WASH funds through BoFEC
Some donor investments that are not channeled through CWA are made at the regional level through BoFEC
The fund channeling at regional level will be captured by BoFEC as WASH fund and shall also be included in
the quarterly financial reporting in a separate report from CWA.
B2) Channeling of WASH funds through implementing agencies
Some donors channel WASH funds through the implementing agencies like sector ministries and bureaus.
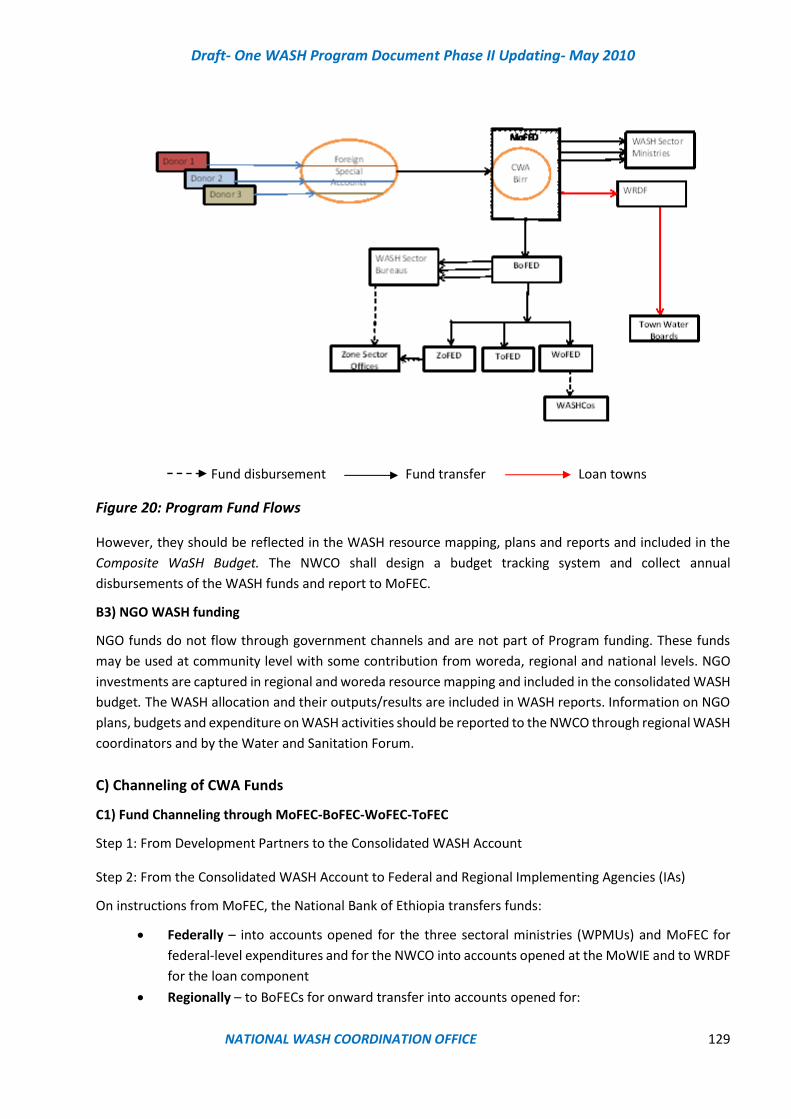
Draft- One WASH Program Document Phase II Updating- May 2010
NATIONAL WASH COORDINATION OFFICE 129
Key
Figure 20: Program Fund Flows
However, they should be reflected in the WASH resource mapping, plans and reports and included in the
Composite WaSH Budget. The NWCO shall design a budget tracking system and collect annual
disbursements of the WASH funds and report to MoFEC.
B3) NGO WASH funding
NGO funds do not flow through government channels and are not part of Program funding. These funds
may be used at community level with some contribution from woreda, regional and national levels. NGO
investments are captured in regional and woreda resource mapping and included in the consolidated WASH
budget. The WASH allocation and their outputs/results are included in WASH reports. Information on NGO
plans, budgets and expenditure on WASH activities should be reported to the NWCO through regional WASH
coordinators and by the Water and Sanitation Forum.
C) Channeling of CWA Funds
C1) Fund Channeling through MoFEC-BoFEC-WoFEC-ToFEC
Step 1: From Development Partners to the Consolidated WASH Account
Step 2: From the Consolidated WASH Account to Federal and Regional Implementing Agencies (IAs)
On instructions from MoFEC, the National Bank of Ethiopia transfers funds:
• Federally – into accounts opened for the three sectoral ministries (WPMUs) and MoFEC for
federal-level expenditures and for the NWCO into accounts opened at the MoWIE and to WRDF
for the loan component
• Regionally – to BoFECs for onward transfer into accounts opened for:
Fund disbursement Fund transfer Loan towns
Draft- One WASH Program Document Phase II Updating- May 2010
NATIONAL WASH COORDINATION OFFICE 130
- the RWCO into accounts opened at regional water bureaus (for joint Program support)
- the three sectoral Bureaus and BoFEC (for WPMU-specific expenditures)
Fund Transfer from WRDF to Town as Loans
WRDF receives transfers from MoFEC for the loan component:
• Transfers payments to special accounts of town water boards
• Matching funds from utilities, city administration and regions will be transferred to special account
in WRDF
Transfers from BoFEC to regional IA and Zones/Woreda Finance Offices
• Regional /Zonal Sector Offices - BoFEC disburses funds to:
- Regional Sector Bureaus for WASH expenditure
- Zonal Finance Offices for WASH expenditure
Regional Water Bureau can delegate WASH activities to be effected by a stronger Zonal Sector Offices. The
budget will be disbursed from regional water bureaus.
• Town/Woredas - BoFECs also open accounts for, and disburses funds to WoFECs for WWT
expendituresParticipating towns (for town water supply and sewerage projects and other WASH
activities)
• CMP funds through WoFEC
BoFEC will transfer WASH funds directly to WoFEC’s account. In this case WoFEC will open a special
account dedicated for community WASH investment managed by the Woreda Finance Office.
WoFEC disburse WASH funds to communities after approval by WWT from the special account.
C2) CMP Fund Transfers through Service Providers
A main feature of the CMP approach is that funds for construction/rehabilitation of WASH facilities are
channeled to the WASHCO who is responsible for implementation and procuring materials and services for
the project. CMP funds can also be channeled through a service provider (e.g. a bank or MFI). In the COWASH
Project MFIs are presently used as a financial intermediary to channel funds for CMP projects to WASHCOs.
WoFECs, in agreement with the WASHCO, can decide to channel funds through a service provider. If a
service provider is used, WoFEC, in agreement with the community, will enter into an agreement with the
service provider, subject to the prior approval of BoFEC to ensure compliance with GoE’s public financial
management rules.
Disbursements to the service provider will be subject to prior approval from the WWT and WoFEC. The
service provider will submit monthly disbursement and utilization reports to WoFEC. Original copies of
relevant financial records will be maintained by the WoFEC. WoFEC will report quarterly to BoFEC on
utilization of WASH funds, including funds for CMP projects, with a copy to the WASHCO. Detailed
arrangements will be agreed during detailed planning with the community based on CMP financial
guidelines.
13.6.5 Fund Allocation
WASH funds are allocated to implementing agencies as follows:
Federal level
Draft- One WASH Program Document Phase II Updating- May 2010
NATIONAL WASH COORDINATION OFFICE 131
The Annual (National) WASH Plan and Budget specifies the amount of WASH funds to be budgeted at the
national level for:
• Expenditure by the NWCO and by each of the four national WPMUs
• Expenditure on trans-sector national WASH activities
• Loan component to be transferred to Water Resources Development Fund
It also specifies the total amount to be allocated to the regions. Allocation among regions is prescribed by
the government’s Block Grant formula and annual WASH plans. Expenditures on trans-sectoral national
WASH activities are those expenditures which are allocated for WASH integration and coordination and
those that are expended for activities like JTR, MSF and other multi sect oral and monitoring activities.
Regional level
Annual Regional WASH Plans and Budgets specify the amount of WASH funds to be budgeted at the
regional level for:
• Expenditure by RWCOs and by each of the four regional WPMUs
• Expenditure on trans-sector regional WASH activities
Regional level trans-sectoral expenditures are those expenses that are expended to facilitate regional level
inter sect oral WASH activities like coordination, monitoring and joint intervention activities.
It also specifies the total amount to be allocated to the woredas and towns/cities. Recommendation for
allocation among woredas and town/cities are made by the Regional WASH Steering Committee:
• On the basis of need/priority established in approved town/woreda Annual WASH Plans
• Within the framework of the Regional Strategic WASH Plan
In allocation of regional WASH funds to the woredas, the RWSC shall try to follow the policy of 30% for
hygiene and sanitation and 70% for water, but the actual annual budget at woreda level will be defined
based on needs identified during the annual planning process.
Woreda
The WWT’s Annual WASH Plan and Budget specify the amount of funds to be budgeted at woreda level
for:
• Expenditure on intersectoral WASH activities
- The total amount to be allocated for WASH services investment with disaggregation for
water, sanitation and hygiene
- The community water supply investment divided into CMP and WMP components
Towns
The City Council’s Annual WASH Plan and Budget specifies the amount of funds to be budgeted for:
• Inter-sectoral WASH activities
• The total amount to be allocated for water supply investment
13.6.6 Budgeting
Budget Preparation
Draft- One WASH Program Document Phase II Updating- May 2010
NATIONAL WASH COORDINATION OFFICE 132
Budgeting takes place based on forms and procedures designed by MoFEC. Sector offices from federal
ministries to woreda offices will be responsible for requesting WASH budget. It is based on a
comprehensive resource mapping of all resources available to WASH at the given level, i.e. federal,
regional, zonal or woreda/town. The basis for annual WASH budgets is approved annual plans, prepared at
each level according to a common planning format provided by the NWCO.
WASH budget preparation will follow the government budget preparation schedule. The budget approval
process for WASH budget will also follow existing government regulations. While the Development
Partners’ component is budgeted at federal level the government contribution will be budgeted at
respective institutional levels of the government.
Budgeting at Federal Level
The budgeting process begins with the announcement of MoFEC of the ceiling for WASH budget. Based on
the ceiling and the approved annual WASH plan the federal ministries of Water and Energy, Ministry of
Education and Ministry of Health will identify the budget requirement for federal management and federal
implemented WASH activities based on the agreed “Consolidated annual WASH plan”. The four sector
ministries submit their annual WASH budget to MoFEC. The NWSC through NWCO will coordinate the
budget preparation process of the four sector ministries. The NWCO budget will be allocated through the
MoWIE.
Regional Level
The NWSC through the NWCO will inform regions the WASH targets for the fiscal year. MoFEC will provide
the Regions with indicative CWA budget ceilings. RWCO will prepare regional annual WASH plan based on
the regional targets, woreda and town WASH plans and regional sector bureaus plans. This will be the
basis for the budgeting process. They will consolidate the regional plan based on aggregated woreda and
town plans including regional WASH activities. The regional sector bureaus then will prepare their annual
budget request and submit to BoFED. BoFEC will review the budget request based on available resources
from CWA and block grants and propose annual budget for the sector bureaus and it will be approved by
regional council. The RWCO budget will be allocated through the Regional Water Resource Bureau.
Woreda Level
The WWT will prepare annual WASH plan which will eventually be approved by the Woreda Council. The
basis for annual WASH plans is the woreda WASH targets from the region. The woreda sector offices will
prepare their WASH annual budget based on the budget ceilings provided by WoFEC. The sector office
budgets will be submitted to WoFEC. The WWT will coordinate the budget preparation process. The
Woreda WASH budget will be approved by Woreda Council.
Town Level
In towns there are two major WASH structures; Water Utilities and WASH Technical Team. Their
activities are coordinated by the City council. The budgeting process follows the same pattern. The town
water board (responsible for the water utility) will prepare annual capital budget for water supply
improvement and will be submitted to town finance and economic development office. The health and
education office will also submit their annual budget to town finance and economic development office.
The town finance and economic development office will prepare the aggregate WASH budget and
submit to City council for approval.
Budget Control
MoFEC, the BoFECs and the WoFECs are responsible for recording, maintaining and controlling WASH
budgets at the federal, regional and woreda levels respectively. MoFEC ensures that sufficient trained
personnel are in place to handle the financial management requirements at each level. Provision is made

Draft- One WASH Program Document Phase II Updating- May 2010
NATIONAL WASH COORDINATION OFFICE 133
in the WASH structure for each of the governmental Implementing Agencies to have their own accounting
staff to administer WASH funds on a full or contractual basis. MoFEC, BoFEC and WoFEC are responsible
for financial reporting; the WASH structures will be primarily responsible for monitoring WASH
implementation and provision of guidance to implementers.
Budget control is exercised to ensure that WASH funds are being spent as planned with respect to
categories, cost, timeliness and value for money. Primary responsibility for budget control in WASH is with
the WASH accountants. However, managers at each level (Woreda Sector Offices, Regional WASH Sector
Offices and the Federal WASH Sector Offices) will review on a monthly basis the financial reports prepared
by their respective budget sections and take whatever action may be required to ensure effective budget
control.
The main tools for budget control will be budget codes, ledger cards, and budget tracking.
13.6.7 Consolidated WASH Account at federal level
The disbursement procedure for Consolidated WASH Account will be as follows:
• Donor’s disbursement will be made biannually. Condition for first disbursement is the approved
Consolidated Annual WASH Plan. For the first disbursement of the fiscal year, Development
Partners will advance at least 50 percent of their expected annual commitment.
• The Development Partners’ initial deposits into the program Foreign Currency Special Accounts
with National Bank of Ethiopia constituted their advances to the Program.
• Contributions will be converted into Birr and transferred to the Consolidated WASH Account
managed by MoFEC.
• MoFEC disburses funds, as advances for the first six months of the Program, into WASH accounts
established for implementing agencies at the federal and regional levels.
• A second payment will be made in December, following submission by MoFEC in October of a
Interim Financial Report setting out details of eligible expenditures in the first quarter, the
balances in the relevant accounts (including unspent funds carried forward from the previous
year), and the work-plan and cash-flow forecast for the second and third quarters. The condition
for disbursement is utilization of at least 50% of the first transfer.
• MoFEC continues, on the same basis, to make biannual replenishment requests to the
Development Partners six weeks in advance of scheduled expenditures.
• Upon receipt of replenishment from the Development Partners, MoFEC immediately transfers
funds to the Implementing Agencies.
MoFEC’s requests are supported by Interim Financial Reports for the previous quarter.
Fund requests should always include financial reporting. The process of reporting is illustrated in the figure
below.
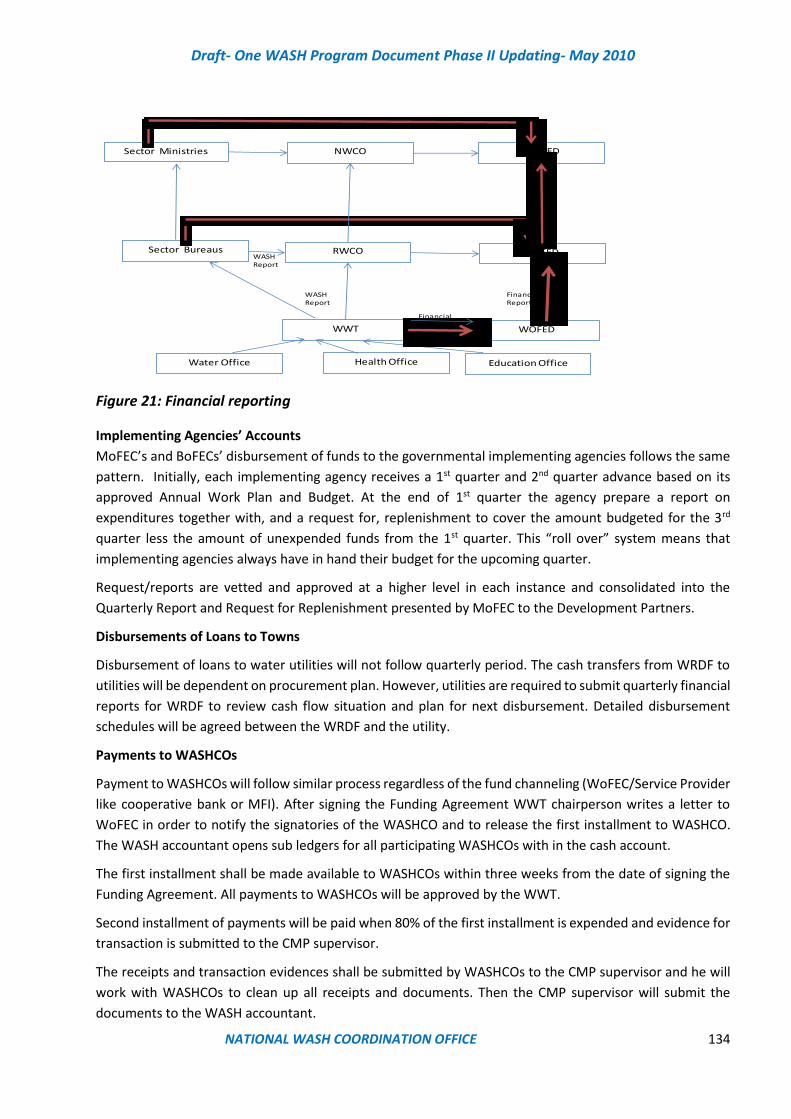
Draft- One WASH Program Document Phase II Updating- May 2010
NATIONAL WASH COORDINATION OFFICE 134
WWT
Education OfficeWater Office Health Office
WOFED
FinancialReport
BOFED
FinancialReport
RWCO
WASHReport
Sector BureausWASHReport
NWCOSector Ministries MOFED
Figure 21: Financial reporting
Implementing Agencies’ Accounts
MoFEC’s and BoFECs’ disbursement of funds to the governmental implementing agencies follows the same
pattern. Initially, each implementing agency receives a 1st quarter and 2nd quarter advance based on its
approved Annual Work Plan and Budget. At the end of 1st quarter the agency prepare a report on
expenditures together with, and a request for, replenishment to cover the amount budgeted for the 3rd
quarter less the amount of unexpended funds from the 1st quarter. This “roll over” system means that
implementing agencies always have in hand their budget for the upcoming quarter.
Request/reports are vetted and approved at a higher level in each instance and consolidated into the
Quarterly Report and Request for Replenishment presented by MoFEC to the Development Partners.
Disbursements of Loans to Towns
Disbursement of loans to water utilities will not follow quarterly period. The cash transfers from WRDF to
utilities will be dependent on procurement plan. However, utilities are required to submit quarterly financial
reports for WRDF to review cash flow situation and plan for next disbursement. Detailed disbursement
schedules will be agreed between the WRDF and the utility.
Payments to WASHCOs
Payment to WASHCOs will follow similar process regardless of the fund channeling (WoFEC/Service Provider
like cooperative bank or MFI). After signing the Funding Agreement WWT chairperson writes a letter to
WoFEC in order to notify the signatories of the WASHCO and to release the first installment to WASHCO.
The WASH accountant opens sub ledgers for all participating WASHCOs with in the cash account.
The first installment shall be made available to WASHCOs within three weeks from the date of signing the
Funding Agreement. All payments to WASHCOs will be approved by the WWT.
Second installment of payments will be paid when 80% of the first installment is expended and evidence for
transaction is submitted to the CMP supervisor.
The receipts and transaction evidences shall be submitted by WASHCOs to the CMP supervisor and he will
work with WASHCOs to clean up all receipts and documents. Then the CMP supervisor will submit the
documents to the WASH accountant.
Draft- One WASH Program Document Phase II Updating- May 2010
NATIONAL WASH COORDINATION OFFICE 135
If the WASH accountant does not approve the documents then he will give it back to the CMP supervisor
for his follow up and correction.
13.6.8 Bank Accounts
Bank Accounts
Program bank accounts and the process flow and the purpose of the accounts, are described below:
• MoFEC opens foreign currency special accounts at the National Bank of Ethiopia (NBE) for each
financing partners. In addition, it opens Birr accounts into which funds from the donors’ special
accounts will be converted and deposited. The Birr accounts serves as a consolidated fund for all
donors, MoFEC will be responsible for the day-to-day management of the special accounts and the
pooled Birr account.
• A Bank Account, which will be operated by two official signatories, will be opened in the name of
OWNP at each implementing ministries and WRDF.
• MoFEC at the federal level will transfer funds to the Federal implementing ministries including WRDF
and BoFEC bank accounts
• The regional BoFEC will open bank accounts for each of the Bureaus of Sectoral Offices to be
operated by joint signatures of BoFEC officials
• BoFEC also open account and disburse the funds to the towns, and Woreda Finance Office bank
account, based on approved WASH plan.
• Each woreda will open Woreda Bank Account, which will be operated by joint signatures of WoFEC
officials
• Woredas choosing to implement CMP modality will open a “community water investment account”
to be operated by joint signatories of Woreda officials
• Each town will open Town Bank Account, operated by joint signatories of the town.
• Each town water utility open special bank account, which will be operated by joint signatories of the
utility.
Accounts to be opened at regional and woreda levels are solely dedicated for WASH funding and operations.
13.6.9 Financial Reporting
The objectives of financial reporting by the public finance management entities (from federal to woreda
level) are to provide information about the program that is useful to participants for accountability purposes
and for decision-making purposes.
Financial reports will be prepared and submitted quarterly. Financial reports will be prepared by WoFEC,
BoFEC and MoFEC respectively. WoFEC reports to BoFEC and BoFEC reports to MoFEC. MoFEC compiles and
reports to Development Partners.
The financial reporting at each level shall facilitate the distinction of budget utilization to the sources of the
fund. For this purpose financial plans will be prepared at each level indicating the source of finances. The
financing plan then will be the basis for financial reporting and budget control.
The financial reports will be in line with the financial management system of the GOE and will be
complemented by source and use of funds.
The quarterly financial reporting will include the following: trial balance, revenue reports, expense report,
receivable report, payable report, monthly bank reconciliation statement
Draft- One WASH Program Document Phase II Updating- May 2010
NATIONAL WASH COORDINATION OFFICE 136
Additional statements to satisfy the One WASH Program are financial reporting requirements:
Statement of Special Accounts
This is a statement showing summary of the movements of each of the financers’ special USD bank accounts.
13.6.10 Fixed Assets
All assets purchased for the Program shall be expensed upon purchase. This is important because, the
program is run using pooled funds that will need report of all expenditures as and when incurred.
Fixed assets register would be maintained as per the FGE manual with all the necessary details to know
about the location and user of the assets.
An identification number should be given to each of fixed assets, as per the government policy, with
indicators showing the assets belong to the One WASH Program.
13.6.11 Preservation of Financial Documents
According to Financial Documents Preservation Guideline No 5/1999 of MoFEC, financial documents shall
be preserved for ten years from the date they were created or up to two years after the audit by the Auditor
General is completed, whichever comes last. For further detail please refer the guideline.
Documents refer to all the ledger cards, registers and supporting documents. Program documents shall be
kept separately and shall be filed in a way that makes referring to the documents very easy. The filing system
should enable auditors and anyone who is authorized to review Program documents to easily and
systematically trace the required documents and information.
13.6.12 Internal Controls
To satisfy the effectiveness and efficiency of the Program’s financial management system to the
Government and Development Partners, it is essential to develop or strengthen adequate internal control
systems at each and every level. Internal control should be used to support the Program in achieving its
objectives by managing its risks, while complying with rules, regulations, and policies of the Program. The
Program should therefore make internal control part of program management and integrate both in its
overall governance system.
The Program should determine the various roles and responsibilities of different units and personnel with
respect to internal control.
The Program should particularly introduce control mechanisms including requirement for approvals,
authorizations, verifications, reconciliations and segregation of duties. Program management should foster
an organizational culture that motivates members of the program to act in line with risk management
strategy and policies on internal control set by the Government of Ethiopia to achieve the program’s
objectives.
The management and key personnel of the Program should be sufficiently competent to fulfill the internal
control responsibilities associated with their roles.
Controls should always be designed, implemented and applied in a response to specific risks like
procurement and disbursement. Internal control principles of the Program should be fully understood and
correctly applied by all relevant parties.
Safeguards at WASHCO level

Draft- One WASH Program Document Phase II Updating- May 2010
NATIONAL WASH COORDINATION OFFICE 137
• The community signs a funding agreement which specifies the obligations of the community.
• For the payment to be released from the bank/MFI, two signatories from WWT shall authorize
based on recommendations of the CMP supervisor on the progress of the work
• The artisan and the WASHCO shall prepare and sign jointly progress reports for payment release
to be effected and their report shall be verified by woreda water office staff
• The WASHCO shall submit expenditure documents for 80% of advance or previous payment for
another request to be effected.
13.6.13 Auditing
According to the Ethiopian Constitution, the Office of Federal Auditor General (OFAG) is responsible for
carrying out the audit of all the financial transactions of the federal government and subsidies to the regions.
The whole program finance will be audited by OFAG or competent auditing firm assigned by the OFAG.
Internal audits will be carried out in line with the internal audit guidelines of the GOE. The results of internal
audits will be made available to external auditors. The implementing agencies are responsible for follow up
of audit recommendations.
External audit will be carried out at the end of the fiscal year. MOFEC and Development partners will agree
on the TOR and schedule of the audit. MoFEC will facilitate the audit and that the report is provided to the
Development Partners. The audit will be conducted by an independent certified auditor. The audit report
will include an audit of all program bank accounts, and will specifically identify and audit the pooled fund
eligible expenditures.
Development Partners may request a performance related audit to be carried out by an external auditor.
The Partners will provide adequate resources for such a purpose. The selection of the auditors and timing
for such audit will be done in close collaboration between MoFEC and the Development Partners. The
development partners and GOE will jointly agree on the TOR. Based on the outcome of such audit, the
Development Partners may convey to GOE any corrective measures they consider necessary to be
undertaken.
A periodic joint spot check will be carried out maximum twice a year. The spot checks will be carried out by
independent body as agreed between the signatories. The spot checks will focus on high risk areas as
identified by Fiduciary Risk Assessment. The independent body conducting the spot check will report to the
implementing agency and after agreed on the outcome; will submit official report to MoFEC. MoFEC will
notify development partners about the results of the spot check and its full report as required.
An independent evaluation of the performance of the Program will be carried out based on the advice of
the MoFEC at periodic intervals. The evaluation reports will be submitted to the Government of Ethiopia
and to the Financing partners for review and comments.
Independent evaluation of the Program will include; an assessment of the adequacy of accounting and
internal control systems to monitor expenditures and other financial transactions and ensure safe custody
of project-financed assets; determining as to whether the program implementing entities have maintained
adequate documentation of all relevant transactions and verification that the annual financial statements
reflect the actual financial situation of the Program.
For this, the auditor should obtain a sufficient understanding of the internal control structure of the
institution as it relates to the One WASH Program, evaluating control risks and identifying reportable
conditions, including material weaknesses in the internal control structure. Deficiencies and weaknesses
Draft- One WASH Program Document Phase II Updating- May 2010
NATIONAL WASH COORDINATION OFFICE 138
that do not affect the financial statements may be discussed in a Management Letter, which should report
weaknesses in the internal control system, the deficiencies observed, and other findings.
Audit reports must include a summary of the main audit procedures used for planning the audit, evaluating
the internal control structure, checking of the figures included in the financial statements and other reports
subject to audit, and the evaluation of the compliance with terms of the applicable agreements, laws and
regulations.
Annual external financial audits will be planned and coordinated by the Program Steering Committee and
managed by the NWCO. The auditor will present their report and management letter to the Steering
Committee, who will be responsible for taking follow-up actions.
13.6.14 Taxation
National Wash Steering Committee should identify WASH investment areas where tax and custom privileges
to the program can bring reduction of costs and can enhance effectiveness of the Program. The priority
WASH investment areas for tax and custom privileges should be submitted for the approval of the
Government of Ethiopia as soon as possible in order to gain the advantages for the program.
13.6.15 Per diems
Effective program implementation can only be assured if implementing agencies can regularly conduct
supervision of works, monitoring of community activities and periodic consultation at all level. In order to
achieve these motivated and competent staff at all level should be maintained. One main reason for lack of
motivation is the occurrence of different per diem rates within the same program. Therefore, the National
WASH Steering Committee should establish uniform per diem rates across the program and get approval
from appropriate authorities.
Draft- One WASH Program Document Phase II Updating- May 2010
NATIONAL WASH COORDINATION OFFICE 139
14. Procurement and Contract Management
14.1 Introduction
During regional consultations it was disclosed that procurement and contract management was identified
as major constraint in implementing WASH activities. The Program will make use of the public procurement
system and procedures and established procedures for contract management. Ministries, regional bureaus
and woreda offices will use standard bidding and contract documents that comply with government rules
and regulations81 for procurement of works, goods and services.
Given the existing capacity constraints at all levels, efficient procurement and contract management is a
challenge that can adversely affect implementation of the Program. Therefore, continuous capacity building
support with well-designed and focused procurement and contract management training will be provided
as TA to relevant staff at federal, regional, city, town and woreda level to help ensure the smooth
implementation of Program activities.
Procurement manuals have been prepared by the Ethiopian government, the World Bank and African
Development Bank, and attempts have been made to coordinate and align to these guidelines, which are
commonly used for procurement and contract administration in the WASH sector. However, capacity
limitations in the application and use of these procedures are often a major cause of delays in
implementation of projects in the WASH sector.
From experience, procurement on a piece by piece modality have caused delays in accomplishing planned
activities. This modality will have to change to bulk purchasing of important items such as electromechanical
equipment, pumps and store at federal level to be issued on request from projects and continue to replenish
the items. This will require government commitment to avail foreign exchange money on demand and the
establishment of a central procurement facility with adequate and qualified personnel.
Packaged contracting has already been tried within the WASH sector in Ethiopia with variable results –
depending on the capacity of the client or procuring agency to put together attractive packages for the
private sector and then to effectively manage the contract throughout its implementation. The packaging
of the different contracts into one has a number of advantages. The first is to have a joint plan of the project,
including all aspects of the project execution, drilling, construction, supply order and installation of
electromechanical parts, as well as capacity building, so a high level of project organization is achieved.”
With a better integration of planning, the different elements of the project should be delivered more timely.
The outcome in the course of OWNP program review and updating process reinforces the immediate need
to quickly increase the focus and investment in procurement contracting and contract risk management
capabilities at all WASH stakeholder level from federal to Woreda . Delay in transfer and reimbursement of
available funding and lack in procurement contracts management process capabilities such as poor
procurement, contracting etc has been related to overly bureaucratic or inadequate procedures and poor
system design. These are, to a greater or lesser extent, holding up programs and achievement of targets.
81FDRE, User’s GuideforSimple Requests for Quotations andLocal Purchase Order. January 2006, and;
FDRE, Procurement services and contract administration – Amharic version. Addis Ababa, July 2002 EC.

Draft- One WASH Program Document Phase II Updating- May 2010
NATIONAL WASH COORDINATION OFFICE 140
14.2 Procurement Methods
The Program will follow the Procurement Proclamation issued by the Federal Government (January
12, 2005) and the subsequent Procurement Directives released by MoFEC. At regional level the procurement
code is enacted by regional governments and the procurement directive adapted to each Region based on
a model prepared by the Federal Government.
According to the Government’s policy to decentralize and devolve responsibility, WASH procurement is
carried out, as far as possible, at the level where the goods are utilized and the services delivered to build
capacity for local procurement.
The procurement plan is an essential component of annual WASH plans. Training and technical assistance
will be available to assist regions, towns, woredas and community planners. Procurement plans are
consolidated by WWTs and regional and federal WASH Coordination Offices. Procurement at all WASH cost
centers will be reported quarterly.
Procurement of works and goods can be combined in a turnkey contract as is being done by the WRDF in
some urban water supply schemes. Where funds are available, longer-term framework contracts for
services and works and can be considered, as can combining procurement of pumps and spare parts in one
tender.
Where the CMP approach is used, licensed service providers at woreda level can be procured for services
or construction work at community level with technical support from kebele and woreda levels as required.
Procurement requires quality assurance (QA). QA for goods can be undertaken in collaboration with the
Ethiopian Standards Authority (ESA). The Ethiopian Water Technology Institute (EWTI) can also contribute
to the development of standards, BOQs and specifications for works, goods and services.
The Program will recognize the following procurement methods:
Table 12: OWNP Procurement Methods
Method Procurement by/through
Government of Ethiopia GoE and CWA
Woreda managed projects GoE and CWA
Community managed projects WASHCOs
NGO projects NGOs
World Bank WASH II
Other partners Respective partners
Self- Supply Households and groups
The methods to be followed for the procurement of works, goods and services will be specified in the annual
procurement plans at federal, regional/city, woreda/town and community levels.
Packaging of services, works and goods is advantageous in terms of cost and time saving, in the same way
procurement of works and goods can be combined in a turnkey contract as is being done by the WRDF in
some urban water supply schemes. Where funds are available, longer-term framework contracts for
services and works can be considered, as can combining procurement of pumps and spare parts in one
tender.
Where the CMP approach is used, service providers at woreda level can be procured for services or
construction work at community level with technical support from kebele and woreda levels as required.

Draft- One WASH Program Document Phase II Updating- May 2010
NATIONAL WASH COORDINATION OFFICE 141
Woredas and towns may also decide to delegate larger procurements to regional bureaus and regional
governments, respectively.
Quality assurance (QA) is an important aspect of procurement. QA for goods can be undertaken in
collaboration with the Ethiopian Standards Authority (ESA). The Ethiopian Water Technology Centre can
also contribute to the QA of WASH goods, products and works.
Procurement guidelines have been prepared by the Ethiopian government, the World Bank and African
Development Bank, and attempts have been made to coordinate and align these guidelines, which are
commonly used for procurement and contact administration in the WASH sector. Ministry, region, city and
woreda procurement staff are familiar with the content of these guidelines, however capacity limitations in
the application and use of these procedures have often been a major cause of delays in implementation of
projects in the WASH sector. Furthermore, the approving committee at the federal level are another
bottleneck. The committee now formed may not have the time to commit to decide and the necessary
consultation with local companies on the products and systems.
Consider taking the following steps will improve procurement processes:
1. Carry out an unbiased and comprehensive assessment of the current procurement contracts
Management processes and related capabilities (e.g. Strengthening Federal Level procurement staffs,
at region and Woreda level, review of procurement process, Local contractor and Consultant capacity
etc.), and then evaluate gaps between the current state and an agreed-upon desired level of capability
and performance.
2. Identify immediate short-term actions to address urgent control improvement needs and put the
necessary resources behind those short-term actions.
3. Make clear overall strategic and operational objectives and performance expectations for the
government procurement contracts management process at all level of program implementation
approach, CWA, NGOs, CMP etc . Without such a vision and objectives, it is unlikely that the desired
level of performance, control and capability will be achieved.
4. Design, develop and implement strategies and detailed procurement plan, integrated action plans to
achieve the desired levels of performance and process maturity, actions that address each and all of
contracts management capability, and cover the immediate, middle and longer term horizons
(typically current to three years GTPII period).
5. Higher decision-maker management support for the execution of the short-term as well as mid to
longer-term improvement plans through facilitation of tax breaks for import of critical WASH plant
and equipment, where these are not manufactured in Ethiopia to the required specifications. Such
equipment includes water drilling machines, pumps, generators, vacuum trucks, laboratory
equipment, etc.
6. Make appropriate mid to longer-term investments in procurement contracts management process
capabilities
14.3 Program Procurement Requirements
The Program will require the following types of procurement:
Services
1. Service providers, including artisans, at woreda level providing the following services:
• Planning and design of water supply schemes
Draft- One WASH Program Document Phase II Updating- May 2010
NATIONAL WASH COORDINATION OFFICE 142
• Sitting and surveying
• Post-construction support to communities
• Community mobilization and training of WASHCOs
• Training water supply caretakers and mechanics
• Financial services
2. Consultants or firms at regional or national level to:
• Build capacity of woreda WASH teams, prepare annual, strategic and procurement plans
• Conducting hydrogeological investigations including borehole siting and drilling supervision
• Carry out study and design for water supply schemes
• Conduct studies for rehabilitation and expansion of water supply schemes
• Supervise construction, rehabilitation and expansion of water supply schemes
Works
1. Service providers constructing:
• New hand dug wells and installation of pumps
• New spring capping
• Rehabilitation of existing point sources
• Construction/rehabilitation of institutional sanitation facilities
2. Drilling contractors at regional or national level for:
• Drilling shallow boreholes and installation of hand pumps
• Drilling deep boreholes, pump installation and construction of distribution system
3. Contractors at regional level or artisans at woreda level for:
• Rural piped gravity schemes from spring sources
• Rural piped schemes from spring sources with motorized pumping
• Rehabilitation and expansion of water supply schemes
• Construction/rehabilitation of institutional and public sanitation facilities
• Rural piped schemes supplied from deep boreholes (excluding drilling)
Goods
• Service providers, including artisans, at woreda level supplying: Hand pumps and spare parts,
Construction materials, Sanitation materials
• Region-based suppliers supplying: Tools for HDW contractors, Office supplies, Hand pumps and
spare parts, Submersible pumps with accessories and spare parts, Generators with accessories,
Pipes and fittings, Sanitation materials, Desludging equipment, Sewerage works (only in Addis
Ababa)
Procurement of design and construction supervision works by service providers licensed at woreda level will
be done at woreda level by the Woreda Finance Office in collaboration with the Woreda Water, Health and
Education offices as required. Design and supervision of up to 4-5 water supply schemes or construction of
latrines in a group of institutions in one kebele can be packaged and offered as one contract in order to take
advantage of economies of scale.
Draft- One WASH Program Document Phase II Updating- May 2010
NATIONAL WASH COORDINATION OFFICE 143
Turnkey contracts combining civil works and supply of electromechanical equipment in urban water supply
schemes have been executed under the WRDF. Turnkey contracts combining design and construction can
also be considered, as well as other contracting modalities such as framework contracts and outsourcing.
14.4 Program Interventions
The adequacy of procurement and contract management capacity for the implementation of the Program
at all relevant levels will be assessed using a standardized questionnaire early in Phase I of the Program. The
Program will support the provision of qualified needs-based training to relevant staff on public procurement
and contact management as a practical training using actual cases.
Due to its critical importance for the timely completion of Program activities, procurement and contract
management will be the subject of periodic reviews by independent evaluators. Follow-up compliance with
recommendations from these reviews will be important for ensuring Program effectiveness.
As small contractors are expected to bid for contracts up to a threshold of USD 100,000, the Program will
support the training of small contractors at regional and city in collaboration with contractors’ associations
to improve their ability to successfully bid for these contracts. Contractors and consultants are also expected
to perform ethically in accordance with a mutually agreed code of conduct.

Draft- One WASH Program Document Phase II Updating- May 2010
NATIONAL WASH COORDINATION OFFICE 144
15. OWNP Phase 2 Completion Program Costs and Budget
15.1 Introduction
The Program planning process includes two converging and complementing processes (scenarios); (i)
projections based on updated models used in preparing the UAP & SAP, and (ii) a process based on
information received from the regions and cities. The two processes will be compared following an iterative
process. The two scenarios have reasonably converged as can be seen from the two sections (billion USD
versus billion USD)82. It could therefore be concluded that the adjusted regional plan i.e. scenario II is
verified. It is foreseen that regions could make use of the scenarios in accordance to their specific situations
and preferences.
15.2 Program Planning Process
The planning process is iterative, being done in several steps. The present situation has to be assessed;
service levels and problems have to be identified. Then, targets are set to address the problems or increase
service levels to reach the intended targets.
By comparing the present situation with the targets, it is possible to identify important issues and possible
solutions. These possible solutions are quantified, using planning models as briefly illustrated in sections
below. Issues were identified, following which solutions and the quantification of the identified solutions
were worked out.
The model output is a Program that will serve as a national multi sectoral SWAp for WASH activities.
Additional outputs of the model are "consequences" of the plan, such as financial needs and sectoral and
institutional requirements. Based on results of monitoring and periodic reviews, updates and adjustments
will be made to the planning parameters.
For the conceptual framework for program planning, see Annex 10, Figure A10-1.
15.2Program Planning Process
15.2.1 Introduction
The programme planning process for Phase 2 is in many ways similar to the process used for Phase 1. The
term “planning process” is used again since a definitive “plan” cannot be made without further iterative
steps, as explained in the Sub-section 16.3below.
Constraints include:
➢ Meet GTP2 targets by 2020, that is, within less than 3 years
➢ Incorporate 40% of the proposed R&S WASH Programme (Resilient and Sustainable Water Supply,
Sanitation and Hygiene programme in Arid and Semi-Arid Drought Prone Areas of Ethiopia), that is,
USD 2 billion out of the estimated 5 billion budgeted for this programme
➢ Limited WASH capacity for implementation (planning, design, procurement, implementation)
82In this document scenario I is shown in this chapter i.e. Chapter 15 while scenario II is enclosed in Annex 11. Scenario II is slightly higher since schemes lean towards high technology. Physical and Financial Comparisons of the two scenarios are shown in Annex 11 Table A11.14 and Figure A11.8.

Draft- One WASH Program Document Phase II Updating- May 2010
NATIONAL WASH COORDINATION OFFICE 145
➢ Low operational capability leading to high level of system failures
➢ Limited awareness, at all levels, of sanitation and hygiene impacts and needs, impacting health,
quality of life and economic activity
In November 2017, regional sector offices (water, health and education) were invited to make 3-year plans
to meet GTP2 targets. These plans have been tabulated and compared with both the original OWNP
document 2013 and available data from CWA, DP and CSO sources.
15.2.2 Planning Parameters
Urban water supply
• Generates resource requirements based on town categories
• A design period of 7 years
• Per capita costs generated from prevailing rates for various town categories
• Complementary use of existing systems is considered for determining resource requirements
• Regional factors are used for labour availability, infrastructure and costs. The highest factors
are assigned to Afar and Somali regions.
(3) Urban sanitation
• Generates resource requirements based on town categories
• Resources for desludging, facilities are determined using the model
• Public toilet requirements for 350 towns are determined based on acceptable assumptions
• Current rates are adjusted by 2.5% per annum for determining rates
• Regional factors are used to take labor availability, infrastructure and related matters into
consideration (The highest factors are for Afar and Somali regions.)
(4) Rural and peri urban sanitation83
• The model calculates resource requirements in three areas i.e. creation of enabling environment,
creation of demand, facilitation of supply from kebele to federal level
• Prevailing rates escalated at 2.5% per annum are used for determining rates
• Regional factors are used to take labor availability, infrastructure and related matters into
consideration. The highest factors are assigned to Afar and Somali regions.
15.2.3 Planning Criteria
The planning criteria used for Phase II are as follows:
• Rural water supply: 25 liters per capita per day within 1km radius
• Urban water supply: 40-100 liters per capita per day within 0.5 km radius depending on the class
of the towns
• Rural and peri-urban sanitation: reduce open defecation by constructing both traditional and
improved latrines using the CLTSH approach.
• Urban sanitation: Sewerage will be considered in Addis Ababa, while desludging facilities and
provision of public toilets will be considered for other towns.
The assumptions used in preparing the physical and financing plan are presented in Annex 10.
83Based on the model used for the SAP (2012)

Draft- One WASH Program Document Phase II Updating- May 2010
NATIONAL WASH COORDINATION OFFICE 146
15.2.4 Price Inflation
In mid-2018, the official inflation rate in Ethiopia is around 15%. It is assumed this figure will decrease to
around -% by 2015. The estimated foreign portion of the Program budget is % and the local component is
%. Domestic inflation is estimated to be about %. The foreign inflation rate is estimated to be around %
annually assuming a prevailing foreign inflation rate of %. The local and foreign inflation rate together is %.
Since the USD has been used in the current Program, the inflation rate can be lowered to % to compensate
for depreciation of the ETB.
15.3 Access
15.3.1 Rural and Urban Water Supply
According to the GTP II targets, water supply access is expected to each to 98.5 % of the population. In
order to determine water and sanitation access in Phase II the first step taken was to project the rural and
urban population from the base year 2017 to 2020. Therefore the total population to be considered for
water supply in rural Ethiopia is 79,473,756 and in urban areas (see details in annex 1
Table12: Rural and Urban Water Supply Access by Region and Year (%)
No. Region/City Base Year Phase II Phase III
2017 2018 2019 2020 2021 2022 2023 2024 2025
1 Tigray
100
Rural 66.6 69 77 85 86 90 94 98 100
Urban 56.6 59 68 75 78 84 90 96 100
Total 64.8 68 76 83 85 89 93 97 100
2 Gambella
Rural 73.6 75 80 85 86 90 94 98 100
Urban 40.3 46 61 75 78 84 90 96 100
Total 64.2 67 75 83 85 89 93 97 100
3 B. Gumuz
Rural 60 63 75 85 86 90 94 98 100
Urban 50 54 65 75 78 84 90 96 100
Total 55.2 59 72 83 85 89 93 97 100
4 Dire Dawa
Rural 81 81 83 85 86 90 94 98 100
Urban 55 58 67 75 78 84 90 96 100
Total 61.1 64 74 83 85 89 93 97 100
5 Harari
Rural 65 68 77 85 86 90 94 98 100
Urban 66 67 71 75 78 84 90 96 100
Total 65.5 68 76 83 85 89 93 97 100
6 Somali
Rural 66.7 69 77 85 86 90 94 98 100
Urban 64.5 66 71 75 78 84 90 96 100
Total 65.3 68 76 83 85 89 93 97 100
7 Amhara
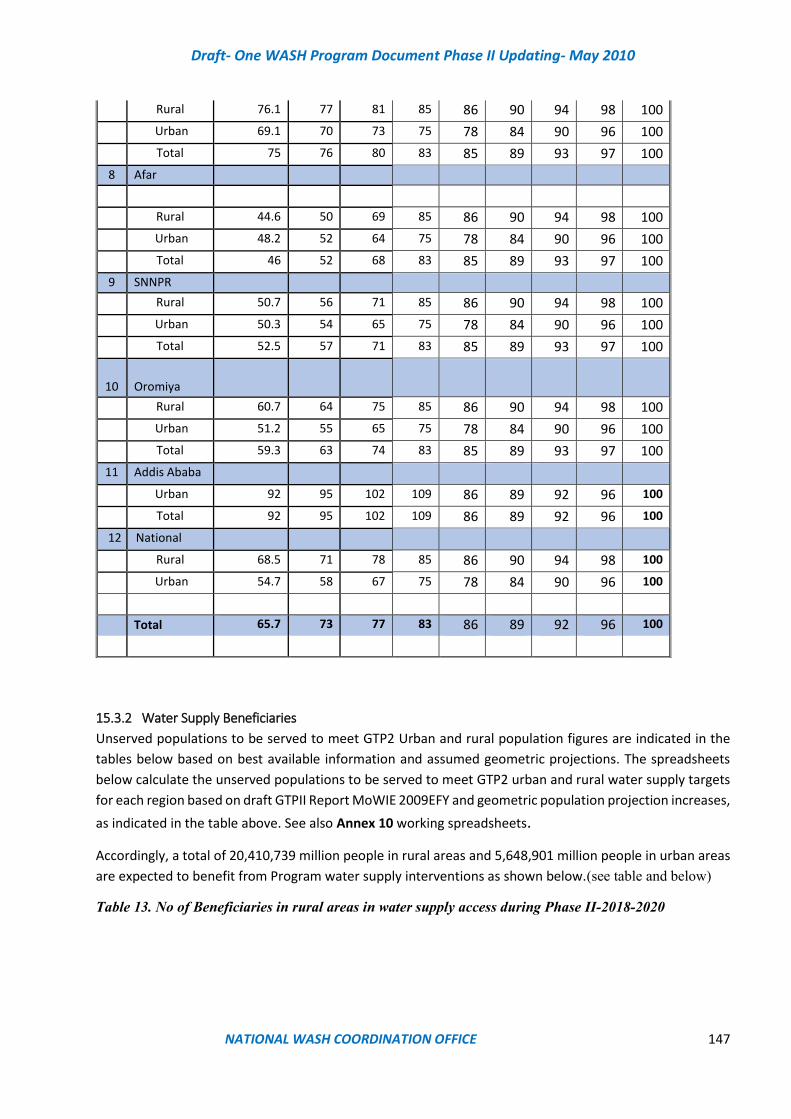
Draft- One WASH Program Document Phase II Updating- May 2010
NATIONAL WASH COORDINATION OFFICE 147
15.3.2 Water Supply Beneficiaries
Unserved populations to be served to meet GTP2 Urban and rural population figures are indicated in the
tables below based on best available information and assumed geometric projections. The spreadsheets
below calculate the unserved populations to be served to meet GTP2 urban and rural water supply targets
for each region based on draft GTPII Report MoWIE 2009EFY and geometric population projection increases,
as indicated in the table above. See also Annex 10 working spreadsheets.
Accordingly, a total of 20,410,739 million people in rural areas and 5,648,901 million people in urban areas
are expected to benefit from Program water supply interventions as shown below.(see table and below)
Table 13. No of Beneficiaries in rural areas in water supply access during Phase II-2018-2020
Rural 76.1 77 81 85 86 90 94 98 100
Urban 69.1 70 73 75 78 84 90 96 100
Total 75 76 80 83 85 89 93 97 100
8 Afar
Rural 44.6 50 69 85 86 90 94 98 100
Urban 48.2 52 64 75 78 84 90 96 100
Total 46 52 68 83 85 89 93 97 100
9 SNNPR
Rural 50.7 56 71 85 86 90 94 98 100
Urban 50.3 54 65 75 78 84 90 96 100
Total 52.5 57 71 83 85 89 93 97 100
10
Oromiya
Rural 60.7 64 75 85 86 90 94 98 100
Urban 51.2 55 65 75 78 84 90 96 100
Total 59.3 63 74 83 85 89 93 97 100
11 Addis Ababa
Urban 92 95 102 109 86 89 92 96 100
Total 92 95 102 109 86 89 92 96 100
12 National
Rural 68.5 71 78 85 86 90 94 98 100
Urban 54.7 58 67 75 78 84 90 96 100
Total 65.7 73 77 83 86 89 92 96 100

Draft- One WASH Program Document Phase II Updating- May 2010
NATIONAL WASH COORDINATION OFFICE 148
Table 14. No of beneficiaries in urban areas to benefit in water supply access during Phase II -2018-
2020
15.3.3 Rural water supply analysis methodology
Each region has given an estimate of total “unserved population to be planned for the remaining 3 Years”
in the region, for each of rural and urban water supply, as well as needs for institutional WASH (health and
education) and for capacity building. However, in the majority of cases, these populations do not align with
the population figures derived under Sub-section 15.2above: The unserved 2020 populations have been re-
calculated in the spreadsheets described under Sub-section 15.2 based on MoWIE estimates of GTP2 water
supply coverage. Label the re-estimated total regional rural water unserved population as PR.
Various data sources are used to arrive at best estimates of unit rates and populations served for each
technology across the regions. This analysis is presented in Sub-section 15.4 below.
Two spreadsheets (scenarios) are presented in Sub-section 15.5for each region:
Unserved Rural Design population
Region Baseline population
for Phase II in year
2017
Water supply
coverage in
year 2017
Projected
Population
By the year
2020
Served
population
Unserved
Population
GTP2 target
rural %age
Population to
be served by
2020
1 Tigray 3,847,000 66.6% 3,934,359 2,560,563 1,373,796 85% 783,642
2 Afar 1,466,000 44.6% 1,545,951 653,836 892,115 85% 660,222
3 Amhara 17,453,000 76.1% 18,025,467 13,283,478 4,741,989 85% 2,038,169
4 Oromiya 30,113,000 60.7% 32,179,185 18,275,580 13,903,605 85% 9,076,728
5 Benishangul 836,000 60.0% 888,278 501,600 386,678 85% 253,437
6 SNNP 15,992,000 50.7% 16,903,089 8,101,547 8,801,542 85% 6,266,079
7 Gambela 288,000 73.6% 305,292 211,968 93,324 85% 47,530
8 Harar 109,000 65.0% 117,053 70,850 46,203 85% 28,645
9 Somali 4,911,000 66.7% 5,308,238 3,275,637 2,032,601 85% 1,236,365
10 Diredawa(35l/c/d) 173,000 81.0% 188,298 140,130 48,168 85% 19,923
National 68.5% 79,395,210 47,075,189 32,320,020 20,410,739
Note
Source: WS Coverage Prepared from data from Fig 8, draft GTP II Report, MoWIE, 2009EFY
Unserved Urban Design population
Region
GTP2
target
urban
%age
Unserved
population
to be
served by
2020
Population Served Unserved
1 Tigray 1,400,000 56.6% 1,633,334 792,680 840,654 75% 432,321
2 Afar 346,000 48.2% 414,248 166,772 247,476 75% 143,914
3 Amhara 3,682,000 69.1% 4,335,515 2,543,157 1,792,357 75% 708,479
4 Oromiya 5,354,000 51.2% 6,168,587 2,743,390 3,425,198 75% 1,883,051
5 Benishangul 230,000 50.0% 279,896 115,000 164,896 75% 94,922
6 SNNP 3,178,000 50.3% 3,730,962 1,598,534 2,132,428 75% 1,199,688
7 Gambela 148,000 40.3% 176,690 59,644 117,046 75% 72,874
8 Harar 137,000 66.0% 150,152 90,420 59,732 75% 22,194
9 Somali 838,000 64.5% 920,373 540,510 379,863 75% 149,770
10 Diredawa(35l/c/d) 293,000 55.0% 318,749 161,150 157,599 75% 77,912
11 Addis Ababa (35l/c/d) 3,434,000 92.0% 3,690,878 3,159,280 531,598 109% 863,777
National 19,040,000 54.7% 21,819,386 11,970,537 9,848,849 5,648,901
Baseline
population
for Phase II
in year 2017
Water supply
coverage in
year 2017
Unserved Proj. Population By the By the
year 2020

Draft- One WASH Program Document Phase II Updating- May 2010
NATIONAL WASH COORDINATION OFFICE 149
The first scenario worksheet tool re-calculates the cost and population for the number of schemes nT
proposed by the region, using the unit rates calculated in Sub-section 15.4. The population served may be
expressed as ∑ (pT x nT), where pT is average population served by each technology type. This may be greater
or less than PR.
The second scenario worksheet tool then adjusts the number of schemes and the technology mix until the
population served equals the GTP2 unserved population. PR. This may be expressed as ∑ (pT x nT) = PR. In this
scenario the opportunity is taken to vary the technology mix to move towards: (i) meeting proposals under
R&S WASH Programme, that is deep boreholes and multi-village schemes, (ii) use of solar power and (iii)
introduce what is considered to be more reliable technology.
It is recommended that both national government technical experts and the regional water bureaus staff
should be given the opportunity to review the Scenario 2 technology mix and discuss possible amendments
with the NWCO (consultants and Task Force) and the RWCOs, but not so as to hold up adoption of the Phase
2 programme and rapid implementation thereafter.
Important Note: The proposed programme will not be successful unless combined with WASH sector
reform, capacity building and advocacy as described in this OWNP document 2018.
The unit cost rates are conveniently compared with unit rates of 2013 and discussed through chart
representation as shown in Annex 1 and the summery of the unit rates and population served is shown in
Table 32 below
Table 15: Unit rate USD per capita per technology and people served
Technology Type Average
unit rate
Average
Pop. Served
HH dug well with rope pump 133 6
Community dug well with RP 47 19
Dug well with hand pump 25 171
Shallow well with hand pump 66 275
Shallow well with Solar 0 0
Bore hole with distribution 167.9 1560
Bore hole with solar 0 0
Capped spring 25 242
Rain water 40 249
Cistern 140 127
Hafir Dam 13 2225
Single village spring 2-4 WP 62 1452
Single village from spring source + motorised distribution with 2 water
points (small 103.2 1402
Single village from spring source + motorised distribution with 2 water
points (small) + solar 52 3000
Multi village from spring source + gravity distribution with 4-6 water points
(medium) 68.6 33
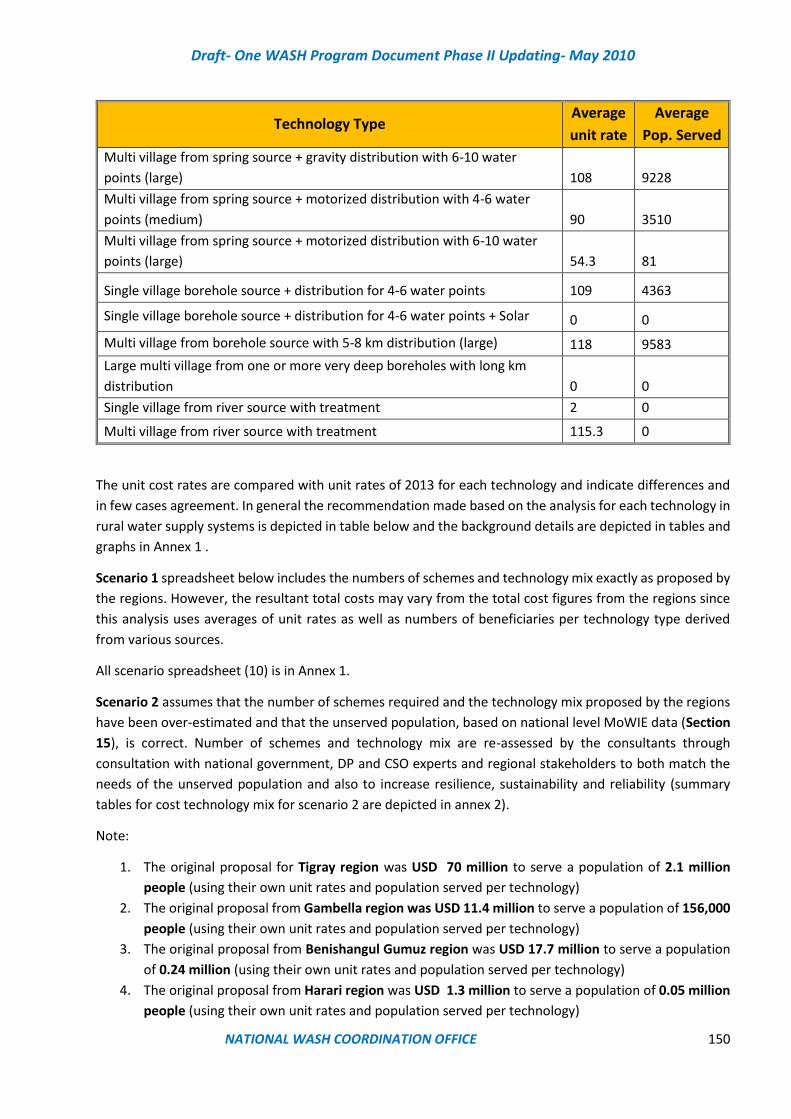
Draft- One WASH Program Document Phase II Updating- May 2010
NATIONAL WASH COORDINATION OFFICE 150
Technology Type Average
unit rate
Average
Pop. Served
Multi village from spring source + gravity distribution with 6-10 water
points (large) 108 9228
Multi village from spring source + motorized distribution with 4-6 water
points (medium) 90 3510
Multi village from spring source + motorized distribution with 6-10 water
points (large) 54.3 81
Single village borehole source + distribution for 4-6 water points 109 4363
Single village borehole source + distribution for 4-6 water points + Solar 0 0
Multi village from borehole source with 5-8 km distribution (large) 118 9583
Large multi village from one or more very deep boreholes with long km
distribution 0 0
Single village from river source with treatment 2 0
Multi village from river source with treatment 115.3 0
The unit cost rates are compared with unit rates of 2013 for each technology and indicate differences and
in few cases agreement. In general the recommendation made based on the analysis for each technology in
rural water supply systems is depicted in table below and the background details are depicted in tables and
graphs in Annex 1 .
Scenario 1 spreadsheet below includes the numbers of schemes and technology mix exactly as proposed by
the regions. However, the resultant total costs may vary from the total cost figures from the regions since
this analysis uses averages of unit rates as well as numbers of beneficiaries per technology type derived
from various sources.
All scenario spreadsheet (10) is in Annex 1.
Scenario 2 assumes that the number of schemes required and the technology mix proposed by the regions
have been over-estimated and that the unserved population, based on national level MoWIE data (Section
15), is correct. Number of schemes and technology mix are re-assessed by the consultants through
consultation with national government, DP and CSO experts and regional stakeholders to both match the
needs of the unserved population and also to increase resilience, sustainability and reliability (summary
tables for cost technology mix for scenario 2 are depicted in annex 2).
Note:
1. The original proposal for Tigray region was USD 70 million to serve a population of 2.1 million
people (using their own unit rates and population served per technology)
2. The original proposal from Gambella region was USD 11.4 million to serve a population of 156,000
people (using their own unit rates and population served per technology)
3. The original proposal from Benishangul Gumuz region was USD 17.7 million to serve a population
of 0.24 million (using their own unit rates and population served per technology)
4. The original proposal from Harari region was USD 1.3 million to serve a population of 0.05 million
people (using their own unit rates and population served per technology)

Draft- One WASH Program Document Phase II Updating- May 2010
NATIONAL WASH COORDINATION OFFICE 151
5. The original proposal from Somali region was USD 335 million to serve a population of 1.09 million
(using their own unit rates and population served per technology)
6. The original proposal from Amhara region was USD 223 million to serve a population of 4.3 million
people (using their own unit rates and population served per technology)
7. The original proposal from Afar region was USD 77 million to serve a population of 0.53 million
(using their own unit rates and population served per technology)
8. The original proposal from SNNPR region was USD 371 million to serve a population of 13.2 million
(using their own unit rates and population served per technology)
9. The original proposal from Oromia region was USD 254million to serve a population of 4.6 million
people (using their own unit rates and population served per technology)
10. The regional proposals from Dire daw administration did not give details of costs and population
to be served.
15.4. Physical and Financial Plan
Rural Water Supply Summary
Additional factors have been applied to the CR-WASH component (that is, using 2030 projected design
population) in order to allow for anticipated population movements triggered by installation of reliable
water supply. Overall rural water supply cost becomes 2,096 USD million, of which 934 USD million is
for CR-WASH Programme (Resilient and Sustainable Water Supply, Sanitation and Hygiene programme
in Arid and Semi-Arid Drought Prone Areas of Ethiopia).
The overall cost is high and will be challenging to implement within the GTP2 timeframe. It will need
other (software factors) to be concurrently put into place (WASH sector reform, capacity building,
advocacy and of course funding).
Table 16: Number of schemes proposed, recalculated and adjusted target population for intervention
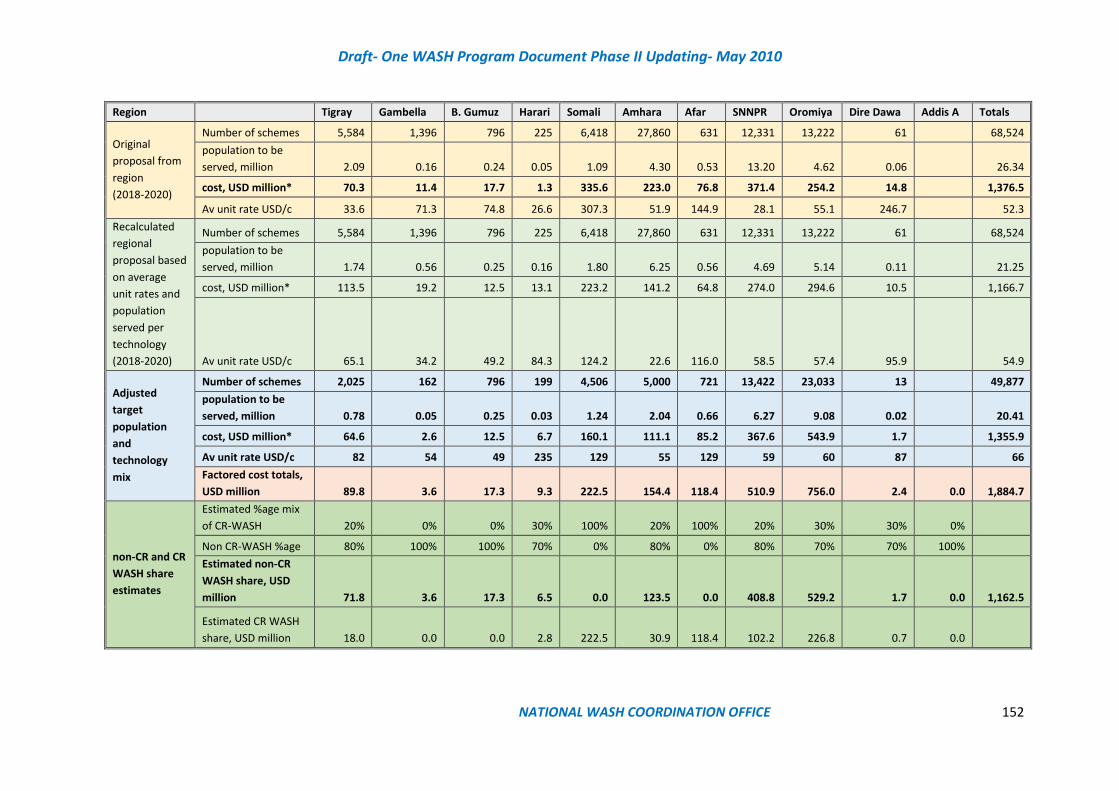
Draft- One WASH Program Document Phase II Updating- May 2010
NATIONAL WASH COORDINATION OFFICE 152
Region Tigray Gambella B. Gumuz Harari Somali Amhara Afar SNNPR Oromiya Dire Dawa Addis A Totals
Original
proposal from
region
(2018-2020)
Number of schemes 5,584 1,396 796 225 6,418 27,860 631 12,331 13,222 61 68,524
population to be
served, million 2.09 0.16 0.24 0.05 1.09 4.30 0.53 13.20 4.62 0.06 26.34
cost, USD million* 70.3 11.4 17.7 1.3 335.6 223.0 76.8 371.4 254.2 14.8 1,376.5
Av unit rate USD/c 33.6 71.3 74.8 26.6 307.3 51.9 144.9 28.1 55.1 246.7 52.3
Recalculated
regional
proposal based
on average
unit rates and
population
served per
technology
(2018-2020)
Number of schemes 5,584 1,396 796 225 6,418 27,860 631 12,331 13,222 61 68,524
population to be
served, million 1.74 0.56 0.25 0.16 1.80 6.25 0.56 4.69 5.14 0.11 21.25
cost, USD million* 113.5 19.2 12.5 13.1 223.2 141.2 64.8 274.0 294.6 10.5 1,166.7
Av unit rate USD/c 65.1 34.2 49.2 84.3 124.2 22.6 116.0 58.5 57.4 95.9 54.9
Adjusted
target
population
and
technology
mix
Number of schemes 2,025 162 796 199 4,506 5,000 721 13,422 23,033 13 49,877
population to be
served, million 0.78 0.05 0.25 0.03 1.24 2.04 0.66 6.27 9.08 0.02 20.41
cost, USD million* 64.6 2.6 12.5 6.7 160.1 111.1 85.2 367.6 543.9 1.7 1,355.9
Av unit rate USD/c 82 54 49 235 129 55 129 59 60 87 66
Factored cost totals,
USD million 89.8 3.6 17.3 9.3 222.5 154.4 118.4 510.9 756.0 2.4 0.0 1,884.7
non-CR and CR
WASH share
estimates
Estimated %age mix
of CR-WASH 20% 0% 0% 30% 100% 20% 100% 20% 30% 30% 0%
Non CR-WASH %age 80% 100% 100% 70% 0% 80% 0% 80% 70% 70% 100%
Estimated non-CR
WASH share, USD
million 71.8 3.6 17.3 6.5 0.0 123.5 0.0 408.8 529.2 1.7 0.0 1,162.5
Estimated CR WASH
share, USD million 18.0 0.0 0.0 2.8 222.5 30.9 118.4 102.2 226.8 0.7 0.0
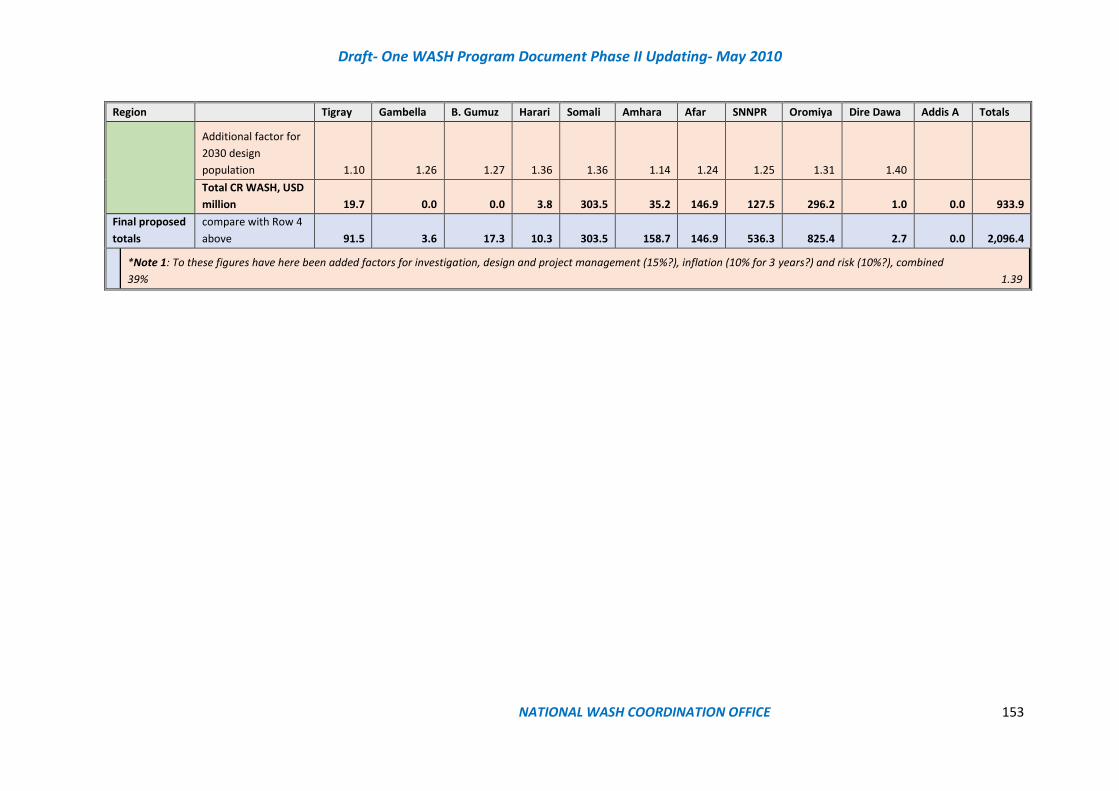
Draft- One WASH Program Document Phase II Updating- May 2010
NATIONAL WASH COORDINATION OFFICE 153
Region Tigray Gambella B. Gumuz Harari Somali Amhara Afar SNNPR Oromiya Dire Dawa Addis A Totals
Additional factor for
2030 design
population 1.10 1.26 1.27 1.36 1.36 1.14 1.24 1.25 1.31 1.40
Total CR WASH, USD
million 19.7 0.0 0.0 3.8 303.5 35.2 146.9 127.5 296.2 1.0 0.0 933.9
Final proposed
totals
compare with Row 4
above 91.5 3.6 17.3 10.3 303.5 158.7 146.9 536.3 825.4 2.7 0.0 2,096.4
*Note 1: To these figures have here been added factors for investigation, design and project management (15%?), inflation (10% for 3 years?) and risk (10%?), combined
39% 1.39
Draft- One WASH Program Document Phase II Updating- May 2010
NATIONAL WASH COORDINATION OFFICE 154
As can be seen from the table above, there is reasonable correlation (in terms of overall cost but not the
detailed make-up) between the regional proposals (Line 4) and the adjusted estimates (Line 14) described in
the sub-sections above, except for Oromiya region which appears to have under-estimated the population
to be served by a factor of 2 and the cost by a factor of 3.
15.5 Scenario -2 Physical Plan and Financial requirement for Rural Water Supply
15.5.1-New Rural Water Supply Facilities
Table 17: Rural Water Supply Technology Mix Planned for intervention, 2018-2020
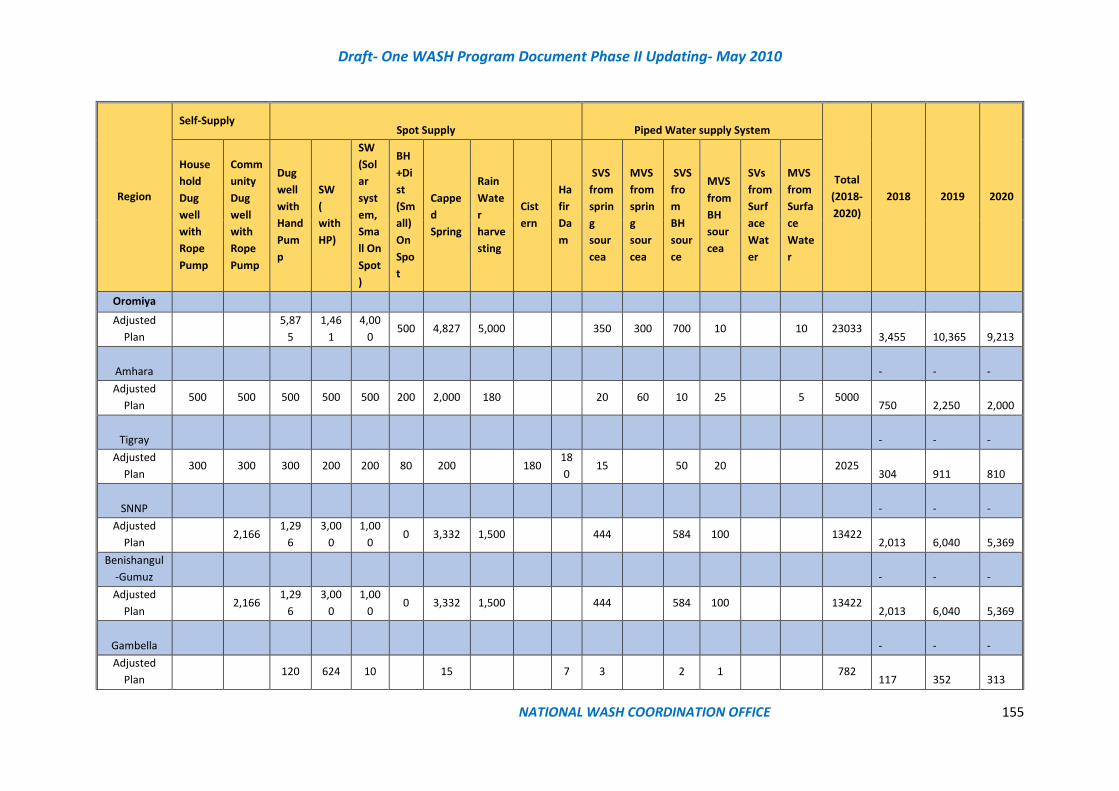
Draft- One WASH Program Document Phase II Updating- May 2010
NATIONAL WASH COORDINATION OFFICE 155
Region
Self-Supply Spot Supply Piped Water supply System
Total
(2018-
2020)
2018 2019 2020
House
hold
Dug
well
with
Rope
Pump
Comm
unity
Dug
well
with
Rope
Pump
Dug
well
with
Hand
Pum
p
SW
(
with
HP)
SW
(Sol
ar
syst
em,
Sma
ll On
Spot
)
BH
+Di
st
(Sm
all)
On
Spo
t
Cappe
d
Spring
Rain
Wate
r
harve
sting
Cist
ern
Ha
fir
Da
m
SVS
from
sprin
g
sour
cea
MVS
from
sprin
g
sour
cea
SVS
fro
m
BH
sour
ce
MVS
from
BH
sour
cea
SVs
from
Surf
ace
Wat
er
MVS
from
Surfa
ce
Wate
r
Oromiya
Adjusted
Plan
5,87
5
1,46
1
4,00
0 500 4,827 5,000 350 300 700 10 10 23033
3,455
10,365
9,213
Amhara
-
-
-
Adjusted
Plan 500 500 500 500 500 200 2,000 180 20 60 10 25 5 5000
750
2,250
2,000
Tigray
-
-
-
Adjusted
Plan 300 300 300 200 200 80 200 180
18
0 15 50 20 2025
304
911
810
SNNP
-
-
-
Adjusted
Plan 2,166
1,29
6
3,00
0
1,00
0 0 3,332 1,500 444 584 100 13422
2,013
6,040
5,369
Benishangul
-Gumuz
-
-
-
Adjusted
Plan 2,166
1,29
6
3,00
0
1,00
0 0 3,332 1,500 444 584 100 13422
2,013
6,040
5,369
Gambella
-
-
-
Adjusted
Plan 120 624 10 15 7 3 2 1 782
117
352
313
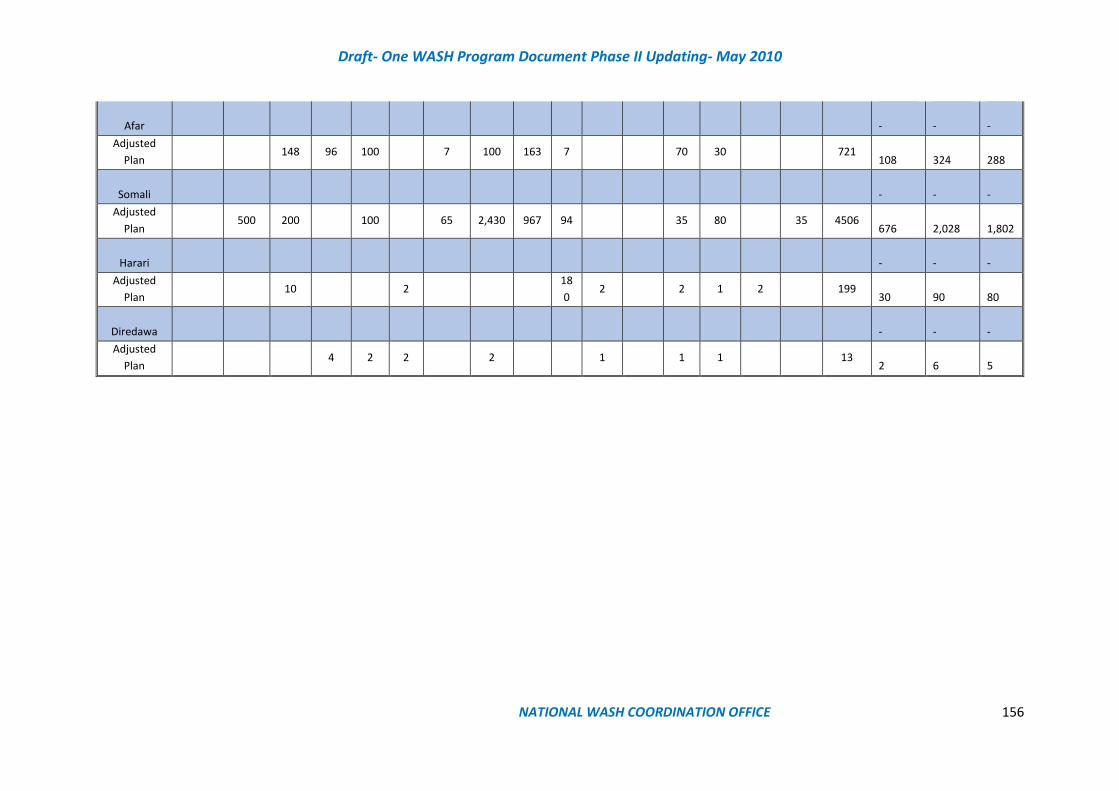
Draft- One WASH Program Document Phase II Updating- May 2010
NATIONAL WASH COORDINATION OFFICE 156
Afar
-
-
-
Adjusted
Plan 148 96 100 7 100 163 7 70 30 721
108
324
288
Somali
-
-
-
Adjusted
Plan 500 200 100 65 2,430 967 94 35 80 35 4506
676
2,028
1,802
Harari
-
-
-
Adjusted
Plan 10 2
18
0 2 2 1 2 199
30
90
80
Diredawa
-
-
-
Adjusted
Plan 4 2 2 2 1 1 1 13
2
6
5
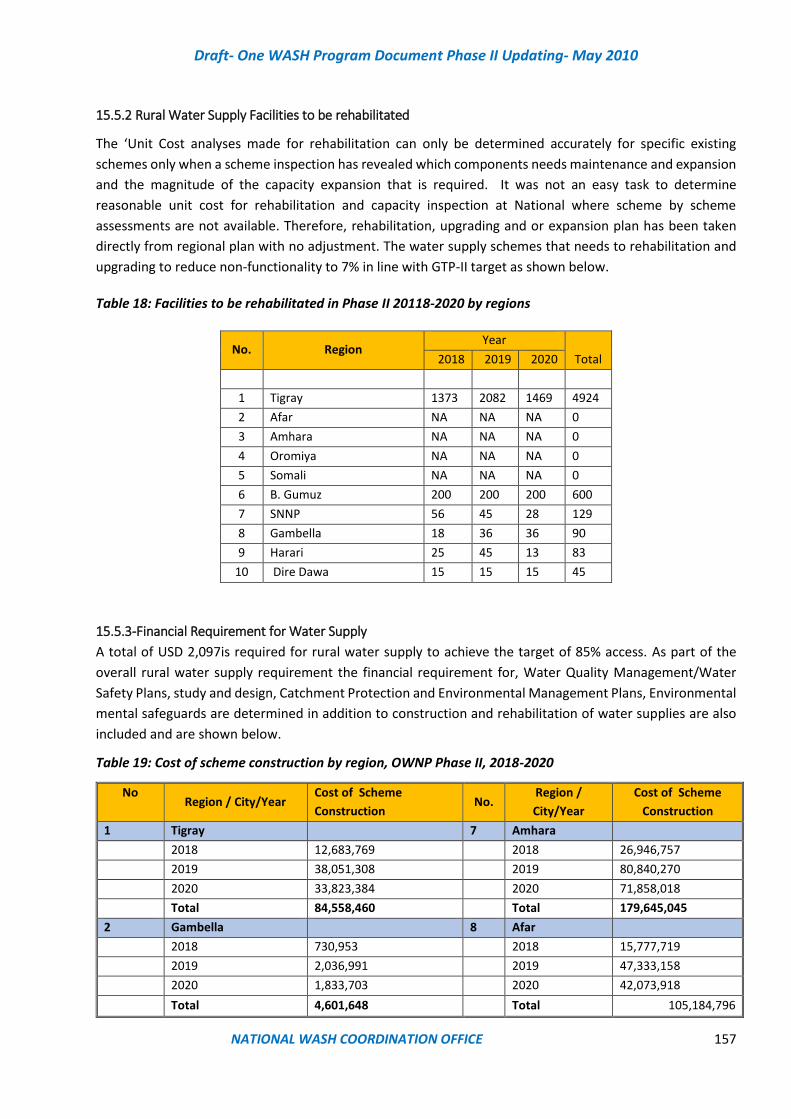
Draft- One WASH Program Document Phase II Updating- May 2010
NATIONAL WASH COORDINATION OFFICE 157
15.5.2 Rural Water Supply Facilities to be rehabilitated
The ‘Unit Cost analyses made for rehabilitation can only be determined accurately for specific existing
schemes only when a scheme inspection has revealed which components needs maintenance and expansion
and the magnitude of the capacity expansion that is required. It was not an easy task to determine
reasonable unit cost for rehabilitation and capacity inspection at National where scheme by scheme
assessments are not available. Therefore, rehabilitation, upgrading and or expansion plan has been taken
directly from regional plan with no adjustment. The water supply schemes that needs to rehabilitation and
upgrading to reduce non-functionality to 7% in line with GTP-II target as shown below.
Table 18: Facilities to be rehabilitated in Phase II 20118-2020 by regions
No. Region Year
Total 2018 2019 2020
1 Tigray 1373 2082 1469 4924
2 Afar NA NA NA 0
3 Amhara NA NA NA 0
4 Oromiya NA NA NA 0
5 Somali NA NA NA 0
6 B. Gumuz 200 200 200 600
7 SNNP 56 45 28 129
8 Gambella 18 36 36 90
9 Harari 25 45 13 83
10 Dire Dawa 15 15 15 45
15.5.3-Financial Requirement for Water Supply
A total of USD 2,097is required for rural water supply to achieve the target of 85% access. As part of the
overall rural water supply requirement the financial requirement for, Water Quality Management/Water
Safety Plans, study and design, Catchment Protection and Environmental Management Plans, Environmental
mental safeguards are determined in addition to construction and rehabilitation of water supplies are also
included and are shown below.
Table 19: Cost of scheme construction by region, OWNP Phase II, 2018-2020
No Region / City/Year
Cost of Scheme
Construction No.
Region /
City/Year
Cost of Scheme
Construction
1 Tigray 7 Amhara
2018 12,683,769 2018 26,946,757
2019 38,051,308 2019 80,840,270
2020 33,823,384 2020 71,858,018
Total 84,558,460 Total 179,645,045
2 Gambella 8 Afar
2018 730,953 2018 15,777,719
2019 2,036,991 2019 47,333,158
2020 1,833,703 2020 42,073,918
Total 4,601,648 Total 105,184,796

Draft- One WASH Program Document Phase II Updating- May 2010
NATIONAL WASH COORDINATION OFFICE 158
3 B. Gumuz 9 SNNPR
2018 2,623,482 2018 85,893,638
2019 7,696,533 2019 227,919,949
2020 6,851,024 2020 201,325,947
Total 17,171,039 Total 515,139,534
4 Dire Dawa 10 Oromia
2018 13,955,120 2018 114,593,052
2019 41,800,139 2019 330,690,756
2020 37,159,302 2020 293,943,084
Total 92,914,561 Total 739,226,892
5 Harari 6 Somali
2018 1,267,028 2018 30,782,888
2019 3,738,474 2019 92,348,663
2020 3,333,523 2020 82,087,701
Total 8,339,026 Total 205,219,252
6 National
2018 307,075,680 Federal 1821273.762
2019 877,920,062 5463821.287
2020 779,146,335 4856730.366
1,964,142,078 12141825.41
Additional Budget
allocated for large MV
CR WASH schemes &
2032design pop
132,222,828
Grand Total 2,096,364,906
Note: The detail Cost allocated for each technology by region please see annex---

Draft- One WASH Program Document Phase II Updating- May 2010
NATIONAL WASH COORDINATION OFFICE 159
Fig 22: Summery of cost for rural water supply, Phase II 2018-2020
15.6 Institutional WASH
The investments required for water supply and sanitation facilities in institutions have been calculated based
on the sanitation micro-plans to achieve universal access by 2030 and adjusted to the specific targets for
WASH in institutions included under GTP-2 (80% water coverage in schools and 60% water coverage in health
post and health centres).
The budget for School WASH also includes targeting 80% of the 36,518 schools (33,524 primary and 2,994
secondary) with MHM and other hygiene promotion packages.
The budget for WASH in health institutions includes all infrastructure investments to ensure 60% of water
coverage in health posts and health centres, as well as software activities such as the IPPS (Infection
prevention and patient safety).
Table 20: Summary of cost for WASH in schools by region, Phase II 2018-2020
Region Name Primary schools rural areas
Primary schools urban areas
Secondary schools (both rural and
urban)
Total WASH in schools (ETB)
Total WASH in schools (US$)
Addis Ababa - 63,428,000 67,912,320 131,340,320 4,690,725.71
$1,356
$63
$321
$104
$65
$55
$132
$2,096
$0 $500 $1,000 $1,500 $2,000 $2,500
C O N S T R U C T I O N O F W A T E R S U P P L I E S I N C O M M U N I T I E S
R E H A B I L I T A T I O N O F W A T E R S U P P L I E S I N C O M M U N I T I E S
S T U D Y , D E S I G N A N D P R O J E C T M A N G M E N T I N C L U D I N G C A T C H M E N T / S U B C A T C H M E N T …
E N V I R O N M E N T A L S A F E G U R D
W A T E R S A F E T Y P L A N S A N D W A T E R Q U A L I T Y M A N G M E N T
C A T C H M E N T P R O T E C T I O N A N D E N V I R O N M E N T A L M A N A G E M E N T P L A N S
A D D I T I O N A L B U D G E T A L L O C A T E D F O R L A R G E M V C R W A S H S C H E M E S & 2 0 3 2 D E S I G N P O P
R U R A L W A T E R S U P P L Y T O T A L C O S T
RURAL WATER SUPPLY(MILLION USD)
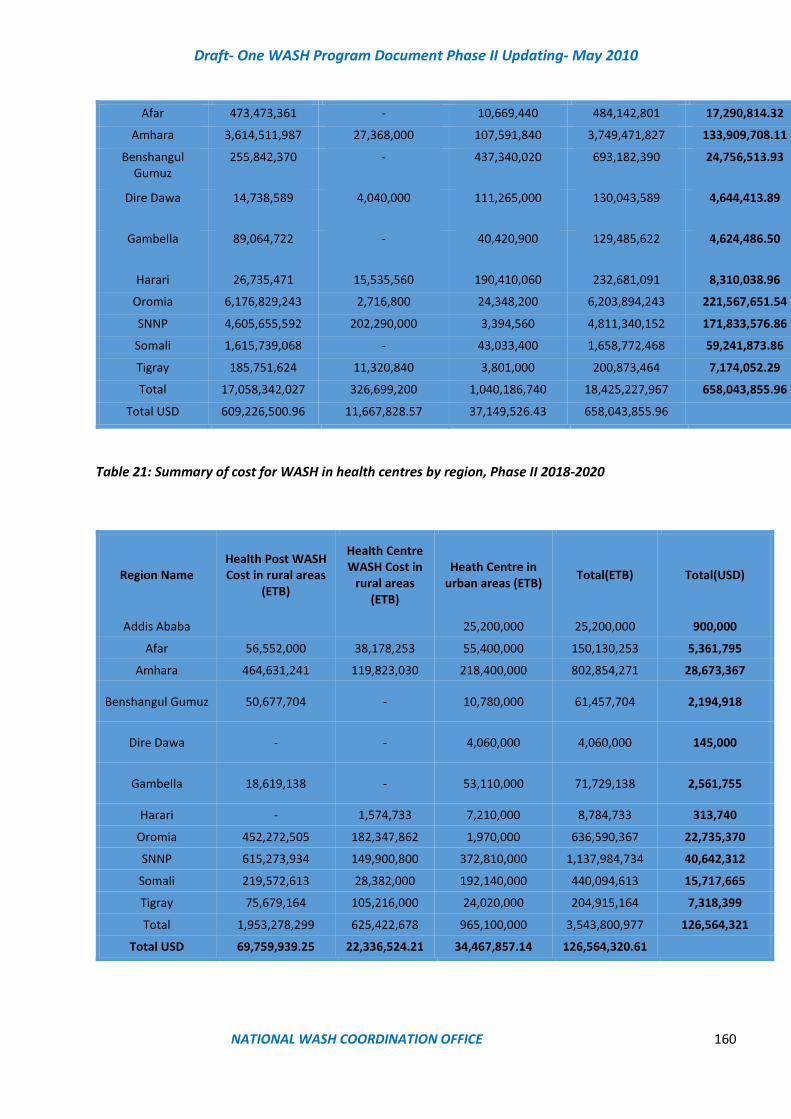
Draft- One WASH Program Document Phase II Updating- May 2010
NATIONAL WASH COORDINATION OFFICE 160
Afar 473,473,361 - 10,669,440 484,142,801 17,290,814.32
Amhara 3,614,511,987 27,368,000 107,591,840 3,749,471,827 133,909,708.11
Benshangul Gumuz
255,842,370 - 437,340,020 693,182,390 24,756,513.93
Dire Dawa 14,738,589 4,040,000 111,265,000 130,043,589 4,644,413.89
Gambella 89,064,722 - 40,420,900 129,485,622 4,624,486.50
Harari 26,735,471 15,535,560 190,410,060 232,681,091 8,310,038.96
Oromia 6,176,829,243 2,716,800 24,348,200 6,203,894,243 221,567,651.54
SNNP 4,605,655,592 202,290,000 3,394,560 4,811,340,152 171,833,576.86
Somali 1,615,739,068 - 43,033,400 1,658,772,468 59,241,873.86
Tigray 185,751,624 11,320,840 3,801,000 200,873,464 7,174,052.29
Total 17,058,342,027 326,699,200 1,040,186,740 18,425,227,967 658,043,855.96
Total USD 609,226,500.96 11,667,828.57 37,149,526.43 658,043,855.96
Table 21: Summary of cost for WASH in health centres by region, Phase II 2018-2020
Region Name Health Post WASH Cost in rural areas
(ETB)
Health Centre WASH Cost in
rural areas (ETB)
Heath Centre in urban areas (ETB)
Total(ETB) Total(USD)
Addis Ababa 25,200,000 25,200,000 900,000
Afar 56,552,000 38,178,253 55,400,000 150,130,253 5,361,795
Amhara 464,631,241 119,823,030 218,400,000 802,854,271 28,673,367
Benshangul Gumuz 50,677,704 - 10,780,000 61,457,704 2,194,918
Dire Dawa - - 4,060,000 4,060,000 145,000
Gambella 18,619,138 - 53,110,000 71,729,138 2,561,755
Harari - 1,574,733 7,210,000 8,784,733 313,740
Oromia 452,272,505 182,347,862 1,970,000 636,590,367 22,735,370
SNNP 615,273,934 149,900,800 372,810,000 1,137,984,734 40,642,312
Somali 219,572,613 28,382,000 192,140,000 440,094,613 15,717,665
Tigray 75,679,164 105,216,000 24,020,000 204,915,164 7,318,399
Total 1,953,278,299 625,422,678 965,100,000 3,543,800,977 126,564,321
Total USD 69,759,939.25 22,336,524.21 34,467,857.14 126,564,320.61
Draft- One WASH Program Document Phase II Updating- May 2010
NATIONAL WASH COORDINATION OFFICE 161
15.7. Urban Water Supply
Population to be served under GTP2 by 2020 is included under sub-section 16…
Per capita unit rates have been derived from all sources and variations are illustrated in the figure below.
Phase 1 estimates have proved to be too low and the recent rates used by the regions are considered to be
unreliable. Hence
Hence limited information from other sources has been analyzed and is recommended for use: see table
below
Table 22-Per capita Unit Rate for Urban Water Supply (USD)

Draft- One WASH Program Document Phase II Updating- May 2010
NATIONAL WASH COORDINATION OFFICE 162
1 Parameters Urban water unit rates, USD per capita by Regions
2 Regions and City Administrations Oromiya Amhara Tigray SNNP Somali B Gumuz Afar Gambella Harari Dire
Dawa
Addis
Ababa
3 Per capita cost national average of all
category
91 91 91 91 91 91 91 91 91
4 SDG WASH Costing Tools basic water
estimate Including price inflation for year
2017
94 94 94 94 94 94 94 94 94
5 Regional Factor proposed in phase-I 1 1 1.05 1 1.25 1.1 1.25 1.1 1.05
6 Regional factors developed from unit cost
analyses of different NGOs and CWA project
records
1.06 1.06 1.10 1.07 1.28 1.08 1.11 1.09 1.08
7 Regional factors, average of above 2 rows 1.03 1.03 1.07 1.04 1.27 1.09 1.18 1.09 1.06
8 Per capita unit rate from OWNP Phase-I
document
28 39 28 23 67 30 33 31 28
9 Factored per capita unit rate planned by
regions for OWNP phase-II
34 43 11 459 130 74 122 113 1
10 Regional unit rates from CR-WASH 127 127 133 127 145 145
11 Per capita unit rates derived from available
sources
94 94 98 94 115 99 107 100 97
12 Per capita Unit Rate that takes account of the
various factors from SDG WASH Costing
Tools
97 97 101 97 119 102 111 103 100
13 Average of above 2 rows recommended for
use alongside CR-WASH figures
95 95 99 96 117 101 109 101 98 47
Note: rates in Row 13 to be used, but supplemented by Row 10 according to proportion of very deep well schemes
Draft- One WASH Program Document Phase II Updating- May 2010
NATIONAL WASH COORDINATION OFFICE 163
Note: These rates are based on design population, assumed to be 2032
15.7 Urban Water Supply Physical and Financial Plan
Urban technology mix
In order to achieve greater resilience and reliability, it has been decided to increase the mix of very deep
boreholes in drought prone areas, both urban and rural. Funding source for the drought prone area
interventions under CR-WASH (Resilient and Sustainable Water Supply, Sanitation and Hygiene programme in
Arid and Semi-Arid Drought Prone Areas of Ethiopia) has been identified separate from other funding sources,
so that the table below reflects this distinction.
The percentages of CR-WASH and non-CR-WASH are based on estimates from recent WASH Cluster reports:
However, this will require inputs from both national experts and regional actors with local knowledge: The
spreadsheet tool, below, is designed to be user friendly so that this can be easily done.
The overall cost 1,013 USD million (including 218 USD million CR-WASH) is considered to be reasonable and
possible to implement in the GTP2 timeframe, but only if other factors are concurrently put into place (WASH
sector reform, capacity building, advocacy and of course funding).
This represents a significant reduction in the 1,919 million USD total proposed by the regions. The difference
can be accounted by (a) a higher target population of 11.27 million compared with GTP2 target of 9.27 million
and (b) while Oromiya region underestimated costs by half, SNNP region would appear to have overestimated
urban costs by a factor of 7.
It could be argued that works to serve the population at the 2020 GTP2 target date should to be based on 2032
design horizon, which could be up to double the 2020 population. This would push the cost to 1,698 million
USD (including 384 million USD CR-WASH). This would be a valid argument if the full capacity of the built works
were only to be utilised in 2032, but not true in the situation where any works installed in an “under-served”
city (as is the case in all of Ethiopia) since any installed capacity will be immediately utilised.
It is recommended that the GTP2 urban water budgets should be based on 1,013 USD million (including 219
USD million CR-WASH) and that funding to this amount be identified.(see table 16.8)

Draft- One WASH Program Document Phase II Updating- May 2010
NATIONAL WASH COORDINATION OFFICE 164
Table 22: Urban water cost, GTP II, 2018-2020
1 Parameters Urban water costs to meet GTP2, USD million by regions Total 2 Regions and City Administrations Oromia Amhara Tigray SNNP Somali B
Gumuz
Afar Gambela Harari Dire
Dawa
Addis
Ababa
3 Unit rates from CR-WASH, USD/c 127 127 133 127 145 145 134 134 134
4 Recommended for use for non CR-WASH, USD/c 95 95 99 96 117 101 109 101 96 98 47
5 Unserved population to be served by 2020, million 1.88 0.71 0.43 1.20 0.15 0.09 0.14 0.07 0.15 0.08 4.36 9.27
6 Estimated %age mix of CR-WASH to 2020, from latest 30% 20% 20% 20% 100% 0% 100% 0% 30% 30% 0% 32%
7 Non CR-WASH %age 70% 80% 80% 80% 0% 100% 0% 100% 70% 70% 100%
8 Cost, USD million = Row 5 x (Row 3 x Row 6 + Row 4 x Row 7) 197.1 72.0 45.8 122.3 21.7 9.5 20.9 7.4 16.1 8.5 206.8 728.2
9 Note: To all these figures must be added factors for investigation, design and project management (15%), Environmental Safe guard(2%), Catchment Protection(2%),
inflation (10% for 3 years) and risk (10%), combined 39%.
1.39
10 Totals 274.3 100.1 63.8 170.2 30.2 13.3 29.0 10.3 22.4 11.8 287.8 1,013.2
11 CR-WASH, USD million, without design factor 82.3 20.0 12.8 34.0 30.2 0.0 29.0 0.0 6.7 3.5 0.0 218.6
12 non-CR-WASH, USD million, without design factor 192.0 80.1 51.0 136.2 0.0 13.3 0.0 10.3 15.7 8.3 287.8 794.6
13 Factor to allow for use of 2032 design population compared
with GTP2 2020 population for calculating costs
1.76 1.92 1.85 1.90 1.46 2.19 1.85 2.03 1.44 1.40 1.33
14 Totals with design factors USD million 483.3 192.5 118.2 323.4 44.0 29.1 53.8 20.8 32.4 16.5 384.1 1,698.0
15 CR-WASH, USD million, with design factor 145.0 38.5 23.6 64.7 44.0 0.0 53.8 0.0 9.7 5.0 0.0 384.2
16 non-CR-WASH, USD million, with design factor 338.3 154.0 94.6 258.7 0.0 29.1 0.0 20.8 22.6 11.6 384.1 1,313.8
17 Original regional proposal unserved population to be served
by 2020, million
1.71 1.24 0.79 2.61 0.24 0.11 0.11 0.08 0.00 0.01 4.36 11.27
18 Regional proposal, USD million 142.5 106.8 55.2 1242.2 57.0 16.5 39.1 50.3 0.0 2.7 206.8 1919.2
19 Unit rate from regional proposal, USD/c 83 86 70 475 241 144 342 625 300 47
Note: Note: These rates are based on design population, assumed to be that projected for 2032
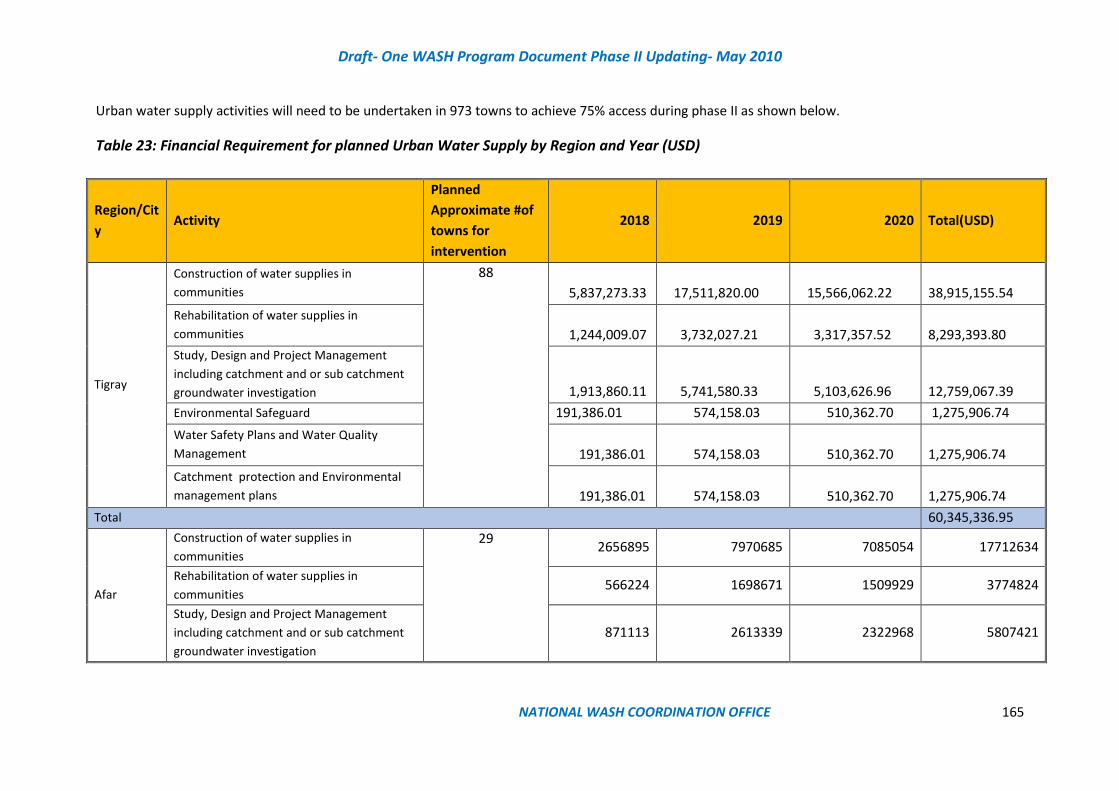
Draft- One WASH Program Document Phase II Updating- May 2010
NATIONAL WASH COORDINATION OFFICE 165
Urban water supply activities will need to be undertaken in 973 towns to achieve 75% access during phase II as shown below.
Table 23: Financial Requirement for planned Urban Water Supply by Region and Year (USD)
Region/Cit
y Activity
Planned
Approximate #of
towns for
intervention
2018 2019 2020 Total(USD)
Tigray
Construction of water supplies in
communities
88
5,837,273.33 17,511,820.00 15,566,062.22
38,915,155.54
Rehabilitation of water supplies in
communities 1,244,009.07 3,732,027.21 3,317,357.52
8,293,393.80
Study, Design and Project Management
including catchment and or sub catchment
groundwater investigation 1,913,860.11 5,741,580.33 5,103,626.96
12,759,067.39
Environmental Safeguard 191,386.01 574,158.03 510,362.70 1,275,906.74
Water Safety Plans and Water Quality
Management 191,386.01 574,158.03 510,362.70
1,275,906.74
Catchment protection and Environmental
management plans 191,386.01 574,158.03 510,362.70
1,275,906.74
Total 60,345,336.95
Afar
Construction of water supplies in
communities
29 2656895 7970685 7085054 17712634
Rehabilitation of water supplies in
communities 566224 1698671 1509929 3774824
Study, Design and Project Management
including catchment and or sub catchment
groundwater investigation
871113 2613339 2322968 5807421
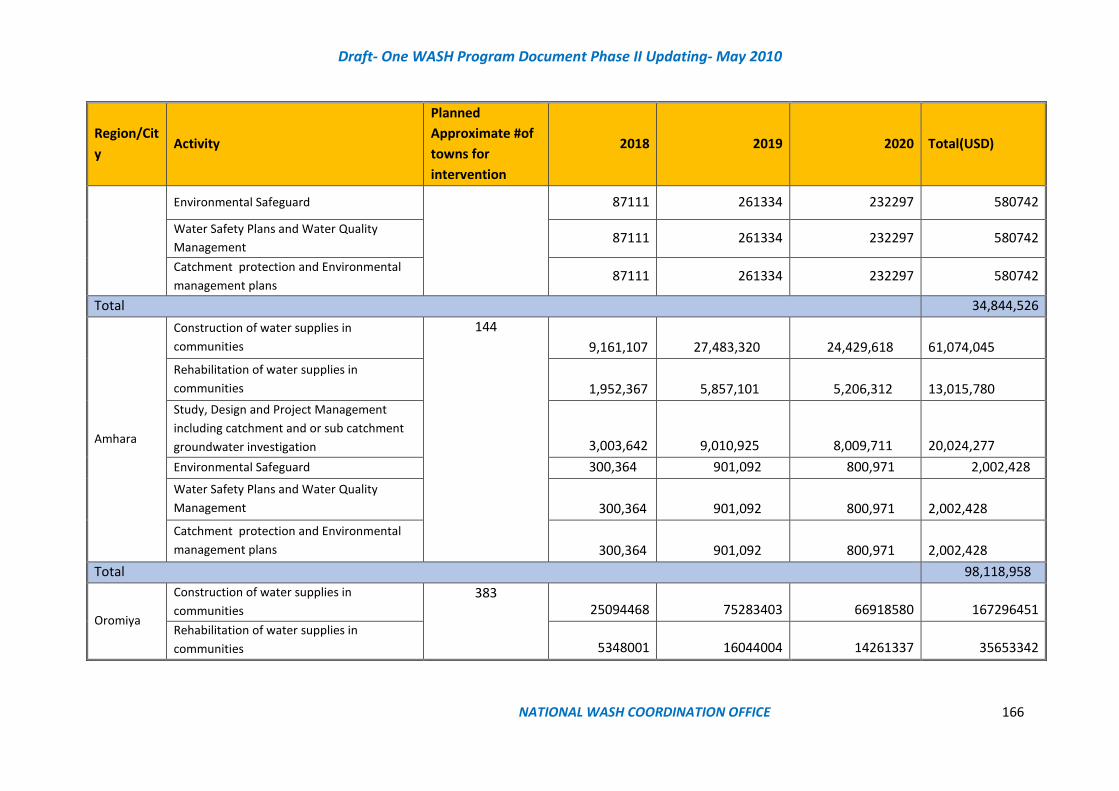
Draft- One WASH Program Document Phase II Updating- May 2010
NATIONAL WASH COORDINATION OFFICE 166
Region/Cit
y Activity
Planned
Approximate #of
towns for
intervention
2018 2019 2020 Total(USD)
Environmental Safeguard 87111 261334 232297 580742
Water Safety Plans and Water Quality
Management 87111 261334 232297 580742
Catchment protection and Environmental
management plans 87111 261334 232297 580742
Total 34,844,526
Amhara
Construction of water supplies in
communities
144
9,161,107 27,483,320 24,429,618
61,074,045
Rehabilitation of water supplies in
communities 1,952,367 5,857,101 5,206,312
13,015,780
Study, Design and Project Management
including catchment and or sub catchment
groundwater investigation 3,003,642 9,010,925 8,009,711
20,024,277
Environmental Safeguard 300,364 901,092 800,971 2,002,428
Water Safety Plans and Water Quality
Management 300,364 901,092 800,971
2,002,428
Catchment protection and Environmental
management plans 300,364 901,092 800,971
2,002,428
Total 98,118,958
Oromiya
Construction of water supplies in
communities
383 25094468 75283403 66918580 167296451
Rehabilitation of water supplies in
communities 5348001 16044004 14261337 35653342
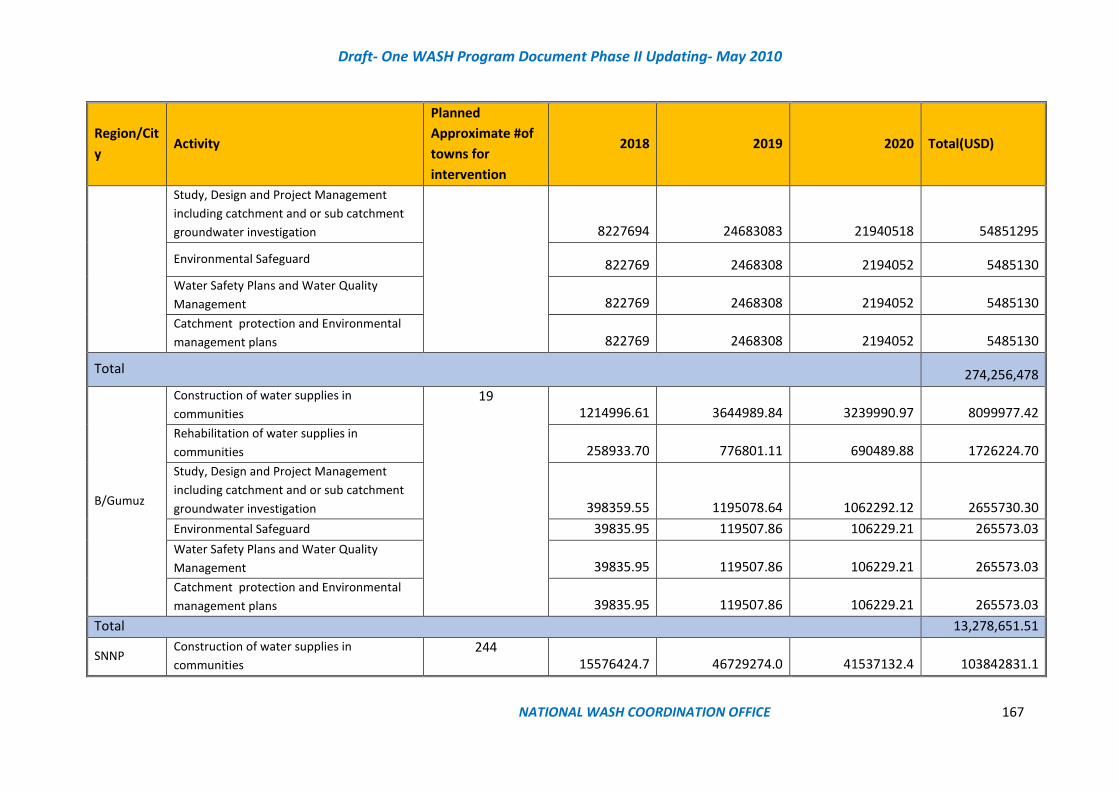
Draft- One WASH Program Document Phase II Updating- May 2010
NATIONAL WASH COORDINATION OFFICE 167
Region/Cit
y Activity
Planned
Approximate #of
towns for
intervention
2018 2019 2020 Total(USD)
Study, Design and Project Management
including catchment and or sub catchment
groundwater investigation 8227694 24683083 21940518 54851295
Environmental Safeguard 822769 2468308 2194052 5485130
Water Safety Plans and Water Quality
Management 822769 2468308 2194052 5485130
Catchment protection and Environmental
management plans 822769 2468308 2194052 5485130
Total 274,256,478
B/Gumuz
Construction of water supplies in
communities
19 1214996.61 3644989.84 3239990.97 8099977.42
Rehabilitation of water supplies in
communities 258933.70 776801.11 690489.88 1726224.70
Study, Design and Project Management
including catchment and or sub catchment
groundwater investigation 398359.55 1195078.64 1062292.12 2655730.30
Environmental Safeguard 39835.95 119507.86 106229.21 265573.03
Water Safety Plans and Water Quality
Management 39835.95 119507.86 106229.21 265573.03
Catchment protection and Environmental
management plans 39835.95 119507.86 106229.21 265573.03
Total 13,278,651.51
SNNP Construction of water supplies in
communities
244 15576424.7 46729274.0 41537132.4 103842831.1

Draft- One WASH Program Document Phase II Updating- May 2010
NATIONAL WASH COORDINATION OFFICE 168
Region/Cit
y Activity
Planned
Approximate #of
towns for
intervention
2018 2019 2020 Total(USD)
244 3319565.9 9958697.7 8852175.8 22130439.4
Study, Design and Project Management
including catchment and or sub catchment
groundwater investigation 5107024.5 15321073.4 13618731.9 34046829.9
Environmental Safeguards 510702.4 1532107.3 1361873.2 3404683.0
510702.4 1532107.3 1361873.2 3404683.0
510702.4 1532107.3 1361873.2 3404683.0
Total 170,234,149.40
Gambella
Construction of water supplies in
communities
15
938,466.03 2,815,398.09 2,502,576.08
6,256,440.19
Rehabilitation of water supplies in
communities 200,000.96 600,002.87 533,335.89
1,333,339.71
Study, Design and Project Management
including catchment and or sub catchment
groundwater investigation 307,693.78 923,081.34 820,516.75
2,051,291.87
Environmental Safeguard 30,769.38 92,308.13 82,051.67 205,129.19
Water Safety Plans and Water Quality
Management 30,769.38 92,308.13 82,051.67
205,129.19
Catchment protection and Environmental
management plans 30,769.38 92,308.13 82,051.67
205,129.19
Total 10,256,459.34
Harari
Construction of water supplies in
communities
5 2051542.47 6154627.41 5470779.92 13676949.80
Rehabilitation of water supplies in
communities 437213.97 1311641.91 1165903.92 2914759.79
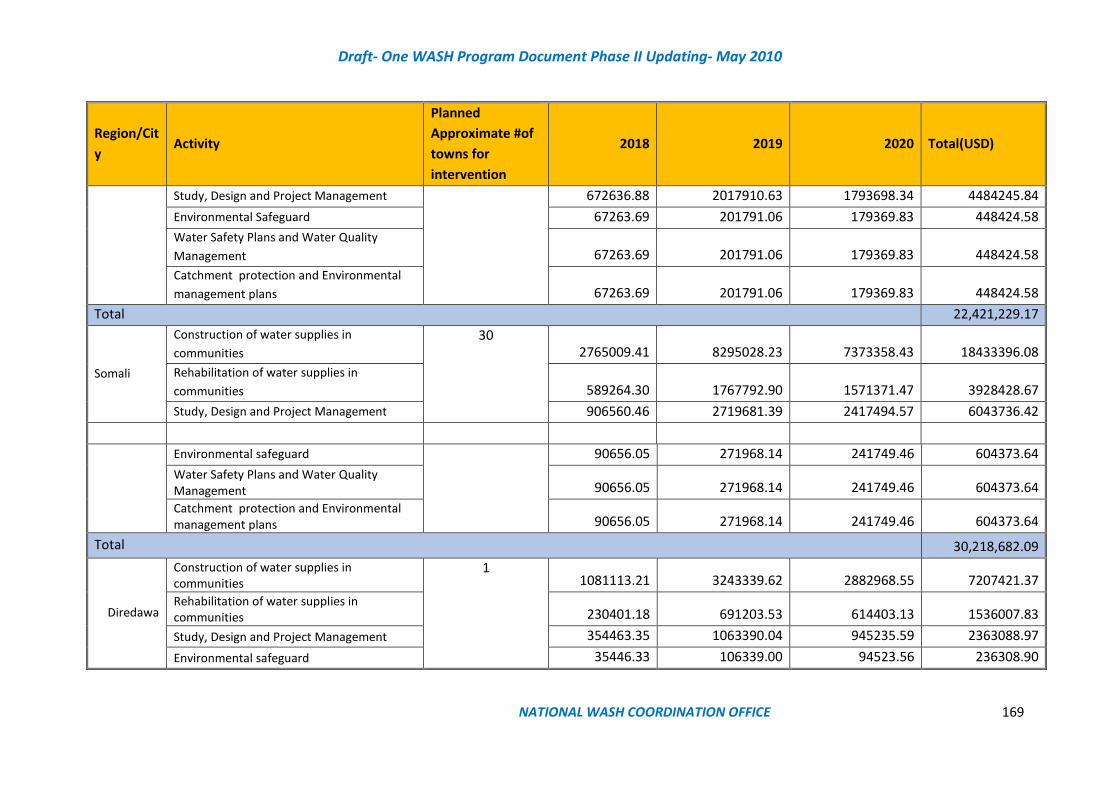
Draft- One WASH Program Document Phase II Updating- May 2010
NATIONAL WASH COORDINATION OFFICE 169
Region/Cit
y Activity
Planned
Approximate #of
towns for
intervention
2018 2019 2020 Total(USD)
Study, Design and Project Management 672636.88 2017910.63 1793698.34 4484245.84
Environmental Safeguard 67263.69 201791.06 179369.83 448424.58
Water Safety Plans and Water Quality
Management 67263.69 201791.06 179369.83 448424.58
Catchment protection and Environmental
management plans 67263.69 201791.06 179369.83 448424.58
Total 22,421,229.17
Somali
Construction of water supplies in
communities
30 2765009.41 8295028.23 7373358.43 18433396.08
Rehabilitation of water supplies in
communities 589264.30 1767792.90 1571371.47 3928428.67
Study, Design and Project Management 906560.46 2719681.39 2417494.57 6043736.42
Environmental safeguard 90656.05 271968.14 241749.46 604373.64
Water Safety Plans and Water Quality Management 90656.05 271968.14 241749.46 604373.64
Catchment protection and Environmental management plans 90656.05 271968.14 241749.46 604373.64
Total 30,218,682.09
Diredawa
Construction of water supplies in communities
1 1081113.21 3243339.62 2882968.55 7207421.37
Rehabilitation of water supplies in communities 230401.18 691203.53 614403.13 1536007.83
Study, Design and Project Management 354463.35 1063390.04 945235.59 2363088.97
Environmental safeguard 35446.33 106339.00 94523.56 236308.90

Draft- One WASH Program Document Phase II Updating- May 2010
NATIONAL WASH COORDINATION OFFICE 170
Region/Cit
y Activity
Planned
Approximate #of
towns for
intervention
2018 2019 2020 Total(USD)
Water Safety Plans and Water Quality Management 35446.33 106339.00 94523.56 236308.90
Catchment protection and Environmental management plans 35446.33 106339.00 94523.56 236308.90
11,815,444.87
Addis
Ababa
Construction of water supplies in communities
1 26333902.1 79001706.2 70223738.8 175559347.0
Rehabilitation of water supplies in communities 5612143.1 16836429.2 14965714.8 37414287.1
Study, Design and Project Management 8634066.2 25902198.7 23024176.7 57560441.6
Environmental safeguard 863406.6 2590219.9 2302417.7 5756044.2
Water Safety Plans and Water Quality Management 863406.6 2590219.9 2302417.7 5756044.2
Catchment protection and Environmental management plans 863406.6 2590219.9 2302417.7 5756044.2
Total 287,802,208.30
Grand Total 1,013,237,129

Draft- One WASH Program Document Phase II Updating- May 2010
NATIONAL WASH COORDINATION OFFICE 171
15.8 Rural and Peri-urban Sanitation Physical Plan
Rural sanitation and hygiene
The target for rural sanitation activities is to increase access to improved sanitation facilities and hygiene practice.
An estimated USD 394,689,743 is required to achieve the Program’s physical targets. The regional distribution of
the financial requirement is shown below cost of software for advocacy and capacity building is described under
program management and capacity building section
Region Name
Taking villages to Primary ODF village status
Taking villages to Secondary ODF village
status
Taking villages to Safely Managed sanitation village
status Fixed Costs for
training; supervision
and monitoring
Regional costs
Estimated Cost
Physical Target
Estimated Cost Physical Target
Estimated Cost Physical Target
Addis Ababa
- - - - - - - -
Afar 30,886,825 2,046 28,441,241 2,198 94,804,136 2,198 20,073,600 5,820,000
Amhara 197,496,941 21,454 299,330,475 33,600 312,969,611 35,131 135,453,796 22,844,000
Benshangul Gumuz
33,908,074 1,053 75,542,500 2,500 45,100,000 2,500 9,676,000 2,972,000
Dire Dawa 37,602,453 350 38,410,477 381 22,931,628 381 4,477,200 1,308,000
Gambella 29,075,896 767 20,595,120 910 20,595,120 910 483,800 2,252,000
Harari 9,811,474 84 20,934,612 191 12,498,276 191 590,400 828,000
Oromia 2,055,468,542 104,162 2,773,234,620 149,765 1,661,245,288 150,270 423,189,467 40,604,000
SNNP 107,189,109 56,144 302,215,478 31,659 566,350,690 91,960 324,839,034 20,684,000
Somali 102,341,190 4,382 89,322,499 4,462 73,253,571 4,468 58,006,832 14,220,000
Tigray 181,181,498 950 395,869,420 2,212 278,436,670 2,606 40,153,347 5,084,000
Total 2,784,962,002 191,392 4,043,896,442 227,878 3,088,184,991 290,614 1,016,943,476 116,616,000
Total USD 99,462,928.66 6,835.42 144,424,872.94 8,138.48 110,292,321.09 10,379.08 36,319,409.86 4,164,857.14

Draft- One WASH Program Document Phase II Updating- May 2010
NATIONAL WASH COORDINATION OFFICE 172
15.9 Urban sanitation
Since the information from the regions on urban sanitation is not complete, the GOE approved IUSHSAP
proposals (valid 2016/7) have been used, but excluding SWM components, as can be seen in the table
below.
Table 27: Cost for Urban sanitation
No Particulars Unit Quantity Estimated Financial
Requirement (ETB)
A Hardware Phase 1
(2016-2020)
PG1:Y4hase 1 (2016 -
2020 )
1 Public Toilets Construction in 970 towns No. of units 1201 939,088,500
2 Communal Toilets Construction in 970 towns No. of units 2237 1,249,787,500
3 School Toilets Construction in 970 towns No. of units 1942 1,303,194,000
4 Waste Water Study and Design No. of towns 36 180,000,000
5 Waste Water Treatment Plants Construction No. of towns 6 6,161,800,000
6 Decentralized WWT system study design and installation 200 Included in above figure
7 Procurement of 8 m3 capacity Vacuum Trucks for 50 towns
and surrounding cities
No. of units 48 144,000,000
8 Procurement of 5 m3 capacity Vacuum Trucks for 50 towns
and surrounding cities
No. of units 25 62,500,000
9 Procurement of 3 m3 capacity Vacuum Trucks for 50 towns
and surrounding cities
No. of units 1 2,000,000
Sum 10,042,370,000
10 For Rehabilitation of Sanitation Facilities (7% of Sum) 702,965,900
Grand Sum Hardware 10,745,335,900
B Software
1 322,360,077
2 Advocacy and communication (0.1% of Grand Sum per annum or 0.5% per phase) 53,726,680
3 Capacity Building
3.
1
Updating/preparation of Manuals (0.05% of Grand Sum) 5,372,668
Continuous Cascaded training on liquid waste management, composting,
etc. (0.1% of Grand Sum per annum or 0.5% per phase)
53,726,680
3.
3
Capacity Building in terms of Logistics (4% of Grand Sum) 429,813,436
C Miscellaneous
R&D
Seed money for Formative Research (1% of Grand Sum) 107,453,359
M&E (1% of Grand Sum) 107,453,359
Technical Assistance by NWCO and S&H TWG (0.5% of
Grand Sum) 53,726,680
Seed money for MFIs (3%) 322,360,077
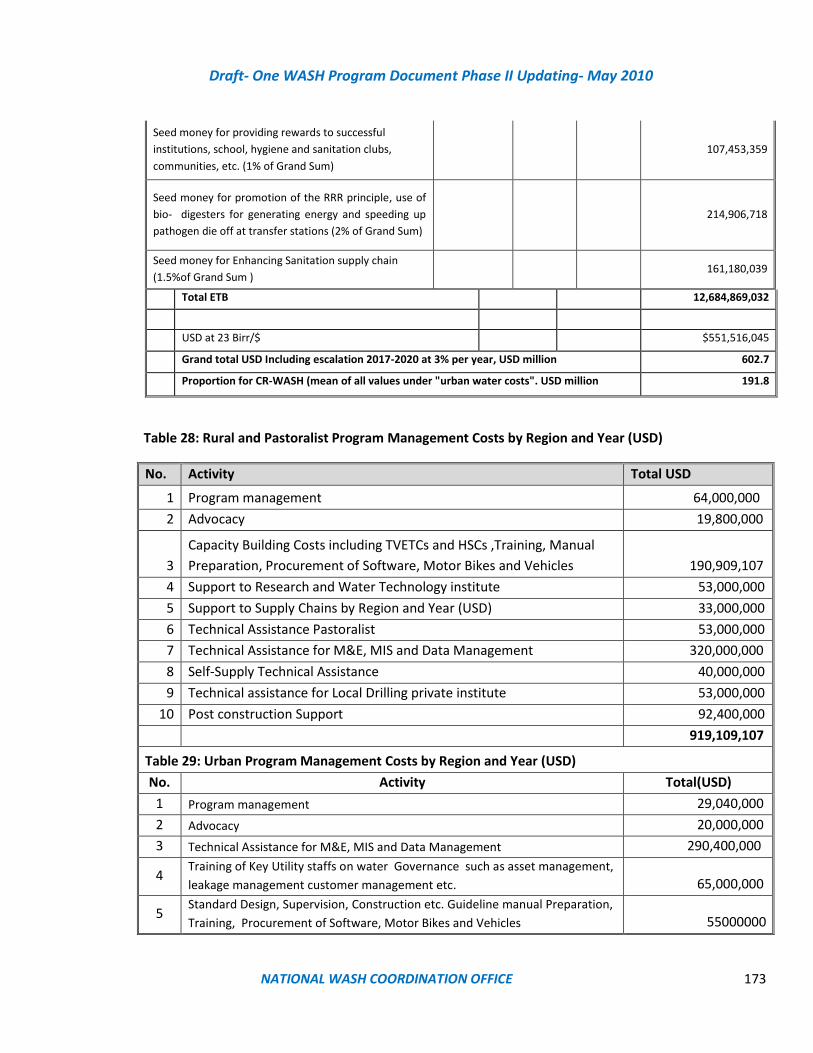
Draft- One WASH Program Document Phase II Updating- May 2010
NATIONAL WASH COORDINATION OFFICE 173
Seed money for providing rewards to successful
institutions, school, hygiene and sanitation clubs,
communities, etc. (1% of Grand Sum)
107,453,359
Seed money for promotion of the RRR principle, use of
bio- digesters for generating energy and speeding up
pathogen die off at transfer stations (2% of Grand Sum)
214,906,718
Seed money for Enhancing Sanitation supply chain
(1.5%of Grand Sum ) 161,180,039
Total ETB 12,684,869,032
USD at 23 Birr/$ $551,516,045
Grand total USD Including escalation 2017-2020 at 3% per year, USD million 602.7
Proportion for CR-WASH (mean of all values under "urban water costs". USD million 191.8
Table 28: Rural and Pastoralist Program Management Costs by Region and Year (USD)
No. Activity Total USD
1 Program management 64,000,000
2 Advocacy 19,800,000
3
Capacity Building Costs including TVETCs and HSCs ,Training, Manual
Preparation, Procurement of Software, Motor Bikes and Vehicles 190,909,107
4 Support to Research and Water Technology institute 53,000,000
5 Support to Supply Chains by Region and Year (USD) 33,000,000
6 Technical Assistance Pastoralist 53,000,000
7 Technical Assistance for M&E, MIS and Data Management 320,000,000
8 Self-Supply Technical Assistance 40,000,000
9 Technical assistance for Local Drilling private institute 53,000,000
10 Post construction Support 92,400,000
919,109,107
Table 29: Urban Program Management Costs by Region and Year (USD)
No. Activity Total(USD)
1 Program management 29,040,000
2 Advocacy 20,000,000
3 Technical Assistance for M&E, MIS and Data Management 290,400,000
4 Training of Key Utility staffs on water Governance such as asset management,
leakage management customer management etc. 65,000,000
5 Standard Design, Supervision, Construction etc. Guideline manual Preparation,
Training, Procurement of Software, Motor Bikes and Vehicles 55000000
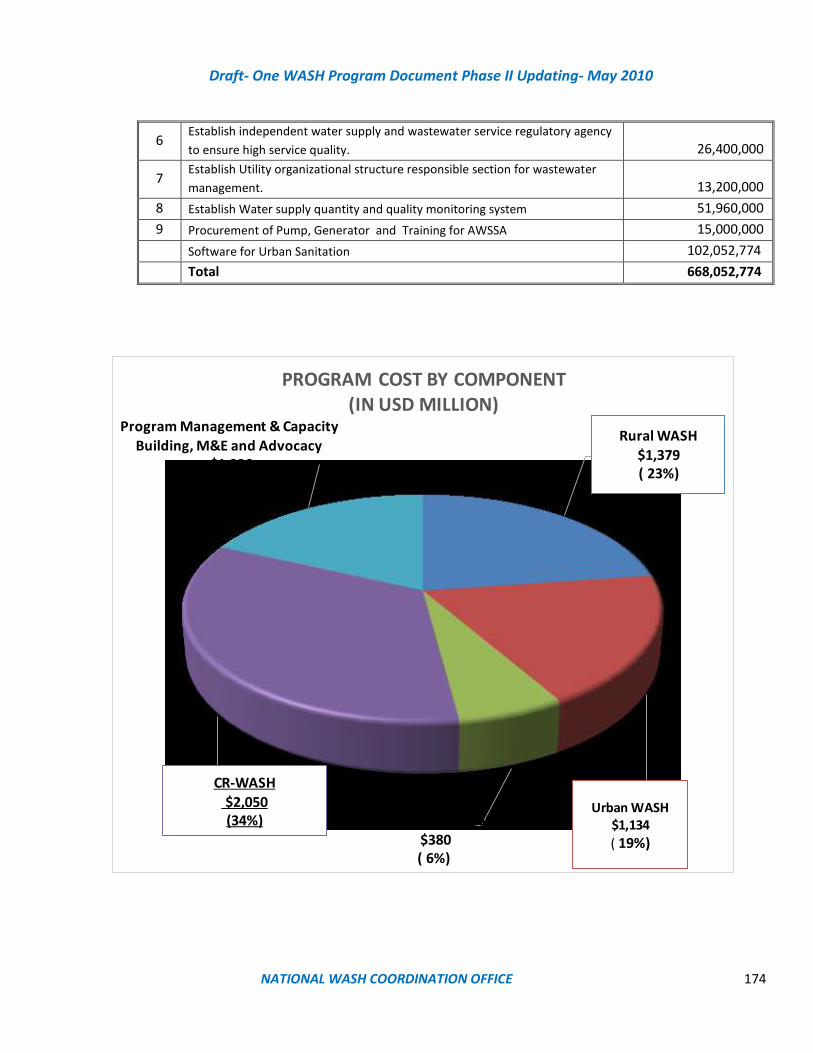
Draft- One WASH Program Document Phase II Updating- May 2010
NATIONAL WASH COORDINATION OFFICE 174
6 Establish independent water supply and wastewater service regulatory agency
to ensure high service quality. 26,400,000
7 Establish Utility organizational structure responsible section for wastewater
management. 13,200,000
8 Establish Water supply quantity and quality monitoring system 51,960,000
9 Procurement of Pump, Generator and Training for AWSSA 15,000,000
Software for Urban Sanitation 102,052,774
Total 668,052,774
Rural WASH $1,379( 23%)
Urban WASH$1,134
( 19%)
Institutional WASH $380( 6%)
CR-WASH$2,050(34%)
Program Management & Capacity Building, M&E and Advocacy
$1,096( 18%)
PROGRAM COST BY COMPONENT(IN USD MILLION)
Draft- One WASH Program Document Phase II Updating- May 2010
NATIONAL WASH COORDINATION OFFICE 175

Draft- One WASH Program Document Phase II Updating- May 2010
NATIONAL WASH COORDINATION OFFICE 176
2,383
2,096
286
1,513
1,013
500
556
1,587
937
610
40
6,039
1,379
1,162
217
1,134
795
340
380
1,096
628
438
30
3,989
1,003
934
69
379
219
160
176
491
309
173
10
2,050
0 1,000 2,000 3,000 4,000 5,000 6,000 7,000
Rural WASH
Rural water
Rural sanitation and hygiene
Urban WASH
Urban water
Urban sanitation
Institutional WASH
Program Management & CapacityBuilding, M&E and Advocacy
Program Management and CapacityBuilding
Monitering and evaluation
Advocacy
Totals
Program Cost by Component Total and CR-WASH and Non CR-WASH (Million USD)
Community, $906(15%)
Government $2,416 ( 40%)
Doonors, $2,718,
(45%)
PROGRAM SOURCE OF FUND IN MILLION USD
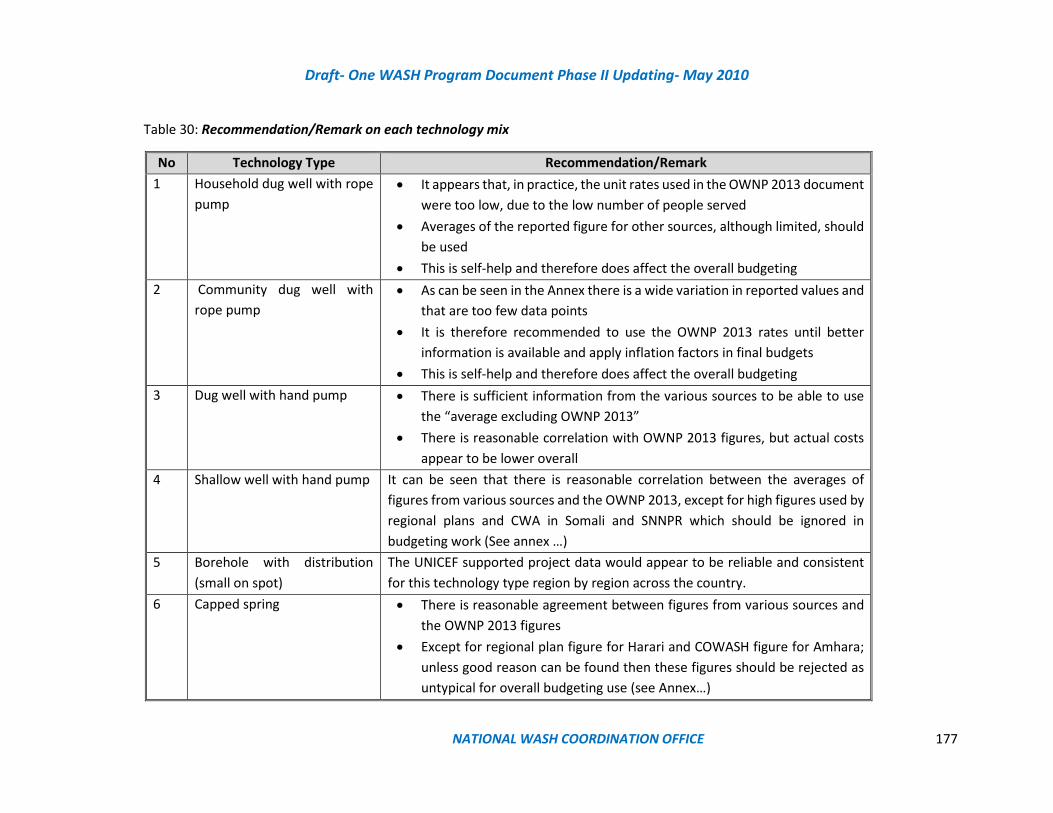
Draft- One WASH Program Document Phase II Updating- May 2010
NATIONAL WASH COORDINATION OFFICE 177
Table 30: Recommendation/Remark on each technology mix
No Technology Type Recommendation/Remark
1 Household dug well with rope
pump
• It appears that, in practice, the unit rates used in the OWNP 2013 document
were too low, due to the low number of people served
• Averages of the reported figure for other sources, although limited, should
be used
• This is self-help and therefore does affect the overall budgeting
2 Community dug well with
rope pump
• As can be seen in the Annex there is a wide variation in reported values and
that are too few data points
• It is therefore recommended to use the OWNP 2013 rates until better
information is available and apply inflation factors in final budgets
• This is self-help and therefore does affect the overall budgeting
3 Dug well with hand pump • There is sufficient information from the various sources to be able to use
the “average excluding OWNP 2013”
• There is reasonable correlation with OWNP 2013 figures, but actual costs
appear to be lower overall
4 Shallow well with hand pump It can be seen that there is reasonable correlation between the averages of
figures from various sources and the OWNP 2013, except for high figures used by
regional plans and CWA in Somali and SNNPR which should be ignored in
budgeting work (See annex …)
5 Borehole with distribution
(small on spot)
The UNICEF supported project data would appear to be reliable and consistent
for this technology type region by region across the country.
6 Capped spring • There is reasonable agreement between figures from various sources and
the OWNP 2013 figures
• Except for regional plan figure for Harari and COWASH figure for Amhara;
unless good reason can be found then these figures should be rejected as
untypical for overall budgeting use (see Annex…)
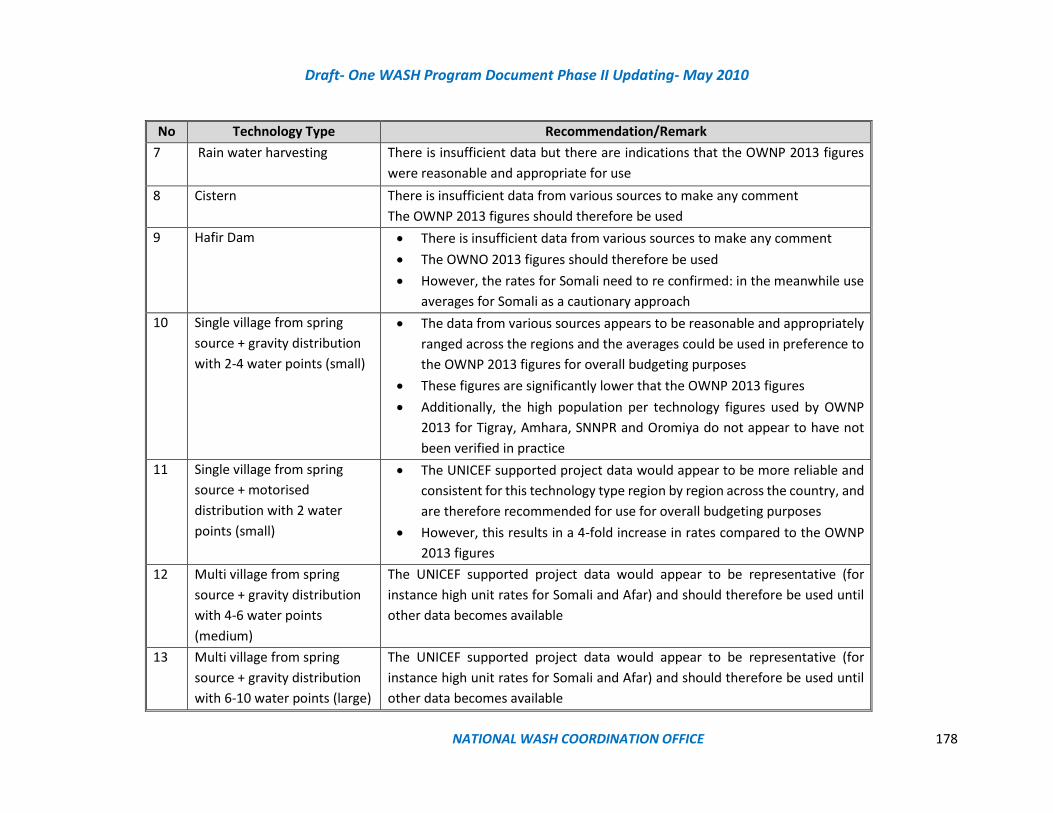
Draft- One WASH Program Document Phase II Updating- May 2010
NATIONAL WASH COORDINATION OFFICE 178
No Technology Type Recommendation/Remark
7 Rain water harvesting
There is insufficient data but there are indications that the OWNP 2013 figures
were reasonable and appropriate for use
8 Cistern
There is insufficient data from various sources to make any comment
The OWNP 2013 figures should therefore be used
9 Hafir Dam
• There is insufficient data from various sources to make any comment
• The OWNO 2013 figures should therefore be used
• However, the rates for Somali need to re confirmed: in the meanwhile use
averages for Somali as a cautionary approach
10 Single village from spring
source + gravity distribution
with 2-4 water points (small)
• The data from various sources appears to be reasonable and appropriately
ranged across the regions and the averages could be used in preference to
the OWNP 2013 figures for overall budgeting purposes
• These figures are significantly lower that the OWNP 2013 figures
• Additionally, the high population per technology figures used by OWNP
2013 for Tigray, Amhara, SNNPR and Oromiya do not appear to have not
been verified in practice
11 Single village from spring
source + motorised
distribution with 2 water
points (small)
• The UNICEF supported project data would appear to be more reliable and
consistent for this technology type region by region across the country, and
are therefore recommended for use for overall budgeting purposes
• However, this results in a 4-fold increase in rates compared to the OWNP
2013 figures
12 Multi village from spring
source + gravity distribution
with 4-6 water points
(medium)
The UNICEF supported project data would appear to be representative (for
instance high unit rates for Somali and Afar) and should therefore be used until
other data becomes available
13 Multi village from spring
source + gravity distribution
with 6-10 water points (large)
The UNICEF supported project data would appear to be representative (for
instance high unit rates for Somali and Afar) and should therefore be used until
other data becomes available
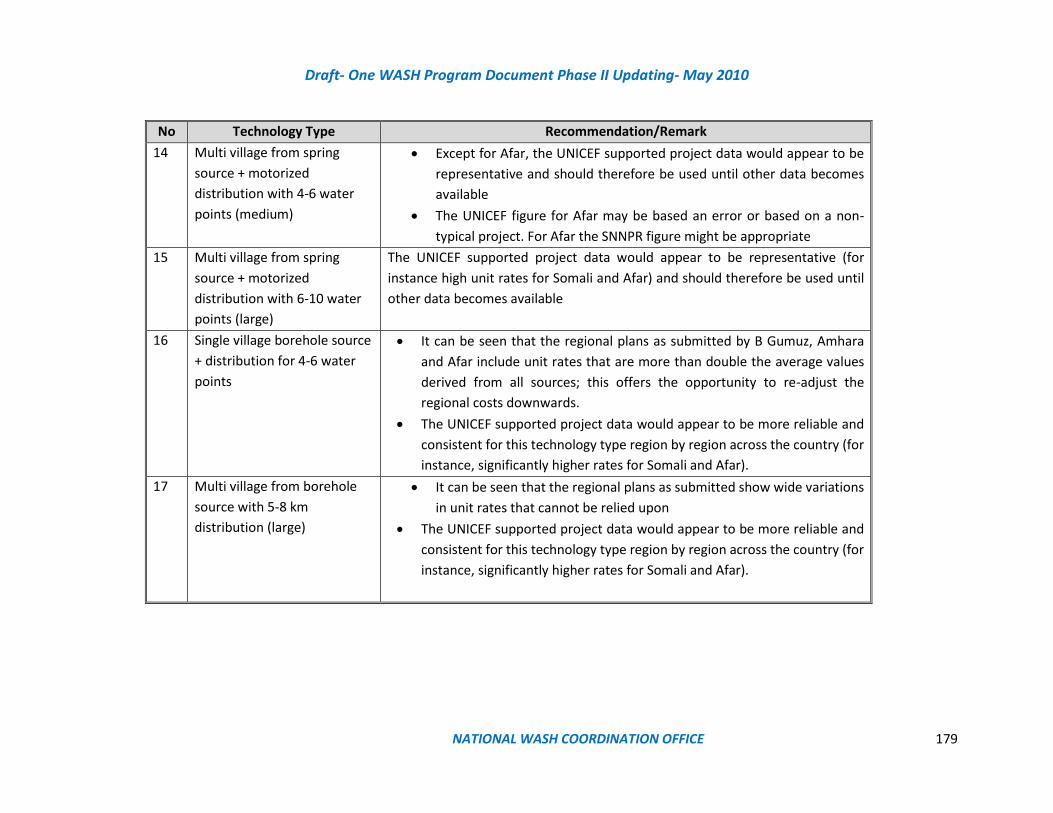
Draft- One WASH Program Document Phase II Updating- May 2010
NATIONAL WASH COORDINATION OFFICE 179
No Technology Type Recommendation/Remark
14 Multi village from spring
source + motorized
distribution with 4-6 water
points (medium)
• Except for Afar, the UNICEF supported project data would appear to be
representative and should therefore be used until other data becomes
available
• The UNICEF figure for Afar may be based an error or based on a non-
typical project. For Afar the SNNPR figure might be appropriate
15 Multi village from spring
source + motorized
distribution with 6-10 water
points (large)
The UNICEF supported project data would appear to be representative (for
instance high unit rates for Somali and Afar) and should therefore be used until
other data becomes available
16 Single village borehole source
+ distribution for 4-6 water
points
• It can be seen that the regional plans as submitted by B Gumuz, Amhara
and Afar include unit rates that are more than double the average values
derived from all sources; this offers the opportunity to re-adjust the
regional costs downwards.
• The UNICEF supported project data would appear to be more reliable and
consistent for this technology type region by region across the country (for
instance, significantly higher rates for Somali and Afar).
17 Multi village from borehole
source with 5-8 km
distribution (large)
• It can be seen that the regional plans as submitted show wide variations
in unit rates that cannot be relied upon
• The UNICEF supported project data would appear to be more reliable and
consistent for this technology type region by region across the country (for
instance, significantly higher rates for Somali and Afar).

Draft- One WASH Program Document Phase II Updating- May 2010
NATIONAL WASH COORDINATION OFFICE 180
List of Annexes Regional technology mix to meet GTP2
Scenario 1 spreadsheet below includes the numbers of schemes and technology mix exactly as proposed by the
regions. However, the resultant total costs may vary from the total cost figures from the regions since this analysis
uses averages of unit rates as well as numbers of beneficiaries per technology type derived from various sources
Scenario 2 assumes that the number of schemes required and the technology mix proposed by the regions have
been over-estimated and that the unserved populated, based on national level MoWIE data), is correct. Number
of schemes and technology mix are re-assessed by the consultants through consultation with national
government, DP and CSO experts and regional stakeholders to both match the needs of the unserved population
and also to increase resilience, sustainability and reliability.
The detail Physical and Financial plan has prepared for each region and each year of the reaming GTPII Plan based
on scenario 2
All regions
The working Regional Rural Water spreadsheet “tool” is based on:
• Number of systems proposed for each technology by each region, Column 3 in spreadsheets below
• Average population served by each technology is calculated for each region, Column 6,
• Unit cost per capita for each technology in each region, Column 9, also calculated in Section 16.4
• Unserved population to reach 85% GTP2 coverage by 2020, based on MoWIE 2009EFY report, Sub-section
16.2above
1 Urban water unit rates, USD per capita
2
Note: These rates are based on design population,
assumed to be 2032 Oromia Amhara Tigray SNNP Somali
B
Gumuz Afar Gambela Harari
Dire
Dawa
Addis
Ababa
3 Per capita cost national average of all category 91 91 91 91 91 91 91 91 91
4
SDG WASH Costing Tools basic water estimate
Including price inflation for year 2017 94 94 94 94 94 94 94 94 94
5 Regional Factor proposed in phase-I 1 1 1.05 1 1.25 1.1 1.25 1.1 1.05
6
Regional factors developed from unit cost analyses of
different NGOs and CWA project records 1.06 1.06 1.10 1.07 1.28 1.08 1.11 1.09 1.08
7 Regional factors, average of above 2 rows 1.03 1.03 1.07 1.04 1.27 1.09 1.18 1.09 1.06
8 Per capita unit rate from OWNP Phase-I document 28 39 28 23 67 30 33 31 28
9
Factored per capita unit rate planned by regions for
OWNP phase-II 34 43 11 459 130 74 122 113 1
10 Regional unit rates from CR-WASH 127 127 133 127 145 145
11 Per capita unit rates derived from available sources 94 94 98 94 115 99 107 100 97
12
Per capita Unit Rate that takes account of the various
factors from SDG WASH Costing Tools 97 97 101 97 119 102 111 103 100
13
Average of above 2 rows recommended for use
alongside CR-WASH figures 95 95 99 96 117 101 109 101 98 47
Region
Note: rates in Row 13 to be used, but supplemented by Row 10 according to proportion of very deep well schemes
Draft- One WASH Program Document Phase II Updating- May 2010
NATIONAL WASH COORDINATION OFFICE 181
Annex 1 Scenario 1
1-Tigray Region
It can be seen that, for Tigray region, for Scenario 1 (unadjusted):
1. Unserved population to reach 85% GTP2 coverage by 2020 = 783,642
2. The numbers of systems proposed by the region will serve a (here calculated) 219% of the actual rural water
need (1)
The cost calculated using this tool is USD 112 million to serve a rural population of 1.7 million people (219% of
the need), while the original proposal from the region was USD 70 million to serve a population of 2.1 million
people (using their own unit rates and population served per technology

Draft- One WASH Program Document Phase II Updating- May 2010
NATIONAL WASH COORDINATION OFFICE 182
2-Gambella Region
It can be seen that, for Gambella region, for Scenario 1 (unadjusted):
1. Unserved population to reach 85% GTP2 coverage by 2020 = 47,520
2. The numbers of systems proposed by the region will serve a (here calculated) 342% of the actual rural
water need (1)
Technology mix for rural water
Tigray region
783,642
Type Technology
No. of
systems
proposed
by Region
Adjusted
No. of
systems
Adjust-
ment
%age
Av.
population
served per
system in
this region
Adjusted
regional
population to
be served by
this system
Proportion
of unserved
population
Unit cost
per
capita
USD
Total cost USD Notes
1 Household Dug well with Rope Pump 924 924 100% 7 6,468 0.8% 112 723,490
2 Community Dug well with Rope Pump 0 0 10 0 0.0% 78 0
3 Dug well with Hand Pump 837 837 100% 171 143,127 18.3% 27 3,828,681
4 Shallow well with hand pump 2,557 2,557 100% 237 604,731 77.2% 44 26,844,884
5 Shallow well with solar system (small on spot) 0 0 0 0
6 Borehole with distribution (small on spot) 80 80 1,250 100,000 12.8% 125 12,527,964
7 Borehole with distribution (on spot) + solar 0 0 1,250 0 0
8 Capped Spring 414 414 100% 253 104,742 13.4% 21 2,171,904
9 Rain Water harvesting 0 0 300 0 45 0
10 Cistern 0 0 150 0 45 0
11 Hafir Dam 0 0 0 0
Other 0 0 0
12aSingle vil lage from spring source + gravity
distribution with 2 -4 water points (small) 0 1,650 0 0.0% 39 0
12bSingle vllage from spring source + motorized
distribution with 2 water points (small) 0 1,450 0 75 0
12cSingle vllage from spring source + motorized
distribution with 2 water points + solar 0 0% 3,000 52 0
13aMulti vil lage from spring source + gravity
distribution with 4-6 water points (medium) 0 3,000 0 0.0% 79 0
13bMulti vil lage from spring source + gravity
distribution with 6-10 water points (large) 0 8,100 0 39 0
13cMulti vil lage from spring source + motorized
distribution with 4-6 water points (medium) 0 5,500 0 54 0
13dMulti vil lage from spring source + motorized
distribution with 6-10 water points (large) 0 8,100 0 47 0
13eMulti vil lage from spring source + motorized
distribution with 4-10 water points + solar 0 0
14aSingle vil lage borehole source + distribution for
4-6 water points (medium) 90 6,500 585,000 74.7% 88 51,679,393
14bSingle vil lage borehole source + distribution for
4-6 water points + Solar 0 0
15aMulti vil lage from borehole source with 5-8 km
distribution (large) 22 100% 7,799 171,571 21.9% 84 14,490,591
15bMulti vil lage from borehole source with 5-8 km
distribution + Solar 0 0% 0
15cLarge multi vil lage from one or more very deep
boreholes with long km distribution 0 0% 10,000 140 0figures from Coffey?
Check CR WASH sheets
16. Single
Village -
river
16 Single vil lage from river source with treatment
0 0 0 0
17. Multi
Village -17 Multi vil lage from river source with treatment
0 0 0 115 0
Other 0
Totals 4,924 4,924 1,715,638 218.9% 112,266,907
Adjust figures in col 4 based on best estimate to reach 100% in col 8
14. Single
Village -
borehole
90
15. Multi
Village -
borehole
22
Unserved population to be served in the remaining three years according to
data derived from draft MoWIE report 2009EFY
Self supply
On spot
12. Single
Village -
spring
0
13. Multi
Village -
spring
0

Draft- One WASH Program Document Phase II Updating- May 2010
NATIONAL WASH COORDINATION OFFICE 183
3. The cost calculated using this tool is USD 14 million to serve a rural population of 162 thousand people
(342% of the need), while the original proposal from the region was USD 11.4 million to serve a
population of 156 thousand people (using their own unit rates and population served per technology)
3-Gumuz Region
It can be seen that, for B Gumuz region, for Scenario 1 (unadjusted):
1. Unserved population to reach 85% GTP2 coverage by 2020 = 253,437
2. The numbers of systems proposed by the region will serve a (here calculated) 105% of the actual rural water
need (1)
Technology mix for rural water
Gambella region
47,530
Type Technology
No. of
systems
proposed
by Region
Adjusted
No. of
systems
Adjust-
ment
%age
Av.
population
served per
system in
this region
Adjusted
regional
population to
be served by
this system
Proportion
of unserved
population
Unit cost
per
capita
USD
Total cost USD Notes
1 Household Dug well with Rope Pump 650 650 100% 6 3,835 8.1% 133 509,999
2 Community Dug well with Rope Pump 0 0 19 0 0.0% 47 0
3 Dug well with Hand Pump 163 163 100% 135 22,005 46.3% 34 754,357
4 Shallow well with hand pump 238 238 100% 237 56,287 118.4% 95 5,322,697
5 Shallow well with solar system (small on spot) 111 111 100% 237 26,252 55.2% 95 2,482,434
6 Borehole with distribution (small on spot) 0 0 1,250 0 0.0% 135 0 av unit cost used
7 Borehole with distribution (on spot) + solar 0 0 1,250 0 135 0
8 Capped Spring 34 34 100% 200 6,811 14.3% 30 206,456
9 Rain Water harvesting 0 0 249 0 40 0
10 Cistern 0 0 127 0 140 0
11 Hafir Dam 0 0 2,225 0 13 0
Other 0 0 0
12aSingle vil lage from spring source + gravity
distribution with 2 -4 water points (small) 8 100% 1,400 11,200 23.6% 96 1,072,908
12bSingle vllage from spring source + motorized
distribution with 2 water points (small) 0 1,300 0 117 0
12cSingle vllage from spring source + motorized
distribution with 2 water points + solar 0 3,000 52 0 from Tigray
13aMulti vil lage from spring source + gravity
distribution with 4-6 water points (medium) 0 3,300 0 0.0% 49 0
13bMulti vil lage from spring source + gravity
distribution with 6-10 water points (large) 0 9,228 0 108 0 av figures used
13cMulti vil lage from spring source + motorized
distribution with 4-6 water points (medium) 0 3,300 0 69 0
13dMulti vil lage from spring source + motorized
distribution with 6-10 water points (large) 0 8,350 0 41 0
13eMulti vil lage from spring source + motorized
distribution with 4-10 water points + solar 0 0
14aSingle vil lage borehole source + distribution for
4-6 water points (medium) 12 3,000 36,000 75.7% 105 3,782,937
14bSingle vil lage borehole source + distribution for
4-6 water points + Solar 0 0
15aMulti vil lage from borehole source with 5-8 km
distribution (large) 0 7,921 0 0.0% 39 0
15bMulti vil lage from borehole source with 5-8 km
distribution + Solar 0 0 0
15cLarge multi vil lage from one or more very deep
boreholes with long km distribution 0 10,000 0 140 0figures from Coffey?
Check CR WASH sheets
16. Single
Village -
river
16 Single vil lage from river source with treatment
0 0 0 0
17. Multi
Village -17 Multi vil lage from river source with treatment
0 0 0 115 0
Other 0
Totals 1,216 1,216 162,390 341.7% 14,131,786
Adjust figures in col 4 based on best estimate to reach 100% in col 8
14. Single
Village -
borehole
12
15. Multi
Village -
borehole
0
Unserved population to be served in the remaining three years according to
data derived from draft MoWIE report 2009EFY
Self supply
On spot
12. Single
Village -
spring
8
13. Multi
Village -
spring
0

Draft- One WASH Program Document Phase II Updating- May 2010
NATIONAL WASH COORDINATION OFFICE 184
3. The cost calculated using this tool is USD 12.5 million to serve a rural population of 0.25 million (105% of the
need), while the original proposal from the region was USD 17.7 million to serve a population of 0.24 million
(using their own unit rates and population served per technology)
4-Harari Region
It can be seen that, for Harari region, for Scenario 1 (unadjusted):
1. Unserved population to reach 85% GTP2 coverage by 2020 = 28,645
Technology mix for rural water
B Gumuz region
253,437
Type Technology
No. of
systems
proposed
by Region
Adjusted
No. of
systems
Adjust-
ment
%age
Av.
population
served per
system in
this region
Adjusted
regional
population to
be served by
this system
Proportion
of unserved
population
Unit cost
per
capita
USD
Total cost USD Notes
1 Household Dug well with Rope Pump 0 0 6 0 133 0
2 Community Dug well with Rope Pump 0 0 33 0 38 0
3 Dug well with Hand Pump 120 120 100% 115 13,800 5.4% 30 416,311
4 Shallow well with hand pump 624 624 100% 236 147,264 58.1% 41 6,034,378
5 Shallow well with solar system (small on spot) 10 10 100% 236 2,360 0.9% 41 96,705
6 Borehole with distribution (small on spot) 0 0 1,250 0 115 0
7 Borehole with distribution (on spot) + solar 0 0 1,250 0 0
8 Capped Spring 24 24 100% 188 4,500 1.8% 31 140,042
9 Rain Water harvesting 0 0 44 0 39 0
10 Cistern 0 0 44 0 106 0
11 Hafir Dam 0 0 222 0 105 0
Other 0 0 0
12aSingle vil lage from spring source + gravity
distribution with 2 -4 water points (small) 0 1,450 0 66 0
12bSingle vllage from spring source + motorized
distribution with 2 water points (small) 0 1,400 0 105 0
12cSingle vllage from spring source + motorized
distribution with 2 water points + solar 0 3,000 0 52 0 from Tigray
13aMulti vil lage from spring source + gravity
distribution with 4-6 water points (medium) 0 3,200 0 48 0
13bMulti vil lage from spring source + gravity
distribution with 6-10 water points (large) 0 8,100 0 37 0
13cMulti vil lage from spring source + motorized
distribution with 4-6 water points (medium) 0 3,200 0 69 0
13dMulti vil lage from spring source + motorized
distribution with 6-10 water points (large) 0 8,100 0 45 0
13eMulti vil lage from spring source + motorized
distribution with 4-10 water points + solar 0 0
14aSingle vil lage borehole source + distribution for
4-6 water points (medium) 10 100% 3,000 30,000 11.8% 79 2,371,365
14bSingle vil lage borehole source + distribution for
4-6 water points + Solar 0 0
15aMulti vil lage from borehole source with 5-8 km
distribution (large) 8 100% 8,500 68,000 26.8% 50 3,400,447
15bMulti vil lage from borehole source with 5-8 km
distribution + Solar 0 0% 0
15cLarge multi vil lage from one or more very deep
boreholes with long km distribution 0 0% 10,000 140 0figures from Coffey?
Check CR WASH sheets
16. Single
Village -
river
16 Single vil lage from river source with treatment
0 0 0 0
17. Multi
Village -17 Multi vil lage from river source with treatment
0 0 0 115 0
Other 0
Totals 796 796 265,924 104.9% 12,459,248
14. Single
Village -
borehole
10
15. Multi
Village -
borehole
8
Unserved population to be served in the remaining three years according to
data derived from draft MoWIE report 2009EFY
Self supply
On spot
12. Single
Village -
spring
0
13. Multi
Village -
spring
0
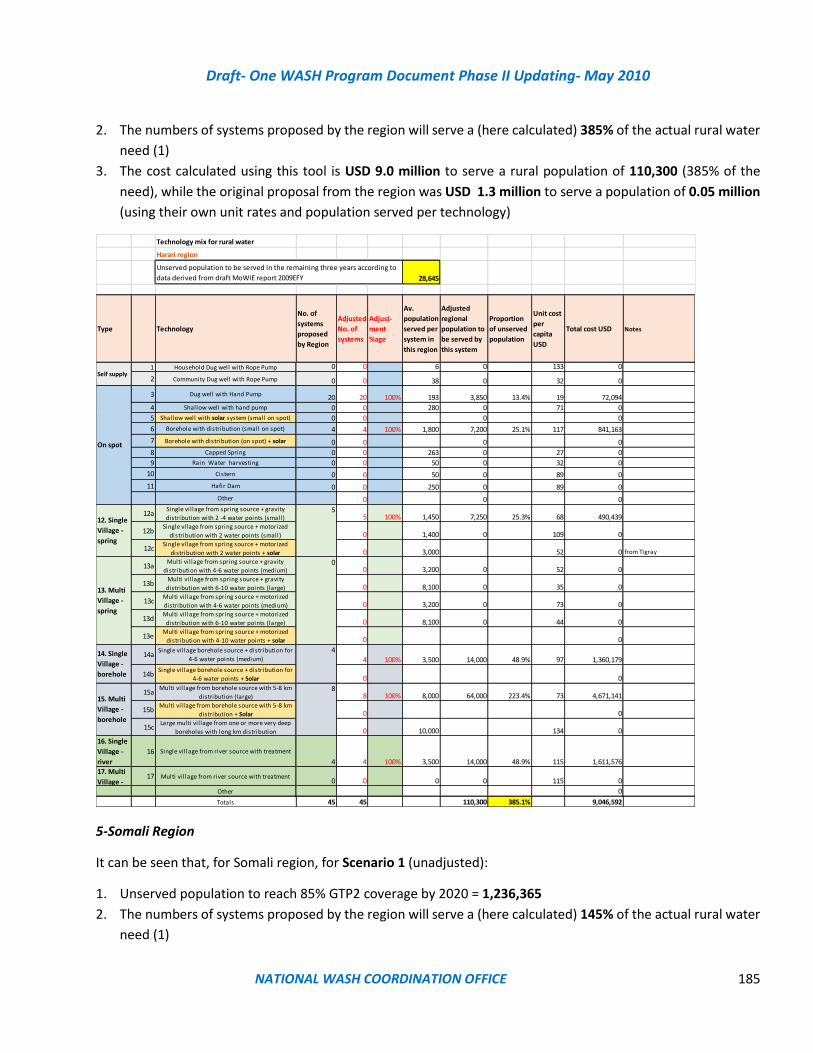
Draft- One WASH Program Document Phase II Updating- May 2010
NATIONAL WASH COORDINATION OFFICE 185
2. The numbers of systems proposed by the region will serve a (here calculated) 385% of the actual rural water
need (1)
3. The cost calculated using this tool is USD 9.0 million to serve a rural population of 110,300 (385% of the
need), while the original proposal from the region was USD 1.3 million to serve a population of 0.05 million
(using their own unit rates and population served per technology)
5-Somali Region
It can be seen that, for Somali region, for Scenario 1 (unadjusted):
1. Unserved population to reach 85% GTP2 coverage by 2020 = 1,236,365
2. The numbers of systems proposed by the region will serve a (here calculated) 145% of the actual rural water
need (1)
Technology mix for rural water
Harari region
28,645
Type Technology
No. of
systems
proposed
by Region
Adjusted
No. of
systems
Adjust-
ment
%age
Av.
population
served per
system in
this region
Adjusted
regional
population to
be served by
this system
Proportion
of unserved
population
Unit cost
per
capita
USD
Total cost USD Notes
1 Household Dug well with Rope Pump 0 0 6 0 133 0
2 Community Dug well with Rope Pump 0 0 38 0 32 0
3 Dug well with Hand Pump 20 20 100% 193 3,850 13.4% 19 72,094
4 Shallow well with hand pump 0 0 280 0 71 0
5 Shallow well with solar system (small on spot) 0 0 0 0
6 Borehole with distribution (small on spot) 4 4 100% 1,800 7,200 25.1% 117 841,163
7 Borehole with distribution (on spot) + solar 0 0 0 0
8 Capped Spring 0 0 263 0 27 0
9 Rain Water harvesting 0 0 50 0 32 0
10 Cistern 0 0 50 0 89 0
11 Hafir Dam 0 0 250 0 89 0
Other 0 0 0
12aSingle vil lage from spring source + gravity
distribution with 2 -4 water points (small) 5 100% 1,450 7,250 25.3% 68 490,439
12bSingle vllage from spring source + motorized
distribution with 2 water points (small) 0 1,400 0 109 0
12cSingle vllage from spring source + motorized
distribution with 2 water points + solar 0 3,000 52 0 from Tigray
13aMulti vil lage from spring source + gravity
distribution with 4-6 water points (medium) 0 3,200 0 52 0
13bMulti vil lage from spring source + gravity
distribution with 6-10 water points (large) 0 8,100 0 35 0
13cMulti vil lage from spring source + motorized
distribution with 4-6 water points (medium) 0 3,200 0 73 0
13dMulti vil lage from spring source + motorized
distribution with 6-10 water points (large) 0 8,100 0 44 0
13eMulti vil lage from spring source + motorized
distribution with 4-10 water points + solar 0 0
14aSingle vil lage borehole source + distribution for
4-6 water points (medium) 4 100% 3,500 14,000 48.9% 97 1,360,179
14bSingle vil lage borehole source + distribution for
4-6 water points + Solar 0 0
15aMulti vil lage from borehole source with 5-8 km
distribution (large) 8 100% 8,000 64,000 223.4% 73 4,671,141
15bMulti vil lage from borehole source with 5-8 km
distribution + Solar 0 0
15cLarge multi vil lage from one or more very deep
boreholes with long km distribution 0 10,000 134 0
16. Single
Village -
river
16 Single vil lage from river source with treatment
4 4 100% 3,500 14,000 48.9% 115 1,611,576
17. Multi
Village -17 Multi vil lage from river source with treatment
0 0 0 0 115 0
Other 0
Totals 45 45 110,300 385.1% 9,046,592
14. Single
Village -
borehole
4
15. Multi
Village -
borehole
8
Unserved population to be served in the remaining three years according to
data derived from draft MoWIE report 2009EFY
Self supply
On spot
12. Single
Village -
spring
5
13. Multi
Village -
spring
0
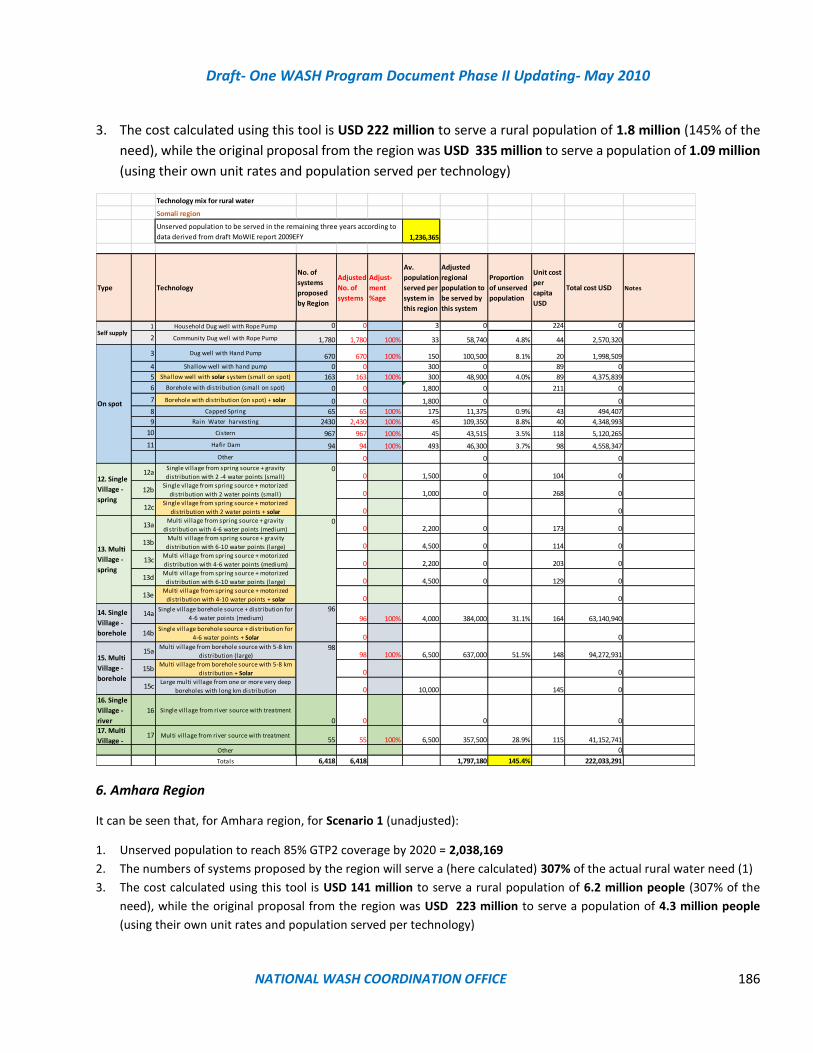
Draft- One WASH Program Document Phase II Updating- May 2010
NATIONAL WASH COORDINATION OFFICE 186
3. The cost calculated using this tool is USD 222 million to serve a rural population of 1.8 million (145% of the
need), while the original proposal from the region was USD 335 million to serve a population of 1.09 million
(using their own unit rates and population served per technology)
6. Amhara Region
It can be seen that, for Amhara region, for Scenario 1 (unadjusted):
1. Unserved population to reach 85% GTP2 coverage by 2020 = 2,038,169
2. The numbers of systems proposed by the region will serve a (here calculated) 307% of the actual rural water need (1)
3. The cost calculated using this tool is USD 141 million to serve a rural population of 6.2 million people (307% of the
need), while the original proposal from the region was USD 223 million to serve a population of 4.3 million people
(using their own unit rates and population served per technology)
Technology mix for rural water
Somali region
1,236,365
Type Technology
No. of
systems
proposed
by Region
Adjusted
No. of
systems
Adjust-
ment
%age
Av.
population
served per
system in
this region
Adjusted
regional
population to
be served by
this system
Proportion
of unserved
population
Unit cost
per
capita
USD
Total cost USD Notes
1 Household Dug well with Rope Pump 0 0 3 0 224 0
2 Community Dug well with Rope Pump 1,780 1,780 100% 33 58,740 4.8% 44 2,570,320
3 Dug well with Hand Pump 670 670 100% 150 100,500 8.1% 20 1,998,509
4 Shallow well with hand pump 0 0 300 0 89 0
5 Shallow well with solar system (small on spot) 163 163 100% 300 48,900 4.0% 89 4,375,839
6 Borehole with distribution (small on spot) 0 0 1,800 0 211 0
7 Borehole with distribution (on spot) + solar 0 0 1,800 0 0
8 Capped Spring 65 65 100% 175 11,375 0.9% 43 494,407
9 Rain Water harvesting 2430 2,430 100% 45 109,350 8.8% 40 4,348,993
10 Cistern 967 967 100% 45 43,515 3.5% 118 5,120,265
11 Hafir Dam 94 94 100% 493 46,300 3.7% 98 4,558,347
Other 0 0 0
12aSingle vil lage from spring source + gravity
distribution with 2 -4 water points (small) 0 1,500 0 104 0
12bSingle vllage from spring source + motorized
distribution with 2 water points (small) 0 1,000 0 268 0
12cSingle vllage from spring source + motorized
distribution with 2 water points + solar 0 0
13aMulti vil lage from spring source + gravity
distribution with 4-6 water points (medium) 0 2,200 0 173 0
13bMulti vil lage from spring source + gravity
distribution with 6-10 water points (large) 0 4,500 0 114 0
13cMulti vil lage from spring source + motorized
distribution with 4-6 water points (medium) 0 2,200 0 203 0
13dMulti vil lage from spring source + motorized
distribution with 6-10 water points (large) 0 4,500 0 129 0
13eMulti vil lage from spring source + motorized
distribution with 4-10 water points + solar 0 0
14aSingle vil lage borehole source + distribution for
4-6 water points (medium) 96 100% 4,000 384,000 31.1% 164 63,140,940
14bSingle vil lage borehole source + distribution for
4-6 water points + Solar 0 0
15aMulti vil lage from borehole source with 5-8 km
distribution (large) 98 100% 6,500 637,000 51.5% 148 94,272,931
15bMulti vil lage from borehole source with 5-8 km
distribution + Solar 0 0
15cLarge multi vil lage from one or more very deep
boreholes with long km distribution 0 10,000 145 0
16. Single
Village -
river
16 Single vil lage from river source with treatment
0 0 0 0
17. Multi
Village -17 Multi vil lage from river source with treatment
55 55 100% 6,500 357,500 28.9% 115 41,152,741
Other 0
Totals 6,418 6,418 1,797,180 145.4% 222,033,291
14. Single
Village -
borehole
96
15. Multi
Village -
borehole
98
Unserved population to be served in the remaining three years according to
data derived from draft MoWIE report 2009EFY
Self supply
On spot
12. Single
Village -
spring
0
13. Multi
Village -
spring
0
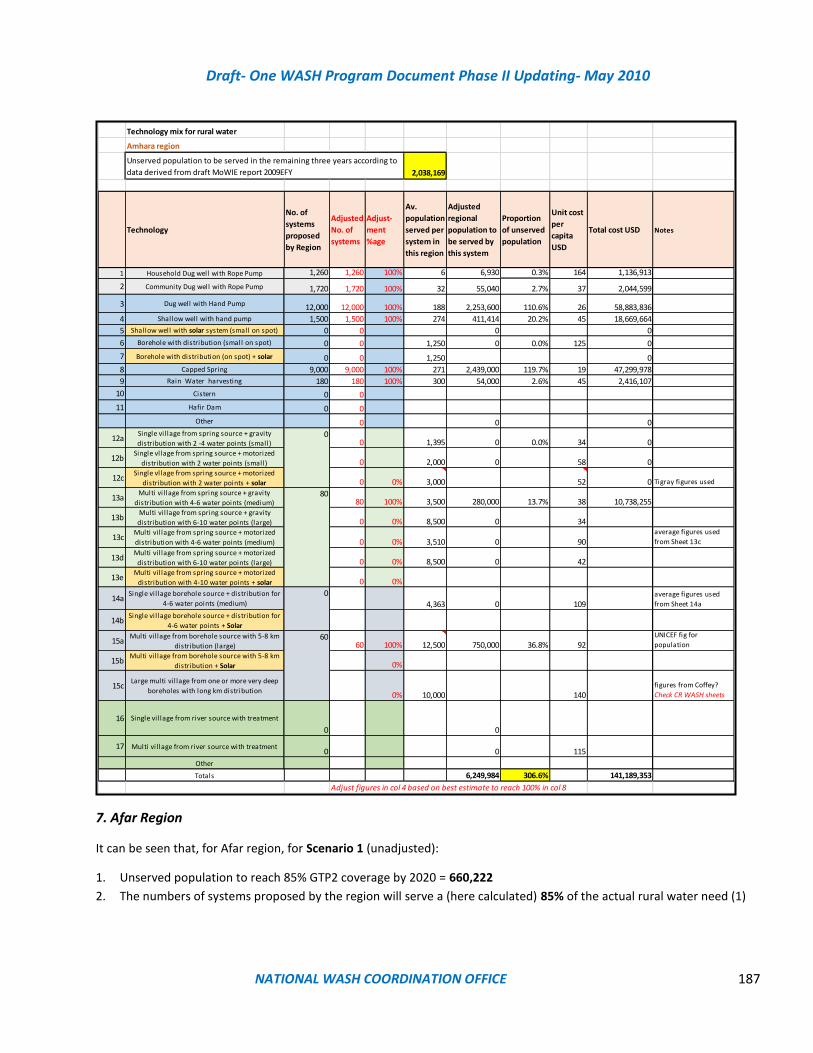
Draft- One WASH Program Document Phase II Updating- May 2010
NATIONAL WASH COORDINATION OFFICE 187
7. Afar Region
It can be seen that, for Afar region, for Scenario 1 (unadjusted):
1. Unserved population to reach 85% GTP2 coverage by 2020 = 660,222
2. The numbers of systems proposed by the region will serve a (here calculated) 85% of the actual rural water need (1)
Technology mix for rural water
Amhara region
2,038,169
Technology
No. of
systems
proposed
by Region
Adjusted
No. of
systems
Adjust-
ment
%age
Av.
population
served per
system in
this region
Adjusted
regional
population to
be served by
this system
Proportion
of unserved
population
Unit cost
per
capita
USD
Total cost USD Notes
1 Household Dug well with Rope Pump 1,260 1,260 100% 6 6,930 0.3% 164 1,136,913
2 Community Dug well with Rope Pump 1,720 1,720 100% 32 55,040 2.7% 37 2,044,599
3 Dug well with Hand Pump 12,000 12,000 100% 188 2,253,600 110.6% 26 58,883,836
4 Shallow well with hand pump 1,500 1,500 100% 274 411,414 20.2% 45 18,669,664
5 Shallow well with solar system (small on spot) 0 0 0 0
6 Borehole with distribution (small on spot) 0 0 1,250 0 0.0% 125 0
7 Borehole with distribution (on spot) + solar 0 0 1,250 0
8 Capped Spring 9,000 9,000 100% 271 2,439,000 119.7% 19 47,299,978
9 Rain Water harvesting 180 180 100% 300 54,000 2.6% 45 2,416,107
10 Cistern 0 0
11 Hafir Dam 0 0
Other 0 0 0
12aSingle vil lage from spring source + gravity
distribution with 2 -4 water points (small) 0 1,395 0 0.0% 34 0
12bSingle vllage from spring source + motorized
distribution with 2 water points (small) 0 2,000 0 58 0
12cSingle vllage from spring source + motorized
distribution with 2 water points + solar 0 0% 3,000 52 0 Tigray figures used
13aMulti vil lage from spring source + gravity
distribution with 4-6 water points (medium) 80 100% 3,500 280,000 13.7% 38 10,738,255
13bMulti vil lage from spring source + gravity
distribution with 6-10 water points (large) 0 0% 8,500 0 34
13cMulti vil lage from spring source + motorized
distribution with 4-6 water points (medium) 0 0% 3,510 0 90average figures used
from Sheet 13c
13dMulti vil lage from spring source + motorized
distribution with 6-10 water points (large) 0 0% 8,500 0 42
13eMulti vil lage from spring source + motorized
distribution with 4-10 water points + solar 0 0%
14aSingle vil lage borehole source + distribution for
4-6 water points (medium) 4,363 0 109average figures used
from Sheet 14a
14bSingle vil lage borehole source + distribution for
4-6 water points + Solar
15aMulti vil lage from borehole source with 5-8 km
distribution (large) 60 100% 12,500 750,000 36.8% 92UNICEF fig for
population
15bMulti vil lage from borehole source with 5-8 km
distribution + Solar 0%
15cLarge multi vil lage from one or more very deep
boreholes with long km distribution0% 10,000 140
figures from Coffey?
Check CR WASH sheets
16 Single vil lage from river source with treatment
0 0
17 Multi vil lage from river source with treatment0 0 115
Other
Totals 6,249,984 306.6% 141,189,353
Adjust figures in col 4 based on best estimate to reach 100% in col 8
Unserved population to be served in the remaining three years according to
data derived from draft MoWIE report 2009EFY
0
80
0
60
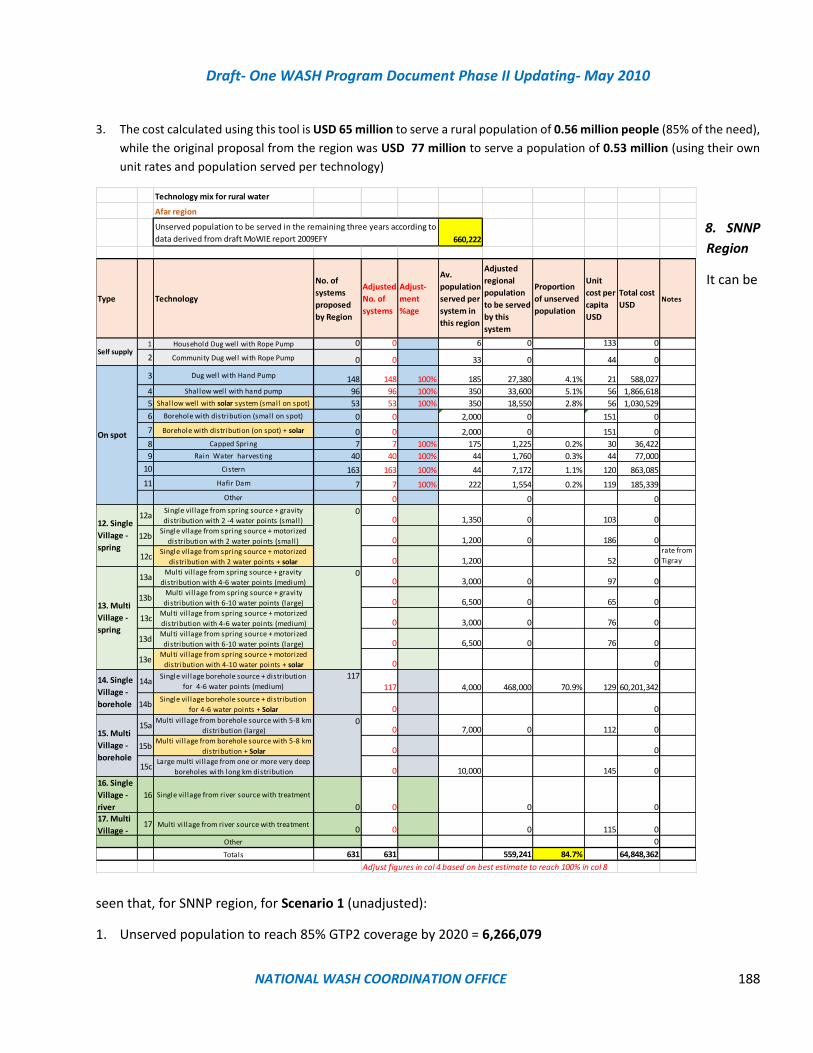
Draft- One WASH Program Document Phase II Updating- May 2010
NATIONAL WASH COORDINATION OFFICE 188
3. The cost calculated using this tool is USD 65 million to serve a rural population of 0.56 million people (85% of the need),
while the original proposal from the region was USD 77 million to serve a population of 0.53 million (using their own
unit rates and population served per technology)
8. SNNP
Region
It can be
seen that, for SNNP region, for Scenario 1 (unadjusted):
1. Unserved population to reach 85% GTP2 coverage by 2020 = 6,266,079
Technology mix for rural water
Afar region
660,222
Type Technology
No. of
systems
proposed
by Region
Adjusted
No. of
systems
Adjust-
ment
%age
Av.
population
served per
system in
this region
Adjusted
regional
population
to be served
by this
system
Proportion
of unserved
population
Unit
cost per
capita
USD
Total cost
USDNotes
1 Household Dug well with Rope Pump 0 0 6 0 133 0
2 Community Dug well with Rope Pump 0 0 33 0 44 0
3 Dug well with Hand Pump 148 148 100% 185 27,380 4.1% 21 588,027
4 Shallow well with hand pump 96 96 100% 350 33,600 5.1% 56 1,866,618
5 Shallow well with solar system (small on spot) 53 53 100% 350 18,550 2.8% 56 1,030,529
6 Borehole with distribution (small on spot) 0 0 2,000 0 151 0
7 Borehole with distribution (on spot) + solar 0 0 2,000 0 151 0
8 Capped Spring 7 7 100% 175 1,225 0.2% 30 36,422
9 Rain Water harvesting 40 40 100% 44 1,760 0.3% 44 77,000
10 Cistern 163 163 100% 44 7,172 1.1% 120 863,085
11 Hafir Dam 7 7 100% 222 1,554 0.2% 119 185,339
Other 0 0 0
12aSingle vil lage from spring source + gravity
distribution with 2 -4 water points (small) 0 1,350 0 103 0
12bSingle vllage from spring source + motorized
distribution with 2 water points (small) 0 1,200 0 186 0
12cSingle vllage from spring source + motorized
distribution with 2 water points + solar 0 1,200 52 0rate from
Tigray
13aMulti vil lage from spring source + gravity
distribution with 4-6 water points (medium) 0 3,000 0 97 0
13bMulti vil lage from spring source + gravity
distribution with 6-10 water points (large) 0 6,500 0 65 0
13cMulti vil lage from spring source + motorized
distribution with 4-6 water points (medium) 0 3,000 0 76 0
13dMulti vil lage from spring source + motorized
distribution with 6-10 water points (large) 0 6,500 0 76 0
13eMulti vil lage from spring source + motorized
distribution with 4-10 water points + solar 0 0
14aSingle vil lage borehole source + distribution
for 4-6 water points (medium) 117 4,000 468,000 70.9% 129 60,201,342
14bSingle vil lage borehole source + distribution
for 4-6 water points + Solar 0 0
15aMulti vil lage from borehole source with 5-8 km
distribution (large) 0 7,000 0 112 0
15bMulti vil lage from borehole source with 5-8 km
distribution + Solar 0 0
15cLarge multi vil lage from one or more very deep
boreholes with long km distribution 0 10,000 145 0
16. Single
Village -
river
16 Single vil lage from river source with treatment
0 0 0 0
17. Multi
Village -17 Multi vil lage from river source with treatment
0 0 0 115 0
Other 0
Totals 631 631 559,241 84.7% 64,848,362
Adjust figures in col 4 based on best estimate to reach 100% in col 8
14. Single
Village -
borehole
117
15. Multi
Village -
borehole
0
Unserved population to be served in the remaining three years according to
data derived from draft MoWIE report 2009EFY
Self supply
On spot
12. Single
Village -
spring
0
13. Multi
Village -
spring
0
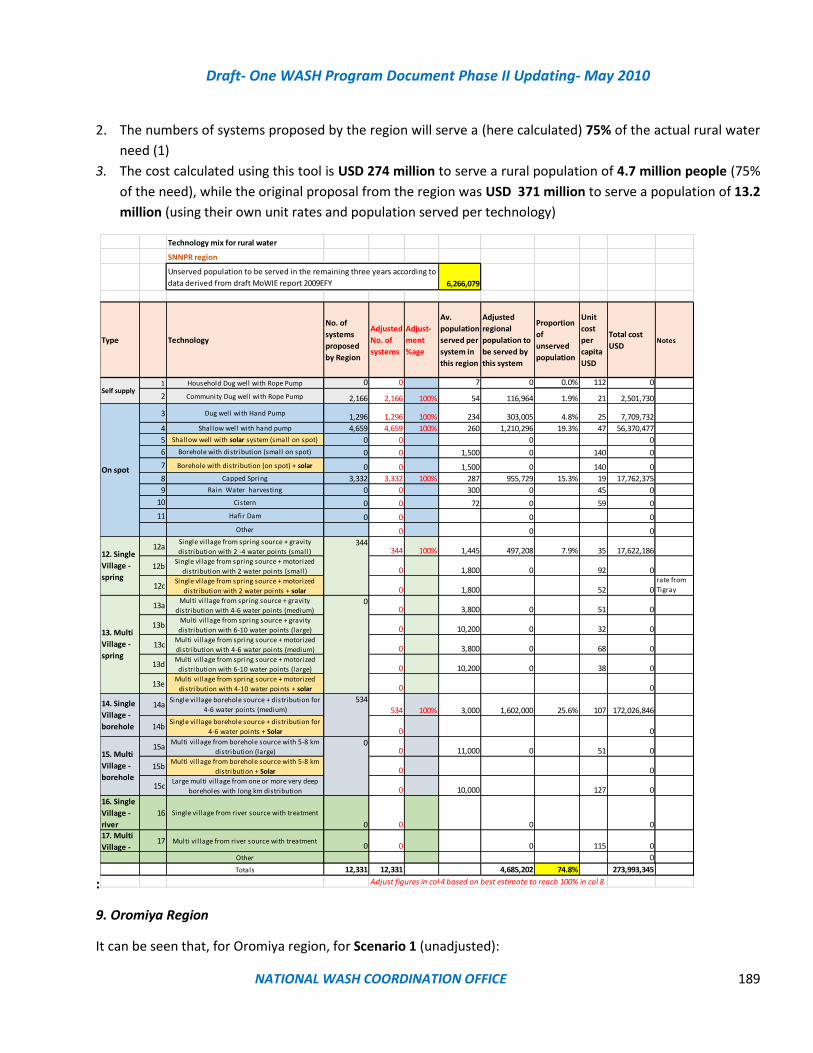
Draft- One WASH Program Document Phase II Updating- May 2010
NATIONAL WASH COORDINATION OFFICE 189
2. The numbers of systems proposed by the region will serve a (here calculated) 75% of the actual rural water
need (1)
3. The cost calculated using this tool is USD 274 million to serve a rural population of 4.7 million people (75%
of the need), while the original proposal from the region was USD 371 million to serve a population of 13.2
million (using their own unit rates and population served per technology)
:
9. Oromiya Region
It can be seen that, for Oromiya region, for Scenario 1 (unadjusted):
Technology mix for rural water
SNNPR region
6,266,079
Type Technology
No. of
systems
proposed
by Region
Adjusted
No. of
systems
Adjust-
ment
%age
Av.
population
served per
system in
this region
Adjusted
regional
population to
be served by
this system
Proportion
of
unserved
population
Unit
cost
per
capita
USD
Total cost
USDNotes
1 Household Dug well with Rope Pump 0 0 7 0 0.0% 112 0
2 Community Dug well with Rope Pump 2,166 2,166 100% 54 116,964 1.9% 21 2,501,730
3 Dug well with Hand Pump 1,296 1,296 100% 234 303,005 4.8% 25 7,709,732
4 Shallow well with hand pump 4,659 4,659 100% 260 1,210,296 19.3% 47 56,370,477
5 Shallow well with solar system (small on spot) 0 0 0 0
6 Borehole with distribution (small on spot) 0 0 1,500 0 140 0
7 Borehole with distribution (on spot) + solar 0 0 1,500 0 140 0
8 Capped Spring 3,332 3,332 100% 287 955,729 15.3% 19 17,762,375
9 Rain Water harvesting 0 0 300 0 45 0
10 Cistern 0 0 72 0 59 0
11 Hafir Dam 0 0 0 0
Other 0 0 0
12aSingle vil lage from spring source + gravity
distribution with 2 -4 water points (small) 344 100% 1,445 497,208 7.9% 35 17,622,186
12bSingle vllage from spring source + motorized
distribution with 2 water points (small) 0 1,800 0 92 0
12cSingle vllage from spring source + motorized
distribution with 2 water points + solar 0 1,800 52 0rate from
Tigray
13aMulti vil lage from spring source + gravity
distribution with 4-6 water points (medium) 0 3,800 0 51 0
13bMulti vil lage from spring source + gravity
distribution with 6-10 water points (large) 0 10,200 0 32 0
13cMulti vil lage from spring source + motorized
distribution with 4-6 water points (medium) 0 3,800 0 68 0
13dMulti vil lage from spring source + motorized
distribution with 6-10 water points (large) 0 10,200 0 38 0
13eMulti vil lage from spring source + motorized
distribution with 4-10 water points + solar 0 0
14aSingle vil lage borehole source + distribution for
4-6 water points (medium) 534 100% 3,000 1,602,000 25.6% 107 172,026,846
14bSingle vil lage borehole source + distribution for
4-6 water points + Solar 0 0
15aMulti vil lage from borehole source with 5-8 km
distribution (large) 0 11,000 0 51 0
15bMulti vil lage from borehole source with 5-8 km
distribution + Solar 0 0
15cLarge multi vil lage from one or more very deep
boreholes with long km distribution 0 10,000 127 0
16. Single
Village -
river
16 Single vil lage from river source with treatment
0 0 0 0
17. Multi
Village -17 Multi vil lage from river source with treatment
0 0 0 115 0
Other 0
Totals 12,331 12,331 4,685,202 74.8% 273,993,345
Adjust figures in col 4 based on best estimate to reach 100% in col 8
14. Single
Village -
borehole
534
15. Multi
Village -
borehole
0
Unserved population to be served in the remaining three years according to
data derived from draft MoWIE report 2009EFY
Self supply
On spot
12. Single
Village -
spring
344
13. Multi
Village -
spring
0

Draft- One WASH Program Document Phase II Updating- May 2010
NATIONAL WASH COORDINATION OFFICE 190
1. Unserved population to reach 85% GTP2 coverage by 2020 = 9,076,728
2. The numbers of systems proposed by the region will serve a (here calculated) 57% of the actual rural
water need (1)
3. The cost calculated using this tool is USD 295 million to serve a rural population of 5.1 million people
(57% of the need), while the original proposal from the region was USD 254million to serve a population
of 4.6 million people (using their own unit rates and population served per technology)
10. Dire Dawa Region
It can be seen that, for Dire Dawa region, for Scenario 1 (unadjusted):
Technology mix for rural water
Oromia region
9,076,728
Type Technology
No. of
systems
proposed
by Region
Adjusted
No. of
systems
Adjust-
ment
%age
Av.
population
served per
system in
this region
Adjusted
regional
population to
be served by
this system
Proportion
of
unserved
population
Unit cost
per
capita
USD
Total cost
USDNotes
1 Household Dug well with Rope Pump 0 0 7 0 112 0
2 Community Dug well with Rope Pump 0 0 54 0 21 0
3 Dug well with Hand Pump 5,875 5,875 100% 166 972,900 10.7% 23 22,372,502
4 Shallow well with hand pump 1,461 1,461 100% 217 316,953 3.5% 41 13,034,585
5 Shallow well with solar system (small on spot) 0 0 0 0
6 Borehole with distribution (small on spot) 0 0 1,500 0 134 0
7 Borehole with distribution (on spot) + solar 0 0 1,500 0 134 0
8 Capped Spring 4,827 4,827 100% 256 1,236,402 13.6% 20 24,881,648
9 Rain Water harvesting 0 0 72 0 21 0
10 Cistern 0 0 72 0 90 0
11 Hafir Dam 0 0 359 0 59 0
Other 0 0 0 0
12aSingle vil lage from spring source + gravity
distribution with 2 -4 water points (small) 372 100% 1,479 550,079 6.1% 35 19,181,856
12bSingle vllage from spring source + motorized
distribution with 2 water points (small) 0 2,000 0 81 0
12cSingle vllage from spring source + motorized
distribution with 2 water points + solar 0 2,000 52 0Unit rate from
Tigray
13aMulti vil lage from spring source + gravity
distribution with 4-6 water points (medium) 0 4,200 0 0.0% 44 0
13bMulti vil lage from spring source + gravity
distribution with 6-10 water points (large) 0 11,000 0 31 0
13cMulti vil lage from spring source + motorized
distribution with 4-6 water points (medium) 0 4,200 0 60 0
13dMulti vil lage from spring source + motorized
distribution with 6-10 water points (large) 0 11,000 0 35 0
13eMulti vil lage from spring source + motorized
distribution with 4-10 water points + solar 0 0
14aSingle vil lage borehole source + distribution for
4-6 water points (medium) 687 100% 3,000 2,061,000 22.7% 104 215,167,785
14bSingle vil lage borehole source + distribution for
4-6 water points + Solar 0 0
15aMulti vil lage from borehole source with 5-8 km
distribution (large) 0 10,500 0 52 0
15bMulti vil lage from borehole source with 5-8 km
distribution + Solar 0 0
15cLarge multi vil lage from one or more very deep
boreholes with long km distribution 0 10,000 127 0
16. Single
Village -
river
16 Single vil lage from river source with treatment
0 0 0 0
17. Multi
Village -17 Multi vil lage from river source with treatment
0 0 0 115 0
Other 0
Totals 13,222 13,222 5,137,333 56.6% 294,638,377
Adjust figures in col 4 based on best estimate to reach 100% in col 8
14. Single
Village -
borehole
687
15. Multi
Village -
borehole
0
Unserved population to be served in the remaining three years according
to data derived from draft MoWIE report 2009EFY
Self supply
On spot
12. Single
Village -
spring
372
13. Multi
Village -
spring
0
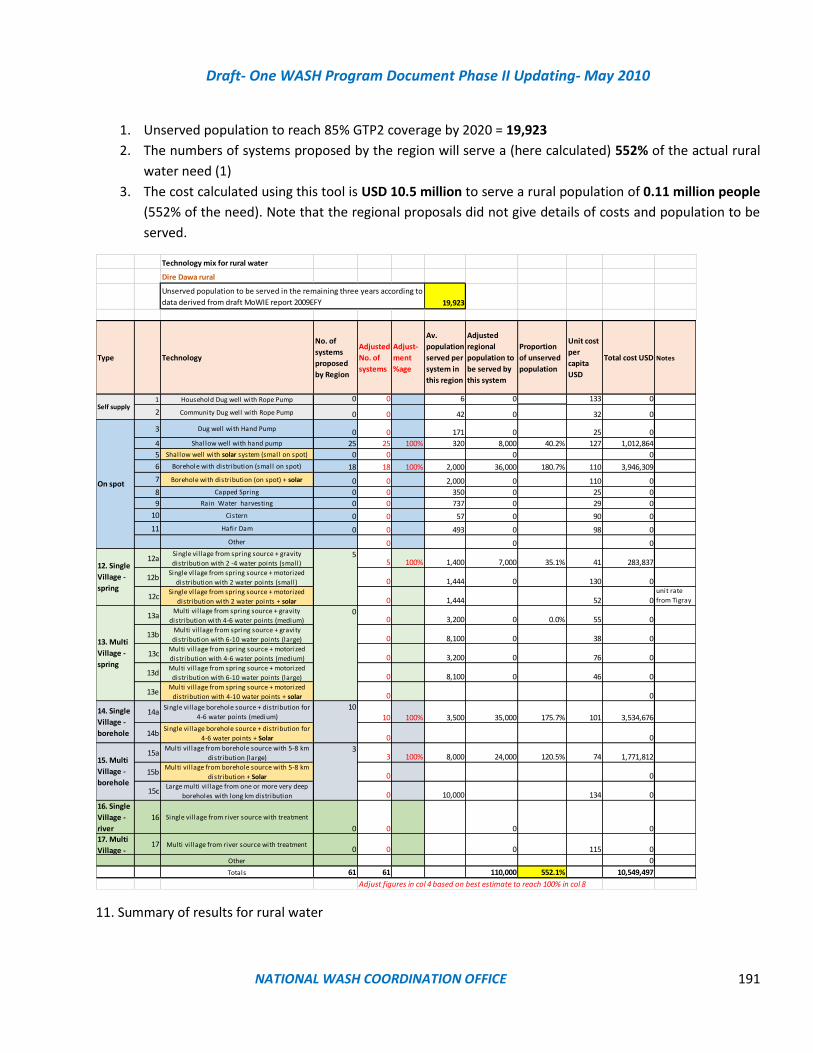
Draft- One WASH Program Document Phase II Updating- May 2010
NATIONAL WASH COORDINATION OFFICE 191
1. Unserved population to reach 85% GTP2 coverage by 2020 = 19,923
2. The numbers of systems proposed by the region will serve a (here calculated) 552% of the actual rural
water need (1)
3. The cost calculated using this tool is USD 10.5 million to serve a rural population of 0.11 million people
(552% of the need). Note that the regional proposals did not give details of costs and population to be
served.
11. Summary of results for rural water
Technology mix for rural water
Dire Dawa rural
19,923
Type Technology
No. of
systems
proposed
by Region
Adjusted
No. of
systems
Adjust-
ment
%age
Av.
population
served per
system in
this region
Adjusted
regional
population to
be served by
this system
Proportion
of unserved
population
Unit cost
per
capita
USD
Total cost USD Notes
1 Household Dug well with Rope Pump 0 0 6 0 133 0
2 Community Dug well with Rope Pump 0 0 42 0 32 0
3 Dug well with Hand Pump 0 0 171 0 25 0
4 Shallow well with hand pump 25 25 100% 320 8,000 40.2% 127 1,012,864
5 Shallow well with solar system (small on spot) 0 0 0 0
6 Borehole with distribution (small on spot) 18 18 100% 2,000 36,000 180.7% 110 3,946,309
7 Borehole with distribution (on spot) + solar 0 0 2,000 0 110 0
8 Capped Spring 0 0 350 0 25 0
9 Rain Water harvesting 0 0 737 0 29 0
10 Cistern 0 0 57 0 90 0
11 Hafir Dam 0 0 493 0 98 0
Other 0 0 0
12aSingle vil lage from spring source + gravity
distribution with 2 -4 water points (small) 5 100% 1,400 7,000 35.1% 41 283,837
12bSingle vllage from spring source + motorized
distribution with 2 water points (small) 0 1,444 0 130 0
12cSingle vllage from spring source + motorized
distribution with 2 water points + solar 0 1,444 52 0unit rate
from Tigray
13aMulti vil lage from spring source + gravity
distribution with 4-6 water points (medium) 0 3,200 0 0.0% 55 0
13bMulti vil lage from spring source + gravity
distribution with 6-10 water points (large) 0 8,100 0 38 0
13cMulti vil lage from spring source + motorized
distribution with 4-6 water points (medium) 0 3,200 0 76 0
13dMulti vil lage from spring source + motorized
distribution with 6-10 water points (large) 0 8,100 0 46 0
13eMulti vil lage from spring source + motorized
distribution with 4-10 water points + solar 0 0
14aSingle vil lage borehole source + distribution for
4-6 water points (medium) 10 100% 3,500 35,000 175.7% 101 3,534,676
14bSingle vil lage borehole source + distribution for
4-6 water points + Solar 0 0
15aMulti vil lage from borehole source with 5-8 km
distribution (large) 3 100% 8,000 24,000 120.5% 74 1,771,812
15bMulti vil lage from borehole source with 5-8 km
distribution + Solar 0 0
15cLarge multi vil lage from one or more very deep
boreholes with long km distribution 0 10,000 134 0
16. Single
Village -
river
16 Single vil lage from river source with treatment
0 0 0 0
17. Multi
Village -17 Multi vil lage from river source with treatment
0 0 0 115 0
Other 0
Totals 61 61 110,000 552.1% 10,549,497
Adjust figures in col 4 based on best estimate to reach 100% in col 8
14. Single
Village -
borehole
10
15. Multi
Village -
borehole
3
Unserved population to be served in the remaining three years according to
data derived from draft MoWIE report 2009EFY
Self supply
On spot
12. Single
Village -
spring
5
13. Multi
Village -
spring
0
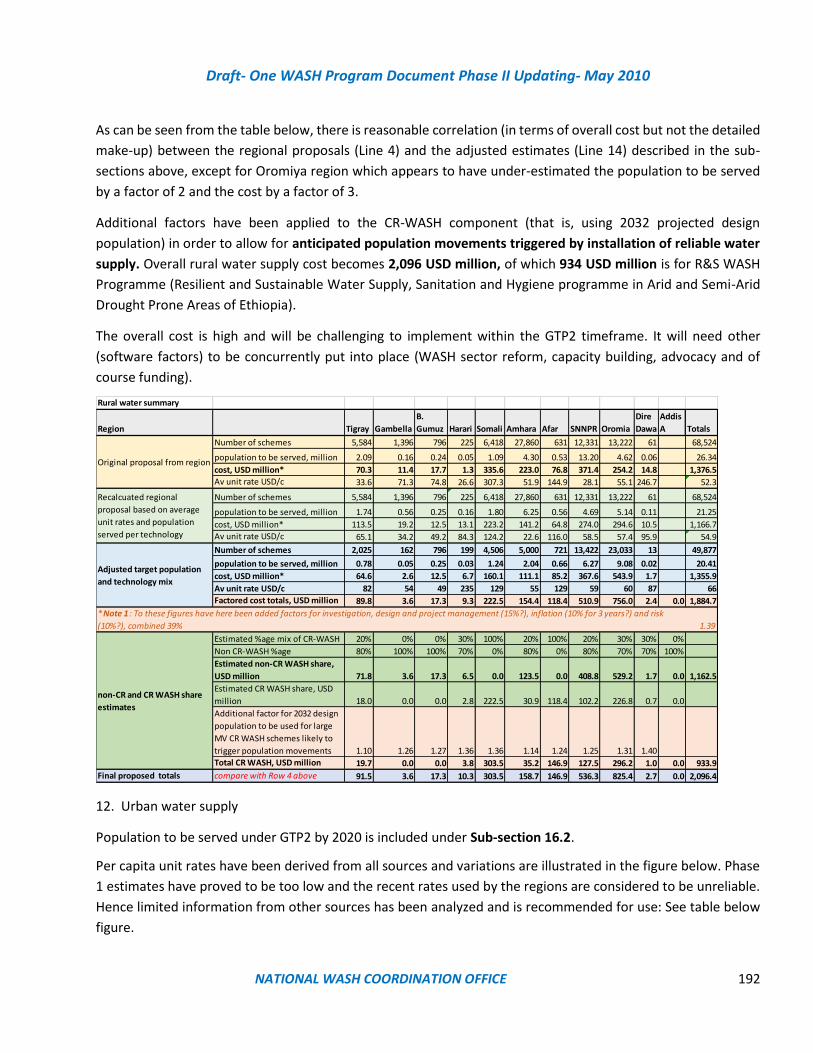
Draft- One WASH Program Document Phase II Updating- May 2010
NATIONAL WASH COORDINATION OFFICE 192
As can be seen from the table below, there is reasonable correlation (in terms of overall cost but not the detailed
make-up) between the regional proposals (Line 4) and the adjusted estimates (Line 14) described in the sub-
sections above, except for Oromiya region which appears to have under-estimated the population to be served
by a factor of 2 and the cost by a factor of 3.
Additional factors have been applied to the CR-WASH component (that is, using 2032 projected design
population) in order to allow for anticipated population movements triggered by installation of reliable water
supply. Overall rural water supply cost becomes 2,096 USD million, of which 934 USD million is for R&S WASH
Programme (Resilient and Sustainable Water Supply, Sanitation and Hygiene programme in Arid and Semi-Arid
Drought Prone Areas of Ethiopia).
The overall cost is high and will be challenging to implement within the GTP2 timeframe. It will need other
(software factors) to be concurrently put into place (WASH sector reform, capacity building, advocacy and of
course funding).
12. Urban water supply
Population to be served under GTP2 by 2020 is included under Sub-section 16.2.
Per capita unit rates have been derived from all sources and variations are illustrated in the figure below. Phase
1 estimates have proved to be too low and the recent rates used by the regions are considered to be unreliable.
Hence limited information from other sources has been analyzed and is recommended for use: See table below
figure.
Rural water summary
Region Tigray Gambella
B.
Gumuz Harari Somali Amhara Afar SNNPR Oromia
Dire
Dawa
Addis
A Totals
Number of schemes 5,584 1,396 796 225 6,418 27,860 631 12,331 13,222 61 68,524
population to be served, million 2.09 0.16 0.24 0.05 1.09 4.30 0.53 13.20 4.62 0.06 26.34
cost, USD million* 70.3 11.4 17.7 1.3 335.6 223.0 76.8 371.4 254.2 14.8 1,376.5
Av unit rate USD/c 33.6 71.3 74.8 26.6 307.3 51.9 144.9 28.1 55.1 246.7 52.3
Number of schemes 5,584 1,396 796 225 6,418 27,860 631 12,331 13,222 61 68,524
population to be served, million 1.74 0.56 0.25 0.16 1.80 6.25 0.56 4.69 5.14 0.11 21.25
cost, USD million* 113.5 19.2 12.5 13.1 223.2 141.2 64.8 274.0 294.6 10.5 1,166.7
Av unit rate USD/c 65.1 34.2 49.2 84.3 124.2 22.6 116.0 58.5 57.4 95.9 54.9
Number of schemes 2,025 162 796 199 4,506 5,000 721 13,422 23,033 13 49,877
population to be served, million 0.78 0.05 0.25 0.03 1.24 2.04 0.66 6.27 9.08 0.02 20.41
cost, USD million* 64.6 2.6 12.5 6.7 160.1 111.1 85.2 367.6 543.9 1.7 1,355.9
Av unit rate USD/c 82 54 49 235 129 55 129 59 60 87 66
Factored cost totals, USD million 89.8 3.6 17.3 9.3 222.5 154.4 118.4 510.9 756.0 2.4 0.0 1,884.7
1.39
Estimated %age mix of CR-WASH 20% 0% 0% 30% 100% 20% 100% 20% 30% 30% 0%
Non CR-WASH %age 80% 100% 100% 70% 0% 80% 0% 80% 70% 70% 100%
Estimated non-CR WASH share,
USD million 71.8 3.6 17.3 6.5 0.0 123.5 0.0 408.8 529.2 1.7 0.0 1,162.5
Estimated CR WASH share, USD
million 18.0 0.0 0.0 2.8 222.5 30.9 118.4 102.2 226.8 0.7 0.0
Additional factor for 2032 design
population to be used for large
MV CR WASH schemes likely to
trigger population movements 1.10 1.26 1.27 1.36 1.36 1.14 1.24 1.25 1.31 1.40
Total CR WASH, USD million 19.7 0.0 0.0 3.8 303.5 35.2 146.9 127.5 296.2 1.0 0.0 933.9
Final proposed totals compare with Row 4 above 91.5 3.6 17.3 10.3 303.5 158.7 146.9 536.3 825.4 2.7 0.0 2,096.4
Original proposal from region
Recalcuated regional
proposal based on average
unit rates and population
served per technology
Adjusted target population
and technology mix
*Note 1 : To these figures have here been added factors for investigation, design and project management (15%?), inflation (10% for 3 years?) and risk
(10%?), combined 39%
non-CR and CR WASH share
estimates
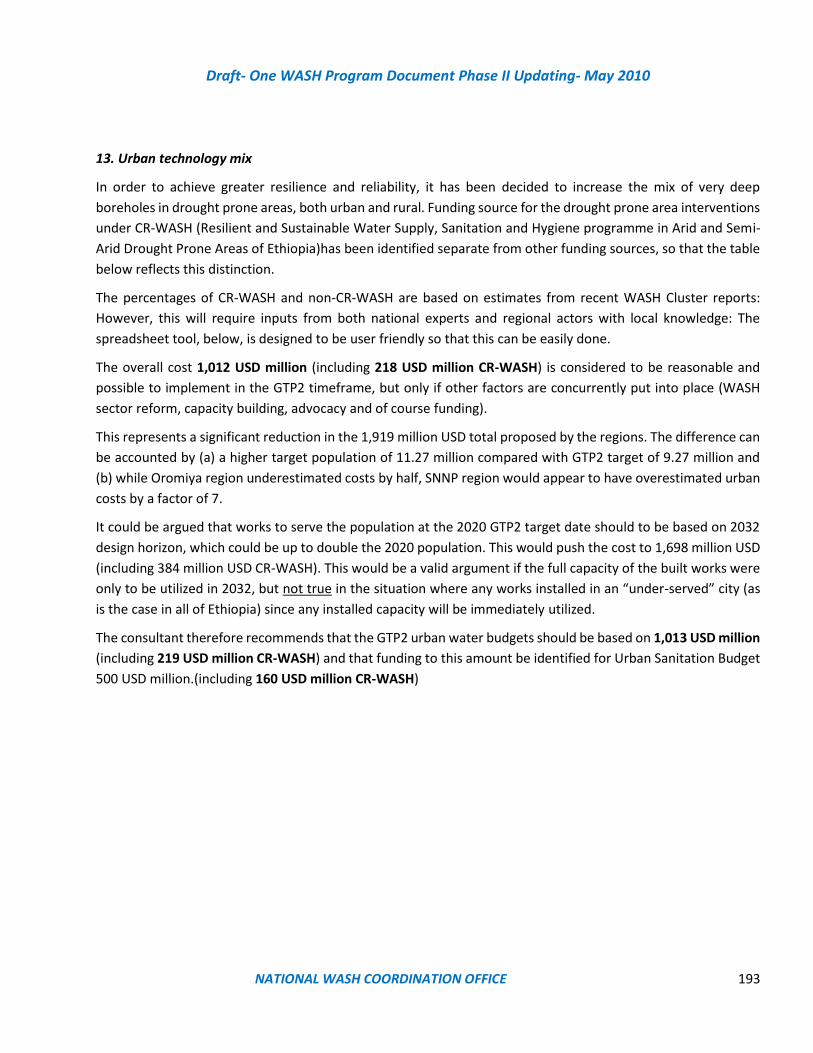
Draft- One WASH Program Document Phase II Updating- May 2010
NATIONAL WASH COORDINATION OFFICE 193
13. Urban technology mix
In order to achieve greater resilience and reliability, it has been decided to increase the mix of very deep
boreholes in drought prone areas, both urban and rural. Funding source for the drought prone area interventions
under CR-WASH (Resilient and Sustainable Water Supply, Sanitation and Hygiene programme in Arid and Semi-
Arid Drought Prone Areas of Ethiopia)has been identified separate from other funding sources, so that the table
below reflects this distinction.
The percentages of CR-WASH and non-CR-WASH are based on estimates from recent WASH Cluster reports:
However, this will require inputs from both national experts and regional actors with local knowledge: The
spreadsheet tool, below, is designed to be user friendly so that this can be easily done.
The overall cost 1,012 USD million (including 218 USD million CR-WASH) is considered to be reasonable and
possible to implement in the GTP2 timeframe, but only if other factors are concurrently put into place (WASH
sector reform, capacity building, advocacy and of course funding).
This represents a significant reduction in the 1,919 million USD total proposed by the regions. The difference can
be accounted by (a) a higher target population of 11.27 million compared with GTP2 target of 9.27 million and
(b) while Oromiya region underestimated costs by half, SNNP region would appear to have overestimated urban
costs by a factor of 7.
It could be argued that works to serve the population at the 2020 GTP2 target date should to be based on 2032
design horizon, which could be up to double the 2020 population. This would push the cost to 1,698 million USD
(including 384 million USD CR-WASH). This would be a valid argument if the full capacity of the built works were
only to be utilized in 2032, but not true in the situation where any works installed in an “under-served” city (as
is the case in all of Ethiopia) since any installed capacity will be immediately utilized.
The consultant therefore recommends that the GTP2 urban water budgets should be based on 1,013 USD million
(including 219 USD million CR-WASH) and that funding to this amount be identified for Urban Sanitation Budget
500 USD million.(including 160 USD million CR-WASH)

Draft- One WASH Program Document Phase II Updating- May 2010
NATIONAL WASH COORDINATION OFFICE 194
1 Urban water costs to meet GTP2, USD million
2
Note : These rates are based on design population, assumed
to be that projected for 2032 Oromia Amhara Tigray SNNP Somali
B
Gumuz Afar Gambela Harari
Dire
Dawa
Addis
Ababa
3 Unit rates from CR-WASH, USD/c 127 127 133 127 145 145 134 134 134
4 Recommended for use for non CR-WASH, USD/c 95 95 99 96 117 101 109 101 96 98 47
5 Unserved population to be served by 2020, million 1.88 0.71 0.43 1.20 0.15 0.09 0.14 0.07 0.15 0.08 4.36 9.27
6 Estimated %age mix of CR-WASH to 2020, from latest 30% 20% 20% 20% 100% 0% 100% 0% 30% 30% 0% 32%
7 Non CR-WASH %age 70% 80% 80% 80% 0% 100% 0% 100% 70% 70% 100%
8 Cost, USD million = Row 5 x (Row 3 x Row 6 + Row 4 x Row 7) 197.1 72.0 45.8 122.3 21.7 9.5 20.9 7.4 16.1 8.5 206.8 728.2
9 1.39
10 Totals 274.3 100.1 63.8 170.2 30.2 13.3 29.0 10.3 22.4 11.8 287.8 1,013.2
11 CR-WASH, USD million, without design factor 82.3 20.0 12.8 34.0 30.2 0.0 29.0 0.0 6.7 3.5 0.0 218.612 non-CR-WASH, USD million, without design factor 192.0 80.1 51.0 136.2 0.0 13.3 0.0 10.3 15.7 8.3 287.8 794.6
13
Factor to allow for use of 2032 design population compared
with GTP2 2020 population for calculating costs 1.76 1.92 1.85 1.90 1.46 2.19 1.85 2.03 1.44 1.40 1.33
14 Totals with design factors USD million 483.3 192.5 118.2 323.4 44.0 29.1 53.8 20.8 32.4 16.5 384.1 1,698.0
15 CR-WASH, USD million, with design factor 145.0 38.5 23.6 64.7 44.0 0.0 53.8 0.0 9.7 5.0 0.0 384.2
16 non-CR-WASH, USD million, with design factor 338.3 154.0 94.6 258.7 0.0 29.1 0.0 20.8 22.6 11.6 384.1 1,313.8
17
Original regional proposal unserved population to be
served by 2020, million 1.71 1.24 0.79 2.61 0.24 0.11 0.11 0.08 0.00 0.01 4.36 11.27
18 Regional proposal, USD million 142.5 106.8 55.2 1242.2 57.0 16.5 39.1 50.3 0.0 2.7 206.8 1919.2
19 Unit rate from regional proposal, USD/c 83 86 70 475 241 144 342 625 300 47
Region
Note : To all these figures must be added factors for investigation, design and project management (15%), inflation (10% for 3 years) and risk (10%), combined
39%.
Total
Draft- One WASH Program Document Phase II Updating- May 2010
NATIONAL WASH COORDINATION OFFICE 195
Annex 2 Scenario-II

Draft- One WASH Program Document Phase II Updating- May 2010
NATIONAL WASH COORDINATION OFFICE 196
Table 1 Rural Water Supply: Tigray Water Supply Beneficiaries and Annual Physical and Financial Plan (208-2020)
783,642
2018 2019 2020 2018 2019 2020
1 Household Dug well with Rope Pump 924 300 45 20 8 32% 7 2,100 0.3% 112 234,899 35,235 15,856 6,342
2 Community Dug well with Rope Pump 0 300 45 20 8 10 3,000 0.4% 78 234,899 35,235 15,856 6,342
3 Dug well with Hand Pump 837 300 45 20 8 36% 171 51,300 6.5% 27 1,372,287 205,843 92,629 37,052
4 Shallow well with hand pump 2,557 200 30 14 5 8% 237 47,300 6.0% 44 2,099,717 314,958 141,731 56,692
5 Shallow well with solar system (small on spot) 0 200 30 14 5 237 47,300 6.0% 44 2,099,717 314,958 141,731 56,692
6 Borehole with distribution (small on spot) 80 40 6 3 1 50% 1,250 50,000 6.4% 125 6,263,982 939,597 422,819 169,128
7 Borehole with distribution (on spot) + solar 0 40 6 3 1 1,250 50,000 6.4% 125 6,263,982 939,597 422,819 169,128
8 Capped Spring 414 200 30 14 5 48% 253 50,600 6.5% 21 1,049,229 157,384 70,823 28,329
9 Rain Water harvesting 0 0 0 0 0 300 0 45 0 0 0 0
10 Cistern 180 180 27 12 5 150 27,000 45 1,208,054 181,208 81,544 32,617
11 Hafir Dam 180 180 27 12 5 0 0 0 0 0
Other 0 0 0 0 0 0 0 0 0
12aSingle vil lage from spring source + gravity
distribution with 2 -4 water points (small) 0 0 0 0 1,650 0 0.0% 39 0 0 0 0
12bSingle vllage from spring source + motorized
distribution with 2 water points (small) 10 2 1 0 1,450 14,500 1.9% 75 1,089,778 163,467 73,560 29,424
12cSingle vllage from spring source + motorized
distribution with 2 water points + solar 5 1 0 0 3,000 15,000 1.9% 52 782,998 117,450 52,852 21,141
13aMulti vil lage from spring source + gravity
distribution with 4-6 water points (medium) 0 0 0 0 3,000 0 0.0% 79 0 0 0 0
13bMulti vil lage from spring source + gravity
distribution with 6-10 water points (large) 0 0 0 0 8,100 0 39 0 0 0 0
13cMulti vil lage from spring source + motorized
distribution with 4-6 water points (medium) 0 0 0 0 5,500 0 54 0 0 0 0
13dMulti vil lage from spring source + motorized
distribution with 6-10 water points (large) 0 0 0 0 8,100 0 47 0 0 0 0
13eMulti vil lage from spring source + motorized
distribution with 4-10 water points + solar 0 0 0 0 0 0 0 0 0
14aSingle vil lage borehole source + distribution for
4-6 water points (medium) 40 6 3 1 44% 6,500 260,000 33.2% 88 22,968,619 3,445,293 1,550,382 620,153
14bSingle vil lage borehole source + distribution for
4-6 water points + Solar 10 2 1 0 11% 6,500 65,000 8.3% 88 5,742,155 861,323 387,595 155,038
15aMulti vil lage from borehole source with 5-8 km
distribution (large) 18 3 1 0 82% 7,799 140,376 17.9% 84 11,855,938 1,778,391 800,276 320,110
15bMulti vil lage from borehole source with 5-8 km
distribution + Solar 2 0 0 0 9% 7,799 15,597 2.0% 84 1,317,326 197,599 88,920 35,568
15cLarge multi vil lage from one or more very deep
boreholes with long km distribution 0 0 0 0 0% 10,000 0 133 0 0 0 0
16. Single
Village -
river
16 Single vil lage from river source with treatment
60 0 0 0 0 0 0 0 0 0
17. Multi
Village -17 Multi vil lage from river source with treatment
60 0 0 0 0 0 118 0 0 0 0
Other 0 0 0 0 0 0 0
Totals 5,584 2,025 304 137 55 839,073 103.6% 64,583,582 9,687,537 4,359,392 1,743,757
Notes
Adjusted
No. of
systems
Unserved population to be served in the remaining three years according to data derived from draft MoWIE report 2009EFY
Adjust-
ment
%age
Av.
population
served per
system in
this region
Yearly Financial Plan
Adjusted
regional
population to
be served by
this system
Proportion
of unserved
population
Unit cost
per
capita
USD
Total cost USD
14. Single
Village -
borehole
90
15. Multi
Village -
borehole
22
Self supply
On spot
12. Single
Village -
spring
180
13. Multi
Village -
spring
0
Yearly Physical plan for 2020No. of
systems
proposed
by Region
Technology Sr NoType
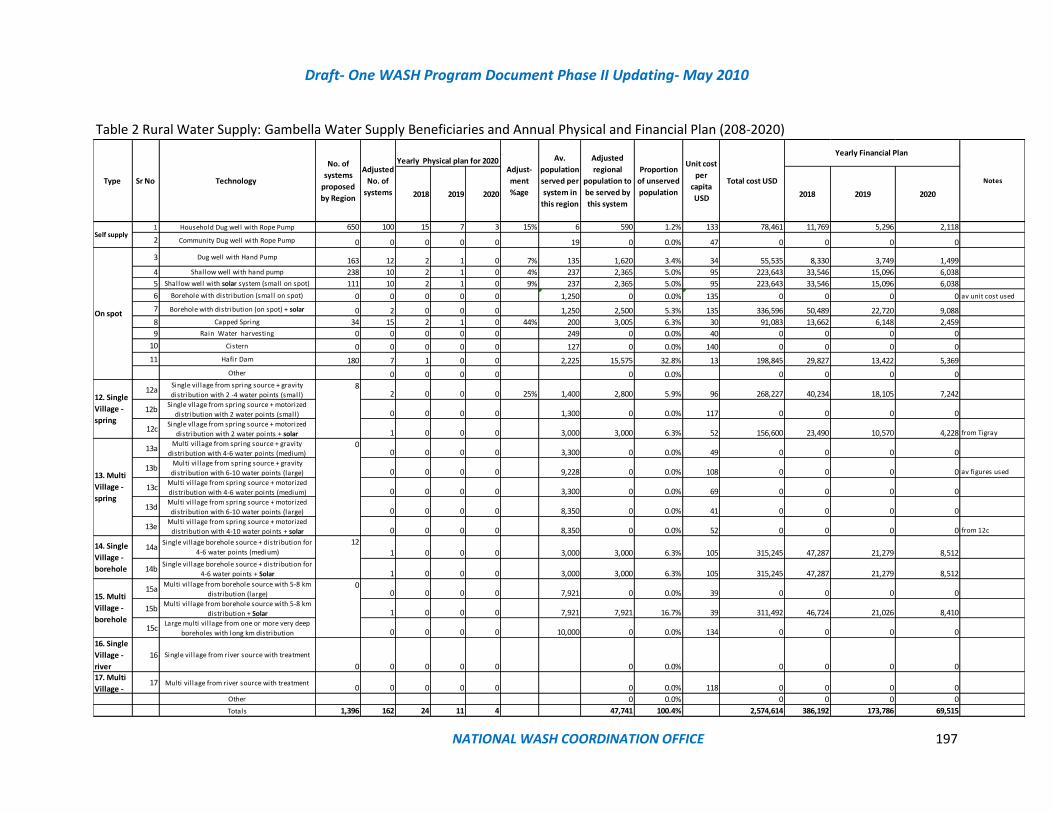
Draft- One WASH Program Document Phase II Updating- May 2010
NATIONAL WASH COORDINATION OFFICE 197
Table 2 Rural Water Supply: Gambella Water Supply Beneficiaries and Annual Physical and Financial Plan (208-2020)
2018 2019 2020 2018 2019 2020
1 Household Dug well with Rope Pump 650 100 15 7 3 15% 6 590 1.2% 133 78,461 11,769 5,296 2,118
2 Community Dug well with Rope Pump 0 0 0 0 0 19 0 0.0% 47 0 0 0 0
3 Dug well with Hand Pump 163 12 2 1 0 7% 135 1,620 3.4% 34 55,535 8,330 3,749 1,499
4 Shallow well with hand pump 238 10 2 1 0 4% 237 2,365 5.0% 95 223,643 33,546 15,096 6,038
5 Shallow well with solar system (small on spot) 111 10 2 1 0 9% 237 2,365 5.0% 95 223,643 33,546 15,096 6,038
6 Borehole with distribution (small on spot) 0 0 0 0 0 1,250 0 0.0% 135 0 0 0 0 av unit cost used
7 Borehole with distribution (on spot) + solar 0 2 0 0 0 1,250 2,500 5.3% 135 336,596 50,489 22,720 9,088
8 Capped Spring 34 15 2 1 0 44% 200 3,005 6.3% 30 91,083 13,662 6,148 2,459
9 Rain Water harvesting 0 0 0 0 0 249 0 0.0% 40 0 0 0 0
10 Cistern 0 0 0 0 0 127 0 0.0% 140 0 0 0 0
11 Hafir Dam 180 7 1 0 0 2,225 15,575 32.8% 13 198,845 29,827 13,422 5,369
Other 0 0 0 0 0 0.0% 0 0 0 0
12aSingle vil lage from spring source + gravity
distribution with 2 -4 water points (small) 2 0 0 0 25% 1,400 2,800 5.9% 96 268,227 40,234 18,105 7,242
12bSingle vllage from spring source + motorized
distribution with 2 water points (small) 0 0 0 0 1,300 0 0.0% 117 0 0 0 0
12cSingle vllage from spring source + motorized
distribution with 2 water points + solar 1 0 0 0 3,000 3,000 6.3% 52 156,600 23,490 10,570 4,228 from Tigray
13aMulti vil lage from spring source + gravity
distribution with 4-6 water points (medium) 0 0 0 0 3,300 0 0.0% 49 0 0 0 0
13bMulti vil lage from spring source + gravity
distribution with 6-10 water points (large) 0 0 0 0 9,228 0 0.0% 108 0 0 0 0 av figures used
13cMulti vil lage from spring source + motorized
distribution with 4-6 water points (medium) 0 0 0 0 3,300 0 0.0% 69 0 0 0 0
13dMulti vil lage from spring source + motorized
distribution with 6-10 water points (large) 0 0 0 0 8,350 0 0.0% 41 0 0 0 0
13eMulti vil lage from spring source + motorized
distribution with 4-10 water points + solar 0 0 0 0 8,350 0 0.0% 52 0 0 0 0 from 12c
14aSingle vil lage borehole source + distribution for
4-6 water points (medium) 1 0 0 0 3,000 3,000 6.3% 105 315,245 47,287 21,279 8,512
14bSingle vil lage borehole source + distribution for
4-6 water points + Solar 1 0 0 0 3,000 3,000 6.3% 105 315,245 47,287 21,279 8,512
15aMulti vil lage from borehole source with 5-8 km
distribution (large) 0 0 0 0 7,921 0 0.0% 39 0 0 0 0
15bMulti vil lage from borehole source with 5-8 km
distribution + Solar 1 0 0 0 7,921 7,921 16.7% 39 311,492 46,724 21,026 8,410
15cLarge multi vil lage from one or more very deep
boreholes with long km distribution 0 0 0 0 10,000 0 0.0% 134 0 0 0 0
16. Single
Village -
river
16 Single vil lage from river source with treatment
0 0 0 0 0 0 0.0% 0 0 0 0
17. Multi
Village -17 Multi vil lage from river source with treatment
0 0 0 0 0 0 0.0% 118 0 0 0 0
Other 0 0.0% 0 0 0 0
Totals 1,396 162 24 11 4 47,741 100.4% 2,574,614 386,192 173,786 69,515
Unit cost
per
capita
USD
Total cost USD
Yearly Financial Plan
Notes
Yearly Physical plan for 2020Adjust-
ment
%age
Av.
population
served per
system in
this region
Adjusted
regional
population to
be served by
this system
Proportion
of unserved
population
14. Single
Village -
borehole
12
15. Multi
Village -
borehole
0
Self supply
On spot
12. Single
Village -
spring
8
13. Multi
Village -
spring
0
Type Sr No Technology
No. of
systems
proposed
by Region
Adjusted
No. of
systems

Draft- One WASH Program Document Phase II Updating- May 2010
NATIONAL WASH COORDINATION OFFICE 198
Table 3 Rural Water Supply: B-Gumuz Water Supply Beneficiaries and Annual Physical and Financial Plan (208-2020)
2018 2019 2020 2018 2019 2020
1 Household Dug well with Rope Pump 0 0 0 0 0 6 0 0.0% 133 0 0 0 0
2 Community Dug well with Rope Pump 0 0 0 0 0 33 0 0.0% 38 0 0 0 0
3 Dug well with Hand Pump 120 120 18 54 48 100% 115 13,800 5.4% 30 416,311 62,447 187,340 166,524
4 Shallow well with hand pump 624 624 94 281 250 100% 236 147,264 58.1% 41 6,034,378 905,157 2,715,470 2,413,751
5 Shallow well with solar system (small on spot) 10 10 2 5 4 100% 236 2,360 0.9% 41 96,705 14,506 43,517 38,682
6 Borehole with distribution (small on spot) 0 0 0 0 0 1,250 0 0.0% 115 0 0 0 0
7 Borehole with distribution (on spot) + solar 0 0 0 0 0 1,250 0 0.0% 0 0 0 0
8 Capped Spring 24 24 4 11 10 100% 188 4,500 1.8% 31 140,042 21,006 63,019 56,017
9 Rain Water harvesting 0 0 0 0 0 44 0 0.0% 39 0 0 0 0
10 Cistern 0 0 0 0 0 44 0 0.0% 106 0 0 0 0
11 Hafir Dam 0 0 0 0 0 222 0 0.0% 105 0 0 0 0
Other 0 0 0 0 0 0.0% 0 0 0 0
12aSingle vil lage from spring source + gravity
distribution with 2 -4 water points (small) 0 0 0 0 1,450 0 0.0% 66 0 0 0 0
12bSingle vllage from spring source + motorized
distribution with 2 water points (small) 0 0 0 0 1,400 0 0.0% 105 0 0 0 0
12cSingle vllage from spring source + motorized
distribution with 2 water points + solar 0 0 0 0 3,000 0 0.0% 52 0 0 0 0
13aMulti vil lage from spring source + gravity
distribution with 4-6 water points (medium) 0 0 0 0 3,200 0 0.0% 48 0 0 0 0
13bMulti vil lage from spring source + gravity
distribution with 6-10 water points (large) 0 0 0 0 8,100 0 0.0% 37 0 0 0 0
13cMulti vil lage from spring source + motorized
distribution with 4-6 water points (medium) 0 0 0 0 3,200 0 0.0% 69 0 0 0 0
13dMulti vil lage from spring source + motorized
distribution with 6-10 water points (large) 0 0 0 0 8,100 0 0.0% 45 0 0 0 0
13eMulti vil lage from spring source + motorized
distribution with 4-10 water points + solar 0 0 0 0 0 0.0% 0 0 0 0
14aSingle vil lage borehole source + distribution for
4-6 water points (medium) 10 2 5 4 100% 3,000 30,000 11.8% 79 2,371,365 355,705 1,067,114 948,546
14bSingle vil lage borehole source + distribution for
4-6 water points + Solar 0 0 0 0 0 0.0% 0 0 0 0
15aMulti vil lage from borehole source with 5-8 km
distribution (large) 8 1 4 3 100% 8,500 68,000 26.8% 50 3,400,447 510,067 1,530,201 1,360,179
15bMulti vil lage from borehole source with 5-8 km
distribution + Solar 0 0 0 0 0% 0 0.0% 0 0 0 0
15cLarge multi vil lage from one or more very deep
boreholes with long km distribution 0 0 0 0 0% 10,000 0 0.0% 140 0 0 0 0
16. Single
Village -
river
16 Single vil lage from river source with treatment
0 0 0 0 0 0 0.0% 0 0 0 0
17. Multi
Village -17 Multi vil lage from river source with treatment
0 0 0 0 0 0 0.0% 118 0 0 0 0
Other 0 0 0 0 0.0% 0 0 0 0
Totals 796 796 119 358 318 265,924 104.9% 12,459,248 1,868,887 5,606,661 4,983,699
Unit cost
per
capita
USD
Total cost USD
Yearly Financial Plan Yearly Physical plan for 2020
Adjust-
ment
%age
Av.
population
served per
system in
this region
Adjusted
regional
population to
be served by
this system
Proportion
of unserved
population
14. Single
Village -
borehole
10
15. Multi
Village -
borehole
8
Self supply
On spot
12. Single
Village -
spring
0
13. Multi
Village -
spring
0
Type Sr No Technology
No. of
systems
proposed
by Region
Adjusted
No. of
systems
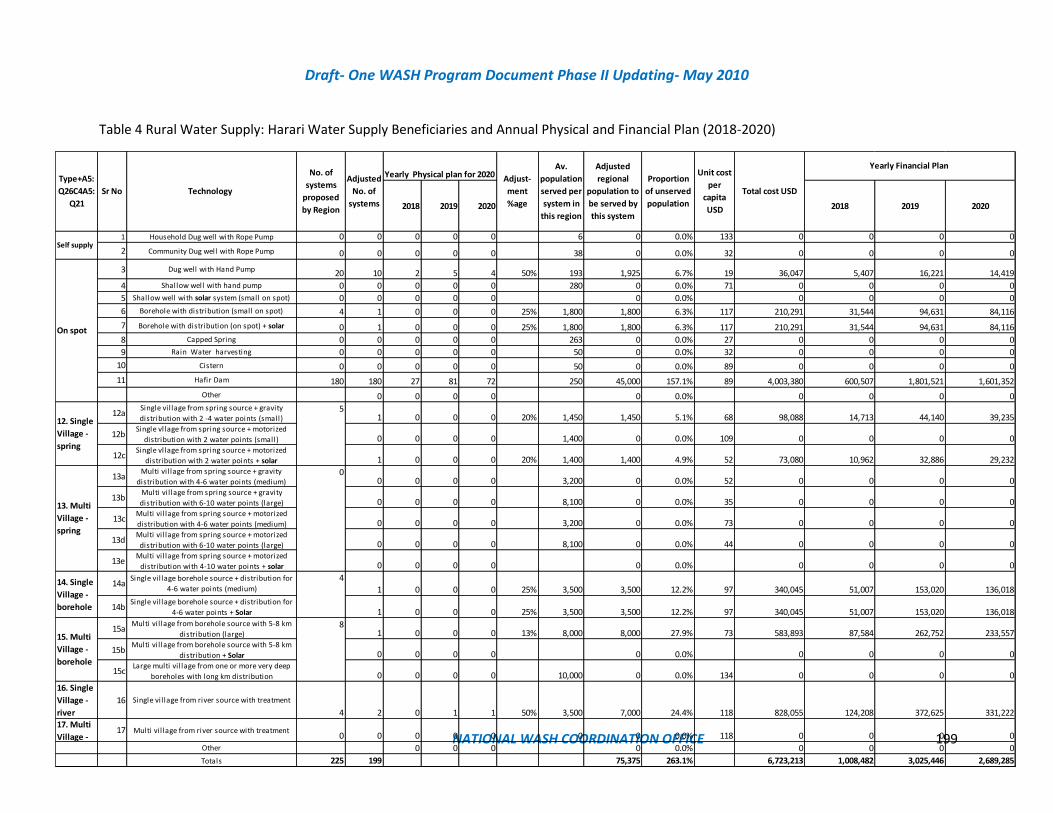
Draft- One WASH Program Document Phase II Updating- May 2010
NATIONAL WASH COORDINATION OFFICE 199
Table 4 Rural Water Supply: Harari Water Supply Beneficiaries and Annual Physical and Financial Plan (2018-2020)
2018 2019 2020 2018 2019 2020
1 Household Dug well with Rope Pump 0 0 0 0 0 6 0 0.0% 133 0 0 0 0
2 Community Dug well with Rope Pump 0 0 0 0 0 38 0 0.0% 32 0 0 0 0
3 Dug well with Hand Pump 20 10 2 5 4 50% 193 1,925 6.7% 19 36,047 5,407 16,221 14,419
4 Shallow well with hand pump 0 0 0 0 0 280 0 0.0% 71 0 0 0 0
5 Shallow well with solar system (small on spot) 0 0 0 0 0 0 0.0% 0 0 0 0
6 Borehole with distribution (small on spot) 4 1 0 0 0 25% 1,800 1,800 6.3% 117 210,291 31,544 94,631 84,116
7 Borehole with distribution (on spot) + solar 0 1 0 0 0 25% 1,800 1,800 6.3% 117 210,291 31,544 94,631 84,116
8 Capped Spring 0 0 0 0 0 263 0 0.0% 27 0 0 0 0
9 Rain Water harvesting 0 0 0 0 0 50 0 0.0% 32 0 0 0 0
10 Cistern 0 0 0 0 0 50 0 0.0% 89 0 0 0 0
11 Hafir Dam 180 180 27 81 72 250 45,000 157.1% 89 4,003,380 600,507 1,801,521 1,601,352
Other 0 0 0 0 0 0.0% 0 0 0 0
12aSingle vil lage from spring source + gravity
distribution with 2 -4 water points (small) 1 0 0 0 20% 1,450 1,450 5.1% 68 98,088 14,713 44,140 39,235
12bSingle vllage from spring source + motorized
distribution with 2 water points (small) 0 0 0 0 1,400 0 0.0% 109 0 0 0 0
12cSingle vllage from spring source + motorized
distribution with 2 water points + solar 1 0 0 0 20% 1,400 1,400 4.9% 52 73,080 10,962 32,886 29,232
13aMulti vil lage from spring source + gravity
distribution with 4-6 water points (medium) 0 0 0 0 3,200 0 0.0% 52 0 0 0 0
13bMulti vil lage from spring source + gravity
distribution with 6-10 water points (large) 0 0 0 0 8,100 0 0.0% 35 0 0 0 0
13cMulti vil lage from spring source + motorized
distribution with 4-6 water points (medium) 0 0 0 0 3,200 0 0.0% 73 0 0 0 0
13dMulti vil lage from spring source + motorized
distribution with 6-10 water points (large) 0 0 0 0 8,100 0 0.0% 44 0 0 0 0
13eMulti vil lage from spring source + motorized
distribution with 4-10 water points + solar 0 0 0 0 0 0.0% 0 0 0 0
14aSingle vil lage borehole source + distribution for
4-6 water points (medium) 1 0 0 0 25% 3,500 3,500 12.2% 97 340,045 51,007 153,020 136,018
14bSingle vil lage borehole source + distribution for
4-6 water points + Solar 1 0 0 0 25% 3,500 3,500 12.2% 97 340,045 51,007 153,020 136,018
15aMulti vil lage from borehole source with 5-8 km
distribution (large) 1 0 0 0 13% 8,000 8,000 27.9% 73 583,893 87,584 262,752 233,557
15bMulti vil lage from borehole source with 5-8 km
distribution + Solar 0 0 0 0 0 0.0% 0 0 0 0
15cLarge multi vil lage from one or more very deep
boreholes with long km distribution 0 0 0 0 10,000 0 0.0% 134 0 0 0 0
16. Single
Village -
river
16 Single vil lage from river source with treatment
4 2 0 1 1 50% 3,500 7,000 24.4% 118 828,055 124,208 372,625 331,222
17. Multi
Village -17 Multi vil lage from river source with treatment
0 0 0 0 0 0 0 0.0% 118 0 0 0 0
Other 0 0 0 0 0.0% 0 0 0 0
Totals 225 199 75,375 263.1% 6,723,213 1,008,482 3,025,446 2,689,285
Unit cost
per
capita
USD
Total cost USD
Yearly Financial Plan Yearly Physical plan for 2020 Adjust-
ment
%age
Av.
population
served per
system in
this region
Adjusted
regional
population to
be served by
this system
Proportion
of unserved
population
14. Single
Village -
borehole
4
15. Multi
Village -
borehole
8
Self supply
On spot
12. Single
Village -
spring
5
13. Multi
Village -
spring
0
Type+A5:
Q26C4A5:
Q21
Sr No Technology
No. of
systems
proposed
by Region
Adjusted
No. of
systems
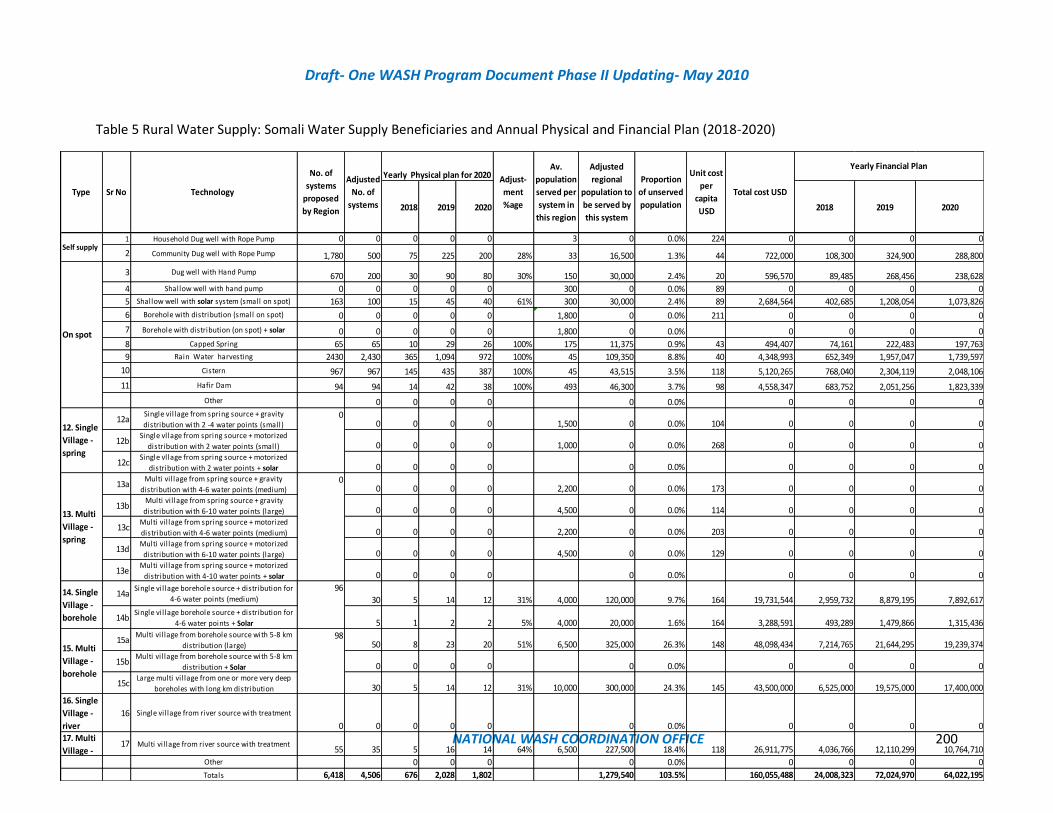
Draft- One WASH Program Document Phase II Updating- May 2010
NATIONAL WASH COORDINATION OFFICE 200
Table 5 Rural Water Supply: Somali Water Supply Beneficiaries and Annual Physical and Financial Plan (2018-2020)
2018 2019 2020 2018 2019 2020
1 Household Dug well with Rope Pump 0 0 0 0 0 3 0 0.0% 224 0 0 0 0
2 Community Dug well with Rope Pump 1,780 500 75 225 200 28% 33 16,500 1.3% 44 722,000 108,300 324,900 288,800
3 Dug well with Hand Pump 670 200 30 90 80 30% 150 30,000 2.4% 20 596,570 89,485 268,456 238,628
4 Shallow well with hand pump 0 0 0 0 0 300 0 0.0% 89 0 0 0 0
5 Shallow well with solar system (small on spot) 163 100 15 45 40 61% 300 30,000 2.4% 89 2,684,564 402,685 1,208,054 1,073,826
6 Borehole with distribution (small on spot) 0 0 0 0 0 1,800 0 0.0% 211 0 0 0 0
7 Borehole with distribution (on spot) + solar 0 0 0 0 0 1,800 0 0.0% 0 0 0 0
8 Capped Spring 65 65 10 29 26 100% 175 11,375 0.9% 43 494,407 74,161 222,483 197,763
9 Rain Water harvesting 2430 2,430 365 1,094 972 100% 45 109,350 8.8% 40 4,348,993 652,349 1,957,047 1,739,597
10 Cistern 967 967 145 435 387 100% 45 43,515 3.5% 118 5,120,265 768,040 2,304,119 2,048,106
11 Hafir Dam 94 94 14 42 38 100% 493 46,300 3.7% 98 4,558,347 683,752 2,051,256 1,823,339
Other 0 0 0 0 0 0.0% 0 0 0 0
12aSingle vil lage from spring source + gravity
distribution with 2 -4 water points (small) 0 0 0 0 1,500 0 0.0% 104 0 0 0 0
12bSingle vllage from spring source + motorized
distribution with 2 water points (small) 0 0 0 0 1,000 0 0.0% 268 0 0 0 0
12cSingle vllage from spring source + motorized
distribution with 2 water points + solar 0 0 0 0 0 0.0% 0 0 0 0
13aMulti vil lage from spring source + gravity
distribution with 4-6 water points (medium) 0 0 0 0 2,200 0 0.0% 173 0 0 0 0
13bMulti vil lage from spring source + gravity
distribution with 6-10 water points (large) 0 0 0 0 4,500 0 0.0% 114 0 0 0 0
13cMulti vil lage from spring source + motorized
distribution with 4-6 water points (medium) 0 0 0 0 2,200 0 0.0% 203 0 0 0 0
13dMulti vil lage from spring source + motorized
distribution with 6-10 water points (large) 0 0 0 0 4,500 0 0.0% 129 0 0 0 0
13eMulti vil lage from spring source + motorized
distribution with 4-10 water points + solar 0 0 0 0 0 0.0% 0 0 0 0
14aSingle vil lage borehole source + distribution for
4-6 water points (medium) 30 5 14 12 31% 4,000 120,000 9.7% 164 19,731,544 2,959,732 8,879,195 7,892,617
14bSingle vil lage borehole source + distribution for
4-6 water points + Solar 5 1 2 2 5% 4,000 20,000 1.6% 164 3,288,591 493,289 1,479,866 1,315,436
15aMulti vil lage from borehole source with 5-8 km
distribution (large) 50 8 23 20 51% 6,500 325,000 26.3% 148 48,098,434 7,214,765 21,644,295 19,239,374
15bMulti vil lage from borehole source with 5-8 km
distribution + Solar 0 0 0 0 0 0.0% 0 0 0 0
15cLarge multi vil lage from one or more very deep
boreholes with long km distribution 30 5 14 12 31% 10,000 300,000 24.3% 145 43,500,000 6,525,000 19,575,000 17,400,000
16. Single
Village -
river
16 Single vil lage from river source with treatment
0 0 0 0 0 0 0.0% 0 0 0 0
17. Multi
Village -17 Multi vil lage from river source with treatment
55 35 5 16 14 64% 6,500 227,500 18.4% 118 26,911,775 4,036,766 12,110,299 10,764,710
Other 0 0 0 0 0.0% 0 0 0 0
Totals 6,418 4,506 676 2,028 1,802 1,279,540 103.5% 160,055,488 24,008,323 72,024,970 64,022,195
Type Sr No Technology
No. of
systems
proposed
by Region
Adjusted
No. of
systems
Yearly Physical plan for 2020 Adjust-
ment
%age
Av.
population
served per
system in
this region
Adjusted
regional
population to
be served by
this system
Proportion
of unserved
population
Unit cost
per
capita
USD
Total cost USD
Yearly Financial Plan
14. Single
Village -
borehole
96
15. Multi
Village -
borehole
98
Self supply
On spot
12. Single
Village -
spring
0
13. Multi
Village -
spring
0

Draft- One WASH Program Document Phase II Updating- May 2010
NATIONAL WASH COORDINATION OFFICE 201
Table 6 Rural Water Supply: Amhara Water Supply Beneficiaries and Annual Physical and Financial Plan (2018-2020)
2018 2019 2020 2018 2019 2020
1 Household Dug well with Rope Pump 1,260 500 75 225 200 40% 6 2,750 0.1% 164 451,156 67,673 203,020 180,462
2 Community Dug well with Rope Pump 1,720 500 75 225 200 29% 32 16,000 0.8% 37 594,360 89,154 267,462 237,744
3 Dug well with Hand Pump 12,000 500 75 225 200 4% 188 93,900 4.6% 26 2,453,493 368,024 1,104,072 981,397
4 Shallow well with hand pump 1,500 500 75 225 200 33% 274 137,138 6.7% 45 6,223,221 933,483 2,800,450 2,489,289
5 Shallow well with solar system (small on spot) 1,500 500 75 225 200 274 137,138 6.7% 45 6,223,221 933,483 2,800,450 2,489,289
6 Borehole with distribution (small on spot) 0 100 15 45 40 1250 125,000 6.1% 125 15,659,955 2,348,993 7,046,980 6,263,982
7 Borehole with distribution (on spot) + solar 0 100 15 45 40 1250 125,000 6.1% 125 15,659,955 2,348,993 7,046,980 6,263,982
8 Capped Spring 9,000 2,000 300 900 800 22% 271 542,000 26.6% 19 10,511,106 1,576,666 4,729,998 4,204,443
9 Rain Water harvesting 180 180 27 81 72 100% 300 54,000 2.6% 45 2,416,107 362,416 1,087,248 966,443
10 Cistern 180 0 0 0 0 0 0.0% 0 0 0 0
11 Hafir Dam 180 0 0 0 0 0 0.0% 0 0 0 0
Other 0 0 0 0 0 0.0% 0 0 0 0
12aSingle vil lage from spring source + gravity
distribution with 2 -4 water points (small) 0 0 0 0 1395 0 0.0% 34 0 0 0 0
12bSingle vllage from spring source + motorized
distribution with 2 water points (small) 10 2 5 4 2000 20,000 1.0% 58 1,158,340 173,751 521,253 463,336
12cSingle vllage from spring source + motorized
distribution with 2 water points + solar 10 2 5 4 3000 30,000 1.5% 52 1,560,000 234,000 702,000 624,000
13aMulti vil lage from spring source + gravity
distribution with 4-6 water points (medium) 20 3 9 8 25% 3500 70,000 3.4% 38 2,684,564 402,685 1,208,054 1,073,826
13bMulti vil lage from spring source + gravity
distribution with 6-10 water points (large) 20 3 9 8 25% 8500 170,000 8.3% 34 5,816,555 872,483 2,617,450 2,326,622
13cMulti vil lage from spring source + motorized
distribution with 4-6 water points (medium) 10 2 5 4 13% 3500 35,000 1.7% 58 2,013,423 302,013 906,040 805,369
13dMulti vil lage from spring source + motorized
distribution with 6-10 water points (large) 5 1 2 2 6% 8500 42,500 2.1% 42 1,789,709 268,456 805,369 715,884
13eMulti vil lage from spring source + motorized
distribution with 4-10 water points + solar 5 1 2 2 6% 8500 42,500 2.1% 52 2,210,000 331,500 994,500 884,000
14aSingle vil lage borehole source + distribution for
4-6 water points (medium) 5 1 2 2 3000 15,000 0.7% 75 1,118,568 167,785 503,356 447,427
14bSingle vil lage borehole source + distribution for
4-6 water points + Solar 5 1 2 2 3000 15,000 0.7% 75 1,118,568 167,785 503,356 447,427
15aMulti vil lage from borehole source with 5-8 km
distribution (large) 20 3 9 8 33% 12500 250,000 12.3% 77 19,239,374 2,885,906 8,657,718 7,695,749
15bMulti vil lage from borehole source with 5-8 km
distribution + Solar 5 1 2 2 8% 12500 62,500 3.1% 77 4,809,843 721,477 2,164,430 1,923,937
15cLarge multi vil lage from one or more very deep
boreholes with long km distribution 0 0 0 0% 10000 0 0.0% 127 0 0 0 0
16. Single
Village -
river
16 Single vil lage from river source with treatment
60 0 0 0 0 0.0% 0 0 0 0
17. Multi
Village -17 Multi vil lage from river source with treatment
60 5 1 2 2 12500 62,500 3.1% 118 7,393,345 1,109,002 3,327,005 2,957,338
Other 0 0.0% 0 0 0 0
Totals 28,040 5,000 750 2,250 2,000 2,047,926 100.5% 111,104,864 16,665,730 49,997,189 44,441,946
Yearly Financial Plan
Type
Av.
population
served per
system in
this region
Adjusted
regional
population to
be served by
this system
Proportion
of unserved
population
Unit cost
per
capita
USD
Total cost USDSr No Technology
No. of
systems
proposed
by Region
Adjusted
No. of
systems
Yearly Physical plan for 2020 Adjust-
ment
%age
14. Single
Village -
borehole
80
15. Multi
Village -
borehole
60
Self supply
On spot
12. Single
Village -
spring
180
13. Multi
Village -
spring
80
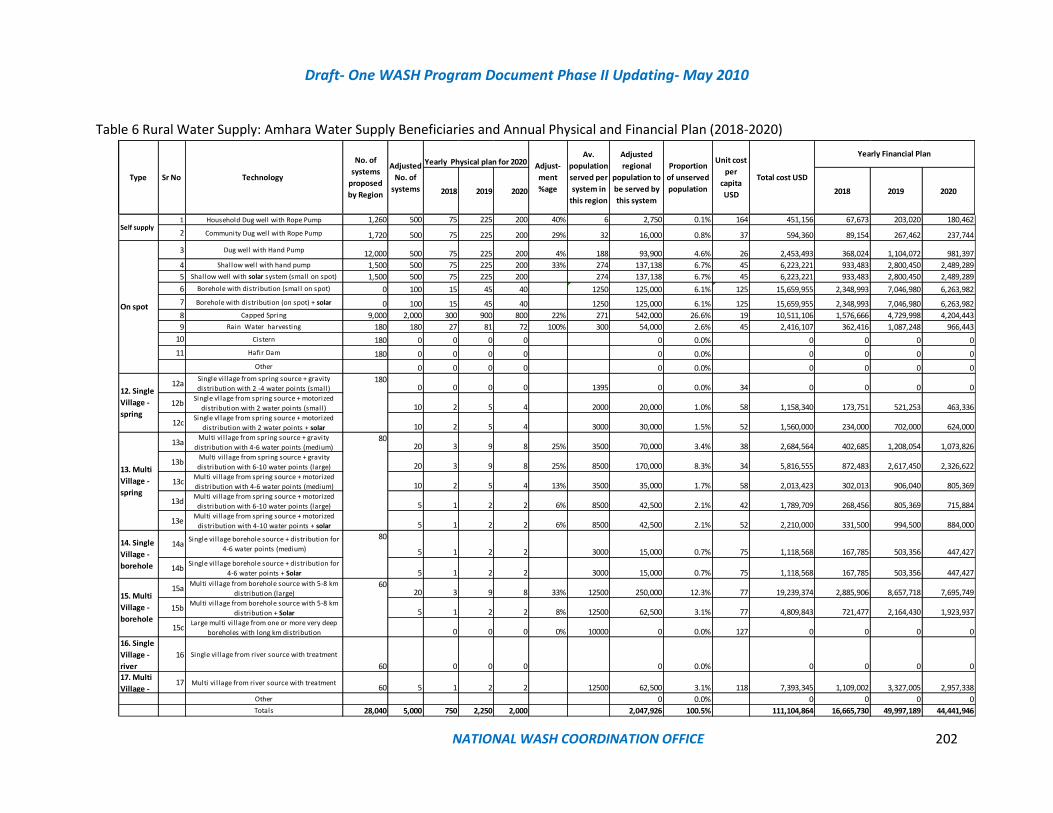
Draft- One WASH Program Document Phase II Updating- May 2010
NATIONAL WASH COORDINATION OFFICE 202
Table 6 Rural Water Supply: Amhara Water Supply Beneficiaries and Annual Physical and Financial Plan (2018-2020)
2018 2019 2020 2018 2019 2020
1 Household Dug well with Rope Pump 1,260 500 75 225 200 40% 6 2,750 0.1% 164 451,156 67,673 203,020 180,462
2 Community Dug well with Rope Pump 1,720 500 75 225 200 29% 32 16,000 0.8% 37 594,360 89,154 267,462 237,744
3 Dug well with Hand Pump 12,000 500 75 225 200 4% 188 93,900 4.6% 26 2,453,493 368,024 1,104,072 981,397
4 Shallow well with hand pump 1,500 500 75 225 200 33% 274 137,138 6.7% 45 6,223,221 933,483 2,800,450 2,489,289
5 Shallow well with solar system (small on spot) 1,500 500 75 225 200 274 137,138 6.7% 45 6,223,221 933,483 2,800,450 2,489,289
6 Borehole with distribution (small on spot) 0 100 15 45 40 1250 125,000 6.1% 125 15,659,955 2,348,993 7,046,980 6,263,982
7 Borehole with distribution (on spot) + solar 0 100 15 45 40 1250 125,000 6.1% 125 15,659,955 2,348,993 7,046,980 6,263,982
8 Capped Spring 9,000 2,000 300 900 800 22% 271 542,000 26.6% 19 10,511,106 1,576,666 4,729,998 4,204,443
9 Rain Water harvesting 180 180 27 81 72 100% 300 54,000 2.6% 45 2,416,107 362,416 1,087,248 966,443
10 Cistern 180 0 0 0 0 0 0.0% 0 0 0 0
11 Hafir Dam 180 0 0 0 0 0 0.0% 0 0 0 0
Other 0 0 0 0 0 0.0% 0 0 0 0
12aSingle vil lage from spring source + gravity
distribution with 2 -4 water points (small) 0 0 0 0 1395 0 0.0% 34 0 0 0 0
12bSingle vllage from spring source + motorized
distribution with 2 water points (small) 10 2 5 4 2000 20,000 1.0% 58 1,158,340 173,751 521,253 463,336
12cSingle vllage from spring source + motorized
distribution with 2 water points + solar 10 2 5 4 3000 30,000 1.5% 52 1,560,000 234,000 702,000 624,000
13aMulti vil lage from spring source + gravity
distribution with 4-6 water points (medium) 20 3 9 8 25% 3500 70,000 3.4% 38 2,684,564 402,685 1,208,054 1,073,826
13bMulti vil lage from spring source + gravity
distribution with 6-10 water points (large) 20 3 9 8 25% 8500 170,000 8.3% 34 5,816,555 872,483 2,617,450 2,326,622
13cMulti vil lage from spring source + motorized
distribution with 4-6 water points (medium) 10 2 5 4 13% 3500 35,000 1.7% 58 2,013,423 302,013 906,040 805,369
13dMulti vil lage from spring source + motorized
distribution with 6-10 water points (large) 5 1 2 2 6% 8500 42,500 2.1% 42 1,789,709 268,456 805,369 715,884
13eMulti vil lage from spring source + motorized
distribution with 4-10 water points + solar 5 1 2 2 6% 8500 42,500 2.1% 52 2,210,000 331,500 994,500 884,000
14aSingle vil lage borehole source + distribution for
4-6 water points (medium) 5 1 2 2 3000 15,000 0.7% 75 1,118,568 167,785 503,356 447,427
14bSingle vil lage borehole source + distribution for
4-6 water points + Solar 5 1 2 2 3000 15,000 0.7% 75 1,118,568 167,785 503,356 447,427
15aMulti vil lage from borehole source with 5-8 km
distribution (large) 20 3 9 8 33% 12500 250,000 12.3% 77 19,239,374 2,885,906 8,657,718 7,695,749
15bMulti vil lage from borehole source with 5-8 km
distribution + Solar 5 1 2 2 8% 12500 62,500 3.1% 77 4,809,843 721,477 2,164,430 1,923,937
15cLarge multi vil lage from one or more very deep
boreholes with long km distribution 0 0 0 0% 10000 0 0.0% 127 0 0 0 0
16. Single
Village -
river
16 Single vil lage from river source with treatment
60 0 0 0 0 0.0% 0 0 0 0
17. Multi
Village -17 Multi vil lage from river source with treatment
60 5 1 2 2 12500 62,500 3.1% 118 7,393,345 1,109,002 3,327,005 2,957,338
Other 0 0.0% 0 0 0 0
Totals 28,040 5,000 750 2,250 2,000 2,047,926 100.5% 111,104,864 16,665,730 49,997,189 44,441,946
Yearly Financial Plan
Type
Av.
population
served per
system in
this region
Adjusted
regional
population to
be served by
this system
Proportion
of unserved
population
Unit cost
per
capita
USD
Total cost USDSr No Technology
No. of
systems
proposed
by Region
Adjusted
No. of
systems
Yearly Physical plan for 2020 Adjust-
ment
%age
14. Single
Village -
borehole
80
15. Multi
Village -
borehole
60
Self supply
On spot
12. Single
Village -
spring
180
13. Multi
Village -
spring
80

Draft- One WASH Program Document Phase II Updating- May 2010
NATIONAL WASH COORDINATION OFFICE 203
Table 7 Rural Water Supply: Afar Water Supply Beneficiaries and Annual Physical and Financial Plan (2018-2020)
2018 2019 2020 2018 2019 2020
1 Household Dug well with Rope Pump 0 0 0 0 0 6 0 0.0% 133 0 0 0 0
2 Community Dug well with Rope Pump 0 0 0 0 0 33 0 0.0% 44 0 0 0 0
3 Dug well with Hand Pump 148 148 22 67 59 100% 185 27,380 4.1% 21 588,027 88,204 264,612 235,211
4 Shallow well with hand pump 96 96 14 43 38 100% 350 33,600 5.1% 56 1,866,618 279,993 839,978 746,647
5 Shallow well with solar system (small on spot) 53 100 15 45 40 189% 350 35,000 5.3% 56 1,944,394 291,659 874,977 777,758
6 Borehole with distribution (small on spot) 0 0 0 0 0 2,000 0 0.0% 151 0 0 0 0
7 Borehole with distribution (on spot) + solar 0 0 0 0 0 2,000 0 0.0% 151 0 0 0 0
8 Capped Spring 7 7 1 3 3 100% 175 1,225 0.2% 30 36,422 5,463 16,390 14,569
9 Rain Water harvesting 40 100 15 45 40 250% 44 4,400 0.7% 44 192,500 28,875 86,625 77,000
10 Cistern 163 163 24 73 65 100% 44 7,172 1.1% 120 863,085 129,463 388,388 345,234
11 Hafir Dam 7 7 1 3 3 100% 222 1,554 0.2% 119 185,339 27,801 83,403 74,136
Other 0 0 0 0 0 0.0% 0 0 0 0
12aSingle vil lage from spring source + gravity
distribution with 2 -4 water points (small) 0 0 0 0 1,350 0 0.0% 103 0 0 0 0
12bSingle vllage from spring source + motorized
distribution with 2 water points (small) 0 0 0 0 1,200 0 0.0% 186 0 0 0 0
12cSingle vllage from spring source + motorized
distribution with 2 water points + solar 0 0 0 0 1,200 0 0.0% 52 0 0 0 0
13aMulti vil lage from spring source + gravity
distribution with 4-6 water points (medium) 0 0 0 0 3,000 0 0.0% 97 0 0 0 0
13bMulti vil lage from spring source + gravity
distribution with 6-10 water points (large) 0 0 0 0 6,500 0 0.0% 65 0 0 0 0
13cMulti vil lage from spring source + motorized
distribution with 4-6 water points (medium) 0 0 0 0 3,000 0 0.0% 76 0 0 0 0
13dMulti vil lage from spring source + motorized
distribution with 6-10 water points (large) 0 0 0 0 6,500 0 0.0% 76 0 0 0 0
13eMulti vil lage from spring source + motorized
distribution with 4-10 water points + solar 0 0 0 0 0 0.0% 0 0 0 0
14aSingle vil lage borehole source + distribution for
4-6 water points (medium) 60 9 27 24 4,000 240,000 36.4% 129 30,872,483 4,630,872 13,892,617 12,348,993
14bSingle vil lage borehole source + distribution for
4-6 water points + Solar 10 2 5 4 4,000 40,000 6.1% 129 5,145,414 771,812 2,315,436 2,058,166
15aMulti vil lage from borehole source with 5-8 km
distribution (large) 0 0 0 0 7,000 0 0.0% 112 0 0 0 0
15bMulti vil lage from borehole source with 5-8 km
distribution + Solar 0 0 0 0 0.0% 0 0 0 0
15cLarge multi vil lage from one or more very deep
boreholes with long km distribution 30 5 14 12 10,000 300,000 45.4% 145 43,500,000 6,525,000 19,575,000 17,400,000
16. Single
Village -
river
16 Single vil lage from river source with treatment
0 0 0 0 0 0 0.0% 0 0 0 0
17. Multi
Village -17 Multi vil lage from river source with treatment
0 0 0 0 0 0 0.0% 118 0 0 0 0
Other 0 0.0% 0 0 0 0
Totals 631 721 108 324 288 690,331 104.6% 85,194,282 12,779,142 38,337,427 34,077,713
Unit cost
per
capita
USD
Total cost
USD
Yearly Financial Plan Yearly Physical plan for 2020 Adjust-
ment
%age
Av.
population
served per
system in
this region
Adjusted
regional
population
to be
served by
this system
Proportion
of unserved
population
14. Single
Village -
borehole
117
15. Multi
Village -
borehole
0
Self supply
On spot
12. Single
Village -
spring
0
13. Multi
Village -
spring
0
Type Sr No Technology
No. of
systems
proposed
by Region
Adjusted
No. of
systems
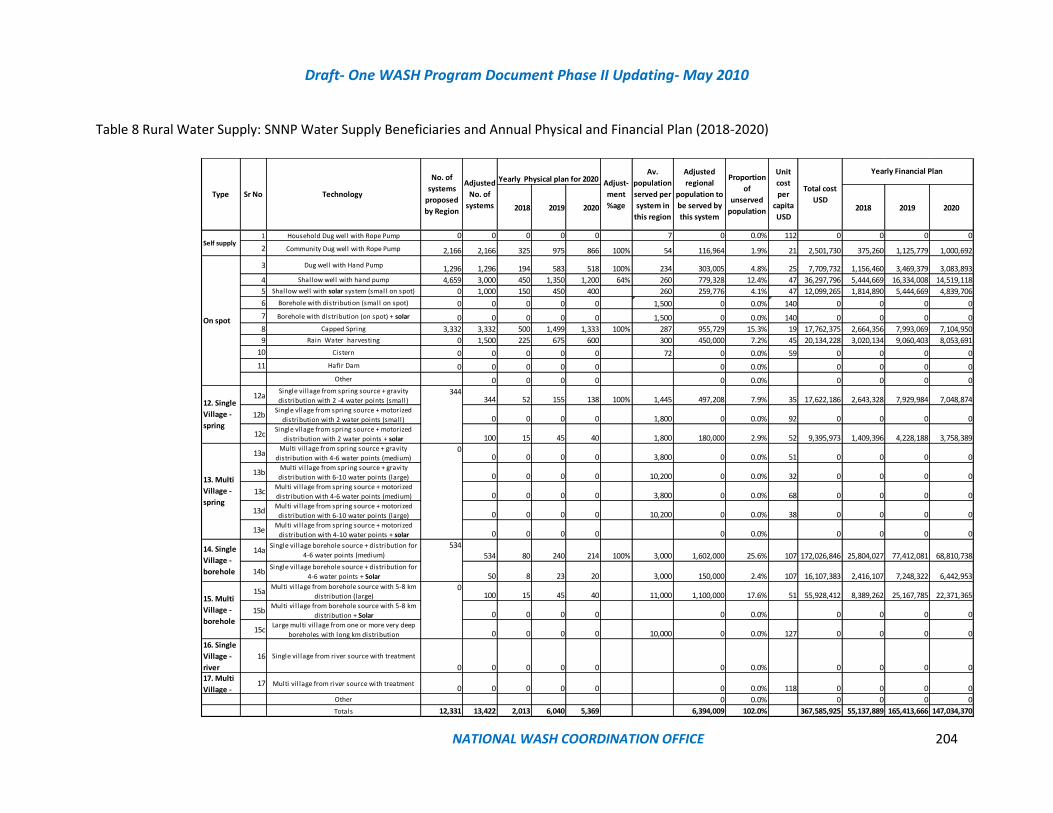
Draft- One WASH Program Document Phase II Updating- May 2010
NATIONAL WASH COORDINATION OFFICE 204
Table 8 Rural Water Supply: SNNP Water Supply Beneficiaries and Annual Physical and Financial Plan (2018-2020)
2018 2019 2020 2018 2019 2020
1 Household Dug well with Rope Pump 0 0 0 0 0 7 0 0.0% 112 0 0 0 0
2 Community Dug well with Rope Pump 2,166 2,166 325 975 866 100% 54 116,964 1.9% 21 2,501,730 375,260 1,125,779 1,000,692
3 Dug well with Hand Pump 1,296 1,296 194 583 518 100% 234 303,005 4.8% 25 7,709,732 1,156,460 3,469,379 3,083,893
4 Shallow well with hand pump 4,659 3,000 450 1,350 1,200 64% 260 779,328 12.4% 47 36,297,796 5,444,669 16,334,008 14,519,118
5 Shallow well with solar system (small on spot) 0 1,000 150 450 400 260 259,776 4.1% 47 12,099,265 1,814,890 5,444,669 4,839,706
6 Borehole with distribution (small on spot) 0 0 0 0 0 1,500 0 0.0% 140 0 0 0 0
7 Borehole with distribution (on spot) + solar 0 0 0 0 0 1,500 0 0.0% 140 0 0 0 0
8 Capped Spring 3,332 3,332 500 1,499 1,333 100% 287 955,729 15.3% 19 17,762,375 2,664,356 7,993,069 7,104,950
9 Rain Water harvesting 0 1,500 225 675 600 300 450,000 7.2% 45 20,134,228 3,020,134 9,060,403 8,053,691
10 Cistern 0 0 0 0 0 72 0 0.0% 59 0 0 0 0
11 Hafir Dam 0 0 0 0 0 0 0.0% 0 0 0 0
Other 0 0 0 0 0 0.0% 0 0 0 0
12aSingle vil lage from spring source + gravity
distribution with 2 -4 water points (small) 344 52 155 138 100% 1,445 497,208 7.9% 35 17,622,186 2,643,328 7,929,984 7,048,874
12bSingle vllage from spring source + motorized
distribution with 2 water points (small) 0 0 0 0 1,800 0 0.0% 92 0 0 0 0
12cSingle vllage from spring source + motorized
distribution with 2 water points + solar 100 15 45 40 1,800 180,000 2.9% 52 9,395,973 1,409,396 4,228,188 3,758,389
13aMulti vil lage from spring source + gravity
distribution with 4-6 water points (medium) 0 0 0 0 3,800 0 0.0% 51 0 0 0 0
13bMulti vil lage from spring source + gravity
distribution with 6-10 water points (large) 0 0 0 0 10,200 0 0.0% 32 0 0 0 0
13cMulti vil lage from spring source + motorized
distribution with 4-6 water points (medium) 0 0 0 0 3,800 0 0.0% 68 0 0 0 0
13dMulti vil lage from spring source + motorized
distribution with 6-10 water points (large) 0 0 0 0 10,200 0 0.0% 38 0 0 0 0
13eMulti vil lage from spring source + motorized
distribution with 4-10 water points + solar 0 0 0 0 0 0.0% 0 0 0 0
14aSingle vil lage borehole source + distribution for
4-6 water points (medium) 534 80 240 214 100% 3,000 1,602,000 25.6% 107 172,026,846 25,804,027 77,412,081 68,810,738
14bSingle vil lage borehole source + distribution for
4-6 water points + Solar 50 8 23 20 3,000 150,000 2.4% 107 16,107,383 2,416,107 7,248,322 6,442,953
15aMulti vil lage from borehole source with 5-8 km
distribution (large) 100 15 45 40 11,000 1,100,000 17.6% 51 55,928,412 8,389,262 25,167,785 22,371,365
15bMulti vil lage from borehole source with 5-8 km
distribution + Solar 0 0 0 0 0 0.0% 0 0 0 0
15cLarge multi vil lage from one or more very deep
boreholes with long km distribution 0 0 0 0 10,000 0 0.0% 127 0 0 0 0
16. Single
Village -
river
16 Single vil lage from river source with treatment
0 0 0 0 0 0 0.0% 0 0 0 0
17. Multi
Village -17 Multi vil lage from river source with treatment
0 0 0 0 0 0 0.0% 118 0 0 0 0
Other 0 0.0% 0 0 0 0
Totals 12,331 13,422 2,013 6,040 5,369 6,394,009 102.0% 367,585,925 55,137,889 165,413,666 147,034,370
Unit
cost
per
capita
USD
Total cost
USD
Yearly Financial Plan Yearly Physical plan for 2020 Adjust-
ment
%age
Av.
population
served per
system in
this region
Adjusted
regional
population to
be served by
this system
Proportion
of
unserved
population
14. Single
Village -
borehole
534
15. Multi
Village -
borehole
0
Self supply
On spot
12. Single
Village -
spring
344
13. Multi
Village -
spring
0
Type Sr No Technology
No. of
systems
proposed
by Region
Adjusted
No. of
systems
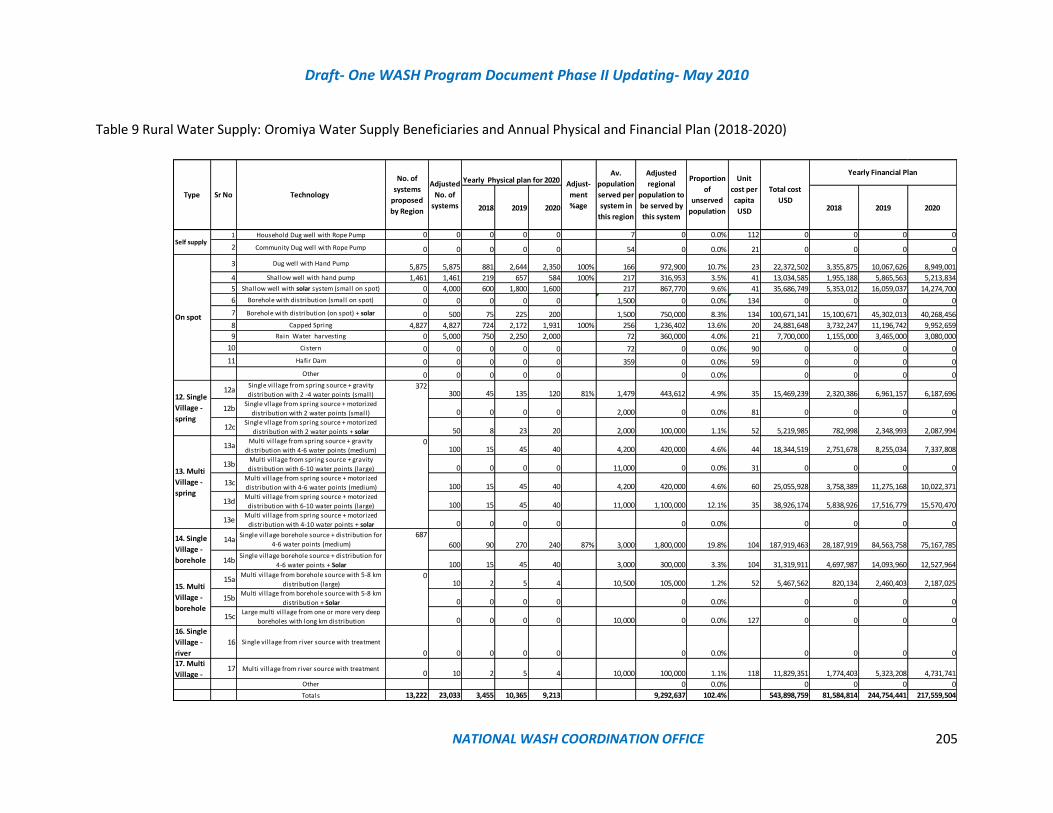
Draft- One WASH Program Document Phase II Updating- May 2010
NATIONAL WASH COORDINATION OFFICE 205
Table 9 Rural Water Supply: Oromiya Water Supply Beneficiaries and Annual Physical and Financial Plan (2018-2020)
2018 2019 2020 2018 2019 2020
1 Household Dug well with Rope Pump 0 0 0 0 0 7 0 0.0% 112 0 0 0 0
2 Community Dug well with Rope Pump 0 0 0 0 0 54 0 0.0% 21 0 0 0 0
3 Dug well with Hand Pump 5,875 5,875 881 2,644 2,350 100% 166 972,900 10.7% 23 22,372,502 3,355,875 10,067,626 8,949,001
4 Shallow well with hand pump 1,461 1,461 219 657 584 100% 217 316,953 3.5% 41 13,034,585 1,955,188 5,865,563 5,213,834
5 Shallow well with solar system (small on spot) 0 4,000 600 1,800 1,600 217 867,770 9.6% 41 35,686,749 5,353,012 16,059,037 14,274,700
6 Borehole with distribution (small on spot) 0 0 0 0 0 1,500 0 0.0% 134 0 0 0 0
7 Borehole with distribution (on spot) + solar 0 500 75 225 200 1,500 750,000 8.3% 134 100,671,141 15,100,671 45,302,013 40,268,456
8 Capped Spring 4,827 4,827 724 2,172 1,931 100% 256 1,236,402 13.6% 20 24,881,648 3,732,247 11,196,742 9,952,659
9 Rain Water harvesting 0 5,000 750 2,250 2,000 72 360,000 4.0% 21 7,700,000 1,155,000 3,465,000 3,080,000
10 Cistern 0 0 0 0 0 72 0 0.0% 90 0 0 0 0
11 Hafir Dam 0 0 0 0 0 359 0 0.0% 59 0 0 0 0
Other 0 0 0 0 0 0 0.0% 0 0 0 0
12aSingle vil lage from spring source + gravity
distribution with 2 -4 water points (small) 300 45 135 120 81% 1,479 443,612 4.9% 35 15,469,239 2,320,386 6,961,157 6,187,696
12bSingle vllage from spring source + motorized
distribution with 2 water points (small) 0 0 0 0 2,000 0 0.0% 81 0 0 0 0
12cSingle vllage from spring source + motorized
distribution with 2 water points + solar 50 8 23 20 2,000 100,000 1.1% 52 5,219,985 782,998 2,348,993 2,087,994
13aMulti vil lage from spring source + gravity
distribution with 4-6 water points (medium) 100 15 45 40 4,200 420,000 4.6% 44 18,344,519 2,751,678 8,255,034 7,337,808
13bMulti vil lage from spring source + gravity
distribution with 6-10 water points (large) 0 0 0 0 11,000 0 0.0% 31 0 0 0 0
13cMulti vil lage from spring source + motorized
distribution with 4-6 water points (medium) 100 15 45 40 4,200 420,000 4.6% 60 25,055,928 3,758,389 11,275,168 10,022,371
13dMulti vil lage from spring source + motorized
distribution with 6-10 water points (large) 100 15 45 40 11,000 1,100,000 12.1% 35 38,926,174 5,838,926 17,516,779 15,570,470
13eMulti vil lage from spring source + motorized
distribution with 4-10 water points + solar 0 0 0 0 0 0.0% 0 0 0 0
14aSingle vil lage borehole source + distribution for
4-6 water points (medium) 600 90 270 240 87% 3,000 1,800,000 19.8% 104 187,919,463 28,187,919 84,563,758 75,167,785
14bSingle vil lage borehole source + distribution for
4-6 water points + Solar 100 15 45 40 3,000 300,000 3.3% 104 31,319,911 4,697,987 14,093,960 12,527,964
15aMulti vil lage from borehole source with 5-8 km
distribution (large) 10 2 5 4 10,500 105,000 1.2% 52 5,467,562 820,134 2,460,403 2,187,025
15bMulti vil lage from borehole source with 5-8 km
distribution + Solar 0 0 0 0 0 0.0% 0 0 0 0
15cLarge multi vil lage from one or more very deep
boreholes with long km distribution 0 0 0 0 10,000 0 0.0% 127 0 0 0 0
16. Single
Village -
river
16 Single vil lage from river source with treatment
0 0 0 0 0 0 0.0% 0 0 0 0
17. Multi
Village -17 Multi vil lage from river source with treatment
0 10 2 5 4 10,000 100,000 1.1% 118 11,829,351 1,774,403 5,323,208 4,731,741
Other 0 0.0% 0 0 0 0
Totals 13,222 23,033 3,455 10,365 9,213 9,292,637 102.4% 543,898,759 81,584,814 244,754,441 217,559,504
Unit
cost per
capita
USD
Total cost
USD
Yearly Financial Plan Yearly Physical plan for 2020 Adjust-
ment
%age
Av.
population
served per
system in
this region
Adjusted
regional
population to
be served by
this system
Proportion
of
unserved
population
14. Single
Village -
borehole
687
15. Multi
Village -
borehole
0
Self supply
On spot
12. Single
Village -
spring
372
13. Multi
Village -
spring
0
Type Sr No Technology
No. of
systems
proposed
by Region
Adjusted
No. of
systems

Draft- One WASH Program Document Phase II Updating- May 2010
NATIONAL WASH COORDINATION OFFICE 206
Table 10 Rural Water Supply: Dire Dawa Water Supply Beneficiaries and Annual Physical and Financial Plan (2018-2020)
2018 2019 2020 2018 2019 2020
1 Household Dug well with Rope Pump 0 0 0 0 0 6 0 0.0% 133 0 0 0 0
2 Community Dug well with Rope Pump 0 0 0 0 0 42 0 0.0% 32 0 0 0 0
3 Dug well with Hand Pump 0 0 0 0 0 171 0 0.0% 25 0 0 0 0
4 Shallow well with hand pump 25 4 1 2 2 16% 320 1,280 6.4% 127 162,058 24,309 72,926 64,823
5 Shallow well with solar system (small on spot) 0 2 0 1 1 320 640 3.2% 127 81,029 12,154 36,463 32,412
6 Borehole with distribution (small on spot) 18 1 0 0 0 6% 2,000 2,000 10.0% 110 219,239 32,886 98,658 87,696
7 Borehole with distribution (on spot) + solar 0 1 0 0 0 2,000 2,000 10.0% 110 219,239 32,886 98,658 87,696
8 Capped Spring 0 0 0 0 0 350 0 0.0% 25 0 0 0 0
9 Rain Water harvesting 0 2 0 1 1 737 1,474 7.4% 29 42,452 6,368 19,103 16,981
10 Cistern 0 0 0 0 0 57 0 0.0% 90 0 0 0 0
11 Hafir Dam 0 0 0 0 0 493 0 0.0% 98 0 0 0 0
Other 0 0 0 0 0 0.0% 0 0 0 0
12aSingle vil lage from spring source + gravity
distribution with 2 -4 water points (small) 1 0 0 0 20% 1,400 1,400 7.0% 41 56,767 8,515 25,545 22,707
12bSingle vllage from spring source + motorized
distribution with 2 water points (small) 0 0 0 0 1,444 0 0.0% 130 0 0 0 0
12cSingle vllage from spring source + motorized
distribution with 2 water points + solar 0 0 0 0 1,444 0 0.0% 52 0 0 0 0
13aMulti vil lage from spring source + gravity
distribution with 4-6 water points (medium) 0 0 0 0 3,200 0 0.0% 55 0 0 0 0
13bMulti vil lage from spring source + gravity
distribution with 6-10 water points (large) 0 0 0 0 8,100 0 0.0% 38 0 0 0 0
13cMulti vil lage from spring source + motorized
distribution with 4-6 water points (medium) 0 0 0 0 3,200 0 0.0% 76 0 0 0 0
13dMulti vil lage from spring source + motorized
distribution with 6-10 water points (large) 0 0 0 0 8,100 0 0.0% 46 0 0 0 0
13eMulti vil lage from spring source + motorized
distribution with 4-10 water points + solar 0 0 0 0 0 0.0% 0 0 0 0
14aSingle vil lage borehole source + distribution for
4-6 water points (medium) 1 0 0 0 10% 3,500 3,500 17.6% 101 353,468 53,020 159,060 141,387
14bSingle vil lage borehole source + distribution for
4-6 water points + Solar 0 0 0 0 0 0.0% 0 0 0 0
15aMulti vil lage from borehole source with 5-8 km
distribution (large) 1 0 0 0 33% 8,000 8,000 40.2% 74 590,604 88,591 265,772 236,242
15bMulti vil lage from borehole source with 5-8 km
distribution + Solar 0 0 0 0 0 0.0% 0 0 0 0
15cLarge multi vil lage from one or more very deep
boreholes with long km distribution 0 0 0 0 10,000 0 0.0% 134 0 0 0 0
16. Single
Village -
river
16 Single vil lage from river source with treatment
0 0 0 0 0 0 0.0% 0 0 0 0
17. Multi
Village -17 Multi vil lage from river source with treatment
0 0 0 0 0 0 0.0% 118 0 0 0 0
Other 0 0.0% 0 0 0 0
Totals 61 13 2 6 5 20,294 101.9% 1,724,857 258,729 776,186 689,943
Unit cost
per
capita
USD
Total cost
USD
Yearly Financial Plan Yearly Physical plan for 2020 Adjust-
ment
%age
Av.
population
served per
system in
this region
Adjusted
regional
population to
be served by
this system
Proportion
of unserved
population
14. Single
Village -
borehole
10
15. Multi
Village -
borehole
3
Self supply
On spot
12. Single
Village -
spring
5
13. Multi
Village -
spring
0
Type Sr No Technology
No. of
systems
proposed
by Region
Adjusted
No. of
systems

Draft- One WASH Program Document Phase II Updating- May 2010
NATIONAL WASH COORDINATION OFFICE 207
Table 11: Summary of Rural Water Supply: Scheme Technology mix ratio planned by the regions and Adjusted plan
Sr
No
Region Unserved
population To
be served in
the remaining
three years
Self-Supply Spot Supply Piped Water supply System Total
Household
Dug well
with Rope
Pump
Community
Dug well
with Rope
Pump
Dug
well
with
Hand
Pump
SW
(
with
HP)
SW (Solar
system,
Small On
Spot)
BH+Dist
(Small)
On Spot
Capped
Spring
Rain
Water
harvestin
g
Cistern Hafi
r
Da
m
SVS
from
spring
source
MVS
from
spring
source
SVS
from
BH
source
MVS
from BH
source
SVs
from
Surfac
e
Water
MVS from
Surface Water
1 Oromiya
A Regional Plan 4,616,200 5875 1461 4827 372 687 13222
Mix ratio"A" 0.00 0.00 0.44 0.11 0.00 0.00 0.37 0.00 0.00 0.00 0.03 0.00 0.05 0.00 0.00 0.0
0
1.0
B Adjusted Plan 9,292,637 5,875 1,46
1
4,000 500 4,827 5,000 350 300 700 10 10 23033
Mix ratio"B" 0.00 0.00 0.26 0.06 0.17 0.02 0.21 0.22 0.00 0.00 0.02 0.01 0.03 0.00 0.00 0.0
0
1.0
2 Amhara
2 Regional Plan 4,300,607 1,260 1,720 12,00
0
1,50
0
9,000 180
80
60 25800
Mix ratio 0.05 0.07 0.47 0.06 0.00 0.00 0.35 0.01 0.00 0.00 0.00 0.00 0.00 0.00 0.00 0.0
0
1.0
A Adjusted Plan 2,047,926 500 500 500 500 500 200 2,000 180 20 60 10 25 5 5000
Mix ratio"B" 0.10 0.10 0.10 0.10 0.10 0.04 0.40 0.04 0.00 0.00 0.00 0.01 0.00 0.01 0.00 0.0
0
1.0
3 Tigray
A Regional Plan 2,092,712 924 837 2557 80 414 90 22 4924
Mix ratio 0.18 0.00 0.17 0.51 0.00 0.02 0.08 0.00 0.00 0.00 0.00 0.00 0.02 0.00 0.00 0.0
0
1.0
B Adjusted Plan 839,073 300 300 300 200 200 80 200 180 180 15 50 20 2025

Draft- One WASH Program Document Phase II Updating- May 2010
NATIONAL WASH COORDINATION OFFICE 208
Mix ratio"B" 0.15 0.15 0.15 0.10 0.10 0.04 0.10 0.00 0.09 0.09 0.01 0.00 0.02 0.01 0.00 0.0
0
1.0
4 SNNP
A Regional Plan 12,203,384 2166 1296 4659 3332 344 534 12331
Mix ratio 0.00 0.18 0.11 0.38 0.00 0.00 0.27 0.00 0.00 0.00 0.03 0.00 0.04 0.00 0.00 0.0
0
1.0
B Adjusted Plan 6,394,009 2,166 1,296 3,00
0
1,000 0 3,332 1,500 444 584 100 13422
Mix ratio"B" 0.00 0.16 0.10 0.22 0.07 0.00 0.25 0.11 0.00 0.00 0.03 0.00 0.04 0.01 0.00 0.0
0
1.0
5 Benshiangul-Gumuz
A Regional Plan 13,203,384 120 624 10 24 10 8 796
Mix ratio 0.00 0.00 0.15 0.78 0.01 0.00 0.03 0.00 0.00 0.00 0.00 0.00 0.01 0.01 0.00 0.0
0
1.0
B Adjusted Plan 265,924 2,166 1,296 3,00
0
1,000 0 3,332 1,500 444 584 100 13422
Mix ratio"B" 0.00 0.16 0.10 0.22 0.07 0.00 0.25 0.11 0.00 0.00 0.03 0.00 0.04 0.01 0.00 0.0
0
1.0
6 Gambela
A Regional Plan 116,331 650 163 238 111 34 8 12 1216
Mix ratio 0.53 0.00 0.13 0.20 0.09 0.00 0.03 0.00 0.00 0.00 0.01 0.00 0.01 0.00 0.00 0.0
0
1.0
B Adjusted Plan 47,741 120 624 10 15 7 3 2 1 782
Mix ratio"B" 0.00 0.00 0.15 0.80 0.01 0.00 0.02 0.00 0.00 0.01 0.00 0.00 0.00 0.00 0.00 0.0
0
1.0
7 Afar
A Regional Plan 125,028.3 148 96 53 7 40 163 7 117 631
Mix ratio 0.00 0.00 0.23 0.15 0.08 0.00 0.01 0.06 0.26 0.01 0.00 0.00 0.19 0.00 0.00 0.0
0
1.0
B Adjusted Plan 690,331 148 96 100 7 100 163 7 70 30 721
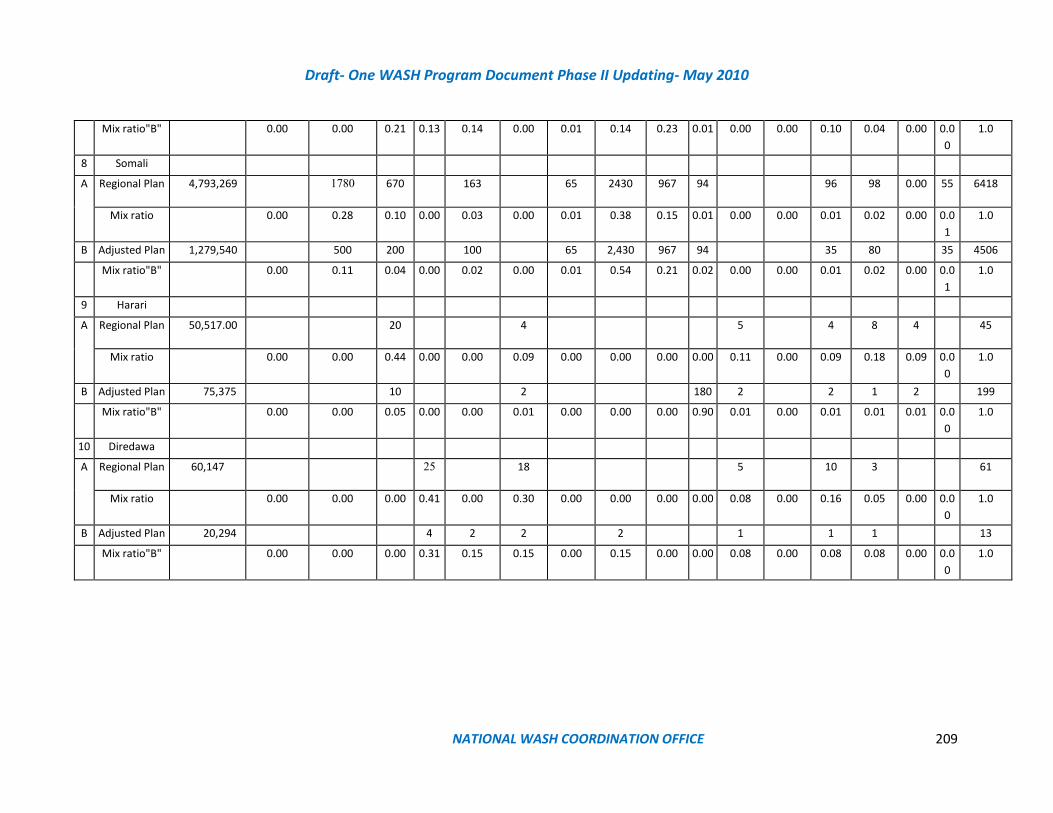
Draft- One WASH Program Document Phase II Updating- May 2010
NATIONAL WASH COORDINATION OFFICE 209
Mix ratio"B" 0.00 0.00 0.21 0.13 0.14 0.00 0.01 0.14 0.23 0.01 0.00 0.00 0.10 0.04 0.00 0.0
0
1.0
8 Somali
A Regional Plan 4,793,269 1780 670 163 65 2430 967 94 96 98 0.00 55 6418
Mix ratio 0.00 0.28 0.10 0.00 0.03 0.00 0.01 0.38 0.15 0.01 0.00 0.00 0.01 0.02 0.00 0.0
1
1.0
B Adjusted Plan 1,279,540 500 200 100 65 2,430 967 94 35 80 35 4506
Mix ratio"B" 0.00 0.11 0.04 0.00 0.02 0.00 0.01 0.54 0.21 0.02 0.00 0.00 0.01 0.02 0.00 0.0
1
1.0
9 Harari
A Regional Plan 50,517.00 20 4 5 4 8 4 45
Mix ratio 0.00 0.00 0.44 0.00 0.00 0.09 0.00 0.00 0.00 0.00 0.11 0.00 0.09 0.18 0.09 0.0
0
1.0
B Adjusted Plan 75,375 10 2 180 2 2 1 2 199
Mix ratio"B" 0.00 0.00 0.05 0.00 0.00 0.01 0.00 0.00 0.00 0.90 0.01 0.00 0.01 0.01 0.01 0.0
0
1.0
10 Diredawa
A Regional Plan 60,147 25 18 5 10 3 61
Mix ratio 0.00 0.00 0.00 0.41 0.00 0.30 0.00 0.00 0.00 0.00 0.08 0.00 0.16 0.05 0.00 0.0
0
1.0
B Adjusted Plan 20,294 4 2 2 2 1 1 1 13
Mix ratio"B" 0.00 0.00 0.00 0.31 0.15 0.15 0.00 0.15 0.00 0.00 0.08 0.00 0.08 0.08 0.00 0.0
0
1.0
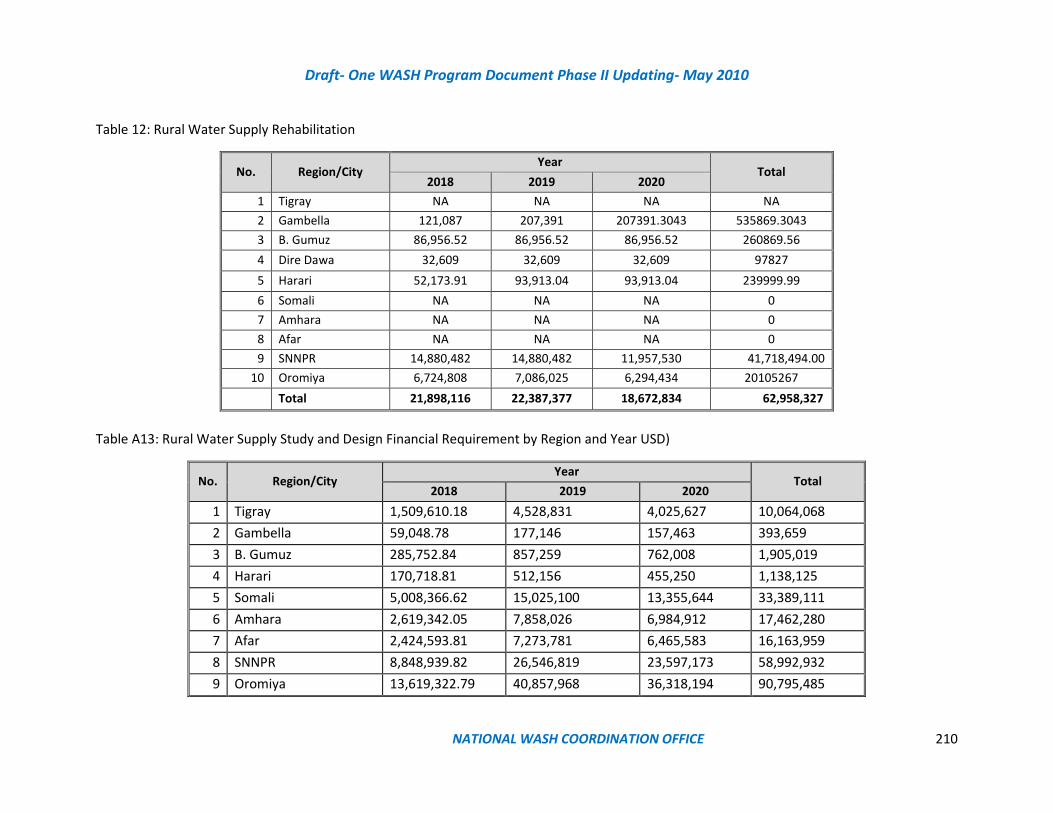
Draft- One WASH Program Document Phase II Updating- May 2010
NATIONAL WASH COORDINATION OFFICE 210
Table 12: Rural Water Supply Rehabilitation
No. Region/City Year
Total 2018 2019 2020
1 Tigray NA NA NA NA
2 Gambella 121,087 207,391 207391.3043 535869.3043
3 B. Gumuz 86,956.52 86,956.52 86,956.52 260869.56
4 Dire Dawa 32,609 32,609 32,609 97827
5 Harari 52,173.91 93,913.04 93,913.04 239999.99
6 Somali NA NA NA 0
7 Amhara NA NA NA 0
8 Afar NA NA NA 0
9 SNNPR 14,880,482 14,880,482 11,957,530 41,718,494.00
10 Oromiya 6,724,808 7,086,025 6,294,434 20105267
Total 21,898,116 22,387,377 18,672,834 62,958,327
Table A13: Rural Water Supply Study and Design Financial Requirement by Region and Year USD)
No. Region/City Year
Total 2018 2019 2020
1 Tigray 1,509,610.18 4,528,831 4,025,627 10,064,068
2 Gambella 59,048.78 177,146 157,463 393,659
3 B. Gumuz 285,752.84 857,259 762,008 1,905,019
4 Harari 170,718.81 512,156 455,250 1,138,125
5 Somali 5,008,366.62 15,025,100 13,355,644 33,389,111
6 Amhara 2,619,342.05 7,858,026 6,984,912 17,462,280
7 Afar 2,424,593.81 7,273,781 6,465,583 16,163,959
8 SNNPR 8,848,939.82 26,546,819 23,597,173 58,992,932
9 Oromiya 13,619,322.79 40,857,968 36,318,194 90,795,485

Draft- One WASH Program Document Phase II Updating- May 2010
NATIONAL WASH COORDINATION OFFICE 211
10 Dire Dawa 13,619,322.79 40,857,968 36,318,194 90,795,485
Total 48,165,018.49 144,495,055 128,440,049 321,100,123
Table 14: Rural Water Supply Environmental safeguards
No. Region Year
Total (USD) 2018 2019 2020
1 Afar 266,628 799,885 711,009 1,777,523
2 Amhara 3,350,952 10,052,857 8,935,873 22,339,682
3 B. Gumuz 133,314 399,943 355,505 888,761
4 Dire Dawa 25,711 77,134 68,563 171,408
5 Gambella 57,135 171,404 152,359 380,898
6 Harari 19,998 59,993 53,327 133,318
7 Oromiya 5,690,621 17,071,863 15,174,989 37,937,473
8 SNNP 3,213,829 9,641,487 8,570,211 21,425,527
9 Somali 879,875 2,639,625 2,346,333 5,865,834
10 Tigray 788,460 2,365,379 2,102,559 5,256,397
11 Federal 1,188,477 3,565,430 3,169,271 7,923,178
Total 15,615,000 46,845,000 41,640,000 104,100,000
Table 15 Rural Water Supply Water safety, Catchment protection &Water resource management plan
No. Region Year
Total (USD) 2014 2015
1 Tigray 278,352 835,055 742,271 1,855,677
2 Gambella 77,070 231,211 205,521 513,803
3 B. Gumuz 177,589 532,767 473,570 1,183,926
4 Diredawa 5,058 15,173 13,487 33,717
5 Harari 5,008 15,023 13,354 33,385
6 Somali 417,839 1,253,516 1,114,237 2,785,592

Draft- One WASH Program Document Phase II Updating- May 2010
NATIONAL WASH COORDINATION OFFICE 212
No. Region Year
Total (USD) 2014 2015
7 Amhara 2,526,539 7,579,617 6,737,437 16,843,593
8 Afar 165,390 496,171 441,041 1,102,603
9 SNNPR 2,101,315 6,303,945 5,603,507 14,008,767
10 Oromiya 3,943,550 11,830,651 10,516,134 26,290,335
Total 9,697,710 29,093,130 25,860,560 64,651,400
Table 16 Rural Water Supply: Catchment Protection &Water Resource Management plan
No. Region Year
Total (USD) 2018 2019 2020
1 Afar 141,965 425,894 378,572 946,431
2 Amhara 1,784,194 5,352,581 4,757,850 11,894,625
3 B. Gumuz 70,982 212,947 189,286 473,215
4 Dire Dawa 13,690 41,069 36,506 91,265
5 Gambella 30,421 91,263 81,123 202,807
6 Harari 10,648 31,943 28,394 70,985
7 Oromia 3,029,936 9,089,808 8,079,829 20,199,573
8 SNNP 1,711,183 5,133,550 4,563,156 11,407,889
9 Somali 468,484 1,405,452 1,249,291 3,123,227
10 Tigray 419,810 1,259,431 1,119,494 2,798,736
11 Federal 632,797 1,898,391 1,687,459 4,218,647
Total 8,314,110 24,942,330 22,170,960 55,427,400

Draft- One WASH Program Document Phase II Updating- May 2010
NATIONAL WASH COORDINATION OFFICE 213
Table 17 Rural Sanitation: Establish local builder Supply Chain/sanitation market or products and services for rural sanitation low cost
technologies and spare parts.
No. Region Year
Total (USD) 2018 2019 2020
1 Afar 1,561,500 4,684,500 4,164,000 10,410,000
2 Amhara 780,750 2,342,250 2,082,000 5,205,000
3 B. Gumuz 780,750 2,342,250 2,082,000 5,205,000
4 Dire Dawa 780,750 2,342,250 2,082,000 5,205,000
5 Gambella 780,750 2,342,250 2,082,000 5,205,000
6 Harari 1,561,500 4,684,500 4,164,000 10,410,000
7 Oromia 2,342,250 7,026,750 6,246,000 15,615,000
8 SNNP 1,561,500 4,684,500 4,164,000 10,410,000
9 Somali 2,342,250 7,026,750 6,246,000 15,615,000
10 Tigray 3,123,000 9,369,000 8,328,000 20,820,000
Total 15,615,000 46,845,000 41,640,000 198,000,000
Table 18 Rural Sanitation: Research and Produce pilot projects for Rural communal and HH sanitation
No. Region Year
Total (USD) 2018 2019 2020
1 Afar 990,000 2,970,000 2,640,000 6,600,000
2 Amhara 495,000 1,485,000 1,320,000 3,300,000
3 B. Gumuz 495,000 1,485,000 1,320,000 3,300,000
4 Dire Dawa 495,000 1,485,000 1,320,000 3,300,000
5 Gambella 495,000 1,485,000 1,320,000 3,300,000
6 Harari 990,000 2,970,000 2,640,000 6,600,000
7 Oromia 1,485,000 4,455,000 3,960,000 9,900,000
8 SNNP 990,000 2,970,000 2,640,000 6,600,000
9 Somali 1,485,000 4,455,000 3,960,000 9,900,000
10 Tigray 1,980,000 5,940,000 5,280,000 13,200,000
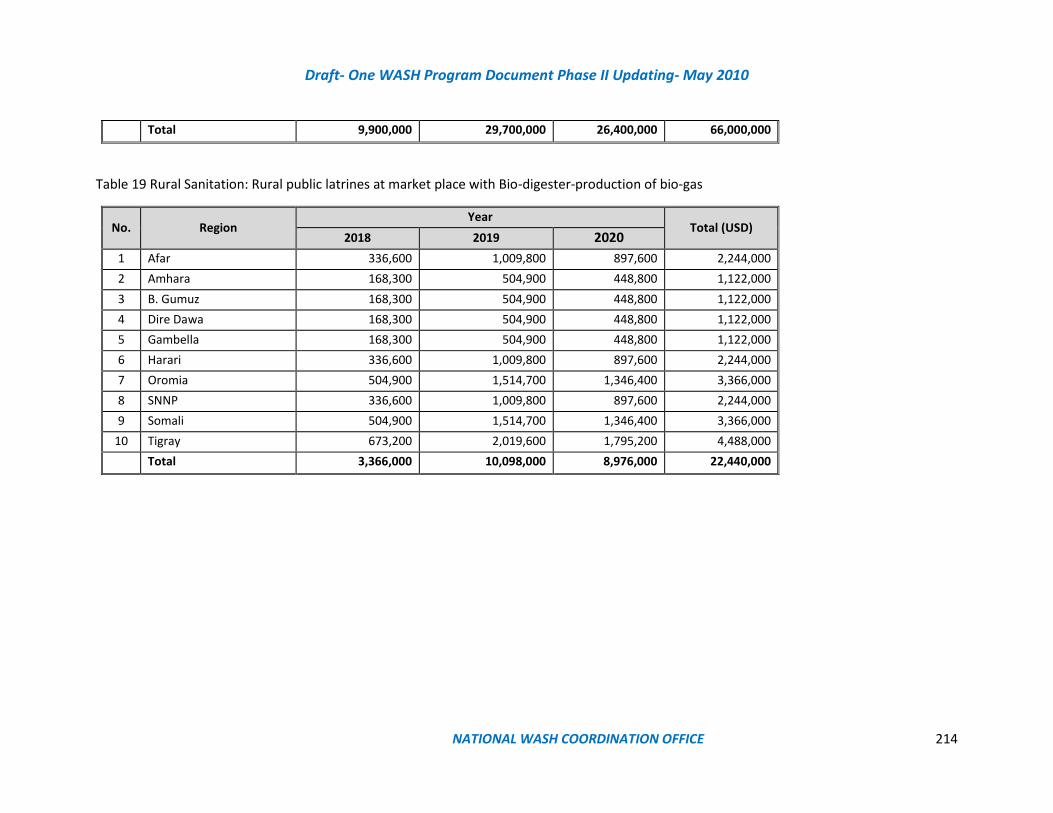
Draft- One WASH Program Document Phase II Updating- May 2010
NATIONAL WASH COORDINATION OFFICE 214
Total 9,900,000 29,700,000 26,400,000 66,000,000
Table 19 Rural Sanitation: Rural public latrines at market place with Bio-digester-production of bio-gas
No. Region Year
Total (USD) 2018 2019 2020
1 Afar 336,600 1,009,800 897,600 2,244,000
2 Amhara 168,300 504,900 448,800 1,122,000
3 B. Gumuz 168,300 504,900 448,800 1,122,000
4 Dire Dawa 168,300 504,900 448,800 1,122,000
5 Gambella 168,300 504,900 448,800 1,122,000
6 Harari 336,600 1,009,800 897,600 2,244,000
7 Oromia 504,900 1,514,700 1,346,400 3,366,000
8 SNNP 336,600 1,009,800 897,600 2,244,000
9 Somali 504,900 1,514,700 1,346,400 3,366,000
10 Tigray 673,200 2,019,600 1,795,200 4,488,000
Total 3,366,000 10,098,000 8,976,000 22,440,000
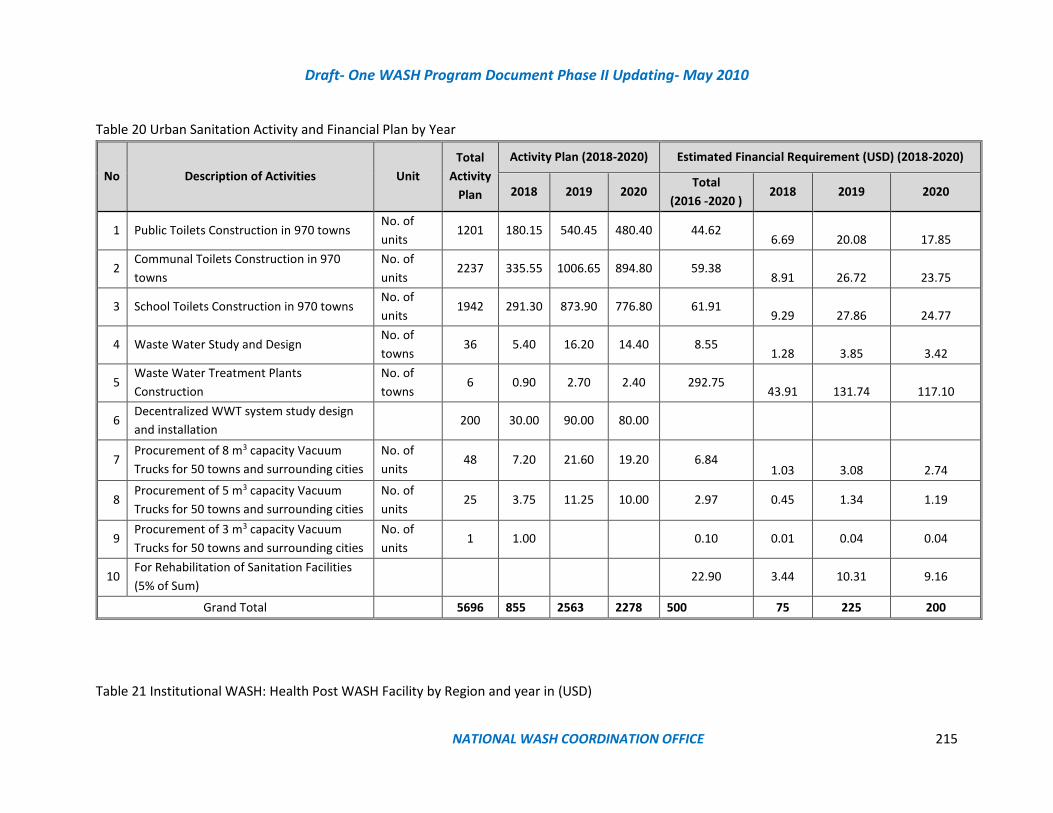
Draft- One WASH Program Document Phase II Updating- May 2010
NATIONAL WASH COORDINATION OFFICE 215
Table 20 Urban Sanitation Activity and Financial Plan by Year
No Description of Activities Unit
Total
Activity
Plan
Activity Plan (2018-2020) Estimated Financial Requirement (USD) (2018-2020)
2018 2019 2020 Total
(2016 -2020 ) 2018 2019 2020
1 Public Toilets Construction in 970 towns No. of
units 1201 180.15 540.45 480.40 44.62
6.69 20.08 17.85
2 Communal Toilets Construction in 970
towns
No. of
units 2237 335.55 1006.65 894.80 59.38
8.91 26.72 23.75
3 School Toilets Construction in 970 towns No. of
units 1942 291.30 873.90 776.80 61.91
9.29 27.86 24.77
4 Waste Water Study and Design No. of
towns 36 5.40 16.20 14.40 8.55
1.28 3.85 3.42
5 Waste Water Treatment Plants
Construction
No. of
towns 6 0.90 2.70 2.40 292.75
43.91 131.74 117.10
6 Decentralized WWT system study design
and installation 200 30.00 90.00 80.00
7 Procurement of 8 m3 capacity Vacuum
Trucks for 50 towns and surrounding cities
No. of
units 48 7.20 21.60 19.20 6.84
1.03 3.08 2.74
8 Procurement of 5 m3 capacity Vacuum
Trucks for 50 towns and surrounding cities
No. of
units 25 3.75 11.25 10.00 2.97 0.45 1.34 1.19
9 Procurement of 3 m3 capacity Vacuum
Trucks for 50 towns and surrounding cities
No. of
units 1 1.00 0.10 0.01 0.04 0.04
10 For Rehabilitation of Sanitation Facilities
(5% of Sum) 22.90 3.44 10.31 9.16
Grand Total 5696 855 2563 2278 500 75 225 200
Table 21 Institutional WASH: Health Post WASH Facility by Region and year in (USD)
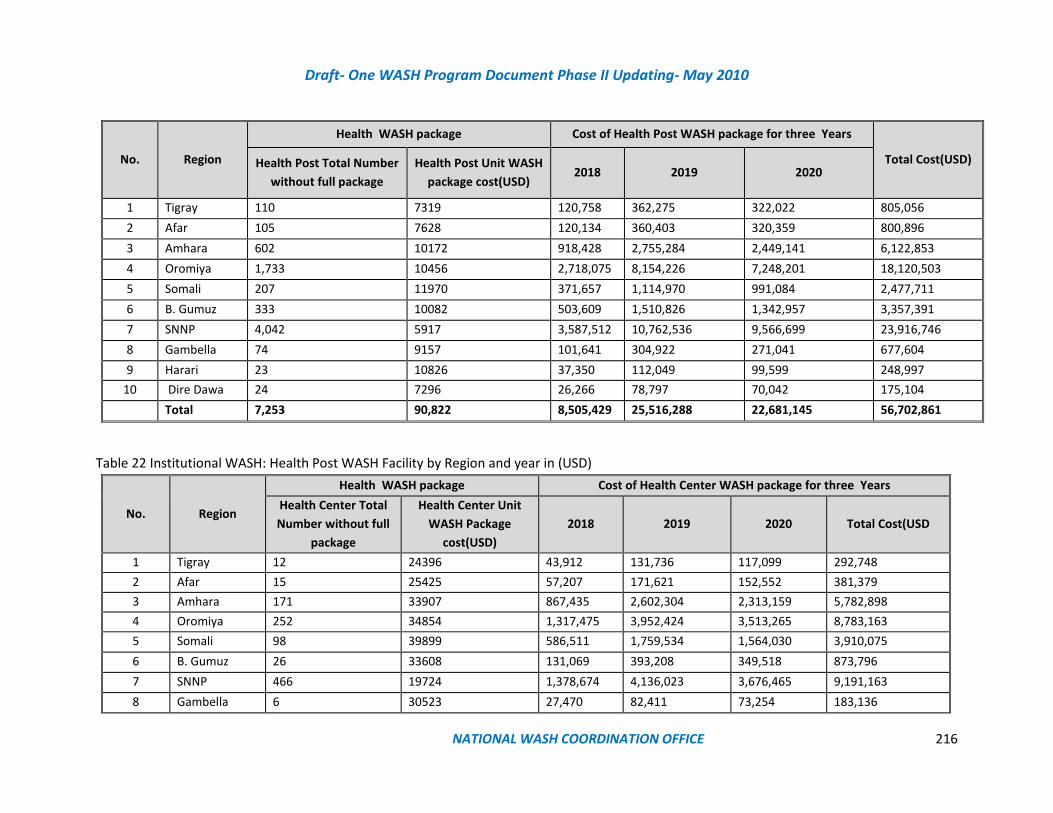
Draft- One WASH Program Document Phase II Updating- May 2010
NATIONAL WASH COORDINATION OFFICE 216
No. Region
Health WASH package Cost of Health Post WASH package for three Years
Total Cost(USD) Health Post Total Number
without full package
Health Post Unit WASH
package cost(USD) 2018 2019 2020
1 Tigray 110 7319 120,758 362,275 322,022 805,056
2 Afar 105 7628 120,134 360,403 320,359 800,896
3 Amhara 602 10172 918,428 2,755,284 2,449,141 6,122,853
4 Oromiya 1,733 10456 2,718,075 8,154,226 7,248,201 18,120,503
5 Somali 207 11970 371,657 1,114,970 991,084 2,477,711
6 B. Gumuz 333 10082 503,609 1,510,826 1,342,957 3,357,391
7 SNNP 4,042 5917 3,587,512 10,762,536 9,566,699 23,916,746
8 Gambella 74 9157 101,641 304,922 271,041 677,604
9 Harari 23 10826 37,350 112,049 99,599 248,997
10 Dire Dawa 24 7296 26,266 78,797 70,042 175,104
Total 7,253 90,822 8,505,429 25,516,288 22,681,145 56,702,861
Table 22 Institutional WASH: Health Post WASH Facility by Region and year in (USD)
No. Region
Health WASH package Cost of Health Center WASH package for three Years
Health Center Total
Number without full
package
Health Center Unit
WASH Package
cost(USD)
2018 2019 2020 Total Cost(USD
1 Tigray 12 24396 43,912 131,736 117,099 292,748
2 Afar 15 25425 57,207 171,621 152,552 381,379
3 Amhara 171 33907 867,435 2,602,304 2,313,159 5,782,898
4 Oromiya 252 34854 1,317,475 3,952,424 3,513,265 8,783,163
5 Somali 98 39899 586,511 1,759,534 1,564,030 3,910,075
6 B. Gumuz 26 33608 131,069 393,208 349,518 873,796
7 SNNP 466 19724 1,378,674 4,136,023 3,676,465 9,191,163
8 Gambella 6 30523 27,470 82,411 73,254 183,136
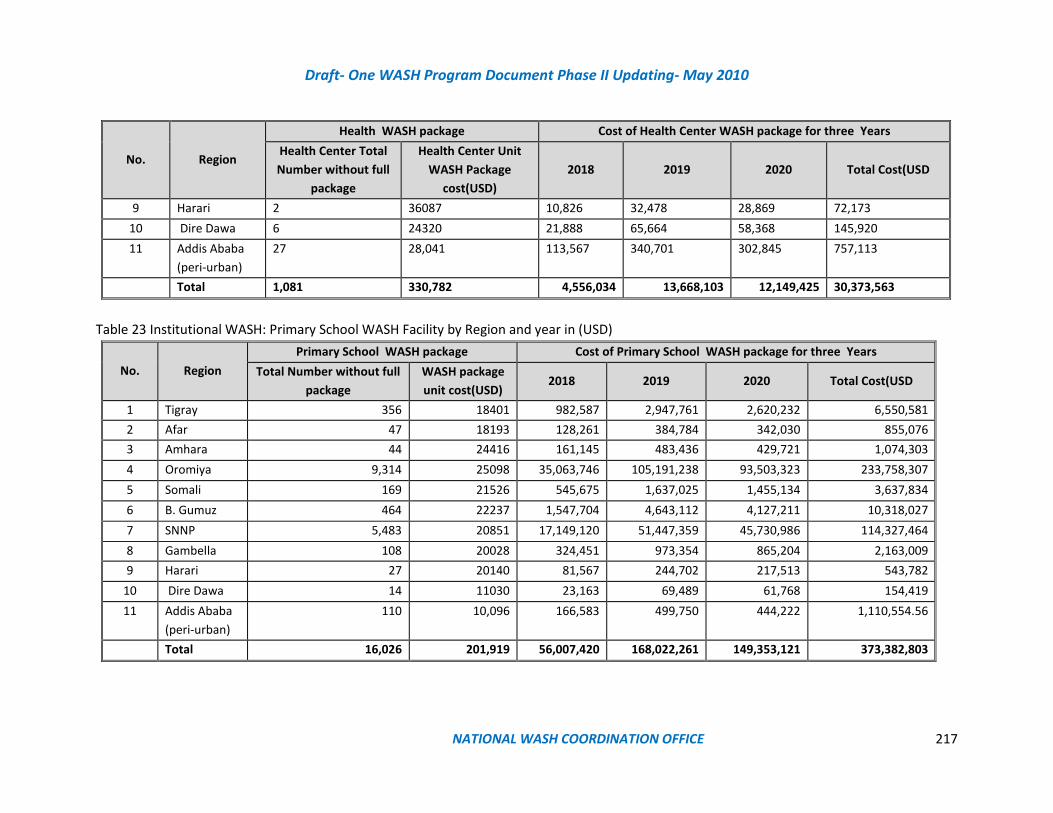
Draft- One WASH Program Document Phase II Updating- May 2010
NATIONAL WASH COORDINATION OFFICE 217
No. Region
Health WASH package Cost of Health Center WASH package for three Years
Health Center Total
Number without full
package
Health Center Unit
WASH Package
cost(USD)
2018 2019 2020 Total Cost(USD
9 Harari 2 36087 10,826 32,478 28,869 72,173
10 Dire Dawa 6 24320 21,888 65,664 58,368 145,920
11 Addis Ababa
(peri-urban)
27 28,041 113,567 340,701 302,845 757,113
Total 1,081 330,782 4,556,034 13,668,103 12,149,425 30,373,563
Table 23 Institutional WASH: Primary School WASH Facility by Region and year in (USD)
No. Region
Primary School WASH package Cost of Primary School WASH package for three Years
Total Number without full
package
WASH package
unit cost(USD) 2018 2019 2020 Total Cost(USD
1 Tigray 356 18401 982,587 2,947,761 2,620,232 6,550,581
2 Afar 47 18193 128,261 384,784 342,030 855,076
3 Amhara 44 24416 161,145 483,436 429,721 1,074,303
4 Oromiya 9,314 25098 35,063,746 105,191,238 93,503,323 233,758,307
5 Somali 169 21526 545,675 1,637,025 1,455,134 3,637,834
6 B. Gumuz 464 22237 1,547,704 4,643,112 4,127,211 10,318,027
7 SNNP 5,483 20851 17,149,120 51,447,359 45,730,986 114,327,464
8 Gambella 108 20028 324,451 973,354 865,204 2,163,009
9 Harari 27 20140 81,567 244,702 217,513 543,782
10 Dire Dawa 14 11030 23,163 69,489 61,768 154,419
11 Addis Ababa
(peri-urban)
110 10,096 166,583 499,750 444,222 1,110,554.56
Total 16,026 201,919 56,007,420 168,022,261 149,353,121 373,382,803
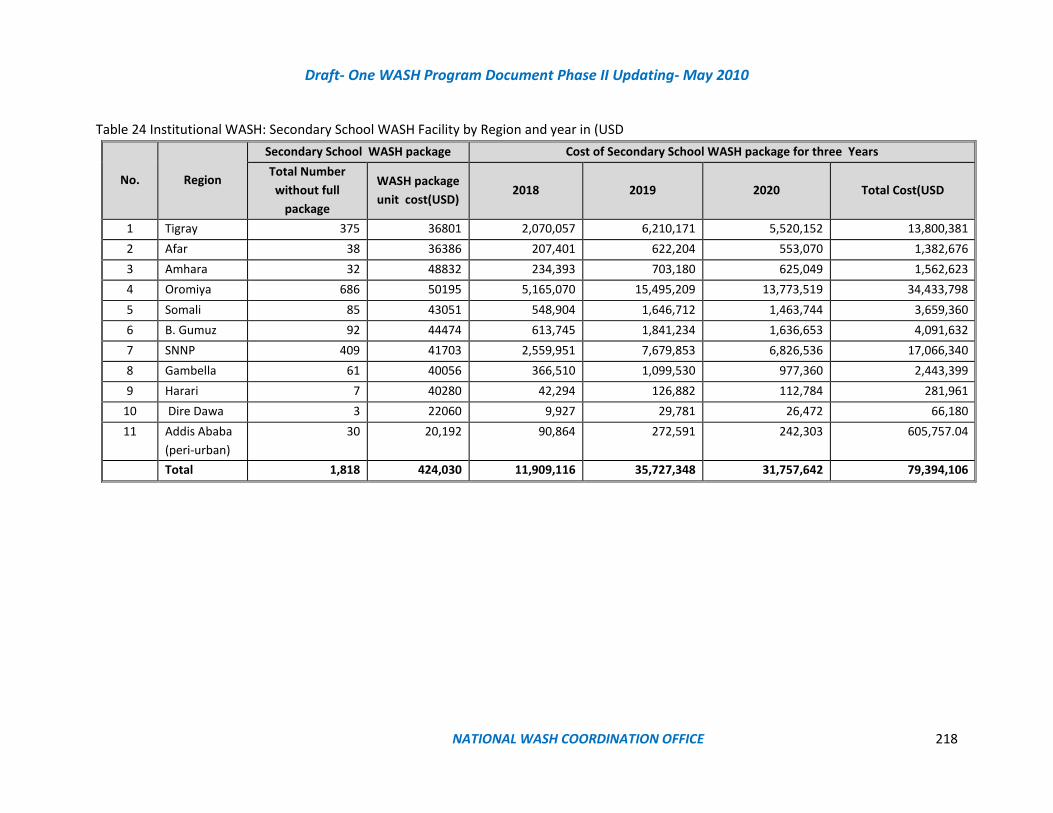
Draft- One WASH Program Document Phase II Updating- May 2010
NATIONAL WASH COORDINATION OFFICE 218
Table 24 Institutional WASH: Secondary School WASH Facility by Region and year in (USD
No. Region
Secondary School WASH package Cost of Secondary School WASH package for three Years
Total Number
without full
package
WASH package
unit cost(USD) 2018 2019 2020 Total Cost(USD
1 Tigray 375 36801 2,070,057 6,210,171 5,520,152 13,800,381
2 Afar 38 36386 207,401 622,204 553,070 1,382,676
3 Amhara 32 48832 234,393 703,180 625,049 1,562,623
4 Oromiya 686 50195 5,165,070 15,495,209 13,773,519 34,433,798
5 Somali 85 43051 548,904 1,646,712 1,463,744 3,659,360
6 B. Gumuz 92 44474 613,745 1,841,234 1,636,653 4,091,632
7 SNNP 409 41703 2,559,951 7,679,853 6,826,536 17,066,340
8 Gambella 61 40056 366,510 1,099,530 977,360 2,443,399
9 Harari 7 40280 42,294 126,882 112,784 281,961
10 Dire Dawa 3 22060 9,927 29,781 26,472 66,180
11 Addis Ababa
(peri-urban)
30 20,192 90,864 272,591 242,303 605,757.04
Total 1,818 424,030 11,909,116 35,727,348 31,757,642 79,394,106
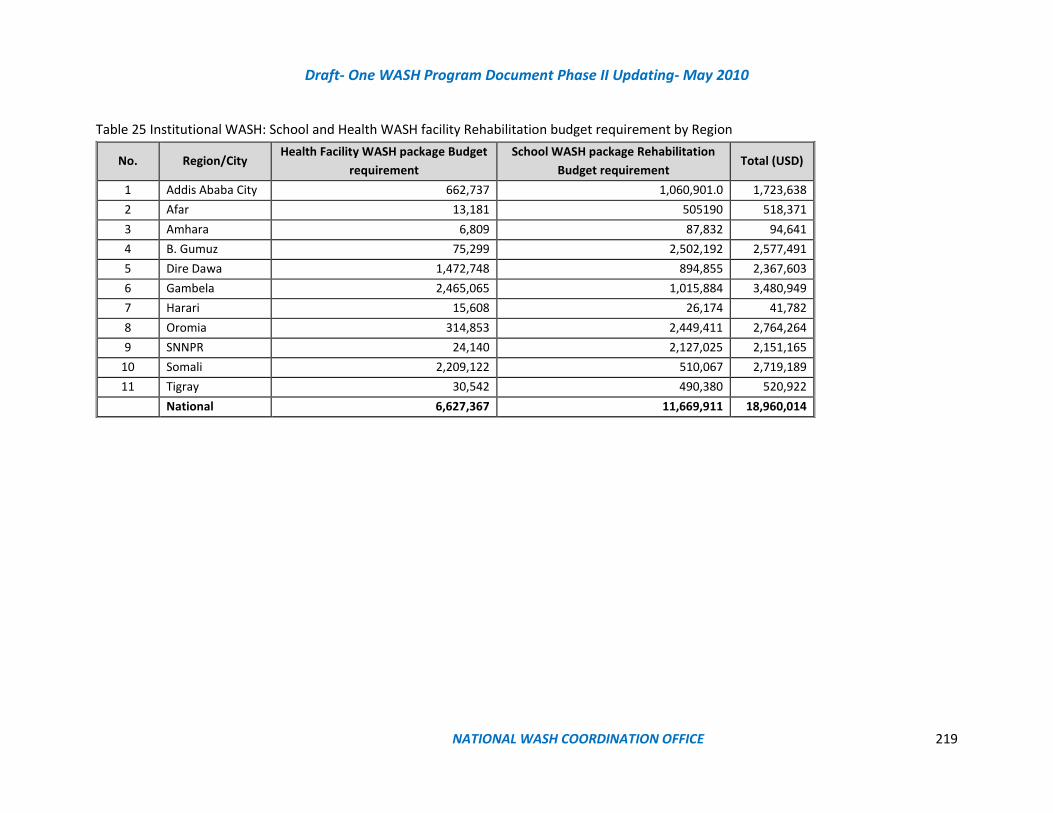
Draft- One WASH Program Document Phase II Updating- May 2010
NATIONAL WASH COORDINATION OFFICE 219
Table 25 Institutional WASH: School and Health WASH facility Rehabilitation budget requirement by Region
No. Region/City Health Facility WASH package Budget
requirement
School WASH package Rehabilitation
Budget requirement Total (USD)
1 Addis Ababa City 662,737 1,060,901.0 1,723,638
2 Afar 13,181 505190 518,371
3 Amhara 6,809 87,832 94,641
4 B. Gumuz 75,299 2,502,192 2,577,491
5 Dire Dawa 1,472,748 894,855 2,367,603
6 Gambela 2,465,065 1,015,884 3,480,949
7 Harari 15,608 26,174 41,782
8 Oromia 314,853 2,449,411 2,764,264
9 SNNPR 24,140 2,127,025 2,151,165
10 Somali 2,209,122 510,067 2,719,189
11 Tigray 30,542 490,380 520,922
National 6,627,367 11,669,911 18,960,014
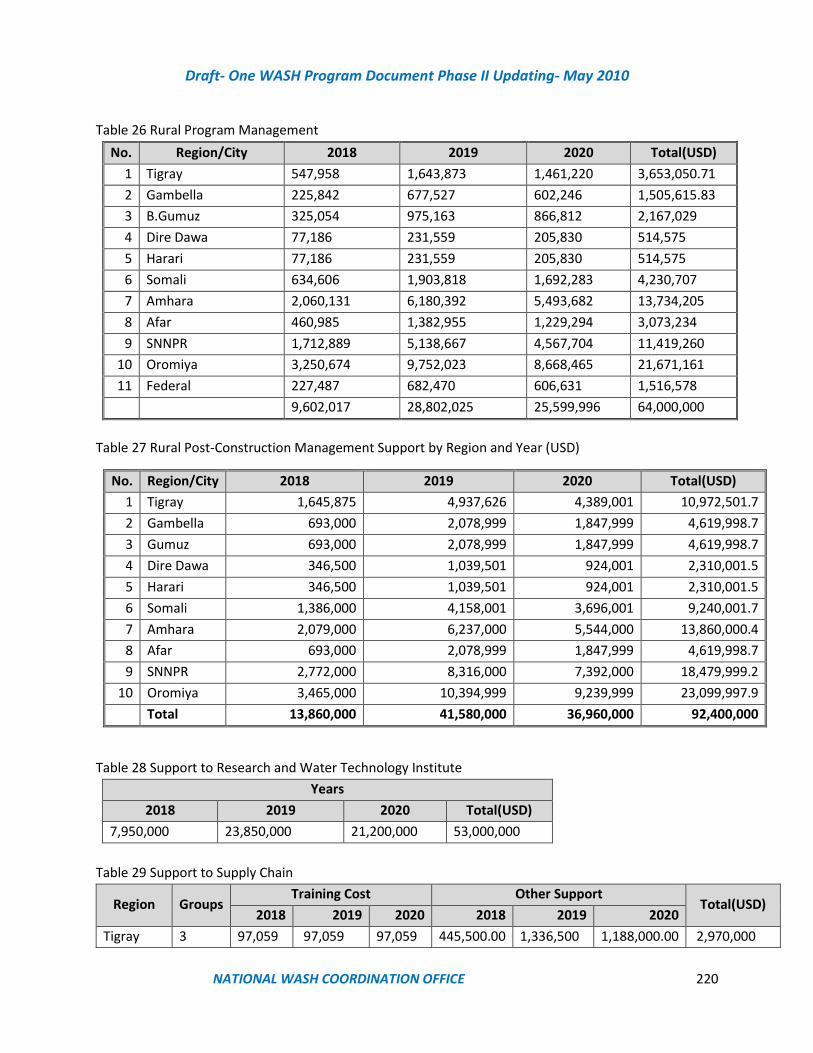
Draft- One WASH Program Document Phase II Updating- May 2010
NATIONAL WASH COORDINATION OFFICE 220
Table 26 Rural Program Management
No. Region/City 2018 2019 2020 Total(USD)
1 Tigray 547,958 1,643,873 1,461,220 3,653,050.71
2 Gambella 225,842 677,527 602,246 1,505,615.83
3 B.Gumuz 325,054 975,163 866,812 2,167,029
4 Dire Dawa 77,186 231,559 205,830 514,575
5 Harari 77,186 231,559 205,830 514,575
6 Somali 634,606 1,903,818 1,692,283 4,230,707
7 Amhara 2,060,131 6,180,392 5,493,682 13,734,205
8 Afar 460,985 1,382,955 1,229,294 3,073,234
9 SNNPR 1,712,889 5,138,667 4,567,704 11,419,260
10 Oromiya 3,250,674 9,752,023 8,668,465 21,671,161
11 Federal 227,487 682,470 606,631 1,516,578
9,602,017 28,802,025 25,599,996 64,000,000
Table 27 Rural Post-Construction Management Support by Region and Year (USD)
No. Region/City 2018 2019 2020 Total(USD)
1 Tigray 1,645,875 4,937,626 4,389,001 10,972,501.7
2 Gambella 693,000 2,078,999 1,847,999 4,619,998.7
3 Gumuz 693,000 2,078,999 1,847,999 4,619,998.7
4 Dire Dawa 346,500 1,039,501 924,001 2,310,001.5
5 Harari 346,500 1,039,501 924,001 2,310,001.5
6 Somali 1,386,000 4,158,001 3,696,001 9,240,001.7
7 Amhara 2,079,000 6,237,000 5,544,000 13,860,000.4
8 Afar 693,000 2,078,999 1,847,999 4,619,998.7
9 SNNPR 2,772,000 8,316,000 7,392,000 18,479,999.2
10 Oromiya 3,465,000 10,394,999 9,239,999 23,099,997.9
Total 13,860,000 41,580,000 36,960,000 92,400,000
Table 28 Support to Research and Water Technology Institute
Years
2018 2019 2020 Total(USD)
7,950,000 23,850,000 21,200,000 53,000,000
Table 29 Support to Supply Chain
Region Groups Training Cost Other Support
Total(USD) 2018 2019 2020 2018 2019 2020
Tigray 3 97,059 97,059 97,059 445,500.00 1,336,500 1,188,000.00 2,970,000
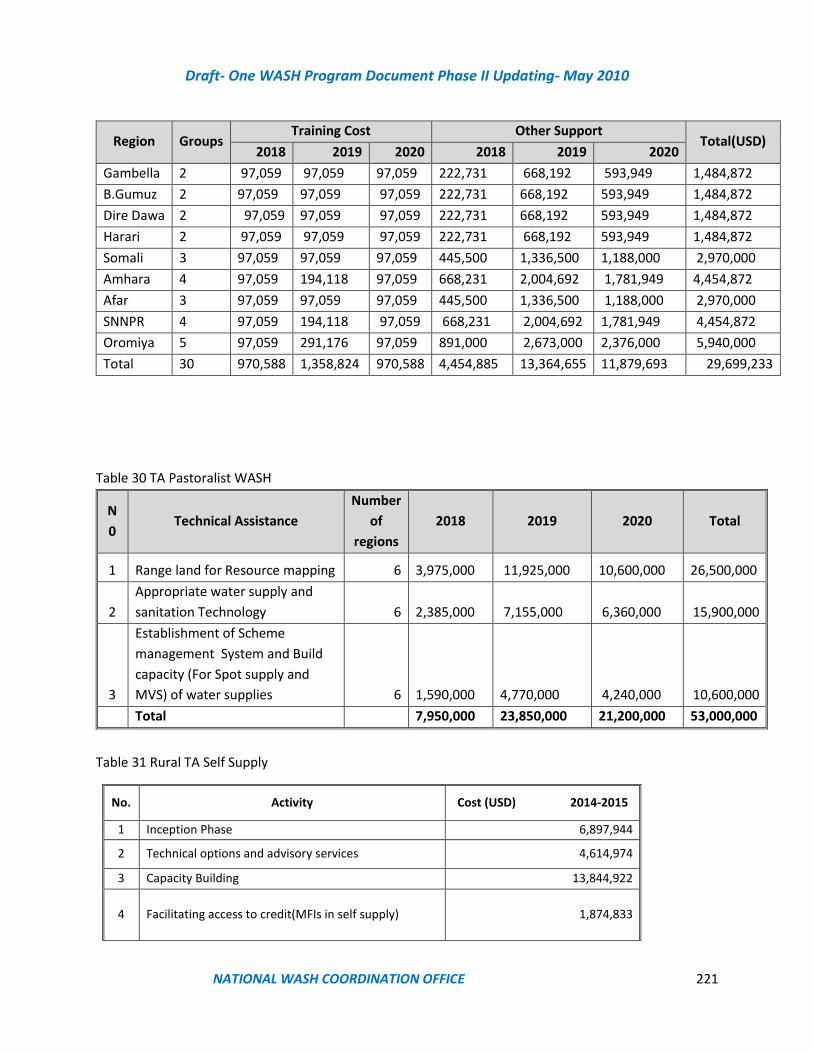
Draft- One WASH Program Document Phase II Updating- May 2010
NATIONAL WASH COORDINATION OFFICE 221
Region Groups Training Cost Other Support
Total(USD) 2018 2019 2020 2018 2019 2020
Gambella 2 97,059 97,059 97,059 222,731 668,192 593,949 1,484,872
B.Gumuz 2 97,059 97,059 97,059 222,731 668,192 593,949 1,484,872
Dire Dawa 2 97,059 97,059 97,059 222,731 668,192 593,949 1,484,872
Harari 2 97,059 97,059 97,059 222,731 668,192 593,949 1,484,872
Somali 3 97,059 97,059 97,059 445,500 1,336,500 1,188,000 2,970,000
Amhara 4 97,059 194,118 97,059 668,231 2,004,692 1,781,949 4,454,872
Afar 3 97,059 97,059 97,059 445,500 1,336,500 1,188,000 2,970,000
SNNPR 4 97,059 194,118 97,059 668,231 2,004,692 1,781,949 4,454,872
Oromiya 5 97,059 291,176 97,059 891,000 2,673,000 2,376,000 5,940,000
Total 30 970,588 1,358,824 970,588 4,454,885 13,364,655 11,879,693 29,699,233
Table 30 TA Pastoralist WASH
N
0 Technical Assistance
Number
of
regions
2018 2019 2020 Total
1 Range land for Resource mapping 6 3,975,000 11,925,000 10,600,000 26,500,000
2
Appropriate water supply and
sanitation Technology 6 2,385,000 7,155,000 6,360,000
15,900,000
3
Establishment of Scheme
management System and Build
capacity (For Spot supply and
MVS) of water supplies 6 1,590,000 4,770,000 4,240,000
10,600,000
Total 7,950,000 23,850,000 21,200,000 53,000,000
Table 31 Rural TA Self Supply
No. Activity Cost (USD) 2014-2015
1 Inception Phase 6,897,944
2 Technical options and advisory services 4,614,974
3 Capacity Building 13,844,922
4 Facilitating access to credit(MFIs in self supply) 1,874,833
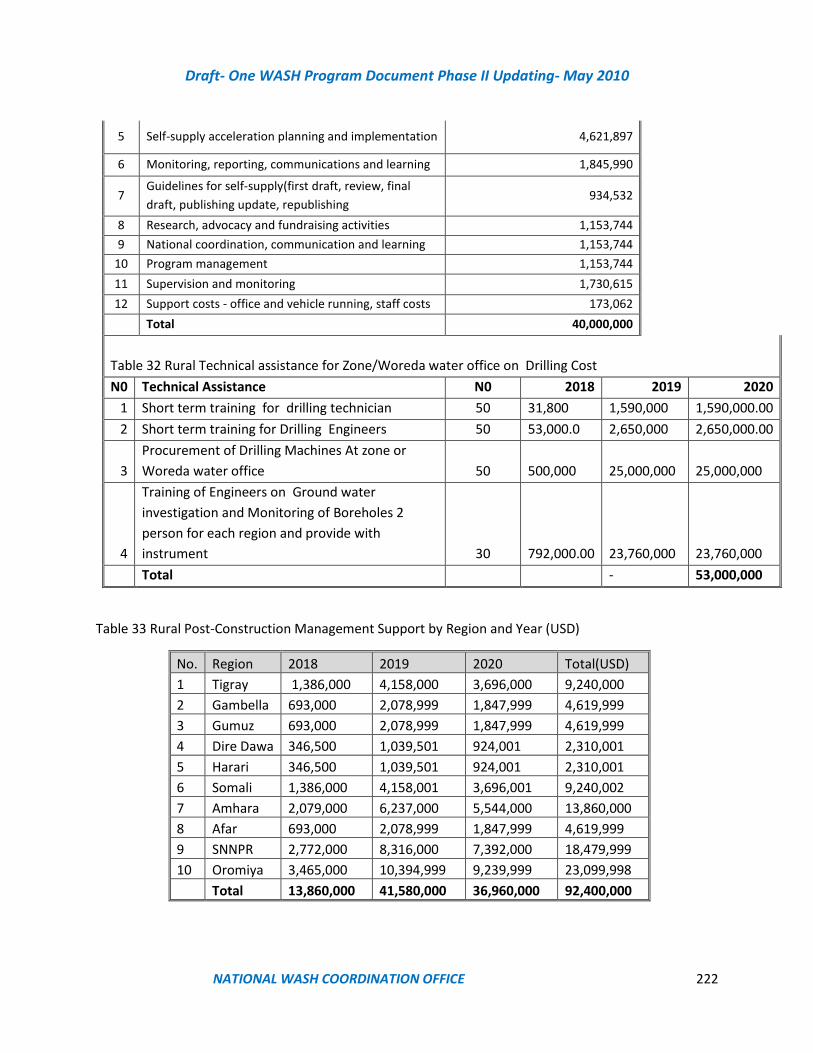
Draft- One WASH Program Document Phase II Updating- May 2010
NATIONAL WASH COORDINATION OFFICE 222
5 Self-supply acceleration planning and implementation 4,621,897
6 Monitoring, reporting, communications and learning 1,845,990
7 Guidelines for self-supply(first draft, review, final
draft, publishing update, republishing 934,532
8 Research, advocacy and fundraising activities 1,153,744
9 National coordination, communication and learning 1,153,744
10 Program management 1,153,744
11 Supervision and monitoring 1,730,615
12 Support costs - office and vehicle running, staff costs 173,062
Total 40,000,000
Table 32 Rural Technical assistance for Zone/Woreda water office on Drilling Cost
N0 Technical Assistance N0 2018 2019 2020
1 Short term training for drilling technician 50 31,800 1,590,000 1,590,000.00
2 Short term training for Drilling Engineers 50 53,000.0 2,650,000 2,650,000.00
3
Procurement of Drilling Machines At zone or
Woreda water office 50
500,000
25,000,000
25,000,000
4
Training of Engineers on Ground water
investigation and Monitoring of Boreholes 2
person for each region and provide with
instrument 30
792,000.00
23,760,000
23,760,000
Total - 53,000,000
Table 33 Rural Post-Construction Management Support by Region and Year (USD)
No. Region 2018 2019 2020 Total(USD)
1 Tigray 1,386,000 4,158,000 3,696,000 9,240,000
2 Gambella 693,000 2,078,999 1,847,999 4,619,999
3 Gumuz 693,000 2,078,999 1,847,999 4,619,999
4 Dire Dawa 346,500 1,039,501 924,001 2,310,001
5 Harari 346,500 1,039,501 924,001 2,310,001
6 Somali 1,386,000 4,158,001 3,696,001 9,240,002
7 Amhara 2,079,000 6,237,000 5,544,000 13,860,000
8 Afar 693,000 2,078,999 1,847,999 4,619,999
9 SNNPR 2,772,000 8,316,000 7,392,000 18,479,999
10 Oromiya 3,465,000 10,394,999 9,239,999 23,099,998
Total 13,860,000 41,580,000 36,960,000 92,400,000
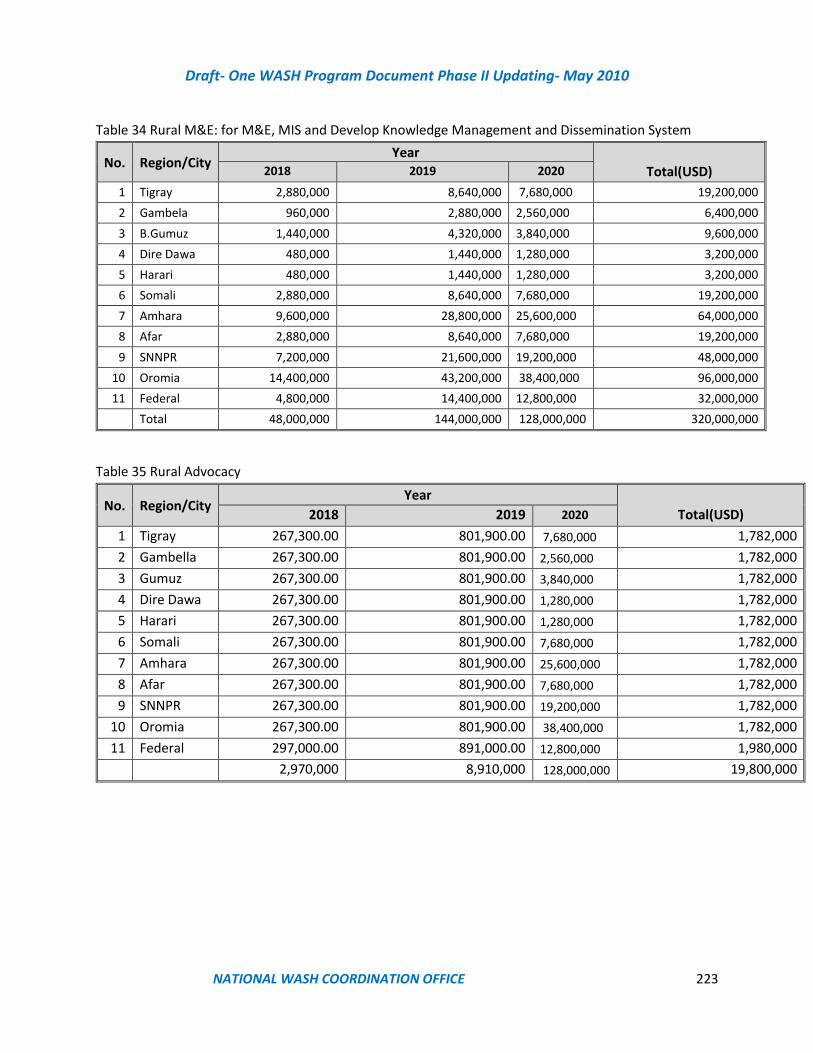
Draft- One WASH Program Document Phase II Updating- May 2010
NATIONAL WASH COORDINATION OFFICE 223
Table 34 Rural M&E: for M&E, MIS and Develop Knowledge Management and Dissemination System
No. Region/City Year
Total(USD) 2018 2019 2020
1 Tigray 2,880,000 8,640,000 7,680,000 19,200,000
2 Gambela 960,000 2,880,000 2,560,000 6,400,000
3 B.Gumuz 1,440,000 4,320,000 3,840,000 9,600,000
4 Dire Dawa 480,000 1,440,000 1,280,000 3,200,000
5 Harari 480,000 1,440,000 1,280,000 3,200,000
6 Somali 2,880,000 8,640,000 7,680,000 19,200,000
7 Amhara 9,600,000 28,800,000 25,600,000 64,000,000
8 Afar 2,880,000 8,640,000 7,680,000 19,200,000
9 SNNPR 7,200,000 21,600,000 19,200,000 48,000,000
10 Oromia 14,400,000 43,200,000 38,400,000 96,000,000
11 Federal 4,800,000 14,400,000 12,800,000 32,000,000
Total 48,000,000 144,000,000 128,000,000 320,000,000
Table 35 Rural Advocacy
No. Region/City Year
Total(USD) 2018 2019 2020
1 Tigray 267,300.00 801,900.00 7,680,000 1,782,000
2 Gambella 267,300.00 801,900.00 2,560,000 1,782,000
3 Gumuz 267,300.00 801,900.00 3,840,000 1,782,000
4 Dire Dawa 267,300.00 801,900.00 1,280,000 1,782,000
5 Harari 267,300.00 801,900.00 1,280,000 1,782,000
6 Somali 267,300.00 801,900.00 7,680,000 1,782,000
7 Amhara 267,300.00 801,900.00 25,600,000 1,782,000
8 Afar 267,300.00 801,900.00 7,680,000 1,782,000
9 SNNPR 267,300.00 801,900.00 19,200,000 1,782,000
10 Oromia 267,300.00 801,900.00 38,400,000 1,782,000
11 Federal 297,000.00 891,000.00 12,800,000 1,980,000
2,970,000 8,910,000 128,000,000 19,800,000
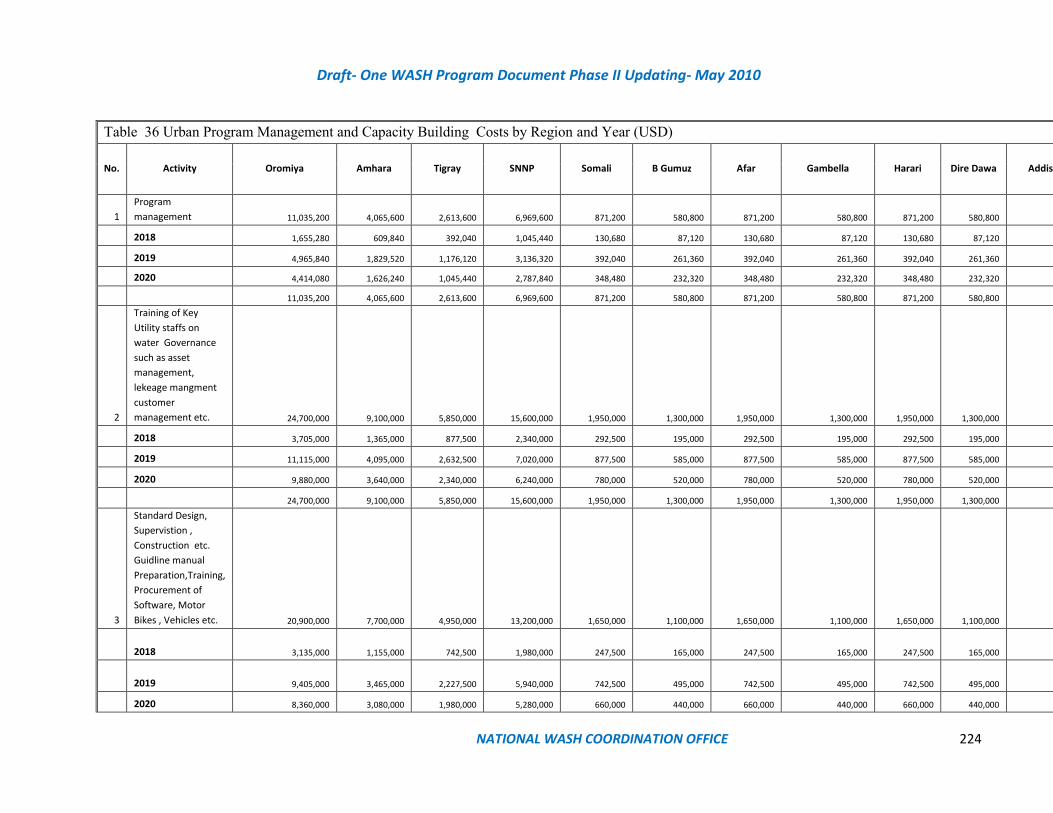
Draft- One WASH Program Document Phase II Updating- May 2010
NATIONAL WASH COORDINATION OFFICE 224
Table 36 Urban Program Management and Capacity Building Costs by Region and Year (USD)
No. Activity Oromiya Amhara Tigray SNNP Somali B Gumuz Afar Gambella Harari Dire Dawa Addis Ababa
1
Program
management 11,035,200 4,065,600 2,613,600 6,969,600 871,200 580,800 871,200 580,800 871,200 580,800
2018 1,655,280 609,840 392,040 1,045,440 130,680 87,120 130,680 87,120 130,680 87,120
2019 4,965,840 1,829,520 1,176,120 3,136,320 392,040 261,360 392,040 261,360 392,040 261,360
2020 4,414,080 1,626,240 1,045,440 2,787,840 348,480 232,320 348,480 232,320 348,480 232,320
11,035,200 4,065,600 2,613,600 6,969,600 871,200 580,800 871,200 580,800 871,200 580,800 -
2
Training of Key
Utility staffs on
water Governance
such as asset
management,
lekeage mangment
customer
management etc. 24,700,000 9,100,000 5,850,000 15,600,000 1,950,000 1,300,000 1,950,000 1,300,000 1,950,000 1,300,000
-
2018 3,705,000 1,365,000 877,500 2,340,000 292,500 195,000 292,500 195,000 292,500 195,000
2019 11,115,000 4,095,000 2,632,500 7,020,000 877,500 585,000 877,500 585,000 877,500 585,000
2020 9,880,000 3,640,000 2,340,000 6,240,000 780,000 520,000 780,000 520,000 780,000 520,000
24,700,000 9,100,000 5,850,000 15,600,000 1,950,000 1,300,000 1,950,000 1,300,000 1,950,000 1,300,000 -
3
Standard Design,
Supervistion ,
Construction etc.
Guidline manual
Preparation,Training,
Procurement of
Software, Motor
Bikes , Vehicles etc. 20,900,000 7,700,000 4,950,000 13,200,000 1,650,000 1,100,000 1,650,000 1,100,000 1,650,000 1,100,000
-
2018 3,135,000 1,155,000 742,500 1,980,000 247,500 165,000 247,500 165,000 247,500 165,000
2019 9,405,000 3,465,000 2,227,500 5,940,000 742,500 495,000 742,500 495,000 742,500 495,000
2020 8,360,000 3,080,000 1,980,000 5,280,000 660,000 440,000 660,000 440,000 660,000 440,000

Draft- One WASH Program Document Phase II Updating- May 2010
NATIONAL WASH COORDINATION OFFICE 225
20,900,000 7,700,000 4,950,000 13,200,000 1,650,000 1,100,000 1,650,000 1,100,000 1,650,000 1,100,000 -
4
Establish
independent water
supply and
wastewater service
regulatory agency to
ensure high service
quality. 10,032,000 3,696,000 2,376,000 6,336,000 792,000 528,000 792,000 528,000 792,000 528,000
-
2018 1,504,800 554,400 356,400 950,400 118,800 79,200 118,800 79,200 118,800 79,200
2019 4,514,400 1,663,200 1,069,200 2,851,200 356,400 237,600 356,400 237,600 356,400 237,600
2020 4,012,800 1,478,400 950,400 2,534,400 316,800 211,200 316,800 211,200 316,800 211,200
10,032,000 3,696,000 2,376,000 6,336,000 792,000 528,000 792,000 528,000 792,000 528,000 -
5
Establish Utility
organizational
structure
responsible section
for wastewater
management. 5,016,000 1,848,000 1,188,000 3,168,000 396,000 264,000 396,000 264,000 396,000 264,000
-
2018 752,400 277,200 178,200 475,200 59,400 39,600 59,400 39,600 59,400 39,600
2019 2,257,200 831,600 534,600 1,425,600 178,200 118,800 178,200 118,800 178,200 118,800
2020 2,006,400 739,200 475,200 1,267,200 158,400 105,600 158,400 105,600 158,400 105,600
5,016,000 1,848,000 1,188,000 3,168,000 396,000 264,000 396,000 264,000 396,000 264,000 -
6
Establish Water
supply quantity and
quality monitoring
system 19,744,800 7,274,400 4,676,400 12,470,400 1,558,800 1,039,200 1,558,800 1,039,200 1,558,800 1,039,200
-
2018 2,961,720 1,091,160 701,460 1,870,560 233,820 155,880 233,820 155,880 233,820 155,880
2019 8,885,160 3,273,480 2,104,380 5,611,680 701,460 467,640 701,460 467,640 701,460 467,640
2020 7,897,920 2,909,760 1,870,560 4,988,160 623,520 415,680 623,520 415,680 623,520 415,680
19,744,800 7,274,400 4,676,400 12,470,400 1,558,800 1,039,200 1,558,800 1,039,200 1,558,800 1,039,200 -
7
Capacity Building
for urban sanitation
Procurement &
Software 38,780,054 14,287,388 9,184,750 3,061,583 2,041,055 3,061,583 2,041,055 3,061,583 2,041,055
-
2018 5,817,008 2,143,108 1,377,712 - 459,237 306,158 459,237 306,158 459,237 306,158
2019 17,451,024 6,429,325 4,133,137 - 1,377,712 918,475 1,377,712 918,475 1,377,712 918,475
2020 15,512,022 5,714,955 3,673,900 - 1,224,633 816,422 1,224,633 816,422 1,224,633 816,422

Draft- One WASH Program Document Phase II Updating- May 2010
NATIONAL WASH COORDINATION OFFICE 226
38,780,054 14,287,388 9,184,750 - 3,061,583 2,041,055 3,061,583 2,041,055 3,061,583 2,041,055 -
8
Procurment of
Pump, Generator
and Training for
AWSSA 15,000,000
2018 - - - - - - - - - -
2019 - - - - - - - - - -
2020 - - - - - - - - - -
- - - - - - - - - - -
Total 130,208,054 47,971,388 30,838,750 57,744,000 10,279,583 6,853,055 10,279,583 6,853,055 10,279,583 6,853,055 -
Table 37: Urban M&E, for M&E, MIS and Develop Knowledge Management and Dissemination System
No.
Region/City
Year Total (USD in Million) 2018 2019 2020
1 Tigray 2.6 7.8 7 17.42
2 Gambela 0.9 2.6 2 5.81
3 B.Gumuz 1.3 3.9 3 8.71
4 Dire Dawa 0.4 1.3 1 2.90
5 Harari 0.4 1.3 1 2.90
6 Somali 3.0 9.1 8 20.33
7 Amhara 8.7 26.1 23 58.08
8 Afar 2.2 6.5 6 14.52
9 SNNPR 6.5 19.6 17 43.56
10 Oromia 13.1 39.2 35 87.12
11 Federal 4.4 13.1 12 29.04
Total 43.6 130.7 116 290.40
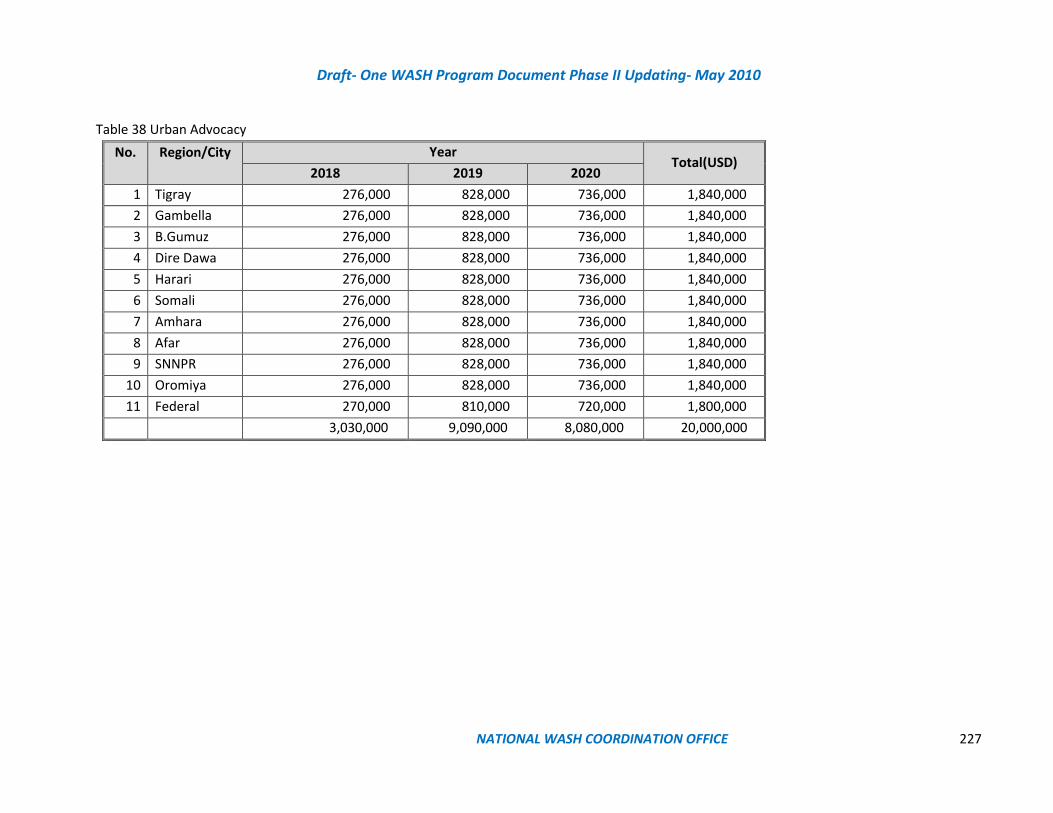
Draft- One WASH Program Document Phase II Updating- May 2010
NATIONAL WASH COORDINATION OFFICE 227
Table 38 Urban Advocacy
No.
Region/City
Year Total(USD)
2018 2019 2020
1 Tigray 276,000 828,000 736,000 1,840,000
2 Gambella 276,000 828,000 736,000 1,840,000
3 B.Gumuz 276,000 828,000 736,000 1,840,000
4 Dire Dawa 276,000 828,000 736,000 1,840,000
5 Harari 276,000 828,000 736,000 1,840,000
6 Somali 276,000 828,000 736,000 1,840,000
7 Amhara 276,000 828,000 736,000 1,840,000
8 Afar 276,000 828,000 736,000 1,840,000
9 SNNPR 276,000 828,000 736,000 1,840,000
10 Oromiya 276,000 828,000 736,000 1,840,000
11 Federal 270,000 810,000 720,000 1,800,000
3,030,000 9,090,000 8,080,000 20,000,000
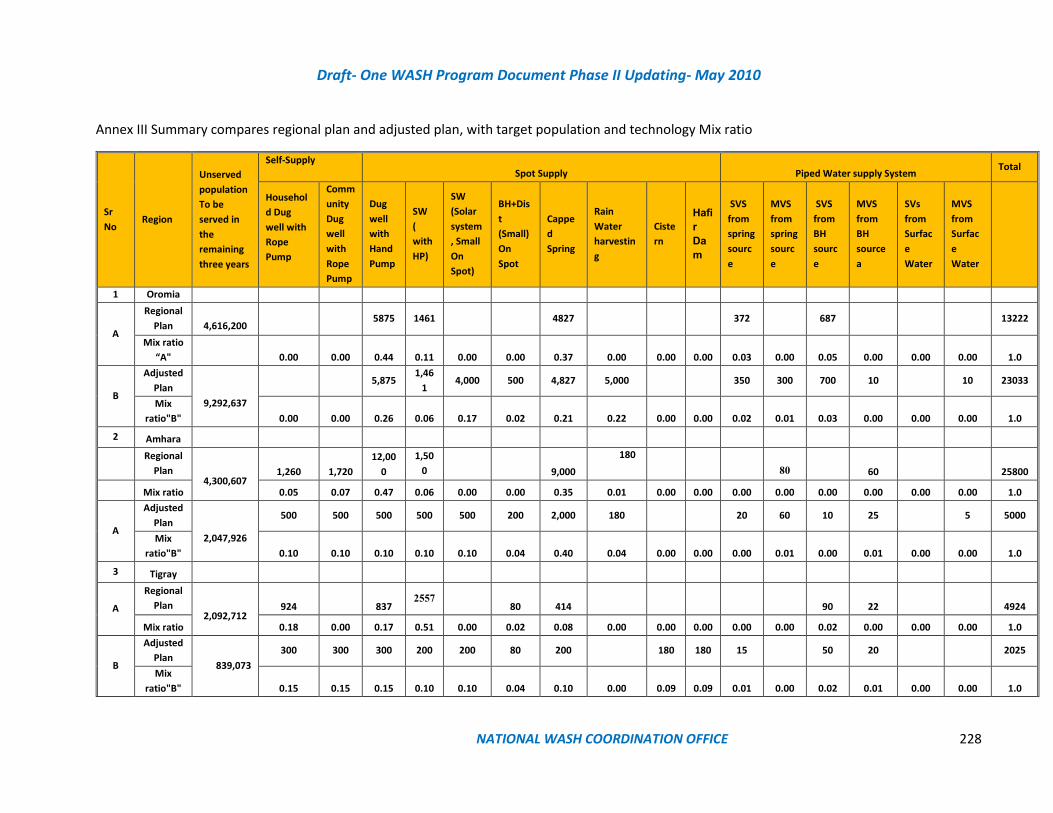
Draft- One WASH Program Document Phase II Updating- May 2010
NATIONAL WASH COORDINATION OFFICE 228
Annex III Summary compares regional plan and adjusted plan, with target population and technology Mix ratio
Sr
No Region
Unserved
population
To be
served in
the
remaining
three years
Self-Supply
Spot Supply Piped Water supply System Total
Househol
d Dug
well with
Rope
Pump
Comm
unity
Dug
well
with
Rope
Pump
Dug
well
with
Hand
Pump
SW
(
with
HP)
SW
(Solar
system
, Small
On
Spot)
BH+Dis
t
(Small)
On
Spot
Cappe
d
Spring
Rain
Water
harvestin
g
Ciste
rn
Hafi
r
Da
m
SVS
from
spring
sourc
e
MVS
from
spring
sourc
e
SVS
from
BH
sourc
e
MVS
from
BH
source
a
SVs
from
Surfac
e
Water
MVS
from
Surfac
e
Water
1 Oromia
A
Regional
Plan
4,616,200 5875 1461 4827 372 687 13222
Mix ratio
“A"
0.00 0.00 0.44 0.11 0.00 0.00 0.37 0.00 0.00 0.00 0.03 0.00 0.05 0.00 0.00 0.00 1.0
B
Adjusted
Plan
9,292,637
5,875 1,46
1 4,000 500 4,827 5,000 350 300 700 10 10 23033
Mix
ratio"B" 0.00 0.00 0.26 0.06 0.17 0.02 0.21 0.22 0.00 0.00 0.02 0.01 0.03 0.00 0.00 0.00 1.0
2 Amhara
Regional
Plan
4,300,607 1,260 1,720
12,00
0
1,50
0 9,000
180
80 60 25800
Mix ratio 0.05 0.07 0.47 0.06 0.00 0.00 0.35 0.01 0.00 0.00 0.00 0.00 0.00 0.00 0.00 0.00 1.0
A
Adjusted
Plan
2,047,926
500 500 500 500 500 200 2,000 180 20 60 10 25 5 5000
Mix
ratio"B" 0.10 0.10 0.10 0.10 0.10 0.04 0.40 0.04 0.00 0.00 0.00 0.01 0.00 0.01 0.00 0.00 1.0
3 Tigray
A
Regional
Plan
2,092,712 924 837
2557 80 414 90 22 4924
Mix ratio 0.18 0.00 0.17 0.51 0.00 0.02 0.08 0.00 0.00 0.00 0.00 0.00 0.02 0.00 0.00 0.00 1.0
B
Adjusted
Plan 839,073
300 300 300 200 200 80 200 180 180 15 50 20 2025
Mix
ratio"B" 0.15 0.15 0.15 0.10 0.10 0.04 0.10 0.00 0.09 0.09 0.01 0.00 0.02 0.01 0.00 0.00 1.0
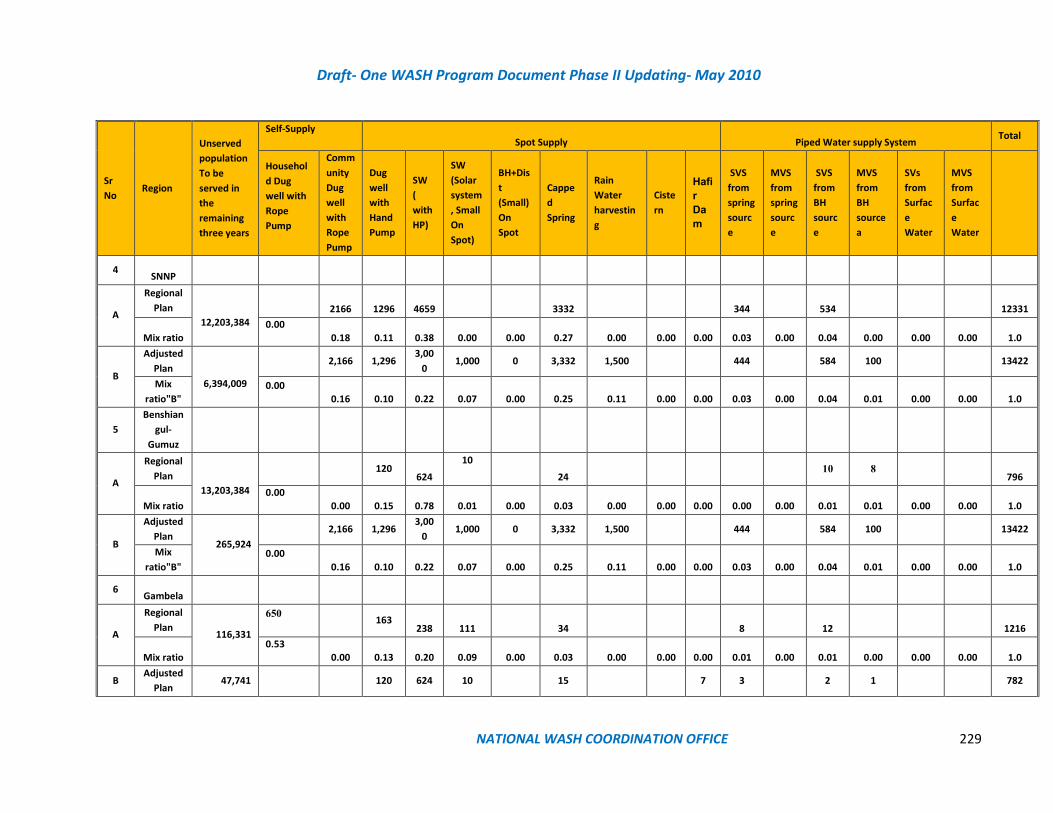
Draft- One WASH Program Document Phase II Updating- May 2010
NATIONAL WASH COORDINATION OFFICE 229
Sr
No Region
Unserved
population
To be
served in
the
remaining
three years
Self-Supply
Spot Supply Piped Water supply System Total
Househol
d Dug
well with
Rope
Pump
Comm
unity
Dug
well
with
Rope
Pump
Dug
well
with
Hand
Pump
SW
(
with
HP)
SW
(Solar
system
, Small
On
Spot)
BH+Dis
t
(Small)
On
Spot
Cappe
d
Spring
Rain
Water
harvestin
g
Ciste
rn
Hafi
r
Da
m
SVS
from
spring
sourc
e
MVS
from
spring
sourc
e
SVS
from
BH
sourc
e
MVS
from
BH
source
a
SVs
from
Surfac
e
Water
MVS
from
Surfac
e
Water
4 SNNP
A
Regional
Plan
12,203,384
2166 1296 4659 3332 344 534 12331
Mix ratio
0.00
0.18 0.11 0.38 0.00 0.00 0.27 0.00 0.00 0.00 0.03 0.00 0.04 0.00 0.00 0.00 1.0
B
Adjusted
Plan
6,394,009
2,166 1,296
3,00
0 1,000 0 3,332 1,500 444 584 100 13422
Mix
ratio"B"
0.00
0.16 0.10 0.22 0.07 0.00 0.25 0.11 0.00 0.00 0.03 0.00 0.04 0.01 0.00 0.00 1.0
5
Benshian
gul-
Gumuz
A
Regional
Plan
13,203,384
120
624
10
24 10 8
796
Mix ratio
0.00
0.00 0.15 0.78 0.01 0.00 0.03 0.00 0.00 0.00 0.00 0.00 0.01 0.01 0.00 0.00 1.0
B
Adjusted
Plan 265,924
2,166 1,296
3,00
0 1,000 0 3,332 1,500 444 584 100 13422
Mix
ratio"B"
0.00
0.16 0.10 0.22 0.07 0.00 0.25 0.11 0.00 0.00 0.03 0.00 0.04 0.01 0.00 0.00 1.0
6 Gambela
A
Regional
Plan 116,331
650 163
238 111 34 8 12 1216
Mix ratio
0.53
0.00 0.13 0.20 0.09 0.00 0.03 0.00 0.00 0.00 0.01 0.00 0.01 0.00 0.00 0.00 1.0
B Adjusted
Plan 47,741
120 624 10 15 7 3 2 1 782

Draft- One WASH Program Document Phase II Updating- May 2010
NATIONAL WASH COORDINATION OFFICE 230
Sr
No Region
Unserved
population
To be
served in
the
remaining
three years
Self-Supply
Spot Supply Piped Water supply System Total
Househol
d Dug
well with
Rope
Pump
Comm
unity
Dug
well
with
Rope
Pump
Dug
well
with
Hand
Pump
SW
(
with
HP)
SW
(Solar
system
, Small
On
Spot)
BH+Dis
t
(Small)
On
Spot
Cappe
d
Spring
Rain
Water
harvestin
g
Ciste
rn
Hafi
r
Da
m
SVS
from
spring
sourc
e
MVS
from
spring
sourc
e
SVS
from
BH
sourc
e
MVS
from
BH
source
a
SVs
from
Surfac
e
Water
MVS
from
Surfac
e
Water
Mix
ratio"B"
0.00
0.00 0.15 0.80 0.01 0.00 0.02 0.00 0.00 0.01 0.00 0.00 0.00 0.00 0.00 0.00 1.0
7 Afar
A
Regional
Plan
125,028.3
148
96 53 7
40 163 7 117 631
Mix ratio
0.00
0.00 0.23 0.15 0.08 0.00 0.01 0.06 0.26 0.01 0.00 0.00 0.19 0.00 0.00 0.00 1.0
B
Adjusted
Plan 690,331
148 96 100 7 100 163 7 70 30 721
Mix
ratio"B"
0.00
0.00 0.21 0.13 0.14 0.00 0.01 0.14 0.23 0.01 0.00 0.00 0.10 0.04 0.00 0.00 1.0
8 Somali
A
Regional
Plan
4,793,269
1780
670
163 65 2430 967 94 96 98 0.00 55 6418
Mix ratio
0.00
0.28 0.10 0.00 0.03 0.00 0.01 0.38 0.15 0.01 0.00 0.00 0.01 0.02 0.00 0.01 1.0
B
Adjusted
Plan
1,279,540
500 200 100 65 2,430 967 94 35 80 35 4506
Mix
ratio"B"
0.00
0.11 0.04 0.00 0.02 0.00 0.01 0.54 0.21 0.02 0.00 0.00 0.01 0.02 0.00 0.01 1.0
9 Harari
A
Regional
Plan
50,517.00
20
4 5 4 8 4 45
Mix ratio
0.00
0.00 0.44 0.00 0.00 0.09 0.00 0.00 0.00 0.00 0.11 0.00 0.09 0.18 0.09 0.00 1.0
B Adjusted
Plan 75,375
10 2 180 2 2 1 2 199
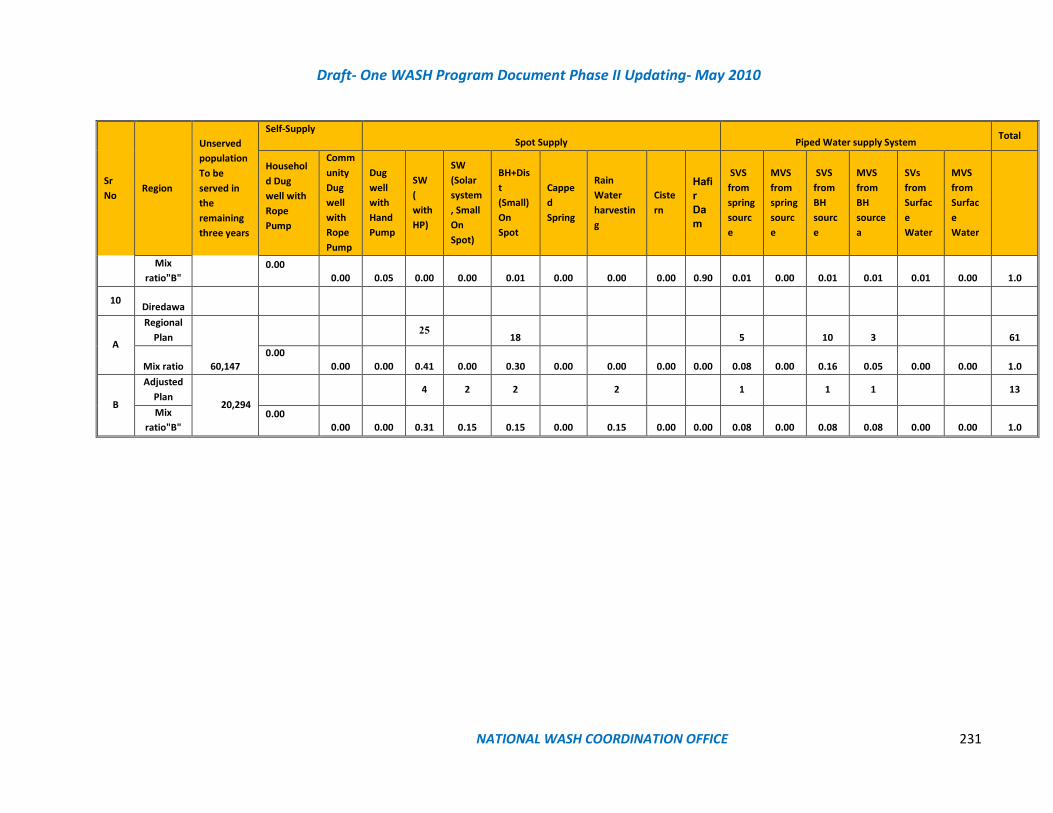
Draft- One WASH Program Document Phase II Updating- May 2010
NATIONAL WASH COORDINATION OFFICE 231
Sr
No Region
Unserved
population
To be
served in
the
remaining
three years
Self-Supply
Spot Supply Piped Water supply System Total
Househol
d Dug
well with
Rope
Pump
Comm
unity
Dug
well
with
Rope
Pump
Dug
well
with
Hand
Pump
SW
(
with
HP)
SW
(Solar
system
, Small
On
Spot)
BH+Dis
t
(Small)
On
Spot
Cappe
d
Spring
Rain
Water
harvestin
g
Ciste
rn
Hafi
r
Da
m
SVS
from
spring
sourc
e
MVS
from
spring
sourc
e
SVS
from
BH
sourc
e
MVS
from
BH
source
a
SVs
from
Surfac
e
Water
MVS
from
Surfac
e
Water
Mix
ratio"B"
0.00
0.00 0.05 0.00 0.00 0.01 0.00 0.00 0.00 0.90 0.01 0.00 0.01 0.01 0.01 0.00 1.0
10 Diredawa
A
Regional
Plan
60,147
25
18 5 10 3 61
Mix ratio
0.00
0.00 0.00 0.41 0.00 0.30 0.00 0.00 0.00 0.00 0.08 0.00 0.16 0.05 0.00 0.00 1.0
B
Adjusted
Plan 20,294
4 2 2 2 1 1 1 13
Mix
ratio"B"
0.00
0.00 0.00 0.31 0.15 0.15 0.00 0.15 0.00 0.00 0.08 0.00 0.08 0.08 0.00 0.00 1.0
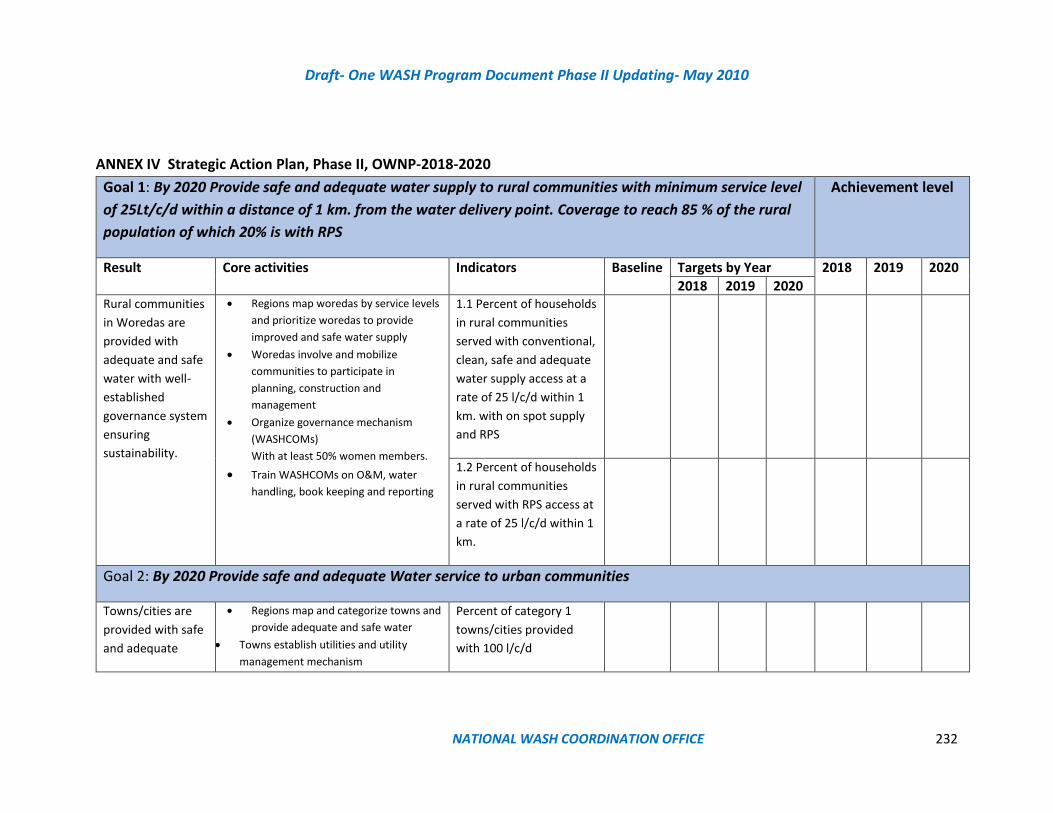
Draft- One WASH Program Document Phase II Updating- May 2010
NATIONAL WASH COORDINATION OFFICE 232
ANNEX IV Strategic Action Plan, Phase II, OWNP-2018-2020
Goal 1: By 2020 Provide safe and adequate water supply to rural communities with minimum service level
of 25Lt/c/d within a distance of 1 km. from the water delivery point. Coverage to reach 85 % of the rural
population of which 20% is with RPS
Achievement level
Result Core activities Indicators Baseline Targets by Year 2018 2019 2020
2018 2019 2020 Rural communities
in Woredas are
provided with
adequate and safe
water with well-
established
governance system
ensuring
sustainability.
• Regions map woredas by service levels
and prioritize woredas to provide
improved and safe water supply
• Woredas involve and mobilize
communities to participate in
planning, construction and
management
• Organize governance mechanism
(WASHCOMs)
With at least 50% women members.
• Train WASHCOMs on O&M, water
handling, book keeping and reporting
1.1 Percent of households
in rural communities
served with conventional,
clean, safe and adequate
water supply access at a
rate of 25 l/c/d within 1
km. with on spot supply
and RPS
1.2 Percent of households
in rural communities
served with RPS access at
a rate of 25 l/c/d within 1
km.
Goal 2: By 2020 Provide safe and adequate Water service to urban communities
Towns/cities are
provided with safe
and adequate
• Regions map and categorize towns and
provide adequate and safe water
• Towns establish utilities and utility
management mechanism
Percent of category 1
towns/cities provided
with 100 l/c/d

Draft- One WASH Program Document Phase II Updating- May 2010
NATIONAL WASH COORDINATION OFFICE 233
water as per their
category
• Towns or town water board set tariffs
for water usage
• Towns/water boards establish O&M
program, tools and spare parts
• Towns/water board conduct continuous
capacity building on O&M, water
treatment, preventive maintenance,
record keeping, water safety plan to
sector staff
Percent of category 2
towns/cities provided with
80 l/c/d ;
Percent of Category 3
towns/cities provided with
60 l/c/day
Percent of Category 4
towns/cities provided with
50 l/c/d up to the premises
Percent of Category 5
towns/cities provided with
40 l/c/d within a distance of
250 mrs with piped system;
Goal 3:By 2020 Carry out study and design for urban waste water management system
Urban waste water
management
system is designed
• Towns/water boards/city
administrations identify and document
background information on the
problem
• Set budget and time line to conduct
feasibility studies on WWM program
• Organize/hire professionals to design
appropriate WWM system for the
selected town/city
Percent of the 36 category
1,2,3 towns and cities Build
WWM infrastructure for 6
towns /cities with a
population of 200,000 and
more
Goal 4:By 2020 Decrease RWS Non Functionality rate of water supply system in urban and rural communities
Number of
nonfunctional
water systems are
decreased to 7%
• Regions together with Woredas map
non functional water systems by
category
• Identify common problems
Percent achievement of
NFR From the present
11.2 %-to the target of
7%
11.2

Draft- One WASH Program Document Phase II Updating- May 2010
NATIONAL WASH COORDINATION OFFICE 234
• Design mechanism/budget and organize
manpower and rehabilitate un
functional water systems
• Woredas with support from regions and
NGOs etc set a maintenance crew with
tools and spare parts and
communication system to maintain
pumps and reduce downtime and non-
functionality rates.
Goal 5: By 2020 Empower women in WASHCOs management including in decision making
WASHCOMs are
established with
50% women
members
• Woredas involve communities including
women in the planning process
• Discuss with communities on roles and
responsibilities in WS management
• Establish WASHCOMs with women
participation of at least 50%
• Train WASHCOMs on book keeping,
O&M, setting tariffs etc…
Percent of WASHCOMs
that increase
membership to 50% and
more
Goal 6. By 2020 Strengthen RWS community management through legalization of WASHCOs
100% of
WASHCOMs in all
regions are
legalized
• Regions register the number of
• WASHCOMs
• Regions advocate on the
importance of legalizing
WASHCOMs so that they function
legally following government rules
• Regions continue on capacity
building to WASHCOMs to
strengthen their water
management roles.
• Percent of RWS
that legalize
WASHCOMs by
region
•
Goal 7. By 2020 Establish supply chain for low cost WS technologies and spare parts
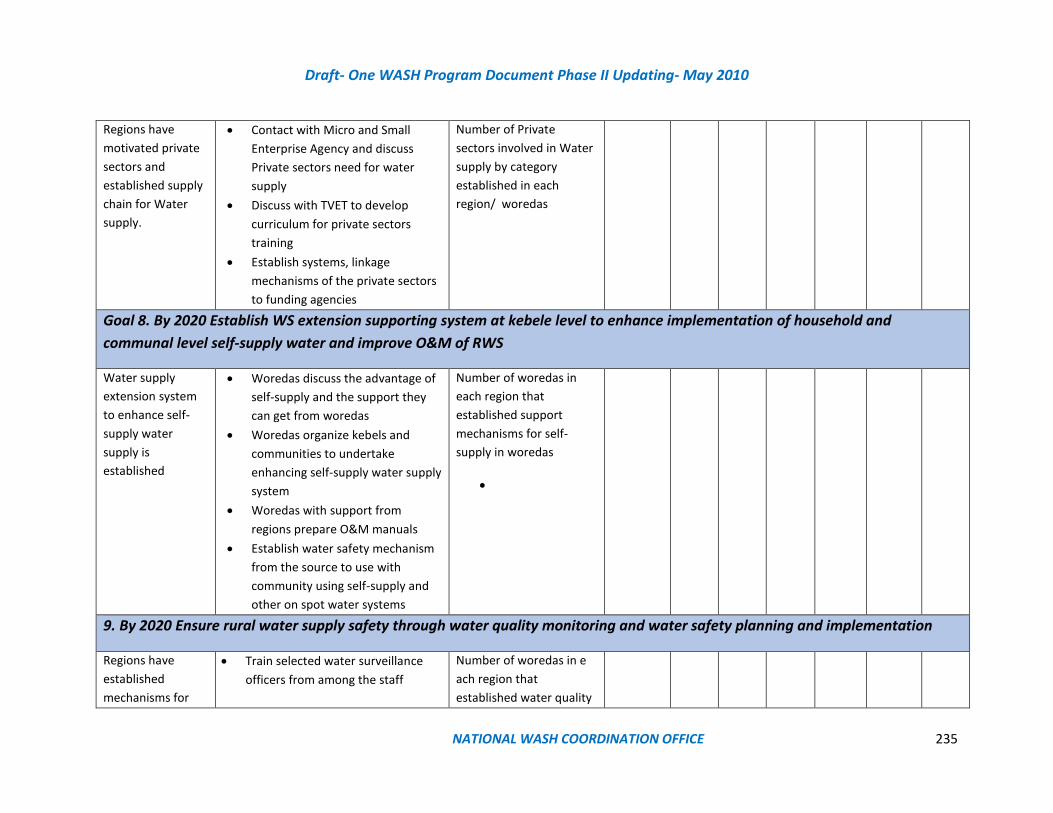
Draft- One WASH Program Document Phase II Updating- May 2010
NATIONAL WASH COORDINATION OFFICE 235
Regions have
motivated private
sectors and
established supply
chain for Water
supply.
• Contact with Micro and Small
Enterprise Agency and discuss
Private sectors need for water
supply
• Discuss with TVET to develop
curriculum for private sectors
training
• Establish systems, linkage
mechanisms of the private sectors
to funding agencies
Number of Private
sectors involved in Water
supply by category
established in each
region/ woredas
Goal 8. By 2020 Establish WS extension supporting system at kebele level to enhance implementation of household and
communal level self-supply water and improve O&M of RWS
Water supply
extension system
to enhance self-
supply water
supply is
established
• Woredas discuss the advantage of
self-supply and the support they
can get from woredas
• Woredas organize kebels and
communities to undertake
enhancing self-supply water supply
system
• Woredas with support from
regions prepare O&M manuals
• Establish water safety mechanism
from the source to use with
community using self-supply and
other on spot water systems
Number of woredas in
each region that
established support
mechanisms for self-
supply in woredas
•
9. By 2020 Ensure rural water supply safety through water quality monitoring and water safety planning and implementation
Regions have
established
mechanisms for
• Train selected water surveillance
officers from among the staff
Number of woredas in e
ach region that
established water quality
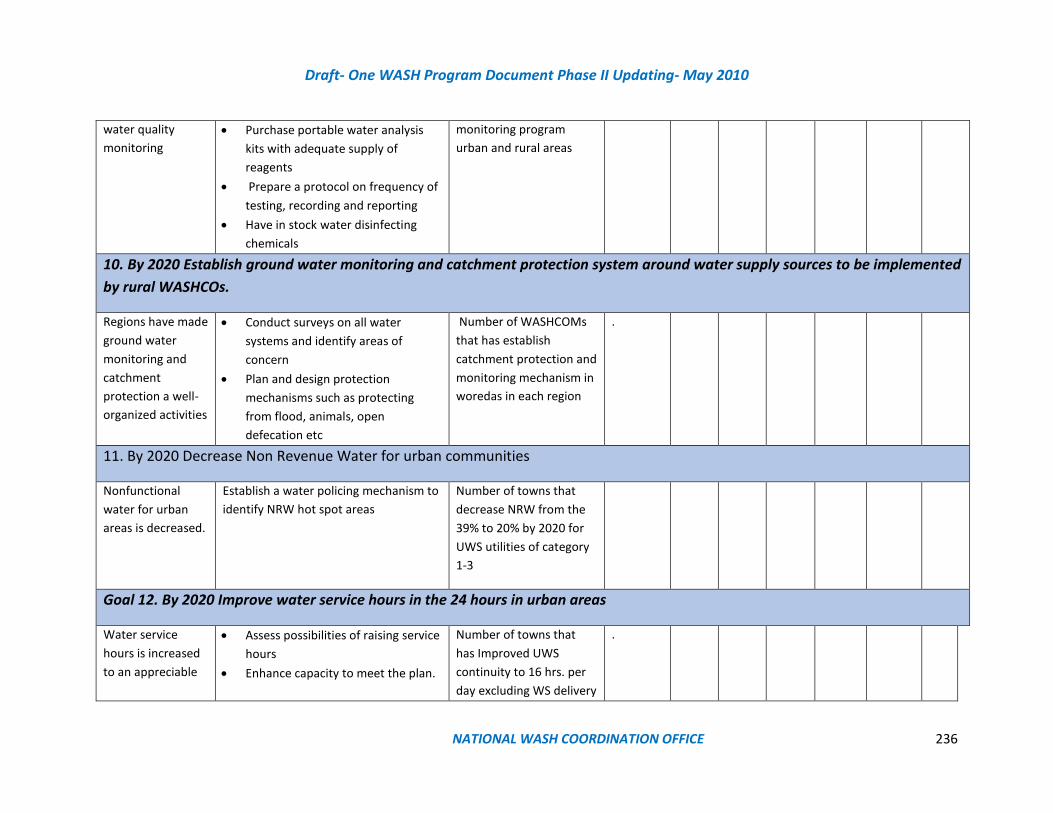
Draft- One WASH Program Document Phase II Updating- May 2010
NATIONAL WASH COORDINATION OFFICE 236
water quality
monitoring
• Purchase portable water analysis
kits with adequate supply of
reagents
• Prepare a protocol on frequency of
testing, recording and reporting
• Have in stock water disinfecting
chemicals
monitoring program
urban and rural areas
10. By 2020 Establish ground water monitoring and catchment protection system around water supply sources to be implemented
by rural WASHCOs.
Regions have made
ground water
monitoring and
catchment
protection a well-
organized activities
• Conduct surveys on all water
systems and identify areas of
concern
• Plan and design protection
mechanisms such as protecting
from flood, animals, open
defecation etc
Number of WASHCOMs
that has establish
catchment protection and
monitoring mechanism in
woredas in each region
.
11. By 2020 Decrease Non Revenue Water for urban communities
Nonfunctional
water for urban
areas is decreased.
Establish a water policing mechanism to
identify NRW hot spot areas
Number of towns that
decrease NRW from the
39% to 20% by 2020 for
UWS utilities of category
1-3
Goal 12. By 2020 Improve water service hours in the 24 hours in urban areas
Water service
hours is increased
to an appreciable
• Assess possibilities of raising service
hours
• Enhance capacity to meet the plan.
Number of towns that
has Improved UWS
continuity to 16 hrs. per
day excluding WS delivery
.

Draft- One WASH Program Document Phase II Updating- May 2010
NATIONAL WASH COORDINATION OFFICE 237
level within the 24
hours
through public taps for
UWS utilities of category
1 to 3
Goal 13. By 2020 Enable cost recovery mechanism for urban water supply system
Urban towns/cities
utilities have
established
reasonable tariffs
• Prepare an advocacy statement to
enable the establishment of cost
recovery mechanism
• Discuss the issue with water board
and beneficiaries
• Involve communities/beneficiaries
before setting tariffs
Number of towns that
enable category 1,2 and 3
towns recover their
investment cost at least
by:80% Category 4 by
60%Category 5 by 30
%And O&M cost by 100%
for all towns
Goal 14. By 2020 Ensure UW safety through water quality monitoring system and water safety planning and implementation for
UWS utilities of category 1 to 3
Urban utilities has
established a
regular water
quality monitoring
plan
• Train selected water surveillance
officers from among the staff
• Purchase portable water analysis
kits with adequate supply of
reagents
• Prepare a protocol on frequency of
testing, recording and reporting
• Have in stock water disinfecting
chemicals
Number of regions that
established water quality
monitoring and reporting
program in woredas
Goal 15. By 2020 Establish ground water monitoring and catchment protection system around WS sources to be implemented by urban WS
utilities

Draft- One WASH Program Document Phase II Updating- May 2010
NATIONAL WASH COORDINATION OFFICE 238
Utilities have
made ground
water
monitoring and
catchment
protection a
well-organized
routine
activities
• .Establish ground water monitoring
unit with the necessary tools
• Conduct surveys on all water
systems and identify areas of
concern
• Plan and design monitoring and
protection mechanisms such as
protecting from flood, animals,
open defecation etc
• Number of towns of
water utilities in
urban areas that
establish urban water
catchment protection
mechanisms
.
Goal 16. By 2020 Conduct capacity building to higher and middle level professional, artisans and caretakers
Capacity building is
conducted to
higher, middle
WASH
professionals and
artisans.
• Design training manuals for higher,
medium professionals and artisans
• Prepare the necessary supporting
training materials
• Use trained trainers for
effectiveness
Percent achievement in
training and engaging
Higher subsector 4, 374
4374
Percent achievement in
training and engaging
midlevel of which 25%
are women
1300
0
Percent achievement in
training and engaging
artisans of which 25% are
women
5100
00
Goal 17. By 2020 Establish independent WS and Wastewater service regulatory agency to ensure high service quality
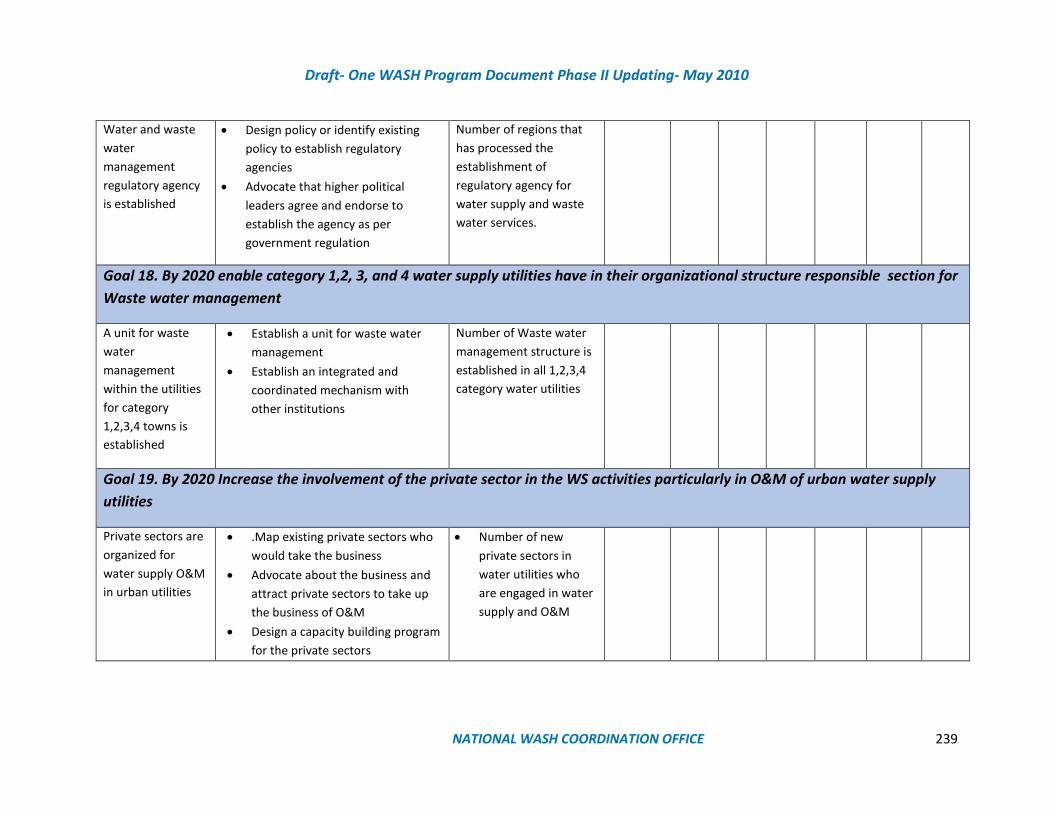
Draft- One WASH Program Document Phase II Updating- May 2010
NATIONAL WASH COORDINATION OFFICE 239
Water and waste
water
management
regulatory agency
is established
• Design policy or identify existing
policy to establish regulatory
agencies
• Advocate that higher political
leaders agree and endorse to
establish the agency as per
government regulation
Number of regions that
has processed the
establishment of
regulatory agency for
water supply and waste
water services.
Goal 18. By 2020 enable category 1,2, 3, and 4 water supply utilities have in their organizational structure responsible section for
Waste water management
A unit for waste
water
management
within the utilities
for category
1,2,3,4 towns is
established
• Establish a unit for waste water
management
• Establish an integrated and
coordinated mechanism with
other institutions
Number of Waste water
management structure is
established in all 1,2,3,4
category water utilities
Goal 19. By 2020 Increase the involvement of the private sector in the WS activities particularly in O&M of urban water supply
utilities
Private sectors are
organized for
water supply O&M
in urban utilities
• .Map existing private sectors who
would take the business
• Advocate about the business and
attract private sectors to take up
the business of O&M
• Design a capacity building program
for the private sectors
• Number of new
private sectors in
water utilities who
are engaged in water
supply and O&M

Draft- One WASH Program Document Phase II Updating- May 2010
NATIONAL WASH COORDINATION OFFICE 240
Goal 20. By 2020 Strengthen WASH integration to meet the objectives of OWNP and establish coordination with the Ministry of
Urban Development and Construction Affairs at all levels in all urban WASH interventions
OWNP has
integrated its
national WASH
plan with like
ministries.
• Advocate the health, development
and economic impact of WASH
with like ministries
• Discuss ways and means to
integrate the program and for
coordinated action for WASH in
urban areas
• Establish standing committees of
professionals overlooking design
and intervention program
• Establish forums fro wider learning
and sharing
Number of integration
and coordination
initiatives taken by OWNP
with like ministries like
ministry of urban
development.
21. By 2020 Implement national ICT based M&E and MIS system for the subsector which enables to capture, collect, analyze and
report the data of the sub-sector staffs and service beneficiaries disaggregated in sex and age
ICT for M&E is
established at all
levels in Ethiopia
• Learn and share experiences of
regions and NGOs and bilateral
organizations who have started ICT
based monitoring in Ethiopia
• Speed up the ICT based national
program and record real time
information in the MIS
• Establish mechanism for reviewing
and learning
Number of regions that
established a functional
ICT based M&E and MIS
system
Table: Strategic Action Plan for Sanitation in Phase II OWNP-2018-2020
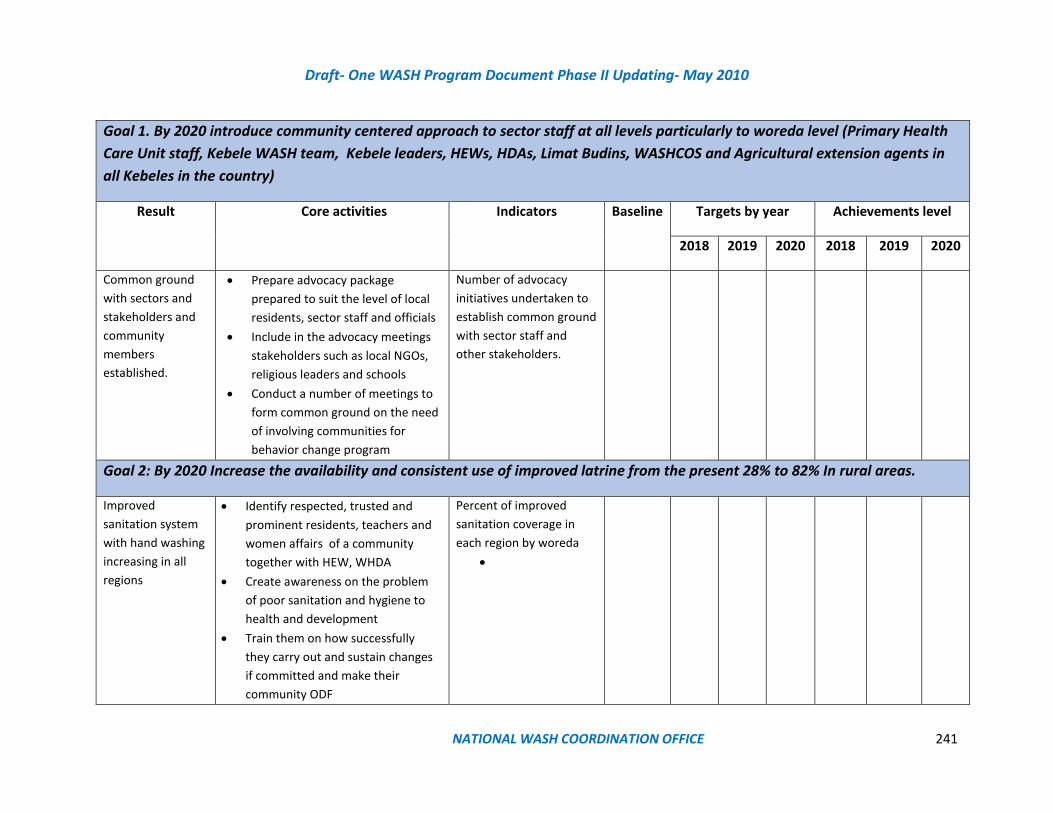
Draft- One WASH Program Document Phase II Updating- May 2010
NATIONAL WASH COORDINATION OFFICE 241
Goal 1. By 2020 introduce community centered approach to sector staff at all levels particularly to woreda level (Primary Health
Care Unit staff, Kebele WASH team, Kebele leaders, HEWs, HDAs, Limat Budins, WASHCOS and Agricultural extension agents in
all Kebeles in the country)
Result Core activities Indicators Baseline Targets by year Achievements level
2018 2019 2020 2018 2019 2020
Common ground
with sectors and
stakeholders and
community
members
established.
• Prepare advocacy package
prepared to suit the level of local
residents, sector staff and officials
• Include in the advocacy meetings
stakeholders such as local NGOs,
religious leaders and schools
• Conduct a number of meetings to
form common ground on the need
of involving communities for
behavior change program
Number of advocacy
initiatives undertaken to
establish common ground
with sector staff and
other stakeholders.
Goal 2: By 2020 Increase the availability and consistent use of improved latrine from the present 28% to 82% In rural areas.
Improved
sanitation system
with hand washing
increasing in all
regions
• Identify respected, trusted and
prominent residents, teachers and
women affairs of a community
together with HEW, WHDA
• Create awareness on the problem
of poor sanitation and hygiene to
health and development
• Train them on how successfully
they carry out and sustain changes
if committed and make their
community ODF
Percent of improved
sanitation coverage in
each region by woreda
•
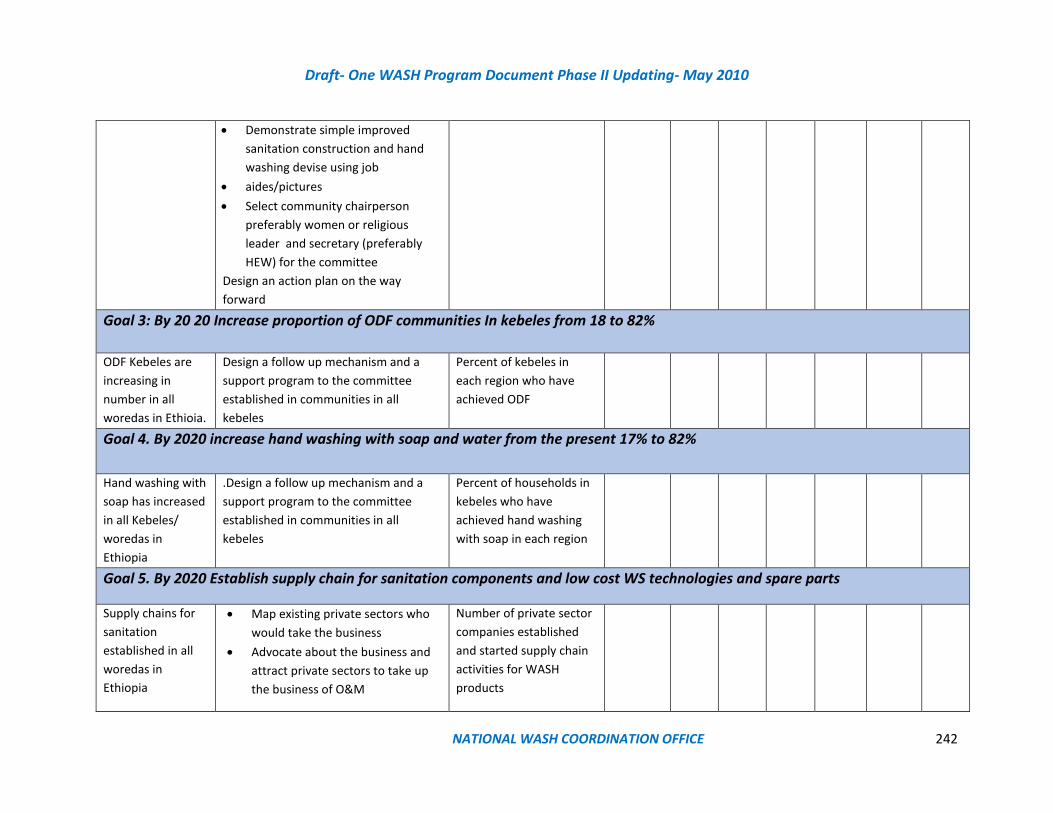
Draft- One WASH Program Document Phase II Updating- May 2010
NATIONAL WASH COORDINATION OFFICE 242
• Demonstrate simple improved
sanitation construction and hand
washing devise using job
• aides/pictures
• Select community chairperson
preferably women or religious
leader and secretary (preferably
HEW) for the committee
Design an action plan on the way
forward
Goal 3: By 20 20 Increase proportion of ODF communities In kebeles from 18 to 82%
ODF Kebeles are
increasing in
number in all
woredas in Ethioia.
Design a follow up mechanism and a
support program to the committee
established in communities in all
kebeles
Percent of kebeles in
each region who have
achieved ODF
Goal 4. By 2020 increase hand washing with soap and water from the present 17% to 82%
Hand washing with
soap has increased
in all Kebeles/
woredas in
Ethiopia
.Design a follow up mechanism and a
support program to the committee
established in communities in all
kebeles
Percent of households in
kebeles who have
achieved hand washing
with soap in each region
Goal 5. By 2020 Establish supply chain for sanitation components and low cost WS technologies and spare parts
Supply chains for
sanitation
established in all
woredas in
Ethiopia
• Map existing private sectors who
would take the business
• Advocate about the business and
attract private sectors to take up
the business of O&M
Number of private sector
companies established
and started supply chain
activities for WASH
products
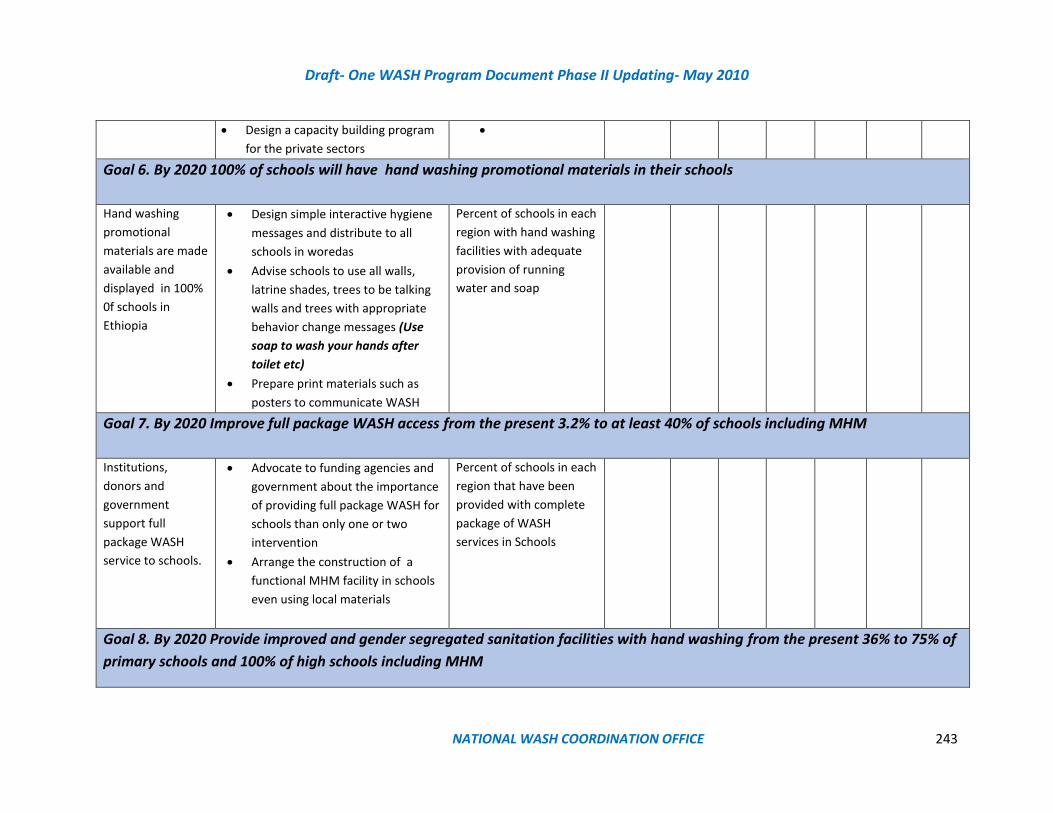
Draft- One WASH Program Document Phase II Updating- May 2010
NATIONAL WASH COORDINATION OFFICE 243
• Design a capacity building program
for the private sectors
•
Goal 6. By 2020 100% of schools will have hand washing promotional materials in their schools
Hand washing
promotional
materials are made
available and
displayed in 100%
0f schools in
Ethiopia
• Design simple interactive hygiene
messages and distribute to all
schools in woredas
• Advise schools to use all walls,
latrine shades, trees to be talking
walls and trees with appropriate
behavior change messages (Use
soap to wash your hands after
toilet etc)
• Prepare print materials such as
posters to communicate WASH
Percent of schools in each
region with hand washing
facilities with adequate
provision of running
water and soap
Goal 7. By 2020 Improve full package WASH access from the present 3.2% to at least 40% of schools including MHM
Institutions,
donors and
government
support full
package WASH
service to schools.
• Advocate to funding agencies and
government about the importance
of providing full package WASH for
schools than only one or two
intervention
• Arrange the construction of a
functional MHM facility in schools
even using local materials
Percent of schools in each
region that have been
provided with complete
package of WASH
services in Schools
Goal 8. By 2020 Provide improved and gender segregated sanitation facilities with hand washing from the present 36% to 75% of
primary schools and 100% of high schools including MHM

Draft- One WASH Program Document Phase II Updating- May 2010
NATIONAL WASH COORDINATION OFFICE 244
Gender separated
improved
sanitation and
MHM facilities are
increasing in all
schools
• Organize parents and teachers
association to participate and
support to construct separate
latrine for boys, girls, teachers
• Organize fund raising festivals, or
school days to raise money to
support latrine construction
• Plan to use revenues usually from
coffee, crop, grass, and wood sales
to support latrine construction.
Percent of schools in each
region with adequate and
gender segregated and
improved sanitation
systems
Goal 9. By 2020 100% of health facilities with full package of WASH facilities including MHM facilities 100%
Institutions,
donors and
government
support full
package WASH
service to schools
• Advocate for the need of providing
full package to health facilities
Percent of health facilities
with full package of
WASH services
Goal 10. By 2020 Increase proportion of households using correct and consistent water treatment and safe storage from 10 to
35%
Point of use
treatment of water
is practiced in
households in
Ethiopia
• Discuss the need of enhancing point
of use treatment with the
community centered committee
• Discuss with water safety supply
chains (Wuha agar, wuha telel) to
make water disinfectant to the
locality
• Arrange with local drug store to also
have wuha agar etc for sale to
communities
Percent of households
practicing point of use
(POU) water treatment.

Draft- One WASH Program Document Phase II Updating- May 2010
NATIONAL WASH COORDINATION OFFICE 245
Goal 11. By 2020 prepare and provide pictorial job aides, operational manuals, implementation guidelines for use by Health
Extension Workers to support facilitation of behavior change in communities
Outreach do-able
behavior change
program is
enhanced using
jobaides in Kebeles
in Ethiopia.
• Explore WASH communication
materials availability in the sector
ministries
• Evaluate the content and determine
whether to use it or not
• Design new or additional
communication products
• Kebele level HEW will need pictorial
jobaides which are available in the
ministry of health
Percent of Kebeles
provided with set of job
aides including latrine
construction, hand
washing, water safety
measures, personal and
environmental hygiene
materials

Draft- One WASH Program Document Phase II Updating- May 2010
NATIONAL WASH COORDINATION OFFICE 246
ANNEX V WASH sector reform principles
ANNEX VI OWNP Result Framework-2018-2020
Level Result Chain Performance Indicators Year of
completion Indicators
Outcome Increased access and
use of improved water
supply and sanitation
services, and hygiene
practices by all people
Percent of households served
with Clean, safe and adequate
water supply access at a rate of:
• 25 l/c/d within 1 km. to
rural communities
• 100 l/c/d for big towns
to 40 l/c/d to small
towns
By 2020 Definition: measures how far intervention woredas have
managed to achieve Improved water, sanitation and hygiene
services from the baseline
Definition: Numerator # of HH with improved water, sanitation
and hygiene in 2020; Denominator# of HH with improved water,
sanitation and hygiene at baseline
Source of data: Local Government
Responsibility: RWCO and NWCO Government
Intermediate
outcome
Government, partners
and CSOs scales up
improved water supply
and sanitation services
and hygiene programs
for all people in urban,
rural and pastoralist
areas through public
and private
participants.
Percent of rural, urban,
pastoralist and Institutional
population with access to
improved water supply,
sanitation and hygiene practices
By 2018-2020 Definition: This indicator measures the achievement in WASH in
all implementation areas demonstrating an improved service
scenario.
• % of communities that are supplied with safe water
from MVS system
• % of communities that are supplied safe water from
Boreholes
• % of communities that are supplied with safe water
from RPS
• % of population that are supplied safe water from hand
pumps
• % of communities that are supplied with safe water
from self-supply
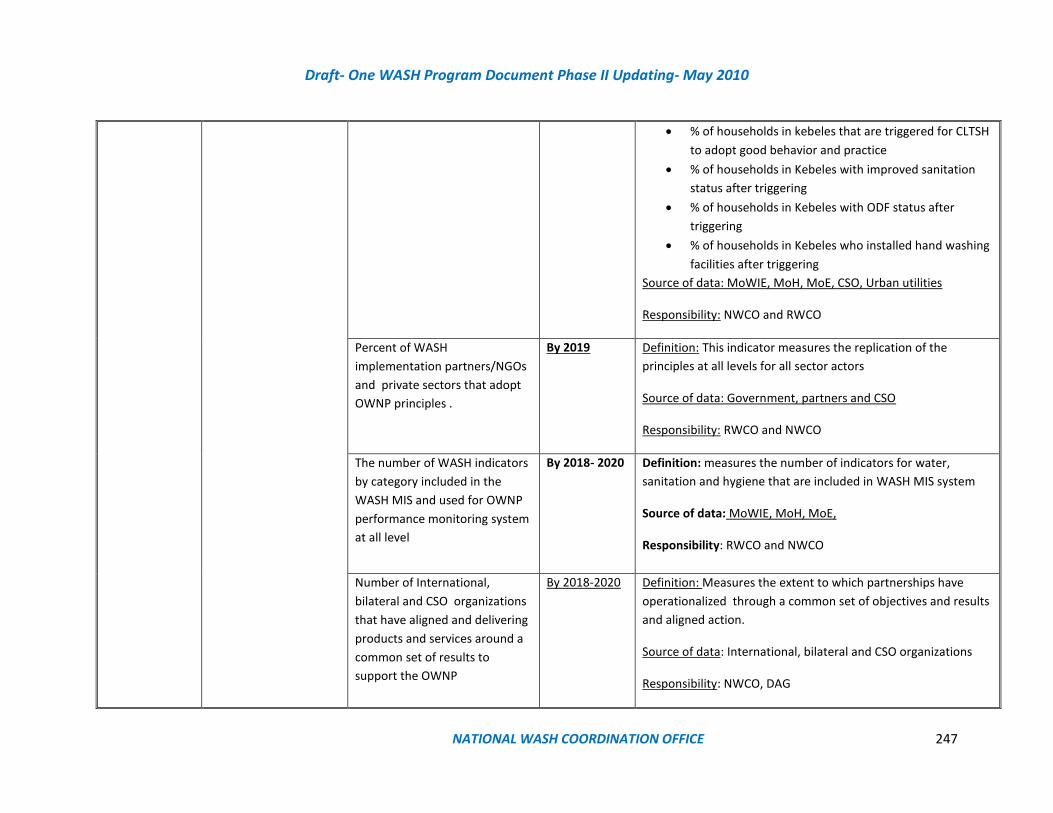
Draft- One WASH Program Document Phase II Updating- May 2010
NATIONAL WASH COORDINATION OFFICE 247
• % of households in kebeles that are triggered for CLTSH
to adopt good behavior and practice
• % of households in Kebeles with improved sanitation
status after triggering
• % of households in Kebeles with ODF status after
triggering
• % of households in Kebeles who installed hand washing
facilities after triggering
Source of data: MoWIE, MoH, MoE, CSO, Urban utilities
Responsibility: NWCO and RWCO
Percent of WASH
implementation partners/NGOs
and private sectors that adopt
OWNP principles .
By 2019 Definition: This indicator measures the replication of the
principles at all levels for all sector actors
Source of data: Government, partners and CSO
Responsibility: RWCO and NWCO
The number of WASH indicators
by category included in the
WASH MIS and used for OWNP
performance monitoring system
at all level
By 2018- 2020 Definition: measures the number of indicators for water,
sanitation and hygiene that are included in WASH MIS system
Source of data: MoWIE, MoH, MoE,
Responsibility: RWCO and NWCO
Number of International,
bilateral and CSO organizations
that have aligned and delivering
products and services around a
common set of results to
support the OWNP
By 2018-2020 Definition: Measures the extent to which partnerships have
operationalized through a common set of objectives and results
and aligned action.
Source of data: International, bilateral and CSO organizations
Responsibility: NWCO, DAG
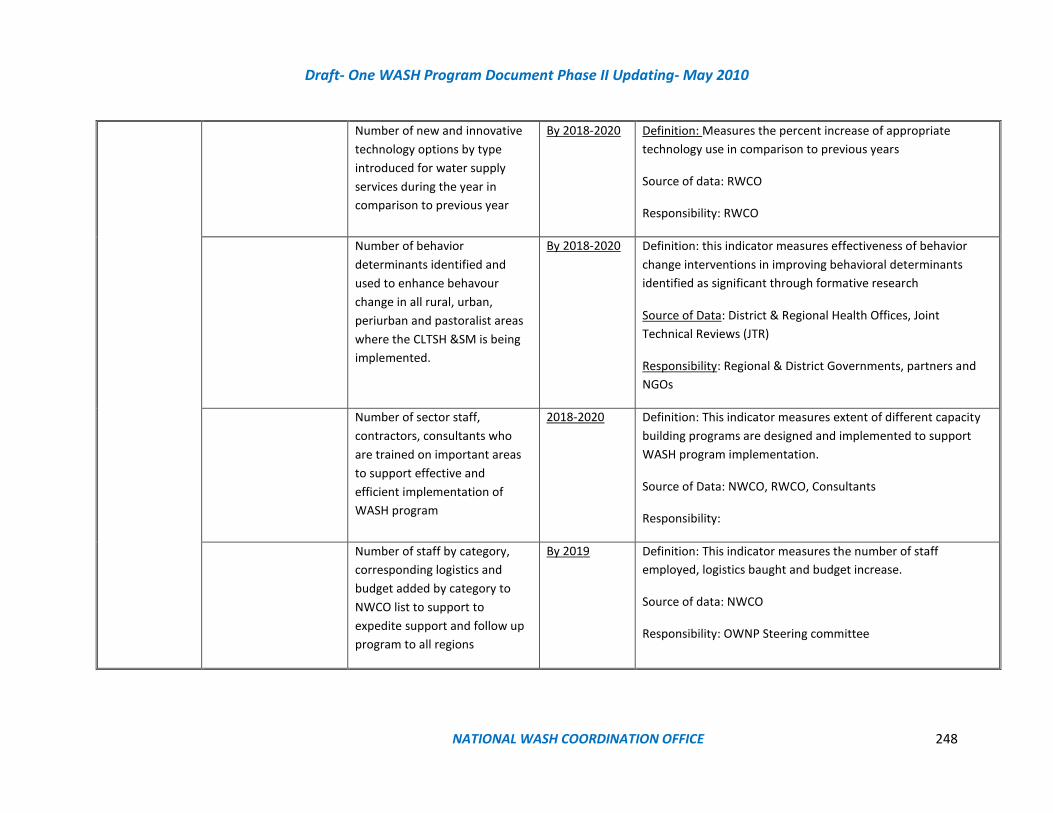
Draft- One WASH Program Document Phase II Updating- May 2010
NATIONAL WASH COORDINATION OFFICE 248
Number of new and innovative
technology options by type
introduced for water supply
services during the year in
comparison to previous year
By 2018-2020 Definition: Measures the percent increase of appropriate
technology use in comparison to previous years
Source of data: RWCO
Responsibility: RWCO
Number of behavior
determinants identified and
used to enhance behavour
change in all rural, urban,
periurban and pastoralist areas
where the CLTSH &SM is being
implemented.
By 2018-2020 Definition: this indicator measures effectiveness of behavior
change interventions in improving behavioral determinants
identified as significant through formative research
Source of Data: District & Regional Health Offices, Joint
Technical Reviews (JTR)
Responsibility: Regional & District Governments, partners and
NGOs
Number of sector staff,
contractors, consultants who
are trained on important areas
to support effective and
efficient implementation of
WASH program
2018-2020 Definition: This indicator measures extent of different capacity
building programs are designed and implemented to support
WASH program implementation.
Source of Data: NWCO, RWCO, Consultants
Responsibility:
Number of staff by category,
corresponding logistics and
budget added by category to
NWCO list to support to
expedite support and follow up
program to all regions
By 2019 Definition: This indicator measures the number of staff
employed, logistics baught and budget increase.
Source of data: NWCO
Responsibility: OWNP Steering committee
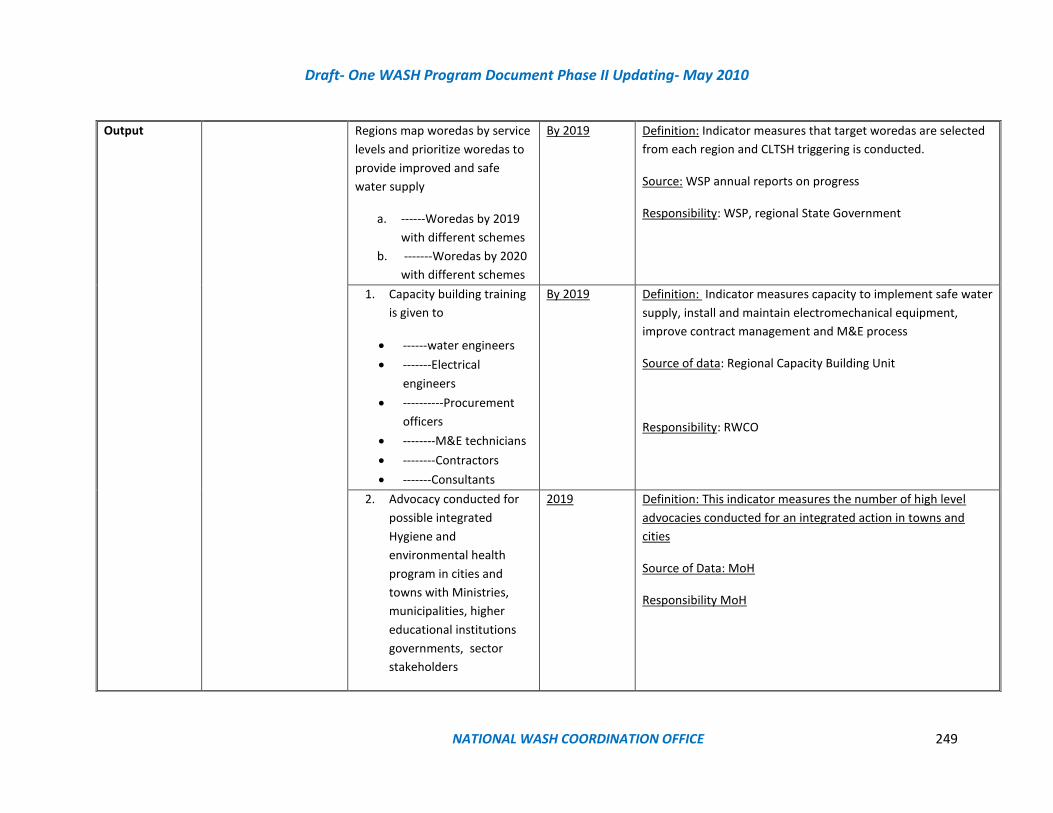
Draft- One WASH Program Document Phase II Updating- May 2010
NATIONAL WASH COORDINATION OFFICE 249
Output Regions map woredas by service
levels and prioritize woredas to
provide improved and safe
water supply
a. ------Woredas by 2019
with different schemes
b. -------Woredas by 2020
with different schemes
By 2019 Definition: Indicator measures that target woredas are selected
from each region and CLTSH triggering is conducted.
Source: WSP annual reports on progress
Responsibility: WSP, regional State Government
1. Capacity building training
is given to
• ------water engineers
• -------Electrical
engineers
• ----------Procurement
officers
• --------M&E technicians
• --------Contractors
• -------Consultants
By 2019 Definition: Indicator measures capacity to implement safe water
supply, install and maintain electromechanical equipment,
improve contract management and M&E process
Source of data: Regional Capacity Building Unit
Responsibility: RWCO
2. Advocacy conducted for
possible integrated
Hygiene and
environmental health
program in cities and
towns with Ministries,
municipalities, higher
educational institutions
governments, sector
stakeholders
2019 Definition: This indicator measures the number of high level
advocacies conducted for an integrated action in towns and
cities
Source of Data: MoH
Responsibility MoH
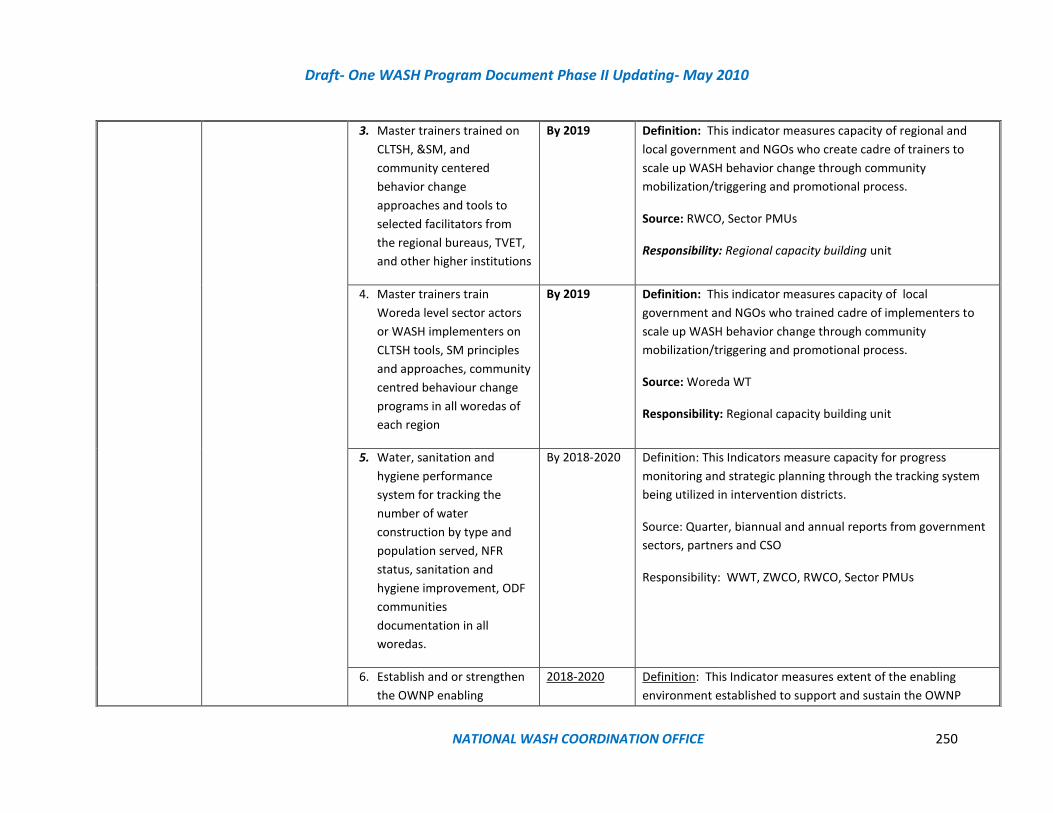
Draft- One WASH Program Document Phase II Updating- May 2010
NATIONAL WASH COORDINATION OFFICE 250
3. Master trainers trained on
CLTSH, &SM, and
community centered
behavior change
approaches and tools to
selected facilitators from
the regional bureaus, TVET,
and other higher institutions
By 2019
Definition: This indicator measures capacity of regional and
local government and NGOs who create cadre of trainers to
scale up WASH behavior change through community
mobilization/triggering and promotional process.
Source: RWCO, Sector PMUs
Responsibility: Regional capacity building unit
4. Master trainers train
Woreda level sector actors
or WASH implementers on
CLTSH tools, SM principles
and approaches, community
centred behaviour change
programs in all woredas of
each region
By 2019
Definition: This indicator measures capacity of local
government and NGOs who trained cadre of implementers to
scale up WASH behavior change through community
mobilization/triggering and promotional process.
Source: Woreda WT
Responsibility: Regional capacity building unit
5. Water, sanitation and
hygiene performance
system for tracking the
number of water
construction by type and
population served, NFR
status, sanitation and
hygiene improvement, ODF
communities
documentation in all
woredas.
By 2018-2020 Definition: This Indicators measure capacity for progress
monitoring and strategic planning through the tracking system
being utilized in intervention districts.
Source: Quarter, biannual and annual reports from government
sectors, partners and CSO
Responsibility: WWT, ZWCO, RWCO, Sector PMUs
6. Establish and or strengthen
the OWNP enabling
2018-2020 Definition: This Indicator measures extent of the enabling
environment established to support and sustain the OWNP
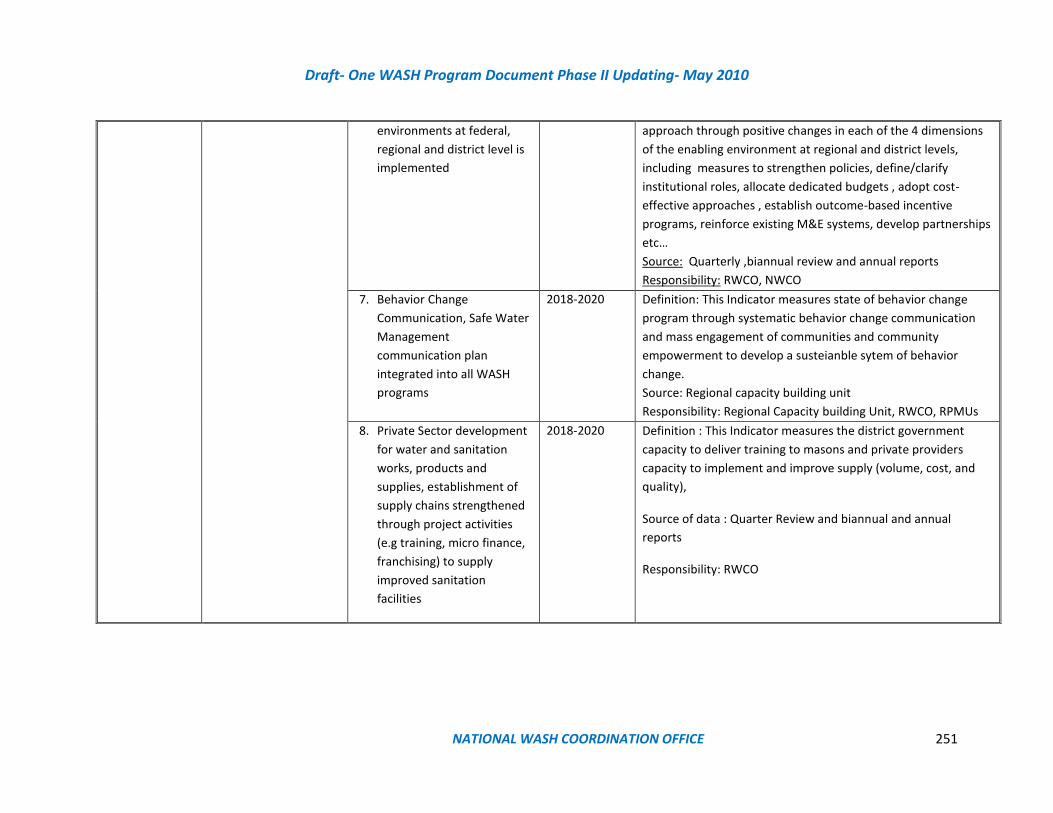
Draft- One WASH Program Document Phase II Updating- May 2010
NATIONAL WASH COORDINATION OFFICE 251
environments at federal,
regional and district level is
implemented
approach through positive changes in each of the 4 dimensions
of the enabling environment at regional and district levels,
including measures to strengthen policies, define/clarify
institutional roles, allocate dedicated budgets , adopt cost-
effective approaches , establish outcome-based incentive
programs, reinforce existing M&E systems, develop partnerships
etc…
Source: Quarterly ,biannual review and annual reports
Responsibility: RWCO, NWCO
7. Behavior Change
Communication, Safe Water
Management
communication plan
integrated into all WASH
programs
2018-2020 Definition: This Indicator measures state of behavior change
program through systematic behavior change communication
and mass engagement of communities and community
empowerment to develop a susteianble sytem of behavior
change.
Source: Regional capacity building unit
Responsibility: Regional Capacity building Unit, RWCO, RPMUs
8. Private Sector development
for water and sanitation
works, products and
supplies, establishment of
supply chains strengthened
through project activities
(e.g training, micro finance,
franchising) to supply
improved sanitation
facilities
2018-2020 Definition : This Indicator measures the district government
capacity to deliver training to masons and private providers
capacity to implement and improve supply (volume, cost, and
quality),
Source of data : Quarter Review and biannual and annual
reports
Responsibility: RWCO

Draft- One WASH Program Document Phase II Updating- May 2010
NATIONAL WASH COORDINATION OFFICE 252
Component 5: Program Management and capacity building
Summary Program management and capacity building for rural and urban
Number of Human Resource Requirement, Training and Job Creation Opportunity by Region
No. Region Population
Ratio 2010 2011 2012 Total
1 Amhara 0.23 26,212 25,078 25,078 76,369
2
Benishangul
Gumuz 0.01 1,291 1,235 1,235 3,762
3 Ethiopia Somali 0.06 7,006 6,703 6,703 20,413
4 Tigray 0.06 6,496 6,215 6,215 18,927
5 SNNPR 0.20 23,482 22,466 22,466 68,414
6 Harari 0.00 298 285 285 868
7 Gambella 0.00 526 503 503 1,531
8 Oromiya 0.37 43,289 41,417 41,417 126,122
9 Afar 0.02 2,214 2,118 2,118 6,450
10 Addis Ababa 0.04 4,205 4,023 4,023 12,252
11 Dire Dawa 0.00 565 541 541 1,647
Total Trainees 115,585 110,585 110,585 336,755
Note: The Human resource Requirement is for High level professionals such as water Engineer, Hydro
geologist, Hydrologist etc.. and for medium level professionals such as water supply technicians, E&M
technicians etc. Adopted from GTPII Subsector plan for water supply and sanitation 2015-2020