FACULTY OF ENGINEERING
DEPARTMENT OF INDUSTRIAL ENGINEERING
Managerial support for an optometry practice:
A business analytics study
Name: Melandi Kotzé
Student number: 15316491
Date of graduation: 8 December 2011
Study Leader: Me T. Visser
Final year projects presented in partial fulfillment of the requirements for the degree of
Bachelors of Industrial Engineering at Stellenbosch University.

ii
Declaration I, Melandi Kotzé, hereby declare that this Final Year Project consists of my own
original work and that I have not previously submitted it at any university for a degree.
All resources used were acknowledged in the appropriate manner according to
Harvard standards.
Ek, Melandi Kotzé, verklaar hiermee dat hierdie Finale Jaar Projek bevat my eie
oorspronklike werk en dat ek dit nog nie vantevore ingedien het by enige universiteit
ter verkryging van ’n graad nie. Aan alle verwysings gebruik was erkenning gegee
volgens die Harvard standaarde.
……………………….. ………………………
Signed On date
iii
ECSA Exit level outcomes references
Exit level outcome Section s Comments
1. Problem solving 2, 3, 4, 5, 8,
10, 11
Practice X was identified as a small business that needed possible guidance on how to improve due to the fact that they have a net income loss and is a very young practice. The report identifies the problem, provides applicable literature to support the evaluation of the practice performance, generates possible solutions and provides recommendations to improve the practice. The problem was solved by means of engineering methods as well as research based on management skills.
5. Engineering
methods, skills
& tools, incl. IT
3, 5, 6, 7, 8,
9
Different methods and tools were used to solve the problem. Specifically industry benchmarks were used to evaluate the performance status of the practice. Computer software such as Excel was used to compute the revenue mix. It was also used to determine the variables used in the metrics (example productivity ratios) since this was not always directly available and had to, in some instances, be determined out of the sales data. Techniques from engineering economics and business management were used for example: a breakeven analysis, sensitivity analysis and risk assessment were done and a database of financial statements were analysed.
6. Professional &
Technical
communication
Entire
report
The entire report was done based on prescribed report specifications and guidelines according to the study guide. Appropriate language was used and the summary was done in two languages. Figures and tables were used to structure and simplify explanations throughout the report. All industry jargon was explained in the glossary.
9. Independent
learning ability 4,5,8,10
Literature was researched on the industry independently. Research found was applied in solving the problem. All steps taken in the report or statement made has literature support. This report challenges the fact that limited literature is available on the optometry industry in South Africa. Literature support was found that U.S benchmarks are applicable in South Africa’s optometry industry. With this research and methods used to solve the problem recommendations could be made.
10. Engineering
professionalism
Declaration,
Reflection
All of the work in this report is my own and acknowledgement was given to references used. The project enabled me to engage in a professional manner with the optometry practice owner. The project made me grow as a candidate engineer.

iv
Synopsis
The South African optometry industry has limited literature available regarding the ideal
management of optometry practices. This makes it difficult for optometry practices to
evaluate their performance in order to make better informed decisions for the future of their
practice. According to other studies done on the South African optometry industry,
optometry practice management is not initially included in the optometry post graduate or
undergraduate programs. Therefore managerial skills and knowledge in most optometry
practices is very limited. This report studied a specific optometry practice that strives for
better business management in order to breakeven as soon as possible and to become
profitable. The approach to the project was to evaluate the practice’s performance in
comparison with the industry benchmarks that is available. The industry benchmarks are
United States based, but can be used as a good approximation of the South African industry,
seeing as literature was found to support this assumption.
It was found that the practice is performing well in terms of the industry benchmarks, but
certain areas were identified where there is improvement potential. These areas were
analysed in more detail in order to generate possible solutions that could possibly improve
the management procedures and processes used in the optometry practice.
It was found that the major setback for the practice is the lack of clients in general and
specifically contact lens clients. When the client base expands the revenue will increase.
This report provides recommendations to aid the management procedures in the practice in
order to attract more clients and to ultimately become profitable.

v
Opsomming
Beperkte literatuur met betrekking tot die Suid-Afrikaanse optometrie industrie en die bestuur
van praktyke is beperk. Gevolglik is dit moeilik vir Suid-Afrikaanse praktyke om hul
effektiwiteit in die industrie te meet om ingeligte besluite vir die toekoms te neem. Volgens
studies in Suid Afrika gedoen met betrekking tot die optometrie industrie, word bestuurs
klasse nie ingesluit in voorgraadse of nagraadse kursusse nie. Gevolglik is bestuur
agtergrond en kennis baie beperk in optometrie praktyke.
Hierdie verslag ondersoek ‘n spesifieke optometrie praktyk wat na meer effektiewe bestuur
van hul praktyk streef om spoedig finansieël gelyk te breek asook winsgewind te word. Die
benadering tot hierdie verslag was om die huidige effektiwiteit van die praktyk te evalueer en
met standaarde van die optometrie industrie te vergelyk. Die industrie standaarde
verkrygbaar is gebaseer op die U.S. standaarde, maar is van toepassing op Suid-Afrikaanse
optometrie praktyke volgens literatuur studies gedoen.
Die ondersoek se resultate het getoon dat die praktyk goed presteer met betrekking tot die
industrie standaarde, maar terselfdetyds is areas waar verbeter kan word ook geïdentifiseer.
Hierdie areas is meer in diepte ondersoek om potensiële oplossings te genereer wat
moontlik die bestuurs besluite en prossese vir die optometrie praktyk kan verbeter.
Die belangrikste bevinding wat voortvloei uit die navorsing rakende die praktyk is die gebrek
aan voldoende kliënte in die algemeen, maar meer spesifiek kontak lens kliënte. Om die
inkomste te vergroot is dit noodsaaklik dat die kliënte basis uitgebrei word. Hierdie verslag
bied aanbevelings vir die praktyk om bestuursbenadering moontlik aan te pas om die kliënte
basis vinniger uit te brei en die praktyk op ‘n winsgewende pad te plaas.

vi
Acknowledgements
I would like to thank God for giving me the strength to complete this project. My family for
their loving support, prayers and motivation. I also would like to thank my study leader for
her guidance and support during the course of this project.
vii
Table of Contents
Declaration ii
ECSA Exit level outcomes references iii
Synopsis iv
Opsomming v
Acknowledgements vi
List of figures x
List of tables xi
Glossary xii
1 Introduction 1
2 Research Problem 2
3 Methodology 3
3.1 Introduction 3
4 Literature study 5
4.1 Optometry growth: future prospects for the optometry industry 5
4.2 Advantages and disadvantages of different types of optometry practices 6
4.2.1 Owning your own private practice 6
4.2.2 Working for another person 6
4.2.3 Corporate optometry 6
4.3 Seven habits of effective optometrists 11
4.3.1 Client centerism 11
4.3.2 Management by performance metrics 12
4.3.3 Setting goals 12
4.3.4 Efficient time use 14
4.3.5 Implementing leadership 14
4.3.6 Taking risks 14
4.3.7 Continuous improvement 15
5 Current performance status of optometry practice X 16
5.1 Introduction 16
viii
5.2 The revenue mix of an optometry practice 17
5.2.1 The typical practice 17
5.2.2 Practice X 17
5.3 Key performance metrics 19
5.3.1 Active patients and complete eye exams 21
5.3.2 Gross per O.D. hour worked, staff hour worked and exams per O.D hour 22
5.3.3 Revenue per active patient 23
5.4 Expenses 23
5.4.1 Cost of goods 24
5.4.2 Staff expenses 25
5.5 Product related norms 25
5.5.1 Eyewear prescriptions (rxes) per 100 eye exams 26
5.5.2 Revenue each eyewear sale generates 26
5.5.3 Gross profit margin 26
6 Breakeven Analysis 27
6.1 Introduction 27
6.2 Calculations 27
7 Sensitivity analysis 31
7.1 Introduction 31
7.2 Calculations 31
8 Improving procedures of an optometry practice 33
8.1 Introduction 33
8.2 Increasing revenue 33
8.2.1 Frame displays and frame mixes 33
8.2.2 Marketing 36
8.2.3 The recall system 38
8.2.4 Grow contact lenses base 39
9 Risk Analysis 42
9.1 Introduction 42
ix
9.2 Lack of supplier discounts 42
9.2.1 Assess risk and plan risk response 43
9.2.2 Control and monitor risk 45
9.3 Lack of frame consignment 45
9.3.1 Asses risk and plan response 45
9.3.2 Control and monitor risks 46
10 Conclusion and recommendations 47
10.1 Clients‐centrism 47
10.2 Management by performance metrics 47
10.3 Setting goals 48
10.4 Efficient time use 48
10.5 Implementing leadership 48
10.6 Taking risks 48
10.7 Continuous improvement 48
11 Reflection 49
12 References 50
13 Appendix A: Income and Expenses of practice X 53
14 Appendix B: Excel spreadsheet with calculated values for minimal monthly turnover 55
15 Appendix C: Gannt chart of methodology timeline 57

x
List of figures
Figure 1: Research Methodology .......................................................................................... 4
Figure 2: Employment increase ............................................................................................. 5
Figure 3: Revenue mix of the typical optometry practice ..................................................... 17
Figure 4: Revenue mix of optometry practice X ................................................................... 18
Figure 5: Turnover analysis for 2010 with breakeven sales illustrated seasonally ............... 30
Figure 6: Average revenue and expense for brands sold in 2010 ........................................ 34
Figure 7: Proportions of contact lens fittings in 38 countries ................................................ 40
Figure 8: Age of patients when first recommended contact lenses ...................................... 41
Figure 9: Turnover analysis for 2010 with new breakeven sales illustrated seasonally ........ 44

xi
List of tables
Table 1: Advantages and disadvantages of different optometry practices ............................. 7
Table 2: Practice X's advantages and disadvantages ........................................................... 8
Table 3: Key metrics by practice type .................................................................................. 20
Table 4: Key metrics for practice X versus typical practice norms ....................................... 20
Table 5: Productivity ratios of practice X versus norms of the typical practice ..................... 22
Table 6: Expense ratios for the typical optometry practice .................................................. 23
Table 7: Expense ratios for optometry practice X ................................................................ 24
Table 8: Practice X product related norms versus the typical practice ................................. 25
Table 9: Net sales and eye exams per week ....................................................................... 29
Table 10: Sensitivity analysis data ...................................................................................... 32
Table 11: Optimal brand fractions ....................................................................................... 35
Table 12: Financial influence without supplier discounts ..................................................... 43
Table 13: Amount of eye exams per week required without supplier discounts ................... 43
Table 14: Financial influence without frames on consignment ............................................. 45
xii
Glossary
MBA The Management and Business Academy
O.D. Doctor of optometry
U.S. United States
SAOA South African Optometric Association
OPM Optometric Practice Management
Rxes Eyewear received with a prescription
Markup Price of item sold
Consignment The supplier keeps ownership of the product until it is
sold and if not sold it is returned to the supplier
1
1 Introduction
Optometry is one of the larger independent health-care professions practiced.
Globally, people are becoming more aware of the importance of healthcare on a daily
basis. The need for vision care is increasing with the growing and aging world
population, therefore it’s likely that the demand for optometrists will also increase.
An optometry practice in the Western Cape approached the student to evaluate their
overall business performance and identify possible areas for improvement. The
practice requested to not be mentioned in the study, due to sensitive financial data
being exposed, hence it will be referred to as practice X throughout the rest of the
study.
Richter (2007) states that in South Africa there is a lack of benchmarks and research
regarding optometry practice management. She also mentions that business
management in terms of optometry in South Africa is still very young. South African
authors have only recently started publishing books and articles on practice
management focusing on subjects such as: inventory control, health, administration,
human resources, project management and professional ethics, according to Mokoena
(Richter, 2007). A study done by Richter (2007) researched the opinions of
optometrists regarding whether or not undergraduate and post graduate programs in
optometry in South Africa should consist of optometry practice management (OPM)
courses. Richter’s study found that 92.6% of the optometrists registered at the South
African Optometry Association (SAOA) that took part in the survey believed that OPM
should be included in their undergraduate and postgraduate studies. Gowans stated
that the effectiveness of an optometry practice lies in the efficient management and
control of a practice’s stock and assets (Richter, 2007).
Accordingly it is evident that for optometry practice X to achieve a competitive
advantage and maintain it, good management is needed. It should be kept in mind that
practice X belongs to a franchise, which can impose limitations to possible
improvements. The practice was taken over by the new owners 2 years ago and is
thus still in its early stage of growth; consequently posting an annual net loss.
Section 2 of this report describes the research problem and is followed by the methods
used to address the research problem in section 3. A literature review will be
presented in section 4 in order to give more insight on the topic. The current state of
2
optometry practice X will be measured and compared to industry norms in order to
determine areas of interest where possible improvements can be made in section 5.
The areas for possible improvements will be analysed in order to provide meaningful
recommendations in section 10.
2 Research Problem
The objective of this study is to engineer the business procedures of optometry
practice X in order to optimize the practice’s daily management with the intention to
become profitable. The initial aim of the study will be to find measurements suitable to
evaluate practice X with, in order to identify areas with improvement potential. The
proposal of solutions and setting of goals to effect these improvements and implement
it within the practice will be considered.
3
3 Methodology
3.1 Introduction
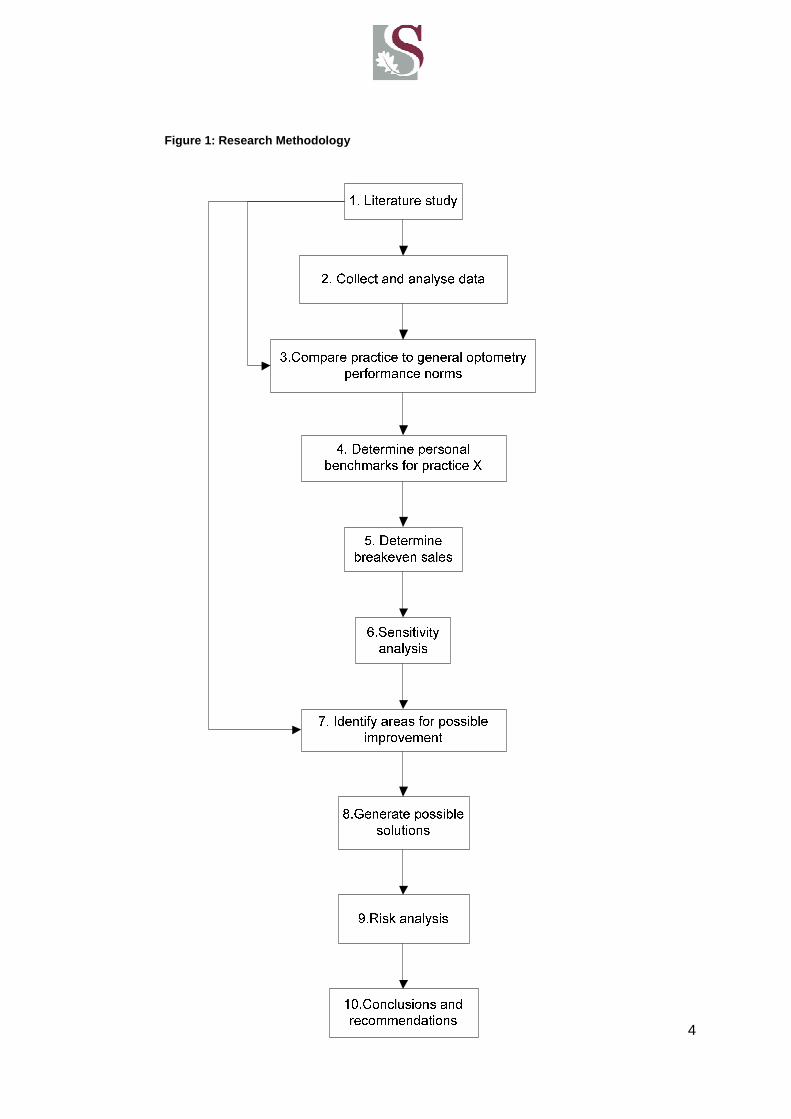
See figure 1 for the research methodology which was the planned approach to this
report. The timeline for these steps can be seen in Appendix C in form of a Gannt
chart. The methodology can be described by a number of steps to be completed.
Step 1: Literature study
Research was done on the optometry industry globally and specifically in South Africa.
The research was updated continuously throughout the completion of this report.
Step 2: Collect and analyze data
The data comprised practice X’s accounting statements, summarised supplier
invoices, daily sales and supplier benefit information. This data was analised to
determine the current performance status of practice X.
Step 3: Compare practice to general optometry perfo rmance norms - The current
status of practice X was compared to optometry industry norms as found in step 1.
Step 4: Determine personal benchmarks for practice X
With regards to the industry norms and results from step 3, benchmarks were set as
specific goals for practice X to strive towards.
Step 5: Determine breakeven sales
It was determined what practice X’s requirements are to be able to break even with
their sales in the future.
Step 6: Sensitivity analysis
A sensitivity analysis was done to determine the influence that an inaccurate
benchmark could have on the practice evaluation.
Step 7: Identify areas for possible improvement
Significant areas that have potential for improvement were identified.
Step 8: Generate possible solutions
Possible solutions were generated for the possible improvement areas identified.
Step 9: Risk analysis
A risk analysis was done to determine the influence of the lack of franchise benefits.
Step 10: Conclusions and recommendations
Conclusions were drawn and recommendations were generated on how to potentially
improve the practice performance going forward.
4
Figure 1: Research Methodology

5
4 Literature study
4.1 Optometry growth: future prospects for the opto metry industry
From 2008 to 2018 the employment of optometrists is expected to grow by 24%
according to the U.S. Department of Labour (U.S. Bureau of Labour Statistics, 2009).
Statistics of optometrist employment in 2008 and projected employment in 2018 is
illustrated in Figure 2.
Figure 2: Employment increase
(U.S. Bureau of Labour Statistics, 2009)
The demand for optometrists will most likely increase with the rising global population,
recognising the importance of vision care. More job growth is also expected due to the
increase in the number of health insurance plans that include vision care. The aging
populations will likely result in an increase in optometrist visits, since vision problems
(such as cataracts, glaucoma and macular degeneration) are more common among
the elderly (U.S. Bureau of Labor Statistics, 2009). Although optometrist are in demand
the opening of a new optometry practice is difficult, thus good management is
essential in order to become profitable as soon as possible.
34800
43200
0
5000
10000
15000
20000
25000
30000
35000
40000
45000
50000
Employment 2008 Projected employment
2018
Nu
mb
er
of
em
plo
ym
en
ts
Employment increase
Employment 2008
Projected number
of employments
increases: 8500
Increase of 24%
6
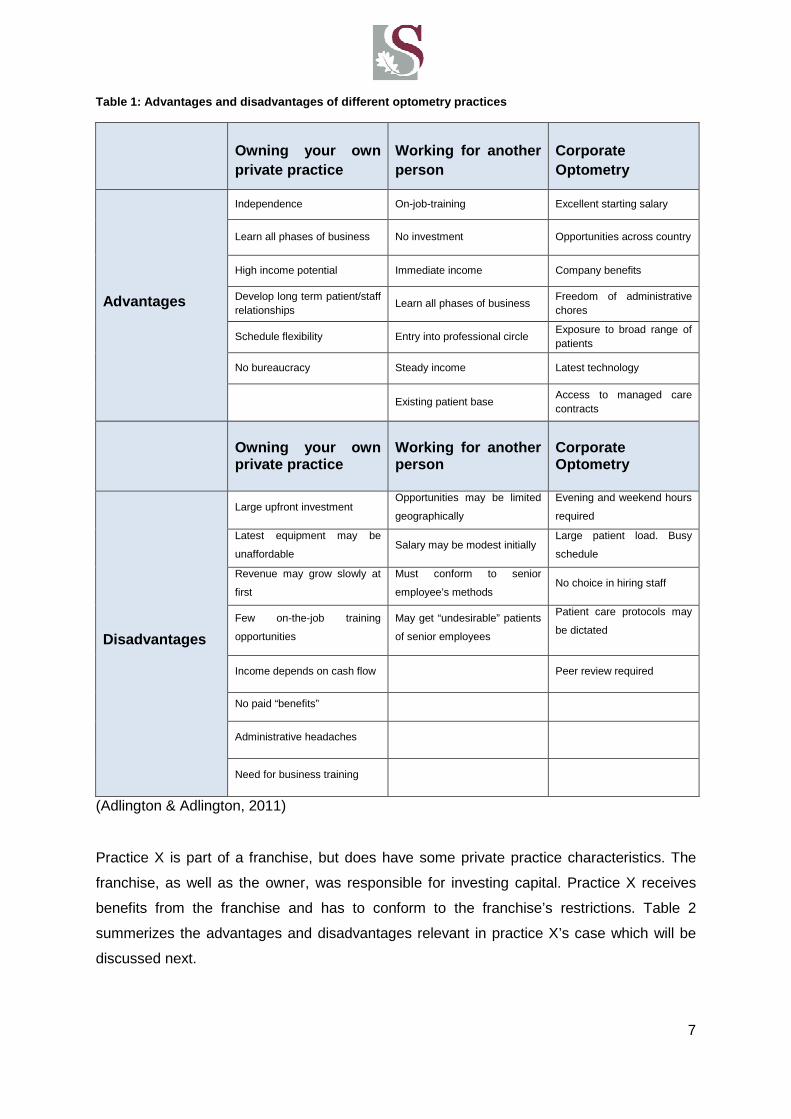
4.2 Advantages and disadvantages of different types of optometry
practices
The following primary types of practices are managed in South Africa and globally: owner
operated practices, working for another person and corporate optometry. To follow is a
clarification of each type of optometry practice.
4.2.1 Owning your own private practice
All capital invested into the practice would be your own and you are self- employed. All
profit and losses are carried by the owner.
4.2.2 Working for another person
This shifts the responsibility of capital investment to the company who employs you.
The optometrist therefore receives a salary and is not affected by the profit or loss the
company makes.
4.2.3 Corporate optometry
Corporate optometry is mostly defined as when a practice is part of a bigger group
corporate entity. They are able to work under the larger business’s name and receive
benefits for belonging to this group. On the other hand, the owner has to pay fees
and conform to certain codes of conduct. A franchise is a good example of corporate
optometry.
A summary of the advantages and disadvantages of the different practice types is identified
in Table 1.
7
Table 1: Advantages and disadvantages of different optometry practices
Owning your own private practice
Working for another person
Corporate Optometry
Advantages
Independence On-job-training Excellent starting salary
Learn all phases of business No investment Opportunities across country
High income potential Immediate income Company benefits
Develop long term patient/staff relationships
Learn all phases of business Freedom of administrative chores
Schedule flexibility Entry into professional circle Exposure to broad range of patients
No bureaucracy Steady income Latest technology
Existing patient base Access to managed care contracts
Owning your own private practice
Working for another person
Corporate Optometry
Disadvantages
Large upfront investment Opportunities may be limited
geographically
Evening and weekend hours
required
Latest equipment may be
unaffordable Salary may be modest initially
Large patient load. Busy
schedule
Revenue may grow slowly at
first
Must conform to senior
employee’s methods No choice in hiring staff
Few on-the-job training
opportunities
May get “undesirable” patients
of senior employees
Patient care protocols may
be dictated
Income depends on cash flow Peer review required
No paid “benefits”
Administrative headaches
Need for business training
(Adlington & Adlington, 2011)
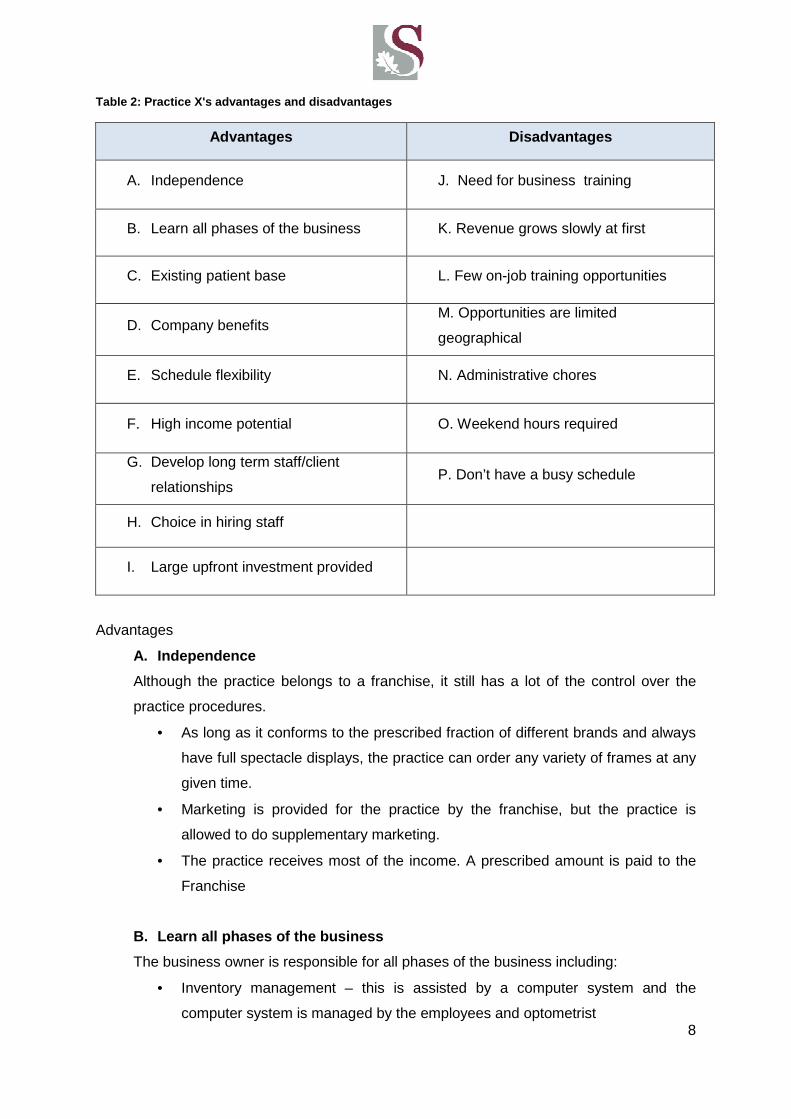
Practice X is part of a franchise, but does have some private practice characteristics. The
franchise, as well as the owner, was responsible for investing capital. Practice X receives
benefits from the franchise and has to conform to the franchise’s restrictions. Table 2
summerizes the advantages and disadvantages relevant in practice X’s case which will be
discussed next.
8
Table 2: Practice X's advantages and disadvantages
Advantages Disadvantages
A. Independence J. Need for business training
B. Learn all phases of the business K. Revenue grows slowly at first
C. Existing patient base L. Few on-job training opportunities
D. Company benefits M. Opportunities are limited
geographical
E. Schedule flexibility N. Administrative chores
F. High income potential O. Weekend hours required
G. Develop long term staff/client
relationships P. Don’t have a busy schedule
H. Choice in hiring staff
I. Large upfront investment provided
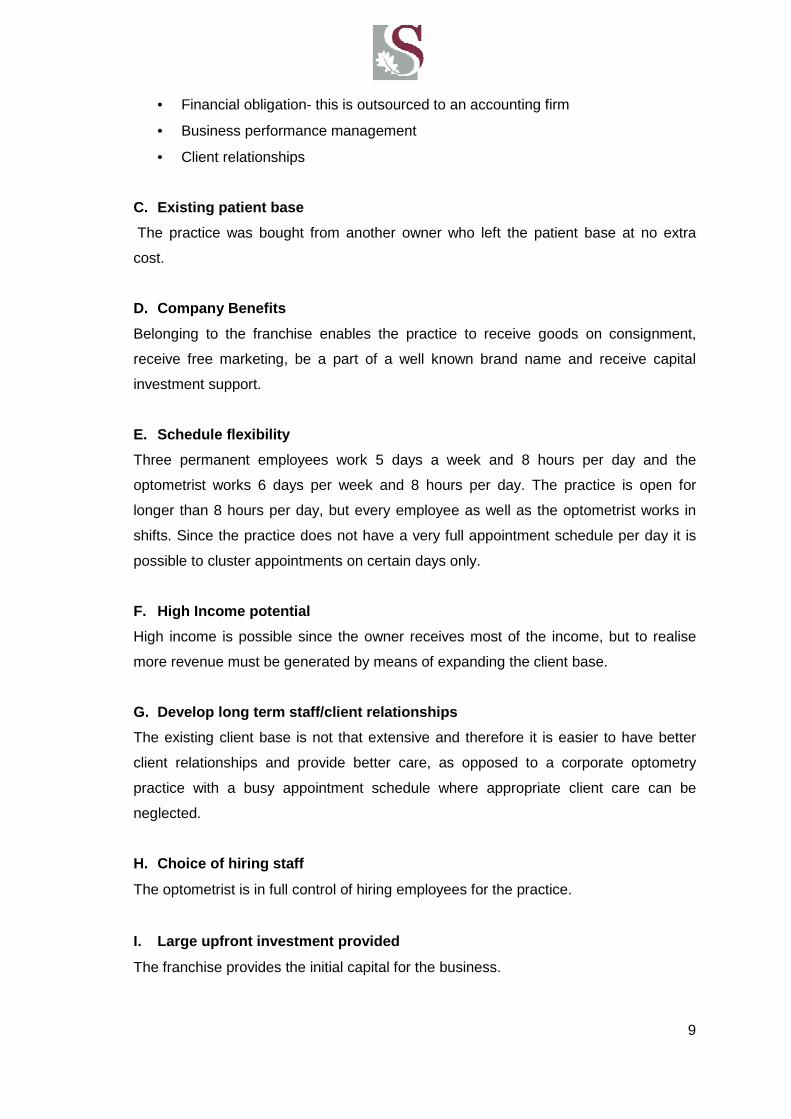
Advantages
A. Independence
Although the practice belongs to a franchise, it still has a lot of the control over the
practice procedures.
• As long as it conforms to the prescribed fraction of different brands and always
have full spectacle displays, the practice can order any variety of frames at any
given time.
• Marketing is provided for the practice by the franchise, but the practice is
allowed to do supplementary marketing.
• The practice receives most of the income. A prescribed amount is paid to the
Franchise
B. Learn all phases of the business
The business owner is responsible for all phases of the business including:
• Inventory management – this is assisted by a computer system and the
computer system is managed by the employees and optometrist
9
• Financial obligation- this is outsourced to an accounting firm
• Business performance management
• Client relationships
C. Existing patient base
The practice was bought from another owner who left the patient base at no extra
cost.
D. Company Benefits
Belonging to the franchise enables the practice to receive goods on consignment,
receive free marketing, be a part of a well known brand name and receive capital
investment support.
E. Schedule flexibility
Three permanent employees work 5 days a week and 8 hours per day and the
optometrist works 6 days per week and 8 hours per day. The practice is open for
longer than 8 hours per day, but every employee as well as the optometrist works in
shifts. Since the practice does not have a very full appointment schedule per day it is
possible to cluster appointments on certain days only.
F. High Income potential
High income is possible since the owner receives most of the income, but to realise
more revenue must be generated by means of expanding the client base.
G. Develop long term staff/client relationships
The existing client base is not that extensive and therefore it is easier to have better
client relationships and provide better care, as opposed to a corporate optometry
practice with a busy appointment schedule where appropriate client care can be
neglected.
H. Choice of hiring staff
The optometrist is in full control of hiring employees for the practice.
I. Large upfront investment provided
The franchise provides the initial capital for the business.
10
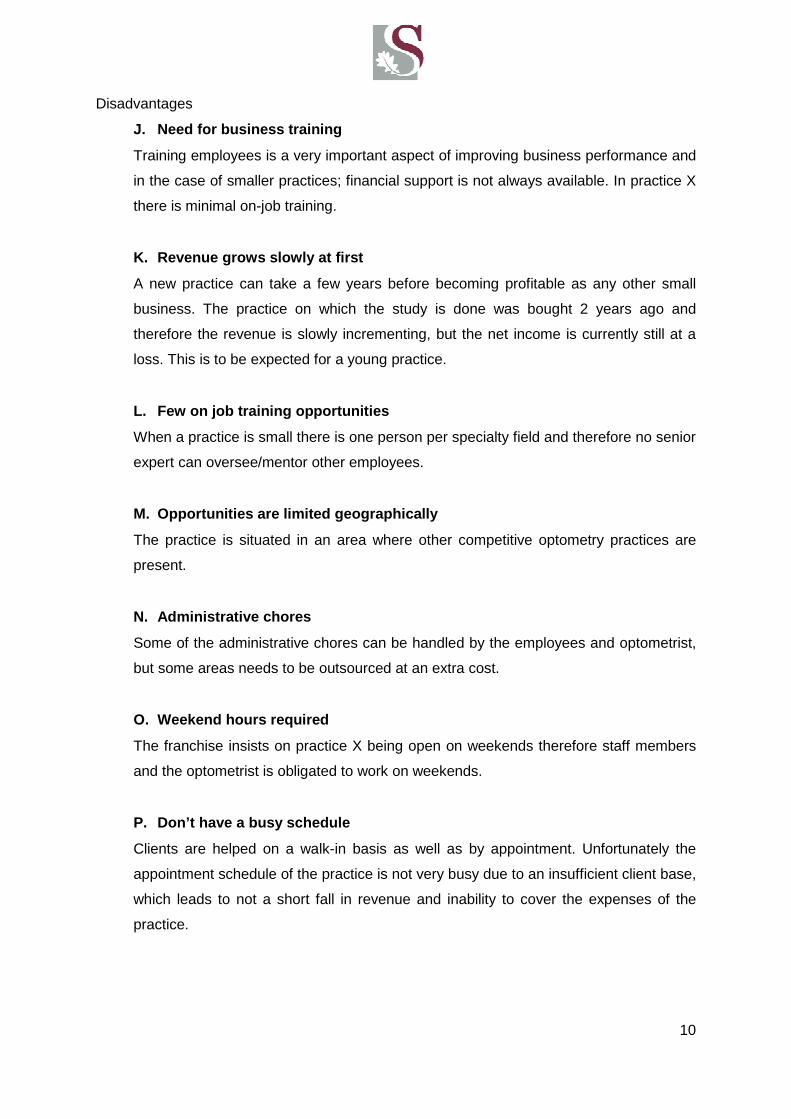
Disadvantages
J. Need for business training
Training employees is a very important aspect of improving business performance and
in the case of smaller practices; financial support is not always available. In practice X
there is minimal on-job training.
K. Revenue grows slowly at first
A new practice can take a few years before becoming profitable as any other small
business. The practice on which the study is done was bought 2 years ago and
therefore the revenue is slowly incrementing, but the net income is currently still at a
loss. This is to be expected for a young practice.
L. Few on job training opportunities
When a practice is small there is one person per specialty field and therefore no senior
expert can oversee/mentor other employees.
M. Opportunities are limited geographically
The practice is situated in an area where other competitive optometry practices are
present.
N. Administrative chores
Some of the administrative chores can be handled by the employees and optometrist,
but some areas needs to be outsourced at an extra cost.
O. Weekend hours required
The franchise insists on practice X being open on weekends therefore staff members
and the optometrist is obligated to work on weekends.
P. Don’t have a busy schedule
Clients are helped on a walk-in basis as well as by appointment. Unfortunately the
appointment schedule of the practice is not very busy due to an insufficient client base,
which leads to not a short fall in revenue and inability to cover the expenses of the
practice.

11
4.3 Seven habits of effective optometrists
One of the greatest misperceptions optometrists encounter is a belief that their business
success relies merely on the clinical skills they can apply in their practice, without
considering client relationships. Non-technical skills are much more significant than most
optometrists realize.
“The seven habits of highly effective optometrists” (Chris, 2009) suggests seven habits for
optometrists to consider in order being financially successful. The following habits are easy
to implement and can be beneficial to practice X.
4.3.1 Client centerism
Many optometry practices provide sufficient technical skill and strive to continuously
improve profit. Profits and expenses become the center of attention and drives
activities within the practice. Their goals are mainly focused on the practice’s financial
welfare and neglect to take into consideration the importance of client satisfaction.
Many practices are under the impression that they are client centric, but in truth their
service levels are mediocre. It is found that clients value their personal relationship
with the optometry practice more than the clinical service they receive. It is, therefore,
important for an optometrist to form a bond with each client and take interest in their
lives.
Moss and Shaw-McMinn (2001) stated that rumours of poor quality service spreads
more rapidly than words of good quality. According to their research clients do not
return based on the following reasons:
• 3 % clients moves to another area
• 9% clients transfers to the competition
• 14% clients is not satisfied with their products received
• 68% clients felt unwelcome
It is important for optometry practice X to form quality relationships with clients and to
provide service in high levels in order to achieve the following results. It is the
personalised service clients receive that is the grounds for them to return to that same
practice.
• Better return rates based on service received
• Client base expansion through positive word-of-mouth

12
4.3.2 Management by performance metrics
Management metrics enables a practice to keep record of the practice’s performance
and enables response in cases of changing circumstances in a business, such as
seasonal dangers, a recession etc.
Metrics are very important platforms on which informed decisions can be based, as
metrics are computed from actual data and thus reduces the risk of basing actions on
intuition and personal feelings. Quantitative measures enable clear goal setting
(discussed in section 4.3.3). Many optometry businesses lack the business element of
management of an optometry practice. The performance of an optometry practice can
be improved by continuously measuring their position with regards to industry norms.
The most successful optometry practices continuously measure variables such as:
revenue generated per eye exam, revenue per optometry doctor (O.D.) hour, revenue
generated per staff hour, exams per O.D. hour, revenue per active patient, number of
exams per active patient, revenue share and expense categories.
Practice X does not currently invest a great deal of time into measuring the
performance of their business and, therefore, this leaves room for improvement. By
monitoring practice X’s performance, attention can be focused on the actions that
generate the best results. Corrective action can then be taken on areas identified for
improvement. Its current performance status will be measured by means of these
metrics and will be discussed in section 5.
4.3.3 Setting goals
Having a successful optometry practice is an ideal which starts with a long-term vision
consisting of short term goals. It is found that in daily life setting goals makes people
more productive and lead to more satisfying lives than following a day-to-day
approach. This concept can be incorporated in practice X by setting goals based on
the performance measurements taken. The following goals can be set for practice X:
Long term goals:
1. What is the performance vision for the practice?
Practice X should strive to breakeven as soon as possible and increase their net
income to an average 33% (Gailmard, 2007) of their gross revenue for the years to
follow.
13
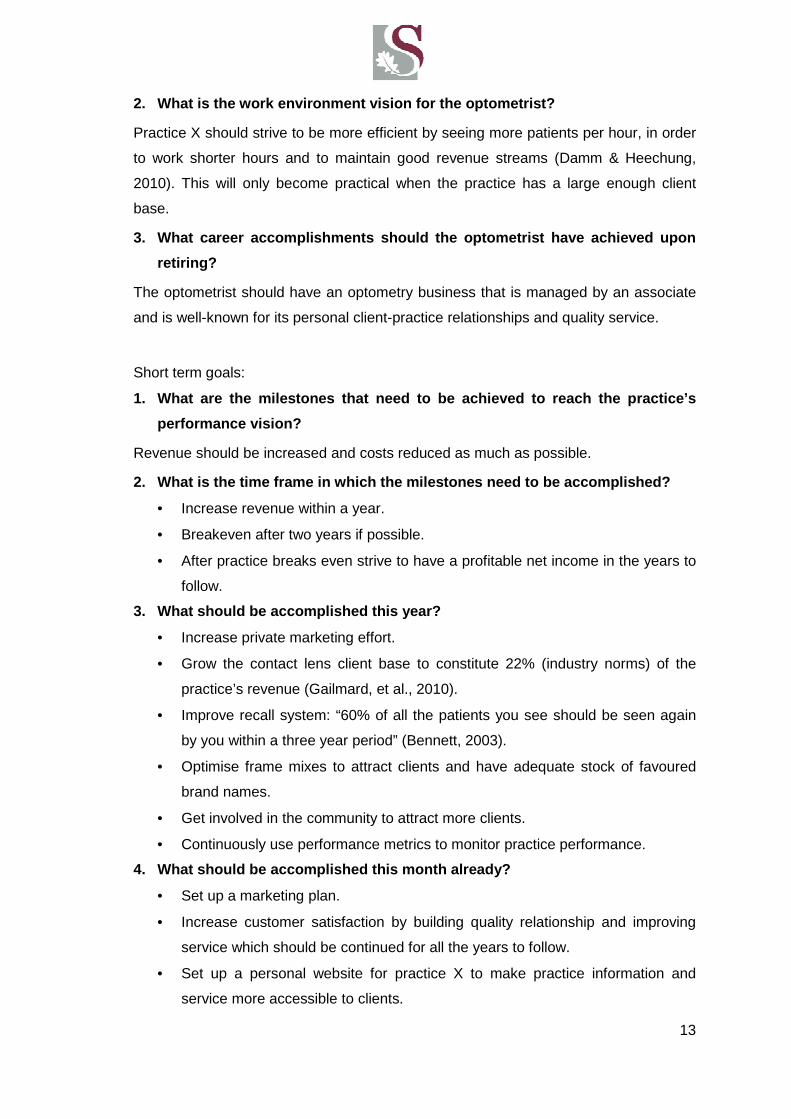
2. What is the work environment vision for the opto metrist?
Practice X should strive to be more efficient by seeing more patients per hour, in order
to work shorter hours and to maintain good revenue streams (Damm & Heechung,
2010). This will only become practical when the practice has a large enough client
base.
3. What career accomplishments should the optometri st have achieved upon
retiring?
The optometrist should have an optometry business that is managed by an associate
and is well-known for its personal client-practice relationships and quality service.
Short term goals:
1. What are the milestones that need to be achieved to reach the practice’s
performance vision?
Revenue should be increased and costs reduced as much as possible.
2. What is the time frame in which the milestones n eed to be accomplished?
• Increase revenue within a year.
• Breakeven after two years if possible.
• After practice breaks even strive to have a profitable net income in the years to
follow.
3. What should be accomplished this year?
• Increase private marketing effort.
• Grow the contact lens client base to constitute 22% (industry norms) of the
practice’s revenue (Gailmard, et al., 2010).
• Improve recall system: “60% of all the patients you see should be seen again
by you within a three year period” (Bennett, 2003).
• Optimise frame mixes to attract clients and have adequate stock of favoured
brand names.
• Get involved in the community to attract more clients.
• Continuously use performance metrics to monitor practice performance.
4. What should be accomplished this month already?
• Set up a marketing plan.
• Increase customer satisfaction by building quality relationship and improving
service which should be continued for all the years to follow.
• Set up a personal website for practice X to make practice information and
service more accessible to clients.
14
Implementing long term and short term goals in practice X is likely to improve their
business procedures and set a basis for continuous assessment of the practice’s
performance in the future.
4.3.4 Efficient time use
Time management is an essential business skill. The ideal is to distribute time around
the practice’s goals and main concerns. Unfortunately, Practice X presently does not
have a very full schedule in terms of time slots filled during the day for eye exams, but
managing their time around other aspects of the business can be very beneficial.
When practice X reaches its potential in terms of a full schedule, good daily time
management will become essential.
According to Chris (2009) “The best performing optometrists have no more time to
advance their business than do the worst performers, but they use every minute more
effectively. The most productive 10 percent earn nearly four times as much each hour
they spend in the office than do the least productive 10 percent.” Practice X should
strive to be part of this productive 10 percent when their schedule becomes full of back
to back appointments. If practice X improves their business procedures discussed in
section 10 it is likely in the future that the practice will become part of this 10 percent.
4.3.5 Implementing leadership
Having a close relationship with staff members even though employees have different
educational degrees can be very beneficial to an optometry practice. Even if a
practice’s staff members consists of people with minimum eye care experience or
training in customer service, it is still important to include staff members in the vision of
the practice. Continuous on-job training and guidance of staff members is needed.
Well trained staff members provide good technical and personal service, which results
in returning clients. Approaching experts to provide guidance in how to engage your
staff can be beneficial to a practice. Practice X strives to have good staff relationships
in order to provide better client service and more returning clients.
4.3.6 Taking risks
Changing a business’s routine does hold financial risk, but breaking old habits and
implementing new ideas can give a practice a competitive advantage. “No successful
business was ever created without accepting risk” (Chris, 2009). In order for practice X
15
to improve its procedures practice X will have to change daily routines which may
seem risky at first, but can be very beneficial to the practice in the long term.
4.3.7 Continuous improvement
It is important to constantly improve the daily office routine of an optometry practice.
This includes being open to new technology. Including staff members in the continuous
improvement can also be beneficial by assigning different areas in the business to
different staff members to monitor. The biggest barrier to improvement is not being
open to change. Practice X does not currently have performance metrics that monitors
the practice’s health and therefore this is something that can be valuable for their
yearly routine. Performance metrics will identify areas where practice X can improve
yearly, which will enable it to set new goals every year; consequently continuously
improving their business procedures.
16
5 Current performance status of optometry practice X
5.1 Introduction
Jerry Hayes, OD, who is among the founding faculty of The Management Business
Academy (MBA), states in his lectures: “Whatever you measure, improves” (Gailmard, et al.,
2010). Using metrics enables a practice to monitor its performance. It also indicates where
there is potential for improvement. Metrics provide a way for an owner of an optometry
practice to stay in control of what is happening in the business and provide means by which
goals can be set realistically. MBA has been collecting information on the characteristics and
financial performance of independent optometric practices from 2005. Their surveys include
about 1500 optometry practices in the U.S.
The MBA guide has been used as metric to determine the current performance status of
practice X. Although the guide is based on the U.S. dollar, all financial numbers has been
converted with 2010’s averaged Rand-Dollar currency exchange rate ($1 = R7.325743).
An interview with John Hanson, who joined Johnson & Johnson Vision Care as an account
manager over 8 years ago, was posted on the Eyesite Magazine website regarding the
future success of their brand. Johnson and Johnson is a world known vision brand and
globally number one with soft contact lenses (Eyesite Magazine, 2011).Hanson worked
originally in the UK, but has been an account manager for many months in South Africa at
Johnson and Johnsons Vision Care. According to Hanson, comparing the UK standards to
South Africa’s standards in optometry is very similar. Hanson (Eyesite Magazine, 2011) also
mentioned: “If looking for a benchmark then I turn to the U.S. The eye doctors there are
much more proactive in offering their professional services and also suggesting different
vision solutions according to the patients needs. At our recent Acuvue® centre of excellence
conference we discussed doing the same in a South African practice.” Hanson finds the
optical industry in South Africa the same as many other markets he has worked in (Eyesite
Magazine, 2011).On these grounds it was possible to use U.S. based benchmarks for
practice X for a good approximation of how it needs to perform.
The general findings of using the MBA guide will be summarised in this report and the most
significant findings are highlighted.
17
5.2 The revenue mix of an optometry practice
When assessing an optometry practice’s performance, it is important to consider the
revenue mix. This metric should be observed continuously. A practice that fluctuates widely
from the norms, with no specialised field, could possibly not be maximising their revenue.
5.2.1 The typical practice
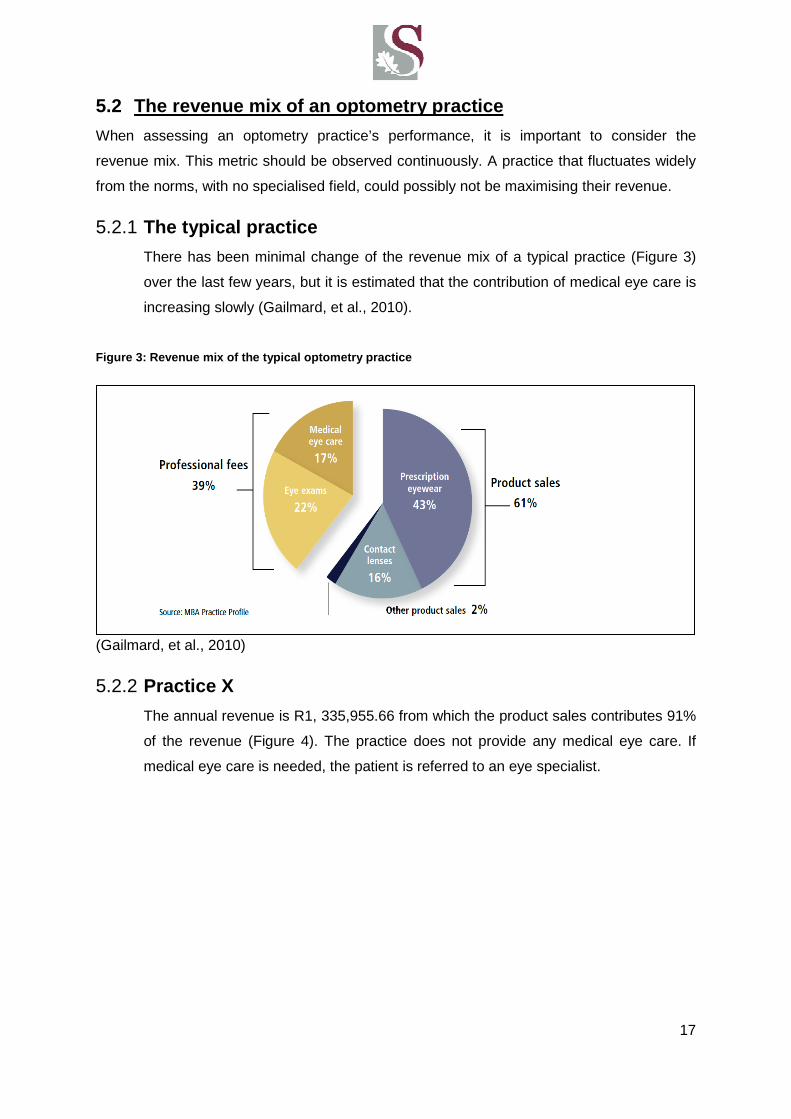
There has been minimal change of the revenue mix of a typical practice (Figure 3)
over the last few years, but it is estimated that the contribution of medical eye care is
increasing slowly (Gailmard, et al., 2010).
Figure 3: Revenue mix of the typical optometry prac tice
(Gailmard, et al., 2010)
5.2.2 Practice X
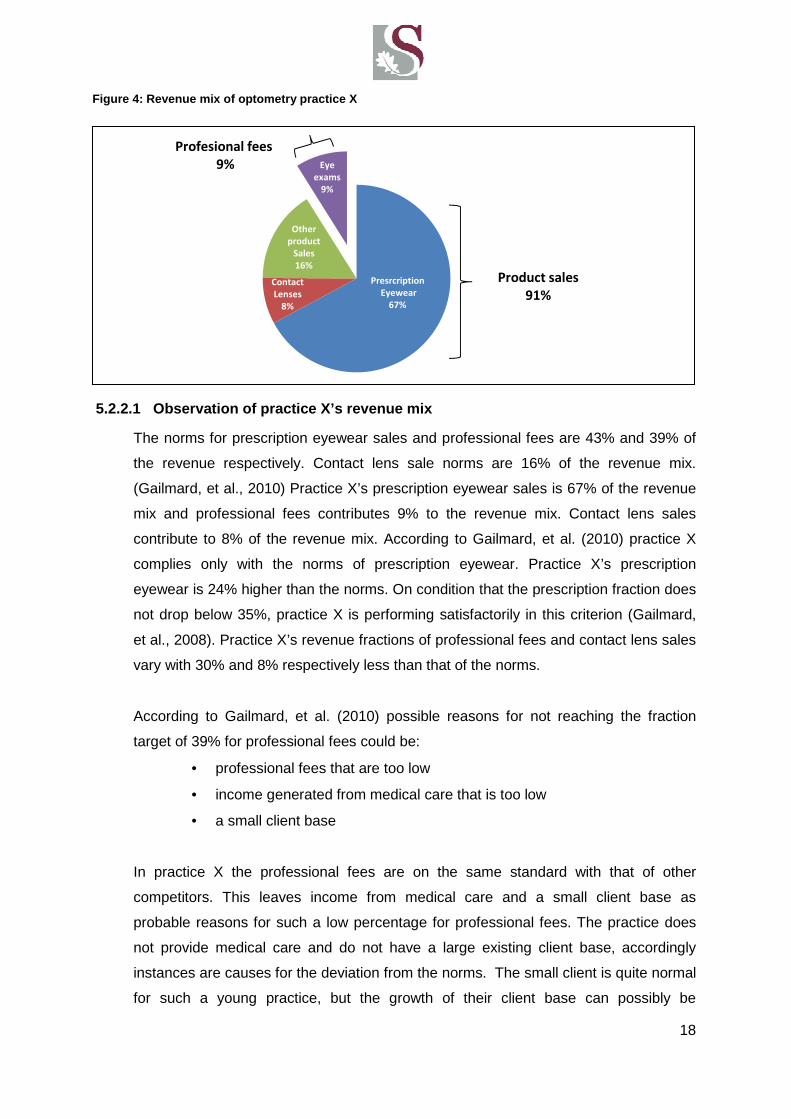
The annual revenue is R1, 335,955.66 from which the product sales contributes 91%
of the revenue (Figure 4). The practice does not provide any medical eye care. If
medical eye care is needed, the patient is referred to an eye specialist.
18
5.2.2.1 Observation of practice X’s revenue mix
The norms for prescription eyewear sales and professional fees are 43% and 39% of
the revenue respectively. Contact lens sale norms are 16% of the revenue mix.
(Gailmard, et al., 2010) Practice X’s prescription eyewear sales is 67% of the revenue
mix and professional fees contributes 9% to the revenue mix. Contact lens sales
contribute to 8% of the revenue mix. According to Gailmard, et al. (2010) practice X
complies only with the norms of prescription eyewear. Practice X’s prescription
eyewear is 24% higher than the norms. On condition that the prescription fraction does
not drop below 35%, practice X is performing satisfactorily in this criterion (Gailmard,
et al., 2008). Practice X’s revenue fractions of professional fees and contact lens sales
vary with 30% and 8% respectively less than that of the norms.
According to Gailmard, et al. (2010) possible reasons for not reaching the fraction
target of 39% for professional fees could be:
• professional fees that are too low
• income generated from medical care that is too low
• a small client base
In practice X the professional fees are on the same standard with that of other
competitors. This leaves income from medical care and a small client base as
probable reasons for such a low percentage for professional fees. The practice does
not provide medical care and do not have a large existing client base, accordingly
instances are causes for the deviation from the norms. The small client is quite normal
for such a young practice, but the growth of their client base can possibly be
Presrcription
Eyewear
67%
Contact
Lenses
8%
Other
product
Sales
16%
Eye
exams
9%
Profesional fees
9%
Product sales
91%
Figure 4: Revenue mix of optometry practice X
19
accelerated in the next few years. The medical care nonconformity can unfortunately
not be addressed, since practice X do not have an ophthalmologist.
According to Gailmard, et al. (2010) possible reasons for not reaching the fraction
target of 16% for contact lens sales could be:
• overlook mentioning contact lenses to clients during routine exams
• the use of speciality lenses are low by clients of the practice
It is evident that there is a need for an increase in the number of eye exams, as well as
sales of contact lenses. Ways to optimise these areas will be discussed in section 8.
5.3 Key performance metrics
A summary follows of key metrics that is used to determine the performance of an optometry
practice and to identify areas that could possibly be optimised. These metrics are based on
The Management Business Academy (2010) booklet with regards to U.S. optometry industry
norms. Practice X’s information was determined from its financial statements and
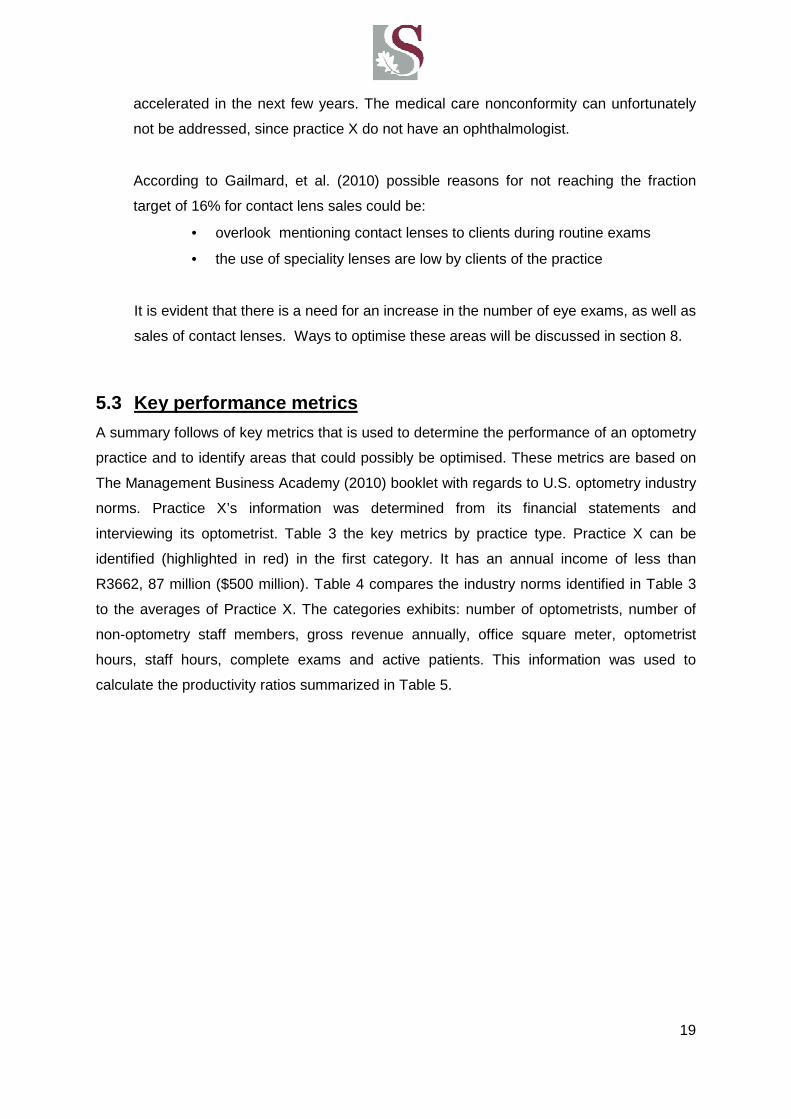
interviewing its optometrist. Table 3 the key metrics by practice type. Practice X can be
identified (highlighted in red) in the first category. It has an annual income of less than
R3662, 87 million ($500 million). Table 4 compares the industry norms identified in Table 3
to the averages of Practice X. The categories exhibits: number of optometrists, number of
non-optometry staff members, gross revenue annually, office square meter, optometrist
hours, staff hours, complete exams and active patients. This information was used to
calculate the productivity ratios summarized in Table 5.
20
(Gailmard, et al., 2010)
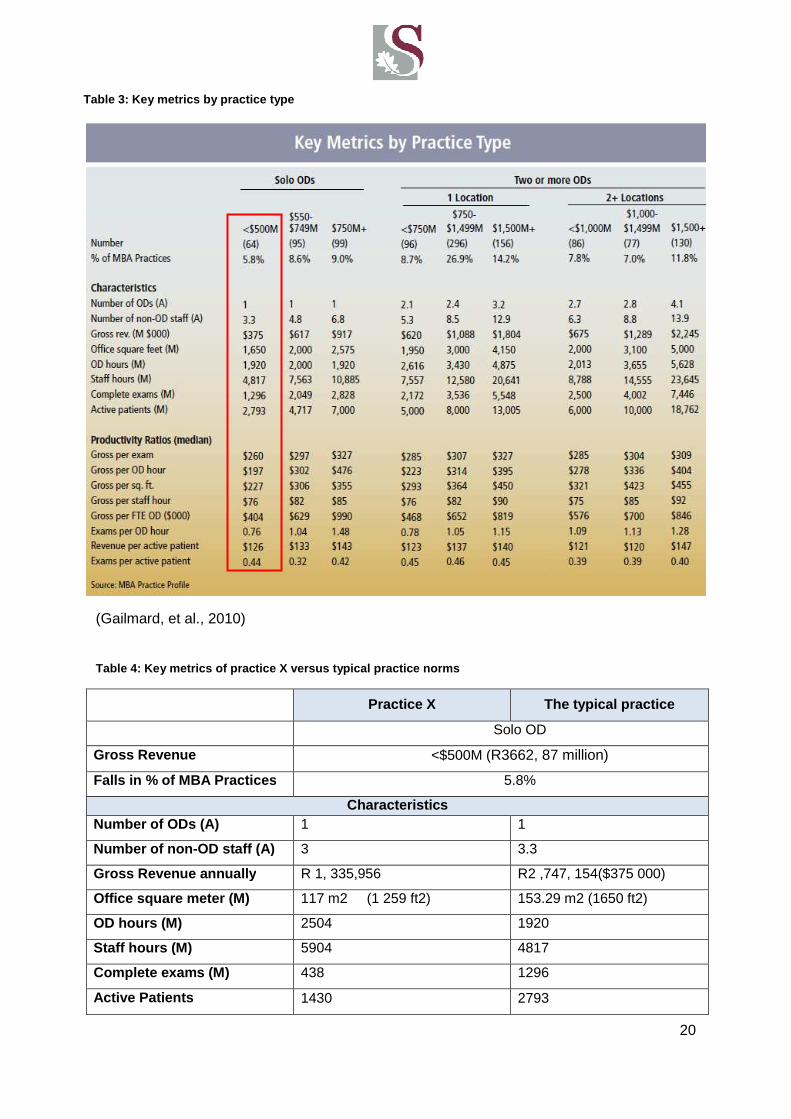
Table 4: Key metrics of practice X versus typical pr actice norms
Practice X The typical practice
Solo OD
Gross Revenue <$500M (R3662, 87 million)
Falls in % of MBA Practices 5.8%
Characteristics Number of ODs (A) 1 1
Number of non -OD staff (A) 3 3.3
Gross Revenue annually R 1, 335,956 R2 ,747, 154($375 000)
Office square meter (M) 117 m2 (1 259 ft2) 153.29 m2 (1650 ft2)
OD hours (M) 2504 1920
Staff hours (M) 5904 4817
Complete exams (M) 438 1296
Active Patients 1430 2793
Table 3: Key metrics by practice type
21
5.3.1 Active patients and complete eye exams
From Table 4 active patients and complete eye exams were identified areas with
improvement potential. The complete eye exams for practice X is 34% of that of the
norm. Practice X’s active patients are 51% of that of the norm. Possible reason could
be (Gailmard, et al., 2010):
• Eye exam fees are too low
• Retail pricing that is too low
• Low amount of multiple pairs sold
• Client base too small
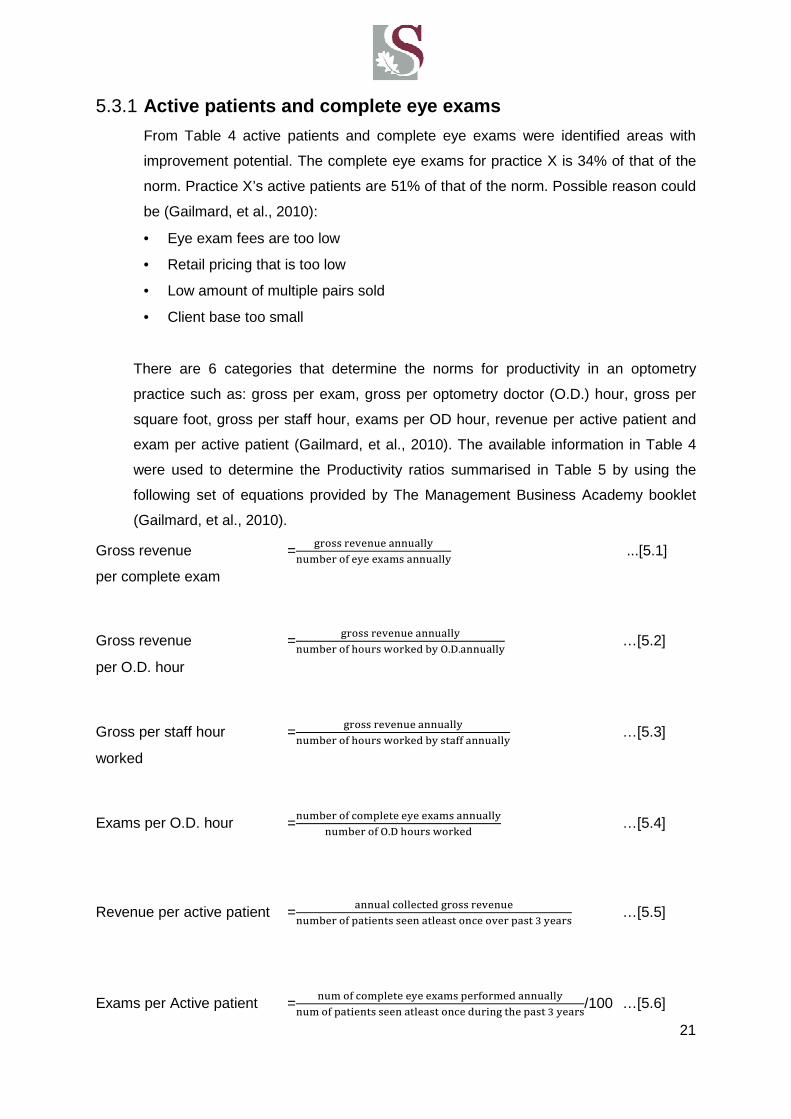
There are 6 categories that determine the norms for productivity in an optometry
practice such as: gross per exam, gross per optometry doctor (O.D.) hour, gross per
square foot, gross per staff hour, exams per OD hour, revenue per active patient and
exam per active patient (Gailmard, et al., 2010). The available information in Table 4
were used to determine the Productivity ratios summarised in Table 5 by using the
following set of equations provided by The Management Business Academy booklet
(Gailmard, et al., 2010).
Gross revenue =����� ����� ����
���� �� � � ����� ���� ...[5.1]
per complete exam
Gross revenue =����� ����� ����
���� �� ���� ������ � �.�.���� …[5.2]
per O.D. hour
Gross per staff hour =����� ����� ����
���� �� ���� ������ � ����� ���� …[5.3]
worked
Exams per O.D. hour =���� �� �������� � � ����� ����
���� �� �.� ���� ������ …[5.4]
Revenue per active patient =��� ��������� ����� �����
���� �� ������� ��� ������� ��� ���� ���� � ���� …[5.5]
Exams per Active patient =� �� �������� � � ����� ��������� ����
� �� ������� ��� ������� ��� ���� ��� ���� � ����/100 …[5.6]
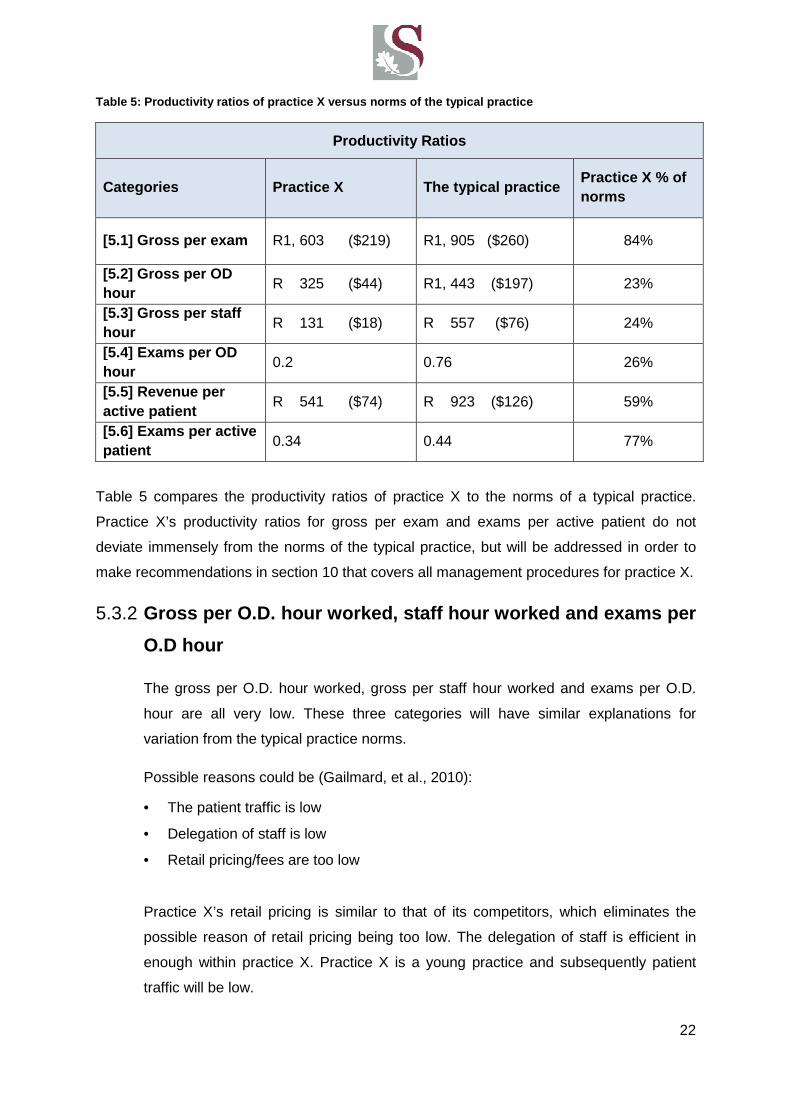
22
Table 5: Productivity ratios of practice X versus nor ms of the typical practice
Productivity Ratios
Categories Practice X The typical practice Practice X % of norms
[5.1] Gross per exam R1, 603 ($219) R1, 905 ($260) 84%
[5.2] Gross per OD hour
R 325 ($44) R1, 443 ($197) 23%
[5.3] Gross per staff hour
R 131 ($18) R 557 ($76) 24%
[5.4] Exams per OD hour
0.2 0.76 26%
[5.5] Revenue per active patient
R 541 ($74) R 923 ($126) 59%
[5.6] Exams per active patient 0.34 0.44 77%
Table 5 compares the productivity ratios of practice X to the norms of a typical practice.
Practice X’s productivity ratios for gross per exam and exams per active patient do not
deviate immensely from the norms of the typical practice, but will be addressed in order to
make recommendations in section 10 that covers all management procedures for practice X.
5.3.2 Gross per O.D. hour worked, staff hour worked and e xams per
O.D hour
The gross per O.D. hour worked, gross per staff hour worked and exams per O.D.
hour are all very low. These three categories will have similar explanations for
variation from the typical practice norms.
Possible reasons could be (Gailmard, et al., 2010):
• The patient traffic is low
• Delegation of staff is low
• Retail pricing/fees are too low
Practice X’s retail pricing is similar to that of its competitors, which eliminates the
possible reason of retail pricing being too low. The delegation of staff is efficient in
enough within practice X. Practice X is a young practice and subsequently patient
traffic will be low.
23
5.3.3 Revenue per active patient
The revenue per active patient for practice X is 59% of that of the norms. Possible
reasons could be (Gailmard, et al., 2010):
• The return rate of patients is too low
• There is long interval between exams
• Eye exams fees are too low
• Retail pricing is too low
Practice X’s retail pricing and eye exam fees are similar to that of its competitors.
There are very long intervals between exams, since practice X does not have back to
back appointments daily. Practice X’s small client base is the primary reason for this.
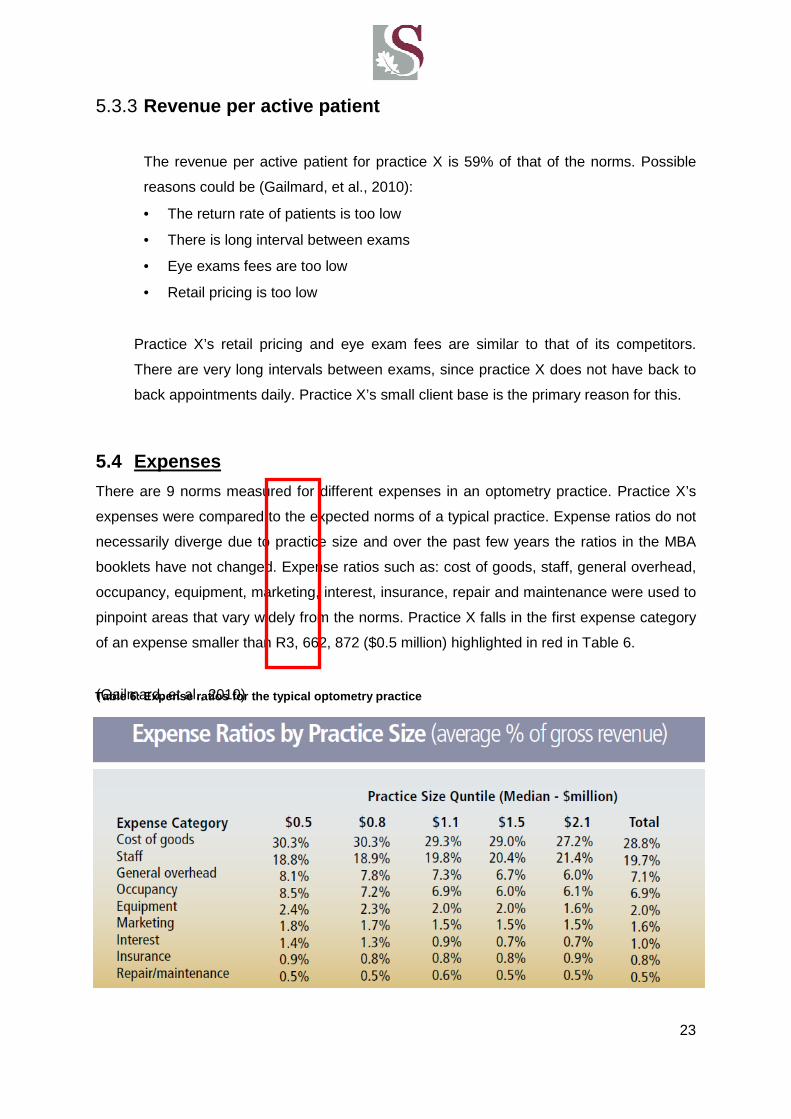
5.4 Expenses
There are 9 norms measured for different expenses in an optometry practice. Practice X’s
expenses were compared to the expected norms of a typical practice. Expense ratios do not
necessarily diverge due to practice size and over the past few years the ratios in the MBA
booklets have not changed. Expense ratios such as: cost of goods, staff, general overhead,
occupancy, equipment, marketing, interest, insurance, repair and maintenance were used to
pinpoint areas that vary widely from the norms. Practice X falls in the first expense category
of an expense smaller than R3, 662, 872 ($0.5 million) highlighted in red in Table 6.
(Gailmard, et al., 2010) Table 6: Expense ratios for the typical optometry pr actice
24
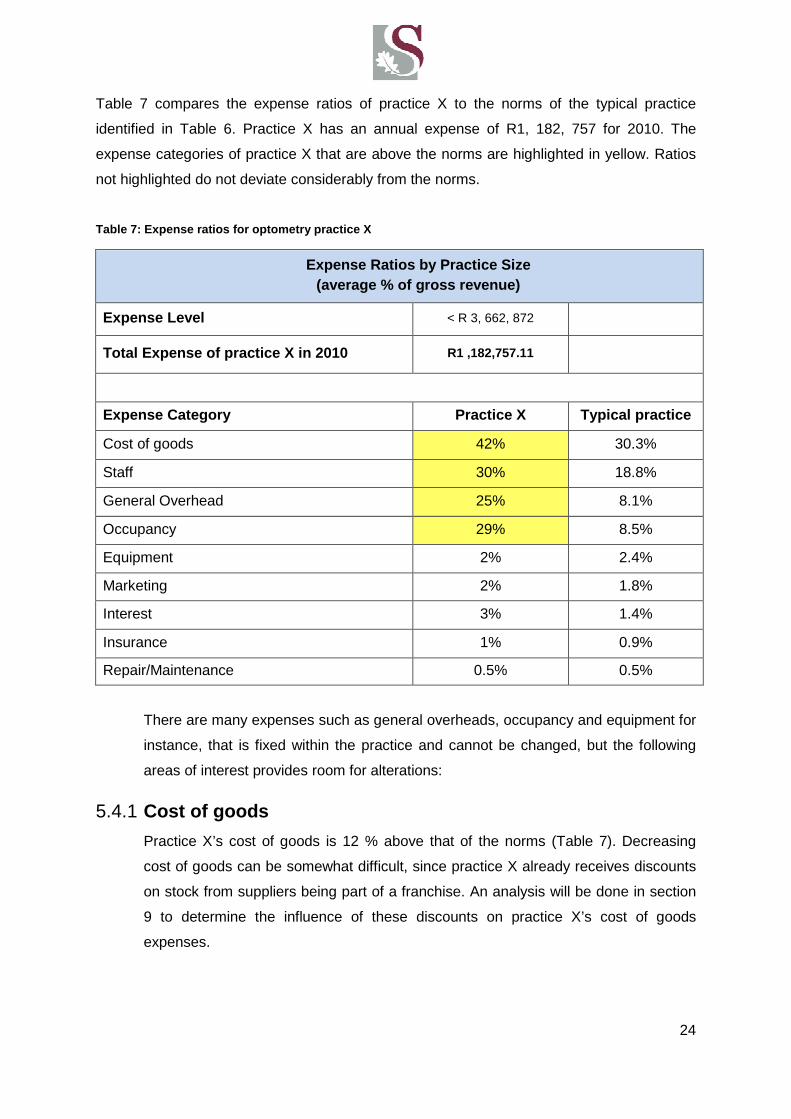
Table 7 compares the expense ratios of practice X to the norms of the typical practice
identified in Table 6. Practice X has an annual expense of R1, 182, 757 for 2010. The
expense categories of practice X that are above the norms are highlighted in yellow. Ratios
not highlighted do not deviate considerably from the norms.
Table 7: Expense ratios for optometry practice X
Expense Ratios by Practice Size (average % of gross revenue)
Expense Level < R 3, 662, 872
Total Expense of practice X in 2010 R1 ,182,757.11
Expense Category Practice X Typical practice
Cost of goods 42% 30.3%
Staff 30% 18.8%
General Overhead 25% 8.1%
Occupancy 29% 8.5%
Equipment 2% 2.4%
Marketing 2% 1.8%
Interest 3% 1.4%
Insurance 1% 0.9%
Repair/Maintenance 0.5% 0.5%
There are many expenses such as general overheads, occupancy and equipment for
instance, that is fixed within the practice and cannot be changed, but the following
areas of interest provides room for alterations:
5.4.1 Cost of goods
Practice X’s cost of goods is 12 % above that of the norms (Table 7). Decreasing
cost of goods can be somewhat difficult, since practice X already receives discounts
on stock from suppliers being part of a franchise. An analysis will be done in section
9 to determine the influence of these discounts on practice X’s cost of goods
expenses.
25
5.4.2 Staff expenses
According to Gerber (2005) the average 20% benchmark should frequently be higher
for staff expenses. He states that practices with higher labour costs tend to perform
better. The employees are in constant contact with clients, thus influences client’s
decision to return. Practice X has four permanent employees including the
optometrist. The industry norms in the same annual revenue category have 3.3 staff
members (Table 4).
5.5 Product related norms
These benchmarks is in terms of the usage of the product, margins of profit and the capture
rates for sales for eyeglasses, spectacle lenses and contact lenses (Gailmard, et al., 2010).
Calculations as provided by The Management and Business Academy booklet follow
(Gailmard, et al., 2010). The results are summarised in Table 8.
Eyewear Prescriptions = ����� �� � ����� ���� �������� � � ���� ������
���� �� � � ����� ��������� ���� ��� ���� ������ …[5.7]
(rxes) per 100 eye exams
Revenue each eyewear = ����� ����� ����� ���� � ����� ��������
���� �� ����� �������� � ���� ���� ������ …[5.8]
sale generate
Gross profit on eyewear = � ����� ����� ����� ���� �� �����
� ����� ����� ����� …[5.9]
sales
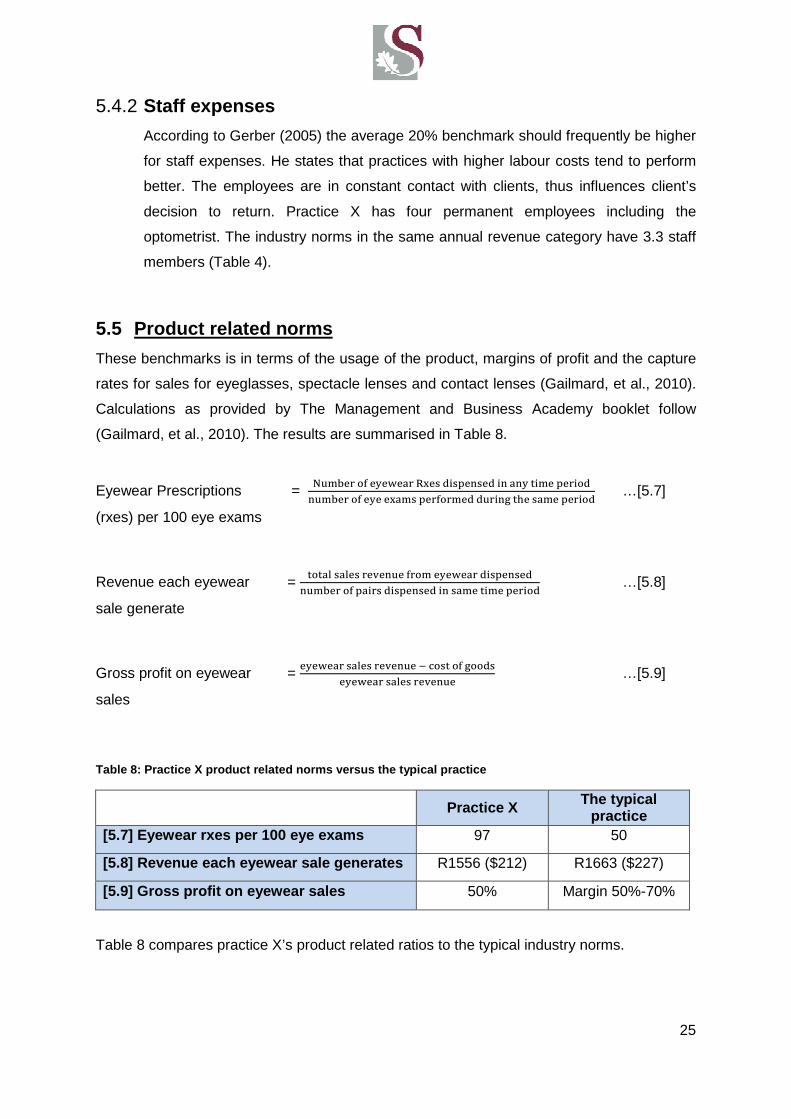
Table 8: Practice X product related norms versus the typical practice
Practice X The typical practice
[5.7] Eyewear rxes per 100 eye exams 97 50
[5.8] Revenue each eyewear sale generates R1556 ($212) R1663 ($227)
[5.9] Gross profit on eyewear sales 50% Margin 50%-70%
Table 8 compares practice X’s product related ratios to the typical industry norms.

26
5.5.1 Eyewear prescriptions (rxes) per 100 eye exams
Practices with a ratio of below 50 pairs per 100 exams have to examine how their
frames are currently displayed as well as presentation process of their eyewear.
Practice X has a ratio well above the typical practice ratio therefore its eyewear
displays and the presentation process is deemed sufficient.
5.5.2 Revenue each eyewear sale generates
Although practice X’s ratio is very close to the norms, increasing the average
eyewear sales is an efficient way to increase the practice’s revenue. Since practice X
needs to increase their revenue this is good area for improvement.
5.5.3 Gross profit margin
A practice achieves a higher gross profit by increasing the volume of sales in frames
and lenses instead of increasing their mark-up. Practice X cannot increase their
mark-ups, since it needs to stay in the same price range as other competitors in
order to maintain clients. As mentioned in section 5.5.2, increasing sales should be
the main focus to improve the gross profit margin.
27
6 Breakeven Analysis
6.1 Introduction
The current status of the practice’s financial cash flows can be seen in Appendix A. This
figure displays the sales, cost of sales, expenses and interest paid in 2010 and the
beginning of 2011. The peak and off-peak seasons are identified in the figure. Peak season
is January, February, March, April, October, November and December. The optometry
practice’s sales do not cover cost of sales, expenses and interest paid and therefore it
currently has an annual net loss of –R 445, 596.58. The practice is not breaking even,
therefore, the turnover should be increased to cover expenses and stay in control of
liabilities.
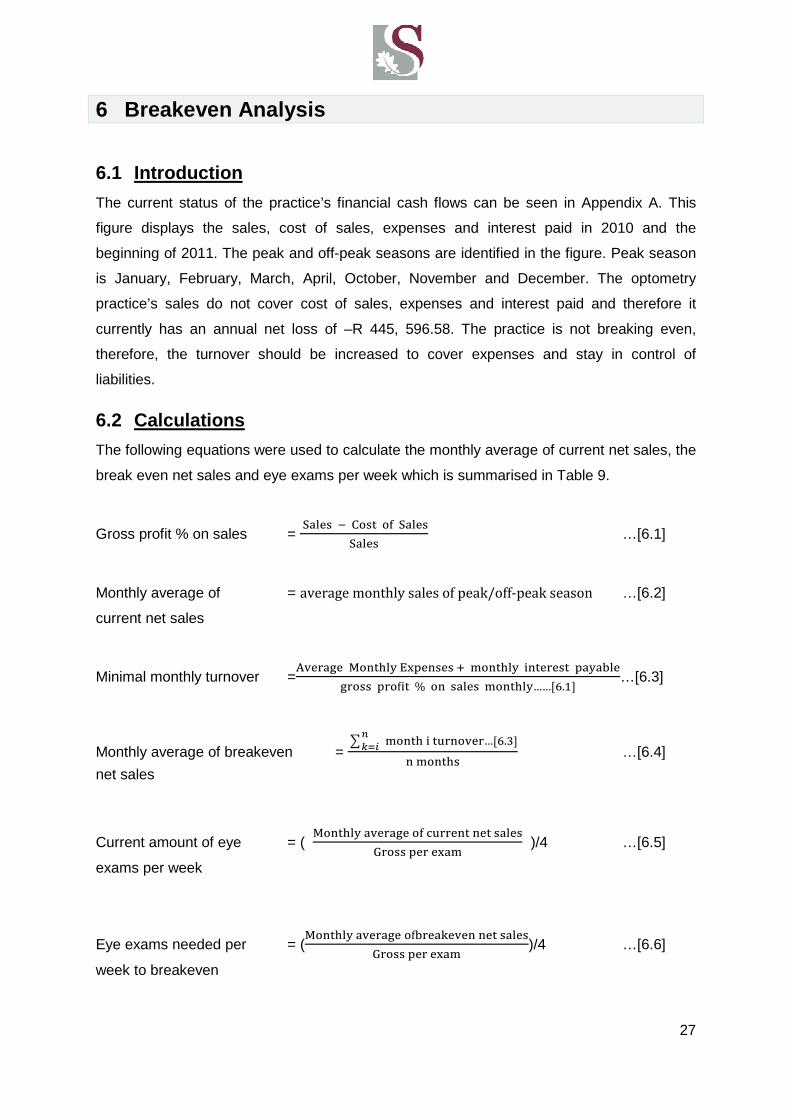
6.2 Calculations
The following equations were used to calculate the monthly average of current net sales, the
break even net sales and eye exams per week which is summarised in Table 9.
Gross profit % on sales = !���� "��� �� !����
!���� …[6.1]
Monthly average of = average monthly sales of peak/off‐peak season …[6.2]
current net sales
Minimal monthly turnover =4������ 5���� 6������ 7 ����� ������� �� ����
����� ���8�� % � ����� ����� ……;<.=>…[6.3]
Monthly average of breakeven = ? ���� � ������…;<.�>
@ABC
����� …[6.4]
net sales
Current amount of eye = ( 5���� ������� �� ����� �� �����
D���� ��� ���� )/4 …[6.5]
exams per week
Eye exams needed per = (5���� ������� �8�������� �� �����
D���� ��� ����)/4 …[6.6]
week to breakeven
28
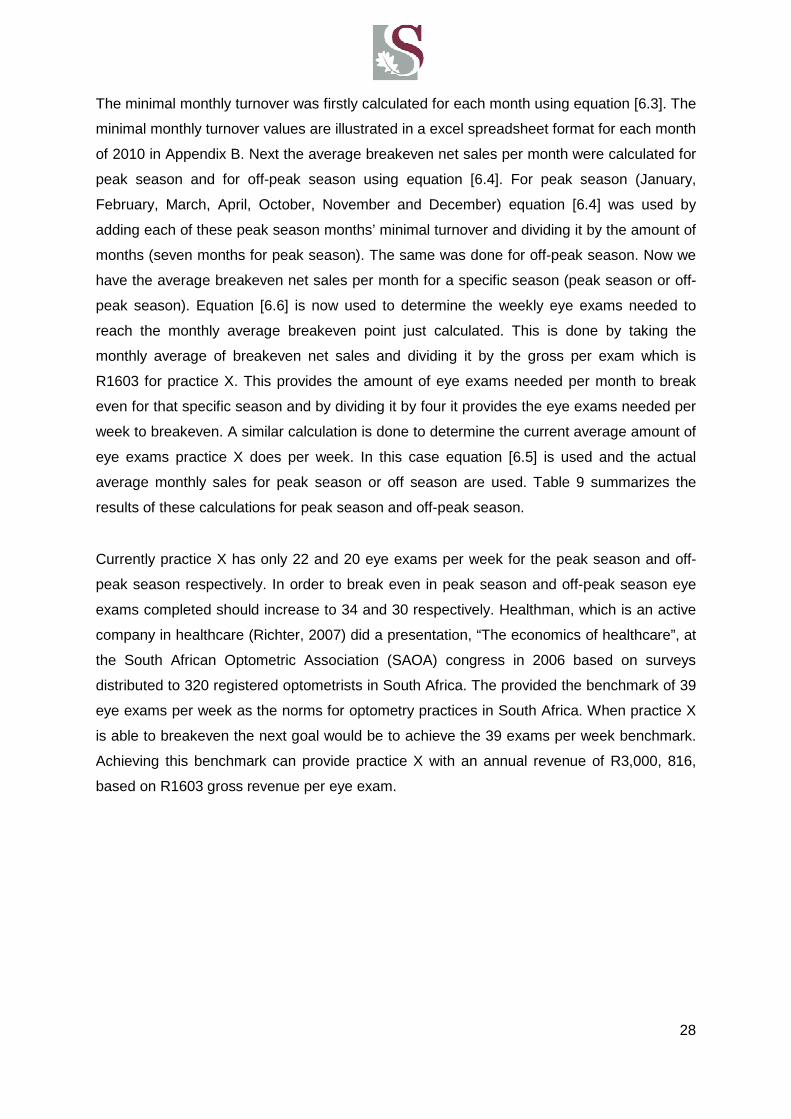
The minimal monthly turnover was firstly calculated for each month using equation [6.3]. The
minimal monthly turnover values are illustrated in a excel spreadsheet format for each month
of 2010 in Appendix B. Next the average breakeven net sales per month were calculated for
peak season and for off-peak season using equation [6.4]. For peak season (January,
February, March, April, October, November and December) equation [6.4] was used by
adding each of these peak season months’ minimal turnover and dividing it by the amount of
months (seven months for peak season). The same was done for off-peak season. Now we
have the average breakeven net sales per month for a specific season (peak season or off-
peak season). Equation [6.6] is now used to determine the weekly eye exams needed to
reach the monthly average breakeven point just calculated. This is done by taking the
monthly average of breakeven net sales and dividing it by the gross per exam which is
R1603 for practice X. This provides the amount of eye exams needed per month to break
even for that specific season and by dividing it by four it provides the eye exams needed per
week to breakeven. A similar calculation is done to determine the current average amount of
eye exams practice X does per week. In this case equation [6.5] is used and the actual
average monthly sales for peak season or off season are used. Table 9 summarizes the
results of these calculations for peak season and off-peak season.
Currently practice X has only 22 and 20 eye exams per week for the peak season and off-
peak season respectively. In order to break even in peak season and off-peak season eye
exams completed should increase to 34 and 30 respectively. Healthman, which is an active
company in healthcare (Richter, 2007) did a presentation, “The economics of healthcare”, at
the South African Optometric Association (SAOA) congress in 2006 based on surveys
distributed to 320 registered optometrists in South Africa. The provided the benchmark of 39
eye exams per week as the norms for optometry practices in South Africa. When practice X
is able to breakeven the next goal would be to achieve the 39 exams per week benchmark.
Achieving this benchmark can provide practice X with an annual revenue of R3,000, 816,
based on R1603 gross revenue per eye exam.
29
Table 9: Net sales and eye exams per week
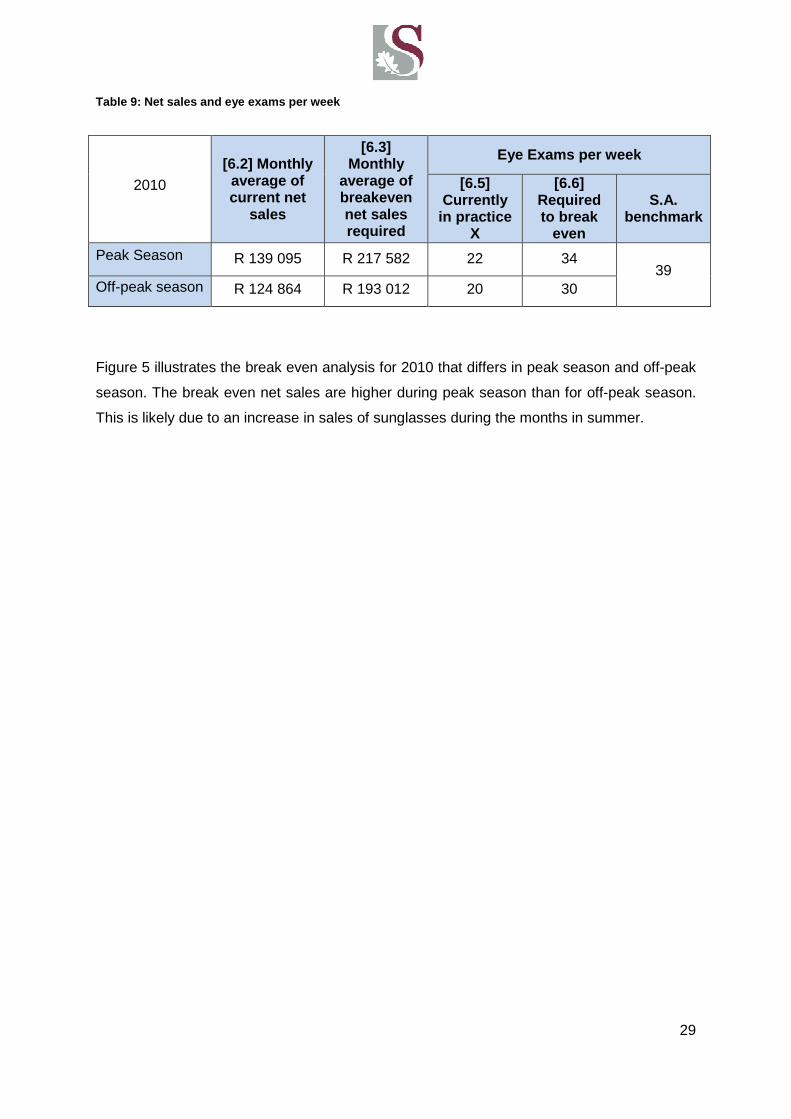
Figure 5 illustrates the break even analysis for 2010 that differs in peak season and off-peak
season. The break even net sales are higher during peak season than for off-peak season.
This is likely due to an increase in sales of sunglasses during the months in summer.
2010
[6.2] Monthly average of current net
sales
[6.3] Monthly
average of breakeven net sales required
Eye Exams per week
[6.5] Currently
in practice X
[6.6] Required to break
even
S.A. benchmark
Peak Season R 139 095 R 217 582 22 34 39
Off-peak season R 124 864 R 193 012 20 30
30
5: Turnover analysis for 2010 with breakeven sales illustrated seasonally
Fig
ure
5: T
urno
ver
anal
ysis
for
2010
with
bre
akev
en s
ales
illu
stra
ted
seas
onal
ly
31
7 Sensitivity analysis
7.1 Introduction
As stated in section 5 there is evidence that the U.S. benchmarks can be used as a relatively
good approximation of how an optometry practice’s performance ought to be in South Africa.
The following sensitivity analysis was done in order to determine the implication of an
inaccurate benchmark on the goals set for practice X. The analysis is based on the gross
revenue per exam as well as the amount of eye exams needed to achieve the practice’s
breakeven sales.
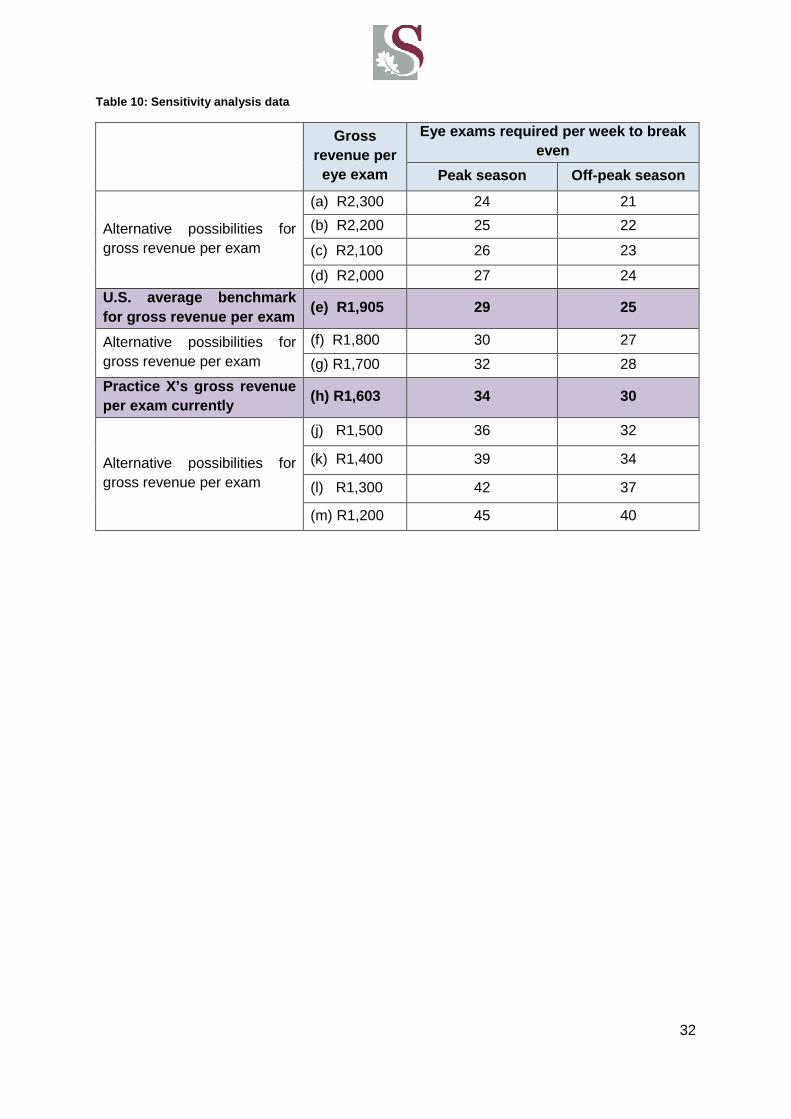
7.2 Calculations
Equation [6.6] was used to determine the data in Table 10 which consist of alternative gross
revenues per exam in order to determine the error margin for the U.S. benchmark. The data
in Table 10 is based on 2010 breakeven sales. The same sensitivity analysis can be done
for 2011 by using the 2011 break even sales and new gross revenue per exam in equation
[6.6] when 2011 data becomes available. Each alternative gross revenue option is displayed
with its relating number of eye exams required per week to break even, in terms of peak
season and off-peak season. The position of the U.S. benchmarks and the current gross
revenue of practice X are highlighted.
The number of eye exams needed to break even for the U.S. benchmark (e) compared to
practice X’s current requirement (h) is 5 exams less per week for peak season and off-peak
season. In order to conform to industry norms practice X should strive to achieve a gross
revenue per exam of R1, 905. Achieving this gross revenue per exam will enable them to
break even with 5 less eye exams per week than eye exams needed currently with practice
X’s gross revenue per exam (R1603). If the U.S. benchmark is inaccurate and the average
gross revenue per exam should hypothetically be an alternative value identified as R1, 800
(f), eye exams per week needed, will be one more than the U.S benchmark identifies (e).
Note that for the different gross per exams values in peak season the difference between
(a), (b), (c) and (d) is only one exam. The difference between (d), (e) is two exams and
between (h), (j), (k), (l) and (m) is three exams. This can suggest that if the U.S. benchmark
is too low, with regards to the S.A. optometry industry, and should be higher, the impact on
the amount of exams needed to break even will not be too disruptive. If the benchmark is too
high, and should be lower for the S.A. industry, the impact could possibly be larger since
more exams is needed which means more clients is needed.
32
Table 10: Sensitivity analysis data
Gross revenue per
eye exam
Eye exams required per week to break even
Peak season Off-peak season
Alternative possibilities for gross revenue per exam
(a) R2,300 24 21
(b) R2,200 25 22
(c) R2,100 26 23
(d) R2,000 27 24
U.S. average benchmark for gross revenue per exam
(e) R1,905 29 25
Alternative possibilities for gross revenue per exam
(f) R1,800 30 27
(g) R1,700 32 28
Practice X’s gross revenue per exam currently
(h) R1,603 34 30
Alternative possibilities for gross revenue per exam
(j) R1,500 36 32
(k) R1,400 39 34
(l) R1,300 42 37
(m) R1,200 45 40
33
8 Improving procedures of an optometry practice
8.1 Introduction
In order for practice X to breakeven as soon as possible and achieve a net income of
average 33% (Gailmard, 2007) of the revenue in near future, the following areas can be
considered for improvement.
8.2 Increasing revenue
Increasing revenue is the ultimate way to increase a practice’s net income. In order to do this
the practice’s client base needs to expand. The following areas can be considered for
improvement with a possible result of a continuous growing client base in the future.
8.2.1 Frame displays and frame mixes
According to Gailmard (2004) it is important to have a large range of eyewear options
on display. If there is nothing the client is interested in, then the client will possibly go
elsewhere. Currently, practice X displays about 784 frames (minimum) and a
maximum of 979 frames. It is important for practice X to always display the maximum
amount of frames possible. It could also be beneficial to expand their display with a
few hundred extra frames. “A large frame inventory is a business investment that will
provide you with an excellent return. Base your inventory on the amount of frames you
hope to sell in a year, not your number of "inventory turns" (the number of frames sold
in a year divided by the number kept in inventory). At least 1,000 frames, although
2,000 is far better” (Gailmard, 2004). Practice X can attempt to expand their displays to
about 1200 frames in the first year depending on the space available in the practice.
Increasing sales should be one of the major goals, thus increasing the frame displays
is a good place to start.
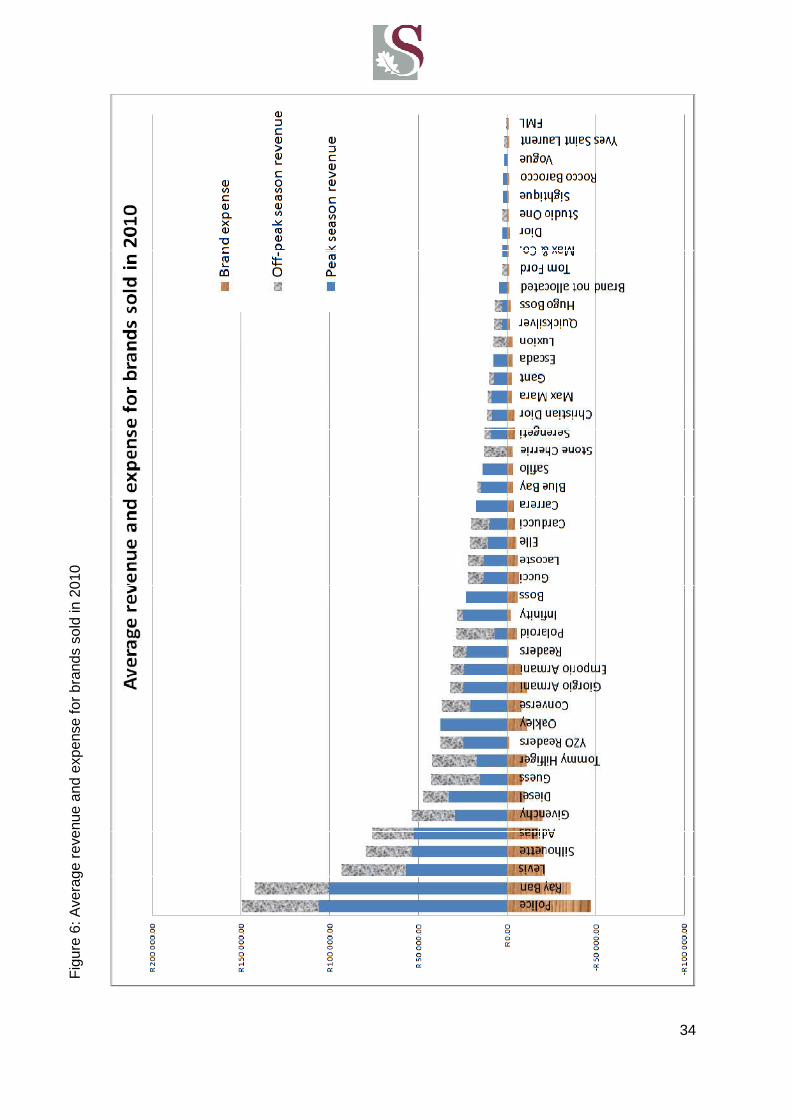
As mentioned in section 5.5.1, practice X has satisfactory frame mix displays, but in
any instance there is an optimal setting. Figure 6 ranks the brand names sold during
the year of 2010 in terms of highest revenue generated to lowest revenue generated.
The figure illustrates the separate revenues generated in peak season and in off-peak
season for each brand, as well as the average expenses tied to each brand. In peak
season the revenue is higher than in off-peak season, possibly because more
sunglasses are sold in the summer months.
34
Fig
ure
6: A
vera
ge r
even
ue a
nd e
xpen
se fo
r br
ands
sol
d in
201
0
Figure 6: Average revenue and expense for brands sold in 2 010
35
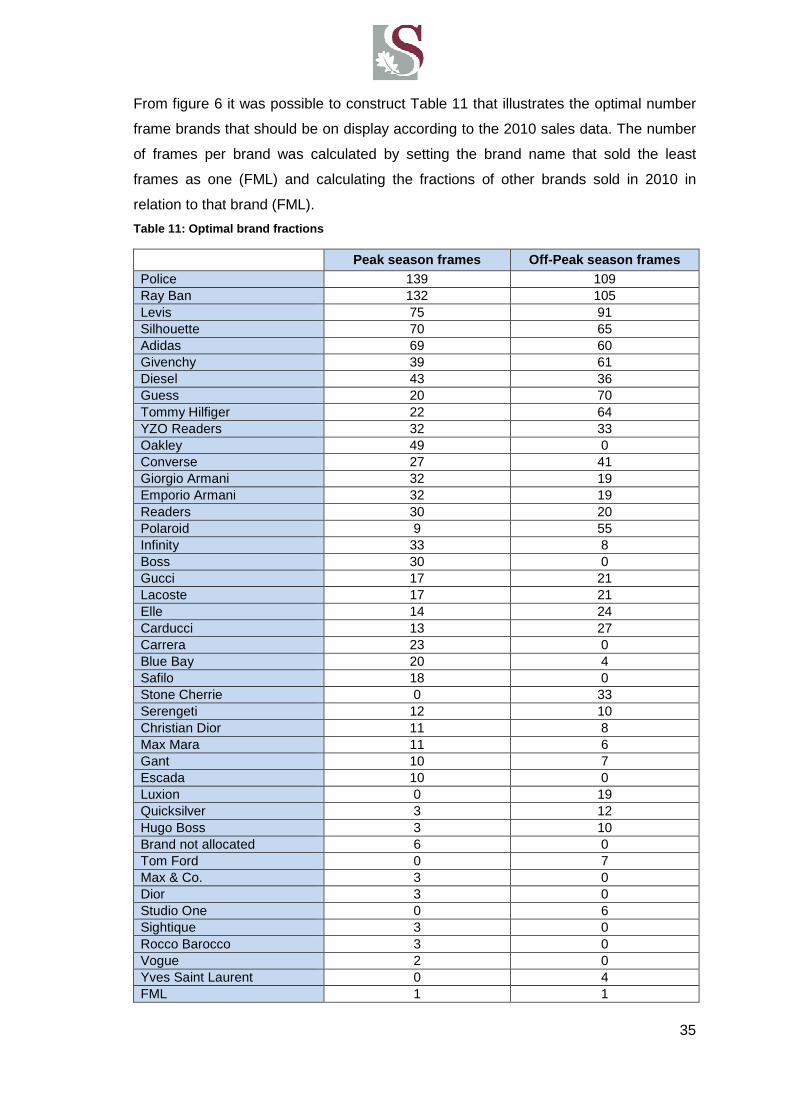
From figure 6 it was possible to construct Table 11 that illustrates the optimal number
frame brands that should be on display according to the 2010 sales data. The number
of frames per brand was calculated by setting the brand name that sold the least
frames as one (FML) and calculating the fractions of other brands sold in 2010 in
relation to that brand (FML).
Table 11: Optimal brand fractions
Peak season frames Off-Peak season frames Police 139 109 Ray Ban 132 105 Levis 75 91 Silhouette 70 65 Adidas 69 60 Givenchy 39 61 Diesel 43 36 Guess 20 70 Tommy Hilfiger 22 64 YZO Readers 32 33 Oakley 49 0 Converse 27 41 Giorgio Armani 32 19 Emporio Armani 32 19 Readers 30 20 Polaroid 9 55 Infinity 33 8 Boss 30 0 Gucci 17 21 Lacoste 17 21 Elle 14 24 Carducci 13 27 Carrera 23 0 Blue Bay 20 4 Safilo 18 0 Stone Cherrie 0 33 Serengeti 12 10 Christian Dior 11 8 Max Mara 11 6 Gant 10 7 Escada 10 0 Luxion 0 19 Quicksilver 3 12 Hugo Boss 3 10 Brand not allocated 6 0 Tom Ford 0 7 Max & Co. 3 0 Dior 3 0 Studio One 0 6 Sightique 3 0 Rocco Barocco 3 0 Vogue 2 0 Yves Saint Laurent 0 4 FML 1 1
36
8.2.2 Marketing
According to Hayes Consulting a practice management consulting firm in Ponte Vedra
Beach, Fla (cited by Shaw-McMinn, 2005) most optometry practices spend only
0.5 % – 1.5% on marketing, contrary to the 4%-7% of most other industries. Gerber
(2005) says that 5%- 20% of an optometry practice’s total gross revenue is generated
from 2% income invested in marketing.
Practice X spends about 2% on marketing. The marketing is done broadly as an
optometry service brand by their franchise therefore the particular practice itself does
not get primary exposure. Consequently, they need to spend more on individual
marketing in order to reach the criteria of generating at least between 5%-20% of their
gross revenue due to marketing. If practice X engages in private marketing as well it
can possibly attract more clients which are what they primarily need at the moment.
8.2.2.1 Marketing plan development
It is essential to make use of marketing procedures that can be tracked. This will
enable practice X to have control over their marketing procedures and expenses and
eliminate those that provide an unsatisfactory return on the money invested.
Internal marketing
Referral marketing is based on clients referring others to a practice they visited. This is
probably one of the most effective and least-cost approaches that practice X can
follow. This can be done through literally asking a happy patient during routine eye
exams to refer the practice to others or placing a sign in the exam room saying,
“Rather than spending money on expensive advertising, we would rather spend it on
ways to provide you better eye care. To help us do that, if you are pleased with our
services, simply tell others about us."(Girard, 2011) Quality service and client-
centerism will also boost referrals.
External marketing
An apparent type of marketing most people would resort to is printed, radio and
television advertisements, but modern technology provides other effective ways of
marketing an optometry practice. Practice X can make use of the internet in order to
maintain their existing client base and also attract more clients in one of the following
ways:
37
• Optometry practice website
Practice X does not have a personal website. The website should consist of all details
concerning the practice and could also provide a service for clients to be able to order
replacements for example for their contact lenses. It can also provide a way for clients
to register themselves and their medical aid on the website before going to an eye
exam, which eliminates some of the paperwork that needs to be done by staff. The
website can assist in clients scheduling appointments; inform clients of business hours
and also promotions available seasonally.
Practice X can have a monthly newsletter sent out to the client base which should
consist of news of the practice, new specials and or discounts, as well as information
about new services the practice is providing. By keeping in touch, the practice
continuously remind clients of their existence and when the time comes for a possible
follow up examination or new eyewear, the client will remember practice X. According
to Lewis (2009) research have shown that 70 % of clients read newsletters sent by
email, because it seems like important information. Emails could also include special
offers to clients that refer others to practice X.
• Business cards
Business cards should be used at anytime that it’s appropriate. Attach it to any invoice
or information pamphlets sent to clients.
• Get involved in the community
Involvement in the community can be very beneficial to practice X. Spending time on
committees, religious groups and doing free vision screenings at schools and
universities can potentially attract new clients.
• Attracting new clients based on location
Many people choose services based on the close proximity to their home. Something
for practice X to try is to choose, for instance, 1000 houses that are close to the
practice and send them a letter that introduces the practice and its services and
explains the convenience of the location of the practice. Shaw-McMinn (2005) states
that direct mail is more effective than advertising, since the client first needs to open
the mail in order to determine if it should be thrown away. The U.S. Postal Service
38
Direct Mail Kit (cited by Shaw-McMinn, 2005) also claims that a practice can expect
gross return of 10 times more on its investment from 4 direct mails per year. Practice X
is not the only optometry practice in the area, therefore it is essential to state clearly on
all direct mails practice X’s name and specific directions to the practice.
• Text messages
Sending text messages to clients as reminders of appointments or as notification of
specials can be very beneficial and almost cost free when sent in bulk. This type of
technology is used by many small businesses that provide a service.
To determine what type of marketing is most rewarding to practice X, include a
question on a new client’s information form asking how they found out about practice
X. Add the amount the client has spent at practice X and after a year the optometrist
can determine what marketing strategies is the most beneficial to the practice and
should be continued or improved. This will indicate if the practice’s expense on certain
marketing criteria is sensible. Practice X should expect to receive 10 times more in
gross revenue than contributed to marketing according to Shaw-McMinn (2005).
8.2.3 The recall system
8.2.3.1 Recall starts with the first appointment
It’s essential for the optometrist and staff to continuously mention the next visit to a
client, in order to convince a client of the importance of another visit, whether it is next
week or next year.
8.2.3.2 Follow up appointments
Clients should not leave without scheduling their following appointment. If it is
scheduled months away, a staff member should explain that a reminder call or
message will be sent to them a week before their scheduled appointment, thus not
alarming the client of the fact that it’s still considerable time before the next
appointment. If it’s a week before the client’s scheduled appointment and the time or
date is inconvenient it can easily be rescheduled and the appointment does not fall
through (Bennett, 2003).Also make use of text messages, letters and phone calls as
reminders of routine checkups.
39
8.2.3.3 Missed appointments
If a client misses an appointment without prior notice it is essential to have a staff
member call the client to reschedule. The extra effort will increase the amount of
clients the optometrist sees and, therefore, lead to an increase in profits according to
Girard (2011). It should be considered whether to charge for missed appointments to
minimise the costs that correspond with potential revenue the appointment could have
generated.
8.2.3.4 Keeping recall records
Recall records should be kept in order to access and keep track of potential recall
clients. It should preferably be computerised to simplify the type of communication sent
to various types of recall clients.
8.2.4 Grow contact lenses base
Currently only 8% of practice X’s revenue is generated from contact lenses sales.
According to Jobson optical research (cited by Kirby, 2004) 22% of adults of the age
18 years and up makes use of contact lenses either full time, part time or occasionally.
John Hanson (Eyesite Magazine, 2011), mentions that the future for contact lenses in
South Africa looks very bright.
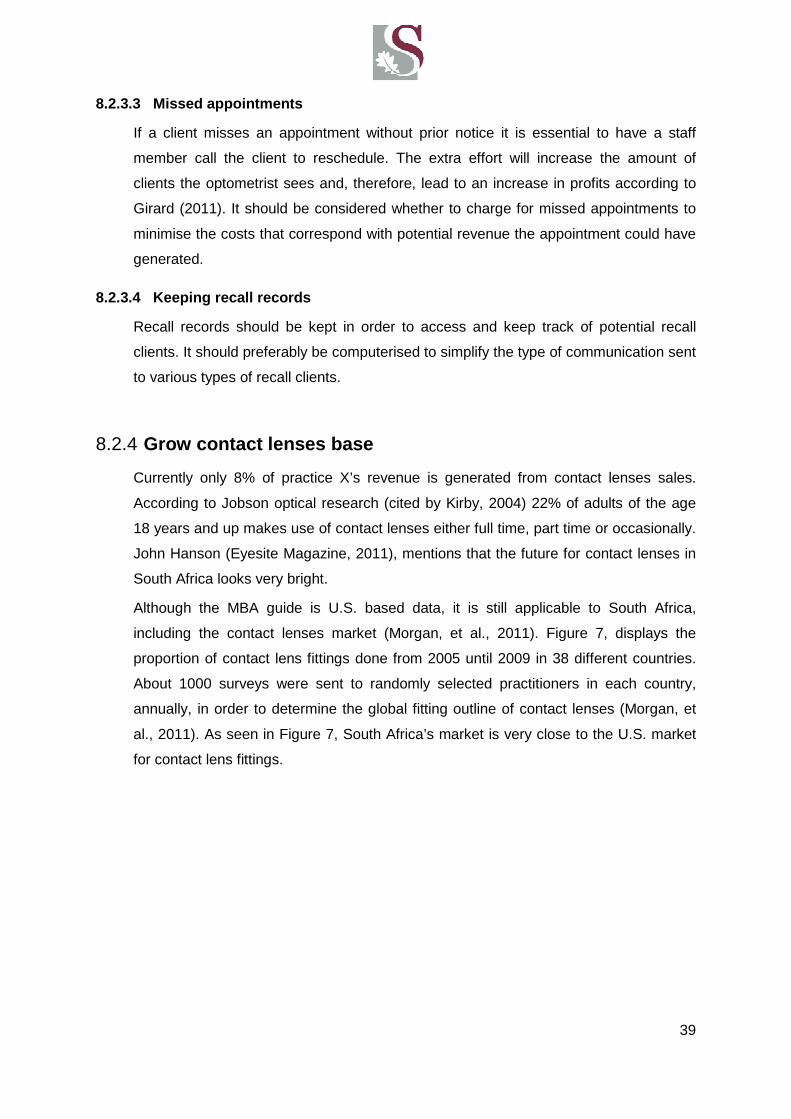
Although the MBA guide is U.S. based data, it is still applicable to South Africa,
including the contact lenses market (Morgan, et al., 2011). Figure 7, displays the
proportion of contact lens fittings done from 2005 until 2009 in 38 different countries.
About 1000 surveys were sent to randomly selected practitioners in each country,
annually, in order to determine the global fitting outline of contact lenses (Morgan, et
al., 2011). As seen in Figure 7, South Africa’s market is very close to the U.S. market
for contact lens fittings.
(Morgan, et al., 2011)
Consequently, there is a big market for contact lenses
be exploited by practice X as much as possible in order to increase their revenue
generated from contact lenses to 22%
8.2.4.1 Fees should be reasonable
Charge the applicable fees for the first pair of lenses and charge less for replacement
lenses. This is the best way to maintain initial clients and compete with competitors
according to Brooks (2000).
8.2.4.2 Don’t make assumptions
Never assume what a client is willing or n
priorities and, thus, it cannot be assumed that
money on a specific object or service will be the same. It is important to provide all
options to a client, even if they seem u
let them bring up the question of cost themselves.
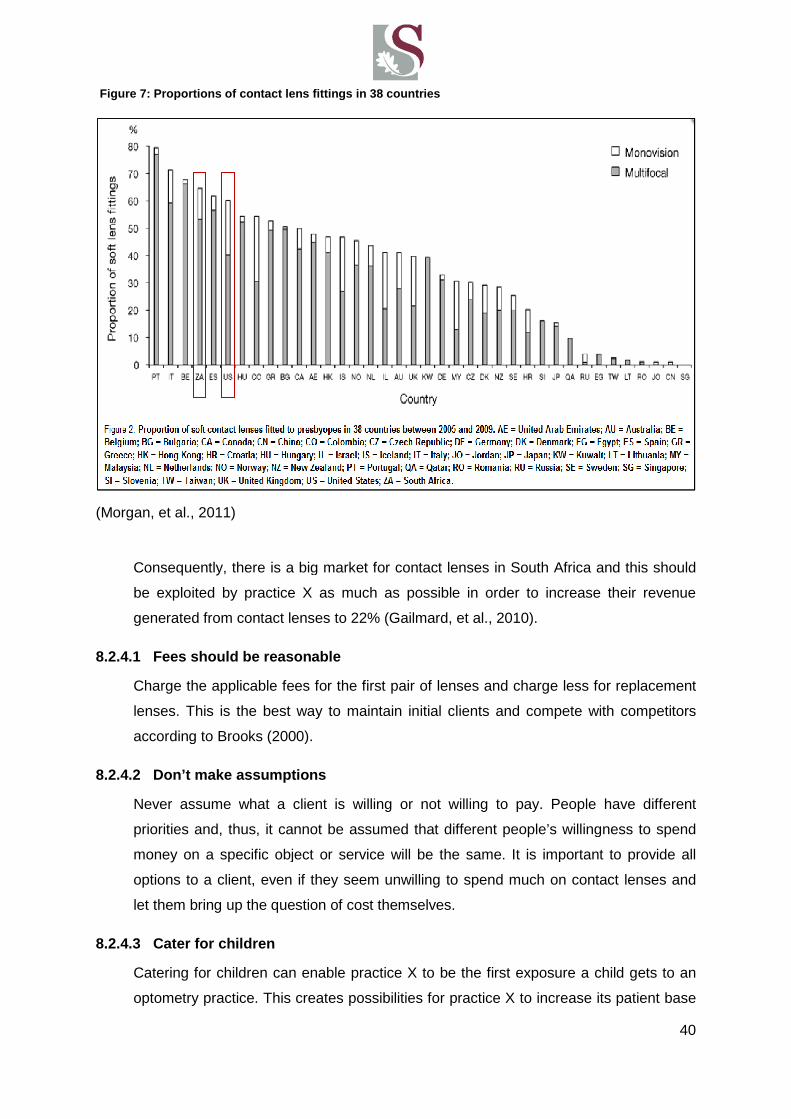
8.2.4.3 Cater for children
Catering for children can enable practice X to be the first exposure a child gets to an
optometry practice. This creates possibilities for practice X to increase its patient base
Figure 7 : Proportions of contact lens fittings in 38 countri es
there is a big market for contact lenses in South Africa
practice X as much as possible in order to increase their revenue
generated from contact lenses to 22% (Gailmard, et al., 2010).
Fees should be reasonable
applicable fees for the first pair of lenses and charge less for replacement
lenses. This is the best way to maintain initial clients and compete with competitors
according to Brooks (2000).
Don’t make assumptions
Never assume what a client is willing or not willing to pay. People have different
it cannot be assumed that different people’s willingness
on a specific object or service will be the same. It is important to provide all
even if they seem unwilling to spend much on contact lenses and
he question of cost themselves.
Catering for children can enable practice X to be the first exposure a child gets to an
optometry practice. This creates possibilities for practice X to increase its patient base
: Proportions of contact lens fittings in 38 countri es
40
in South Africa and this should
practice X as much as possible in order to increase their revenue
applicable fees for the first pair of lenses and charge less for replacement
lenses. This is the best way to maintain initial clients and compete with competitors
ot willing to pay. People have different
willingness to spend
on a specific object or service will be the same. It is important to provide all
nwilling to spend much on contact lenses and
Catering for children can enable practice X to be the first exposure a child gets to an
optometry practice. This creates possibilities for practice X to increase its patient base
41
for the future as well, since the child is likely to return to the practice as an adult if the
service was satisfying. See Figure 8 for the ages when contact lenses are typically
recommended first. Investing in screening at schools (especially at primary schools) as
mentioned in the marketing section, can attract future clients to the practice. The data
was collected by an email survey of including 440 practitioners (Gailmard, 2000)
8.2.4.4 Provide guaranteed services
Clients are often fearful of trying contact lenses due to loss in money if it is
unsuccessful. Practice X should try and maintain a policy of a full return on
professional fees in the case of unsuccessful contact lenses. This may seem very
risky, but according to Brooks (2000) their refunds were shifted from a 50% return to a
100% return and consequently it doubled their contact lens fits with only a few full
refunds.
8.2.4.5 Keep up to date with new products
Ask suppliers about new developments and communicate these options to clients even
if they are spectacle wearers. Sales representatives also on occasion provide free
items that can be mailed to clients. Also include these new developments in the
practice’s newsletter, brochures and reminder cards etc. as discussed. “One recent
mailing brought us dosens of new fits, and even served as a recall letter to other
patients who had not returned”. (Brooks, 2000)
22%
3%
3%
29%
43%
Porportions of age of patients when first recommended
contact lenses
14-15
16-17
17-18
10-11
12-13
Age
Figure 8: Age of patients when first recommended co ntact lenses
42
9 Risk Analysis
9.1 Introduction
Currently practice X is provided with franchise benefits, such as discounts from suppliers on
specific frame brands and also the receipt of frames on consignment. A risk analysis was
done to determine the impact on the practice should these benefits be revoked and to
suggest management procedures to recover from such a setback.
The identified risks are the loss of franchise benefits regarding the receipt consignment
opportunities and discounts on certain frames from suppliers.
9.2 Lack of supplier discounts
The following table summarises certain areas of practice X’s financial reports of 2010 as well
as the discounts received and influence on the net income and cost of sales. Table 12
displays the annual cost of frames, lenses, contact lenses and the discounts received from
suppliers for each of these entities due to franchise benefits. It displays the total cost of
goods for 2010 in terms of supplier discounts included, supplier discount not included and
the variation of these values which is R84 746. The percentage that cost of goods
contributes to practice X’s expense is currently 42% (with supplier discounts), without
supplier discounts the cost of goods percentage of expenses will increase by an average 6
%, which totals at 48 % for potential cost of goods without supplier discounts. This will
influence the net income with a variation difference of an additional expense of R84 746. For
a practice which is operating at an annual loss net income, this additional expense could
probably put extra pressure on the practice in terms of paying its debt and goal of becoming
profitable.
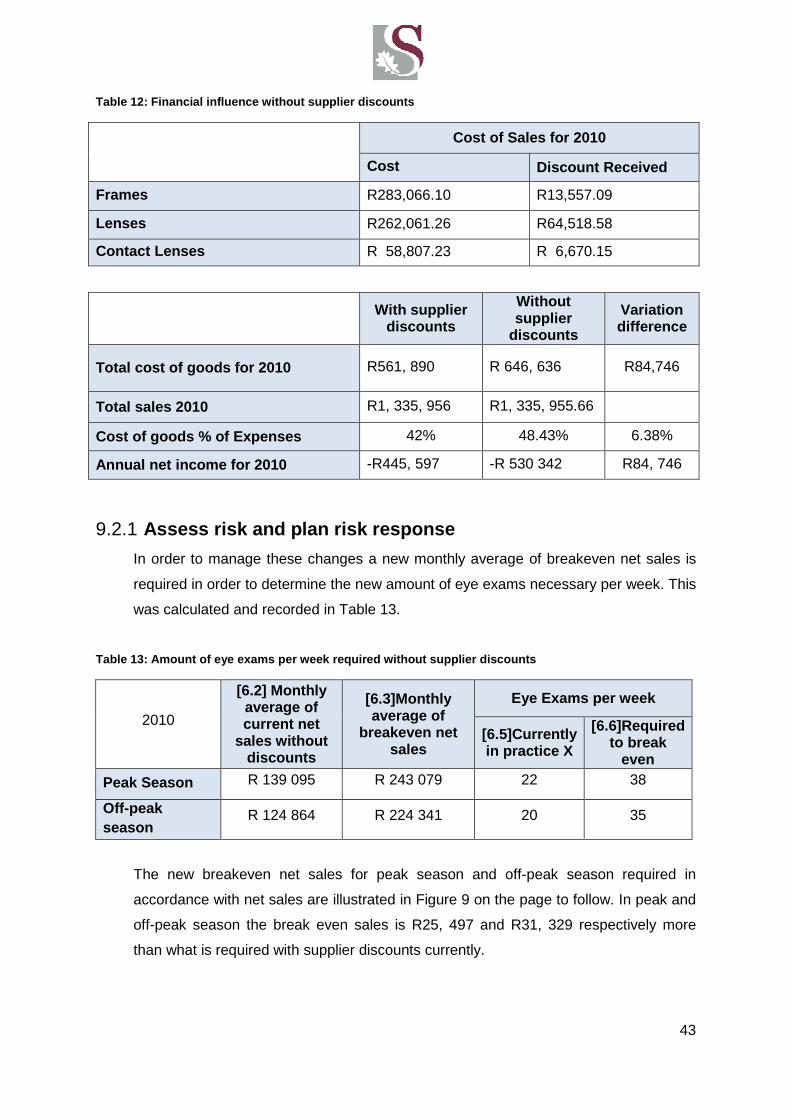
43
Table 12: Financial influence without supplier disc ounts
Cost of Sales for 2010
Cost Discount Received
Frames R283,066.10 R13,557.09
Lenses R262,061.26 R64,518.58
Contact Lenses R 58,807.23 R 6,670.15
With supplier discounts
Without supplier
discounts
Variation difference
Total cost of goods for 2010 R561, 890 R 646, 636 R84,746
Total sales 2010 R1, 335, 956 R1, 335, 955.66
Cost of goods % of Expenses 42% 48.43% 6.38%
Annual net income for 2010 -R445, 597 -R 530 342 R84, 746
9.2.1 Assess risk and plan risk response
In order to manage these changes a new monthly average of breakeven net sales is
required in order to determine the new amount of eye exams necessary per week. This
was calculated and recorded in Table 13.
Table 13: Amount of eye exams per week required wit hout supplier discounts
2010
[6.2] Monthly average of current net
sales without discounts
[6.3]Monthly average of
breakeven net sales
Eye Exams per week
[6.5]Currently in practice X
[6.6]Required to break
even
Peak Season R 139 095 R 243 079 22 38
Off -peak season
R 124 864 R 224 341 20 35
The new breakeven net sales for peak season and off-peak season required in
accordance with net sales are illustrated in Figure 9 on the page to follow. In peak and
off-peak season the break even sales is R25, 497 and R31, 329 respectively more
than what is required with supplier discounts currently.
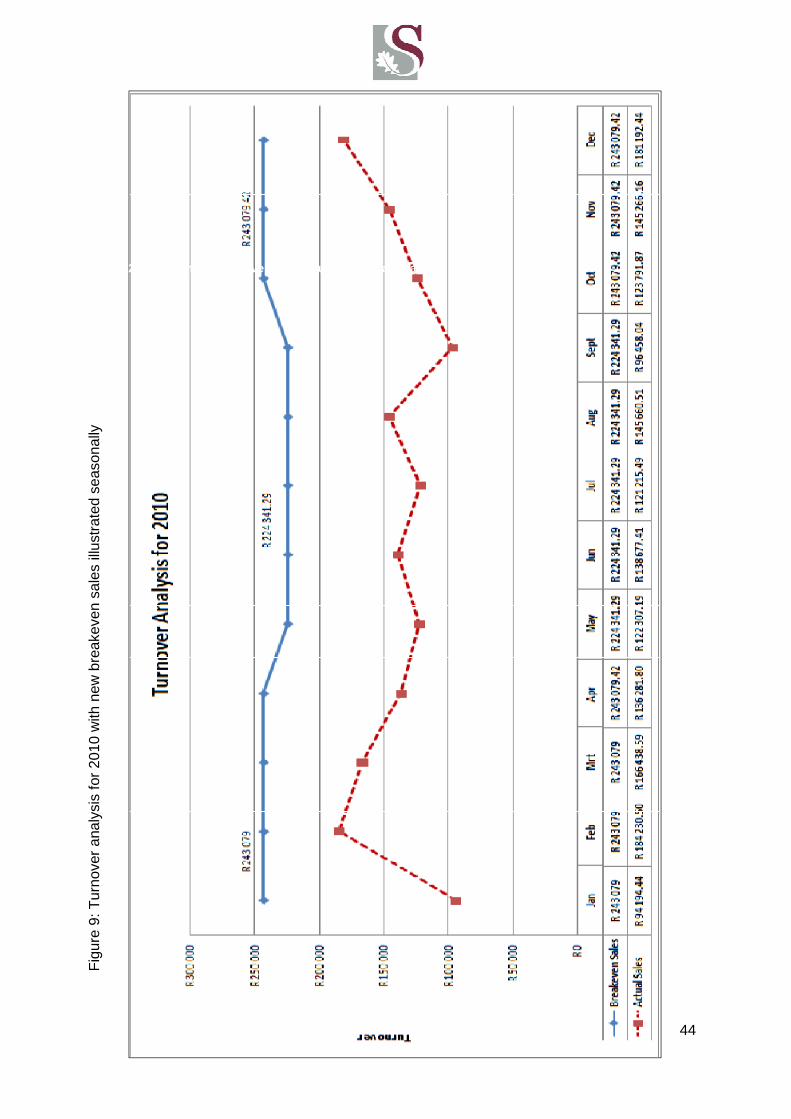
44
Fig
ure
9: T
urno
ver
anal
ysis
for
2010
with
new
bre
akev
en s
ales
illu
stra
ted
seas
onal
ly
: Turnover analysis for 2010 with new breakeven sal es illustrated seasonally
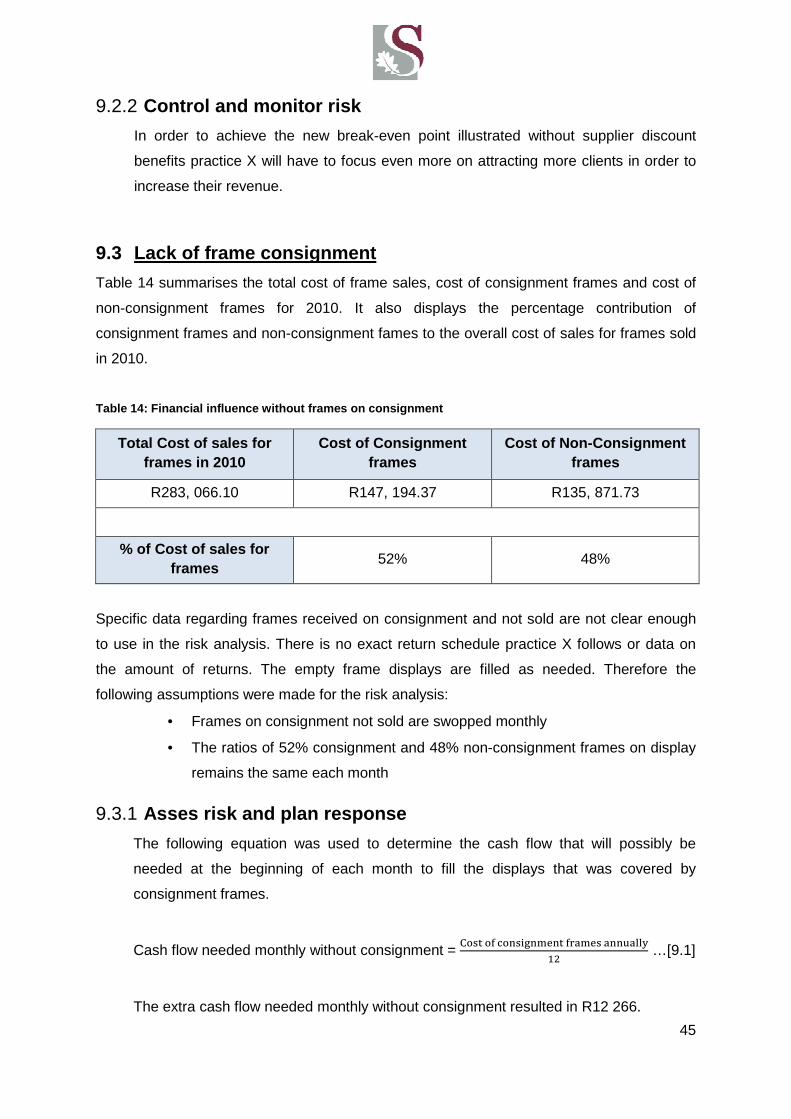
45
9.2.2 Control and monitor risk
In order to achieve the new break-even point illustrated without supplier discount
benefits practice X will have to focus even more on attracting more clients in order to
increase their revenue.
9.3 Lack of frame consignment
Table 14 summarises the total cost of frame sales, cost of consignment frames and cost of
non-consignment frames for 2010. It also displays the percentage contribution of
consignment frames and non-consignment fames to the overall cost of sales for frames sold
in 2010.
Table 14: Financial influence without frames on con signment
Total Cost of sales for frames in 2010
Cost of Consignment frames
Cost of Non-Consignment frames
R283, 066.10 R147, 194.37 R135, 871.73
% of Cost of sales for frames
52% 48%
Specific data regarding frames received on consignment and not sold are not clear enough
to use in the risk analysis. There is no exact return schedule practice X follows or data on
the amount of returns. The empty frame displays are filled as needed. Therefore the
following assumptions were made for the risk analysis:
• Frames on consignment not sold are swopped monthly
• The ratios of 52% consignment and 48% non-consignment frames on display
remains the same each month
9.3.1 Asses risk and plan response
The following equation was used to determine the cash flow that will possibly be
needed at the beginning of each month to fill the displays that was covered by
consignment frames.
Cash flow needed monthly without consignment = "��� �� �������� ������ ����
=E …[9.1]
The extra cash flow needed monthly without consignment resulted in R12 266.

46
9.3.2 Control and monitor risks
With regards to losing the benefit of receiving frames on consignment practice X will
require an extra cash flow of average R 12 266 that has to be available at the
beginning of each month in order to stock the frames that will be sold during that
month. This does not include the frames on consignment that is left unsold for the
month and swopped at the supplier. Unfortunately the cash amount for frames
received on consignment and swopped cannot be determined from the data of practice
X. It can be stated though that when including the unsold frames to the cash flow
required at the beginning of each month (R12 266) can possibly grow with a large
amount. If practice X desires to accurately determine the impact of loss of frames on
consignment, data regarding the cash amounts of frames received on consignment
and swopped should be recorded more accurately.
47
10 Conclusion and recommendations
The literature on South African optometry is limited, hence optometry industry benchmarks
to measure practice X’s performance is not available. It was found that U.S. based
benchmarks from The Management Business Academy booklet (Gailmard, 2010) is a good
approximation of what South African benchmarks should be. The student was able to
measure practice X’s performance and identify procedures that can be improved within the
practice. Implementing these improved procedures could possibly enable practice X to
accelerate the journey towards breaking even and becoming profitable.
In order for practice X to become more profitable, the major barrier at present is the size of
the client base. Contact lens sales should be increased, since there is a good market for it in
South Africa. It is also essential for practice X to attract more clients in general as soon as
possible in order to increase their revenue to breakeven and ultimately become profitable.
Practice X can successfully maintain the seven habits of effective optometrists by
considering the following recommendations.
10.1 Clients ‐‐‐‐centrism
Practice X should focus on improving their client-centrism even more by:
• Improving the recall system
• Having a personal marketing strategy
10.2 Management by performance metrics
It can be very beneficial for practice X to continuously measure the practice’s
performance in order to make more informed decisions for the future and also to
easily identify problem areas. Practice X should attempt to measure their
performance annually and keep record of their results. The following metrics can be
beneficial to measure annually:
• Revenue mix
• Revenue generated per exam
• Expense categories

48
10.3 Setting goals
Long term goal:
Performance vision
• Practice X should breakeven as soon as possible
• Increase their net income to an average 33% of their gross revenue for the
years to follow after they have broken even
• strive to perform 39 eye exams per week according to the South African norms
Short term goal:
Milestones in order to achieve performance vision
• Increase marketing effort
• Grow the contact lens client base
• Improve recall system
• Optimise frame mixes
• Get involved with the community
• Increase customer satisfaction by building quality relationship and improving
service.
• Set up a personal website for practice X
10.4 Efficient time use
When practice X grows in such a way that the amount of eye exams increases to 39,
the habit of efficient time use can be incorporated.
10.5 Implementing leadership
Practice X has good staff relationships, but it can be beneficial to include the staff
members in the practice’s goals by giving each member a specific measurement that
they should monitor throughout the year.
10.6 Taking risks
Changing the routine of optometry practice X can be difficult at first and may hold
some risk, but adapting to a new routine now in order to possibly optimise the practice
for the future can possibly be very rewarding.
10.7 Continuous improvement
To maintain a successful marketing strategy it should be continued and monitored
throughout the year. Also by using metrics practice X can continuously evaluate their
performance and make informed decisions for the future.

49
11 Reflection
The report enabled me to engage in a professional manner with the owner of the optometry
practice on which the study was done. I learned how to thoroughly research a topic and put
all the pieces together in a structured manner in order to be presentable and
understandable. In future engineering projects I will be able to use skills learned during this
process. I realised that one of the most important skills is to have a very structured plan at
the beginning of your project, but it must be flexible enough to be able to adapt to change
completely. My approach to the project changed continuously due to the research materials I
found throughout the process, which finally provided me with the final structure of this report.
The project was also very economics and business management based, which was
challenging at times, but achievable. I found the topic extremely interesting though, since I
was able to apply my engineering knowledge gained over the last four years practically,
economical and theoretical. I found the process of completing this report very rewarding
personally.
50
12 References
Adlington, T., Adlington, C., 2011. Optometric Management: What we learned from
corporate optometry. [Online].2005. Available:
http://www.optometric.com/article.aspx?article=71438 [8 June 2011]
Averkamp, H., 2011. Accounting coach. [Online] Available:
http://blog.accountingcoach.com/break-even-point-2/ [7 September 2011]
Bennett, I., 2003. Management for the eyecare practitioner. Second edition.
Amsterdam: Butterworth-Heinemann
Brooks, R., 2000. Jump-start your practice today and grow well beyond Y2K. Review
of optometry, 137(1):25, January 15
Brooks, R., 2000. Play the contact lens card. Review of optometry, 137(4):29, April 15
Bureau of Labor Statistics, U.S. Department of Labor. 2009., Occupational Outlook
Handbook, 2010-11 Edition, Optometrists. [Online] Available:
http://www.bls.gov/oco/ocos073.htm [8 June 2011]
Chris, K., 2009. Ciba Vision: Academy for eyecare excellence. [Online] Available:
https://www.mycibavision.com/education/docs/Seven_Habits_Optometrists.pdf [13
July 2011]
Damm, J., Heechung K., 2010. Operational Excellence in Optometry: How a Small
Practice Can Utilize Lean Principles.[Online] Available:
http://ezinearticles.com/?expert=John_Damm [5 May 2011]
Diecidue, A., 2003. Helpful websites for O.D.s. Review of optometry, 140(11):29-30,
November 15
Eisenstatt, G., 2007. Recipe for Optometric Success. Review of optometry,
144(11):52-57, November 15
Eyesite-Magazine. 2008., John Hanson interview. [Online] Available:
http://www.eyesite.co.za/magazine/august2005/spotlight2.asp?mainbutton=spotlight&n
avbutton=spotlight2 [5 September 2011]
Gailmard, N.B., 2004. Business Strategies for Your Dispensary. Review of optometry,
141(10):39-42, October 15
51
Gailmard, N.B., 2000. The Entrepreneurial O.D.: Busting the benchmarks. Review of
optometry, 137 (1):29, January 15
Gailmard, N.B., 2007. A new look at practice expense ratios. Review of
optometry.[Online] Available: http://www.optometric.com/mtotw/tip.asp?tip=266[4
September 2011]
Gailmard, N.B., Gerber, G., Hayes, J., Ziegler, D., 2008. Key metrics of optometry
practice. United States: The Management & Business Academy.
Gailmard, N.B., Gerber, G., Hayes, J., Ziegler, D., 2010. Key metrics of optometry
practice. United States: The Management & Business Academy.
Gerber, G.S., 2005. Manage Your Office By the Numbers. Review of Optometry. 142
(10): 31-36, October 15
Girard, F., 2011. Optometric management tips. [Online] Available:
http://www.ehow.com/info_8458707_optometric-management-tips.html [13 July 2011]
Hellem, A., 2007. Opportunity awaits. Review of optometry. 144(9):4, September 15
Kirby, J., 2004. Make Your Specialty Your Success. Review of Optometry. 141(12):31-
34, December 15
Lewis, J., 2009. Optometric Practice Management:How Far Can You Reach? [Online]
Available: http://ezinearticles.com/?expert=Jeffrey_Lewis,_O.D.[11 March 2011]
Morgan, P. B., Efron, N., Woods, C. A. and The International Contact Lens Prescribing
Survey Consortium, 2011. An international survey of contact lens prescribing for
presbyopia. Clinical and Experimental Optometry, 94(1): 87–92, January
Moss, G.L, Shaw-Mc Minn, P.G., 2001. Eyecare business:Marketing and
strategy.Boston: Butterworth-Heinemann
Richter, M., 2007. The need for and development for a Practice Management Module
for Optometry student in South Africa. Johannesburg: University of Johannesburg
(Business Management-dissertation)
Scibal, J., 2010. Optometric management: Use metrics in your practice. [Online]
Available: http://www.optometric.com/article.aspx?article=104934 [2 May 2011]

52
Shaw-McMinn, P.G., 2005. Promote your practice more effectively. Review of
optometry, 152(8):31-39, August 15
X-Rates. 2010., 2010 - South African Rands to 1 USD. [Online] Available:
http://www.x-rates.com/d/ZAR/USD/hist2010.html [ 7 September 2011]

53
13 Appendix A: Income and Expenses of practice X
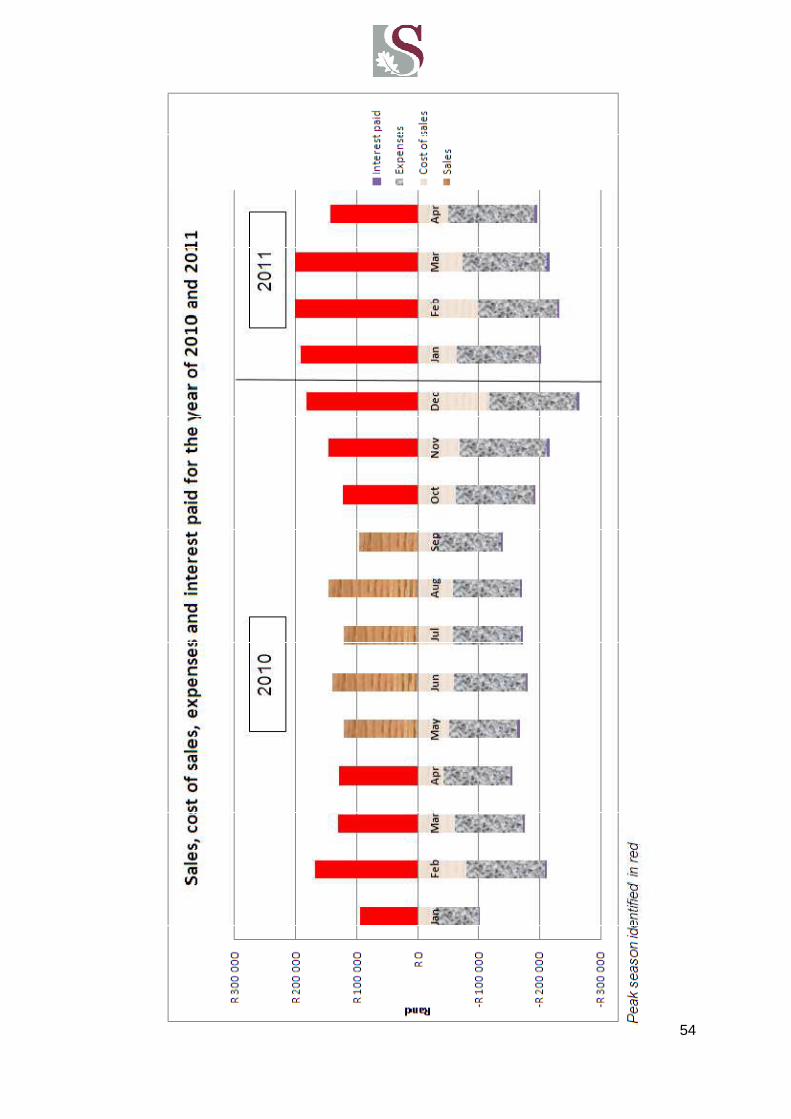
54

55
14 Appendix B: Excel spreadsheet with calculated va lues for minimal monthly turnover
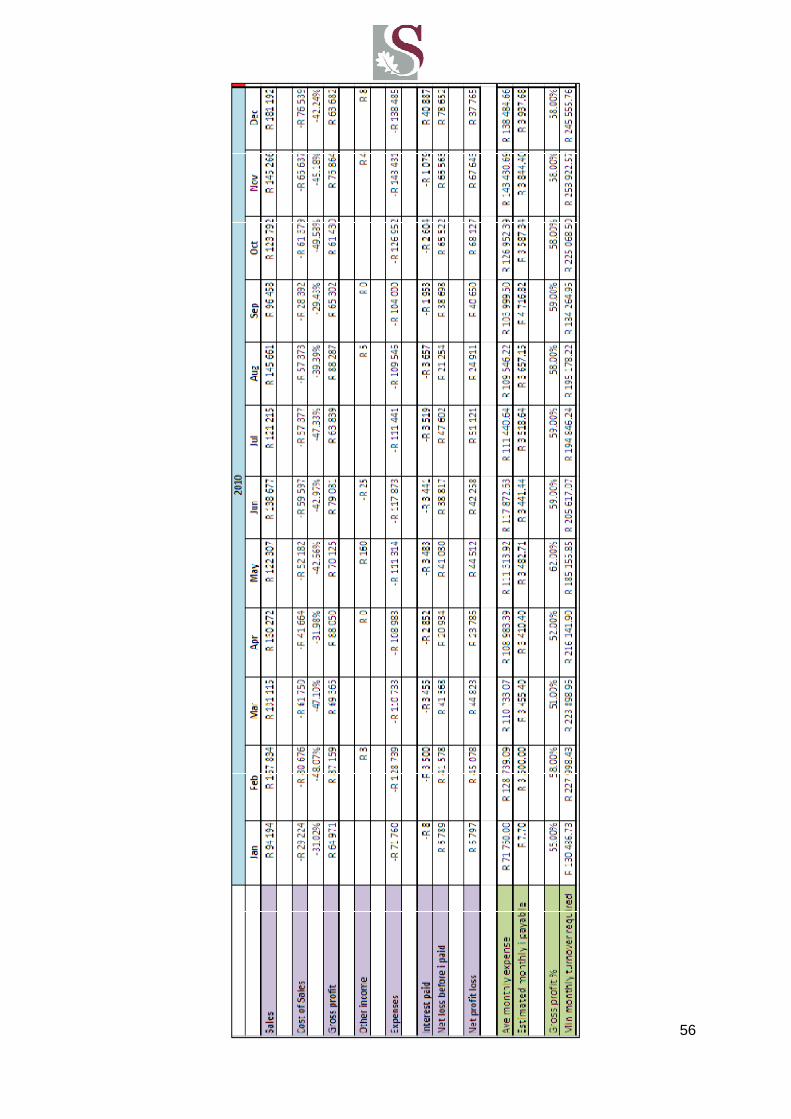
56

57
15 Appendix C: Gannt chart of methodology timeline

58