© 2016 IJRAR December 2016, Volume 3, Issue 4 www.ijrar.org (E-ISSN 2348-1269, P- ISSN 2349-5138)
IJRAR1903990 International Journal of Research and Analytical Reviews (IJRAR) www.ijrar.org 751
Factors Influencing Consumer Preference and Switching Behaviour
:An Empirical Study of Punjab Telecom Sector
Gaurav Vats (Assistant Professor, Department Of Commerce and Business
Management, DAV College, Sector 10 Chandigarh).
Abstract
Indian telecom sector has witnessed exponential growth in the wireless subscribers. With the
advent of advanced technologies like 4th generation and VOLTE services the competition has
increased substantially. The bargaining power of subscribers has further increased due to the
introduction of nationwide MNP. Cellular operators are now facing the biggest challenge of
customer retention. The study attempts to investigate the factors influencing the consumer’s
choice of cellular operator and the reasons responsible for switching behavior. The findings of
the study suggest a positive significant relationship between customer satisfaction with variables
like signal strength, affordability, data services value added services, customer service etc. Indian
cellular operators are now focusing away from attracting new customers, towards retaining the
existing profitable customers. The study also provides policy implications to the selected cellular
operators and other stakeholders.
Keywords
Customer Satisfaction, Service Quality, Mobile Number Portability, Switching intention.
Introduction
In today’s highly dynamic and competitive marketplace, businesses have to be customer centric
due to the plethora of choices available to them. The cellular industry in India has grown
exponentially since the last two decades1. The technology used to deliver these services has
undergone a sea level change2. Indian cellular industry has majority of prepaid subscribers, it is
easy for prepaid users to switch or use services of multiple operators3. Therefore there is a need
to analyze the switching intention of the customers.
After the deregulation of telecom sector, many private as well as foreign cellular operators have
started services in India. This has led to a buyer’s market as the supply now exceeds demand. To
meet the challenges of price wars, customer switching, declining ARPU, cut throat competition,
the firms have to employ latest technology4. The bargaining power of customers has further
increased due to the introduction of MNP5. Cellular operators are increasingly becoming
customer-centric to ensure customer satisfaction6. Satisfied customer stay longer with the
company and also spread positive message about the service firm through word of mouth

© 2016 IJRAR December 2016, Volume 3, Issue 4 www.ijrar.org (E-ISSN 2348-1269, P- ISSN 2349-5138)
IJRAR1903990 International Journal of Research and Analytical Reviews (IJRAR) www.ijrar.org 752
communication7,8,9. There is thus a need to analyze the effect of MNP on the switching behavior
of the subscribers10.
Cellular operators are facing the biggest problem of customer switching11. The firms can reduce
switching if they are able to identify various factors influencing switching12. The review of
literature indicates a relationship between service quality and customer satisfaction13,14. Also
there is association between customer satisfaction, customer switching intention and
recommending behavior15.
MNP was implemented by Telecom Regulatory Authority of India (TRAI) in India on 20th
January 2011. MNP enables the cellular service users to retain their existing mobile number
while switching to another cellular operator of the same telecom circle. Initially, in December
2010, the MNP facility was introduced in Haryana, afterwards it was extended across India on
January 20th, 2011.
Due to the implementation of MNP cellular subscribers can easily switch between different
service providers as per their choice. The technology used for the implementation of MNP in
India is Donor led, which is based on unique porting code. Initially, the subscribers were able to
switch their service provider within same circle, but in 2015, TRAI implemented Pan India
number portability. Pan India number portability enables the subscribers to retain their existing
mobile number throughout the country i.e., across different telecom circles.
In the present era of fierce competitive business environment, it has become vital for the firms to
manage and retain their existing customers. Customer retention has become a better indicator of
enterprise performance than the traditional considered indicator- profitability. Many
organizations still do not give adequate emphasis to customer retention (Ramakrishnan 2005)16.
Retaining the customers is a key to achieve high business efficiency. Customer retention has a
direct influence on economies of scale, profitability levels, market share and other key
performance indicators that enable a firm to attain competitive advantage. Were it not for the
huge license fees paid, the mobile phone business may have even be the most profitable venture
in corporate history of India (McDowell & Lee, 2003)17
Cellular market in India is quite competitive specifically in regard to acquiring new customers as
is clear from the high valuations put on acquisition are based on high subscriber acquisition costs
(Ernst &Young,)18. Due to the dwindling profit margins and declining ARPU’s the cellular
operators have started aiming towards implementing the business practices that aim for customer

© 2016 IJRAR December 2016, Volume 3, Issue 4 www.ijrar.org (E-ISSN 2348-1269, P- ISSN 2349-5138)
IJRAR1903990 International Journal of Research and Analytical Reviews (IJRAR) www.ijrar.org 753
satisfaction and retention (Fornell &Wernerfelt)19. Customer’s perception of the service quality that
they experience with services rendered by current cellular operator, influence their behavioral
outcomes. Thus the presents study gains much relevance as the customer satisfaction and
customer retention become the key to survival and growth of companies.
REVIEW OF EXISTING LITERATURE
A critical examination of the existing studies in Indian and global context was carried out in
order to have a deeper insight into the conceptual framework of the present study. On the basis of
extensive review and the gaps found in the existing studies, research objectives and hypotheses
were formulated for further investigation.
Potluri & Hawariat (2010)20 conducted a research on effect of quality of services rendered by
the Ethiopian Telecommunication Corporation on customer satisfaction. The present study
focused on analyzing the role of serving staff in providing after sale services. Convenience
sampling was used to select the sample for the study. Questionnaire was prepared to collect the
data from respondent who were using fixed line telephone services. Total 450 questionnaires
were distributed among the respondents, out of which 370 responses were used for analyses.
Structured personal interviews with open ended questions was also followed. The results
concluded that nearly 40% of the respondents have negative remarks about the after sale services
rendered by the sale staff. Regarding the service quality, inaccuracy of bills, delay in resolving
complaints, poor network coverage found to be significant in the study which requires
improvement in these services rendered by company.
Gautam & Chandhok (2011)21 investigated the determinants which influence the mobile phone
users to switch to another service providers. The authors found important factors which would
help the companies to keep the customers loyal. The study collected secondary data from the
websites, published and unpublished articles, TRAI reports. The results of the study indicated a
negative relationship between customer satisfaction and customer complaints which revealed that
if the level of satisfaction is high then there will be less tendency to complaint. Therefore, the
authors suggested to improve the services rendered as per the need of subscribers.
Haverila (2011)22 identified the features to be included in the mobile phones which leads to
customer satisfaction. The study focused on the feature preferences of male respondents in
mobile phone. The author tried to establish the relationship between feature preference and

© 2016 IJRAR December 2016, Volume 3, Issue 4 www.ijrar.org (E-ISSN 2348-1269, P- ISSN 2349-5138)
IJRAR1903990 International Journal of Research and Analytical Reviews (IJRAR) www.ijrar.org 754
customer satisfaction and results in repurchase intention. The data was collected from 289
respondents of university and high school of Finland. Online questionnaire was developed for
collecting data. Factor analysis was used in the study. Three factors were grouped for the
features preferences i.e., business functionality, standard parts and processes, and aesthetics and
design. The regression model was applied and indicated that business functionality, had a
significant correlation with repurchase intent.
Afzal et al., (2013)23 tried to bring out the relationship between customer satisfaction and
switching behaviour of mobile phone users. The study was carried out to investigate the factors
which can influence the switching intention of the subscribers. The study examined the loyalty of
subscriber towards their current cellular operator. The data was collected from 104 students
selected from two universities of Larkana. Questionnaire method was selected to collect the data
from the students. The data was analysed by using SPSS. Pearson Correlation indicated the
significant relationship between service quality and switching behaviour of respondents i.e., the
services rendered by the cellular operators had an impact on the switching behaviour of
respondents. The results found the significant relationship between trust and switching
behaviour, whereas, there exists negative relationship between loyalty and switching intention.
Boateng & Boateng (2013)24 developed a model to measure the willingness of subscribers to
switch to another service operator. The study attempted to investigate the effect of
implementation of MNP on the switching behaviour of mobile subscribers. The study includes
the survey of six months. The data was collected through interview and questionnaire method.
Convenience sampling method was used to select the sample of 200 respondents of Ghana. The
results indicated that there exists a negative relationship between switching intention and the
income of subscribers. However, high, average and low customer services were not statistically
significant in determining the switching intention or to stay with current service provider.
Kutlu (2013)25 identified and modeled the factors influencing customer’s adoption for MNP in
Turkey. The data was collected from 1250 respondents who were subscribers of cellular services
through the questionnaire method. In the proposed model, age, type of service contract, the
cellular operator and satisfaction level of the respondent were used as predictors. Multiple
regression analysis was used to examine the effect of respondent’s age, type of contract, network
operator, and current satisfaction level on intention to opt MNP. The results of the study showed
that these variables were having a significant effect on adoption of MNP by the subscribers. The

© 2016 IJRAR December 2016, Volume 3, Issue 4 www.ijrar.org (E-ISSN 2348-1269, P- ISSN 2349-5138)
IJRAR1903990 International Journal of Research and Analytical Reviews (IJRAR) www.ijrar.org 755
study suggested that the proposed model could be beneficial for managers of cellular service
firms in order to meet the challenges posed by MNP.
Yadav & Dabhade (2013)26 identified the impact of number portability on service providers &
service users. The study explored the effect of portability on sale of IDEA cellular Ltd. The study
identified the strategy adopted to attract more customers by the IDEA cellular to retain their
costumers after Number Portability. The self-structured questionnaire was adopted to cover 200
respondents. The study found that MNP generated fair competition among the small as well as
giant player of the telecom sector. MNP compels to focus on retaining their high average revenue
per user (ARPU) postpaid customers because it contributes in profit maximization. The study
recommended the service providers to develop the strategies for attracting new ones as per the
customer expectations and design operator’s services to provide the desired proposition.
Arora & Chawla (2014)27 in their study concentrated on the process of the implementation of
Mobile Number Portability (MNP) and its impacts on cellular subscribers in India. The study
explored the various sources of awareness which influenced the subscribers to opt for MNP. The
study also made a comparison of the satisfaction level of respondents before and after switching
with MNP across different mobile service providers. A self-administered questionnaire on MNP
was designed to collect the data. Snowball sampling method was adopted to select the
respondents for the study. Data were analyzed by using both descriptive and inferential
techniques such as the percentages, paired sample t-test, ANOVA and weighted average score
methods by using SPSS software. The study revealed that friends, family members, relatives
motivated customers to opt mobile number portability followed by information provided by the
Internet and advertisements. Satisfaction level of respondents was found to be enhanced after
having their mobile number ported out to other cellular operator in terms of better connectivity,
affordable tariff plans, reduced call drops, roaming network coverage etc.
Badgujjar & Purewal (2014)28 conducted a study to analyze the subscriber’s preference
towards MNP in three districts of Haryana namely Jind, Rohtak and Sirsa. A pre-structured
questionnaire was devised to obtain the data from 150 cellular subscribers to analyze their
perceptions about the process of porting by opting for MNP. The researchers found the pre-paid
respondents to be satisfied with the services rendered by their cellular operators. The cellular
operators which offer most economic tariff for calls, SMS, 3G data services, variety of roaming
plans can easily lure the customers. The findings of the study opined that if a cellular operator
fails in meeting customer’s expectations in terms of variety of services offered, then there are

© 2016 IJRAR December 2016, Volume 3, Issue 4 www.ijrar.org (E-ISSN 2348-1269, P- ISSN 2349-5138)
IJRAR1903990 International Journal of Research and Analytical Reviews (IJRAR) www.ijrar.org 756
high chances of customer churn. The study concluded that MNP has increased the bargaining
power of the cellular subscribers.
Joshi (2014)29 conducted a survey to identify the factors which affect the experiences of
customers towards cellular mobile services. The data was collected from 536 customers of
Maharashtra using mobile phones. Factor analysis was used in the study for 20 statements
included in the questionnaire and grouped into 5 factors. 86.7% variance was explained in the
study. The results found that service performance was the major factor which affect customer
experience for cellular mobile services. It was found that customers must experience services at
appropriate charges and better quality in network coverage, data connectivity and high speed
from their cellular operator.
Makwana et al., (2014)30 made an attempt to identify various factors influencing consumer
switching behaviour in cellular service industry. A self-designed pre-structured questionnaire
consisting of 19 items was used for data collection. The questionnaire was largely based on 5-
point Likert Scale. The questionnaire was administered on a sample size of 100 respondents
(each of 50 male and 50 female students) graduating from a professional institute of Indore City.
For ensuring adequacy of sample and to ensure validity Kaiser-Mayer-Olkin (KMO) and
Bartlett’s Test were used. Inferential techniques such as factor analysis, mean and student’s t-test
were applied for data analysis. The study revealed that VAS (value added services) and pricing
strategies were the two important factors that had an influence on consumer behavior. The study
offered valuable implications for the wireless service providers to manage consumer brand
switching and also for retaining the customers while maintaining a long term profitable
relationship.
Naik (2014)31 conducted an empirical research to investigate the level of consumer awareness
and customer preference for MNP. The study aimed to identify the major influencers of customer
switching by opting for MNP. The researchers used convenience sampling to draw a sample of
280 mobile service users. A structured questionnaire was framed to conduct the survey for
obtaining the required MNP information for study. The research found advertisements as a main
source of customer awareness about MNP. The findings of the study revealed that 45 pecent of
the respondents desired to switch their service provider. The study also differentiated the
customers who have opted for MNP and those who never opted for MNP. The research found
that 68 percent of the respondents were dissatisfied with various service attributes such as
network coverage, tariff plan, call connectivity etc. the study suggested that cellular operators

© 2016 IJRAR December 2016, Volume 3, Issue 4 www.ijrar.org (E-ISSN 2348-1269, P- ISSN 2349-5138)
IJRAR1903990 International Journal of Research and Analytical Reviews (IJRAR) www.ijrar.org 757
should provide excellent services at an affordable cost in order to retain their customers and to
develop customer loyalty.
Rahul & Majhi (2014)32 attempted to examine the level of satisfaction and loyalty of mobile
users towards their cellular operators. The data was collected through questionnaire method,
distributed among 300 respondents out of which 240 were valid and used further. Factor analysis
was used to drop the items having factor loading less than 0.05. KMO test resulted in value of
0.8 indicating goodness of data. Structural equation model was used in the study to measure the
satisfaction level and loyalty of customers. The study concluded that there exists positive effect
of satisfaction on the loyalty of mobile users. The study suggested that the company can predict
the satisfaction level of customers and loyalty so that steps can be taken to reduce the churn.
Boafo et al., (2015)33 investigated the influence of mobile number portability on the process of
service delivery. The researchers made an attempt to ascertain the factors influencing customer’s
decision to port. The study mentioned advantages and limitations of MNP for both the service
provider firms as well as the cellular subscribers. The authors made a comparison between the
quality of services rendered before and after the implementation of MNP. Both purposive and
accidental types of sampling techniques were used to draw a sample of 164 respondents. The
findings of the study revealed a significant influence of price fairness, customer’s perception of
service quality and company’s brand image over the porting behavior of respondents. The main
managerial implication of the study was that firms should focus on enhancing service quality in
order to aim for customer retention.
Kumaresh & Praveena (2015)34 attempted to measure the impact of implementation of mobile
number portability on the switching intention of mobile phone users. The study focused on
identifying the factors which can influence the customers to switch to another cellular operator
by adopting mobile number portability. The data was collected through structured interview
scheduled from 100 mobile users of Tamil Nadu state. Random sampling method was used to
select the sample. Factor analysis was used to identify the group of factors, factor loading.
Discriminant analysis, percentages were used to test the hypotheses framed. Garrett ranking
method was applied which indicated that the majority of the respondents used mobile phone
because of their personal needs. In the study, advertising was found to be the major source of
information about information of MNP. The study revealed that poor network quality and lack of
promotional activities were the main reason to switch to another competitor.

© 2016 IJRAR December 2016, Volume 3, Issue 4 www.ijrar.org (E-ISSN 2348-1269, P- ISSN 2349-5138)
IJRAR1903990 International Journal of Research and Analytical Reviews (IJRAR) www.ijrar.org 758
Rationale for the present Study
Telecom industry has not only attracted the investments, but also academic researchers. The cellular
services sector of India has witnessed a paradigm shift due to advancements in technology. This
paradigm shift has led to growing emphasis on initiatives that aim at ensuring customer
satisfaction and retention. The expectations of both the service providers as well as cellular
subscribers have increased with the introduction of latest technologies such as 4G and VOLTE.
Further the implementation of nation –wide mobile number portability by TRAI has transformed
the already fierce competition among the cellular operators into a war. The cellular operators
have started experiencing all time high subscriber churn rates due to the implementation of
MNP. With almost similar types of services offered and competitive call rates, cellular operators
are left with only one alternative to differentiate their services from the competitors. That
alternative is to provide high quality of services to the customers and create a high level of
customer satisfaction.
Due to the dwindling profit margins and declining ARPU’s the cellular operators have started
aiming towards implementing the business practices that aim for customer satisfaction and
retention (Fornell &Wernerfelt)35. Customer’s perception of the service quality that they experience
with services rendered by current cellular operator, influence their behavioral outcomes. Thus the
presents study gains much relevance as the customer satisfaction and customer retention become
the key to survival and growth of companies.
Methodology
Research Objectives
1. To explore the subscriber’s perceptions of key service quality dimensions and investigate the
relationship between selected dimensions and customer preference.
2. To identify the determinants of subscriber’s switching intention and examine the relationship
between switching intention and overall customer satisfaction for the services rendered by
selected cellular operators of Punjab telecom circle.
3. To examine the role of Mobile Number Portability on the switching intention of the
subscribers of selected cellular operators of Punjab telecom circle.

© 2016 IJRAR December 2016, Volume 3, Issue 4 www.ijrar.org (E-ISSN 2348-1269, P- ISSN 2349-5138)
IJRAR1903990 International Journal of Research and Analytical Reviews (IJRAR) www.ijrar.org 759
Research Hypotheses
H1: There exists a positive relationship between overall customer satisfaction and different
dimensions of service quality towards services rendered by selected cellular operators of Punjab
telecom circle.
H2: There exists a significant relationship between switching intention and customer’s
perceptions about mobile number portability.
SCOPE OF THE STUDY
The study was conducted on a sample size of 200 subscribers from Punjab telecom circle. Both
prepaid as well as post paid subscribers were included in the study. Both Primary and Secondary
sources of data were used. Primary data was collected through pre-structured questionnaire
largely based on the SERVQUAL scale of service quality. Most of the responses were sought on
five point likert scale. After data collection data was processed and analyzed with the help of MS
Excel and SPSS version 20. Various journals, books, documents, official websites such as TRAI,
COAI, D.O.T etc. were referred for study variables and the testing of hypotheses was achieved
through various inferential statistical techniques.
Test of Goodness was performed to use the adequacy and reliability of the questionnaire. The
KMO test shows that the samples are adequate and useable for inferential statistical analysis. As
per statistical analysis, KMO >0.5 is considered to be an appropriate indicator of adequacy of
data.The Bartlett’s test of Sphericity also confirms that the data is significant at P<0.05.
Table:1 KMO and Bartlett's Test
Kaiser-Meyer-Olkin Measure of Sampling Adequacy. .809
Bartlett's Test of Sphericity
Approx. Chi-Square 1241.065
df 482
Sig. .000
© 2016 IJRAR December 2016, Volume 3, Issue 4 www.ijrar.org (E-ISSN 2348-1269, P- ISSN 2349-5138)
IJRAR1903990 International Journal of Research and Analytical Reviews (IJRAR) www.ijrar.org 760
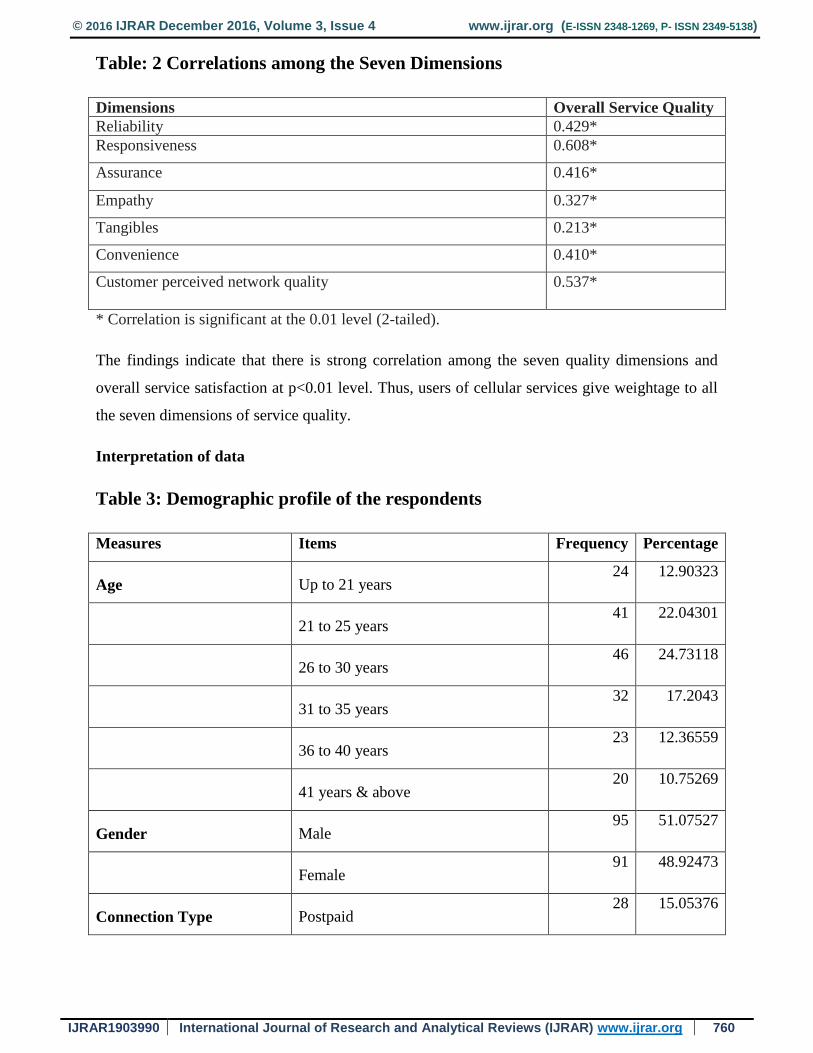
Table: 2 Correlations among the Seven Dimensions
Dimensions Overall Service Quality
Reliability 0.429*
Responsiveness 0.608*
Assurance 0.416*
Empathy 0.327*
Tangibles 0.213*
Convenience 0.410*
Customer perceived network quality
0.537*
* Correlation is significant at the 0.01 level (2-tailed).
The findings indicate that there is strong correlation among the seven quality dimensions and
overall service satisfaction at p<0.01 level. Thus, users of cellular services give weightage to all
the seven dimensions of service quality.
Interpretation of data
Table 3: Demographic profile of the respondents
Measures Items Frequency Percentage
Age Up to 21 years 24 12.90323
21 to 25 years 41 22.04301
26 to 30 years 46 24.73118
31 to 35 years 32 17.2043
36 to 40 years 23 12.36559
41 years & above 20 10.75269
Gender Male 95 51.07527
Female 91 48.92473
Connection Type Postpaid 28 15.05376

© 2016 IJRAR December 2016, Volume 3, Issue 4 www.ijrar.org (E-ISSN 2348-1269, P- ISSN 2349-5138)
IJRAR1903990 International Journal of Research and Analytical Reviews (IJRAR) www.ijrar.org 761
Prepaid 158 84.94624
Network Operator Airtel 53 28.49462
Vodafone 36 19.35484
BSNL 29 15.5914
Idea 33 17.74194
Reliance 21 11.29032
Tata Docomo 14 7.526882
Association with
network
Up to 6 months 39 20.96774
6 months to 1 year 46 24.73118
more than 1 year but less than 2 years 55 29.56989
More than 2 year but less than 3 years 19 10.21505
More than 3 years 27 14.51613
Table 4: Regression Analysis
Independent Variables Beta (β) Sig. T
Reliability 0.368 0.000
Assurance 0.246 0.000
Tangibles 0.042 0.040
Empathy 0.182 0.000
Responsiveness 0.442 0.000
Convenience 0.242 0.000
Customer perceived network quality 0.349 0.000
Table 4, the results indicate that perceived service quality is influenced by all the seven
dimensions with responsiveness as the most important dimension, β coefficient = 0.442,, and
tangibles appearing to be the least important (with β co-efficient = 0.042).
© 2016 IJRAR December 2016, Volume 3, Issue 4 www.ijrar.org (E-ISSN 2348-1269, P- ISSN 2349-5138)
IJRAR1903990 International Journal of Research and Analytical Reviews (IJRAR) www.ijrar.org 762
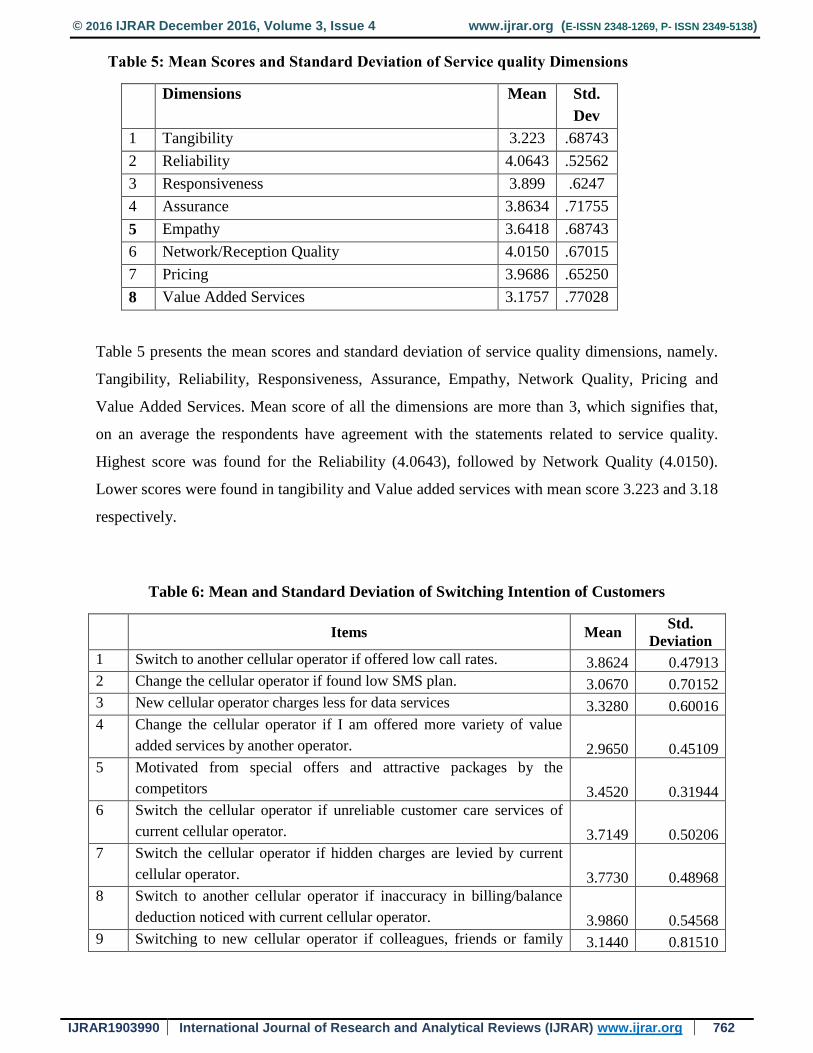
Table 5: Mean Scores and Standard Deviation of Service quality Dimensions
Dimensions Mean Std.
Dev
1 Tangibility 3.223 .68743
2 Reliability 4.0643 .52562
3 Responsiveness 3.899 .6247
4 Assurance 3.8634 .71755
5 Empathy 3.6418 .68743
6 Network/Reception Quality 4.0150 .67015
7 Pricing 3.9686 .65250
8 Value Added Services 3.1757 .77028
Table 5 presents the mean scores and standard deviation of service quality dimensions, namely.
Tangibility, Reliability, Responsiveness, Assurance, Empathy, Network Quality, Pricing and
Value Added Services. Mean score of all the dimensions are more than 3, which signifies that,
on an average the respondents have agreement with the statements related to service quality.
Highest score was found for the Reliability (4.0643), followed by Network Quality (4.0150).
Lower scores were found in tangibility and Value added services with mean score 3.223 and 3.18
respectively.
Table 6: Mean and Standard Deviation of Switching Intention of Customers
Items Mean
Std.
Deviation
1 Switch to another cellular operator if offered low call rates. 3.8624 0.47913
2 Change the cellular operator if found low SMS plan. 3.0670 0.70152
3 New cellular operator charges less for data services 3.3280 0.60016
4 Change the cellular operator if I am offered more variety of value
added services by another operator. 2.9650 0.45109
5 Motivated from special offers and attractive packages by the
competitors 3.4520 0.31944
6 Switch the cellular operator if unreliable customer care services of
current cellular operator. 3.7149 0.50206
7 Switch the cellular operator if hidden charges are levied by current
cellular operator. 3.7730 0.48968
8 Switch to another cellular operator if inaccuracy in billing/balance
deduction noticed with current cellular operator. 3.9860 0.54568
9 Switching to new cellular operator if colleagues, friends or family 3.1440 0.81510

© 2016 IJRAR December 2016, Volume 3, Issue 4 www.ijrar.org (E-ISSN 2348-1269, P- ISSN 2349-5138)
IJRAR1903990 International Journal of Research and Analytical Reviews (IJRAR) www.ijrar.org 763
members switch their cellular operator.
10 Influence of poor network coverage and poor call quality of current
cellular operator. 4.1630 0.50645
11 Switching due to inability to resolve my complaint by current cellular
operator 3.6480 0.49985
12 Switching cellular operator due to relocate factor. 3.0140 0.56478
13 Switching due to poor roaming network. 3.5420 0.49733
14 To experience services offered by other cellular operator. 2.8840 0.63646
15 I would switch to new cellular operator to experience MNP. 2.7390 0.78000
Table 6 shows the mean score of switching intentions of customer to other cellular operators.
High mean score was found 4.1630 if respondents faced poor network coverage and poor call
quality, followed by mean score 3.9860 if there is inaccuracy in billing/balance deduction.
Table 7: Mean and Standard Deviation of Mobile Number Portability
Items Mean
Std.
Deviation
1 MNP is needless as similar type of services offered by all cellular
operators 2.5120 0.86360
2 MNP is beneficial in switching cellular operator. 4.2320 0.52463
3 MNP procedure is quick and hassle free. 3.8680 0.46554
4 Introduction of MNP results into healthy competition among cellular
operators. 3.6120 0.57188
5 MNP is an ultimate solution to all the service problems encountered
with the cellular operator. 3.4820 0.69777
6 MNP is helpful as it focused on strong preference to retain the existing
number while switching to a new cellular operator. 3.9150 0.51915
Table 7 presents the highest mean score of 4.2320 to customer perception of MNP being
beneficial in switching cellular operator followed by mean score 3.9150 to MNP is helpful as it
focused on strong preference to retain the existing number while switching to a new cellular
operator.
Findings and Suggestions
The description of the demographic characteristics of respondents such as gender, age,
connection type, network operator and duration of association with current network were

© 2016 IJRAR December 2016, Volume 3, Issue 4 www.ijrar.org (E-ISSN 2348-1269, P- ISSN 2349-5138)
IJRAR1903990 International Journal of Research and Analytical Reviews (IJRAR) www.ijrar.org 764
analysed which revealed that the majority of the respondents were found in the age group of 26-
30 years (24.7%) followed by the respondents in age group of 21-25 years (22.04%). 51% male
and 48.9% female were covered under the study. The study revealed that out of total 186
respondents 85% were subscribers of pre-paid services and the rest 15%respondents were
subscribers of post-paid services. Majority of the respondents were using Airtel network i.e
28.49% followed by 19.35% of Vodafone. The duration of association with current network
revealed that 29.5% respondent’s lie in the category of 1-2 years of duration of service usage
with their current cellular operator followed by 24.73% respondents having 6 months to 1 year of
service usage. The hypothesis H1 and H2 are accepted.
The two main factors found responsible which influence the switching intention of
customers were poor network coverage and poor call quality mean score 4.1630, followed by
mean score 3.9860 if there is inaccuracy in billing/balance deduction. The main reason for opting
MNP is the ability to retain the existing mobile number while switching to another service
provider.
Conclusion and Implications
The present study aims to determine the factors influencing switching intention after the
implementation of MNP. The findings suggest a negative relationship between customer
satisfaction and propensity to switch. If the subscribers have no intention to change their current
service provider then they continue using the services of existing service provider. Therefore the
cellular operators who aim to retain their existing profitable customers should make an effort to
maximize customer satisfaction by creating exit barriers. These exit barriers could be superior
network quality, prompt complaint resolution, affordable services, variety of value added
services etc.
Limitations and future research
The scope of present study is limited to Punjab telecom circle which may not be generalized for
other geographical areas. Many subscribers who intend to switch their current service provider
are not completely aware of the MNP process. The cellular operators and government should
organize various communication activities such as advertisements, conferences and seminars
related to the porting process. The present study is limited to intra-circle MNP a similar study
can be conducted at national level to analyze the switching intention for inter-circle number

© 2016 IJRAR December 2016, Volume 3, Issue 4 www.ijrar.org (E-ISSN 2348-1269, P- ISSN 2349-5138)
IJRAR1903990 International Journal of Research and Analytical Reviews (IJRAR) www.ijrar.org 765
porting. There is also a scope for research focusing on customer satisfaction before and after
opting for MNP.
REFERENCES
1 Telecom Sector in India: A Decadal Profile, NCAER- TRAI report 08 June, 2012 2 Mehta S. C., Lalwani A., Han S. L. (2000), “Service quality in retailing: relative efficiency of
alternative measurement scales for different product-service environments”, International Journal
of Retail & Distribution Management, Vol. 28 (2): pp. 62-72 3 Prasad R., Sridhar V. (2009), “Allocative efficiency of the mobile industry in India and its
implications for spectrum policy”, Telecommunications Policy, Vol. 33(9): pp. 521-533. 4 Seo D., Ranganathan C., Babad Y. (2001), “Two-level model of customer retention in the US
mobile telecommunications service market”, Telecommunications Policy, Vol. 32(3-4): pp.182-
196. 5 Ranganathan C., Seo D., Babad Y. (2006), “Switching behavior of mobile users: do users
relational investments and demographics matter?”, European Journal of Information Systems,
Vol. 15(3): pp. 269-276. 6 Turel O., Serenko A. (2006), “Satisfaction with mobile services in Canada: An empirical
investigation”, Telecommunications Policy, Vol. 30(5-6):
pp. 314-331. 7 Rajasekhara M. P., Hailemichael W. H. (2010) "Assessment of after-sales service behaviors of
Ethiopia Telecom customers", African Journal of Economic and Management Studies, Vol. 1(1):
pp.75 – 90 8 Dong H. S. (2007), “A study of mobile number portability effects in the United States”,
Telematics and Informatics, Vol. 24(1): pp. 1-14. 9 Maicas J. P., Polo Y., Javier S. F. (2009), “Reducing the level of switching costs in mobile
communications: The case of Mobile Number Portability”, Telecommunications Policy, Vol.
33(9): pp. 544-554. 10 Maicas J. P., Polo Y., Javier S. F. (2009), “Reducing the level of switching costs in mobile
communications: The case of Mobile Number Portability”, Telecommunications Policy, Vol.
33(9): pp. 544-554. 11 Kim M. K., Park M. C., Jeong D. H. (2004), “The effects of customer satisfaction and
switching barrier on customer loyalty in Korean mobile telecommunication services”,
Telecommunication Policy, Vol. 28:pp. 145-15 12 Lee H., Lee Y., Yoo D. (2000), “The determinants of perceived service quality and its
relationship with satisfaction”, Journal of Services Marketing, Vol. 14 (3): pp. 217-231. 13 Oliver R. L. (1980), “A cognitive model of the antecedents and consequences of satisfaction
decisions”, Journal of Marketing Research, Vol.42: pp. 460-46 14 Payne A., Flow P. (1997), “Relationship Marketing: Key Issues for the Utilities Sector”,
Journal of Marketing Management, 13 (5), 463-478. 15 Reichheld F. F., Kenny D. (1990), “The hidden advantages of customer retention”, Journal of
Retail Banking, Vol. 12(4): pp. 19-27.

© 2016 IJRAR December 2016, Volume 3, Issue 4 www.ijrar.org (E-ISSN 2348-1269, P- ISSN 2349-5138)
IJRAR1903990 International Journal of Research and Analytical Reviews (IJRAR) www.ijrar.org 766
16 Ramakrishnan, K. (2005). Customer retention; The key to business performance. Retrieved
June 2015 from http://vww.etstrategicmarketing.com/smNov-Dec2/art11.html
17 McDowell, S. D., & Lee, J. 2003. India's experiments in mobile licensing.
Telecommunications Policy, 27(5–6): 371-382. 18 Ernst & Young, Valuation drivers in the telecommunications industry accessed via url:
http://www.ey.com/Publication/vwLUAssets/Valuation_drivers_in_the_telecommunicationsindu
stry_pdf/$FILE/Valuation%20drivers%20in%20the%20 telecommunications%20industry.pdf 19 Fornell C and Wernerfelt B “ Defensive Marketing Strategy by Customer Complaint
Management: A Theoretical Analysis” Journal of Marketing Research Vol. 24, No. 4 (Nov.,
1987), pp. 337-346 20 Potluri R. M., Hawariat H. W. (2010), “Assessment of after-sales service behaviors of Ethiopia Telecom
customers”, African Journal of Economic and Management Studies, Vol. 1 (1): pp. 75-90. 21 Gautam P., Chandhok A. (2011), “Switching Behaviour of Subscribers in Indian Telecom Sector”, International
Journal of Research in Finance & Marketing, Vol. 1(3): pp. 183-192. 22 Haverila M. (2011), “Mobile phone feature preferences, customer satisfaction and repurchase
intent among male users”, Australasian Marketing Journal, Vol. 19 (2): pp. 238–246 23 Afzal S., Chandio A. K., Shaikh S., Bhand M., Ghumro B. A., khuhro A. K. (2013), “Factors Behind Brand
Switching in Cellular Networks”, International Journal of Asian Social Science, Vol. 3(2):pp. 299-307 24 Boateng K. A., Boateng O.O. (2013), “Mobile Number Portability: On the Switching Trends among Subscribers
within the Telecommunication Industry in a Ghanaian City”, Communications of the IIMA, Vol. 13(4): pp. 75-91. 25 Kutlu B. (2013), “Effects of Mobile Number Portability: Case of Turkey”, International Journal of Business and
Social Science, Vol. 4(14): pp.120-124. 26 Yadav R. K., Dabhade N. (2013), “ Effects of Mobile Number Portability in Telecom Sector - A Case Study of
Idea Cellular Ltd”, Indian Journal of Economics and Development, Vol. 1(2): pp. 49-59. 27 Arora R., Chawla A. (2014), “Mobile Number Portability: A New Feather in Telecom Services”, IJRFM, Vol.4
(3): pp. 75-89. 28 Badgujjar A., Purewal M. K. (2014), “Customers’ perceptions towards Mobile Number Portability in Haryana: A
Study of Jind, Rohtak and Sirsa”, International Journal of Commerce, Business and Management, Vol. 3(1): pp.
119-125. 29 Joshi S. (2014), “Customer experience management: An exploratory study on the parameters
affecting customer experience for cellular mobile services of a telecom company”, Procedia -
Social and Behavioral Sciences, Vol. 133 (8): pp. 392 – 399. 30 Makwana K., Sharma N., Arora S. (2014), “Factors Influencing Consumer Brand Switching Behavior in
Telecommunication Industry: An Empirical Study”, Prestige e-Journal of Management and Research, Vol. 1(1):
pp.1-10 31 Naik M. R. (2014), “Impact of MNP on consumer behaviour with reference to Tirupati city of Andhra Pradesh”,
IOSR Journal of Business and Management, Vol. 16 (11): pp. 33-39. 32 Rahul T., Majhi R. (2014), “An adaptive nonlinear approach for estimation of consumer
satisfaction and loyalty in mobile phone sector of India”, Journal of Retailing and Consumer Services, Vol. 21 (6):
pp. 570–580. 33 Boafo N. D., Kokuma D. A., Arthur G. (2015), “Impact of Mobile Number Portability on Service Delivery in the
Mobile Telecommunication Industry in Ghana; Case Study of Bharti Airtel Ghana Limited, Kumasi”, Developing
Country Studies, Vol. 5(6): pp. 153-159. 34 Kumaresh K. and Praveena S. (2015), “An Empirical Analysis of Consumer
Switching Behavior towards Mobile Number Portability, Abhinav National Monthly Refereed Journal of Research
in Commerce & Management, Vol. 1(11): pp. 10-23. 35 Fornell C and Wernerfelt B “ Defensive Marketing Strategy by Customer Complaint
Management: A Theoretical Analysis” Journal of Marketing Research Vol. 24, No. 4 (Nov.,
1987), pp. 337-346