TECHNICAL NOTE
Experimental Investigation of Interface Behaviour of DifferentTypes of Granular Soil/Geosynthetics
Awdhesh Kumar Choudhary1 • A. Murali Krishna2
Received: 3 October 2015 / Accepted: 6 January 2016 / Published online: 22 January 2016
� Springer International Publishing Switzerland 2016
Abstract In this paper, influence of different types of
soils and geosynthetics on soil/geosynthetics interface
behaviouris investigated by direct shear and pullout tests.
Three different types of cohesionless soils and three dif-
ferent types of geosynthetics materials are adopted for
experimental investigation. A series of large direct shear
tests and pullout tests were conducted to investigate the
interface behaviour of soil/geosynthetics. The test equip-
ment, soils, and geosynthetics properties are described. The
influence of soil particle size (D50) and geosynthetic
structure are discussed by analysing tests results. Results
are presented and discussed in terms of peak shear resis-
tance, peak pullout resistance, interface friction angle,
efficiency factors and interaction coefficient for different
soils and geosynthetics. It could be seen that the interface
friction angle from both direct shear and pullout tests lin-
early increases with increase in (D50) of soil. The pullout
interaction coefficients (Ci) are found to be in the range of
0.62–1.72 for different tests conditions.
Keywords Direct shear test � Pullout test � Sand �Geosynthetics � Efficiency factor � Interaction coefficient
Introduction
Soil reinforcement techniques are adopted to enhance the
performance of earth structures like: reinforced walls, soft
ground improvement, roads and railways embankments,
slope stabilization and foundations etc. Any geosynthetic
material employed as reinforcement has the main task of
resisting applied stresses or preventing unacceptable de-
formations in reinforced geotechnical structures. In this
process, the geosynthetic acts as tensioned member to the
composite material (soil and fill material) and restrain
tensile deformations by mobilizing tensile load in
geosynthetic and to stop the soil from sliding over the
geosynthetic or pulling out the soil by providing bond
resistance, adhesion, interlocking or confinement and thus
maintains the stability of the soil mass [1–3].
The evaluation of soil/geosynthetic interface behaviour
is very important for design and analysis of geosynthetic
reinforced soil structures [4, 5]. Generally, cohesionless
soils are preferred as the backfill soil/neighbouring soil for
geosynthetics in reinforced soil structures. These materials
have been the preferred backfill material due to their high
strength and ability to prevent development of pore water
pressure [6]. The interface friction angle and adhesion
between a geosynthetic and soil are the primary and the
most contentious variables used in design and stability
analysis of geosynthetic reinforcement structures.
Modified direct shear and pullout tests are performed to
provide the design engineer with the friction angle, adhesion
coefficient and other design parameters for various interfaces
within the design. ASTMD5321 [7] standard on direct shear
test method is commonly followed for the purpose. The
dimensions of typical direct shear test specimen
300 9 300 mm. Though the shear strength of the
soil/geosynthetic interface has been investigated by
& Awdhesh Kumar Choudhary
A. Murali Krishna
1 IIT Kharagpur, Kharagpur, India
2 IIT Guwahati, Guwahati, India
123
Int. J. of Geosynth. and Ground Eng. (2016) 2:4
DOI 10.1007/s40891-016-0044-8

conducting other tests, such as tilt-table tests [8, 9], the direct
shear test is still the most common testing method [10–13].
The interface shear resistance of soil against geomembrane
or geotextiles comes from the friction between soil and
geosynthetic, because soil particles are not trapped into the
small openings of geosynthetics. Pullout tests method com-
monly performed in accordance with ASTM D6706 [14] to
provide the design parameters, which can be used in the
design of geosynthetic-reinforced retaining walls, slopes,
and embankments or in other applications where resistance
of a geosynthetic to pullout under simulated field condition is
important. Thus, a safe and economic design of soil rein-
forcement requires a good understanding of interaction
mechanisms that develop between the soil and the rein-
forcement [15–17]. The interactions can be simplified as soil
sliding in direct shear over the reinforcement and pullout of
reinforcement from the soil [18]. The pulloutmechanism has
been investigated by full-scale and laboratory model tests
and numerical analysis [19–28]. These studies mostly
investigated geosynthetic/granular soil interactions. The
literature indicate that the soil-geosynthetic interaction is
complex as it is affected by structural, geometrical, and
mechanical characteristics of the soil and geosynthetic, as
well as by boundary and loading conditions.
Almost all previous investigations have studied the
behaviour of geosynthetics in one type of granular soil.
Very few researchers have investigated the shear behaviour
of different types of soils and geosynthetics [8, 29]. The
objective of this paper is to investigate the influence of
different types of soils and geosynthetics on soil/geosyn-
thetic interface parameter from both direct shear and
pullout tests. For the experimental investigation, different
cohesionless soils having different gradation curves,
mean/effective particle sizes are selected along with dif-
ferent types of geosynthetics. The Results are presented
and discussed in terms of peak shear resistance, peak
pullout resistance, interface friction angle, efficiency fac-
tors and interaction coefficient, describing the influence of
different types of soils and geosynthetics.
Test Equipment and Procedures
Direct Shear Test
A large direct shear test setup, with a shear box of size
300 mm 9 300 mm 9 150 mm height, as shown in Fig. 1
was used to evaluate the interaction behaviour of the
soil/geosynthetic systems. The direct shear tests on
geotechnical materials (soil–soil) were conducted accord-
ing to ASTM D3080 [30]. Modified direct shear tests on
soil-geosynthetic specimens were conducted according to
ASTM D5321 [7], in a manner similar to a direct shear test
on geotechnical materials but with a modification. The
modification is that the lower shear box of the conventional
direct shear test setup was fitted with rigid wooden block
and a wooden plank of dimensions 295 mm 9 295 mm
covered/clamped with geotextile was placed on the wooden
block (Fig. 2). The use of similar rigid block was practiced
by Lee and Manjunath [11] and Lopes and Silvano [31].
The lower box of direct shear test setup could able to move
for 35 mm of total displacement during shearing. The
normal load was applied through a loading yoke connected
to a loading lever, counter-balanced by a dead weight. The
shearing of the test specimen was done by a screw-ad-
vanced drive system, powered by a motor and gear system,
maintaining a controlled constant rate of shear displace-
ment. During shearing, the lead screw pushes the shear box
along with the lower half box, such that the load cell
connected to the upper half of the box via the U-arm
measures the shear resistance. Horizontal displacement is
recorded by placing a linear variable differential trans-
former (LVDT) onto the front face of the shear box as
shown in Fig. 1. During testing, data from the load cell and
LVDT were recorded through data acquisition system.
Pullout Test
Pullout tests were performed in accordance with ASTM D
6706 [14]. Modified direct shear test setup (Prashanth and
Fig. 1 Large direct shear box setup
Fig. 2 Modification to the direct shear box
4 Page 2 of 11 Int. J. of Geosynth. and Ground Eng. (2016) 2:4
123

Krishna [32]) was used for conducting the pullout tests.
The modification was the replacement of direct shear box
with a pullout box (Fig. 3) of with inner dimensions of
400 mm long, 400 mm wide and 230 mm height and
having a 12 mm thick horizontal slot for placing the
geosynthetic specimen in the soil. A picture of the pullout
test setup arrangement and associated instrumentation is
shown in Fig. 4. The sand was placed to the desired level
and the clamped testing specimen (Fig. 5) was inserted
through the slot and then further pluviation of sand was
continued till the top of box. The displacement of
geosynthetic was measured by a LVDT that was placed on
to the geosynthetic clamper. The other end of the clamper
was connected to a load cell that was further fixed to a
screw-advance drive system. The pull is applied to the
clamped geosynthetic specimen by means of lead screw the
motor gear drive system of the direct shear test setup as
shown in Fig. 4. After having arranged all, the vertical or
normal load was applied through a loading yoke connected
to a loading lever. The clamped geosynthetic was allowed
to pull at constant strain rate. Friction between the soil and
inner walls of the box was minimized by pasting a smooth
thin plastic sheet over the inner walls of the box. Dis-
placement by means of a LVDT and the pull-out load
through the load cell were acquired using data acquisition
system.
Materials Used
Soils
Three different types of cohesionless soils were used in the
tests. The particle size distributions, as per ASTM D6913
[33], of the three types of soils: soil 1, soil 2 and soil 3 are
shown in Fig. 6. Their physical properties such as maxi-
mum dry density, minimum dry density and specific
gravity of soil were determined according to ASTM D4253
[34], ASTM D4254 [35] and ASTM D 0854 [36], respec-
tively, and are presented in Table 1. The specific gravity of
sands was found to be 2.64. The coarser size sand, Soil 1
(D50 = 1.5 mm), has soil particle diameter values ranging
from 1 to 2 mm. The finer size sand, Soil 3
Fig. 3 Pullout box
Fig. 4 Modified pullout test setup (after Prashanth and Krishna [36])
Fig. 5 Reinforcement placed
and attached to clamper
Int. J. of Geosynth. and Ground Eng. (2016) 2:4 Page 3 of 11 4
123
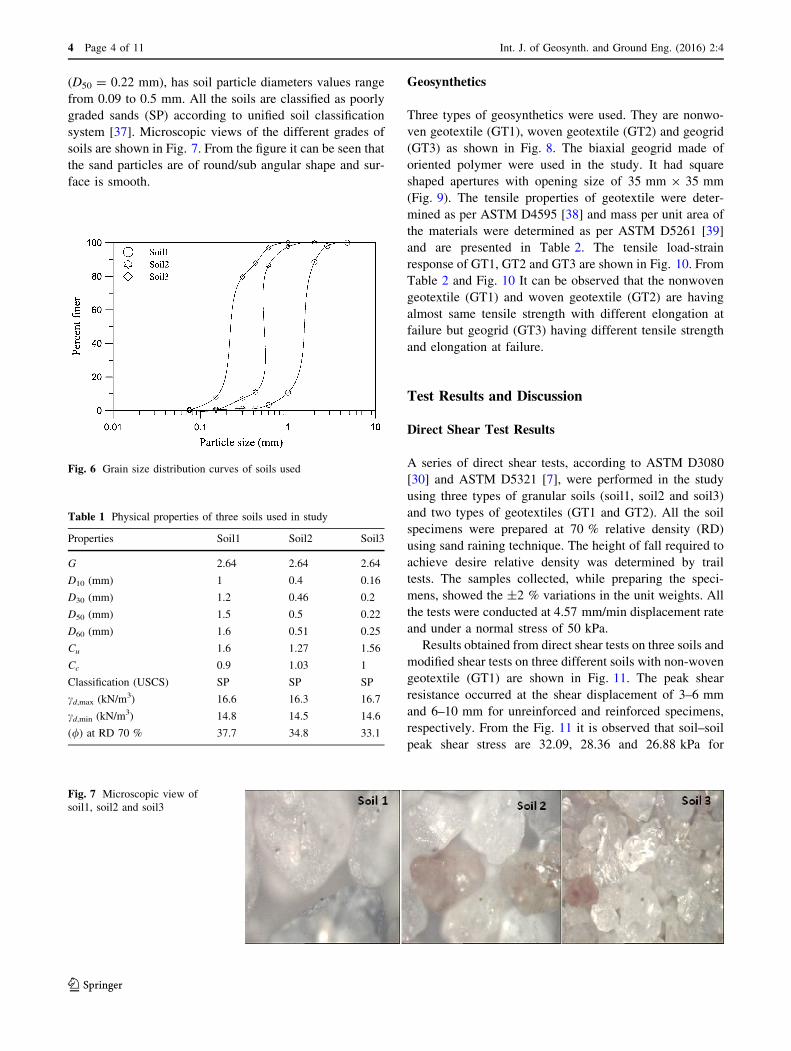
(D50 = 0.22 mm), has soil particle diameters values range
from 0.09 to 0.5 mm. All the soils are classified as poorly
graded sands (SP) according to unified soil classification
system [37]. Microscopic views of the different grades of
soils are shown in Fig. 7. From the figure it can be seen that
the sand particles are of round/sub angular shape and sur-
face is smooth.
Geosynthetics
Three types of geosynthetics were used. They are nonwo-
ven geotextile (GT1), woven geotextile (GT2) and geogrid
(GT3) as shown in Fig. 8. The biaxial geogrid made of
oriented polymer were used in the study. It had square
shaped apertures with opening size of 35 mm 9 35 mm
(Fig. 9). The tensile properties of geotextile were deter-
mined as per ASTM D4595 [38] and mass per unit area of
the materials were determined as per ASTM D5261 [39]
and are presented in Table 2. The tensile load-strain
response of GT1, GT2 and GT3 are shown in Fig. 10. From
Table 2 and Fig. 10 It can be observed that the nonwoven
geotextile (GT1) and woven geotextile (GT2) are having
almost same tensile strength with different elongation at
failure but geogrid (GT3) having different tensile strength
and elongation at failure.
Test Results and Discussion
Direct Shear Test Results
A series of direct shear tests, according to ASTM D3080
[30] and ASTM D5321 [7], were performed in the study
using three types of granular soils (soil1, soil2 and soil3)
and two types of geotextiles (GT1 and GT2). All the soil
specimens were prepared at 70 % relative density (RD)
using sand raining technique. The height of fall required to
achieve desire relative density was determined by trail
tests. The samples collected, while preparing the speci-
mens, showed the ±2 % variations in the unit weights. All
the tests were conducted at 4.57 mm/min displacement rate
and under a normal stress of 50 kPa.
Results obtained from direct shear tests on three soils and
modified shear tests on three different soils with non-woven
geotextile (GT1) are shown in Fig. 11. The peak shear
resistance occurred at the shear displacement of 3–6 mm
and 6–10 mm for unreinforced and reinforced specimens,
respectively. From the Fig. 11 it is observed that soil–soil
peak shear stress are 32.09, 28.36 and 26.88 kPa for
Fig. 6 Grain size distribution curves of soils used
Table 1 Physical properties of three soils used in study
Properties Soil1 Soil2 Soil3
G 2.64 2.64 2.64
D10 (mm) 1 0.4 0.16
D30 (mm) 1.2 0.46 0.2
D50 (mm) 1.5 0.5 0.22
D60 (mm) 1.6 0.51 0.25
Cu 1.6 1.27 1.56
Cc 0.9 1.03 1
Classification (USCS) SP SP SP
cd,max (kN/m3) 16.6 16.3 16.7
cd,min (kN/m3) 14.8 14.5 14.6
(/) at RD 70 % 37.7 34.8 33.1
Fig. 7 Microscopic view of
soil1, soil2 and soil3
4 Page 4 of 11 Int. J. of Geosynth. and Ground Eng. (2016) 2:4
123

unreinforced soil1 (D50 = 1.5 mm), soil2 (D50 = 0.5 mm)
and soil3 (D50 = 0.22 mm) respectively. The correspond-
ing soil-geosynthetic (GT1) peak shear stresses are 16.75,
15.57 and 14.67 kPa, respectively, for three different soils,
in order. From these peak stress values, it can be noted that
the response follows increasing trend with mean particle
size of soil (D50). Figure 11 clearly provides the compar-
ison of all modified direct shear test results for three dif-
ferent soils with non-woven geotextile (GT1).
Figure 12 presents the results similar to Fig. 11, but
with woven geotextile (GT2). In this case, soil-geosyn-
thetic (GT2) peak shear stress for different soils: soil1
(D50 = 1.5 mm), soil2 (D50 = 0.5 mm) and soil3
(D50 = 0.22 mm) are 16.62, 14.27 and 13.3 kPa and
respectively. These peak stress values are lower than that
of non-woven geotextile (GT1) case. This implies that
nonwoven geotextile facilitated good interaction with
neighbouring soil which may be attributed to its texture.
However, for the case of coarser size soil (soil1) the dif-
ference between the peak shear stress values for both GT1
Fig. 8 Geosynthetics used in
study
Fig. 9 Geometry of the geogrid
Table 2 Properties of geosynthetics used in study
Properties Nonwoven
geotextile (GT1)
Woven
Geotextile
(GT2)
Geogrid
(GT3)
Mass per unit area (g/m2) 698 250.4 332
Tensile strength (kN/m) 38.8 39.2 19.3
Elongation at break (%) 22.8 39.13 28
Fig. 10 Tensile load-strain behaviour of Nonwoven geotextile
(GT1), Woven geotextile (GT2) and Geogrid (GT3)
Fig. 11 Direct shear test (unreinforced) and modified direct shear test
(reinforced) results of all soils with GT1
Int. J. of Geosynth. and Ground Eng. (2016) 2:4 Page 5 of 11 4
123

and GT2 is not very significant (Fig. 13a), which is
attributed to the larger mean particle size (D50 = 1.5 mm).
This shows that the larger particle (soil1) could able to
penetrate both woven and nonwoven geotextile thereby
giving almost same peak shear stress. In contrast, fine
particle (soil3) cannot able to penetrate the woven geo-
textile, but can able to stick to nonwoven geotextile thereby
exhibited more stress than that of woven geotextile
(Fig. 13c). Soil2 (D50 = 0.5 mm) having intermediate
particle size shows intermediate behaviour (Fig. 13b).
Efficiency Factors
Using peak shear stress values obtained from experimental
data, friction angle (/) for different soils and interfacial
friction angle (dGT) for different soils—geosyntheticsFig. 12 Direct (soil–soil) and modified direct shear test (soil-GT)
results of all soils with GT2
Fig. 13 Modified direct shear test results for soils/geotextile: influence of geotextiles
4 Page 6 of 11 Int. J. of Geosynth. and Ground Eng. (2016) 2:4
123
combinations were evaluated by as per Mohr–Coulomb
principle (Eqs. 1 and 2).
sp ¼ cþ r0n tan ð/Þ ð1Þ
spm ¼ cþ r0n tan ðdGTÞ ð2Þ
where, sp is the peak shear stress from direct shear test
(soil–soil), spm is the peak shear stress from modified direct
shear test (soil–Geosynthetic), c = soil cohesion (c = 0 for
granular soil), r0n is the effective normal stress (=50 kPa
for all the tests), / is the frictional angle of sand and dGT is
the interfacial frictional angle between soil and geosyn-
thetic in direct shear test.
The friction efficiency factors (E/) were evaluated from
the calculated values of / and dGT using Eq. 3.
E/ ¼ ðtan dGTÞ=ðtan/Þ ð3Þ
The internal friction angle (/), interfacial friction angle
(dGT) and efficiency factor (E/) evaluated for different
soils with different geosynthetics are presented in Table 3.
When comparing the interfacial friction angle (dGT)values for the two geosynthetics, a difference of approxi-
mately 1.09, 8.1 and 9.73 % for different soils (soil1 to 3 in
order), respectively, is observed. The higher dGT values for
non-woven geotextile (GT1) may be attributed to its rough
texture relative to the smooth texture of woven geotextile
(GT2). The surface roughness of nonwoven geotextile is
the reason for the increasing resistance
From the Table 3 it can also be noted that soil 1
exhibited 7.55 and 13.14 % higher dGT values with GT1,
when compared to dGT values for soil 2 and soil 3
respectively. For GT2 these variations are 15.02, and
22.8 %. With this observation it can be stated that the type
of soil has significant role on interface friction angle val-
ues. From the results reported here, it is also noted that the
woven geotextile (GT2) results are more affected with soil
variation, the range being 15–23 % in comparison to
7–13 % for nonwoven geotextile (GT1). Further, from all
the tests, the lowest soil-geosynthetic interface friction
angle value obtained was 14.9�, which corresponds to soil3
(D50 = 0.22)/geotextile GT2 (smoother surface), while the
highest value was 18.58, which corresponds to soil1
(D50 = 1.5)/geotextile GT1 (having the rougher surface).
Therefore, the structure of the geosynthetics and soil par-
ticle size play a very important role in the soil-geosynthetic
interface resistance.
However, in contrast to the discussion on the interfacial
friction angles, variation in efficiency factors (E/) for
different soils is not very significant for a selected
geosynthetic material. The fact here is that the efficiency
factors are representing the interfacial friction values of
different types of soils normalised with the frictional angle
values of the same soil. But different efficiency factors
(E/) for different geosynthetics are observed from the
values presented in Table 3. An average E/ for non-woven
geotextile (GT1) being 0.45 while the same for woven
geotextile (GT2) it is 0.41. The similar range of efficiency
factors has been reported by Hsieh et al. [29].
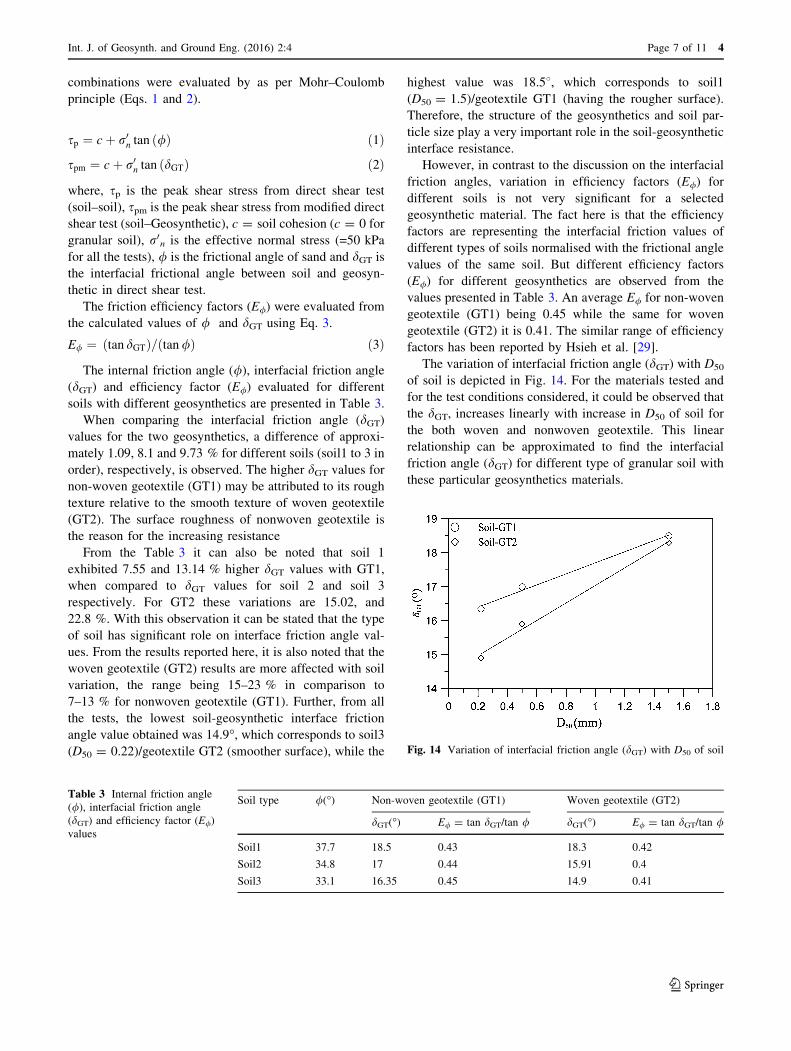
The variation of interfacial friction angle (dGT) with D50
of soil is depicted in Fig. 14. For the materials tested and
for the test conditions considered, it could be observed that
the dGT, increases linearly with increase in D50 of soil for
the both woven and nonwoven geotextile. This linear
relationship can be approximated to find the interfacial
friction angle (dGT) for different type of granular soil with
these particular geosynthetics materials.
Table 3 Internal friction angle
(/), interfacial friction angle
(dGT) and efficiency factor (E/)
values
Soil type /(�) Non-woven geotextile (GT1) Woven geotextile (GT2)
dGT(�) E/ = tan dGT/tan / dGT(�) E/ = tan dGT/tan /
Soil1 37.7 18.5 0.43 18.3 0.42
Soil2 34.8 17 0.44 15.91 0.4
Soil3 33.1 16.35 0.45 14.9 0.41
Fig. 14 Variation of interfacial friction angle (dGT) with D50 of soil
Int. J. of Geosynth. and Ground Eng. (2016) 2:4 Page 7 of 11 4
123

Pullout Test Results
A series of pullout tests, according to ASTM D 6706 [14],
were performed in this study using three types of granular
soils (soil1, soil2 and soil3) and two types of geotextiles
(GT1 and GT2) and one type of geogrid (GT3). All the soil
specimens were prepared at 70 % relative density using
sand raining method. All the tests were conducted at a
displacement rate of 4.567 mm/min and under normal
stress of 20 kPa. The length of geosynthetics (L) embedded
in soil mass is 300 mm. The effective length (Le) of
geosynthetics has been calculated by deducting the pullout
deformation/displacement from the total embedment
length. As the extensibility measurements of the geogrid
members are not available due to limitation of tests setup
used in the present study, the displacement of the rein-
forcement is considered for evaluating the active length.
Typical pullout test results for the geotextile/geogrid with
soil are presented in Figs. 15, 16 and 17 for different
geosynthetic materials GT1, GT2 and GT3, respectively.
The peak pullout resistances, for soil1, soil2 and soil3 with
nonwoven geotextile (GT1) are observed to be 8.72, 6.38
and 5.37 kN/m, respectively, as shown in Fig. 15. Simi-
larly, the peak pullout resistance observed 7.97, 5.36 and
4.42 kN/m for soils1-3 with woven geotextile (GT2) is
shown in Fig. 16 and the values are 21.89, 18.23 and 17.30
kN/m for soils1-3 with GT3 (Fig. 17). It could be observed
that the pullout resistance of geotextile/geogrid is signifi-
cantly influenced by the soil types. This behaviour can be
explained by referring to the soil particle size. All particles
in Soil3 have an equivalent diameter less than 0.5 mm,
while for Soil1, 50 % of particles are between 1.5 and
2 mm in diameter with a maximum particle size of 2 mm.
Soil1 (D50 = 1.5 mm)/nonwoven geotextile (GT1) exhib-
ited 3.35 kN/m i.e. (62.38 %) more peak pullout than that of soil3 (D50 = 0.5 mm)/nonwoven geotextile (GT1).
Soil1 (D50 = 1.5 mm)/woven geotextile (GT2) exhibited
3.55 kN/m i.e. (80.31 %) more peak pullout than that of
soil3 (D50 = 0.5 mm)/woven geotextile (GT2). It is con-
cluded that soil1/geotextile exhibited higher peak pullout
resistance than soil3/geotextile.
From Fig. 18, it is interest to note that the influence of
geotextile types (GT1 and GT2) shows less significance for
Soil1 (D50 = 1.5 mm), whereas for soil2 and soil3, non-
woven geotextile exhibited higher resistance than that of
woven geotextile. Similar behaviour observed for soil/
nonwoven geotextile through direct shear tests, which is in
general agreement with the pullout results. Soil1 (D50 -
= 1.5 mm)/geogrid (GT3) exhibited 4.49 kN/m i.e.
(26.53 %) more peak pullout than that of soil3 (D50 -
= 0.5 mm)/geogrid (GT3). The pullout resistance observed
for soil/geogrid is much higher than the soil/geotextile. The
higher pullout resistance exhibited is associated with the
two different behaviors of geogrid. First, the increase inFig. 15 Pull out-displacement response of soil-nonwoven geotextile
(GT1)
Fig. 16 Pull out-displacement response of soil-woven geotextile
(GT2)
Fig. 17 Pull out-displacement response of soil-geogrid (GT3)
4 Page 8 of 11 Int. J. of Geosynth. and Ground Eng. (2016) 2:4
123
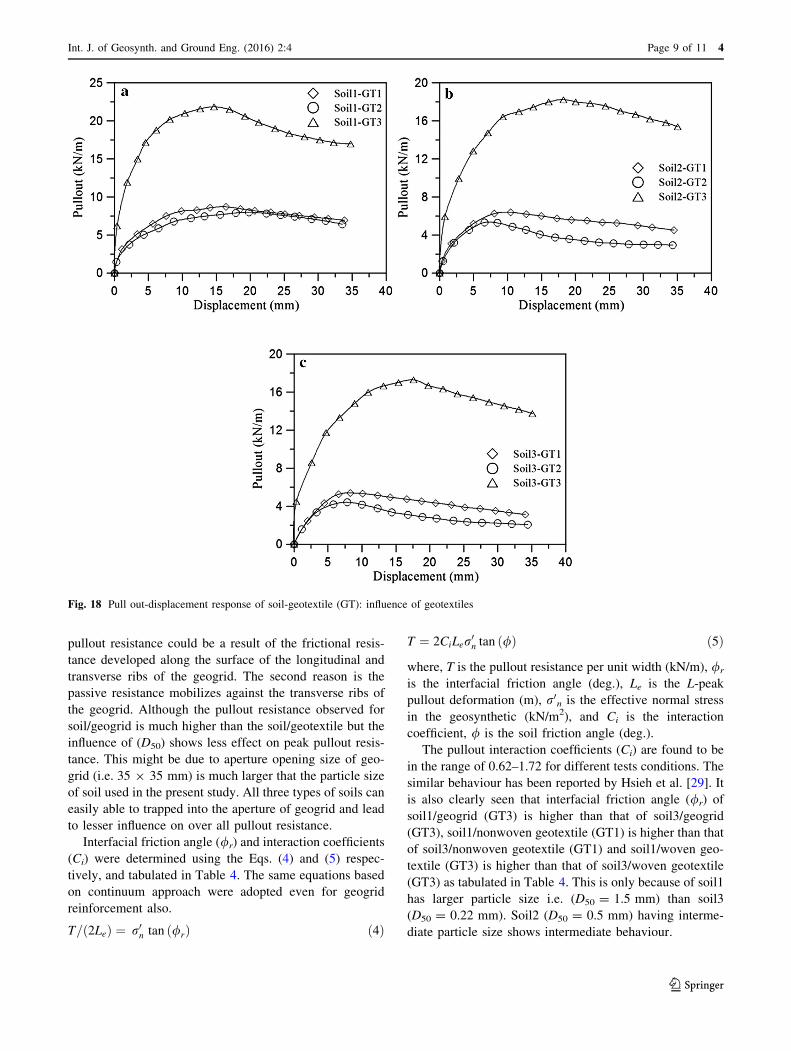
pullout resistance could be a result of the frictional resis-
tance developed along the surface of the longitudinal and
transverse ribs of the geogrid. The second reason is the
passive resistance mobilizes against the transverse ribs of
the geogrid. Although the pullout resistance observed for
soil/geogrid is much higher than the soil/geotextile but the
influence of (D50) shows less effect on peak pullout resis-
tance. This might be due to aperture opening size of geo-
grid (i.e. 35 9 35 mm) is much larger that the particle size
of soil used in the present study. All three types of soils can
easily able to trapped into the aperture of geogrid and lead
to lesser influence on over all pullout resistance.
Interfacial friction angle (/r) and interaction coefficients
(Ci) were determined using the Eqs. (4) and (5) respec-
tively, and tabulated in Table 4. The same equations based
on continuum approach were adopted even for geogrid
reinforcement also.
T=ð2LeÞ ¼ r0n tan ð/rÞ ð4Þ
T ¼ 2CiLer0n tan ð/Þ ð5Þ
where, T is the pullout resistance per unit width (kN/m), /r
is the interfacial friction angle (deg.), Le is the L-peak
pullout deformation (m), r0n is the effective normal stress
in the geosynthetic (kN/m2), and Ci is the interaction
coefficient, / is the soil friction angle (deg.).
The pullout interaction coefficients (Ci) are found to be
in the range of 0.62–1.72 for different tests conditions. The
similar behaviour has been reported by Hsieh et al. [29]. It
is also clearly seen that interfacial friction angle (/r) of
soil1/geogrid (GT3) is higher than that of soil3/geogrid
(GT3), soil1/nonwoven geotextile (GT1) is higher than that
of soil3/nonwoven geotextile (GT1) and soil1/woven geo-
textile (GT3) is higher than that of soil3/woven geotextile
(GT3) as tabulated in Table 4. This is only because of soil1
has larger particle size i.e. (D50 = 1.5 mm) than soil3
(D50 = 0.22 mm). Soil2 (D50 = 0.5 mm) having interme-
diate particle size shows intermediate behaviour.
Fig. 18 Pull out-displacement response of soil-geotextile (GT): influence of geotextiles
Int. J. of Geosynth. and Ground Eng. (2016) 2:4 Page 9 of 11 4
123
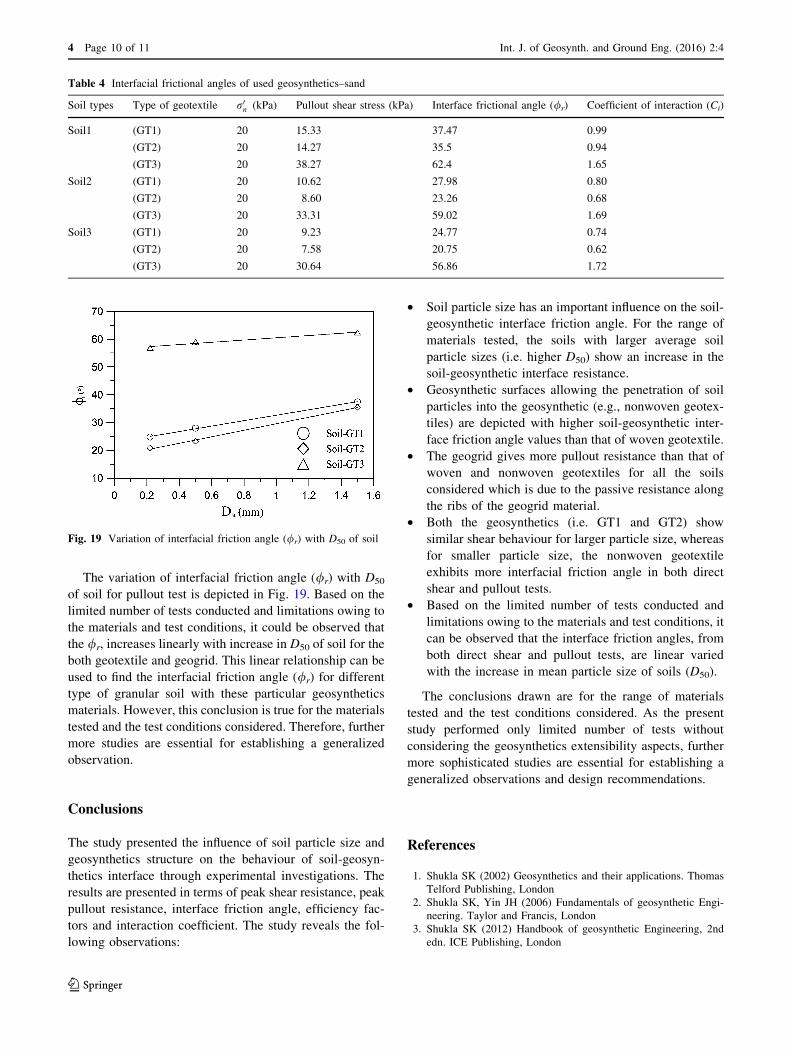
The variation of interfacial friction angle (/r) with D50
of soil for pullout test is depicted in Fig. 19. Based on the
limited number of tests conducted and limitations owing to
the materials and test conditions, it could be observed that
the /r, increases linearly with increase in D50 of soil for the
both geotextile and geogrid. This linear relationship can be
used to find the interfacial friction angle (/r) for different
type of granular soil with these particular geosynthetics
materials. However, this conclusion is true for the materials
tested and the test conditions considered. Therefore, further
more studies are essential for establishing a generalized
observation.
Conclusions
The study presented the influence of soil particle size and
geosynthetics structure on the behaviour of soil-geosyn-
thetics interface through experimental investigations. The
results are presented in terms of peak shear resistance, peak
pullout resistance, interface friction angle, efficiency fac-
tors and interaction coefficient. The study reveals the fol-
lowing observations:
• Soil particle size has an important influence on the soil-
geosynthetic interface friction angle. For the range of
materials tested, the soils with larger average soil
particle sizes (i.e. higher D50) show an increase in the
soil-geosynthetic interface resistance.
• Geosynthetic surfaces allowing the penetration of soil
particles into the geosynthetic (e.g., nonwoven geotex-
tiles) are depicted with higher soil-geosynthetic inter-
face friction angle values than that of woven geotextile.
• The geogrid gives more pullout resistance than that of
woven and nonwoven geotextiles for all the soils
considered which is due to the passive resistance along
the ribs of the geogrid material.
• Both the geosynthetics (i.e. GT1 and GT2) show
similar shear behaviour for larger particle size, whereas
for smaller particle size, the nonwoven geotextile
exhibits more interfacial friction angle in both direct
shear and pullout tests.
• Based on the limited number of tests conducted and
limitations owing to the materials and test conditions, it
can be observed that the interface friction angles, from
both direct shear and pullout tests, are linear varied
with the increase in mean particle size of soils (D50).
The conclusions drawn are for the range of materials
tested and the test conditions considered. As the present
study performed only limited number of tests without
considering the geosynthetics extensibility aspects, further
more sophisticated studies are essential for establishing a
generalized observations and design recommendations.
References
1. Shukla SK (2002) Geosynthetics and their applications. Thomas
Telford Publishing, London
2. Shukla SK, Yin JH (2006) Fundamentals of geosynthetic Engi-
neering. Taylor and Francis, London
3. Shukla SK (2012) Handbook of geosynthetic Engineering, 2nd
edn. ICE Publishing, London
Table 4 Interfacial frictional angles of used geosynthetics–sand
Soil types Type of geotextile r0n (kPa) Pullout shear stress (kPa) Interface frictional angle (/r) Coefficient of interaction (Ci)
Soil1 (GT1) 20 15.33 37.47 0.99
(GT2) 20 14.27 35.5 0.94
(GT3) 20 38.27 62.4 1.65
Soil2 (GT1) 20 10.62 27.98 0.80
(GT2) 20 8.60 23.26 0.68
(GT3) 20 33.31 59.02 1.69
Soil3 (GT1) 20 9.23 24.77 0.74
(GT2) 20 7.58 20.75 0.62
(GT3) 20 30.64 56.86 1.72
Fig. 19 Variation of interfacial friction angle (/r) with D50 of soil
4 Page 10 of 11 Int. J. of Geosynth. and Ground Eng. (2016) 2:4
123

4. Liu CN, Gilbert RB (2003) Simplified method for estimating
geosynthetic loads in landfill liner side slopes during filling.
Geosynth Int 10(1):24–33
5. Palmeira EM, Viana HNL (2003) Effectiveness of geogrids as
inclusions in cover soils of slopes of waste disposal areas. Geo-
text Geomembr 21(5):317–337
6. Elias V, Christopher BR (1996) Mechanically stabilized earth
walls and reinforced soil slopes—design and construction
guidelines. FHWA Demonstration Project 82. Federal Highway
Administration, McLean, VA, USA
7. ASTM D5321 (2002) Standard test method for determining the
coefficient of soil and geosynthetic or geosynthetic and geosyn-
thetic friction by the Direct Shear Method. ASTM Designation:
D5321-02, ASTM, USA
8. Lopes PC, Lopes MJ, Lopes ML (2001) Shear behaviour of
geosynthetics in the inclined plane test influence of soil particle
size and geosynthetic structure. Geosynth Int 8:327–342
9. Wu W, Wick H, Ferstl F, Aschauer F (2008) A tilt table device
for testing geosynthetic interfaces in centrifuge. Geotext Geo-
membr 26(1):31–38
10. Richards EA, Scott JD (1985) Soil geotextile frictional properties.
Second Canadian symposium on geotextiles and geomembranes,
Edmonton, 13–24
11. Lee KM, Manjunath VR (2000) Soil-geotextile interface friction
by direct shear tests. Can Geotech J 37:238–252
12. Mahmood A, Zakaria N, Ahmad F (2000) Studies on geotex-
tile/soil interface shear behaviour. Electron J Geotech Eng, 5
13. Bergado DT, Ramana GV, Sia HI, Varun HI (2006) Evaluation of
interface shear strength of composite liner system and stability
analysis for a landfill lining system in Thailand. Geotext Geo-
membr 24:371–393
14. ASTM D6706 (2001) Standard test method for measuring
geosynthetic pullout resistance in soil. ASTM Designation:
D6706-01, ASTM, USA
15. Giroud JP (1986) From geotextiles to geosynthetics: a revolution
in geotechnical engineering. In: Proceedings of the 3rd interna-
tional conference on geotextiles, Vienna, Austria, Vol 1: 1–18
16. Bergado DT, Sampaco, CL, Shivashankar R, Alfaro MC,
Anderson LR, Balasubramaniam AS (1991) Performance of a
welded wire wall with poor quality backfills on soft clay. ASCE
Geotechnical, 908–922. Special Publication No. 27
17. Touahamia M, Sivakumar V, McKelvey D (2002) Shear strength
of reinforced-recycled material. Constr Build Mater 16:331–339
18. Jewell RA, Milligan GWE, Sarsby RW, Dubois D (1984) Inter-
action between soil and geogrids, polymer grid reinforcement,
Thomas Telford Ltd., In: Proceedings of a conference held in
London, United Kingdom, March 1984, pp 18–30
19. Goodhue MJ, Edil TB, Benson CH (2001) Interaction of foundry
sands with geosynthetics. J Geotech Geoenviron Eng ASCE
124(4):353–362
20. Sugimoto M, Alagiyawanna AMN (2003) Pullout behaviour of
geogrid by test and numerical analysis. J Geotech Geoenviron
Eng ASCE 129(4):361–371
21. Desai FCS, El-Hoseiny KE (2005) Prediction of field behaviour
of reinforced soil wall using advanced constitutive model.
J Geotech Geoenviron Eng ASCE 131(6):729–739
22. Moraci N, Gioffre D (2006) A simple method to evaluate the
pullout resistance of extruded geogrids embedded in a compacted
granular soil. Geotext Geomembr 24(3):198–199
23. Palmeira EM, Milligan GWE (1989) Scale and other factors
affecting the results of pull-out tests of grid buried in sand.
Geotechnique 11(3):511–524
24. Moraci N, Recalcati PG (2006) Factors affecting the pullout
behaviour of extruded geogrids embedded in compacted granular
soil. Geotext Geomembr 24(22):220–242
25. Palmeira EM (2009) Soil-geosynthetic interaction: modelling and
analysis. Geotext Geomembr 27(5):368–390
26. Toufigh V, Saeid F, Toufigh V, Ouria A, Desai CS, Saadatmanesh
H (2013) Laboratory study of soil-CFRP interaction using pull-
out test. Geomech Geoeng 9(3):208–214
27. Cazzuffi D, Moraci N, Calvarano LS, Cardile G, Gioffre D,
Recalcati P (2014) European experience in pullout tests: Part
2-The influence of vertical effective stress and of geogrid length
on interface behaviour under pullout conditions. Geosynthetics
32(2):40–50
28. Moraci N, Cardile G, Gioffre D, Mandaglio MC, Calvarano LS,
Carbone L (2014) Soil geosynthetic interaction: design parame-
ters from experimental and theoretical analysis. Transp Infras-
truct Geotechnol 1(2):165–227
29. Hsieh CW, Chen GH, Jeng-Han W (2011) The shear behaviour
obtained from the direct shear and pullout tests for different poor
graded Soil-geosynthetic systems. J Geoeng 6:15–26
30. ASTM D3080 (2011) Standard test method for direct shear test of
soils under consolidated drained conditions. ASTM International,
West Conshohocken, PA
31. Lopes ML, Silvano R (2010) Soil/geotextile interface behaviour in
direct shear and pulloutmovements. GeotechGeol Eng 28:791–804
32. Prashanth V, Krishna AM (2016) Pullout tests using modified
Direct Shear Test Setup for measuring soil-geosynthetic inter-
action parameters, International Journal of Geosynthetics and
Ground Engineering. (submitted)
33. ASTM D6913-04(2009) Standard Test Methods for Particle-Size
Distribution (Gradation) of Soils Using Sieve Analysis.American
Society for Testing and Materials, West Conshohocken, PA
34. ASTM D4253 (2006) Standard test methods for maximum index
density and unit weight of soils and calculation of relative den-
sity. ASTM International, West Conshohocken, PA, 2006, Vol.
04. 08
35. ASTM D4254 (2006) Standard test methods for minimum index
density and unit weight of soils and calculation of relative den-
sity. ASTM International, West Conshohocken, PA, 2006, Vol.
04. 08
36. ASTM standard D0854 (2006) Standard test methods for specific
gravity of soil solids by water pycnometer. ASTM international,
West Conshohocken, PA, 2006, vol. 04.09
37. ASTM D 2487 (2006) Standard practices for classification of
soils for engineering purposes (Unified Soil Classification Sys-
tem). ASTM International, West Conshohocken, PA, 2006, Vol.
04. 08
38. ASTM D4595 (2009) standard test method for tensile properties
of geotextiles by the wide-width strip method. American Society
for Testing and Materials, West Conshohocken, PA
39. ASTM D5261 (1996) Standard test method for measuring mass
per unit area of geotextiles. American Society for Testing and
Materials, West Conshohocken, PA
Int. J. of Geosynth. and Ground Eng. (2016) 2:4 Page 11 of 11 4
123