16th Int Symp on Applications of Laser Techniques to Fluid Mechanics Lisbon, Portugal, 09-12 July, 2012
- 1 -
Experimental Investigation of Cavitating Flow about a Cascade of NACA0015
Series Hydrofoils
Aleksandra Yu. Kravtsova1,2
, Dmitriy M. Markovich1,2,*
, Konstantin S. Pervunin1,2
,
Mikhail V. Timoshevskiy1,2
1: Institute of Thermophysics SB RAS, 1, Lavrentyev Ave., 630090, Novosibirsk, Russia
2: Novosibirsk State University, 2, Pirogova Str., 630090, Novosibirsk, Russia
* correspondent author: [email protected]
Abstract The main emphasis of the work is put on experimental study of spatial structure and dynamics of gas-vapor cavities and turbulent structure of cavitating turbulent flows around the plate with rounded nose, the NACA0015 hydrofoil and the cascade of three identical NACA0015 hydrofoils. The flows were investigated for different angles of incidence α = 0, 3, 6 and 9º with variation of cavitation number σ from 6 for the cascade down to 0.6 for the single hydrofoil. As a result, the full set of statistical moments of turbulent fluctuations (including the third-order ones) was calculated for all the regimes. Comparison of turbulent characteristics was performed for different cavity types and the main peculiarities of the flows were pointed out.
1. Introduction
The problems relating to cavitation and erosion caused by cavitation belong to the most complex
fundamental challenges of modern hydrodynamics. The most important requirements for safe and
efficient operation of hydropower systems are reliability and longevity of the equipment used. As a rule,
operation of real power systems, such as hydroturbines, and hydrotechnical equipment constructions,
e.g. supply ducts and draft tubes of hydropower plants, are accompanied, in practice, by unsteady
turbulent flows of complex geometry that are often two-phase. A rise of operation time and material
endurance, increase of hydromachinery efficiency and degree of its safety are impossible without
studying physical mechanisms of hydrodynamic processes, where large-scale vortices (LSV) and
cavitation play the key role. Interaction of LSV with gas-vapor dispersed phase is a complex non-linear
process strongly influencing cavitation erosion on hydraulic units and pulsation characteristics of the
flows due to mutual impact of continuous and dispersed phases. Trajectories of dispersed phase particles
(bubbles) can be affected by local non-equilibrium turbulence in liquid (turbulent dispersion), while the
bubbles motion significantly changes properties of turbulent fluctuations in the carrier phase (turbulence
modulation) due to a number of physical mechanisms. As known, the occurrence of resonance effects
can lead to excessive vibration loads and, as a consequence, failure of hydraulic equipment or, at worst,
even emergencies. Thus, it becomes obvious that simultaneous investigation of dynamics of partial
cavities and LSV developing in shear-layers and study of interaction of LSV with gas-vapor dispersed
phase in unsteady turbulent two-phase flows are rather important problems from the standpoint of
fundamental science and applied research (e.g. in the field of improvement of modern hydrotechnical
equipment constructions). In order to forecast cavitation erosion and have an ability to control cavitation,
the detailed experimental data on turbulent structure of flows, i.e. spatial distributions of instantaneous
velocity, vorticity and pressure fields and turbulent characteristics, is of a high interest. It should be also
noted that developed and suggested methods on reducing the negative effects of cavitation have to
satisfy the requirement of power loss minimization. This can be implemented only if the profound
knowledge about the hydrodynamic processes occurring in hydroturbine settings is available.
Presently, one can find a number of papers in literature that are devoted to experimental modeling of
cavitating flows around 2D hydrofoils. However, experimental results obtained in works by different
authors often diverge. Generally, the main results represent visual observations and regime maps with
qualitative descriptions, point pressure measurements and, sometimes, velocity distributions. In some
works, effects of local volume fraction of vapor phase within cavity and in a wake past a foil, liquid

16th Int Symp on Applications of Laser Techniques to Fluid Mechanics Lisbon, Portugal, 09-12 July, 2012
- 2 -
temperature, etc., on spatial structure and dynamics of partial cavities were also studied. Depending on
flow conditions (hydrofoil surface shape, velocity and pressure fields, at alias), one can distinguish a
variety of cavitation patterns (bubble, vortex, cloud and supercavitation, etc.). All types of gas-vapor
cavities are divided into partial and super cavities. Partial cavities occur when a cavity closes on the
cavitating surface, while a super cavity closes downstream in the wake of the cavitating object. Partial
cavitation has further classification (see Laberteaux and Ceccio (2001) for more details). In that work,
the authors showed the essential influence of adverse pressure gradients on formation of a turbulent
wake. With this, cloud cavitation arises when a large portion of cavity filled with re-entrant fluid breaks
off, forming a cavitation cloud. Cervone et al. (2006) studied the impact of thermal cavitation effects on
the onset of various forms of cavitation and instabilities. As a result, cavitation regimes were divided
into three different zones, which correspond to different behaviours of the upstream pressure frequency
spectrum.
When a sheet cavity reaches a certain dimension, periodic oscillations of cavity appear, this process is
accompanied by cavity (in the form of clouds) shedding downstream. In the paper by Kubota et al.
(1989), the authors showed that the cloud cavity consists of a large-scale vortex and cluster of a bulk of
small vapor bubbles situated in the centre of the vortex, using Laser Doppler Anemometry approach
together with conditional sampling method. In various experiments (e.g. George et al. (2000)), it was
revealed that oscillations of the cloud cavities have very close Strouhal numbers. Further studies proved
a correlation between cloud cavitation and re-entrant jet generated in the region of the cavity closure as a
result of the action of opposite pressure gradient (see Callenaere et al. (2001) and Kawanami et al.
(1997)).
Nevertheless, in spite of a large amount of works on investigation of cavitating flows, detailed
quantitative information required for optimisation and verification of existing mathematical models is
still extremely restricted even for simplified conditions. This is because of difficulty or even
impossibility of performing experiments under the full-scale conditions and high costs of tests at
expensive laboratory setups. Due to the complexity of cavitating turbulent flows, comprehensive
experimental information on the hydrodynamic structure of such flows is extremely useful from the
standpoint of development and verification of modern numerical approaches for simulation of
sufficiently anisotropic turbulent multi-phase flows. In terms of elaboration of mathematical models
describing inception and development of cavitation, the main interest is focused on complex
experimental investigations under the simplified geometric conditions (Venturi nozzles, scaled-down
shaped bodies, e.g. NACA series hydrofoils, etc.). Acquisition of systematic experimental data for
various cavitation regimes is a crucial problem.
Experimental setup
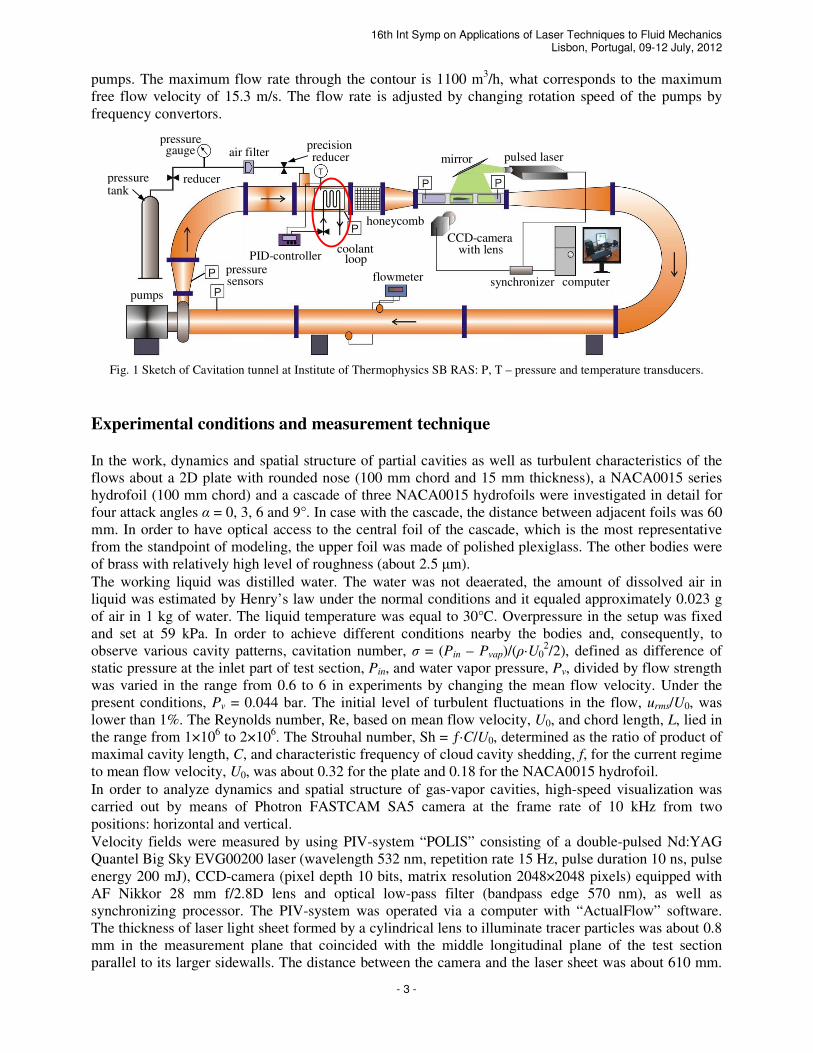
Experiments were carried out at the Cavitation tunnel of the Institute of Thermophysics SB RAS, which
represents a closed hydrodynamic circuit. The setup is equipped with two centrifugal pumps, ultrasonic
flowmeter, temperature and pressure sensors (see Fig. 1). Dimensions of the tunnel are as follows
(LxHxW): 8.4x2.2x1.1 m. Its working section consists of heat exchanger, honeycomb, confuser, test
section and diffuser. The temperature of the working liquid is maintained constant by means of the
temperature control system consisting of the temperature sensor and electromagnetic valve driven by a
PID control. The honeycomb cells are of 25×25 mm cross-section and 500 mm length. The confuser of
790 mm length is made by the fourth-power polynomial profile; the degree of flow compression is equal
to 16. The test section is a channel of 80×250 mm rectangular cross-section and 1.3 m length with flat
parallel sidewalls. The sidewalls of the test section are equipped with transparent windows to perform
visual observations. The divergence angle of diffuser sidewalls adjoining the smaller sidewalls of the
test section is 3.5°, while those abutting upon the larger sidewalls are parallel. A special shaft is located
above the heat exchanger in order to regulate the static pressure inside the circuit. The reverse channel of
the setup includes a swivel elbow on 180 degrees with 750 mm radius and 250x250 mm cross-section,
straight pipeline of 300 mm diameter, flow-measuring part and duct supplying working liquid to the
16th Int Symp on Applications of Laser Techniques to Fluid Mechanics Lisbon, Portugal, 09-12 July, 2012
- 3 -
pumps. The maximum flow rate through the contour is 1100 m3/h, what corresponds to the maximum
free flow velocity of 15.3 m/s. The flow rate is adjusted by changing rotation speed of the pumps by
frequency convertors.
Fig. 1 Sketch of Cavitation tunnel at Institute of Thermophysics SB RAS: P, T – pressure and temperature transducers.
Experimental conditions and measurement technique
In the work, dynamics and spatial structure of partial cavities as well as turbulent characteristics of the
flows about a 2D plate with rounded nose (100 mm chord and 15 mm thickness), a NACA0015 series
hydrofoil (100 mm chord) and a cascade of three NACA0015 hydrofoils were investigated in detail for
four attack angles α = 0, 3, 6 and 9°. In case with the cascade, the distance between adjacent foils was 60
mm. In order to have optical access to the central foil of the cascade, which is the most representative
from the standpoint of modeling, the upper foil was made of polished plexiglass. The other bodies were
of brass with relatively high level of roughness (about 2.5 µm).
The working liquid was distilled water. The water was not deaerated, the amount of dissolved air in
liquid was estimated by Henry’s law under the normal conditions and it equaled approximately 0.023 g
of air in 1 kg of water. The liquid temperature was equal to 30°C. Overpressure in the setup was fixed
and set at 59 kPa. In order to achieve different conditions nearby the bodies and, consequently, to
observe various cavity patterns, cavitation number, σ = (Pin – Pvap)/(ρ·U02/2), defined as difference of
static pressure at the inlet part of test section, Pin, and water vapor pressure, Pv, divided by flow strength
was varied in the range from 0.6 to 6 in experiments by changing the mean flow velocity. Under the
present conditions, Pv = 0.044 bar. The initial level of turbulent fluctuations in the flow, urms/U0, was
lower than 1%. The Reynolds number, Re, based on mean flow velocity, U0, and chord length, L, lied in
the range from 1×10⁶ to 2×10
6. The Strouhal number, Sh = ƒ·C/U0, determined as the ratio of product of
maximal cavity length, C, and characteristic frequency of cloud cavity shedding, f, for the current regime
to mean flow velocity, U0, was about 0.32 for the plate and 0.18 for the NACA0015 hydrofoil.
In order to analyze dynamics and spatial structure of gas-vapor cavities, high-speed visualization was
carried out by means of Photron FASTCAM SA5 camera at the frame rate of 10 kHz from two
positions: horizontal and vertical.
Velocity fields were measured by using PIV-system “POLIS” consisting of a double-pulsed Nd:YAG
Quantel Big Sky EVG00200 laser (wavelength 532 nm, repetition rate 15 Hz, pulse duration 10 ns, pulse
energy 200 mJ), CCD-camera (pixel depth 10 bits, matrix resolution 2048×2048 pixels) equipped with
AF Nikkor 28 mm f/2.8D lens and optical low-pass filter (bandpass edge 570 nm), as well as
synchronizing processor. The PIV-system was operated via a computer with “ActualFlow” software.
The thickness of laser light sheet formed by a cylindrical lens to illuminate tracer particles was about 0.8
mm in the measurement plane that coincided with the middle longitudinal plane of the test section
parallel to its larger sidewalls. The distance between the camera and the laser sheet was about 610 mm.
pumps
honeycomb
flowmeter
mirror pulsed laser
synchronizer
reducer
coolantloopPID-controller
computer
precisionreducer
pressuretank
pressuresensors
air filter
with lensCCD-camera
pressuregauge
16th Int Symp on Applications of Laser Techniques to Fluid Mechanics Lisbon, Portugal, 09-12 July, 2012
- 4 -
The size of the measurement area was about 285×250 mm. In order to perform PIV-measurements in
cavitating flows correctly, the fluorescent tracers (average size of 10 µm, wavelength range of 550–700
nm) were added into the working liquid.
The velocity fields were calculated, using the iterative cross-correlation algorithm with continuous
window shift and deformation, 50% overlap of interrogation windows was applied as well. Sub-pixel
interpolation of a cross-correlation peak was performed over three points, using one-dimensional
approximation by the Gaussian function. In order to have relatively large dynamic range, the initial size
of interrogation window was chosen to be 64×64 pixels. The size of the final interrogation window was
32×32 pixels in order to have relatively low level of noise. Inaccuracy of the offset determination did not
exceed 0.1 pixels. Thus, the velocity measurement errors were 1% and 4% for tracer offsets of 8 and 2
pixels, respectively. Obtained instantaneous velocity vector fields were validated with two procedures
applied successively: Peak Validation with threshold 2.0 and Adaptive 7x7 Median Filter.
Results and discussion
All the results below are given only for α = 3°. This value of the attack angle was selected as the most
demonstrative for qualitative and quantitative description of characteristic features of cavitating flows.
In all fields of turbulent characteristics, the reference point coincides with the leading edge of the
hydrofoil in the measurement plane at α = 0°.
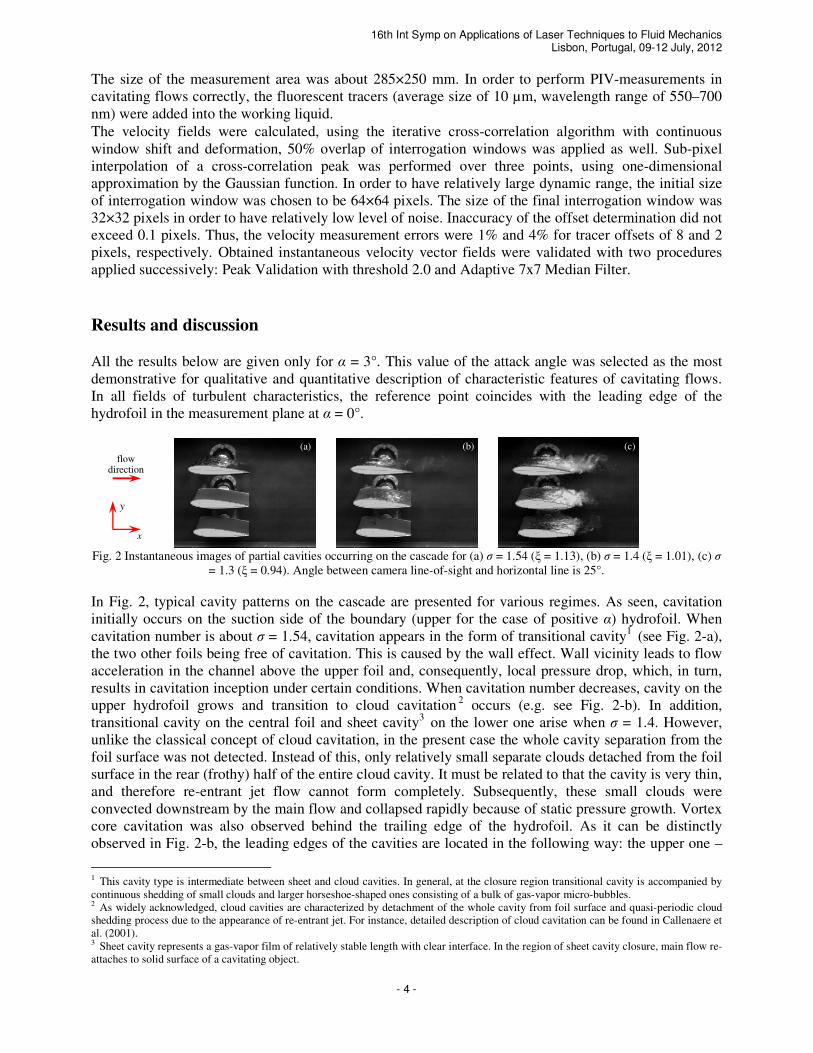
Fig. 2 Instantaneous images of partial cavities occurring on the cascade for (a) σ = 1.54 (ξ = 1.13), (b) σ = 1.4 (ξ = 1.01), (c) σ
= 1.3 (ξ = 0.94). Angle between camera line-of-sight and horizontal line is 25°.
In Fig. 2, typical cavity patterns on the cascade are presented for various regimes. As seen, cavitation
initially occurs on the suction side of the boundary (upper for the case of positive α) hydrofoil. When
cavitation number is about σ = 1.54, cavitation appears in the form of transitional cavity1 (see Fig. 2-a),
the two other foils being free of cavitation. This is caused by the wall effect. Wall vicinity leads to flow
acceleration in the channel above the upper foil and, consequently, local pressure drop, which, in turn,
results in cavitation inception under certain conditions. When cavitation number decreases, cavity on the
upper hydrofoil grows and transition to cloud cavitation2 occurs (e.g. see Fig. 2-b). In addition,
transitional cavity on the central foil and sheet cavity3 on the lower one arise when σ = 1.4. However,
unlike the classical concept of cloud cavitation, in the present case the whole cavity separation from the
foil surface was not detected. Instead of this, only relatively small separate clouds detached from the foil
surface in the rear (frothy) half of the entire cloud cavity. It must be related to that the cavity is very thin,
and therefore re-entrant jet flow cannot form completely. Subsequently, these small clouds were
convected downstream by the main flow and collapsed rapidly because of static pressure growth. Vortex
core cavitation was also observed behind the trailing edge of the hydrofoil. As it can be distinctly
observed in Fig. 2-b, the leading edges of the cavities are located in the following way: the upper one –
1 This cavity type is intermediate between sheet and cloud cavities. In general, at the closure region transitional cavity is accompanied by
continuous shedding of small clouds and larger horseshoe-shaped ones consisting of a bulk of gas-vapor micro-bubbles. 2 As widely acknowledged, cloud cavities are characterized by detachment of the whole cavity from foil surface and quasi-periodic cloud
shedding process due to the appearance of re-entrant jet. For instance, detailed description of cloud cavitation can be found in Callenaere et
al. (2001). 3 Sheet cavity represents a gas-vapor film of relatively stable length with clear interface. In the region of sheet cavity closure, main flow re-
attaches to solid surface of a cavitating object.
(a) (b) (c)
x
y
flowdirection

16th Int Symp on Applications of Laser Techniques to Fluid Mechanics Lisbon, Portugal, 09-12 July, 2012
- 5 -
right behind the leading edge of the foil, the central and lower ones – at distances of 0.05L and 0.12L
downstream from the leading edges of the corresponding foils. This is likely to be connected with
vertical pressure gradient that is created by the foils mounted at non-zero incidence angle. Since cloud
cavities are of quasi-periodical nature, pulsations of the cloud cavity closure on the upper foil produce
those of the transitional and sheet cavities (Sh = 0.15), though the transitional and sheet cavities are
relatively stable in case of a single hydrofoil. This occurs due to variation of pressure field in the whole
flow imposed by cloud cavitation quasi-periodic behaviour. With further reduction in cavitation number
(see Fig. 2-c), the cavities on all the foils continue to rise so that, when σ = 1.3, they all turn into cloud
cavities (Sh = 0.14).
Fig. 3 Temporal evolution of the cavities within one cycle of quasi-periodical process of cavity extent pulsations for σ = 1.4
(Sh = 0.15). Time delay is 8.4 ms.
Fig. 4 Temporal evolution of the cavities within one cycle of quasi-periodical process of cavity extent pulsations for σ = 1.3
(Sh = 0.14). Time delay is 9.9 ms.
Development of the cavities during one period of cavity extent pulsations is demonstrated in Fig. 3 and 4
for two regimes. For σ = 1.4, dynamics of cavity length is as follows. First, the upper cavity rises up to
its maximum length of about L, then its growth stops for a while and, simultaneously, the central and
lower cavities start to rise until they reach their maximum extent about 0.7L and 0.34L, respectively.
After that, the rear half of the upper cavity spontaneously begins to break off (this process is described
above) and the upper cavity length decreases down to 0.5L. Thereafter, the central and lower cavities
diminish. The minimum length of the central cavity is 0.3L, but the lower one disappears totally.
Afterwards, this process repeats. For σ = 1.3, the cavity dynamics changes. All the cavities grow
simultaneously until they achieve the lengths of 0.85L, 0.7L and 0.6L, respectively. Then only the upper
cavity continues to rise to reach the trailing edge of the foil. After that, the central and lower cavities
overtake the upper one and achieve the trailing edges of the corresponding foils as well. At this moment,
free traveling bubble cavitation arises in the channels between the foils and above the upper hydrofoil.
(a) (b) (c) (d)
(e) (f) (g) (h)
(a) (b) (c) (d)
(e) (f) (g) (h)

16th Int Symp on Applications of Laser Techniques to Fluid Mechanics Lisbon, Portugal, 09-12 July, 2012
- 6 -
Cavities on the pressure sides of the upper and central foils were also registered. Thereafter, the upper
cavity diminishes down to 0.5L and, later, the two other cavities start to collapse until they quite
disappear. Usually the central cavity disappears later than the lower one, but sometimes it happens
inversely. After this moment, the upper cavity extent decreases down to 0.25L. Afterwards, this process
repeats.
Basing on the ensemble of 5000 instantaneous velocity fields, 2D distributions of the mean velocity (see
Fig. 5-7), turbulent kinetic energy (see Fig. 8-10) and third-order statistical moments of turbulent
fluctuations (see Fig. 11-13) were calculated. Because of the laser sheet spread from the top along the
symmetry plane of test section, the flow area below the foils was shadowed and, therefore, is masked
grey in the figures. The flow direction is to the right.
In Fig. 5-7, one can observe that, in front of the leading edge, the flow locally decelerates and the region
of slowdown shifts to the pressure side of the foils in all the cases. The minimum values of mean
velocity in cross-section x/L = 0 are almost identical for all the regimes and equal to Umin/U0 ≈ 0.69 for
the plate, 0.73 for the NACA0015 hydrofoil and 0.83 for the center foil of the cascade. In a region above
the upper side of the foils, mean velocity becomes higher than the mean flow velocity. When σ
decreases, maximum of the mean velocity becomes slightly lower and shifts gradually downstream:
from Umax/U0 ≈ 1.54 at point (x/L = 0.17; y/L = 0.13) for σ = 2.56 to Umax/U0 ≈ 1.47 at point (x/L = 0.26;
y/L = 0.18) for σ = 1.56 in case with the plate; from Umax/U0 ≈ 1.35 at point (x/L = 0.2; y/L = 0.12) for σ
= 1.36 to Umax/U0 ≈ 1.33 at point (x/L = 0.38; y/L = 0.12) for σ = 0.97 in case with the NACA0015 foil;
from Umax/U0 ≈ 1.45 at point (x/L = 0.23; y/L = 0.07) for σ = 1.73 to Umax/U0 ≈ 1.44 at point (x/L = 0.38;
y/L = 0.09) for σ = 1.3 in case with the central foil of the cascade. This fact can be explained in the
following way. As known, decrease in cavitation number results as in transition to another cavity type
so, for a current cavity type, extension of the cavity and growth of cavity clouds that separate from the
cavity and are involved downstream by the main flow. This behaviour is accompanied by pulsations of
the cavity at its closure. Consequently, pulsations at the cavity trailing edge lead to increase of liquid
velocity fluctuations (see Fig. 8-10) and, finally, to the reduction of the mean velocity values in this
region.
Fig. 5 2D distributions of longitudinal (x-direction) component of the mean velocity about the plate: (a) σ = 1.92, C/L = 0.2, (b) σ = 1.76,
C/L = 0.3, (c) σ = 1.56, C/L = 0.5, Sh = 0.32.
Fig. 6 2D distributions of longitudinal (x-direction) component of the mean velocity about the NACA0015 foil: (a) σ = 1.22, C/L = 0.5, (b)
σ = 1.05, C/L = 1, (c) σ = 0.97, C/L = 1.1, Sh = 0.18.
Fig. 7 2D distributions of longitudinal (x-direction) component of the mean velocity about the cascade: (a) σ = 1.54 (ξ = 1.13), (b) σ = 1.4 (ξ
= 1), (c) σ = 1.3 (ξ = 0.94).
0U U
x Lx L
y
L
y
L
x L
(b) (c)(a)y
L
0
U
U
(b) (c)(a)y
L
x L x L
y
L
x L
y
L
(b) (c)(a)
x L
y
L
x L
y
L
y
L
x L
0U U
16th Int Symp on Applications of Laser Techniques to Fluid Mechanics Lisbon, Portugal, 09-12 July, 2012
- 7 -
Downstream from the region of higher values of mean velocity along the suction side of the hydrofoil,
the mean velocity drops below the values of mean flow velocity. For the NACA0015 hydrofoil, this
takes place only at the trailing edge of the foil in the wake (see Fig. 6-a). The appearance of a region of
lower values behind the body is directly connected to the flow separation from the foil surface and flow
turbulization. As σ diminishes, the point of flow separation at the suction side slightly moves upstream
and transverse extension of the turbulent wake also rises up to 0.14L for the cloud cavitation (see Fig. 6-
c). In case with the plate, the transverse dimension of the wake is significantly larger owing to its bluff
shape and reaches 0.23L. This is caused by generation of large-scale vortex structures in the shear layers
over the cloud cavity. Here it should be noted that this behaviour is averaged, i.e., at a certain moment,
flow detachment from the surface occurs in some region (its extensions depend on the cavity type)
around the separation point in the mean velocity fields.
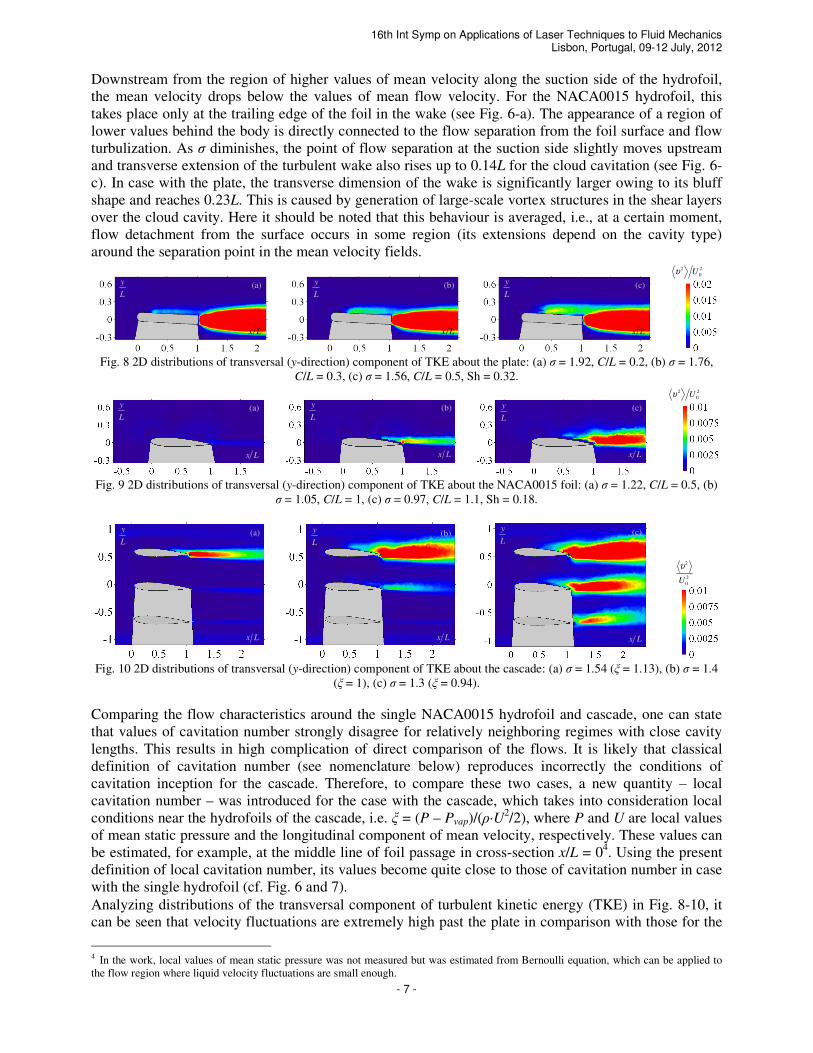
Fig. 8 2D distributions of transversal (y-direction) component of TKE about the plate: (a) σ = 1.92, C/L = 0.2, (b) σ = 1.76,
C/L = 0.3, (c) σ = 1.56, C/L = 0.5, Sh = 0.32.
Fig. 9 2D distributions of transversal (y-direction) component of TKE about the NACA0015 foil: (a) σ = 1.22, C/L = 0.5, (b)
σ = 1.05, C/L = 1, (c) σ = 0.97, C/L = 1.1, Sh = 0.18.
Fig. 10 2D distributions of transversal (y-direction) component of TKE about the cascade: (a) σ = 1.54 (ξ = 1.13), (b) σ = 1.4
(ξ = 1), (c) σ = 1.3 (ξ = 0.94).
Comparing the flow characteristics around the single NACA0015 hydrofoil and cascade, one can state
that values of cavitation number strongly disagree for relatively neighboring regimes with close cavity
lengths. This results in high complication of direct comparison of the flows. It is likely that classical
definition of cavitation number (see nomenclature below) reproduces incorrectly the conditions of
cavitation inception for the cascade. Therefore, to compare these two cases, a new quantity – local
cavitation number – was introduced for the case with the cascade, which takes into consideration local
conditions near the hydrofoils of the cascade, i.e. ξ = (P – Pvap)/(ρ·U2/2), where P and U are local values
of mean static pressure and the longitudinal component of mean velocity, respectively. These values can
be estimated, for example, at the middle line of foil passage in cross-section x/L = 04. Using the present
definition of local cavitation number, its values become quite close to those of cavitation number in case
with the single hydrofoil (cf. Fig. 6 and 7).
Analyzing distributions of the transversal component of turbulent kinetic energy (TKE) in Fig. 8-10, it
can be seen that velocity fluctuations are extremely high past the plate in comparison with those for the
4 In the work, local values of mean static pressure was not measured but was estimated from Bernoulli equation, which can be applied to
the flow region where liquid velocity fluctuations are small enough.
2 2
0Uυ
(c)(a) (b) y
L
y
L
y
L
x L x L x L
y
L
x L
(b)y
L
x L
y
L
x L
(a) (c)
2
2
0U
υ
2 2
0Uυ
(c)(a) (b) y
L
y
L
y
L
x L x L x L
16th Int Symp on Applications of Laser Techniques to Fluid Mechanics Lisbon, Portugal, 09-12 July, 2012
- 8 -
hydrofoil. The fields for the single foil and the cascade show that turbulent wakes behind the central foil
in the cascade and the single foil are quite similar for all regimes. In whole, cavitation number decrease
leads to the growth of liquid velocity fluctuations, except for the region past the plate: behind the leading
edge of the plate, max(⟨υ2⟩/U0
2) ≈ 0.006 at point (x/L = 0.24; y/L = 0.13) for σ = 2.56 and max(⟨υ
2⟩/U0
2)
≈ 0.014 at point (x/L = 0.53; y/L = 0.15) for σ = 1.56; past the plate, max(⟨υ2⟩/U0
2) ≈ 0.4 at point (x/L =
1.19; y/L = 0.02) for σ = 2.56 and max(⟨υ2⟩/U0
2) ≈ 0.31 at point (x/L = 1.19; y/L = 0.02) for σ = 1.56; at
the trailing edge of the single foil, max(⟨υ2⟩/U0
2) ≈ 0.002 at point (x/L = 1.02; y/L = 0.02) for σ = 1.36
and max(⟨υ2⟩/U0
2) ≈ 0.02 at point (x/L = 1.2; y/L = 0.02) for σ = 0.97; behind the central foil of the
cascade, max(⟨υ2⟩/U0
2) ≈ 0.002 at point (x/L = 1.66; y/L = -0.08) for σ = 1.73 and max(⟨υ
2⟩/U0
2) ≈ 0.023
at point (x/L = 1.23; y/L = -0.06) for σ = 1.3. Thus, comparing the fields in Fig. 8-10, one can conclude
that transition to cloud cavitation leads to global modification of the turbulent structure of the flow. As
seen, ⟨υ2⟩ increases about 10 times for the case with the NACA0015 hydrofoil, however, the point where
the maximum value of velocity fluctuations is reached moves downstream for the single foil and
upstream for the cascade when transition to cloud cavitation occurs.
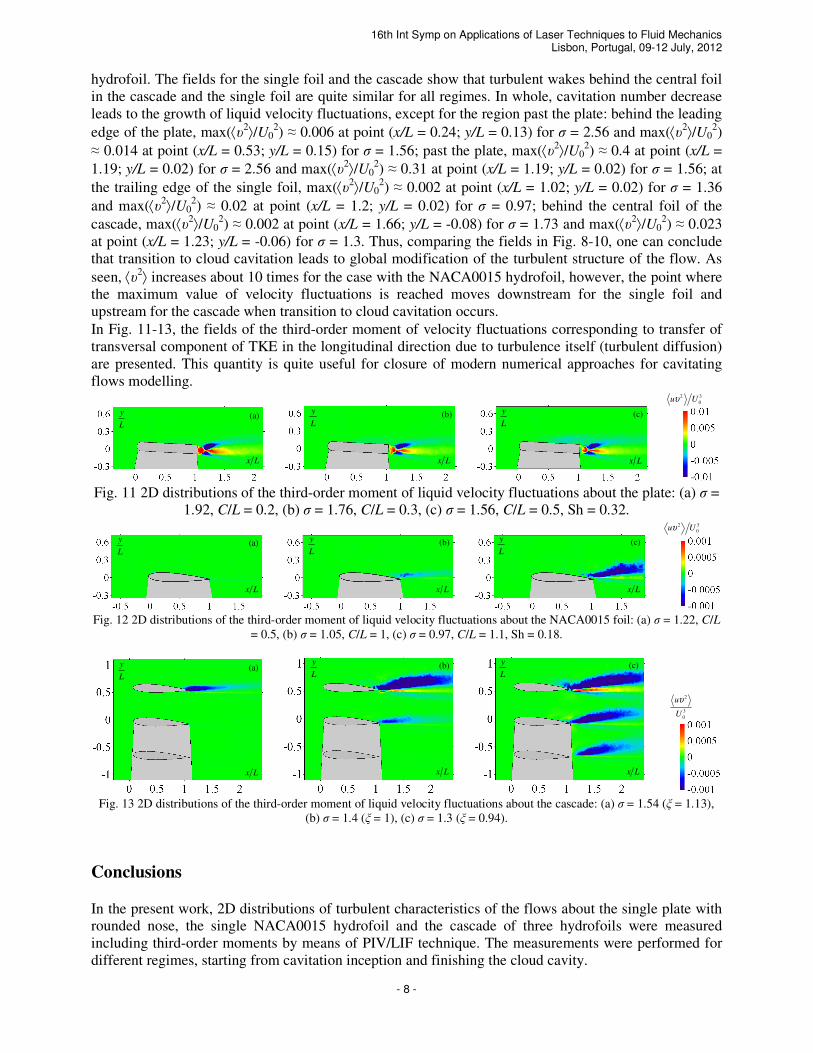
In Fig. 11-13, the fields of the third-order moment of velocity fluctuations corresponding to transfer of
transversal component of TKE in the longitudinal direction due to turbulence itself (turbulent diffusion)
are presented. This quantity is quite useful for closure of modern numerical approaches for cavitating
flows modelling.
Fig. 11 2D distributions of the third-order moment of liquid velocity fluctuations about the plate: (a) σ =
1.92, C/L = 0.2, (b) σ = 1.76, C/L = 0.3, (c) σ = 1.56, C/L = 0.5, Sh = 0.32.
Fig. 12 2D distributions of the third-order moment of liquid velocity fluctuations about the NACA0015 foil: (a) σ = 1.22, C/L
= 0.5, (b) σ = 1.05, C/L = 1, (c) σ = 0.97, C/L = 1.1, Sh = 0.18.
Fig. 13 2D distributions of the third-order moment of liquid velocity fluctuations about the cascade: (a) σ = 1.54 (ξ = 1.13),
(b) σ = 1.4 (ξ = 1), (c) σ = 1.3 (ξ = 0.94).
Conclusions
In the present work, 2D distributions of turbulent characteristics of the flows about the single plate with
rounded nose, the single NACA0015 hydrofoil and the cascade of three hydrofoils were measured
including third-order moments by means of PIV/LIF technique. The measurements were performed for
different regimes, starting from cavitation inception and finishing the cloud cavity.
2
3
0
u
U
υ
y
L
x L
(b) (c)(a)y
L
x L
y
L
x L
y
L
x L
(b) (c)(a) y
L
x L
y
L
x L
2 3
0u Uυ
y
L
x L
(b) (c)(a)y
L
x L
y
L
x L
2 3
0u Uυ

16th Int Symp on Applications of Laser Techniques to Fluid Mechanics Lisbon, Portugal, 09-12 July, 2012
- 9 -
High-speed visualization allowed to investigate qualitatively the dynamics and spatial structures of the
cavities occurring on the cascade. When transition to cloud cavitation occurs, the hydrodynamic
structure of the entire flow undergoes significant changes as compared to the cavitation-inception case.
In the mean, progressive growth of gas-vapor cavity results in gradual shift of the flow separation point
upstream. The cloud cavity leads to formation of an intense turbulent wake behind the cavity closure
region, significant increase in its transverse extent, as well as intensification of turbulent fluctuations
(about 3 times) due to generation of large-scale vortex structures in the shear layer over the vapor cavity.
In general, the work shows that, due to nonlinear nature of turbulent flows, cloud cavitation substantially
changes the global pattern of the flow around the hydrofoil. With this, it becomes obvious that modern
numerical simulation approaches should take into account these features of turbulent cavitating flows.
For more complete analysis of the flow structure, it is obviously necessary to measure simultaneously
the velocity of both phases as well as the concentration of the gas-vapor phase. Such a study will be
possible by using modern sophisticated imaging techniques (one of them is PFBI, for more detailed
description see Akhmetbekov et al. (2010) and Dulin et al. (2011)).
Acknowledgements
The work was partially supported by RFBR (grant N 10-08-01304-а) and Government of the Russian
Federation (grant N 11.G34.31.0046, leading scientist – K. Hanjalic, Novosibirsk State University).
References
Akhmetbekov Ye K, Alekseenko S V, Dulin V M, Markovich D M, Pervunin K S (2010) Planar
fluorescence for round bubble imaging and its application for the study of an axisymmetric two-phase
jet. Exp Fluids 48(4): 615–629.
Brandner P A, Walker G J, Niekamp P N, Anderson B (2010) An experimental investigation of cloud
cavitation about a sphere. J Fluid Mech 656: 147–176.
Cervone A, Bramanti C, Rapposelli E, d’Agostino L (2006) Thermal cavitation experiments on a NACA
0015 hydrofoil. J Fluids Eng 128: 326–331.
Callenaere M, Franc J-P, Michel J-M, Riondet M (2001) The cavitation instability induced by the
development of a re-entrant jet. J Fluid Mech 444: 223–256.
Dulin V M, Markovich D M, Pervunin K S The optical principles of PFBI approach. Proc ISMTMF-7
(2011), Tianjin, China: 217–224.
Franc J P, Michel J M (1985) Attached cavitation and the boundary layer: experimental investigation and
numerical treatment. J Fluid Mech 154: 63–90.
George D L, Iyer C O, Ceccio S L (2000) Measurement of the bubbly flow beneath partial attached
cavities using electrical impedance probes. J Fluids Eng 122: 151–155.
Kawanami Y, Kato H, Yamaguchi H, Tagaya Y, Tanimura M (1997) Mechanism and control of cloud
cavitation. J Fluids Eng 119: 788–795.
Kubota A, Kato H, Yamaguchi H, Maeda M (1989) Unsteady structure measurement of cloud cavitation
on a foil section using conditional sampling technique. J Fluids Eng 111: 204–210.
Laberteaux K R, Ceccio S L (2001) Partial cavity flows. Part 1. Cavities forming on models without
spanwise variation. J Fluid Mech 431: 1–41.