
exam 3 review
optimal pollution
• what is appropriate level of waste?
• how to achieve that level (who has to reduce how much?)
• identify efficient levels of pollution
• discuss market levels of pollution
• demonstrate how policy can reconcile
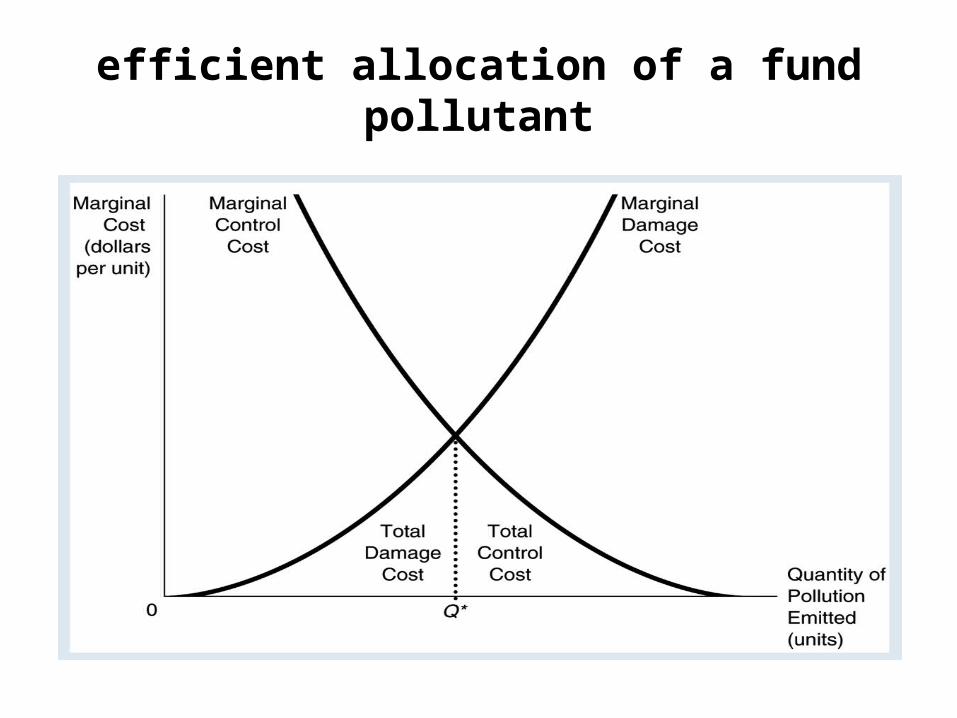
efficient allocation of a fund pollutant
efficiency difficult, use cost-effectiveness criteria
• select Q based on other criteria– safe for human / ecological health
• then, how to allocate responsibility for meeting this level?
• use cost-effectiveness criterion– not necessarily optimal, but minimizes cost given
some level Q
cost-effective allocation: example
• assume 2 sources currently emitting 30 units
• reduce to 15 units
• how to allocate reduction between 2 sources?
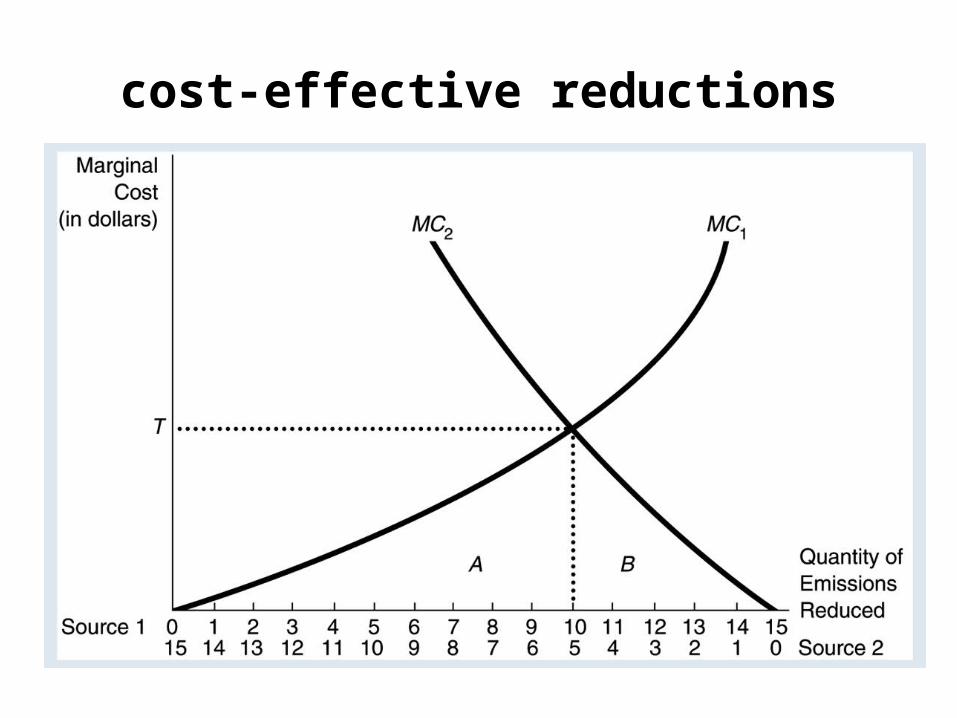
cost-effective reductions

equal MAC
• cost of achieving given reduction in emissions will be minimized if and only if MC of control (abatement) equal across emitters
• what policy instrument to achieve equality?
1. emissions standards
2. emissions charges
3. emissions trading
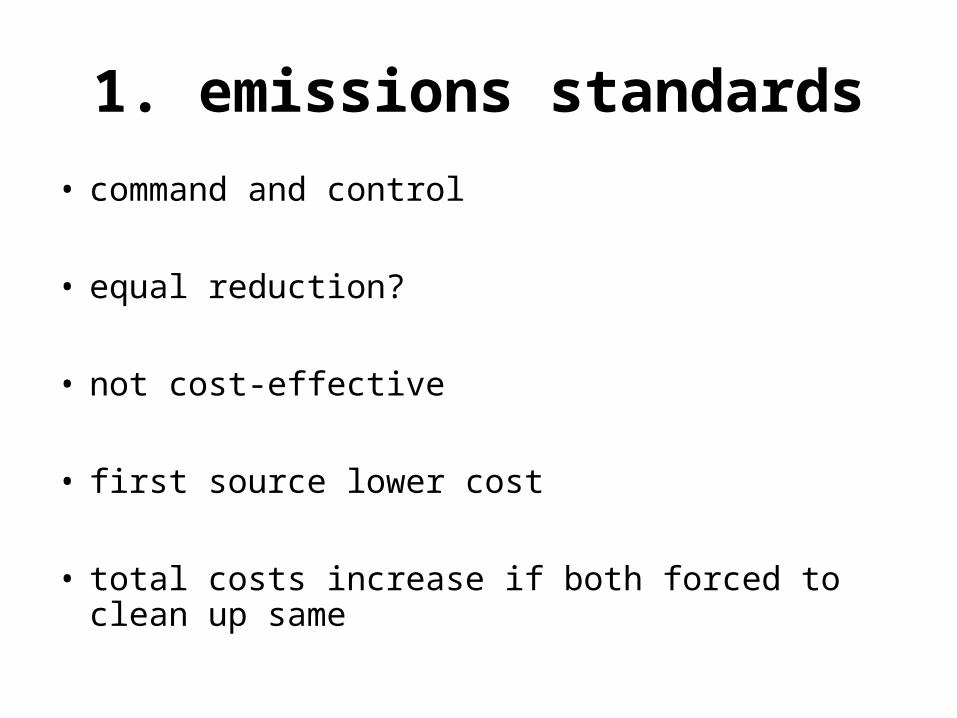
1. emissions standards
• command and control
• equal reduction?
• not cost-effective
• first source lower cost
• total costs increase if both forced to clean up same
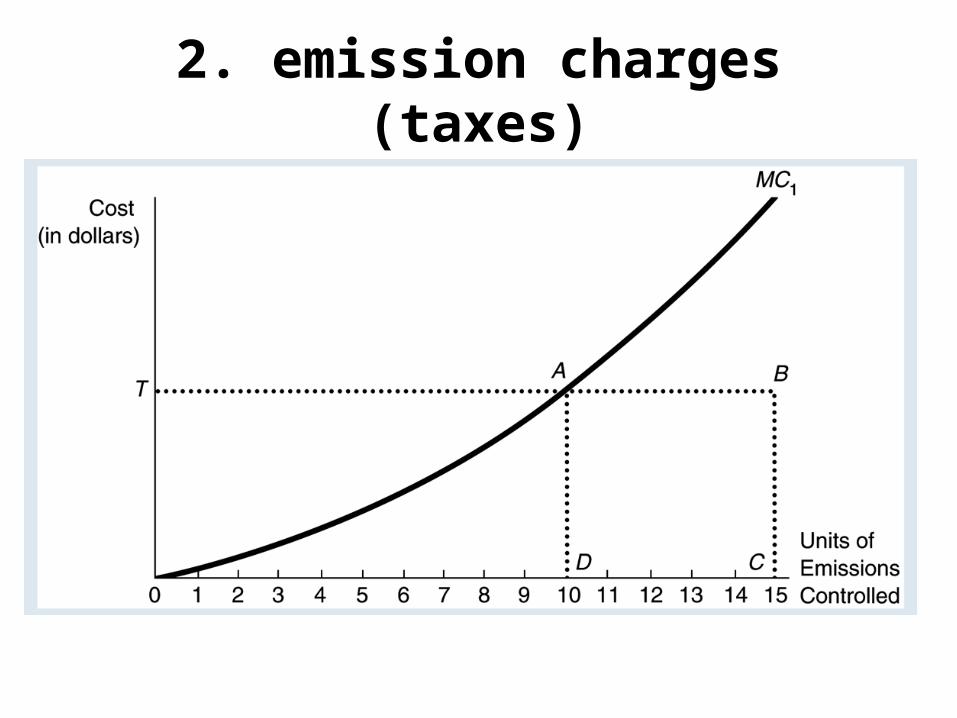
2. emission charges (taxes)
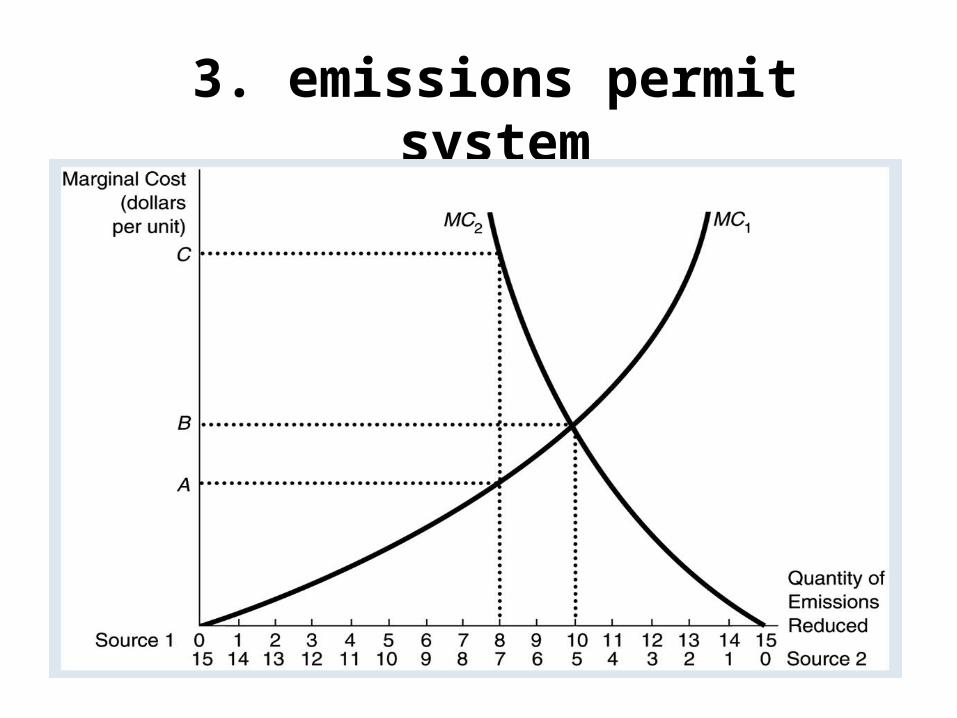
3. emissions permit system
sample question
• with the aid of a graph illustrate optimal pollution abatement if MAC = 10 – E with a per unit tax of $5.
• how would this change if MAC = 8 – E?
energy: efficient vs. market outcomesair pollution and climate policy
• Efficiency of C & C policy?– emissions standard set according to health
“threshold” – protect the most sensitive members of popn
• But adverse health effects are occurring at pollution levels lower than the ambient standard
other problems
• space– no account for number of people exposed– sensitivity of local ecology– costs of compliance in various areas
• time– concentrations are important– standards based on averages– constant levels of control
• exposure– indoor pollutants important too

better to use other 2 instruments:charges vs. trading
• Emissions trading– Initial allocation matters– Free vs. auction– EU experience
• Windfall profits to big polluters
– RGGE in NE 2008• 10 NE states; emissions capped starting 2009
• Emission charges– Tax damage costs per unit– Double dividend

population
• model of population growth on development
• model of development on population growth
• microeconomic theory of fertility
model of population on development
• O = LX– O: output– L: number of workers– X: output per worker
• O/P = (L/P)X…output per capita– P: population
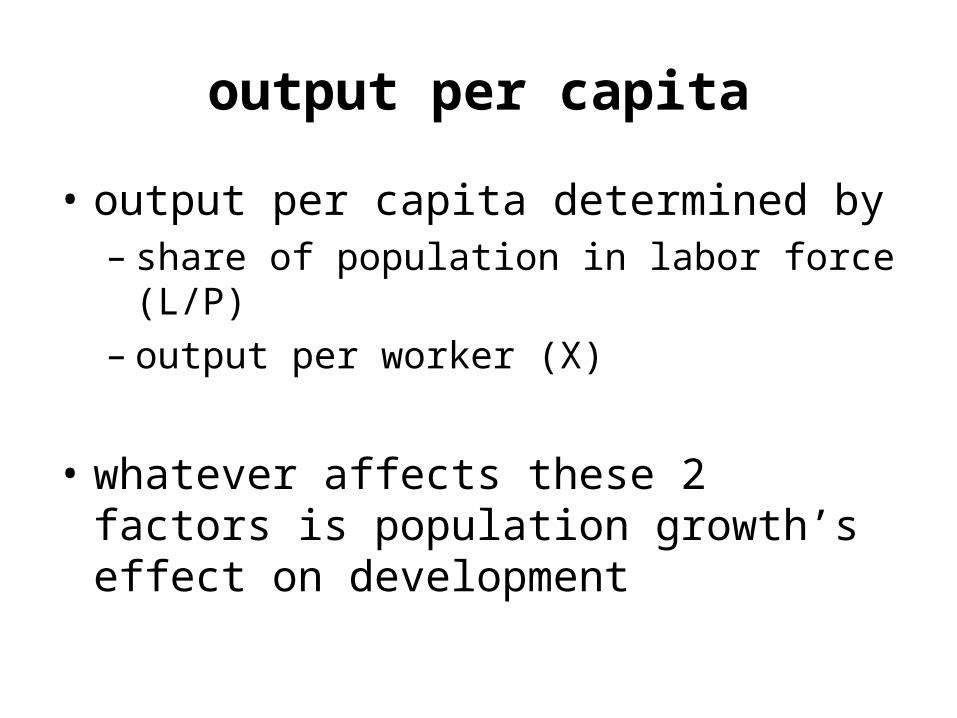
output per capita
• output per capita determined by– share of population in labor force (L/P)– output per worker (X)
• whatever affects these 2 factors is population growth’s effect on development
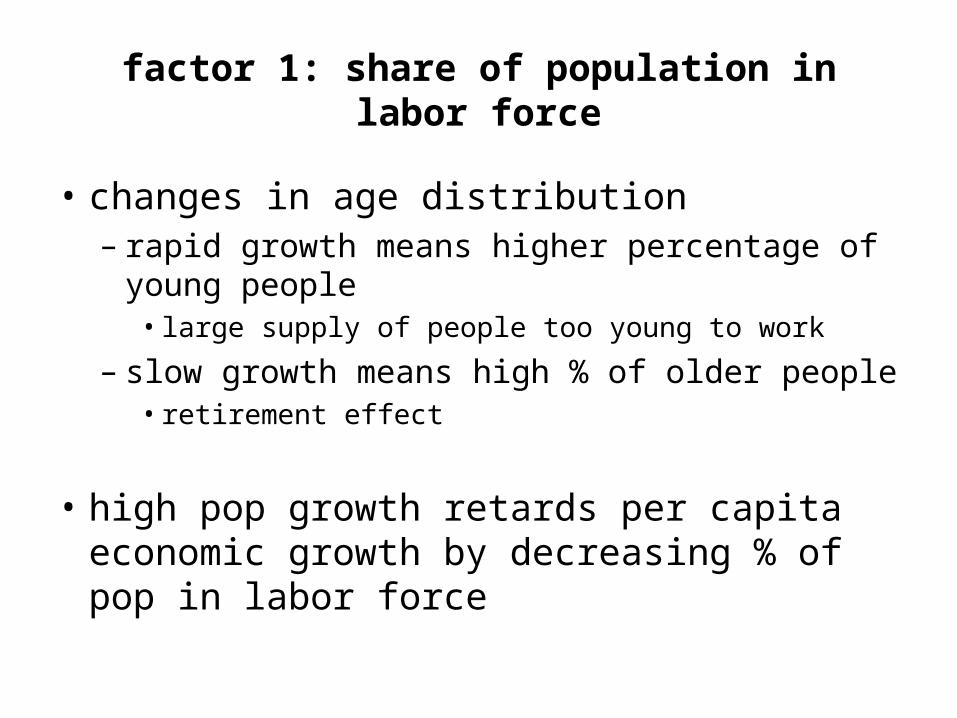
factor 1: share of population in labor force
• changes in age distribution– rapid growth means higher percentage of young
people• large supply of people too young to work
– slow growth means high % of older people• retirement effect
• high pop growth retards per capita economic growth by decreasing % of pop in labor force
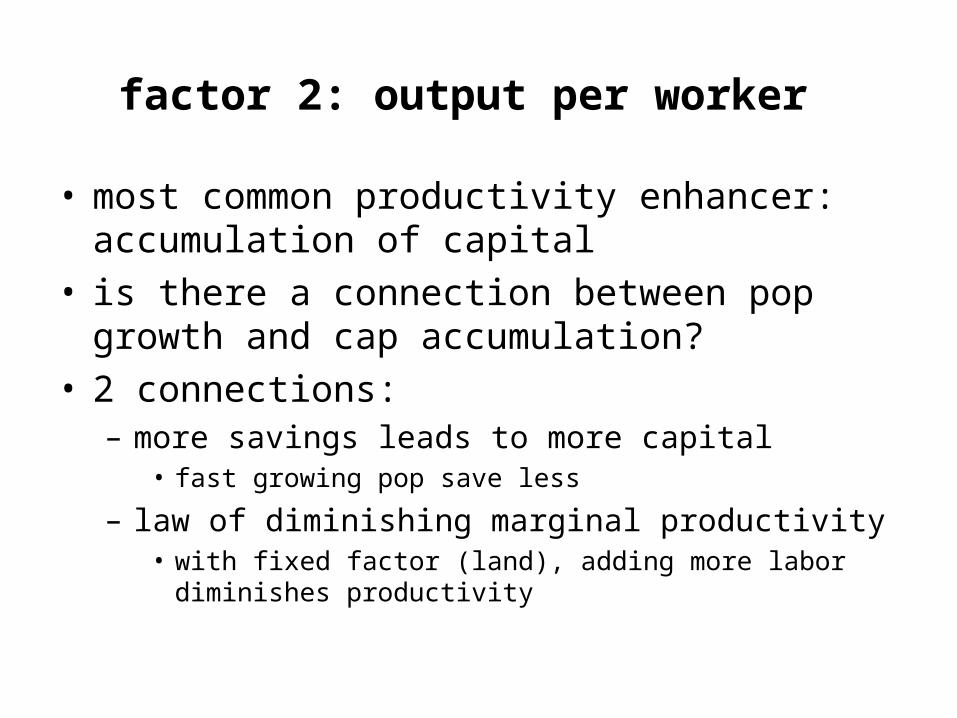
factor 2: output per worker
• most common productivity enhancer: accumulation of capital
• is there a connection between pop growth and cap accumulation?
• 2 connections:– more savings leads to more capital
• fast growing pop save less
– law of diminishing marginal productivity• with fixed factor (land), adding more labor diminishes
productivity
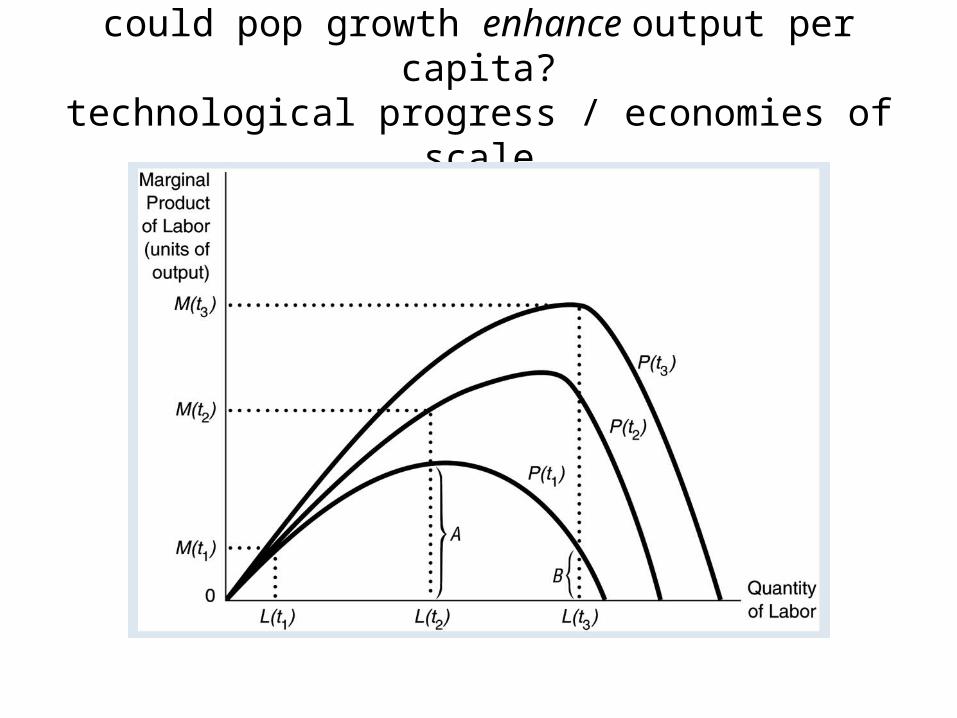
could pop growth enhance output per capita?technological progress / economies of scale

model of development on population
• theory of demographic transition: as nations develop they eventually reach a point where birthrates fall
• stage 1: prior to industrialization, birthrates / death rates stable
• stage 2: after industrialization, lower death rates (same birthrates)
• stage 3: falling birthrates
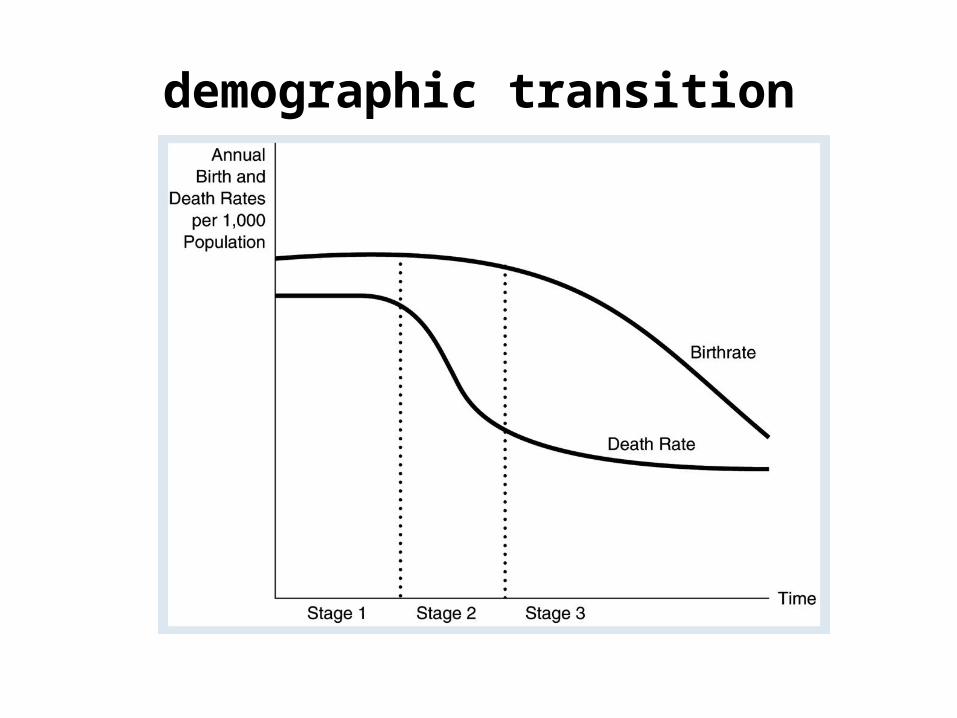
demographic transition

microeconomic theory of fertility
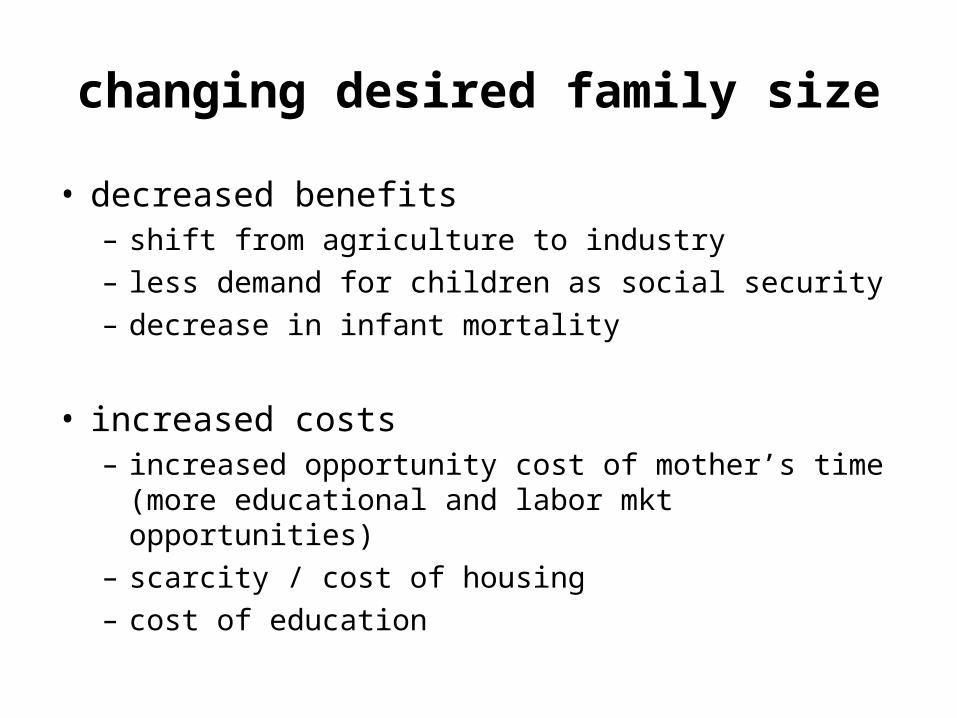
changing desired family size
• decreased benefits– shift from agriculture to industry – less demand for children as social security– decrease in infant mortality
• increased costs– increased opportunity cost of mother’s time (more
educational and labor mkt opportunities)– scarcity / cost of housing– cost of education