OKORO, C.N. 2021. Dynamic relationship between oil price and macroeconomic variables: evidence from oil exporting and oil importing countries in Africa. Robert Gordon University, PhD thesis. Hosted on OpenAIR [online]. Available
from: https://doi.org/10.48526/rgu-wt-1678042
The author of this thesis retains the right to be identified as such on any occasion in which content from this thesis is referenced or re-used. The licence under which this thesis is distributed applies to the text and any original images only – re-use of any third-party content must still be cleared with the original copyright holder.
This document was downloaded from https://openair.rgu.ac.uk
Dynamic relationship between oil price and macroeconomic variables: evidence from oil
exporting and oil importing countries in Africa.
OKORO, C.N.
2021
DYNAMIC RELATIONSHIP BETWEEN OIL PRICE AND MACROECONOMIC
VARIABLES: EVIDENCE FROM OIL EXPORTING AND OIL IMPORTING
COUNTRIES IN AFRICA
A thesis submitted in partial fulfilment of the requirements of Robert Gordon
University for the degree of Doctor of Philosophy
Department of Management
Aberdeen Business School
Robert Gordon University
September 2021
i
ABSTRACT
This study examines the asymmetric long run and the short-run relationship
between oil price and key macroeconomic variables within the context of net
oil-exporting and importing countries in Africa. Using quarterly data ranging
from 1996𝑞1 to 2016𝑞4, panel ARDL estimation is carried out to analyse how
asymmetric changes in oil price affect macroeconomic activities in African
countries and whether the effects are similar or different in oil importing and
exporting African countries. The results show significant positive response of
GDP to oil price in the long run and short run, in net oil exporting countries.
While the response of GDP to oil price is negative and significant in net oil
importing countries in the long run and short run. In the long run interest rate
responded significantly and positively to oil price in net oil exporting and oil
importing, while the short run response is insignificant in both net oil exporters
and oil importers. The Granger-causality test shows that causality run from oil
price to interest rates and exchange rates in both net oil exporting and importing
countries. This study recommends significant policies and strategies for
policymakers to construct effective and efficient short run and long run
economic policies that may help in shielding macroeconomic variables from oil
price shocks. Such policies and strategies include not only diversification of
economic activities through exportation of non-oil products and increase in solar
energy usage to reduce dependence on crude oil but also to enhance increase
in manufacturing, infrastructural and agricultural development to enable
increase in foreign earnings and GDP growth. This study recommends the use
of mixed method to incorporate other exogeneous factors including political,
social, environmental, and institutional factors to give further insight on oil
price-macroeconomic relationship in the context of African countries.

ii
Keywords: Oil price, GDP, Interest rates, Inflation, Exchange Rates,
Unemployment Rates, Food Supply, External Debt, Current Accounts, Foreign
Reserves, panel ARDL model, net oil exporting countries, net oil importing
countries, Africa.
iii
DECLARATION
I hereby declare that this thesis,
Dynamic relationship between oil price and macroeconomic variable:
Evidence from oil exporting and oil importing countries in Africa.
This work is entirely mine, and where any material points to the ideas of others,
it is thoroughly cited and referenced with appropriate acknowledgments given.
OKORO CHINEDU NNENNA
September 2021

iv
DEDICATION
I dedicate this thesis to God Almighty for His infinite mercies and faithfulness
that saw me throughout my PhD journey. I worship, praise, and honour you my
Lord and Saviour Jesus Christ Amen!
To my loving late mum, Mrs Rosemary Okoro, my sister Chinyere Okoro, my
brother Ikechukwu Okoro, my late uncle Tony Ozoemena and my aunty Regina
Ibezim. Thank you all for your encouragement, prayers, and support. Love you
all.

v
ACKNOWLEDGEMENTS
My heart is full of thanksgiving and praises to God Almighty for His unfailing
love and mercy throughout this long, challenging but fulfilling PhD journey. His
mercies and faithfulness kept me moving even when it seems everything is
against me and I felt discouraged, confused, worried, lonely, and disappointed-
God showed me why He is God. He God guided me every step of the journey till
the end of my PhD career. I have nothing to offer you Lord but to say thank
you.
I deeply and sincerely appreciate my principal supervisor Dr Lin Xiong, for her
careful supervisory role in making sure that I produce a high-quality thesis. I
must say it was her mentoring and caring supervisory role that helped and
guided me in producing a good quality thesis. Her immense contribution and
her zeal to direct me correctly transformed my academic life. Through her
persistent, patience, rigorousness, and relentless supervision, I finished my
PhD. For this, I am immensely grateful, and I say may you be blessed.
I am not sure of the appropriate words to express my sincere gratitude to Dr
Omaima Hassan for her advice and encouragement when the going was
getting tough. She spoke out for me when the walls were about to fall upon me.
Her advice appropriately guided and helped me throughout my doctorate
journey.
A special thanks goes to the entire Aberdeen Business school staff and RGU
postgraduate school for the opportunity and their support throughout my PhD
vi
career. To Alison Orellana, my mother and aunty from another country, I say
thank you for your love and care. She was so supportive even during COVID-19
pandemic, always emailing and calling to reach out. Thank you once again.
Special thanks to IT team, library staff, colleagues and friends for their
consistent support and contributions. I am most grateful to my friend Mark
Ushie, Dr Chikezie Emele and Dr Nkeiruka Ndubuka-McCallum for their immense
contributions and unwavering support throughout my PhD programme. God
bless you all.

vii
LIST OF ACRONYMS
FSI Financial statistics institute
OECD Organisation for Economic Co-operation and Development
IIF Institute of International Finance
ASEAN Association of Southeast Asian Nations
FSI Financial Stress Index
EMEs. Emerging Market Economies
VAR vector autoregressive model
SUR Seemingly Unrelated Regressions model
GMM EGLS Generalized Method of Moments Estimated Generalised least square
BRICS countries BRAZIL, RUSSIA, INDIA, AND CHINA
ARDL Autoregressive Distributed Lag model
U.S United States of America
EGARCH Generalised Autoregressive Conditional Heteroskedasticity
GARCH generalized autoregressive conditional heteroscedasticity.
DCC dynamic conditional correlation
NARDL nonlinear autoregressive distributed lag
viii
OPEC Organisation of Petroleum Economic Countries
NARDL nonlinear auto-regressive distributed lag
IMF International Monetary Fund
VECM Vector Error Correction Model.
TVP-VAR time-varying parameter vector autoregressive
TVP-SVAR-SV time-varying parameter structural vector autoregression
IRF impulse response function
APFR Average price of food
APF Aggregate price of food
ix
Table of Contents ABSTRACT ........................................................................................................................................... i
Chapter One ....................................................................................................................................... 1
1.1 Introduction ............................................................................................................................. 1
1.2 Background of the Study ......................................................................................................... 7
1.3 Aim of the study .................................................................................................................... 10
1.4 Significance of the Study ....................................................................................................... 12
1.5 Methodology Overview ......................................................................................................... 14
1.6 Contribution to Knowledge ................................................................................................... 16
1.7 Structure of the Thesis .......................................................................................................... 18
Chapter Two ..................................................................................................................................... 21
An Overview of Research Context .................................................................................................. 21
2.0 Introduction ........................................................................................................................... 21
2.1 The Net Oil Exporting Countries ............................................................................................ 23
2.1.1 Nigeria and Oil Price Shocks ........................................................................................... 24
2.2.2 Algeria and Oil Price Shocks ........................................................................................... 29
2.1.3 Egypt and Oil Price Shocks ............................................................................................. 32
2.2 The Net Oil Importing Countries ........................................................................................... 35
2.2.1 South Africa and Oil Price Shocks .................................................................................. 36
2.2.2 Kenya and oil Price Shocks ............................................................................................. 40
2.3 Shocks in Oil Price Pathway in Net Oil Exporting and Oil Importing Countries in Africa .... 43
2.4 Pathway Through Actual Effect ............................................................................................. 43
2.4 Summary ................................................................................................................................ 45
Chapter Three .................................................................................................................................. 50
Literature Review ............................................................................................................................ 50
3.0 Introduction ........................................................................................................................... 50
3.1 Literature Review on the Relationship Between Oil Price and GDP .................................... 52
3.2 Literature Review on the Relationship Between Oil Price and Interest Rate ..................... 59
3.3 Literature Review on the Relationship Between Oil Price and Inflation ............................. 61
3.4 Literature Review on the Relationship Between Oil Price and Exchange Rtaes ................. 68
3.5 Literature Review on the Relationship Between Oil Price and Unemployment Rates ....... 82
3.6 Literature Review on the Relationship Between Oil Price and Food Supply ...................... 87

x
3.7 Literature Review on the Relationship Between Oil Price and External Debt .................... 99
3.8 Literature Review on the Relationship Between Oil Price and Current Account Balance 102
3.9 Literature Review on The Relationship Between Oil Price and Foreign Reserves ............ 107
3.10 Summary of the Findings on the Reviewed Literature..................................................... 109
Chapter Four .................................................................................................................................. 111
Asymmetries in Oil price, Transmission Channel and Related Theories ..................................... 111
4.0 Introduction ......................................................................................................................... 111
4.1 The Asymmetries in Oil Price .............................................................................................. 111
4.2 Channel of Transmission ..................................................................................................... 114
4.2.1 Supply-Side Effect Channel .......................................................................................... 115
4.2.2 Demand-Side Effect Channel ........................................................................................ 116
4.2.3 Real Balance Effect and Monetary Policy .................................................................... 117
4.2.4 Terms of Trade Channel ............................................................................................... 118
4.2.5 Inflation Effect Channel ................................................................................................ 119
4.3 Related Theories .................................................................................................................. 121
4.3.1 Theory of Reallocation ................................................................................................. 122
4.3.2 Theory of Investment Under Uncertainty ................................................................... 123
4.3.3 Income Transfer Theory ............................................................................................... 127
4.3.4 Theory of Real Business Cycle ...................................................................................... 128
4.4 Summary .............................................................................................................................. 129
CHAPTER FIVE: ............................................................................................................................... 131
RESEARCH METHODOLOGY ........................................................................................................... 131
5.0 Introduction ......................................................................................................................... 131
5.1 Methodology and Methods ................................................................................................ 132
5.1.1 An Overview of Empirical Methodology ...................................................................... 133
5.2 Research Design ................................................................................................................... 133
5.3 Data Collection Technique and Sample Size ....................................................................... 134
5.3.1 Sample Size ................................................................................................................... 134
5.3.2 Description of Data and Data Collection Method ....................................................... 135
5.3.3 Justification for Variables Selection ............................................................................. 136
5.3.4 An Overview of Data Analysis Techniques .................................................................. 139
5.4 An Overview of Econometric Analysis ................................................................................ 140
5.4.1 An Overview Panel ARDL Estimation of Panel ARDL ................................................... 141
5.4.2 An Overview of Panel Unit Root Test .......................................................................... 142
5.4.3 An Overview of Panel Cointegration Test.................................................................... 144
5.10 Conclusion .......................................................................................................................... 145
xi
Chapter Six ..................................................................................................................................... 147
Empirical Analysis .......................................................................................................................... 147
6.0 Introduction ......................................................................................................................... 147
6.1 Descriptive Data Analysis ................................................................................................... 149
6.2 Analysing the Influence of Oil Price on Macroeconomic Variables Using Scattered
Diagram ...................................................................................................................................... 151
6.3 Panel Unit Root Test Result ................................................................................................. 157
6.4 Optimal Lag Selection .......................................................................................................... 161
6.5 Result of Panel Cointegration Test...................................................................................... 162
6.6 Correlation Analysis Between the Key Variables ............................................................... 165
6.7 Panel ARDL Model ............................................................................................................... 170
6.8 Hypotheses Development ................................................................................................... 174
6.8.1 Presentation of Hypothesis 1 ....................................................................................... 174
6.8.2 Presentation of Hypothesis 2 ....................................................................................... 176
6.8.3 Presentation of Hypothesis 3 ....................................................................................... 177
6.8.4 Presentation of Hypothesis 4 ....................................................................................... 178
6.8.5 Presentation of Hypothesis 5 ....................................................................................... 180
6.8.6 Presentation of Hypothesis 6 ....................................................................................... 181
6.8.7 Presentation of Hypothesis 7 ....................................................................................... 183
6.8.8 Presentation of Hypothesis 8 ....................................................................................... 184
6.8.9 Presentation of Hypothesis 9 ....................................................................................... 186
6.8.10 Presentation of Hypothesis 10 ................................................................................... 187
6.8.11 Presentation of Hypothesis 11 ................................................................................... 190
6.9 Discussion of Findings ......................................................................................................... 192
6.9.1 Result from Econometric Analysis Using ARDL Model. ............................................... 192
6.9.1.1Discussion on Results on Hypothesis 1 Testing ......................................................... 194
6.9.1.2 Discussion of Results on Hypotheses 2 Testing. ....................................................... 197
6.9.1.3 Discussion of Results on Hypotheses 3 Testing. ....................................................... 200
6.9.1.4 Discussion of Results on Hypothesis 4 Testing. ........................................................ 202
6.9.1.5 Discussion of Results on Hypothesis 5 Testing ......................................................... 205
6.9.1.6 Discussion of Results on Hypothesis 6 Testing. ........................................................ 207
6.9.1.7 Discussion of Results on Hypothesis 7 Testing. ........................................................ 209
6.9.1.8 Discussion of Results on Hypothesis 8 Testing. ........................................................ 211
6.9.1.9 Discussion of Results on Hypothesis 9 Testing. ........................................................ 214
6.9.1.10 Discussion of Results on Hypothesis 10 Testing. .................................................... 216
6.9.1.11 Discussion of Results on Hypothesis 11 Testing. .................................................... 218
xii
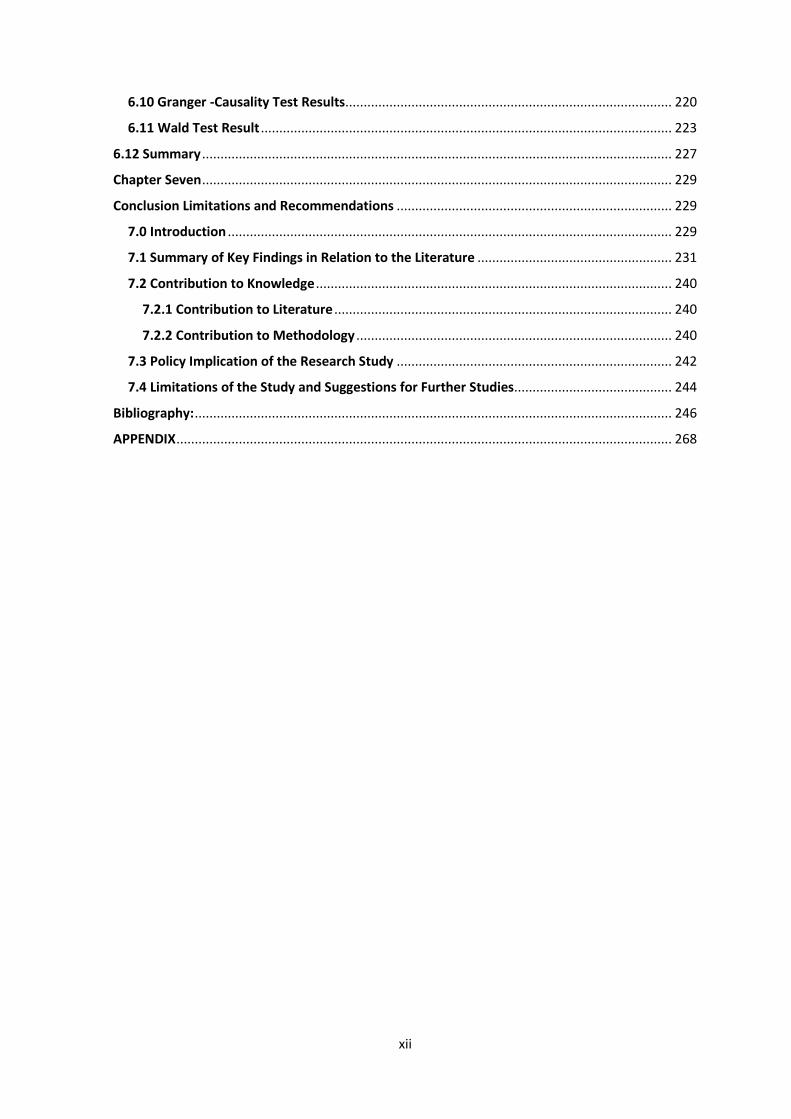
6.10 Granger -Causality Test Results......................................................................................... 220
6.11 Wald Test Result ................................................................................................................ 223
6.12 Summary ................................................................................................................................ 227
Chapter Seven ................................................................................................................................ 229
Conclusion Limitations and Recommendations ........................................................................... 229
7.0 Introduction ......................................................................................................................... 229
7.1 Summary of Key Findings in Relation to the Literature ..................................................... 231
7.2 Contribution to Knowledge ................................................................................................. 240
7.2.1 Contribution to Literature ............................................................................................ 240
7.2.2 Contribution to Methodology ...................................................................................... 240
7.3 Policy Implication of the Research Study ........................................................................... 242
7.4 Limitations of the Study and Suggestions for Further Studies........................................... 244
Bibliography: .................................................................................................................................. 246
APPENDIX ....................................................................................................................................... 268
xiii
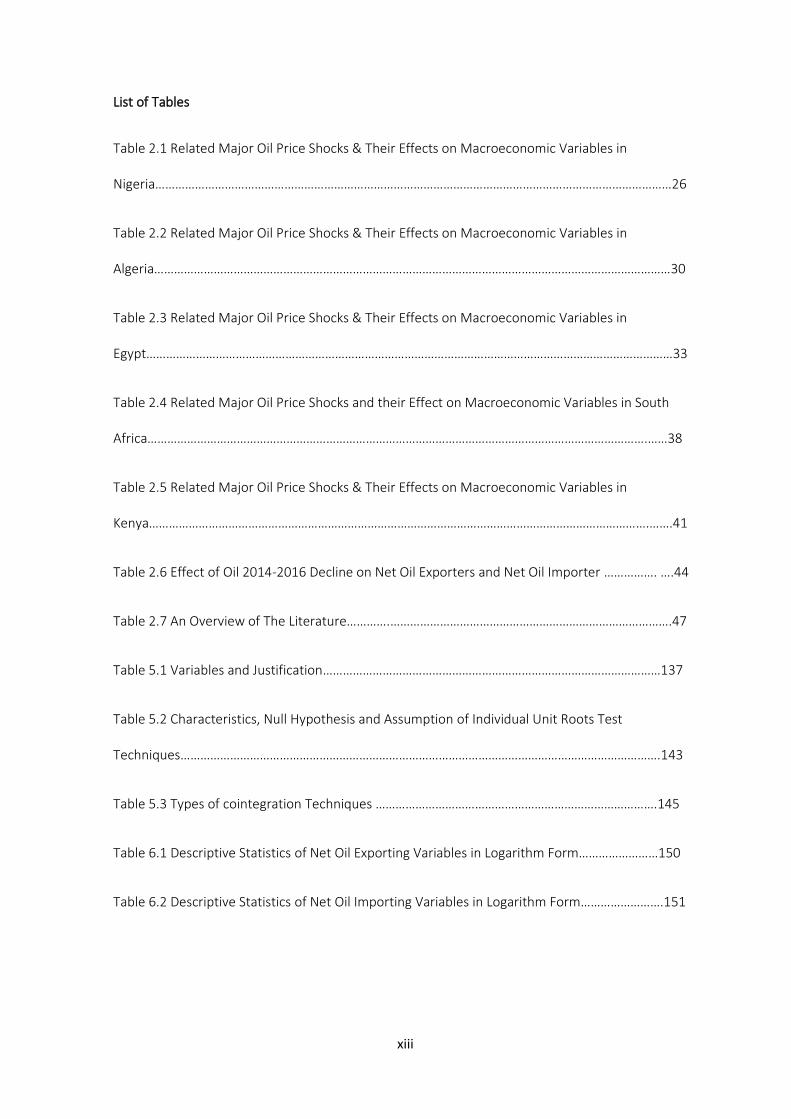
List of Tables
Table 2.1 Related Major Oil Price Shocks & Their Effects on Macroeconomic Variables in
Nigeria…………………………………………………………………………………………………………………………………………26
Table 2.2 Related Major Oil Price Shocks & Their Effects on Macroeconomic Variables in
Algeria…………………………………………………………………………………………………………………………………………30
Table 2.3 Related Major Oil Price Shocks & Their Effects on Macroeconomic Variables in
Egypt……………………………………………………………………………………………………………………………………………33
Table 2.4 Related Major Oil Price Shocks and their Effect on Macroeconomic Variables in South
Africa…………………………………………………………………………………………………………………………………….……38
Table 2.5 Related Major Oil Price Shocks & Their Effects on Macroeconomic Variables in
Kenya…………………………………………………………………………………………………………………………………….…….41
Table 2.6 Effect of Oil 2014-2016 Decline on Net Oil Exporters and Net Oil Importer ……………. ….44
Table 2.7 An Overview of The Literature………….………………………………………………………………………….47
Table 5.1 Variables and Justification…………………………………………………………………………………………137
Table 5.2 Characteristics, Null Hypothesis and Assumption of Individual Unit Roots Test
Techniques……………………………………………………………………………………………………………………………….143
Table 5.3 Types of cointegration Techniques ………………………………………………………………………….145
Table 6.1 Descriptive Statistics of Net Oil Exporting Variables in Logarithm Form……………………150
Table 6.2 Descriptive Statistics of Net Oil Importing Variables in Logarithm Form…………………….151
xiv
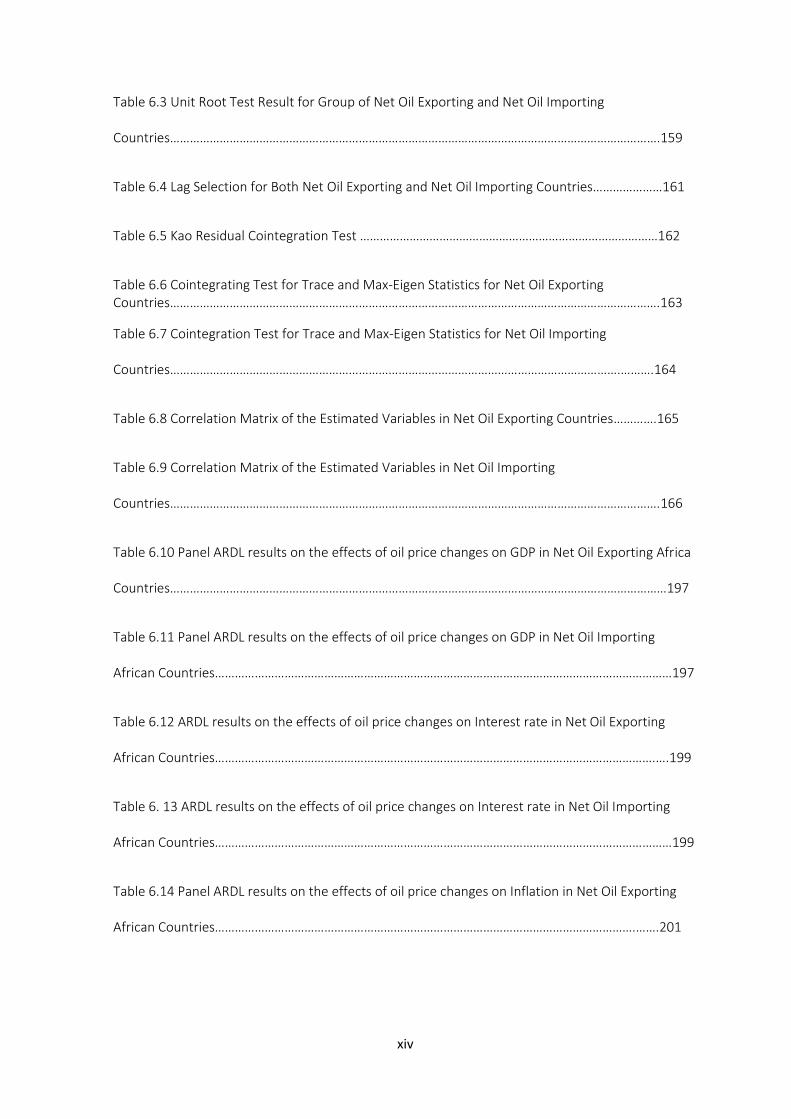
Table 6.3 Unit Root Test Result for Group of Net Oil Exporting and Net Oil Importing
Countries………………………………………………………………………………………………………………………………….159
Table 6.4 Lag Selection for Both Net Oil Exporting and Net Oil Importing Countries…………………161
Table 6.5 Kao Residual Cointegration Test ………………………………………………………………………………162
Table 6.6 Cointegrating Test for Trace and Max-Eigen Statistics for Net Oil Exporting Countries………………………………………………………………………………………………………………………………….163
Table 6.7 Cointegration Test for Trace and Max-Eigen Statistics for Net Oil Importing
Countries……………………………………………………………………………………………………………………….……….164
Table 6.8 Correlation Matrix of the Estimated Variables in Net Oil Exporting Countries………….165
Table 6.9 Correlation Matrix of the Estimated Variables in Net Oil Importing
Countries………………………………………………………………………………………………………………………………….166
Table 6.10 Panel ARDL results on the effects of oil price changes on GDP in Net Oil Exporting Africa
Countries……………………………………………………………………………………………………………………………………197
Table 6.11 Panel ARDL results on the effects of oil price changes on GDP in Net Oil Importing
African Countries…………………………………………………………………………………………………………………………197
Table 6.12 ARDL results on the effects of oil price changes on Interest rate in Net Oil Exporting
African Countries…………………………………………………………………………………………………………………….….199
Table 6. 13 ARDL results on the effects of oil price changes on Interest rate in Net Oil Importing
African Countries…………………………………………………………………………………………………………………………199
Table 6.14 Panel ARDL results on the effects of oil price changes on Inflation in Net Oil Exporting
African Countries……………………………………………………………………………………………………………….…….201
xv
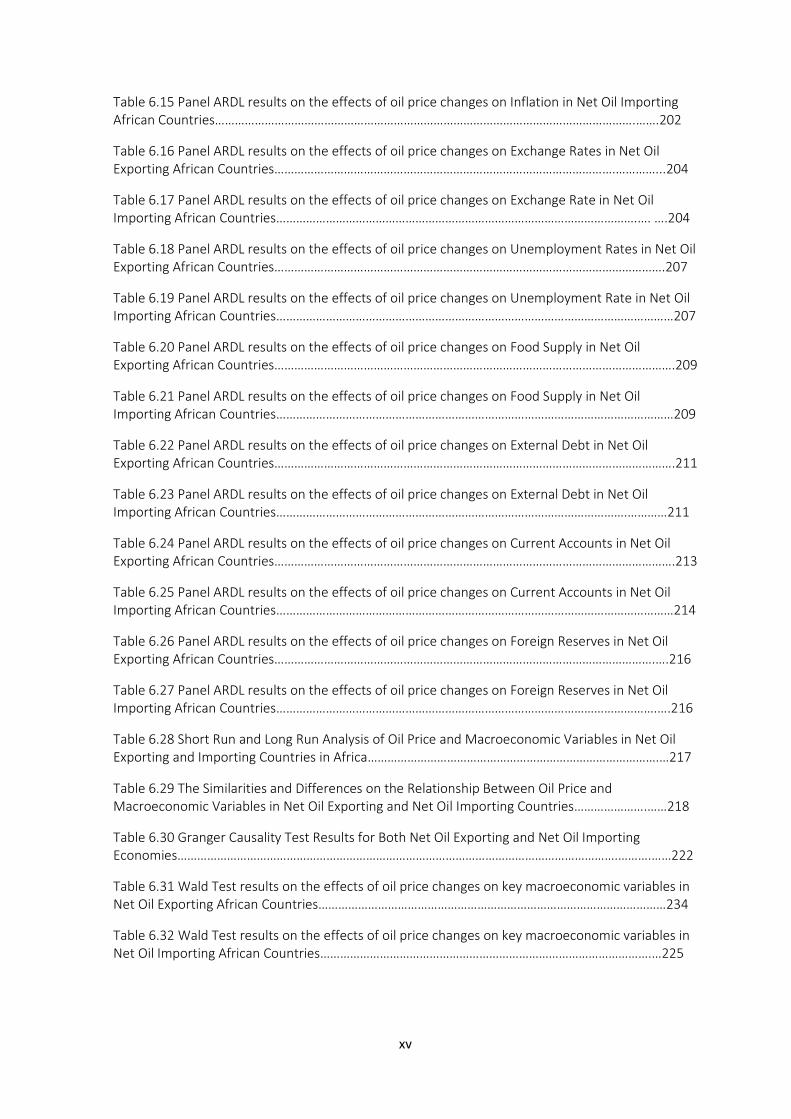
Table 6.15 Panel ARDL results on the effects of oil price changes on Inflation in Net Oil Importing African Countries……………………………………………………………………………………………………………….…….202
Table 6.16 Panel ARDL results on the effects of oil price changes on Exchange Rates in Net Oil Exporting African Countries………………………………………………………………………………………….…………...204
Table 6.17 Panel ARDL results on the effects of oil price changes on Exchange Rate in Net Oil Importing African Countries……………………………………………………………………………………………….…. ….204
Table 6.18 Panel ARDL results on the effects of oil price changes on Unemployment Rates in Net Oil Exporting African Countries……………………………………………………………………………………………………….207
Table 6.19 Panel ARDL results on the effects of oil price changes on Unemployment Rate in Net Oil Importing African Countries…………………………………………………………………………………………………………207
Table 6.20 Panel ARDL results on the effects of oil price changes on Food Supply in Net Oil Exporting African Countries………………………………………………………………………………………………………….209
Table 6.21 Panel ARDL results on the effects of oil price changes on Food Supply in Net Oil Importing African Countries…………………………………………………………………………………………………………209
Table 6.22 Panel ARDL results on the effects of oil price changes on External Debt in Net Oil Exporting African Countries………………………………………………………………………………………………………….211
Table 6.23 Panel ARDL results on the effects of oil price changes on External Debt in Net Oil Importing African Countries…………………………………………………………………………………………….…………211
Table 6.24 Panel ARDL results on the effects of oil price changes on Current Accounts in Net Oil Exporting African Countries………………………………………………………………………………………………………….213
Table 6.25 Panel ARDL results on the effects of oil price changes on Current Accounts in Net Oil Importing African Countries…………………………………………………………………………………………………………214
Table 6.26 Panel ARDL results on the effects of oil price changes on Foreign Reserves in Net Oil Exporting African Countries…………………………………………………………………………………………………….….216
Table 6.27 Panel ARDL results on the effects of oil price changes on Foreign Reserves in Net Oil Importing African Countries…………………………………………………………………………………………………….….216
Table 6.28 Short Run and Long Run Analysis of Oil Price and Macroeconomic Variables in Net Oil Exporting and Importing Countries in Africa…………………………………………………………………………….…217
Table 6.29 The Similarities and Differences on the Relationship Between Oil Price and Macroeconomic Variables in Net Oil Exporting and Net Oil Importing Countries………………….……218
Table 6.30 Granger Causality Test Results for Both Net Oil Exporting and Net Oil Importing Economies…………………………………………………………………………………………………………………….……….……222
Table 6.31 Wald Test results on the effects of oil price changes on key macroeconomic variables in Net Oil Exporting African Countries……………………………………………………………………………………………234
Table 6.32 Wald Test results on the effects of oil price changes on key macroeconomic variables in Net Oil Importing African Countries……………………………………………………………………………………….…225
xvi
List of figures
Figure 1.1 Structure of The Thesis………………………………………………………………………………………………...20
Figure 2.1: The Response of GDP to Oil Price Fluctuations in Nigeria from 1996𝑞1 to 2016𝑞4…….…28
Figure 2.2: The Response of Current Accounts to Oil Price Fluctuations in Nigeria from 1996𝑞1 to
2016𝑞4……………………………………………………………………………………………………………………………………….….29
Figure 2.3: The Response of GDP to Oil Price Fluctuations in Algeria from 1996𝑞1 to 2016𝑞4…. ….31
Figure 2.4: The Response of Current Account to Oil Price Fluctuations in Algeria from 1996𝑞1 to
2016𝑞4……………………………………………………………………………………………………………………………………. ….32
Figure 2.5: The Response of GDP to Oil Price Fluctuations in Egypt from 1996𝑞1 to 2016𝑞4……….34
Figure 2.6: The Response of Current Account to Oil Price Fluctuations in Egypt from 1996𝑞1 to
2016𝑞4…………………………………………………………………………………………………………………………………………34
Figure 2.7: The Response of GDP to Oil Price Fluctuations in South Africa from 1996𝑞1 to
2016𝑞4…………………………………………………………………………………………………………………………………….….39
Figure 2.8: The Response of Current Account to Oil Price Fluctuations in South Africa from 1996𝑞1
to 2016𝑞4…………………………………………………………………………………………………………………………………….39
Figure 2.9: The Response of GDP to Oil Price Fluctuations in Kenya from 1996𝑞1 to 2016𝑞4……….42
Figure 2.10: The Response of Current Accounts to Oil Price Fluctuations in Kenya from 1996𝑞1 to
2016𝑞4…………………………………………………………………………………………………………………………………………42
Figure 4.1 Transmission Mechanism of Oil Price………………………………………………………………………121
Figure 4.2 Mechanistic Relationship Between Uncertainty in Oil Price and Macroeconomic
Variables……………………………………………………………………………………………………………………………………126
Nigeria: Figure 6.1 Co-movement Between Oil Price and GDP……………………………………………….…268
Nigeria: Figure 6.2 Co-movement Between Oil Price and Interest Rates……………………………….…269
Nigeria: Figure 6.3 Co-movement Between Oil Price and Inflation……………………………….………….269
Nigeria: Figure 6.4 Co-movement Between Oil Price and Exchange Rates…………………………………270
Nigeria: Figure 6.5 Co-movement Between Oil Price and Unemployment Rates……………………….270
Nigeria: Figure 6.6 Co-movement Between Oil Price and Food Supply………………………………………271
xvii
Nigeria: Figure 6.7 Co-movement Between Oil Price and External Debt……………………………………271
Nigeria: Figure 6.8 Co-movement Between Oil Price and Current Accounts………………………………272
Nigeria: Figure 6.9 Co-movement Between Oil Price and Foreign Reserves…………………………….272
Algeria: Figure 6.10 Co-movement Between Oil Price and GDP…………………………………………………273
Algeria: Figure 6.11 Co-movements Between Oil Price and Interest Rates…………………………………273
Algeria: Figure 6.12 Co-movements Between Oil Price and Inflation………………………………………….274
Algeria: Figure 6.13 Co-movement Between Oil Price and Exchange Rates…………………………….…274
Algeria; Figure 6.14 Co-movement Between Oil Price and Unemployment Rates………………………275
Algeria: Figure 6.15 Co-movement Between Oil Price and Food Supply ……………………………...……275
Algeria: Figure 6.16 Co-movements Between Oil price and External Debt……………….…………….…276
Algeria: Figure 6.17 Co-movements Between Oil Price and Current Accounts……………………………276
Algeria: Figure 6.18 Co-movement Between Oil Price and Foreign Reserves…………………….………277
EGYPT: Figure 6.19 Co-movement Between Oil Price and GDP……………………………….…………………277
Egypt: Figure 6.20 Co-movements Between Oil Price and Interest Rates……………………….………….278
Egypt: Figure 6.21 Co-movement Between Oil Price and Inflation…………………………………………….278
Egypt: Figure 6.22 Co-movements Between Oil Price and Exchange Rates…………………………………279
Egypt: Figure 6.23 Co-movement Between Oil Price and Unemployment Rates…………….…………279
Egypt: Figure 6.24 Co-movement Between Oil Price and Food Supply……………………………………….280
Egypt: Figure 6.25 Co-movement Between Oil Price and External Debt…………………………………….280

xviii
Egypt: Figure 6.26 Co-movement Between Oil Price and Current Accounts………………………….….281
Egypt: Figure 6.27 Co-movement Between Oil Price and Foreign Reserves…………………….…………281
Kenya: Figure 6.28 Co-movements Between Oil Price and GDP…………………………………………………282
Kenya: Figure 6.29 Co-movement Between Oil Price and Interest Rates……………………………………282
Kenya: Figure 6.30 Co-movement Between Oil Price and Inflation…………………………………………….283
Kenya: Figure 6.31 Co-movements Between Oil Price and Exchange Rates…………………….…………283
Figure 6.32 Co-movements Between Oil Price and Unemployment Rates…………………………………284
Kenya: Figure 6.33 Co-movements Between Oil Price and Food Supply……………………………………284
Kenya: Figure 6.34 Co-movements Between Oil price and External Debt…………………………………285
Kenya: Figure 6.35 Co-movements Between Oil Price and Current Accounts……………………………285
Kenya: Figure 6.36 Co-movement Between Oil Price and Foreign Reserves………………….………….286
South Africa: Figure 6.37 Co-movement Between Oil Price and GDP…………………………………………286
South Africa: Figure 6.38 Co-movement Between Oil Price and Interest Rates…………………………287
South Africa Figure 6.39 Co-movement Between Oil Price and Inflation……………………………………287
South Africa: Figure 6.40 Co-movement Between Oil Price and Exchange Rates………………………288
South Africa: Figure 6.41 Co-movement Between Oil Price and Unemployment Rates………………288
South Africa: Figure 6.42 Co-movements Between Oil Price and Food Supply……………………………289
South Africa: Figure 6.43 Co-movement Between Oil Price and External Debt………………………….289
South Africa: Figure 6.44 Co-movement Between Oil Price and Current Accounts……………………290
xix
South Africa: Figure 6.45 Co-movement Between Oil Price and Foreign Reserves…………………….290
Net Oil Importers: Figure 6.46 Co-movement Between Oil Price and GDP…………………………………291
Net Oil Importers: Figure 6.47 Co-movement Between Oil Price and Interest Rates…………………291
Net Oil Importers: Figure 6.48 Co-movement Between Oil Price and Inflation………………………….292
Net Oil Importers: Figure 6.49 Co-movement Between Oil Price and Exchange Rates………………292
Net Oil Importers: Figure 6.50 Co-movement Between Oil Price and Unemployment Rates…….293
Net Oil Importers: Figure 6.51 Co-movements Between Oil Price and Food Supply………………….293
Net Oil Importers: Figure 6.52 Co-movements Between Oil Price and External Debts………………294
Net Oil Importers: Figure 6.53 Co-movements Between Oil Price and Current
Accounts……………………………………………………………………………………………………………………………………294
Net Oil Importers: Figure 6.54 Co-movements Between Oil Price and Foreign
Reserves…………………………………………………………………………………………………………………………………….295
Net Oil Exporters: Figure 6.55 Co-movement Between Oil Price and GDP……………………………….295
Net Oil Exporters: Figure 6.56 Co-movement Between Oil Price and Interest Rates………………….296
Net Oil Exporters: Figure 6.57 Co-movement Between Oil Price and Inflation……………………………296
Net Oil Exporters: Figure 6.58 Co-movement Between Oil Price and Exchange Rates…………….…297
Net Oil Exporters: Figure 6.59 Co-movement Between Oil Price and Unemployment Rate……….297
Net Oil Exporters Figure 6.60 Co-movement Between Oil Price and Food Supply………………………298
Net Oil Exporters: Figure 6.61 Co-movement Between Oil Price and External Debt…………….……298
Net Oil Exporters: Figure 6.62 Co-movement Between Oil Price and Current Accounts………. ….299
xx
Net Oil Exporters: Figure 6.63 Co-movement Between Oil Price and Foreign Reserves…………….299
1
Chapter One
1.1 Introduction
Changes in oil prices have been recognized in the literature as the major
contributor to shocks in macroeconomic variables and consequently shocks in
economic activities (see Brown and Yucel 2002; Ahmed 2013; Trang et al. 2017;
Akinsola and Odhiambo 2020). However, mixed evidence has been found in
literature as the cause of changes in oil price which explain variations in
macroeconomic variables (Chen and Chen 2006; Fueki et al. 2020). It is argued
that some of these sources that validate changes in oil price is either oil demand
shocks or oil supply shocks (Kilian 2009; Chen et al. 2016), and the effect could
be either negative or positive (Chatziantoniou et al.2021).
The implication of these sources for example, oil demand shocks driven by
economic activities validate increase in real GDP following an oil price increase.
While the implication of oil supply shocks, however, differs across countries
following an oil price increase. Net oil importing countries may experience
decline in economic activities following an adverse oil supply shock, while the
consequences in oil exporting countries is insignificant or even positive
(Baumeister et al.2009).
Salisu and Isah (2017), Chatziantoniou et al. (2021) and Lin and Bai (2021) are
of the view that changes oil price play a significant role predicting of variations
in macroeconomic variables since it offers valuable information to policymakers,
investors, firms, financial market participant, and consumers in making
economic, investment and monetary decisions. Indeed, in a recent study,
Kocaarslan et al. (2020) provide evidence that oil prices dynamics contain
2
information that helps predict the asymmetric response of unemployment rate
to uncertainty and shocks in oil price in the US.
Another important aspect of studying the oil price-macroeconomic relationship
is understanding the asymmetric relationship. Asymmetric relationship between
oil price and macroeconomic variables involves examining the impact of
negative and positive effects of oil price on macroeconomic variables in the short
run and in the long run. The long run and short run effect of oil price-
macroeconomic relationship help in determining the degree and magnitude of
the effect. Furthermore, categorizing oil price-macroeconomic relationship into
long run and short run effect can help policymakers and investors determine the
type of policy to employ to hedge macroeconomic variables against oil price
shocks and make short run and long run investment decision respectively.
Asymmetric relationship between oil price and macroeconomic variables have
been empirically analysed in literature. For example, Jibril et al. (2020) used
SVAR model and decomposed oil price into oil supply shock and oil demand
shocks and asymmetrically examined the effect of these oil shocks on external
balances in net oil exporting and importing countries. Their result show
asymmetries in the effect of oil demand and supply shocks on external balances
in both net oil exporting and net oil importing countries. That is, positive and
negative oil price changes have varying effect on macroeconomic variables. It
then implies that, the asymmetries associated with oil demand and oil supply is
a significant factor in causing variations in macroeconomic variables. As such
policymakers should be concerned on this while formulating policies that will
minimize shocks from oil price to external balances.
3
Kocaarslan et al. (2020) employed a nonlinear autoregressive distributed lag
(NARDL) model to investigate the asymmetric effect of oil price uncertainty and
interest rate on unemployment rates in the USA. The result shows that
unemployment rates responded asymmetrically to oil price uncertainty. The
implication of this result is that to curb unemployment rates policy aimed at
reducing oil price uncertainty should be encouraged to lessen the negative effect
of oil price volatility.
Salisu and Isah (2017) estimated the symmetric (not accounting for positive
and negative changes in oil price) and asymmetric (accounting for positive and
negative changes in oil price) relationship between oil price and stock price in
the context of net oil-exporting and net oil-importing countries. They concluded
that stock prices responded asymmetrically to shocks in oil price both in net oil-
exporting and net oil-importing countries. Meaning that positive and negative
changes in oil price have different effect on stock prices. However, they opined
that the response is more evident in net oil exporters than in net oil importers.
The implication of their finding is that the degree of oil price shocks on stock
prices may not be the same for net oil exporting and net oil importing countries.
And policymakers and investors can utilize the information contained in the
finding for policy formulation and investment decisions making.
Jiang and Gu (2016) employed MF-DCCA method with daily data from 2000:4:1
to 2014:31:12 to analyse the asymmetric relationship between oil price and
exchange rates in net oil exporting and importing countries. They used
structural oil shocks and oil price trend as an indicator to differentiate the
asymmetries associated with changes in oil price in analyse oil price-
macroeconomic relationship. They found that the asymmetric degree
significantly varied. The implication is that discerning the sources oil price
4
shocks is significant for policymakers and investors given that the interaction
between oil price and exchange rate depended on it.
In contrast, Khan et al. (2019) found no evidence of an asymmetric short-run
and long-run relationship between oil price and GDP in Philippines, Thailand,
and Singapore, Malaysia, and Korea. In support of Khan et al. (2019) opinion,
Chen et al. (2016) found that the relationship between oil price shocks and
exchange rate in 16 countries which include Australia, Czech Republic, Canada,
Denmark, Hungary, Iceland, Korea, Japan, New Zealand, Mexico Norway,
Poland, Switzerland Sweden is not asymmetric
On the long run and short run asymmetric effect of oil price on macroeconomic
variables, scholars including Abeysinghe (2001) found a long-run effect of oil
price fluctuations on macroeconomic variables in the Asian economy. Chen et
al. (2016) is of the view that 10%-20% of the long-run variation in 16 OECD
currencies against the U.S dollar is forecasted by shocks in oil price. In contrast,
Basnet and Upadhyaya (2015) reported no evidence of a long-run relationship
between oil price changes and macroeconomic variables for Thailand, Indonesia,
Philippines, Singapore, and Malaysia.
The literature on the relationship between changes in oil prices and variations
in macroeconomic variables are mostly focused on developed countries of
Europe, the US, Asia, and Arab countries. For example, Du and Wei (2010)
focused on China’s economy, Berument et al. (2010) investigated countries in
the Middle East and North Africa (MENA) region, while Hanabusa (2009)
examined the Japanese economy, Lescaroux, and Mignon (2008) analysed
several groups of countries of net oil-exporting and net oil-importing countries.
Jiménez-Rodríguez and Sánchez (2005) offered empirical evidence on some
5
OECD countries; Cunado and Perez-de Gracia (2003, 2005) examined many
Asian and European countries.
In this study, the asymmetric relationship between oil price and macroeconomic
variables in the context of net oil exporting and net oil importing countries in
Africa is investigated using dataset covering 1996𝑞1 to 2016𝑞4. By using panel
ARDL model, this study re-investigates if macroeconomic variables respond to
asymmetric changes in oil price as has been documented in existing literature
in Africa which comprises mainly country-specific level (Fowowe 2014;
Chiwneza and Aye 2018), at net oil-exporting level (Omojolaibi and Egwaikhide
2013; Omolade et al.2019) and at net oil-importing level (Akinsola and
Odhiambo 2020). That is, this study investigates how changes in oil price cause
variations in macroeconomic variables in the long run and in the short run in
the context of net oil exporting and net oil importing countries in Africa.
Furthermore, this study examines the ability of oil prices to forecast future GDP
growth rate, interest rates, inflation, exchange rates, unemployment rates, food
supply, external debt, current accounts, and foreign reserves in accordance with
panel ARDL statistical prediction regression model that examine the relationship
between oil price and macroeconomic variables. See for example Salisu and
Isah (2017), Kocaarslan et al. (2020) and Liu et al. (2021).
This study contributes to literature in the following ways. First, this study
reviewed different oil price shock events covering 1996q1 to 2016 q4 using
extended literature and analyse how the structural shocks in oil price forecasted
macroeconomic variables including GDP, interest rate, inflation, exchange rates,
unemployment rates, food supply, external debt, current accounts, and foreign
reserves; in previous study in Africa close to this study only variable of interest
rate, GDP and trade openness have been used (see for example, Akinsola and

6
Odhiambo 2020). The justification for using the variables mentioned above is
well detailed in chapter 5 table 5.3. Second, this study reviewed the asymmetric
relationship between oil price and macroeconomic relationship not only in the
context of net oil exporting countries in Africa but also in the context of net oil
importing countries in Africa. The sample period used in analysing the extended
literature review enabled determining how different structural breaks of oil price
shocks affect macroeconomic variables within the sample size covered. The
findings present information to stakeholders on oil price-macroeconomic
relationship in the context of net oil exporting and oil importing in Africa. This
study fills this gap and explore the ability of oil price to explain variations in the
key macroeconomic variables using panel ARDL model. This is significant
because the information provided by this study which is not presented in
previous studies with scholars such as Kibunyi et al. (2018), Akinsola and
Odhiambo (2020) and Ogede et al. (2020), is now available in literature to
enable policymakers to formulate long run and short run policies to hedge
macroeconomic variables from oil price shocks in net oil exporting and oil
importing countries in Africa. This information will also enable investors to make
an informed long run and short run investment decisions.
This chapter is structured as follows: Section 1.1 puts forward the introduction.
The background of the study is discussed in section 1.2. The aim of the study
is presented in section 1.3 Section 1.4 put forward the originality of the study.
Methodology overview is discussed in section 1.5. Section 1.6 discusses the
contribution to knowledge. Section 1.7 summarised the structure of the thesis.
7
1.2 Background of the Study
Crude oil assumes significant importance in most African countries, as it is the
leading source of revenue generation (Onigbinde et al.2014). For example, in
Nigeria, Algeria, and Egypt, oil serves as a major source of foreign earnings
(Hou et al.2015) and a source of raw material for production in Kenya and South
Africa (Chiweza and Aye 2018; Kibunyi et al.2018). Over the years, crude oil
has overwhelmingly accounted for the larger portion of export and imports for
oil exporting and oil importing countries in Africa respectively (Omojolaibi and
Egwaikhide 2013; Kibunyi et al.2018). As such, it is expected that economies
with such significant involvement in crude oil export and import should be able
to achieve effective and sustainable economic growth that will shield
macroeconomic variables from oil price shocks (Essama-Nssah 2007). However,
literature has shown that macroeconomic variables of the key African countries
under study are vulnerable to oil price shocks (Olomola and Adejumo 2006;
Onigbinde et al.2014).
Furthermore, following the increase in oil price between 2000 to 2013, Nigeria,
Algeria, and Egypt generated huge foreign earnings from oil export (Wit and
Crookes 2013; Zahran 2019). With such huge foreign revenue from oil, the
economies of these countries are expected experience improved economic
growth through government spending on capital projects and investment on
infrastructural and agricultural development (Bouchaour and Al-Zeaud 2012;
Onigbinde et al. 2014). Instead, the GDP of Nigeria, Algeria, and Egypt declined
tremendously between 2015 and 2016. Nigeria, for example was classified as
the 3rd poverty-driven country in the globe by World Bank (2019),65% of
Algerian and 70% Kenyans are living in extreme poverty (World Bank 2019).
Despite the solid natural resources base of these countries, especially the net
8
oil-exporting countries such as Nigeria and Algeria, these countries have weakly
performed in economic growth (Kibunyi et al. 2018; Onigbinde et al.2014).
Given the lack of sustainable economic growth and the continued dependence
on crude oil as a significant source of revenue generation, the net oil-exporting
countries in Africa especially Nigeria and Algeria have been described in the
literature as representing an example of 'Dutch Diseases' (Olomola and
Adejumo 2006 and Lardic and Mignon 2005). This has given birth to why and
how fluctuations in oil price affect variations in GDP growth rate, given that the
net oil-exporting countries have significant revenue from crude oil and the net
oil-importing countries have significant trade involvement in crude oil. They
have achieved so little in enhancing economic growth. Based on the World Bank
estimation, about 90% of oil revenue is being mismanaged, especially in Nigeria,
through corrupt practices, as such economic activities and growth are impacted
(Kretzmann and Nooruddin 2005).
Auty (1998) argued that countries endowed with crude oil often experience
decreased economic performance and growth compared to countries with little
or no crude oil. Auty and Gelb (2001) supported this argument and pointed out
that a developing political environment is related to poor economy as result of
resource mismanagement. Equally noted is that significant importance is not
placed on the economy for investment efficiency (Adamu 2019). Literature has
argued that countries endowed with crude oil, especially in concentrated form,
seem to battle for rental income (De Wit and Crookes 2013). Furthermore, this
creates factional and rapacious conditions and a situation where rental income
is distributed through indirect means (Auty and Gelb 2001). As such, economic
activities are affected, thus, reduction in GDP growth rate.
9
Thus, there has been significant debate about how oil prices affect
macroeconomic variables. Some scholars argued that oil price affect
macroeconomic variables through reallocation effect (Doğrul and Soytas 2010),
while other argued that the effect of oil price on macroeconomic variables is
through uncertainty associated with oil price (Dixit and Pindyck 1994; Ferderer
1996). Furthermore, oil price is evidenced to predict variations in
macroeconomic variables through real business cycle (Brown and Yucel 2002;
González and Nabiyev 2009). Additionally, studies have shown that changes in
oil prices affect macroeconomic variables through different channels (Yildirim
and Arifli 2021). And these channels include supply-side effect channel,
demand-side effect channel, real balance effect channel, terms of trade channel
and inflation effect channel.
The effects of oil price on macroeconomic variables through any of these
channels can cause increase in production cost (Nusair and Olson 2021), budget
deficit (Alkhateeb et al. 2021; Jin and Xiong 2021), current account imbalances
(Balli et al. 2021; Gnimassoun et al. 2017; Qurat-Ul-Ain and Tufail 2013),
exchange rate dynamics (Tian et al. 2021; Qurat-Ul-Ain and Tufail 2013), Dutch
Disease (Ma et al.2021), interest rate dynamics (Baek and Choi 2021; Polbin et
al. 2020), loss of market share (Baffes et al.2015), reduction in foreign reserves
(Khan et al. 2021), increase in the unemployment rate (Kocaarsslan et al.
2020), external debt dynamics (Kretzmann and Nooruddin 2005 ) to inflationary
pressure (Zakaria et al. 2021; Liu 2021).
However, most of the studies in Africa that analysed how oil price affect
variations in macroeconomic variables through the above mentioned channels
are either country specific (Chiweza and Aye 2018; Kibunyi et al.2018), or are
on net oil importing countries (Akinsola and Odhiambo 2020) or are on net oil
10
exporting countries (Omolade et al. 2019; Ogede et al. 2020) , as such this
studies will fill in the identified gap by analysing the asymmetric relationship
between oil price and macroeconomic variables not only in the context of net oil
exporting countries but also in the context of net oil importing countries in
Africa. The findings will provide information to stakeholders including policy
makers, investors and academia which is not provided by previous scholars who
analysed this relationship in a country-specific level, or net oil exporting level or
net oil importing level. In responding to these gaps and with recent development
in oil price-macroeconomic relationship dynamics, this study will bridge these
gaps not only using extended literature review to analyse how the structural
breaks caused by oil price shocks affect macroeconomic variables of net oil
exporting and oil importing countries in Africa within the period of study, but
also this study employed panel ARDL model to analyse the asymmetric short
run and long run relationship between oil price and key macroeconomic
variables such as GDP, interest rates, inflation, exchange rates, unemployment
rates, food supply, external debt, current accounts and foreign reserves in the
context of net oil exporting but also in the context importing countries in Africa
to present a comparative analysis.
1.3 Aim of the study
This study aims to investigate the dynamic relationship between oil price and
macroeconomic variables in the context of net oil-exporting and net oil-
importing African countries. To address the research aim, the following
objectives are developed.

11
1. To examine if the asymmetric effect of oil price on macroeconomic variables is
the same in the short and long run, in net oil exporting and oil importing
countries in Africa.
2. To examine how oil price affect key macro-economic variables including
economic growth rate, interest rate, exchange rate, inflation, unemployment
rate, food supply, external debt, current account, and foreign reserves in net
oil-exporting and net oil-importing African countries from 1996𝑞1 to 2016𝑞4.
3. To examine if the asymmetric effects of oil price on macroeconomic variables
are the same in net oil-exporting and net oil-importing countries in Africa.
The first objective helps understand how fluctuations in oil prices affect
macroeconomic variables in the short and long run. For example, Cunado and
Gracia (2005) found the short-run effect of fluctuations in oil prices on
macroeconomic variables in the Asian economy. In contrast, Abeysinghe (2001)
found a long-run effect of oil price fluctuations on macroeconomic variables in
the same Asian economy. Understanding whether the effect of oil price on
macroeconomic variables is in the short run or long run will provide information
for policymakers and investors to formulate adequate short run or long run
policy and as well make an informed long run and short run investment decision.
The second objective will investigate the interplay between fluctuations in oil
price and macroeconomic variables and how this relationship impacts economic
activities and growth of net oil-exporting and net oil-importing countries. The
finding of this objective will provide information for policymakers to formulate
policy that is aimed at shielding macroeconomic variables from oil price shocks.
As studies including Lescaroux and Mignon (2008), Baffes et al. (2015) and Lin
and Bai (2021) were of the view that shocks in oil price affect macroeconomic
variables in net oil exporting and net oil importing countries differently.
12
The third objective will help to present a comparative analysis and examine if
changes in oil price have the same effect on the key macroeconomic variables
in net oil-exporting countries and in net oil-importing countries in Africa. This is
significant because policymakers and investors can utilize the information
contained in the finding for policy formulation and investment decisions. As
reviewed literature indicate that shocks in oil price affect macroeconomic
variables differently in net oil exporting and oil importing countries. For
example, Hou et al. (2015) and Lin and Bai (2021) concluded that oil price
shocks affect macroeconomic variables differently in net oil exporting and oil
importing countries. While other scholars including Salius and Isah (2017)
conclude that shocks in oil price have the same effect in net oil exporting and
net oil importing countries.
1.4 Significance of the Study
This study examines how changes in oil price relate to macroeconomic variables
in the context of net oil-exporting countries of Nigeria, Algeria, Egypt, and net
oil-importing countries of Kenya and South Africa. These countries were chosen
given their level of oil export (net oil-exporting) and their level of oil
consumption, and involvement in crude oil trade (net oil-importing and net oil-
exporting). Literature has shown that macroeconomic variables of these
selected economies are vulnerable to shocks in oil price, given their level of oil
exportation and oil importation (Onigbinde et al.2014; Chisadza et al.2016).
Several empirical analyses have been carried out to determine how
macroeconomic variables respond to oil prices. Aliyu (2011), Gbatu et al.
(2017), and Akinsola and Odhiambo (2020) analysed themes such as the
reasons for the asymmetries in the oil price- macroeconomic relationship in
economies of Africa. These studies focused on the lack of diversification,
13
ineffective and efficient policy application, Dutch disease syndrome, inadequate
utilization of revenues generated from oil windfall, corruption, and lack of
investments in capital projects (Olomola 2006; Iwayemi and Fowowe 2010;
Umar and Abdulhakeem 2010; Omojolabi and Egwaikhide 2013). Omojolabi and
Egwaikhide (2013) suggest that gross investment is a crucial channel through
which shocks in oil price affect macroeconomic variables in net oil-exporting
countries in Africa, hence, understanding this view will help policymakers and
investors to respectively make informed decisions on to shield macroeconomic
variables from oil price shock and invest properly.
However, there is a lack of research in the context of net oil-exporting and net
oil-importing countries, especially in Africa. Hence, focusing on net oil-exporting
and net oil-importing countries in Africa, this study differs from the studies
mentioned above and contribute to literature by not only using extended
literature review covering the major oil price events from 1996𝑞1 to 2016𝑞4 to
show how oil price forecasted macroeconomic variables in net oil exporters and
oil importers in Africa but also, to give further insight on how the structural
shocks in oil price within these sample periods influence macroeconomic
variables in net oil exporting and net oil importing countries in Africa.
Additionally, this study will capture the asymmetries and heterogeneity effects
in the oil price-macroeconomic relationship using panel data of net oil-exporting
and net oil-importing countries in Africa (see detail in chapter 2).
Furthermore, the findings from this study provide useful information that will
enhance cautious evaluation of the fundamental dynamics between oil price and
macroeconomic variables by investors, policymakers and monetary authorities
at the regional level and international level. This information is significant to
these stakeholders given that the frequently study variations in macroeconomic
14
variables to make investment decisions and formulate policies for sustainable
economic activities and growth. The information contained in this finding for
sustainable economic development and growth include formation of efficient and
effective monetary policy especially towards exchange rates and inflation that
may shield macroeconomic variables from oil price shocks. Engaging in
diversification strategies for example, if oil exporting countries pursue the
strategy of exporting of non-oil products, this may not only enhance increase of
their foreign earnings but also enhance employment rate and increase GDP
growth. While diversification towards solar energy will not only enhance energy
sustainability but also can reduce dependence on crude oil by net oil importing
countries. Hence, the negative effect of oil price increase on GDP growth rate
as opined by scholars including Hamilton (1996) and Lee et al. (1996) may be
minimized. Encouragement in infrastructural, manufacturing, and agricultural
development to help diversify the economy should be pursued. Thus, policies
that will enable oil price decline to improve external and fiscal balance which
will support economic growth should be pursued. This will boost savings and
economic growth during oil price decline to reduce the effect of shocks coming
from oil price increase on macroeconomic variables.
1.5 Methodology Overview
This section provides an overview of the research methodology adopted.
Quantitative approach that hinges on applying measurable and numeric data in
quantifying relationships alongside a statistical tool in analysing the correlational
relationship and co-integration between and among variables (Crossman 2019;
Healy and Perry 2000) is adopted. The justification of adopting quantitative
15
approach is to objectively determine in quantitative terms the asymmetric
relationship between oil price and macroeconomic variables. Given that the
methodological stance is taken from the school of positivism which anchors on
realism from ontological domain. Panel ARDL is used to analyse the unbiased
and value free data as hypothesis testing is involved to quantitatively examine
how shocks in oil price affect macroeconomic variables in net oil exporting and
oil importing countries in Africa. The findings are measurable and quantifiable
with statistical tools, meaning that the findings of this study can be generalised.
The quarterly data for all the macroeconomic variables including GDP, inflation
rate, interest rate, exchange rate, unemployment rate, food supply current
account, external debt, and foreign reserves covering from 1996𝑞1 to 2016𝑞4
are all secondarily sourced from DataStream of International Monetary Fund
(IMF) and Thompson Routers. Quarterly data for oil price covering from 1996𝑞1
to 2016𝑞4 is collected from Energy Information Administration (EIA) for this
analysis.
The results from the panel ARDL model would be used to examine how
cointegrated the variables are and well find out the asymmetries of these
variables concerning the short-run and the long-run equilibrium relationships.
The justification for analysing oil price-macroeconomic relationship in the
context of asymmetries is to give insight in understanding how oil price has
positive and negative effect on the key macroeconomic variables and as well to
determine the long run and short run effect of oil price on macroeconomic
variables in the context of net oil exporting and importing countries in Africa.
16
1.6 Contribution to Knowledge
This research contributed to the existing knowledge by reviewing not only the
asymmetric relationship between oil price and macroeconomic variable in the
context of net oil-exporting countries in Africa but also in the context of net oil-
importing economies in Africa. This has presented information to stakeholders
to spur a comparative analysis on oil price-macroeconomic relationship in the
context of net oil exporting and oil importing countries of Africa. This is
significant because the information provided by this study which is not present
in previous studies including Akinsola and Odhiambo (2020) can help
policymakers to formulate long run and short run policies to hedge
macroeconomic variables from oil price shocks in net oil exporting and oil
importing countries in Africa. The information will also enable investors to make
informed investments decisions. The awareness of this seemly information can
form a key aspect that could be addressed in future research.
This study also, contributed to existing literature in terms of the methodology
adopted by using visual presentation of scattered diagram of regression analysis
(see chapter 5) to give further insight of how oil price influenced the key
macroeconomic variables negatively and positively. The visual diagram can
enable readers to comprehend how oil price influence macroeconomic variables
by mere looking at the diagram. This also will provide information for policy
formulation and investment decision making.
Furthermore, extended literature review is used to capture the exposure of GDP
including other variables to the dynamics of oil price. This is done by reviewing
the finding of previous scholars on this relationship using various significant oil
price shocks events which include the oil price boom of 1996 –1998 associated
17
with OPEC policies, the 2002-2007 oil price increase related to industrial
revolution in Asia, the 2007-2009 oil price decline associated with global
financial crisis, the 2009-2013 oil price rise connected with continued increase
in industrial revolution and the 2014 -2016 oil price decline associated with
increase in unconventional oil production and appreciation of U.S dollar (see
chapter 2). The extended literature review is structured in such manner to
include the structural breaks of oil price shocks events within the period
analysed. This is to enable understanding of how oil price affects macroeconomic
variables of net oil exporting and oil importing countries in Africa within the
period of study.
Additionally, different estimation analysis, including Granger Causality and Wald
test, are considered for robustness purposes. This is to test the validity of the
findings of formulated hypotheses from the panel ARDL model.
Again, this study provides room for further studies to academia given that
varying differences and similarities were found at the same time in net oil
exporting and oil importing countries. This characteristic has put forward
information that can be adequately utilized by scholars to identify if there are
other exogeneous variables that are significant in predicting variations in
macroeconomic variables in African context.
Similarly, this study provides information that offers strategies to investors and
policymakers who frequently study variations in macroeconomic variables to
make investment decisions and formulate policies for sustainable economic
activities and growth. This information reflects investment decisions,
diversification strategies, fiscal and monetary policies frameworks.
18
1.7 Structure of the Thesis
The thesis is structured and presented in the following seven chapters:
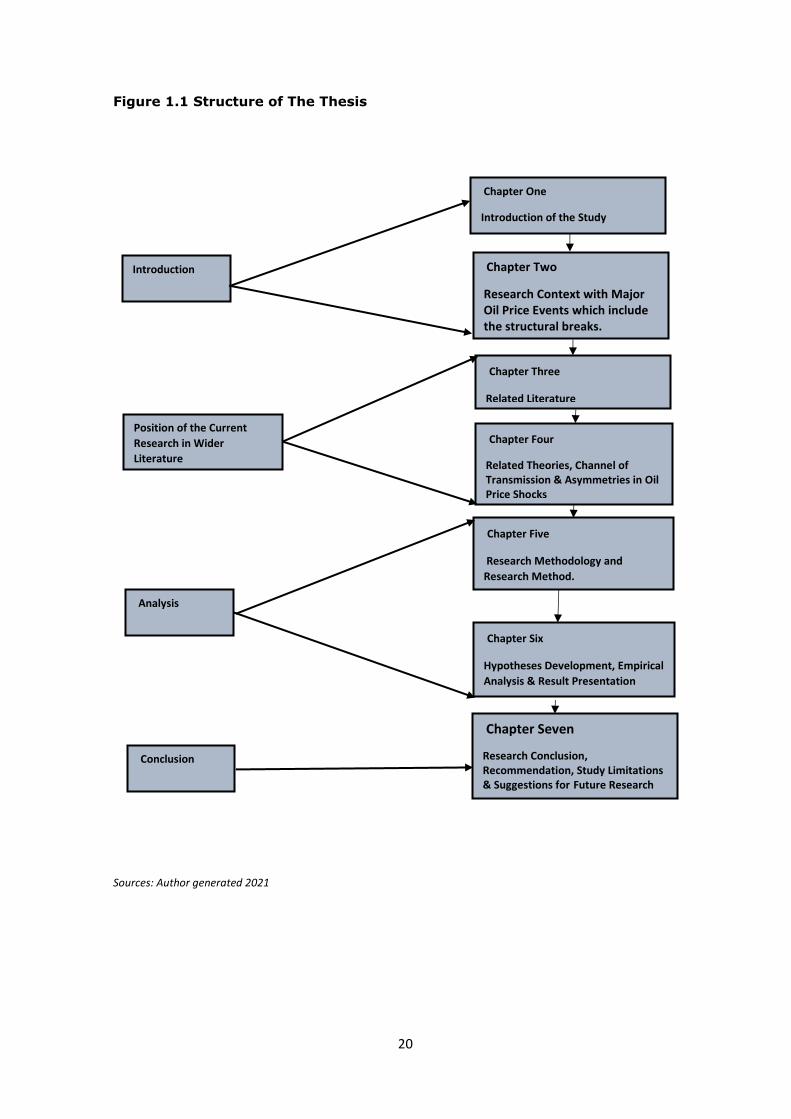
Chapter one: This chapter provided an introductory section of the study which
seeks to answer the question "Why the research," alongside the research
background, the significance of the research, the aim and objectives, the
methodological overview of the research, the contribution of the research to
knowledge and finally, the organized outline of the overall thesis.
Chapter Two: This chapter provides a comprehensive research context and
used different structural breaks in oil price to analyse how oil price affect
macroeconomic variables of the countries under study using extended literature
review. The structural breaks account for the major oil price events from 1996q1
to 2016 q4 that forecasted GDP growth rate including other macroeconomic
variables in context of net oil exporting and oil importing countries in Africa for
policy formulation and investment decision making.
Chapter Three: In this chapter, the thesis explored and reviewed the concepts
of related literature on how fluctuations in oil prices affect changes in
macroeconomic variables in the context of net oil-exporting and net oil-
importing countries.
Chapter Four: In this chapter, the conceptual review of related theories,
asymmetries, and the channels through which changes in the oil price are
transmitted into the macroeconomic variables were described and reviewed.
Chapter Five: In this chapter the research methodology, the research methods,
data collection technique and sample size and justification of variable selection
were duly presented. Also provided in this chapter is an overview of the
19
econometric analysis, panel unit root test overview as well as cointegration test
overview.
Chapter Six: This chapter presents the descriptive data analysis, correlation
matrix, hypotheses development, empirical analysis using panel ARDL model,
diagnostics, and robustness check alongside discussion of findings.
Chapter Seven: This chapter summarises the main research findings, the
practical relevance, the research contribution and the policy implications, the
study limitations, and suggestions for further research.
20
Figure 1.1 Structure of The Thesis
Sources: Author generated 2021
Introduction
Conclusion
Analysis
Position of the Current
Research in Wider
Literature
Chapter Seven
Research Conclusion, Recommendation, Study Limitations & Suggestions for Future Research
Chapter Six
Hypotheses Development, Empirical
Analysis & Result Presentation
Chapter Five
Research Methodology and
Research Method.
Chapter Four
Related Theories, Channel of Transmission & Asymmetries in Oil Price Shocks
Chapter Three
Related Literature
Chapter Two
Research Context with Major Oil Price Events which include the structural breaks.
Chapter One
Introduction of the Study
21
Chapter Two
An Overview of Research Context
2.0 Introduction
This chapter presents a detail insight of the context of the study. Gadderfors and
Anderson (2019) argued that research context is the backbone upon which studies
are carried out and this provided the basis for analyzing the relationship between
fluctuations in oil price and changes in macroeconomic variables within the context
of net oil exporting and net oil importing countries in Africa. Supporting this view,
several studies have recognized the significance of context (Fawowe 2014; Huang
and Guo 2007) in understanding how fluctuations in oil price affect movements in
macroeconomic variables to proffer solutions in terms of policy formulation
(Akinsola and Odhiambo 2002; Kocaarslan et al. 2002) and strategies (Salisu and
Isah 2017) to shield macroeconomic variables from the vulnerability to shocks in
oil price. The research context in which macroeconomic variables are impacted by
the fluctuations in oil price in net oil exporting and net oil importing countries is
characterized by unsustainable economic activities and growth in Africa (Didia and
Ayokunke 2020).
It is argued that the context in which fluctuations in oil price affect changes in
macroeconomic variables is vital and significance as the effect of fluctuations in
oil price on macroeconomic variables is assumed to be country specific (Iweyemi
and Fowowe 2010). Thus, this chapter is set out to review the changes in main
macroeconomic variables, including GDP performance, foreign reserves,
inflation, exchange rate, food supply, interest rate, unemployment rate,
current accounts, and external debt with respect to the major global oil
price event in the context of chosen net oil exporting and net oil importing

22
countries in Africa. This enables the understanding of how the structural breaks
within the major oil price events affect macroeconomic variables in the context of
net oil exporting and net oil importing countries in Africa. This study separates oil
importing and oil exporting countries not only because literature believe that the
response of macroeconomic variables to changes in oil price is country specific
(Iwayemi and Fowowe 2010) but also the response of macroeconomic variables
to changes in oil price is assumed to be a function of portfolio preference of both
net oil exporting and net oil importing countries and distribution of oil imports
across net oil importing countries (Fowowe 2014; Huang and Guo 2007)
The research context is structured as follows: Sections 2.1 and 2.2 provide an
overview of net oil exporting and net importing countries. Also, presented in this
chapter is the overall trend of shocks in oil price and relate these shocks to each
country’s performance in terms of GDP and other variables within the context of
the global major oil price events. The event of the major oil price changes under
consideration incorporate data from 1996𝑞1 to 2016𝑞4. to include the initial oil price
increase between 1996 to 1999, oil boom-period of 2002-2008, the financial crisis
of 2007-2009, the oil-supply disruption associated with Arab Spring and increased
industrial revolution in Asia countries of 2009-2013, as well as the oil price plunge
between 2014 to 2016. This is to find the different levels of effect of oil price on
macroeconomic variables within this period and presents comparative analysis
within the context of net oil exporting and importing countries in Africa.
As earlier mentioned, this chapter is divided into sections 2.1 and 2.2 which is
further divided into subsections. Section 2.1 presents the net oil exporting
countries and the associated response of macroeconomic variables to shocks in oil
price. Section 2.2 put forward the summary of macroeconomic variables response

23
to oil price shocks in net oil importing countries. Section 2.3 describes the
pathways through which shocks in oil price affected selected Africa oil exporting
and n oil importing countries. Section 2.4 put forward the summary of the chapter.
2.1 The Net Oil Exporting Countries
Nigeria, Algeria, and Egypt are three major oil producers and exporters in Africa
(Onigbinde et al.2014). These countries, Nigeria and Algeria are both OPEC
members. Although Egypt is not an OPEC member, however, she is considered as
one of the largest non-OPEC oil exporters (EIA2017). The existing studies show a
mixed results on the impact of macroeconomic variables to oil price fluctuations
(Aliyu 2011; Omojolaibi and Egwaikhide 2013; Rotimi and Ngalawa 2017). For
example, a negative impact of oil price on macroeconomic variables in net oil
exporting countries was reported by Mohsen and Mehrara (2008) and Berument
et al. (2010), Dabrowski and Bruegel (2015) and Omolade et al. (2019). While
positive impact of oil price on macroeconomic variables is reported by several
studies including Mork et al. (1994), Bjornland (2000), Jiménez-Rodríguez and
Sánchez (2004), Farzanegan Markwardt (2009), Madueme and Nwosu (2010),
Akinleye and Ekpo (2013), Emamgholi (2017) and Kibunyi et al. (2018).
The literature also recognizes that the fluctuations in oil price is a function of
supply or demand shocks, acknowledging this, provides information that help
forecast the response of macroeconomic variables to oil price volatility. For
example, González and Nabiyev (2009) and Kocaarslan et al. (2020) argued that
decrease in availability of basic input for production which validates decline in
production and reduced output growth is a function of oil supply shock. On the
other hand, Kilian (2014) argued that the oil demand shock is felt through
consumption and investment. Continued increase oil price can validate decline in

24
total consumption and investment and this may ultimately affect GDP growth rate
(Ahmed 2013; Brown and Yucel 2002).
Another issue that has drawn the interest of academia, policy makers and
investors is whether macroeconomic variables react asymmetrically to changes in
oil price. The recognition of asymmetries in the adjustment process is important
because for example, the unexpected changes in oil price can cause changes in
the equilibrium allocation of production across the economy’s different sectors and
this may cause shocks in macroeconomic variables (Nusair and Olson 2021). There
is no consensus among empirical findings on the asymmetric response of
macroeconomic variables to fluctuations in oil price Lescaroux and Mignon (2008),
Mehrara (2008), Moshiri and Banihasem (2012) and Reboredo and Rivera-Castro
(2014) and Nusair and Olson (2021). Most of the existing findings focus mainly on
the economies of USA, Europe, and Asia. This study will examine the asymmetries
associated with relationship between oil price and macroeconomic variables in the
context of selected African countries. However, the main focus of the relationship
between oil price and macroeconomic variables will be on GDP, current accounts
and foreign reserves for most of the countries under consideration.
2.1.1 Nigeria and Oil Price Shocks
Nigeria is a country in west Africa that is rich in natural resources including crude
oil (Kretzmann and Nooruddin 2005). Nigeria is the sixth largest crude oil exporter
of OPEC members (EIA 2014; Akpan 2009). Crude oil was discovered in
commercial quantity in Nigeria in 1956 (Umar and Abdulhakeem 2010), and since
then her economy has been dominated by oil. In Nigeria, oil accounts for about
90% of exports, 80% of foreign revenue and 25% of GDP in 2013 (Onigbinde et
al.2014). Thus, any slight change in the price of oil can significantly affect Nigerian

25
economy given that the economy is not diversified (Onigbinde et al. 2014). For
example, $1 USD increase in oil price in the early 1990s saw an increase in Nigeria
foreign earnings by about $650 million USD and that is about 2% increase in GDP
(Umar and Abdulhakeem 2010).
Reviewed literature identified shocks in oil price as a function of demand and
supply effect (Akinsola and Odhiambo 2020; Kocaarslan et al.2020; Salisu and
Isah 2017; Odhiambo 2010; Iwayemi and Fowowe 2010 and Hamilton 1996). Most
of the fluctuations in oil price has been traced to have risen from supply disruptions
to include OPEC supply quotas, surge in unconventional oil production, geopolitical
risk, activities of militant groups in oil producing states in Nigeria. The shocks are
classified to be positive with increase in oil price or negative with a fall in the price
of oil (Akpan 2009).
Five oil shocks can be observed in Nigeria during the sample period ranging from
1996𝑞1 to 2016𝑞4.The shocks in oil prices are all related to changes in
macroeconomic activities in Nigeria. For example, 1996 to 1998 increase in oil
price were associated with OPEC policies and Asian crisis (Hamilton 2013). Period
of 2002 – 2007 saw an increase in oil prices followed by industrial revolution in
Asian economies (Hamilton 2013). Within the period 2007-2009, there was a
slight decline in oil price closely related to global financial crisis (Akpan 2009; Sill
2007). The period of 2009 – 2013 saw the continued increase in oil price due to
continued industrial growth in Asian countries (Hamilton 2013). However, the
period of oil price declined between 2014 and 2016 is assumed to be a function of
increase in unconventional oil production in U.S and the activities of non-OPEC
(Baffes et al.2015). The response of macroeconomic variables to the major oil
price shocks in Nigeria is presented in tables 2.1. The analysis is visually supported
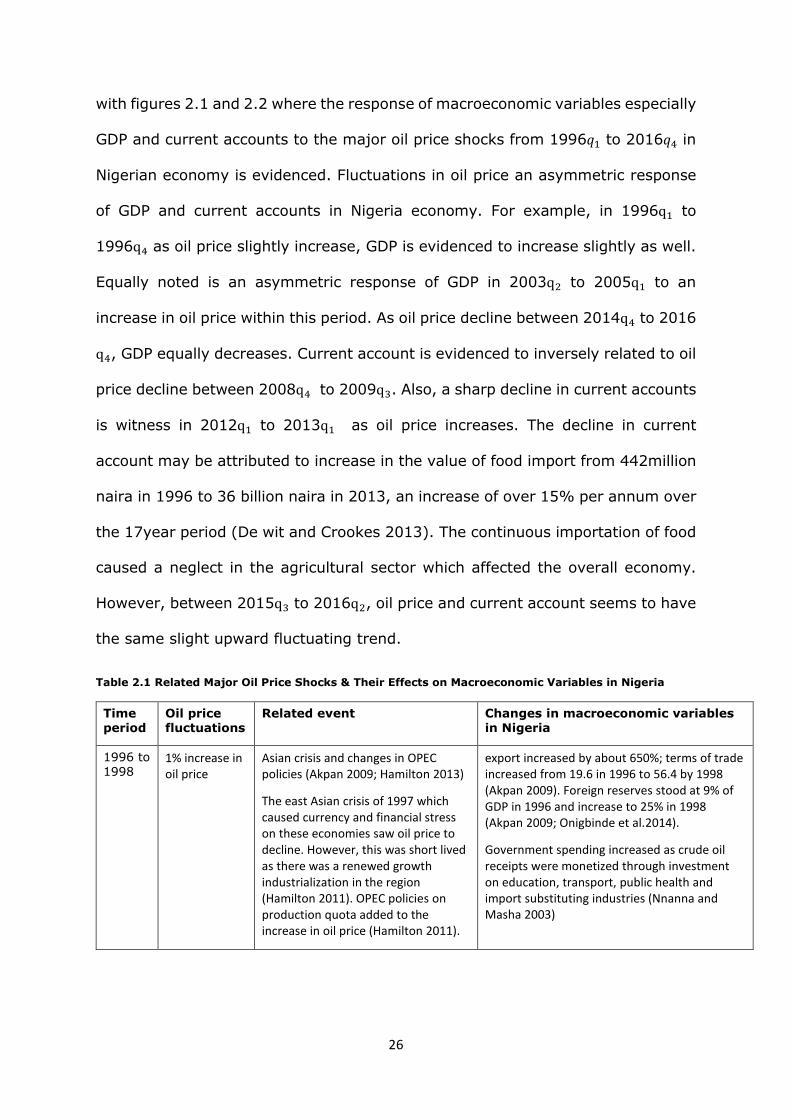
26
with figures 2.1 and 2.2 where the response of macroeconomic variables especially
GDP and current accounts to the major oil price shocks from 1996𝑞1 to 2016𝑞4 in
Nigerian economy is evidenced. Fluctuations in oil price an asymmetric response
of GDP and current accounts in Nigeria economy. For example, in 1996q1 to
1996q4 as oil price slightly increase, GDP is evidenced to increase slightly as well.
Equally noted is an asymmetric response of GDP in 2003q2 to 2005q1 to an
increase in oil price within this period. As oil price decline between 2014q4 to 2016
q4, GDP equally decreases. Current account is evidenced to inversely related to oil
price decline between 2008q4 to 2009q3. Also, a sharp decline in current accounts
is witness in 2012q1 to 2013q1 as oil price increases. The decline in current
account may be attributed to increase in the value of food import from 442million
naira in 1996 to 36 billion naira in 2013, an increase of over 15% per annum over
the 17year period (De wit and Crookes 2013). The continuous importation of food
caused a neglect in the agricultural sector which affected the overall economy.
However, between 2015q3 to 2016q2, oil price and current account seems to have
the same slight upward fluctuating trend.
Table 2.1 Related Major Oil Price Shocks & Their Effects on Macroeconomic Variables in Nigeria
Time period
Oil price fluctuations
Related event Changes in macroeconomic variables in Nigeria
1996 to 1998
1% increase in oil price
Asian crisis and changes in OPEC policies (Akpan 2009; Hamilton 2013)
The east Asian crisis of 1997 which caused currency and financial stress on these economies saw oil price to decline. However, this was short lived as there was a renewed growth industrialization in the region (Hamilton 2011). OPEC policies on production quota added to the increase in oil price (Hamilton 2011).
export increased by about 650%; terms of trade increased from 19.6 in 1996 to 56.4 by 1998 (Akpan 2009). Foreign reserves stood at 9% of GDP in 1996 and increase to 25% in 1998 (Akpan 2009; Onigbinde et al.2014).
Government spending increased as crude oil receipts were monetized through investment on education, transport, public health and import substituting industries (Nnanna and Masha 2003)
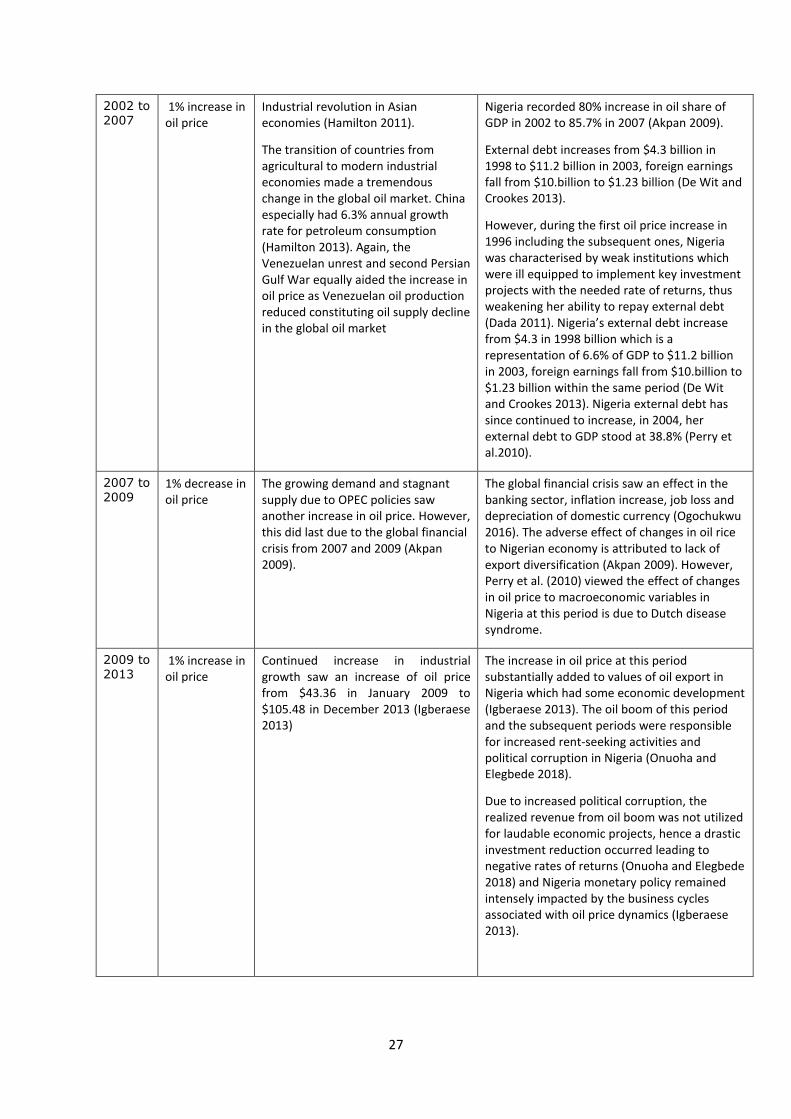
27
2002 to 2007
1% increase in oil price
Industrial revolution in Asian economies (Hamilton 2011).
The transition of countries from agricultural to modern industrial economies made a tremendous change in the global oil market. China especially had 6.3% annual growth rate for petroleum consumption (Hamilton 2013). Again, the Venezuelan unrest and second Persian Gulf War equally aided the increase in oil price as Venezuelan oil production reduced constituting oil supply decline in the global oil market
Nigeria recorded 80% increase in oil share of GDP in 2002 to 85.7% in 2007 (Akpan 2009).
External debt increases from $4.3 billion in 1998 to $11.2 billion in 2003, foreign earnings fall from $10.billion to $1.23 billion (De Wit and Crookes 2013).
However, during the first oil price increase in 1996 including the subsequent ones, Nigeria was characterised by weak institutions which were ill equipped to implement key investment projects with the needed rate of returns, thus weakening her ability to repay external debt (Dada 2011). Nigeria’s external debt increase from $4.3 in 1998 billion which is a representation of 6.6% of GDP to $11.2 billion in 2003, foreign earnings fall from $10.billion to $1.23 billion within the same period (De Wit and Crookes 2013). Nigeria external debt has since continued to increase, in 2004, her external debt to GDP stood at 38.8% (Perry et al.2010).
2007 to 2009
1% decrease in oil price
The growing demand and stagnant supply due to OPEC policies saw another increase in oil price. However, this did last due to the global financial crisis from 2007 and 2009 (Akpan 2009).
The global financial crisis saw an effect in the banking sector, inflation increase, job loss and depreciation of domestic currency (Ogochukwu 2016). The adverse effect of changes in oil rice to Nigerian economy is attributed to lack of export diversification (Akpan 2009). However, Perry et al. (2010) viewed the effect of changes in oil price to macroeconomic variables in Nigeria at this period is due to Dutch disease syndrome.
2009 to 2013
1% increase in oil price
Continued increase in industrial growth saw an increase of oil price from $43.36 in January 2009 to $105.48 in December 2013 (Igberaese 2013)
The increase in oil price at this period substantially added to values of oil export in Nigeria which had some economic development (Igberaese 2013). The oil boom of this period and the subsequent periods were responsible for increased rent-seeking activities and political corruption in Nigeria (Onuoha and Elegbede 2018).
Due to increased political corruption, the realized revenue from oil boom was not utilized for laudable economic projects, hence a drastic investment reduction occurred leading to negative rates of returns (Onuoha and Elegbede 2018) and Nigeria monetary policy remained intensely impacted by the business cycles associated with oil price dynamics (Igberaese 2013).
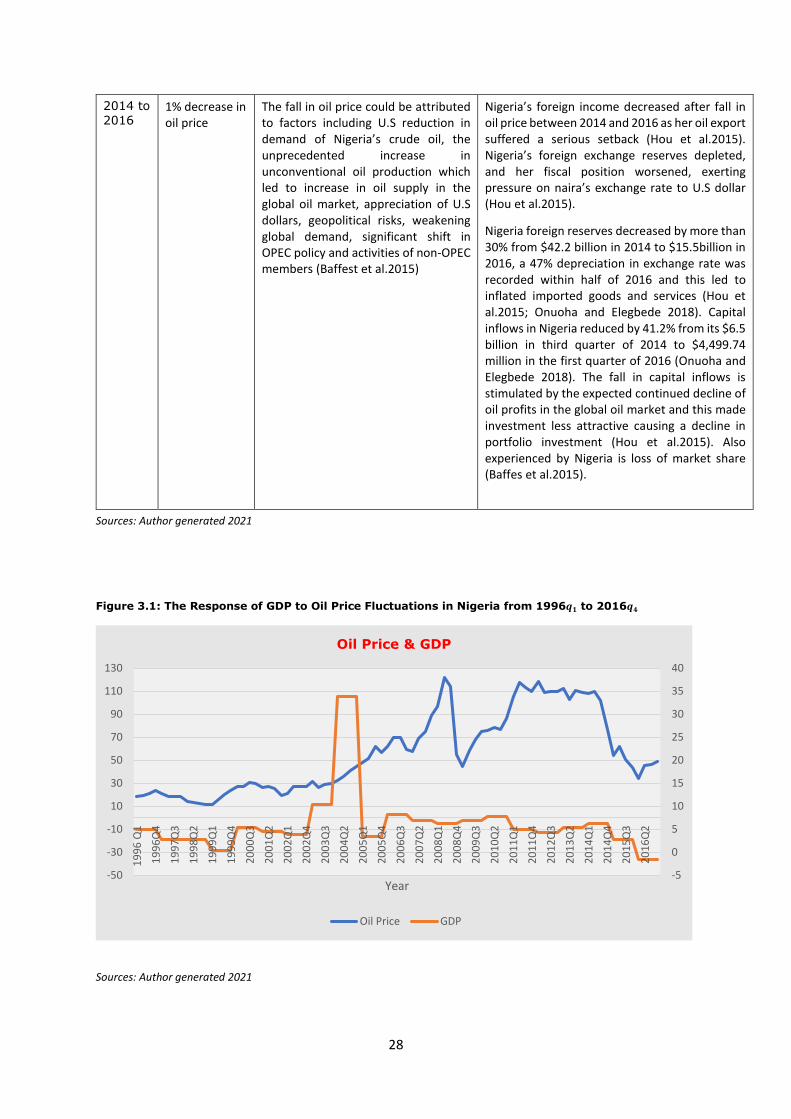
28
2014 to 2016
1% decrease in oil price
The fall in oil price could be attributed to factors including U.S reduction in demand of Nigeria’s crude oil, the unprecedented increase in unconventional oil production which led to increase in oil supply in the global oil market, appreciation of U.S dollars, geopolitical risks, weakening global demand, significant shift in OPEC policy and activities of non-OPEC members (Baffest et al.2015)
Nigeria’s foreign income decreased after fall in oil price between 2014 and 2016 as her oil export suffered a serious setback (Hou et al.2015). Nigeria’s foreign exchange reserves depleted, and her fiscal position worsened, exerting pressure on naira’s exchange rate to U.S dollar (Hou et al.2015).
Nigeria foreign reserves decreased by more than 30% from $42.2 billion in 2014 to $15.5billion in 2016, a 47% depreciation in exchange rate was recorded within half of 2016 and this led to inflated imported goods and services (Hou et al.2015; Onuoha and Elegbede 2018). Capital inflows in Nigeria reduced by 41.2% from its $6.5 billion in third quarter of 2014 to $4,499.74 million in the first quarter of 2016 (Onuoha and Elegbede 2018). The fall in capital inflows is stimulated by the expected continued decline of oil profits in the global oil market and this made investment less attractive causing a decline in portfolio investment (Hou et al.2015). Also experienced by Nigeria is loss of market share (Baffes et al.2015).
Sources: Author generated 2021
Figure 3.1: The Response of GDP to Oil Price Fluctuations in Nigeria from 1996𝒒𝟏 to 2016𝒒𝟒
Sources: Author generated 2021
-5
0
5
10
15
20
25
30
35
40
-50
-30
-10
10
30
50
70
90
110
130
19
96
Q1
19
96
Q4
19
97
Q3
19
98
Q2
19
99
Q1
19
99
Q4
20
00
Q3
20
01
Q2
20
02
Q1
20
02
Q4
20
03
Q3
20
04
Q2
20
05
Q1
20
05
Q4
20
06
Q3
20
07
Q2
20
08
Q1
20
08
Q4
20
09
Q3
20
10
Q2
20
11
Q1
20
11
Q4
20
12
Q3
20
13
Q2
20
14
Q1
20
14
Q4
20
15
Q3
20
16
Q2
Year
Oil Price & GDP
Oil Price GDP
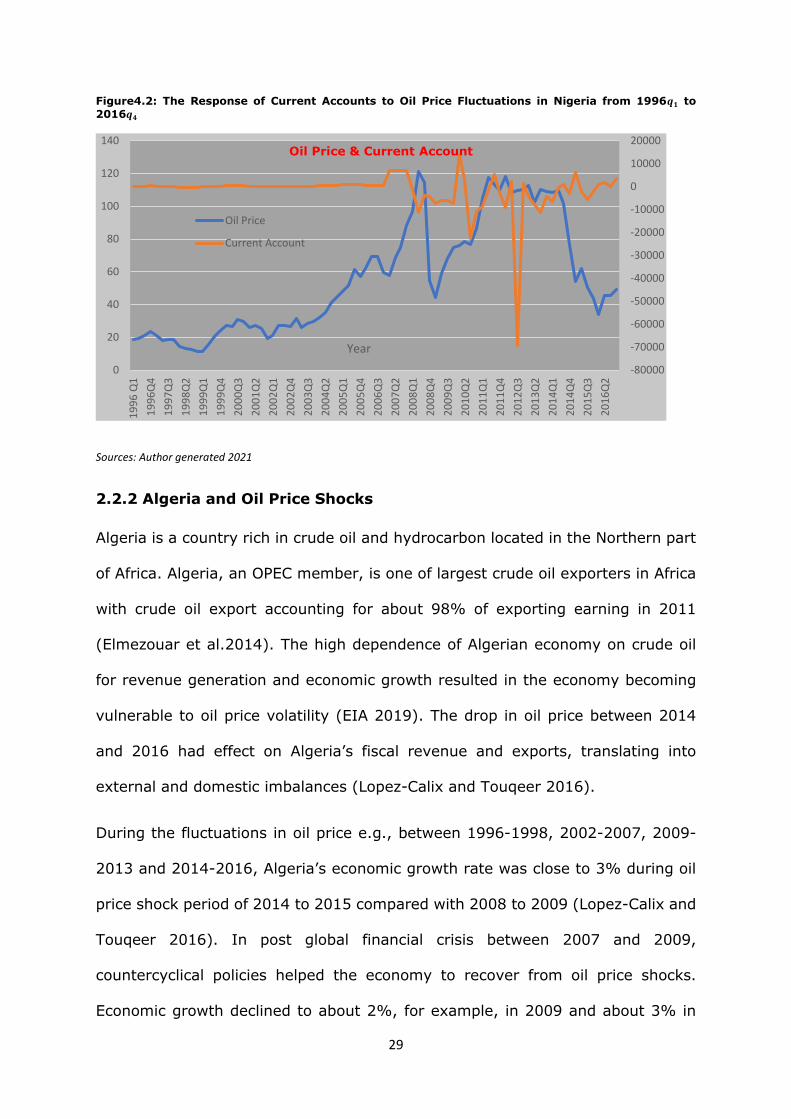
29
Figure4.2: The Response of Current Accounts to Oil Price Fluctuations in Nigeria from 1996𝒒𝟏 to
2016𝒒𝟒
Sources: Author generated 2021
2.2.2 Algeria and Oil Price Shocks
Algeria is a country rich in crude oil and hydrocarbon located in the Northern part
of Africa. Algeria, an OPEC member, is one of largest crude oil exporters in Africa
with crude oil export accounting for about 98% of exporting earning in 2011
(Elmezouar et al.2014). The high dependence of Algerian economy on crude oil
for revenue generation and economic growth resulted in the economy becoming
vulnerable to oil price volatility (EIA 2019). The drop in oil price between 2014
and 2016 had effect on Algeria’s fiscal revenue and exports, translating into
external and domestic imbalances (Lopez-Calix and Touqeer 2016).
During the fluctuations in oil price e.g., between 1996-1998, 2002-2007, 2009-
2013 and 2014-2016, Algeria’s economic growth rate was close to 3% during oil
price shock period of 2014 to 2015 compared with 2008 to 2009 (Lopez-Calix and
Touqeer 2016). In post global financial crisis between 2007 and 2009,
countercyclical policies helped the economy to recover from oil price shocks.
Economic growth declined to about 2%, for example, in 2009 and about 3% in
-80000
-70000
-60000
-50000
-40000
-30000
-20000
-10000
0
10000
20000
0
20
40
60
80
100
120
1401
99
6 Q
1
19
96
Q4
19
97
Q3
19
98
Q2
19
99
Q1
19
99
Q4
20
00
Q3
20
01
Q2
20
02
Q1
20
02
Q4
20
03
Q3
20
04
Q2
20
05
Q1
20
05
Q4
20
06
Q3
20
07
Q2
20
08
Q1
20
08
Q4
20
09
Q3
20
10
Q2
20
11
Q1
20
11
Q4
20
12
Q3
20
13
Q2
20
14
Q1
20
14
Q4
20
15
Q3
20
16
Q2
Year
Oil Price & Current Account
Oil Price
Current Account
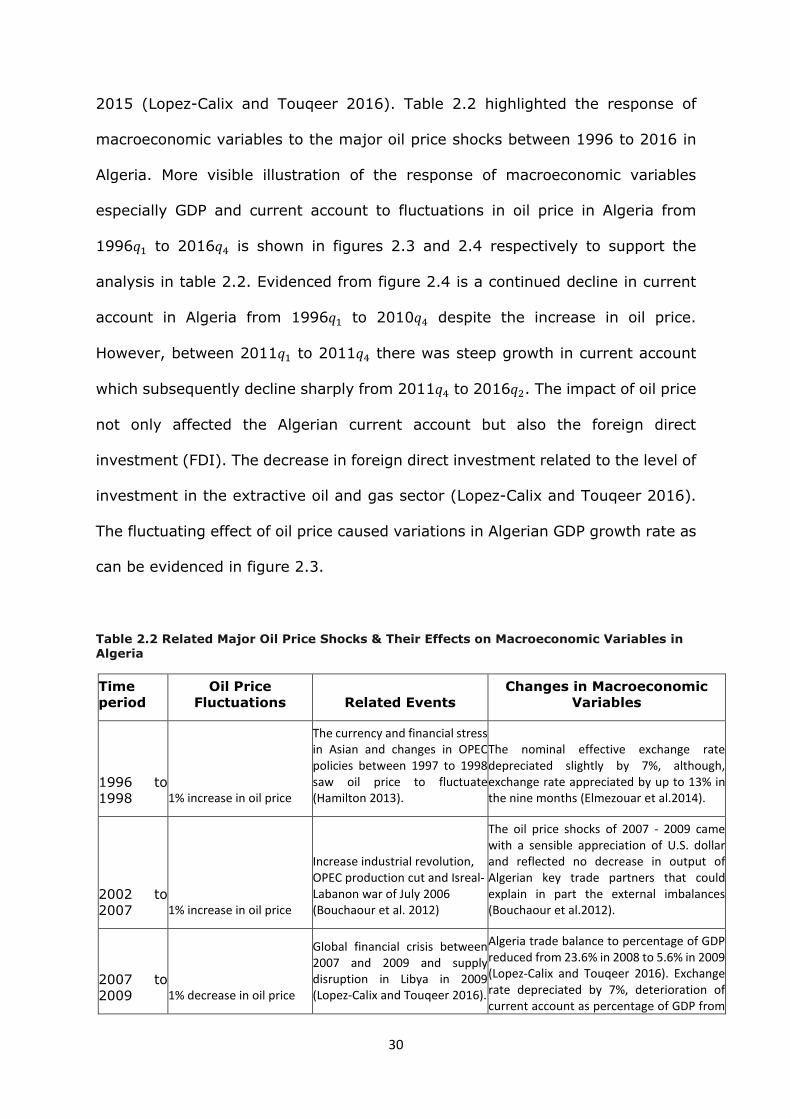
30
2015 (Lopez-Calix and Touqeer 2016). Table 2.2 highlighted the response of
macroeconomic variables to the major oil price shocks between 1996 to 2016 in
Algeria. More visible illustration of the response of macroeconomic variables
especially GDP and current account to fluctuations in oil price in Algeria from
1996𝑞1 to 2016𝑞4 is shown in figures 2.3 and 2.4 respectively to support the
analysis in table 2.2. Evidenced from figure 2.4 is a continued decline in current
account in Algeria from 1996𝑞1 to 2010𝑞4 despite the increase in oil price.
However, between 2011𝑞1 to 2011𝑞4 there was steep growth in current account
which subsequently decline sharply from 2011𝑞4 to 2016𝑞2. The impact of oil price
not only affected the Algerian current account but also the foreign direct
investment (FDI). The decrease in foreign direct investment related to the level of
investment in the extractive oil and gas sector (Lopez-Calix and Touqeer 2016).
The fluctuating effect of oil price caused variations in Algerian GDP growth rate as
can be evidenced in figure 2.3.
Table 2.2 Related Major Oil Price Shocks & Their Effects on Macroeconomic Variables in Algeria
Time
period
Oil Price
Fluctuations Related Events
Changes in Macroeconomic
Variables
1996 to
1998
1% increase in oil price
The currency and financial stress in Asian and changes in OPEC policies between 1997 to 1998 saw oil price to fluctuate (Hamilton 2013).
The nominal effective exchange rate depreciated slightly by 7%, although, exchange rate appreciated by up to 13% in the nine months (Elmezouar et al.2014).
2002 to
2007 1% increase in oil price
Increase industrial revolution, OPEC production cut and Isreal-Labanon war of July 2006 (Bouchaour et al. 2012)
The oil price shocks of 2007 - 2009 came with a sensible appreciation of U.S. dollar and reflected no decrease in output of Algerian key trade partners that could explain in part the external imbalances (Bouchaour et al.2012).
2007 to
2009 1% decrease in oil price
Global financial crisis between 2007 and 2009 and supply disruption in Libya in 2009 (Lopez-Calix and Touqeer 2016).
Algeria trade balance to percentage of GDP reduced from 23.6% in 2008 to 5.6% in 2009 (Lopez-Calix and Touqeer 2016). Exchange rate depreciated by 7%, deterioration of current account as percentage of GDP from
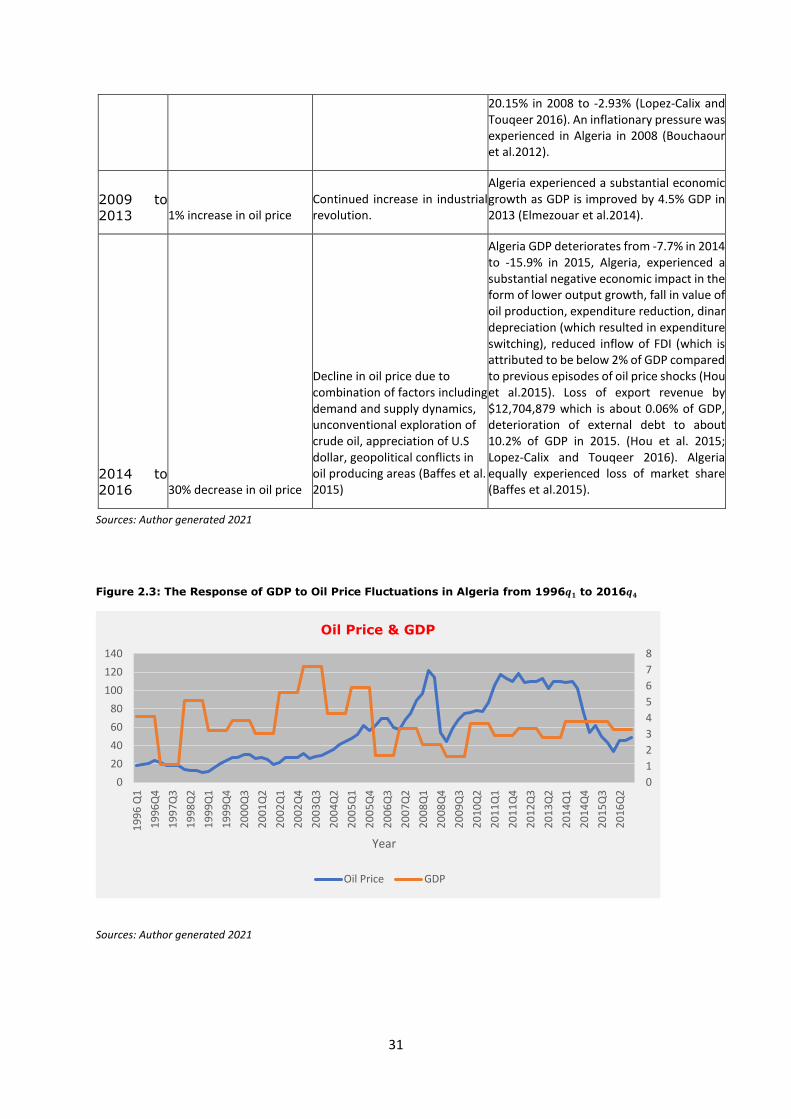
31
20.15% in 2008 to -2.93% (Lopez-Calix and Touqeer 2016). An inflationary pressure was experienced in Algeria in 2008 (Bouchaour et al.2012).
2009 to
2013 1% increase in oil price Continued increase in industrial revolution.
Algeria experienced a substantial economic growth as GDP is improved by 4.5% GDP in 2013 (Elmezouar et al.2014).
2014 to
2016 30% decrease in oil price
Decline in oil price due to combination of factors including demand and supply dynamics, unconventional exploration of crude oil, appreciation of U.S dollar, geopolitical conflicts in oil producing areas (Baffes et al. 2015)
Algeria GDP deteriorates from -7.7% in 2014 to -15.9% in 2015, Algeria, experienced a substantial negative economic impact in the form of lower output growth, fall in value of oil production, expenditure reduction, dinar depreciation (which resulted in expenditure switching), reduced inflow of FDI (which is attributed to be below 2% of GDP compared to previous episodes of oil price shocks (Hou et al.2015). Loss of export revenue by $12,704,879 which is about 0.06% of GDP, deterioration of external debt to about 10.2% of GDP in 2015. (Hou et al. 2015; Lopez-Calix and Touqeer 2016). Algeria equally experienced loss of market share (Baffes et al.2015).
Sources: Author generated 2021
Figure 2.3: The Response of GDP to Oil Price Fluctuations in Algeria from 1996𝒒𝟏 to 2016𝒒𝟒
Sources: Author generated 2021
0
1
2
3
4
5
6
7
8
0
20
40
60
80
100
120
140
19
96
Q1
19
96
Q4
19
97
Q3
19
98
Q2
19
99
Q1
19
99
Q4
20
00
Q3
20
01
Q2
20
02
Q1
20
02
Q4
20
03
Q3
20
04
Q2
20
05
Q1
20
05
Q4
20
06
Q3
20
07
Q2
20
08
Q1
20
08
Q4
20
09
Q3
20
10
Q2
20
11
Q1
20
11
Q4
20
12
Q3
20
13
Q2
20
14
Q1
20
14
Q4
20
15
Q3
20
16
Q2
Year
Oil Price & GDP
Oil Price GDP
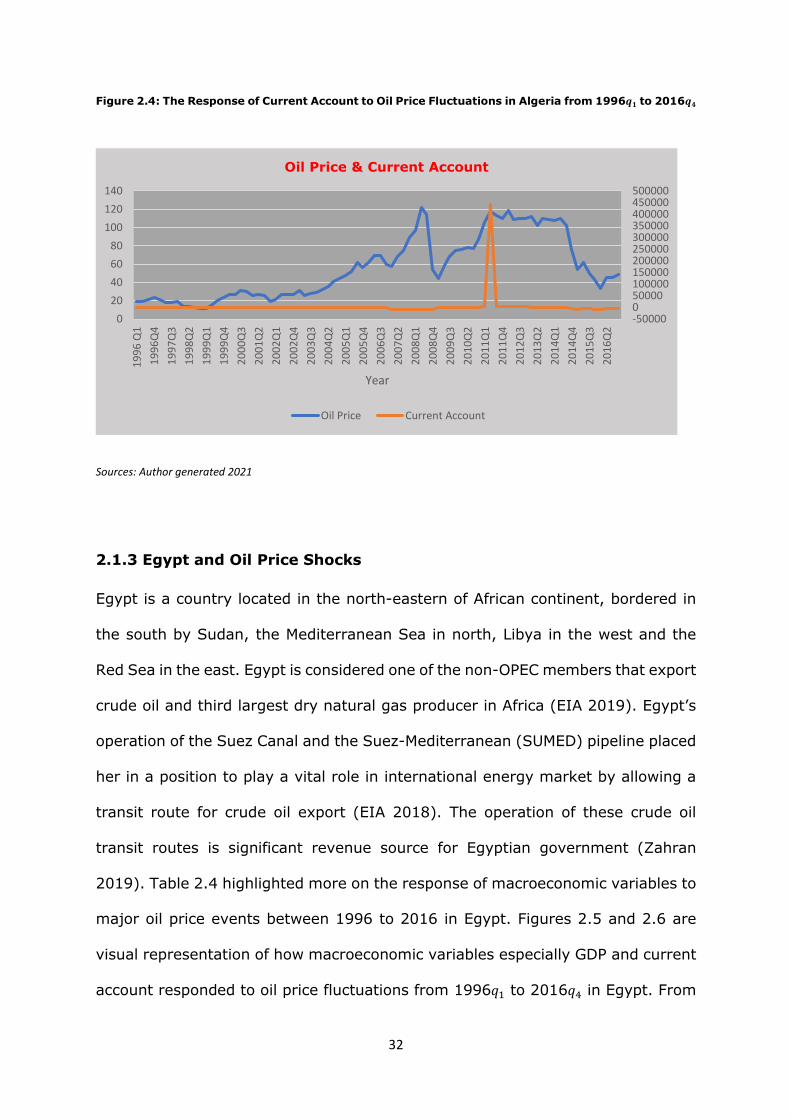
32
Figure 2.4: The Response of Current Account to Oil Price Fluctuations in Algeria from 1996𝒒𝟏 to 2016𝒒𝟒
Sources: Author generated 2021
2.1.3 Egypt and Oil Price Shocks
Egypt is a country located in the north-eastern of African continent, bordered in
the south by Sudan, the Mediterranean Sea in north, Libya in the west and the
Red Sea in the east. Egypt is considered one of the non-OPEC members that export
crude oil and third largest dry natural gas producer in Africa (EIA 2019). Egypt’s
operation of the Suez Canal and the Suez-Mediterranean (SUMED) pipeline placed
her in a position to play a vital role in international energy market by allowing a
transit route for crude oil export (EIA 2018). The operation of these crude oil
transit routes is significant revenue source for Egyptian government (Zahran
2019). Table 2.4 highlighted more on the response of macroeconomic variables to
major oil price events between 1996 to 2016 in Egypt. Figures 2.5 and 2.6 are
visual representation of how macroeconomic variables especially GDP and current
account responded to oil price fluctuations from 1996𝑞1 to 2016𝑞4 in Egypt. From
-50000050000100000150000200000250000300000350000400000450000500000
0
20
40
60
80
100
120
140
19
96
Q1
19
96
Q4
19
97
Q3
19
98
Q2
19
99
Q1
19
99
Q4
20
00
Q3
20
01
Q2
20
02
Q1
20
02
Q4
20
03
Q3
20
04
Q2
20
05
Q1
20
05
Q4
20
06
Q3
20
07
Q2
20
08
Q1
20
08
Q4
20
09
Q3
20
10
Q2
20
11
Q1
20
11
Q4
20
12
Q3
20
13
Q2
20
14
Q1
20
14
Q4
20
15
Q3
20
16
Q2
Year
Oil Price & Current Account
Oil Price Current Account
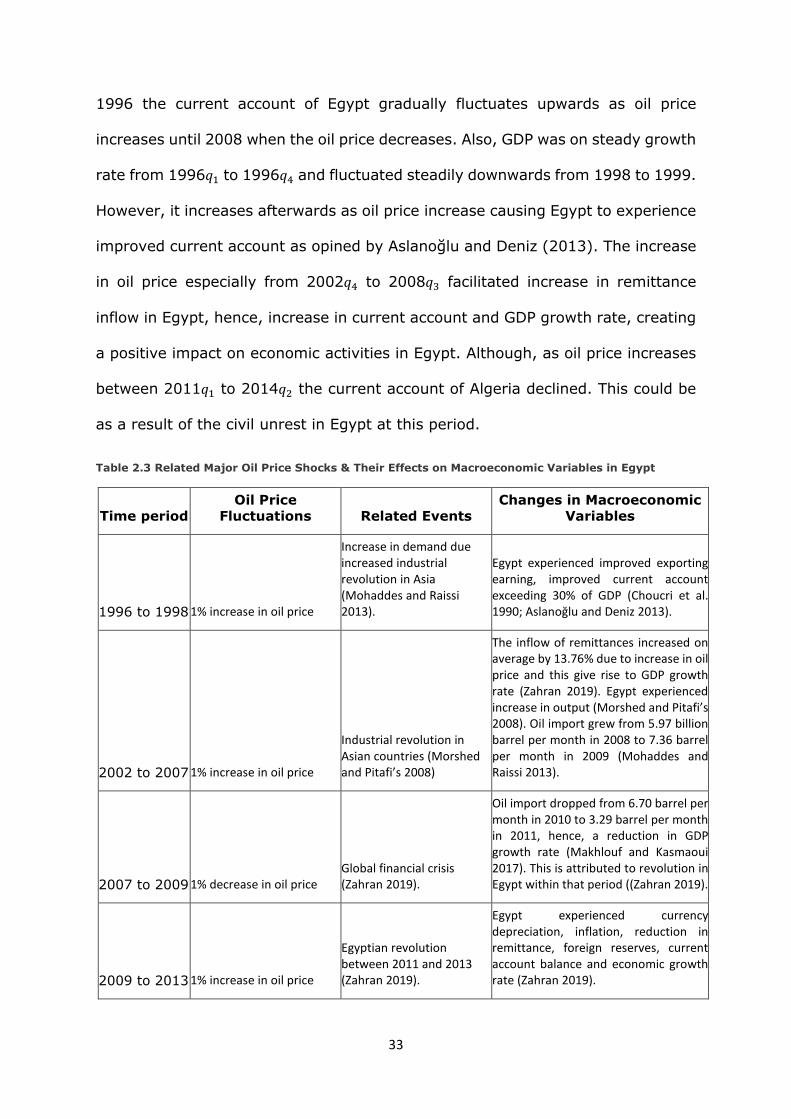
33
1996 the current account of Egypt gradually fluctuates upwards as oil price
increases until 2008 when the oil price decreases. Also, GDP was on steady growth
rate from 1996𝑞1 to 1996𝑞4 and fluctuated steadily downwards from 1998 to 1999.
However, it increases afterwards as oil price increase causing Egypt to experience
improved current account as opined by Aslanoğlu and Deniz (2013). The increase
in oil price especially from 2002𝑞4 to 2008𝑞3 facilitated increase in remittance
inflow in Egypt, hence, increase in current account and GDP growth rate, creating
a positive impact on economic activities in Egypt. Although, as oil price increases
between 2011𝑞1 to 2014𝑞2 the current account of Algeria declined. This could be
as a result of the civil unrest in Egypt at this period.
Table 2.3 Related Major Oil Price Shocks & Their Effects on Macroeconomic Variables in Egypt
Time period
Oil Price
Fluctuations Related Events
Changes in Macroeconomic
Variables
1996 to 1998 1% increase in oil price
Increase in demand due increased industrial revolution in Asia (Mohaddes and Raissi 2013).
Egypt experienced improved exporting earning, improved current account exceeding 30% of GDP (Choucri et al. 1990; Aslanoğlu and Deniz 2013).
2002 to 2007 1% increase in oil price
Industrial revolution in Asian countries (Morshed and Pitafi’s 2008)
The inflow of remittances increased on average by 13.76% due to increase in oil price and this give rise to GDP growth rate (Zahran 2019). Egypt experienced increase in output (Morshed and Pitafi’s 2008). Oil import grew from 5.97 billion barrel per month in 2008 to 7.36 barrel per month in 2009 (Mohaddes and Raissi 2013).
2007 to 2009 1% decrease in oil price Global financial crisis (Zahran 2019).
Oil import dropped from 6.70 barrel per month in 2010 to 3.29 barrel per month in 2011, hence, a reduction in GDP growth rate (Makhlouf and Kasmaoui 2017). This is attributed to revolution in Egypt within that period ((Zahran 2019).
2009 to 2013 1% increase in oil price
Egyptian revolution between 2011 and 2013 (Zahran 2019).
Egypt experienced currency depreciation, inflation, reduction in remittance, foreign reserves, current account balance and economic growth rate (Zahran 2019).
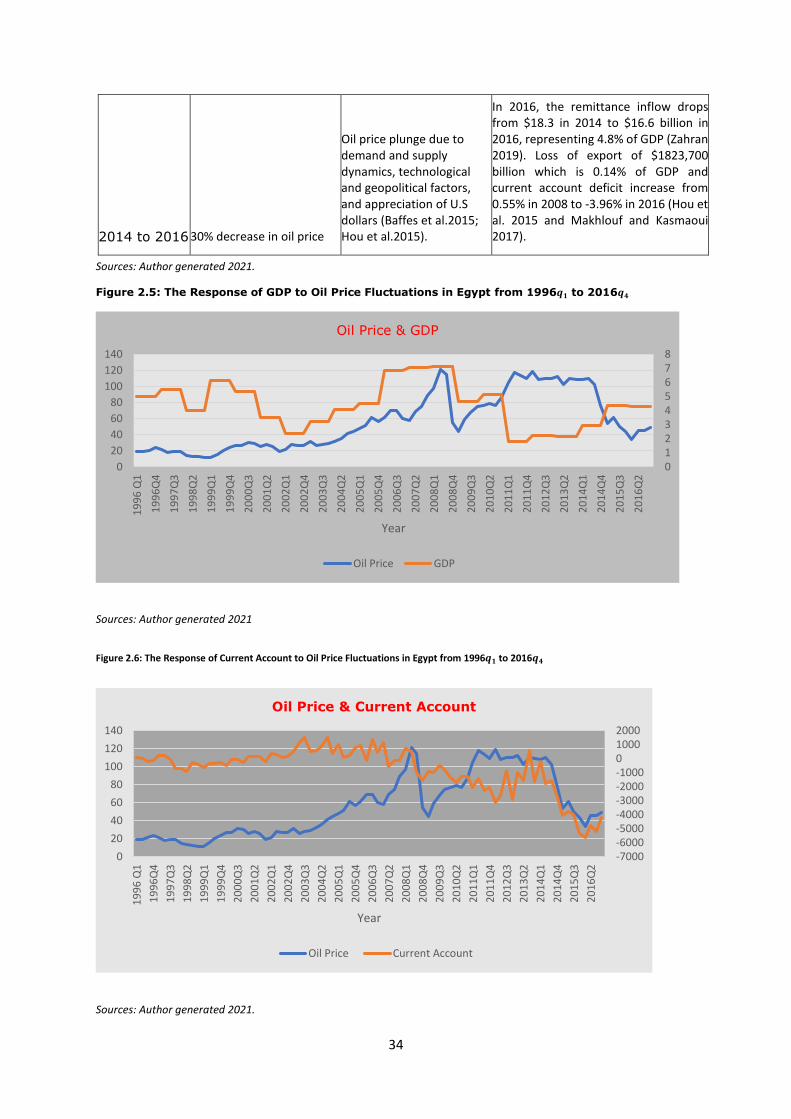
34
2014 to 2016 30% decrease in oil price
Oil price plunge due to demand and supply dynamics, technological and geopolitical factors, and appreciation of U.S dollars (Baffes et al.2015; Hou et al.2015).
In 2016, the remittance inflow drops from $18.3 in 2014 to $16.6 billion in 2016, representing 4.8% of GDP (Zahran 2019). Loss of export of $1823,700 billion which is 0.14% of GDP and current account deficit increase from 0.55% in 2008 to -3.96% in 2016 (Hou et al. 2015 and Makhlouf and Kasmaoui 2017).
Sources: Author generated 2021.
Figure 2.5: The Response of GDP to Oil Price Fluctuations in Egypt from 1996𝒒𝟏 to 2016𝒒𝟒
Sources: Author generated 2021
Figure 2.6: The Response of Current Account to Oil Price Fluctuations in Egypt from 1996𝒒𝟏 to 2016𝒒𝟒
Sources: Author generated 2021.
012345678
0
20
40
60
80
100
120
140
19
96
Q1
19
96
Q4
19
97
Q3
19
98
Q2
19
99
Q1
19
99
Q4
20
00
Q3
20
01
Q2
20
02
Q1
20
02
Q4
20
03
Q3
20
04
Q2
20
05
Q1
20
05
Q4
20
06
Q3
20
07
Q2
20
08
Q1
20
08
Q4
20
09
Q3
20
10
Q2
20
11
Q1
20
11
Q4
20
12
Q3
20
13
Q2
20
14
Q1
20
14
Q4
20
15
Q3
20
16
Q2
Year
Oil Price & GDP
Oil Price GDP
-7000-6000-5000-4000-3000-2000-1000010002000
0
20
40
60
80
100
120
140
19
96
Q1
19
96
Q4
19
97
Q3
19
98
Q2
19
99
Q1
19
99
Q4
20
00
Q3
20
01
Q2
20
02
Q1
20
02
Q4
20
03
Q3
20
04
Q2
20
05
Q1
20
05
Q4
20
06
Q3
20
07
Q2
20
08
Q1
20
08
Q4
20
09
Q3
20
10
Q2
20
11
Q1
20
11
Q4
20
12
Q3
20
13
Q2
20
14
Q1
20
14
Q4
20
15
Q3
20
16
Q2
Year
Oil Price & Current Account
Oil Price Current Account
35
2.2 The Net Oil Importing Countries
The impact of fluctuations in oil price on macroeconomic variables are assumed to
be of two dimensions in the economies of net oil importing countries (Ahmed
2031). First, a decrease in oil price is advantageous to net oil importing countries
through reduction in import bill which may cause improvement in current account
(Grímsson et al.2017; Beckmann et al.2017). Second, an increase in oil price can
cause a steep decrease in income and production level particularly for net oil
importing countries who are highly oil dependent (Trang et al.2017). This can
result to decrease in investment and increase in unemployment rate and
ultimately decline GDP growth rate (Brown and Yucel 2002). A recent study by
Akinsola and Odhiambo 2020 validated that oil price-macroeconomic relationship
is a function of demand and supply factors subject to an asymmetric relationship.
This study will examine the asymmetric relationship between oil price and
macroeconomic variables effect in the context of net oil importing countries in
Africa. Specifically, South Africa and Kenya has been selected because of their
involvement in oil trade, and importantly their involvement in crude oil importation
and consumption level.
Research on negative and positive effect of fluctuations in oil price on
macroeconomic variables in net oil importing countries from the context of
asymmetries have grown especially in developed and Asia countries. Few scholars
who investigated such relationship in Africa include Akinsola and Odhiambo
(2020).
Several recent studies, e.g., Knotek and Zaman (2021) and Liu et al. (2021)
examined long run and short run asymmetries associated with fluctuations in oil
36
price and its effect on macroeconomic variables in net oil importing countries1.
Their empirical result which focused mainly on Europe, US and Asian countries
indicate that the short run and the long run asymmetric relationship between oil
price and macroeconomic variables varies across countries (see Lin and Bai 2021;
Hashmi et al.2021). However, little or no study has been conducted in the context
of net oil exporting and net oil importing countries in Africa, as such this study
intends to examine the structural breaks of oil price shocks caused variations in
macroeconomic variables in the context of net oil exporting and oil importing in
Africa. This is to identify the adjustment process of these key macroeconomic
variables to oil price shocks that contain information exploitable by policy maker,
firms and investors to strategies and reduce the exposure of macroeconomic
variables to oil price shocks. This study fills this research gap in this chapter by
utilizing extended literature review to examine how the structural breaks caused
by the major oil price shocks events created variations of the selected key
variables. This is done by using quarterly data of the major shocks in oil price
between 1996𝑞1 to 2016𝑞1 and demonstrate how changes in oil price influenced
macroeconomic variables in the context of selected net importing countries in
Africa.
2.2.1 South Africa and Oil Price Shocks
South Africa is a country in the southern part of African continent bordered by
Namibia to the northwest, Zimbabwe and Botswana to the north, Swaziland, and
Mozambique to the northeast and east Lesotho. South Africa is an oil importing
country, whose economy is estimated to be the largest and most developed
economy in sub-Saharan Africa. Yet, half of her population is living under poverty
1 Knotek and Zaman (2021) examined this relationship in US and Liu et al. (2021)
focused on China.
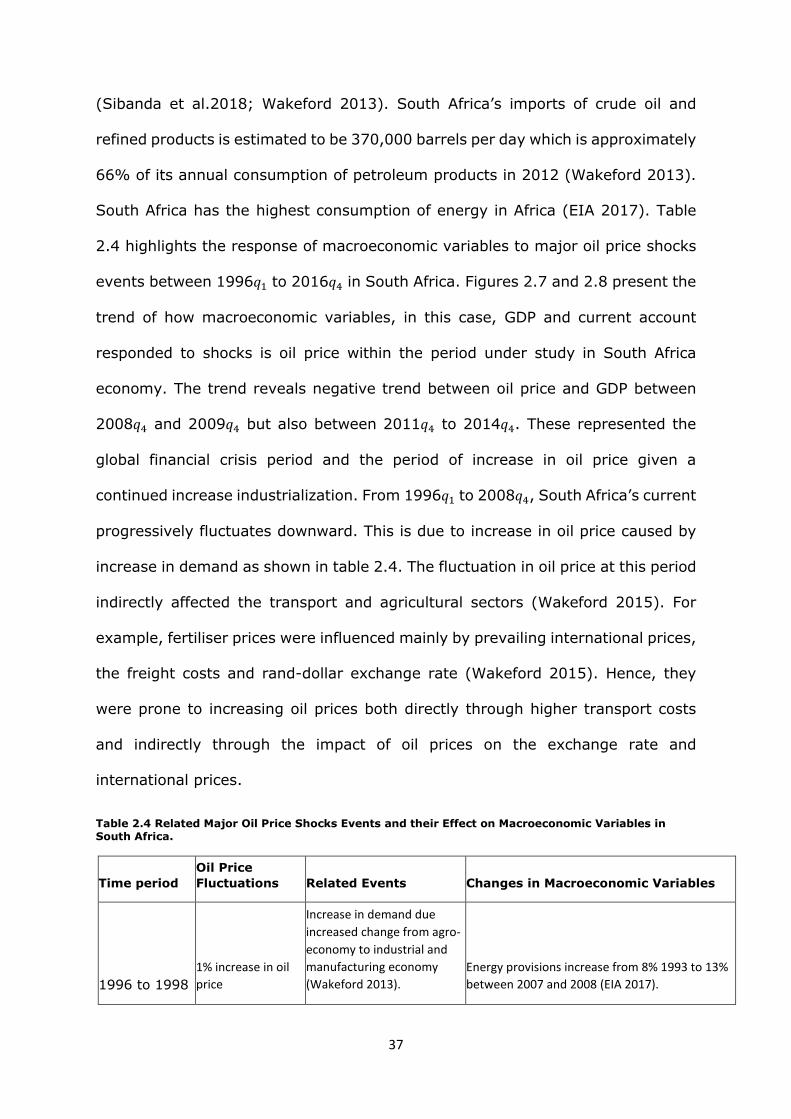
37
(Sibanda et al.2018; Wakeford 2013). South Africa’s imports of crude oil and
refined products is estimated to be 370,000 barrels per day which is approximately
66% of its annual consumption of petroleum products in 2012 (Wakeford 2013).
South Africa has the highest consumption of energy in Africa (EIA 2017). Table
2.4 highlights the response of macroeconomic variables to major oil price shocks
events between 1996𝑞1 to 2016𝑞4 in South Africa. Figures 2.7 and 2.8 present the
trend of how macroeconomic variables, in this case, GDP and current account
responded to shocks is oil price within the period under study in South Africa
economy. The trend reveals negative trend between oil price and GDP between
2008𝑞4 and 2009𝑞4 but also between 2011𝑞4 to 2014𝑞4. These represented the
global financial crisis period and the period of increase in oil price given a
continued increase industrialization. From 1996𝑞1 to 2008𝑞4, South Africa’s current
progressively fluctuates downward. This is due to increase in oil price caused by
increase in demand as shown in table 2.4. The fluctuation in oil price at this period
indirectly affected the transport and agricultural sectors (Wakeford 2015). For
example, fertiliser prices were influenced mainly by prevailing international prices,
the freight costs and rand-dollar exchange rate (Wakeford 2015). Hence, they
were prone to increasing oil prices both directly through higher transport costs
and indirectly through the impact of oil prices on the exchange rate and
international prices.
Table 2.4 Related Major Oil Price Shocks Events and their Effect on Macroeconomic Variables in South Africa.
Time period
Oil Price
Fluctuations Related Events Changes in Macroeconomic Variables
1996 to 1998
1% increase in oil
price
Increase in demand due
increased change from agro-
economy to industrial and
manufacturing economy
(Wakeford 2013).
Energy provisions increase from 8% 1993 to 13%
between 2007 and 2008 (EIA 2017).
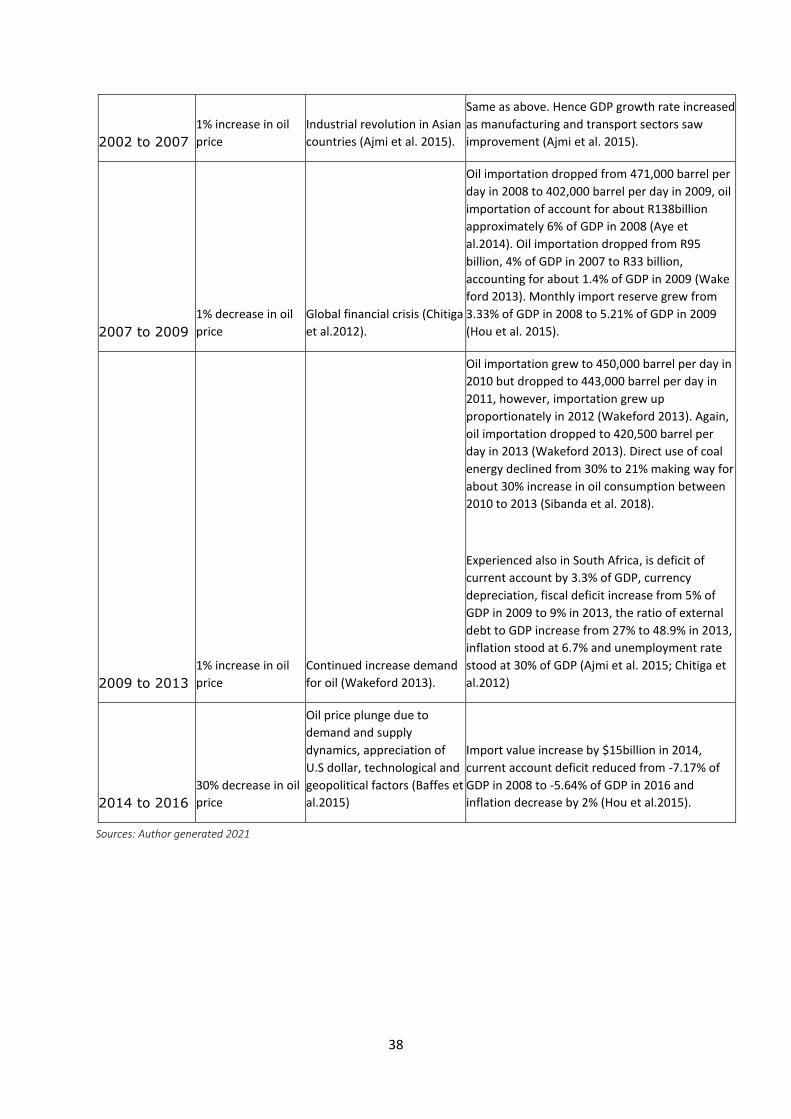
38
2002 to 2007
1% increase in oil
price
Industrial revolution in Asian
countries (Ajmi et al. 2015).
Same as above. Hence GDP growth rate increased
as manufacturing and transport sectors saw
improvement (Ajmi et al. 2015).
2007 to 2009
1% decrease in oil
price
Global financial crisis (Chitiga
et al.2012).
Oil importation dropped from 471,000 barrel per
day in 2008 to 402,000 barrel per day in 2009, oil
importation of account for about R138billion
approximately 6% of GDP in 2008 (Aye et
al.2014). Oil importation dropped from R95
billion, 4% of GDP in 2007 to R33 billion,
accounting for about 1.4% of GDP in 2009 (Wake
ford 2013). Monthly import reserve grew from
3.33% of GDP in 2008 to 5.21% of GDP in 2009
(Hou et al. 2015).
2009 to 2013
1% increase in oil
price
Continued increase demand
for oil (Wakeford 2013).
Oil importation grew to 450,000 barrel per day in
2010 but dropped to 443,000 barrel per day in
2011, however, importation grew up
proportionately in 2012 (Wakeford 2013). Again,
oil importation dropped to 420,500 barrel per
day in 2013 (Wakeford 2013). Direct use of coal
energy declined from 30% to 21% making way for
about 30% increase in oil consumption between
2010 to 2013 (Sibanda et al. 2018).
Experienced also in South Africa, is deficit of
current account by 3.3% of GDP, currency
depreciation, fiscal deficit increase from 5% of
GDP in 2009 to 9% in 2013, the ratio of external
debt to GDP increase from 27% to 48.9% in 2013,
inflation stood at 6.7% and unemployment rate
stood at 30% of GDP (Ajmi et al. 2015; Chitiga et
al.2012)
2014 to 2016
30% decrease in oil
price
Oil price plunge due to
demand and supply
dynamics, appreciation of
U.S dollar, technological and
geopolitical factors (Baffes et
al.2015)
Import value increase by $15billion in 2014,
current account deficit reduced from -7.17% of
GDP in 2008 to -5.64% of GDP in 2016 and
inflation decrease by 2% (Hou et al.2015).
Sources: Author generated 2021
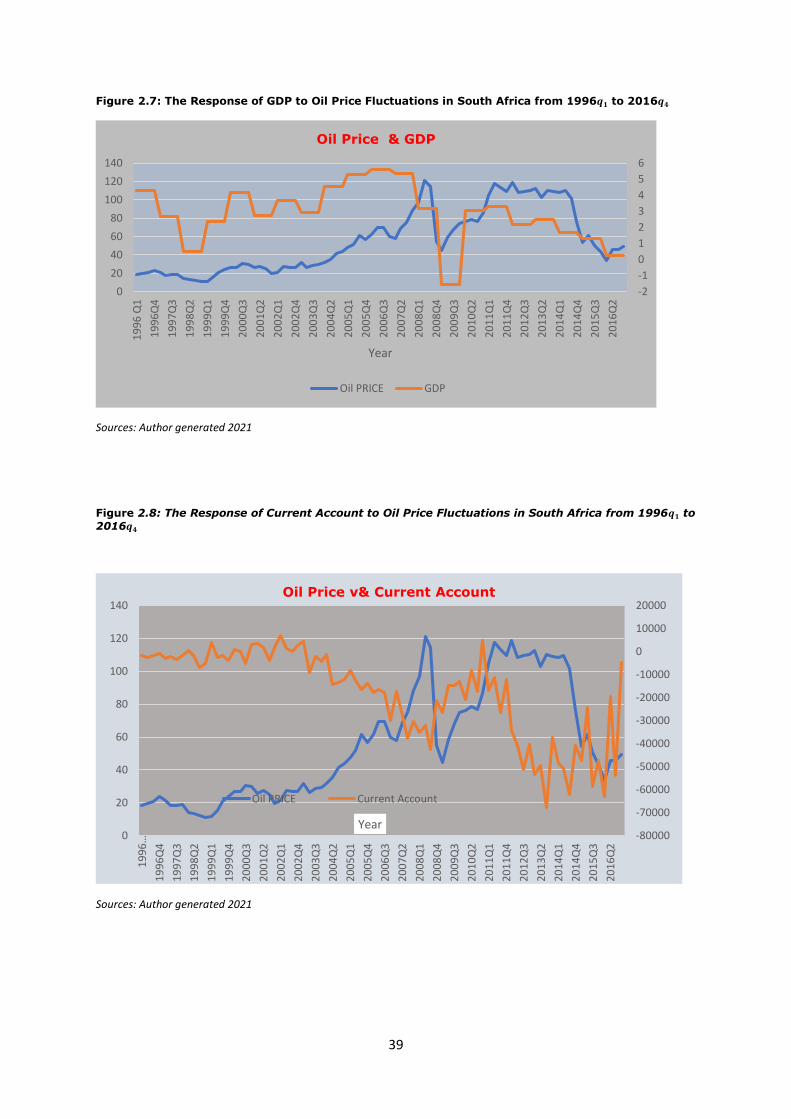
39
Figure 2.7: The Response of GDP to Oil Price Fluctuations in South Africa from 1996𝒒𝟏 to 2016𝒒𝟒
Sources: Author generated 2021
Figure 2.8: The Response of Current Account to Oil Price Fluctuations in South Africa from 1996𝒒𝟏 to
2016𝒒𝟒
Sources: Author generated 2021
-2
-1
0
1
2
3
4
5
6
0
20
40
60
80
100
120
140
19
96
Q1
19
96
Q4
19
97
Q3
19
98
Q2
19
99
Q1
19
99
Q4
20
00
Q3
20
01
Q2
20
02
Q1
20
02
Q4
20
03
Q3
20
04
Q2
20
05
Q1
20
05
Q4
20
06
Q3
20
07
Q2
20
08
Q1
20
08
Q4
20
09
Q3
20
10
Q2
20
11
Q1
20
11
Q4
20
12
Q3
20
13
Q2
20
14
Q1
20
14
Q4
20
15
Q3
20
16
Q2
Year
Oil Price & GDP
Oil PRICE GDP
-80000
-70000
-60000
-50000
-40000
-30000
-20000
-10000
0
10000
20000
0
20
40
60
80
100
120
140
19
96
…
19
96
Q4
19
97
Q3
19
98
Q2
19
99
Q1
19
99
Q4
20
00
Q3
20
01
Q2
20
02
Q1
20
02
Q4
20
03
Q3
20
04
Q2
20
05
Q1
20
05
Q4
20
06
Q3
20
07
Q2
20
08
Q1
20
08
Q4
20
09
Q3
20
10
Q2
20
11
Q1
20
11
Q4
20
12
Q3
20
13
Q2
20
14
Q1
20
14
Q4
20
15
Q3
20
16
Q2
Year
Oil Price v& Current Account
Oil PRICE Current Account
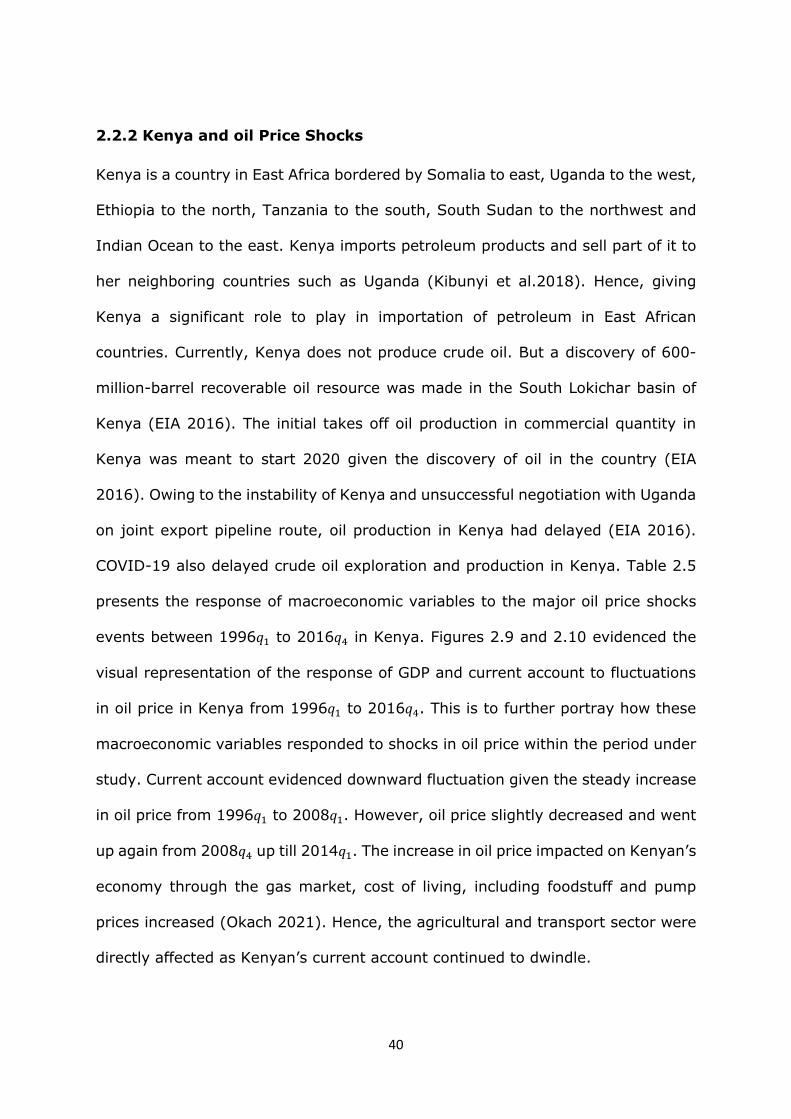
40
2.2.2 Kenya and oil Price Shocks
Kenya is a country in East Africa bordered by Somalia to east, Uganda to the west,
Ethiopia to the north, Tanzania to the south, South Sudan to the northwest and
Indian Ocean to the east. Kenya imports petroleum products and sell part of it to
her neighboring countries such as Uganda (Kibunyi et al.2018). Hence, giving
Kenya a significant role to play in importation of petroleum in East African
countries. Currently, Kenya does not produce crude oil. But a discovery of 600-
million-barrel recoverable oil resource was made in the South Lokichar basin of
Kenya (EIA 2016). The initial takes off oil production in commercial quantity in
Kenya was meant to start 2020 given the discovery of oil in the country (EIA
2016). Owing to the instability of Kenya and unsuccessful negotiation with Uganda
on joint export pipeline route, oil production in Kenya had delayed (EIA 2016).
COVID-19 also delayed crude oil exploration and production in Kenya. Table 2.5
presents the response of macroeconomic variables to the major oil price shocks
events between 1996𝑞1 to 2016𝑞4 in Kenya. Figures 2.9 and 2.10 evidenced the
visual representation of the response of GDP and current account to fluctuations
in oil price in Kenya from 1996𝑞1 to 2016𝑞4. This is to further portray how these
macroeconomic variables responded to shocks in oil price within the period under
study. Current account evidenced downward fluctuation given the steady increase
in oil price from 1996𝑞1 to 2008𝑞1. However, oil price slightly decreased and went
up again from 2008𝑞4 up till 2014𝑞1. The increase in oil price impacted on Kenyan’s
economy through the gas market, cost of living, including foodstuff and pump
prices increased (Okach 2021). Hence, the agricultural and transport sector were
directly affected as Kenyan’s current account continued to dwindle.
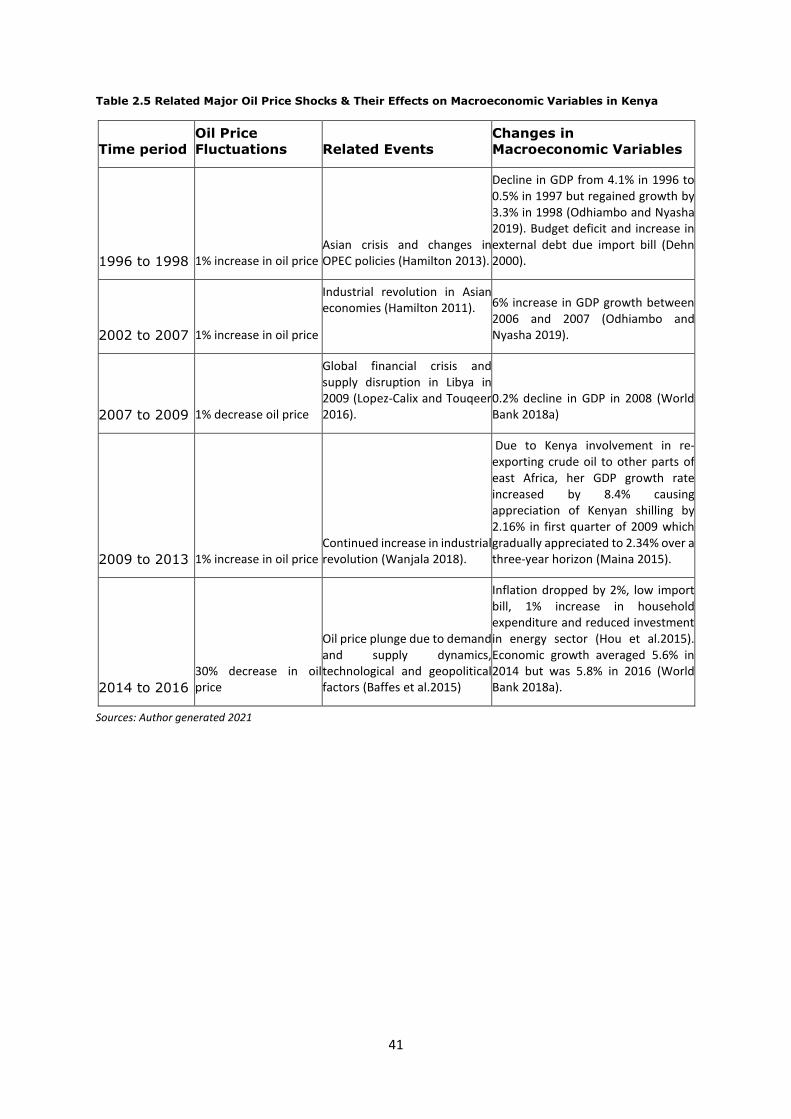
41
Table 2.5 Related Major Oil Price Shocks & Their Effects on Macroeconomic Variables in Kenya
Time period
Oil Price
Fluctuations Related Events
Changes in
Macroeconomic Variables
1996 to 1998 1% increase in oil price Asian crisis and changes in OPEC policies (Hamilton 2013).
Decline in GDP from 4.1% in 1996 to 0.5% in 1997 but regained growth by 3.3% in 1998 (Odhiambo and Nyasha 2019). Budget deficit and increase in external debt due import bill (Dehn 2000).
2002 to 2007 1% increase in oil price
Industrial revolution in Asian economies (Hamilton 2011).
6% increase in GDP growth between 2006 and 2007 (Odhiambo and Nyasha 2019).
2007 to 2009 1% decrease oil price
Global financial crisis and supply disruption in Libya in 2009 (Lopez-Calix and Touqeer 2016).
0.2% decline in GDP in 2008 (World Bank 2018a)
2009 to 2013 1% increase in oil price Continued increase in industrial revolution (Wanjala 2018).
Due to Kenya involvement in re-exporting crude oil to other parts of east Africa, her GDP growth rate increased by 8.4% causing appreciation of Kenyan shilling by 2.16% in first quarter of 2009 which gradually appreciated to 2.34% over a three-year horizon (Maina 2015).
2014 to 2016
30% decrease in oil price
Oil price plunge due to demand and supply dynamics, technological and geopolitical factors (Baffes et al.2015)
Inflation dropped by 2%, low import bill, 1% increase in household expenditure and reduced investment in energy sector (Hou et al.2015). Economic growth averaged 5.6% in 2014 but was 5.8% in 2016 (World Bank 2018a).
Sources: Author generated 2021

42
Figure 2.9: The Response of GDP to Oil Price Fluctuations in Kenya from 1996𝒒𝟏 to 2016𝒒𝟒
Sources: Author generated 2021
Figure 2.10: The Response of Current Account to Oil Price Fluctuations in Kenya from 1996𝒒𝟏 to
2016𝒒𝟒
Sources: Author generated 202
0123456789
0
20
40
60
80
100
120
140
19
96
Q1
19
96
Q4
19
97
Q3
19
98
Q2
19
99
Q1
19
99
Q4
20
00
Q3
20
01
Q2
20
02
Q1
20
02
Q4
20
03
Q3
20
04
Q2
20
05
Q1
20
05
Q4
20
06
Q3
20
07
Q2
20
08
Q1
20
08
Q4
20
09
Q3
20
10
Q2
20
11
Q1
20
11
Q4
20
12
Q3
20
13
Q2
20
14
Q1
20
14
Q4
20
15
Q3
20
16
Q2
Year
Oil Price & GDP
Oil PRICE GDP
0
20
40
60
80
100
120
140
-180000
-160000
-140000
-120000
-100000
-80000
-60000
-40000
-20000
0
19
96
Q1
19
96
Q4
19
97
Q3
19
98
Q2
19
99
Q1
19
99
Q4
20
00
Q3
20
01
Q2
20
02
Q1
20
02
Q4
20
03
Q3
20
04
Q2
20
05
Q1
20
05
Q4
20
06
Q3
20
07
Q2
20
08
Q1
20
08
Q4
20
09
Q3
20
10
Q2
20
11
Q1
20
11
Q4
20
12
Q3
20
13
Q2
20
14
Q1
20
14
Q4
20
15
Q3
20
16
Q2
Year
Oil Price & Current Account
Current Account 18.57

43
2.3 Shocks in Oil Price Pathway in Net Oil Exporting and Oil Importing
Countries in Africa
The combination of global demand and supply dynamics, together with
appreciation of U.S dollars, unconventional exploration of crude oil and major
geopolitical conflits in oil producing areas have caused fluctuations in oil prices
(Baffes et al.,2015). The effect and its magnititude in net oil exporting and
importing countries dependes on transmission channel and policy strurcture
responses of each economy (Bouchaour and Ali Al-Zeaud 2012 ; Lin and Bai
2021). In this section the exposure of macroeconomic variables to oil price shock
on selected African countries is analysed focusing on oil price plunge between
2014 and 2016.The focuse of oil price shock event between 2014 and 2016 in
this section is informed by the sharp change in oil price from $140 per barrel in
early 2014 to $30 per barrel in 2016. The anaysis is amied to identify the actual
effect of how this sharp change in oil price affect macroeconomic variables in the
context of net oil exporting and oil importing countries in Africa.
2.4 Pathway Through Actual Effect
This Section discusses the oil price decline between 2014 and 2016 and the
effects on selected Africa exporting and importing countries. As background,
extended literature review is used to review the actual effect and uncertainties
associated with exposure of macroeconomic variables to shocks in oil price.
The actual effect of oil price decline between 2014 and 2016 according to Hou et
al. (2015) saw a noticeable 17% drop in export value of sub-Saharan oil exporters.
The export of crude oil from sub-Saharan Africa countries to US dropped by 44%,
EU dropped by 10% while export to China increased by 4%. At the same time,
crude oil import bill of net oil importing countries dropped by 20% from quarter
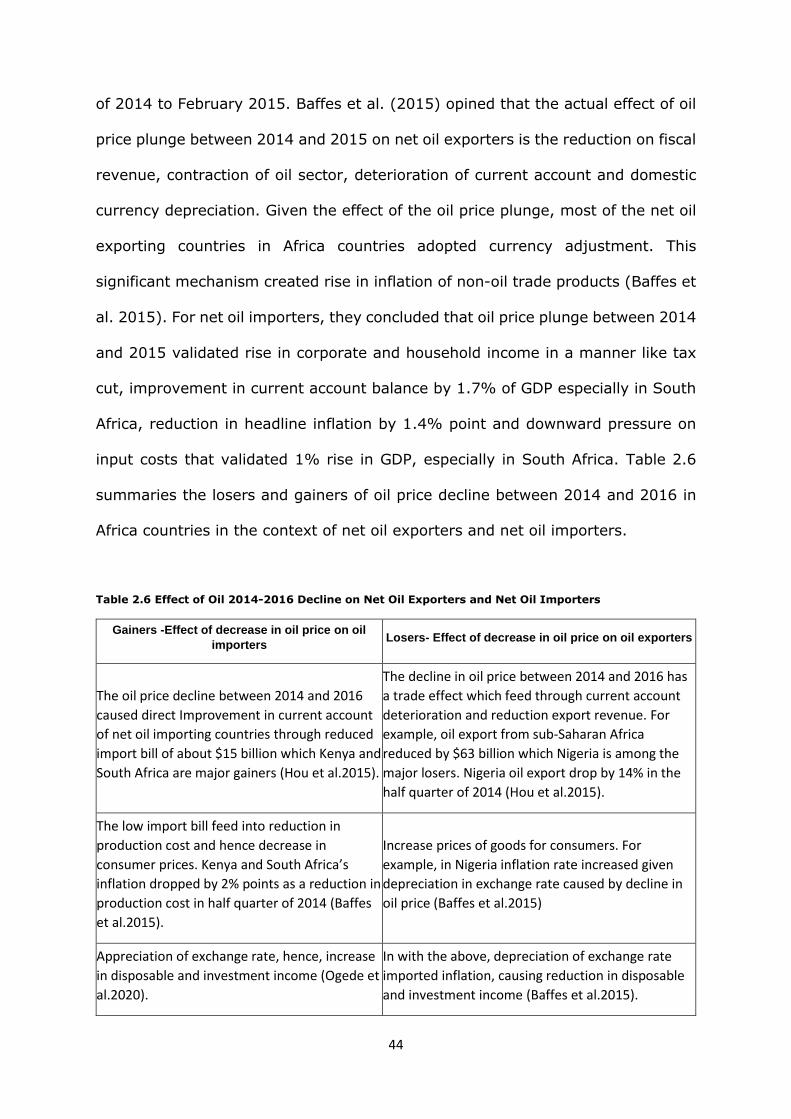
44
of 2014 to February 2015. Baffes et al. (2015) opined that the actual effect of oil
price plunge between 2014 and 2015 on net oil exporters is the reduction on fiscal
revenue, contraction of oil sector, deterioration of current account and domestic
currency depreciation. Given the effect of the oil price plunge, most of the net oil
exporting countries in Africa countries adopted currency adjustment. This
significant mechanism created rise in inflation of non-oil trade products (Baffes et
al. 2015). For net oil importers, they concluded that oil price plunge between 2014
and 2015 validated rise in corporate and household income in a manner like tax
cut, improvement in current account balance by 1.7% of GDP especially in South
Africa, reduction in headline inflation by 1.4% point and downward pressure on
input costs that validated 1% rise in GDP, especially in South Africa. Table 2.6
summaries the losers and gainers of oil price decline between 2014 and 2016 in
Africa countries in the context of net oil exporters and net oil importers.
Table 2.6 Effect of Oil 2014-2016 Decline on Net Oil Exporters and Net Oil Importers
Gainers -Effect of decrease in oil price on oil
importers Losers- Effect of decrease in oil price on oil exporters
The oil price decline between 2014 and 2016
caused direct Improvement in current account
of net oil importing countries through reduced
import bill of about $15 billion which Kenya and
South Africa are major gainers (Hou et al.2015).
The decline in oil price between 2014 and 2016 has
a trade effect which feed through current account
deterioration and reduction export revenue. For
example, oil export from sub-Saharan Africa
reduced by $63 billion which Nigeria is among the
major losers. Nigeria oil export drop by 14% in the
half quarter of 2014 (Hou et al.2015).
The low import bill feed into reduction in
production cost and hence decrease in
consumer prices. Kenya and South Africa’s
inflation dropped by 2% points as a reduction in
production cost in half quarter of 2014 (Baffes
et al.2015).
Increase prices of goods for consumers. For
example, in Nigeria inflation rate increased given
depreciation in exchange rate caused by decline in
oil price (Baffes et al.2015)
Appreciation of exchange rate, hence, increase
in disposable and investment income (Ogede et
al.2020).
In with the above, depreciation of exchange rate
imported inflation, causing reduction in disposable
and investment income (Baffes et al.2015).
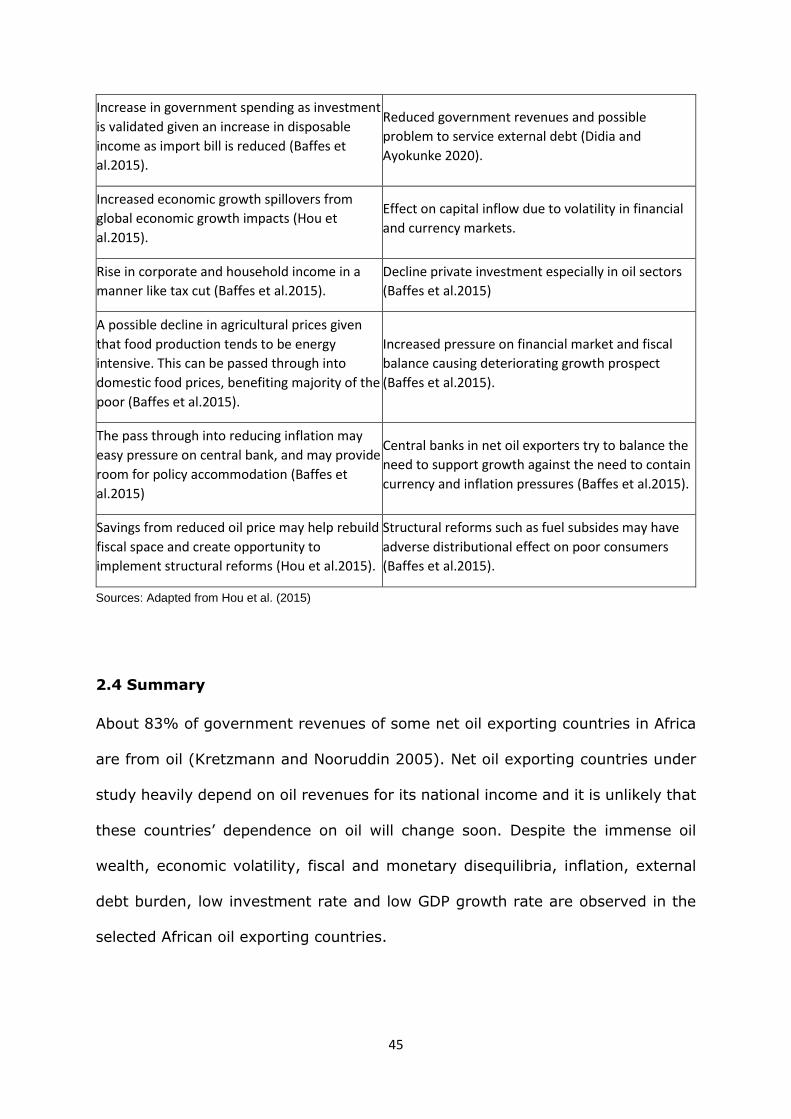
45
Increase in government spending as investment
is validated given an increase in disposable
income as import bill is reduced (Baffes et
al.2015).
Reduced government revenues and possible
problem to service external debt (Didia and
Ayokunke 2020).
Increased economic growth spillovers from
global economic growth impacts (Hou et
al.2015).
Effect on capital inflow due to volatility in financial
and currency markets.
Rise in corporate and household income in a
manner like tax cut (Baffes et al.2015).
Decline private investment especially in oil sectors
(Baffes et al.2015)
A possible decline in agricultural prices given
that food production tends to be energy
intensive. This can be passed through into
domestic food prices, benefiting majority of the
poor (Baffes et al.2015).
Increased pressure on financial market and fiscal
balance causing deteriorating growth prospect
(Baffes et al.2015).
The pass through into reducing inflation may
easy pressure on central bank, and may provide
room for policy accommodation (Baffes et
al.2015)
Central banks in net oil exporters try to balance the
need to support growth against the need to contain
currency and inflation pressures (Baffes et al.2015).
Savings from reduced oil price may help rebuild
fiscal space and create opportunity to
implement structural reforms (Hou et al.2015).
Structural reforms such as fuel subsides may have
adverse distributional effect on poor consumers
(Baffes et al.2015).
Sources: Adapted from Hou et al. (2015)
2.4 Summary
About 83% of government revenues of some net oil exporting countries in Africa
are from oil (Kretzmann and Nooruddin 2005). Net oil exporting countries under
study heavily depend on oil revenues for its national income and it is unlikely that
these countries’ dependence on oil will change soon. Despite the immense oil
wealth, economic volatility, fiscal and monetary disequilibria, inflation, external
debt burden, low investment rate and low GDP growth rate are observed in the
selected African oil exporting countries.
46
Net oil importing countries are significantly affected by oil price shocks (Salius and
Isah 2017). This assumption is echoed by Kretzmann and Nooruddin (2005) and
Hou et al. (2015) by concluding that oil price shocks are highly correlated with
significant changes in macroeconomic activities in African net oil importing
countries. This study has also reviewed that the selected net oil importing
countries in Africa experienced increased interest payments, higher import costs
and adverse domestic macroeconomic conditions following oil price shocks using
extended literature review.
However, existing policy responses that can help both net oil exporting and net oil
importing countries to shield their economies from the shocks of oil price are
limited. This study aims to help policy makers to develop not only policy responses
such as diversification, infrastructural development, refining of crude oil locally by
having a workable refineries and investment on agricultural development but also,
pursue policy that will enhance increase in the use of renewable energy especially
in net oil importing. Through this there will be job creation, increase in foreign
earning, increase in current account, reduction in inflation and dependency on
crude oil. This will economic activities and ultimately validate increase in GDP
growth rate.
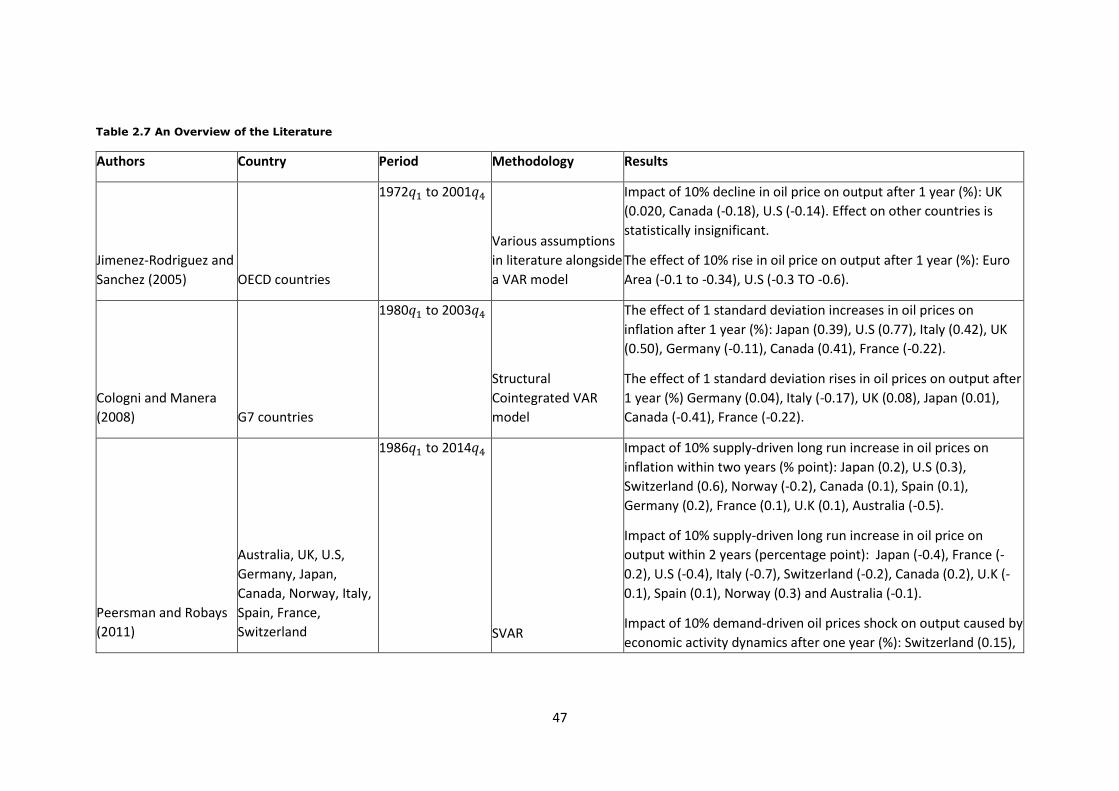
47
Table 2.7 An Overview of the Literature
Authors Country Period Methodology Results
Jimenez-Rodriguez and
Sanchez (2005) OECD countries
1972𝑞1 to 2001𝑞4
Various assumptions
in literature alongside
a VAR model
Impact of 10% decline in oil price on output after 1 year (%): UK
(0.020, Canada (-0.18), U.S (-0.14). Effect on other countries is
statistically insignificant.
The effect of 10% rise in oil price on output after 1 year (%): Euro
Area (-0.1 to -0.34), U.S (-0.3 TO -0.6).
Cologni and Manera
(2008) G7 countries
1980𝑞1 to 2003𝑞4
Structural
Cointegrated VAR
model
The effect of 1 standard deviation increases in oil prices on
inflation after 1 year (%): Japan (0.39), U.S (0.77), Italy (0.42), UK
(0.50), Germany (-0.11), Canada (0.41), France (-0.22).
The effect of 1 standard deviation rises in oil prices on output after
1 year (%) Germany (0.04), Italy (-0.17), UK (0.08), Japan (0.01),
Canada (-0.41), France (-0.22).
Peersman and Robays
(2011)
Australia, UK, U.S,
Germany, Japan,
Canada, Norway, Italy,
Spain, France,
Switzerland
1986𝑞1 to 2014𝑞4
SVAR
Impact of 10% supply-driven long run increase in oil prices on
inflation within two years (% point): Japan (0.2), U.S (0.3),
Switzerland (0.6), Norway (-0.2), Canada (0.1), Spain (0.1),
Germany (0.2), France (0.1), U.K (0.1), Australia (-0.5).
Impact of 10% supply-driven long run increase in oil price on
output within 2 years (percentage point): Japan (-0.4), France (-
0.2), U.S (-0.4), Italy (-0.7), Switzerland (-0.2), Canada (0.2), U.K (-
0.1), Spain (0.1), Norway (0.3) and Australia (-0.1).
Impact of 10% demand-driven oil prices shock on output caused by
economic activity dynamics after one year (%): Switzerland (0.15),
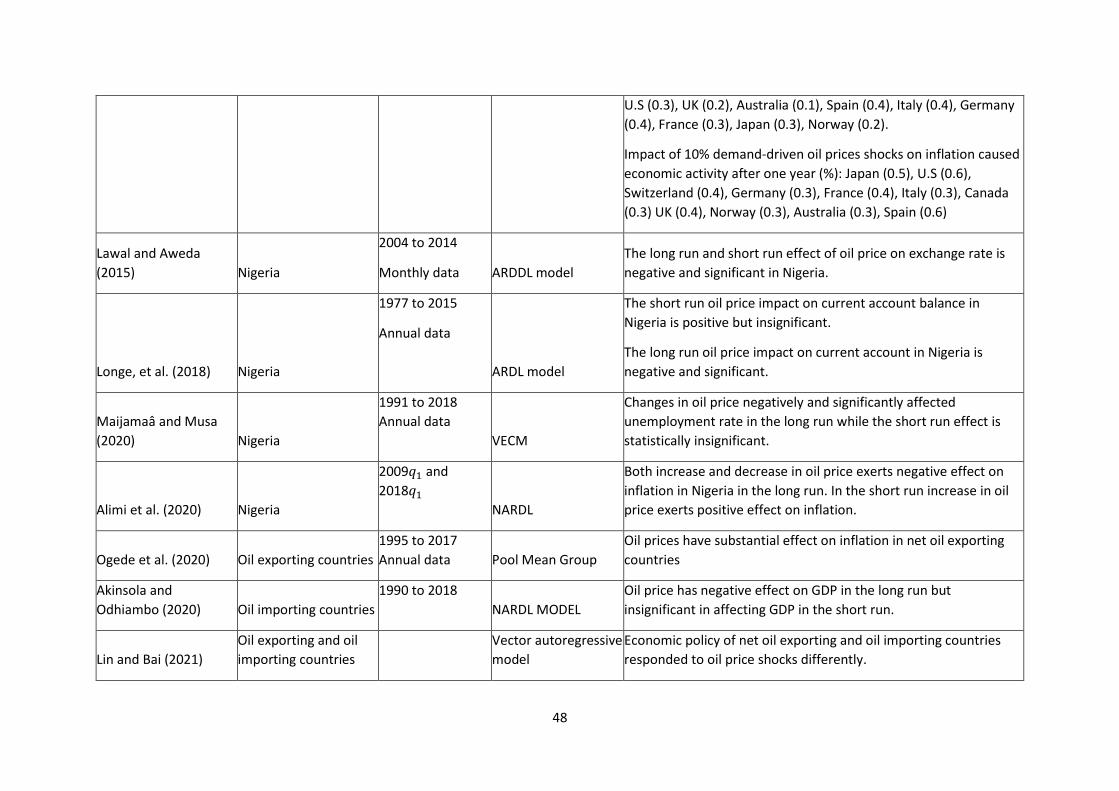
48
U.S (0.3), UK (0.2), Australia (0.1), Spain (0.4), Italy (0.4), Germany
(0.4), France (0.3), Japan (0.3), Norway (0.2).
Impact of 10% demand-driven oil prices shocks on inflation caused
economic activity after one year (%): Japan (0.5), U.S (0.6),
Switzerland (0.4), Germany (0.3), France (0.4), Italy (0.3), Canada
(0.3) UK (0.4), Norway (0.3), Australia (0.3), Spain (0.6)
Lawal and Aweda
(2015) Nigeria
2004 to 2014
Monthly data ARDDL model
The long run and short run effect of oil price on exchange rate is
negative and significant in Nigeria.
Longe, et al. (2018) Nigeria
1977 to 2015
Annual data
ARDL model
The short run oil price impact on current account balance in
Nigeria is positive but insignificant.
The long run oil price impact on current account in Nigeria is
negative and significant.
Maijamaâ and Musa
(2020) Nigeria
1991 to 2018
Annual data
VECM
Changes in oil price negatively and significantly affected
unemployment rate in the long run while the short run effect is
statistically insignificant.
Alimi et al. (2020) Nigeria
2009𝑞1 and
2018𝑞1
NARDL
Both increase and decrease in oil price exerts negative effect on
inflation in Nigeria in the long run. In the short run increase in oil
price exerts positive effect on inflation.
Ogede et al. (2020) Oil exporting countries
1995 to 2017
Annual data Pool Mean Group
Oil prices have substantial effect on inflation in net oil exporting
countries
Akinsola and
Odhiambo (2020) Oil importing countries
1990 to 2018
NARDL MODEL
Oil price has negative effect on GDP in the long run but
insignificant in affecting GDP in the short run.
Lin and Bai (2021)
Oil exporting and oil
importing countries
Vector autoregressive
model
Economic policy of net oil exporting and oil importing countries
responded to oil price shocks differently.
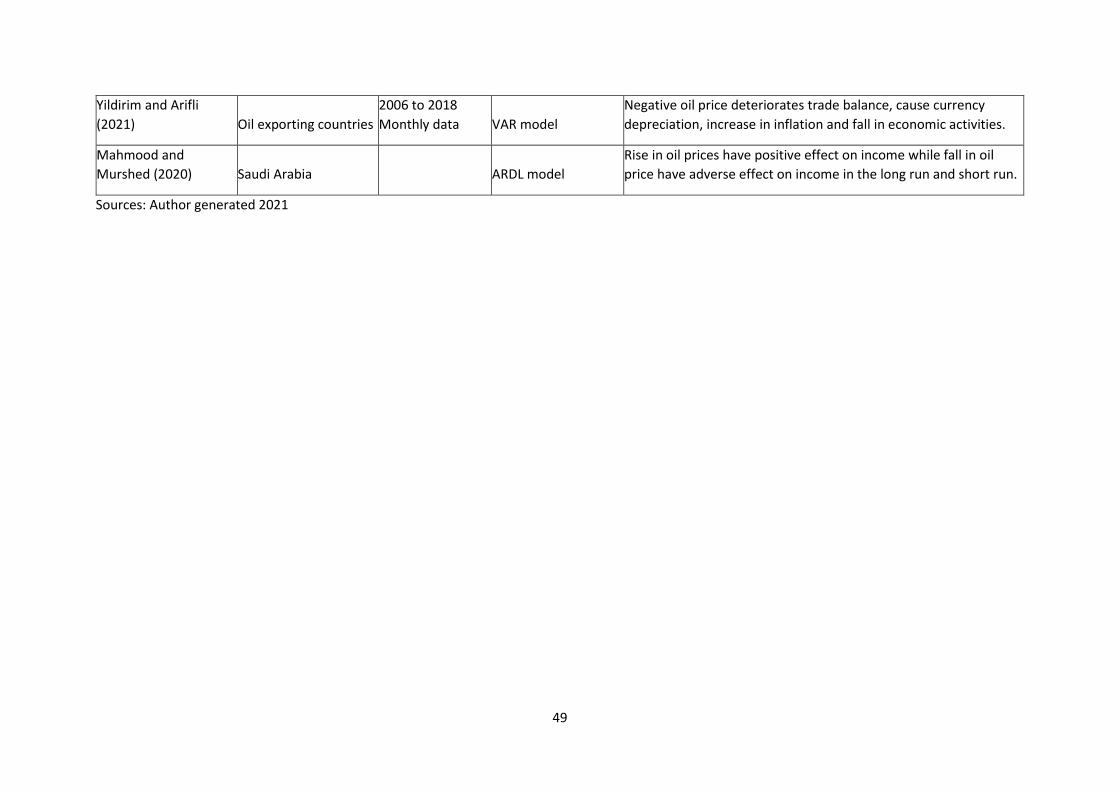
49
Yildirim and Arifli
(2021) Oil exporting countries
2006 to 2018
Monthly data VAR model
Negative oil price deteriorates trade balance, cause currency
depreciation, increase in inflation and fall in economic activities.
Mahmood and
Murshed (2020) Saudi Arabia
ARDL model
Rise in oil prices have positive effect on income while fall in oil
price have adverse effect on income in the long run and short run.
Sources: Author generated 2021
50
Chapter Three
Literature Review
3.0 Introduction
This chapter reviews the existing literature on the relationship between oil price
fluctuations and changes in key macroeconomic variables including GDP growth
rate, interest rates, inflation, exchange rate, unemployment rate, food supply,
external debt, current accounts, and foreign reserves.
Recent development in this strand of literature focuses on asymmetric effect of
fluctuations in oil price on macroeconomic variables (Akinsola and Odhiambo
2020; Salisu and Isah 2017; Fowowe 2014). Beginning with Mork (1989),
analysing asymmetric relationship between oil price and macroeconomic variables
is significant in that it distinguished the effect of oil price increase from the effect
of oil price decrease on macroeconomic variables. Some scholars have found that
oil price increase has a greater impact on macroeconomic variables compared to
oil price decrease (Huang et al. 2005; Zhang 2008; Cologni and Manera 2009;
Kilian and Vigfusson 2017). This study intends to identify if this assumption holds
in the context of net oil exporting and net oil importing countries in Africa. As most
studies on asymmetries of oil price-macroeconomic relationship are either
country-specific (Umar and Abdulhakeem 2010; Elmezouar 2014; Chiwaze and
Aye 2018 Oluwaseyi 2018; Kibunyi et al.2018) or on net oil importers (Akinsola
and Odhiambo 2020; Ahad and Anwer 2020; Murshed and Tanha 2021) or on net
oil exporters (Gbatu et al. 2017 Omolade et al. 2019; 2019; Akram 2020;
Adebayo; 2020 Jibril et al. 2020; Yildirim and Arifli 2021). This will enable a
comparative analysis of the asymmetric effect of oil price on macroeconomic
variables in net oil exporting and oil importing countries in Africa.
51
However, in developed economies, several authors including Lescaroux and
Mignon (2008), Jibril et al. (2020) Lin and Bai (2021) and Su et al. (2021) have
analysed asymmetric effect of oil price on macroeconomic variables in the context
of net oil exporting and oil importing countries. And varying results have been
found in literature with respect to how changes in oil price affect macroeconomic
variables in developed and Asian economies. For example, Hamilton (1983,1996),
Guo and Kilesen (2005), Rafiq et al. (2009) and Mureithi (2014) found negative
relationship between oil price and output growth while Ito (2008), Mohammad et
al. (2009), Cunado et al. (2015) and Kibunyi et al. (2018) evidenced positive
relationship between oil price and output. On the other hand, scholars including
Olomola (2006) and Iwayemi and Fowowe (2010) found that changes in oil price
is insignificant in predicting output.
Mork (1989), Jiménez-Rodríguez and Sánchez (2005), Narayan and Narayan
(2007), Ayadi (2011), Mahmood and Murshed (2021), Hashmi et al. (2021) and
Lin and Bai (2021) found evidence of asymmetric relationship between oil price
and macroeconomic variables while Khan et al. (2019) evidence no asymmetry in
oil price and macroeconomic variables relationship. Furthermore, some studies
found short run effect of oil price on macroeconomic variables (Basnet and
Upadhyaya 2015; Gbatu et al. 2017b) while others evidence long run effect of oil
price on macroeconomic variables (Zhang 2008; Aziz and Dahalan 2015). With
few or no studies researching on net oil exporting and net oil importing countries
in Africa. Hence, this study tends to examine how changes in oil price affect GDP
alongside other variables including interest rates, inflation, exchange rate,
unemployment rate, food supply, external debt, current account, and foreign
reserves in the context of net oil exporting and net oil importing countries in Africa.
This will enable identifying the asymmetries in the adjustment process to long run
52
equilibrium that may consist significant information utilisable by firms, academia,
investors, and policy makers to strategies and reduce the exposure of
macroeconomic variables to oil price shocks.
The section of this chapter is divided into ten sections. Section3.1 presents the
relationship between oil price and GDP as it relates in literature. 3.2 describes the
oil price-interest rate dynamics within the context of related literature. Section 3.3
describes the relationship between oil price and inflation. Section 3.4 deals with
oil price-exchange rate dynamics. Section 3.5 narrates oil price- unemployment
rate in the context of related literature. Section 3.6 describes fluctuations in oil
price and its impact on food supply. Section 3.7 present oil price -external debt
relationship in relation to literature review. Section 3.8 identifies and review
literature on oil price- current account relationship. Section 3.9 describes the
relationship between oil price and foreign reserves with reference to studies in
literature.3.10 presents the summary of the finding on the reviewed literature.
3.1 Literature Review on the Relationship Between Oil Price and
GDP
The first examination of the relationship between oil prices and economic growth
started in 1980s, for example Mork, and Hall (1980) used simulated model and
concluded that a change in the price oil had a significant adverse impact on the
US economy in the mid-1970s. This inverse relationship between increase in oil
price and aggregate economic activities in the US was also found in Hamilton
(1983, 1996). Guo and Kliesen (2005) analysed oil price-output nexus in US
economy and found a negative effect of oil prices on output and other
macroeconomic variables including employment rate and investment. Rafiq et al.
(2009) focused on Thailand and confirmed oil price increases negatively affected
output and macroeconomic variables such as unemployment rate, interest rate,
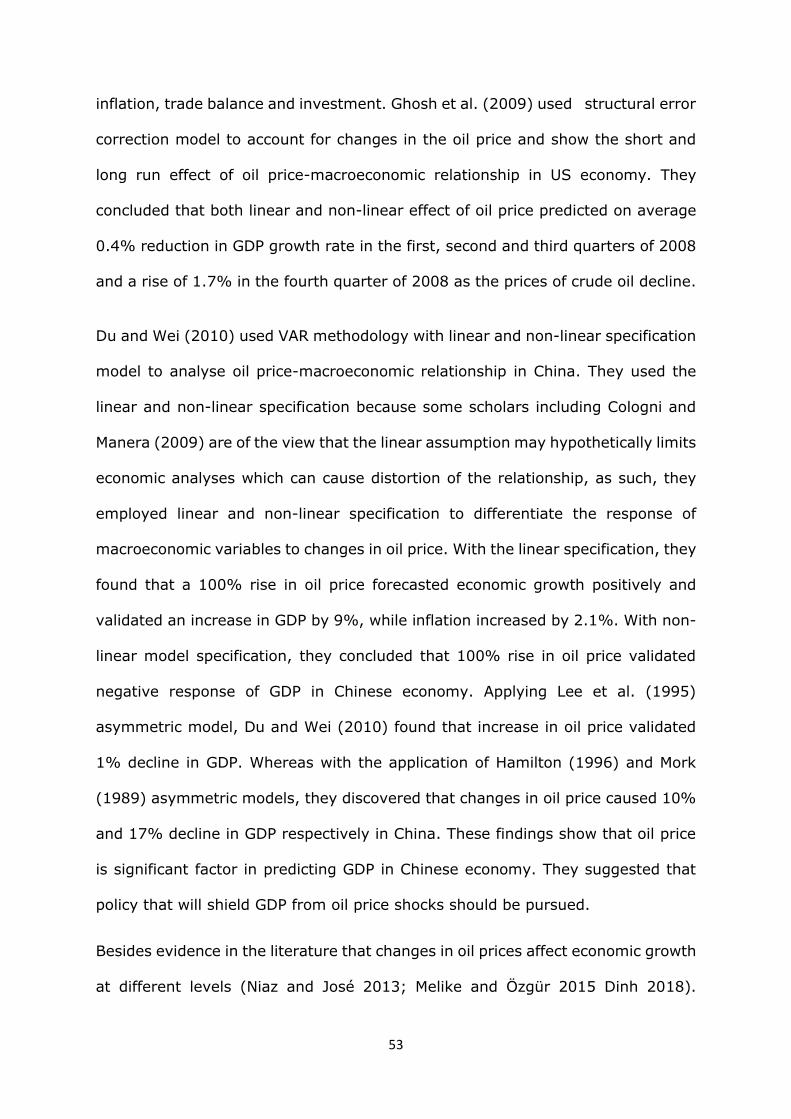
53
inflation, trade balance and investment. Ghosh et al. (2009) used structural error
correction model to account for changes in the oil price and show the short and
long run effect of oil price-macroeconomic relationship in US economy. They
concluded that both linear and non-linear effect of oil price predicted on average
0.4% reduction in GDP growth rate in the first, second and third quarters of 2008
and a rise of 1.7% in the fourth quarter of 2008 as the prices of crude oil decline.
Du and Wei (2010) used VAR methodology with linear and non-linear specification
model to analyse oil price-macroeconomic relationship in China. They used the
linear and non-linear specification because some scholars including Cologni and
Manera (2009) are of the view that the linear assumption may hypothetically limits
economic analyses which can cause distortion of the relationship, as such, they
employed linear and non-linear specification to differentiate the response of
macroeconomic variables to changes in oil price. With the linear specification, they
found that a 100% rise in oil price forecasted economic growth positively and
validated an increase in GDP by 9%, while inflation increased by 2.1%. With non-
linear model specification, they concluded that 100% rise in oil price validated
negative response of GDP in Chinese economy. Applying Lee et al. (1995)
asymmetric model, Du and Wei (2010) found that increase in oil price validated
1% decline in GDP. Whereas with the application of Hamilton (1996) and Mork
(1989) asymmetric models, they discovered that changes in oil price caused 10%
and 17% decline in GDP respectively in China. These findings show that oil price
is significant factor in predicting GDP in Chinese economy. They suggested that
policy that will shield GDP from oil price shocks should be pursued.
Besides evidence in the literature that changes in oil prices affect economic growth
at different levels (Niaz and José 2013; Melike and Özgür 2015 Dinh 2018).
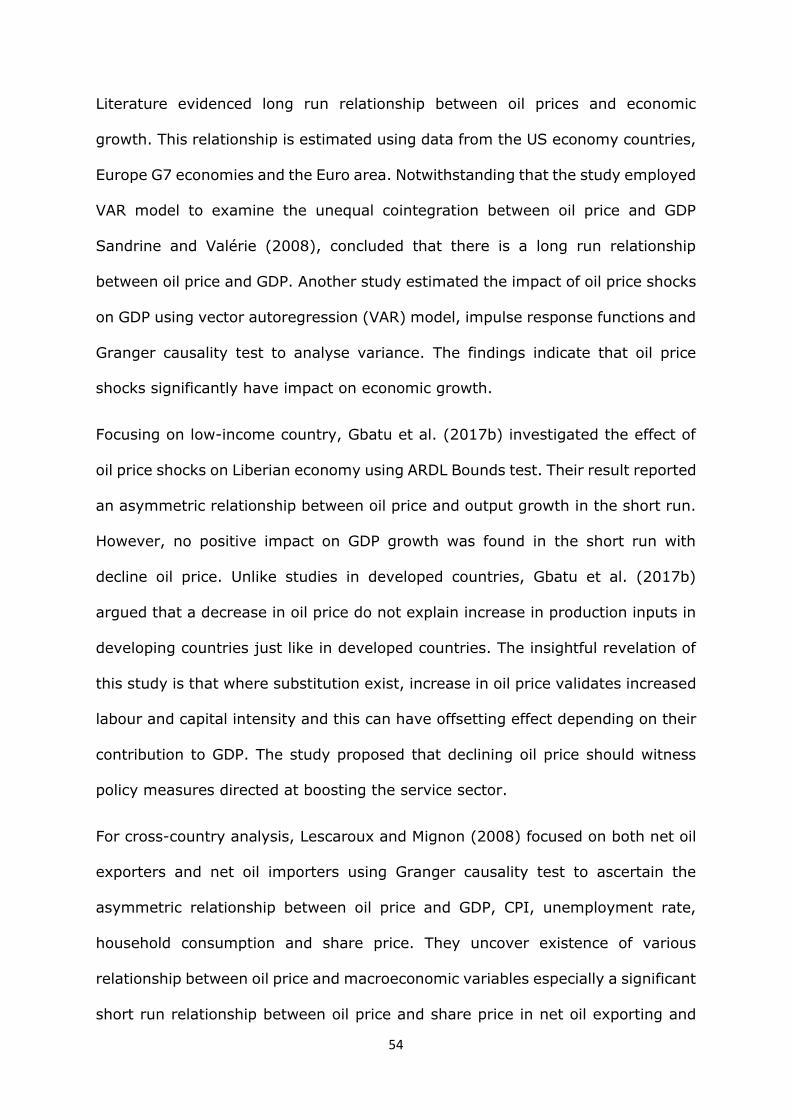
54
Literature evidenced long run relationship between oil prices and economic
growth. This relationship is estimated using data from the US economy countries,
Europe G7 economies and the Euro area. Notwithstanding that the study employed
VAR model to examine the unequal cointegration between oil price and GDP
Sandrine and Valérie (2008), concluded that there is a long run relationship
between oil price and GDP. Another study estimated the impact of oil price shocks
on GDP using vector autoregression (VAR) model, impulse response functions and
Granger causality test to analyse variance. The findings indicate that oil price
shocks significantly have impact on economic growth.
Focusing on low-income country, Gbatu et al. (2017b) investigated the effect of
oil price shocks on Liberian economy using ARDL Bounds test. Their result reported
an asymmetric relationship between oil price and output growth in the short run.
However, no positive impact on GDP growth was found in the short run with
decline oil price. Unlike studies in developed countries, Gbatu et al. (2017b)
argued that a decrease in oil price do not explain increase in production inputs in
developing countries just like in developed countries. The insightful revelation of
this study is that where substitution exist, increase in oil price validates increased
labour and capital intensity and this can have offsetting effect depending on their
contribution to GDP. The study proposed that declining oil price should witness
policy measures directed at boosting the service sector.
For cross-country analysis, Lescaroux and Mignon (2008) focused on both net oil
exporters and net oil importers using Granger causality test to ascertain the
asymmetric relationship between oil price and GDP, CPI, unemployment rate,
household consumption and share price. They uncover existence of various
relationship between oil price and macroeconomic variables especially a significant
short run relationship between oil price and share price in net oil exporting and
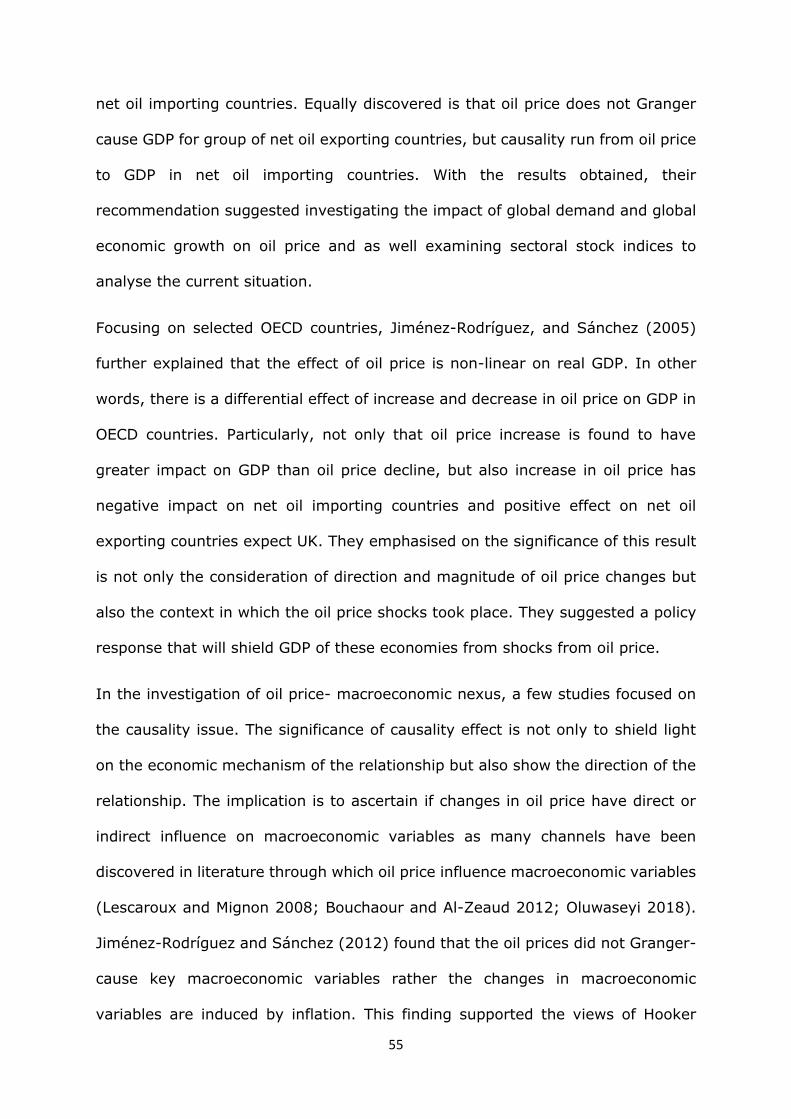
55
net oil importing countries. Equally discovered is that oil price does not Granger
cause GDP for group of net oil exporting countries, but causality run from oil price
to GDP in net oil importing countries. With the results obtained, their
recommendation suggested investigating the impact of global demand and global
economic growth on oil price and as well examining sectoral stock indices to
analyse the current situation.
Focusing on selected OECD countries, Jiménez-Rodríguez, and Sánchez (2005)
further explained that the effect of oil price is non-linear on real GDP. In other
words, there is a differential effect of increase and decrease in oil price on GDP in
OECD countries. Particularly, not only that oil price increase is found to have
greater impact on GDP than oil price decline, but also increase in oil price has
negative impact on net oil importing countries and positive effect on net oil
exporting countries expect UK. They emphasised on the significance of this result
is not only the consideration of direction and magnitude of oil price changes but
also the context in which the oil price shocks took place. They suggested a policy
response that will shield GDP of these economies from shocks from oil price.
In the investigation of oil price- macroeconomic nexus, a few studies focused on
the causality issue. The significance of causality effect is not only to shield light
on the economic mechanism of the relationship but also show the direction of the
relationship. The implication is to ascertain if changes in oil price have direct or
indirect influence on macroeconomic variables as many channels have been
discovered in literature through which oil price influence macroeconomic variables
(Lescaroux and Mignon 2008; Bouchaour and Al-Zeaud 2012; Oluwaseyi 2018).
Jiménez-Rodríguez and Sánchez (2012) found that the oil prices did not Granger-
cause key macroeconomic variables rather the changes in macroeconomic
variables are induced by inflation. This finding supported the views of Hooker
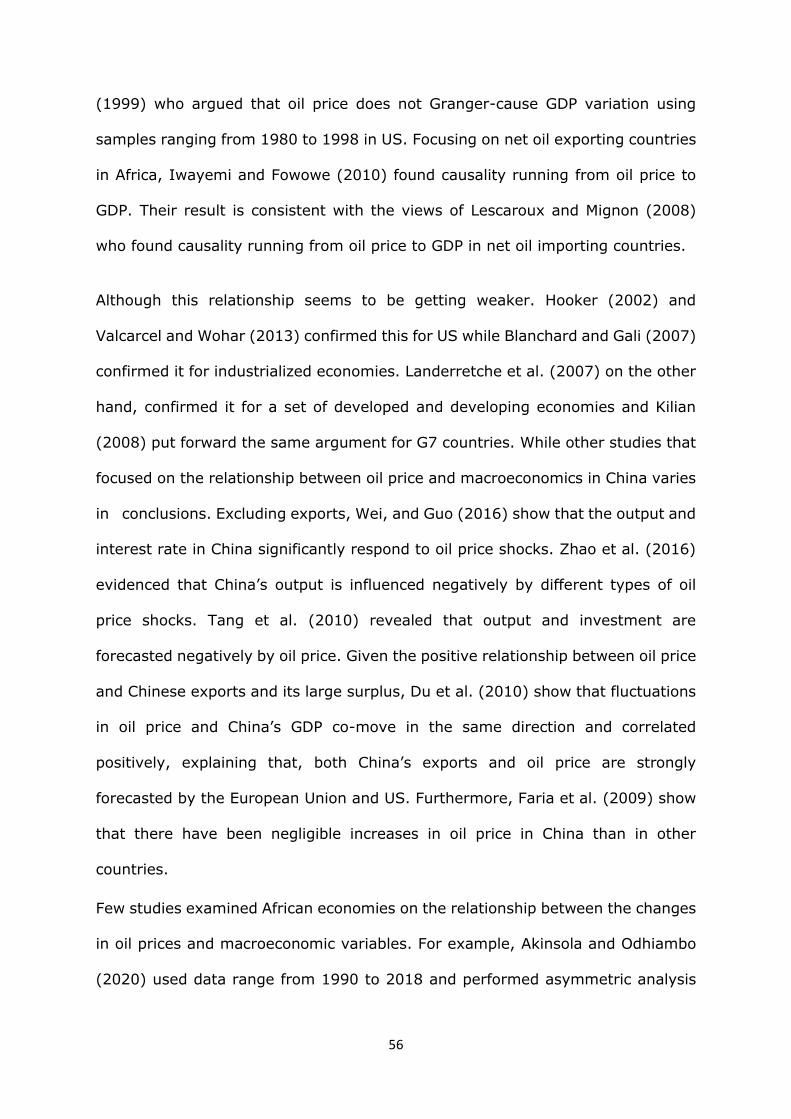
56
(1999) who argued that oil price does not Granger-cause GDP variation using
samples ranging from 1980 to 1998 in US. Focusing on net oil exporting countries
in Africa, Iwayemi and Fowowe (2010) found causality running from oil price to
GDP. Their result is consistent with the views of Lescaroux and Mignon (2008)
who found causality running from oil price to GDP in net oil importing countries.
Although this relationship seems to be getting weaker. Hooker (2002) and
Valcarcel and Wohar (2013) confirmed this for US while Blanchard and Gali (2007)
confirmed it for industrialized economies. Landerretche et al. (2007) on the other
hand, confirmed it for a set of developed and developing economies and Kilian
(2008) put forward the same argument for G7 countries. While other studies that
focused on the relationship between oil price and macroeconomics in China varies
in conclusions. Excluding exports, Wei, and Guo (2016) show that the output and
interest rate in China significantly respond to oil price shocks. Zhao et al. (2016)
evidenced that China’s output is influenced negatively by different types of oil
price shocks. Tang et al. (2010) revealed that output and investment are
forecasted negatively by oil price. Given the positive relationship between oil price
and Chinese exports and its large surplus, Du et al. (2010) show that fluctuations
in oil price and China’s GDP co-move in the same direction and correlated
positively, explaining that, both China’s exports and oil price are strongly
forecasted by the European Union and US. Furthermore, Faria et al. (2009) show
that there have been negligible increases in oil price in China than in other
countries.
Few studies examined African economies on the relationship between the changes
in oil prices and macroeconomic variables. For example, Akinsola and Odhiambo
(2020) used data range from 1990 to 2018 and performed asymmetric analysis
57
between oil price and real GDP, labour force, inflation, and trade openness in net
oil importing countries in Africa. The results show that oil price does not have
significant short run impact on economic growth but has a negative and significant
impact in the long run of the group countries studied. This result implies that the
effect of oil price on macroeconomic variables is time varying. They recommend
that policymakers should implement efficient energy policies and technological
innovation policies to reduce oil price risk.
Salisu and Isah (2017) estimated oil price and macroeconomic relationship in the
context of net oil exporting (Indonesia, Nigeria, Kuwait, Qatar, and Saudi Arabia)
and net oil importing (Argentina, Australia, France, Germany, Japan South Korea)
economies using ARDL model. Their finding established asymmetric response of
stock prices to oil price. Although the response is stronger in net oil exporting
countries compare to net oil importers. They argued that the separation of the
samples into net oil exporting and net oil importing has implication on oil price-
stock relationship and recommend extending the research to examine the sectoral
response of non-energy stocks to oil price shocks, to verify whether the co-
movement between oil price and stock price is not driven by energy-related
stocks.
The empirical evidence from cross-sectional examination on oil price-economic
growth relationship is mixed (Berument et al. 2010; Mureithi 2014). Several
studies take advantage of using panel data such as Salisu and Isah (2017),
Akinsola and Odhiambo (2020), Olayungbo (2021) and Lin and Bai 2021). This is
to capture within group differences and allow for heterogeneity effect of the
countries under study. For example, Lin and Bai (2021) used panel data and
concluded that the response of macroeconomic variables to oil price uncertainty
varies among net oil exporters and net oil importers. Their finding showed that
58
the economic policy uncertainty of net oil exporters response to oil price shocks is
negative and is greater than the economic policy response of that of net oil
importers.
Furthermore, with panel data covering the first quarter of 1990 to fourth quarter
2010, Omojolabi and Egwaikhide (2013) examined the impact of oil price on
economic performance of five net oil exporting countries in Africa including
Nigeria, Algeria, Angola, Egypt, and Libya. The result showed that macroeconomic
variables including real GDP, fiscal deficit, gross investment, and money supply
responded to shocks in oil price. Although, they suggested that gross investment
is the channel through which other variables including GDP respond to oil price
shocks. The policy implication drawn from this study is that continued use of fiscal
deficit and gross domestic product policy tools in net oil exporters in Africa can
speed up economic development even in the presence of oil price shock. A recent
study by Gbatu et al. (2017a) focused on Economic Community of West African
(ECOWAS) countries and samples of net oil exporting and net oil importing
countries with variables of oil price, real GDP, and exchange rate to analyse oil
price-macroeconomic relationship using fixed effect model. Their result showed a
significant negative effect of oil price on real GDP of full ECOWAS sample and net
oil importers. They recommended implementation of diversification and monetary
policies to stabilize macroeconomic variables from oil price shocks.
The reviewed studies have identified that changes in oil price have a significant
impact on macroeconomic variables. However, given that there is little or no
empirical analysis in the context of net oil exporting and net oil importing countries
in Africa, this research will build on the existing literature such as Salius and Isah
(2017) and Akinsola and Odhiambo (2020) and add to these empirical evidences
using various macroeconomic variables including GDP, interest rate, inflation,
59
exchange rate, unemployment rate, food supply, external debt, current account
and foreign reserves to investigate this relationship using ARDL model in the
context of net oil exporting and net oil importing countries in Africa and examine
the effect of oil price on macroeconomic variables’ of these group of countries.
3.2 Literature Review on the Relationship Between Oil Price and
Interest Rates
A large amount of literature examines the fluctuations in oil prices in relation to
macroeconomic variables (see Cologni and Manera 2008; Jumah and Pastuszyn
2007 and Mattei 2005), however limited studies have analysed the effect of oil
price changes on interest rates with most of the work focused on developed
economies. For example, Wu and Ni (2011) examined the impact of changes in oil
price on interest rate alongside with other variables such as inflation, and money
supply with monthly data ranging from 1995 to 2005. The investigation is focused
on understanding how macroeconomic variables interact with external shocks with
different lag length. The result show that shocks in oil price have effect on interest
rate and including inflation and money supply. However, with the different lag
chosen for the analysis, it shows that monetary policy is significant in determining
the relationship between oil price and macroeconomic variables. The research
recommended the application of effective monetary policy to reduce the effect of
oil price shocks on interest rate and inflation.
Using data from 1950 to 2005 and US variables adopted as global variables,
Frankel (2006) suggested that an increase in real interest rate reduces inventory
demand, hence, commodity price including oil price decline. Frankel conclude with
monetary implication by recommending central bank of every country to add
commodity prices to the list of their variables for monitoring purposes regardless
the monetary policy target. Cologni and Manera (2008) argued that the causality
60
may run from oil price shocks to interest rates. They adopted structural
cointegrated VAR model focusing on G-7 countries. The empirical analysis shows
that interest rate of US, Canada, France, and Italy are significantly affected by
unexpected oil price shocks. And this is due to monetary policy response to oil
price shocks which relates to contractionary monetary policy response set to fight
inflation. Similarly, Steidtmann (2004) found that an increase in oil prices caused
a rise in interest rates during the economic recession in the 1970s. Oil prices
increase was an inflation pass through, which caused an increase in interest rates
as a monetary policy intervention, thus creating economic recession. However,
the existing studies fail to show if the interaction between oil price and interest
rate is a long run or short run interaction. As differentiating this relationship into
long run and short may help policymakers, firms, investors, and household
consumers to understand if the relationship is either inflexible or can be adjusted.
Few studies have examined the asymmetric issue between oil prices and interest
rates. For example, Ratti and Vespignani (2015) employed global factor-
augmented error correction model and found that a rise in oil price validates a
significant increase in global interest rate. Furthermore, positive innovation in oil
price causes a decline in the trade weighted value of US dollar rate. Their result
shows that volatility and uncertainty in oil price are disadvantageous to economic
growth with complications for monetary policy. The authors recommended
addressing the implication of asymmetries, nonlinearity and uncertainty in future
research relating to oil price-macroeconomic relationship. Consistent with this
findings, Kilian, and Zhou (2019) used structural vector autoregressive (SVAR)
model and forecasted how changes in oil price affect interest rate and exchange
rates in US. The result evidenced not only that oil price changes affected US real
interest rate, but it also showed that 58% variation in the US exchange rate is
61
driven by global oil price shocks. These results provide direct support for
theoretical models of the relationship between oil price, interest rate and exchange
rates. The implication bordered on pursuing policy that hedge interest rates and
exchange rates from the risks associated with oil price shocks.
The investigation in African economy on the relationship between oil prices and
interest rates is limited. Abdulkareem and Abdulhakeem (2016) provided
analytical insight on oil price- macroeconomic volatility behaviour in Nigeria using
GARCH model and its variants (GARCH-M, EGARCH and TGARCH) with data
covering 1986 to 2014. The results show that all the macroeconomic variables
considered including interest rate, GDP and exchange rate are volatile to oil price
fluctuations. Meaning that volatility arises from oil prices to macroeconomic
variables. However, it is not clear if the effect is short run or long run, but the
authors advocated support for asymmetry in analysing oil price-macroeconomic
relationship in Nigeria. The authors recommended diversification of other sectors
of Nigerian economy including agricultural sector and industrial sector to reduce
the impact of oil price shocks on macroeconomic variables. This study will differ
from previous studies by analysing the asymmetric response of interest rate with
respect to changes in oil price in the context of African net oil exporting and net
oil importing countries. In addition, this study will analyse both the short run and
long run relationship between oil price and interest rate using panel ARDL model.
3.3 Literature Review on the Relationship Between Oil Price and
Inflation
The examination of the relationship between oil prices and inflation is important
because it is argued in literature that changes in oil price validates inflationary
62
pressure and this can reduce economic growth (Cologni and Manera 2008; Mallik
and Chowdhury 2011; Davari and Kamalian 2018; Zakaria et al.2021).
Hooker (2002) provided formal evidence of the asymmetric and nonlinear
relationship between oil price and inflation in the US. This was aimed at
differentiating the effects of oil price increase and decrease on inflation.
Furthermore, it helps in determining the long run and short run effect of oil price
on inflation. There was a statistical break in the estimated relationship between
oil price and inflation at the end of 1980s. When he allowed the interaction to vary
between the period 1962 to 1980 and 1981 to 2000, he found a significant
feedback effect of oil price on inflation in the earlier period, but no significant effect
in the later period. Implying that monetary policy may have help to create a
regime where inflation is less sensitive to oil price in the later periods. Hence, he
recommended that policymaker need to make sure that their response to changes
in oil price should not replicate that of 1970s.
Trehan (2005) focused on oil price-inflation relationship in US economy and
suggested that changes in oil price is statistically significant in forecasting inflation
in the 1970s. He argued that after 1970s, not only that monetary response to oil
price shocks offset the effects of oil price shocks on inflation but also inflation
expectations contributed to why oil price shocks do not have the same impact on
inflation after 1970s. The implication is that sometimes, shocks in oil price are
assigned too much role in the inflation run-up in the 1970s because scholars tend
to ignore the role of monetary policy and inflation expectation at that period. He
recommended the inclusion of inflation expectations and monetary policy variables
in analysing oil price-inflation nexus. Roeger (2005) investigated the long-term
and short-term quantitative effect of changes in oil price on inflation and output
in the European region. The results indicate a short run trade-off between output
63
and inflation. A 25% increase in oil price validates 0.2% reduction in output in the
first year. Suggesting that macro policy cannot smoothen the adjustment. The
author recommends monetary policy that will help cushion inflationary pressure
in the economy.
Castillo et al. (2010) estimated oil price -inflation relationship using perturbation
method and suggested that increased oil price volatility caused an increase level
of average inflation in US economy. Perturbation method is adopted because it
has the advantage of making it simple to obtain strong analytical results for the
relationship between oil price volatility and inflation. To respond to oil price shocks
central bank raises interest rate in response to fluctuations in output, hence,
inflation is affected. The implication of their finding is that monetary policy can be
used to mitigate the effect of oil price shocks on inflation. Misati et al (2013) used
structural vector autoregressive (SVAR) model and analyse oil price-inflation
relationship in Kenya. The study found that the role of oil price shocks is significant
in predicting inflation in the long run. The study recommends adoption of
monetary policy and measures to reduce oil dependence.
Zhao et al. (2016) employed an open-economy dynamic stochastic general
equilibrium (DSGE) model to analyse oil price-inflation dynamics in China and the
rest of the world. The model is structured in a way to capture oil price shock effect
on inflation in four dimensions. These dimensions include oil price supply shocks
driven by political events in OPEC countries, other oil price supply shocks apart
from OPEC’s actions, demand shocks related to industrial commodities, and
specific demand related to global crude oil market. Their findings reveal that oil
supply shocks driven by political events produce short run impact on China’s
inflation and output. While the other three dimensions produce long term effects
with shocks specific global oil demand contributing the longest run effect. This
64
result is robust as it includes different countries and long run and short run effect.
Though it did not indicate if the effect is negative or positive. However, the findings
imply that oil price play a key role in determining inflation in China. Hence, they
suggested implementation of policy that will enhance reduction inflationary
pressure in China.
Cunado and Gracia (2005) estimated the relationship between oil price and
macroeconomic variables by investigating the effect of oil price changes on
inflation and economic growth rates of six Asian countries from 1975𝑞1 to 2002𝑞4.
They utilized oil price and various oil CPI specifications to calculate the effect of
global oil prices on inflation and economic growth on few Asian economies. They
found the oil price forecasted inflation and economic growth. They applied the
same model using domestic oil price in place of global oil price. They found that
domestic oil price has more predictive power over inflation and economic growth
more than global oil price. This explanation is attributed to exchange rate
dynamics. The result of this finding is limited to short run. The Granger-causality
test revealed that domestic oil price Granger-cause inflation and economic growth
in South Korea, Thailand, and Japan only. The significance of oil price appears to
be less in Malaysia being an oil importer. The implication is that the effect of oil
price on net oil exporting countries differs from net oil importing countries.
With respect to Kenya, Kibunyi et al (2018) used ARDL model covering the 1970
t0 2016 to identify the effect of oil price on some selected macroeconomic
variables. Their findings show that not only those fluctuations in oil price have
positive effect on inflation but also, the effect is for the long run. Equally identified
is a long run positive impact of oil price on GDP growth. The growth in GDP is
defined to be a function of Kenyan’s ability to import crude and re-export it to
other countries including Uganda, Rwanda, and South Sudan. The problem with

65
this finding is that it is country specific and cannot be use for generalization. The
economic implication is that trading in crude oil has substantial effect on Kenya’s
inflation dynamics.
Barsky et al. (2002) documented that a rise in oil prices causes increase in output
prices and hence validates increase in inflation. On the other hand, LeBlanc, and
Chinn (2004) are of the view that increase in oil prices have negligible influence
on inflation in European, US. and Japanese economies while Cunado and De Gracia
(2005) focused on Asian countries and documented that the effect of oil prices on
economic activities and price level is significant. Zhang and Reed (2008) argued
that oil price is key factor for rise in agricultural output during the first decade of
2000. Chou and Tseng (2011) draw the same conclusion for emerging Asian
economies in the long run while Chou and Lin (2013) documented same for Taiwan
in the short and long-run. Ibrahim and Said (2012) examined the pass-through of
oil price into consumer price inflation and evidenced a long cointegration between
the oil price and inflation for Malaysia. Supporting the findings, Ibrahim and
Chancharoenchai (2014) affirmed long run relation between CPI and oil prices and
in Thailand. Though, with more advancement, improvement and investment in
energy efficient technologies and a change towards alternative energy sources.
Kiptui (2009) employed conventional Phillips’s curve and estimated the pass-
through of oil price into inflation in Kenya. The finding shows that correlation
between inflation and oil prices declined in the early 90’s but strengthened after
trade liberalization. The outcome of the analysis indicate that oil price has
significant predictive power over inflation. His result equally showed that
aggregate demand and changes in exchange rates significantly influenced
inflation. The measure of oil price pass-through is shown to be 0.05 in the short
run and 0.10 in the long run to inflation, much lesser than exchange rate pass-
66
through which is 0.32 in the short run and 0.64 in the long run. Implying that 1%
increase in oil price will cause 0.5% increase in the short run and 1% increase in
inflation in the long run. Thus, oil price pass-through is low in both case. The
implication is that oil price does not a strong determinant factor in influencing
inflation both in the long run and short run.
Michael and David (2004) employed augmented Phillips’s curve framework to
analyse oil price -inflation nexus in Japan, UK, Germany, US, and France. They
concluded a negligible effect of oil price increase on Japan, US, and Europe’s
inflation. The outcome indicated that 10% increase in oil prices cause about 0.1-
0.8 % direct inflationary pressure in US. Inflation significantly responded to oil
price changes more than US’s inflation.
Cunado and Perezde (2003) estimated oil price-macro economy relationship and
linked it to oil price effect on inflation and industrial manufacturing for different
European countries for period covering 1960 to1999. The outcome of the research
showed asymmetric significant effect of oil price on inflation and production growth
rate However, the response of inflation to oil price shocks of the countries studied
varied. Implying that the effect of oil price shocks on inflation is country specific.
They recommend policy that will shield inflation from oil price shocks.
Khan and Ahmed (2011) focused on Pakistan and with application of SVAR
concluded that oil price shock cause increase in inflation. Using cointegration,
Ansar and Asghar (2013) support this view by evidencing positive relationship
between oil prices and inflation in Pakistan. Chen (2009) estimated oil price-
inflation nexus using a state space approach for 19 industrialized countries and
conclude a positive relationship. While Alvarez et al. (2011) focused on Spain and
Euro zone and applied Dynamic Stochastic General Equilibrium model to reach the
same conclusion.
67
Jiménez-Rodríguez and Sánchez (2009) employed both linear VAR and three
nonlinear approaches, including Mork’s asymmetric model, Hamilton’s net oil
model and Lee’s scaled model in their investigation on the effects of oil price
shocks on the real economy of major industrialized OECD countries. They used
quarterly data covering 1970:3 to 2003:4 with variables including the real wage,
short-term and long-term interest rate, real effective exchange rate and CPI
inflation. The results showed a non-linear effect of oil price on inflation and the
real economy. Furthermore, the scholars showed that when the conditional
variance of the shocks was controlled, the context of oil price volatility with
constant price environments exhibited significant larger impacts compared to
those with fluctuating price environment. This shows that price regime is
important in determining oil price-inflation relationship.
Though this study used different models that focus on the effect of oil price shocks
on macroeconomic performance, thus, appearing to integrate all of them, the
period of sampling according to Ghosh (2009) demonstrated declined volatility of
oil prices with reducing effects on output and inflation. Thus, this may not give a
reflection of the current behaviour of the macroeconomic variables. The scholar
moreover did not specify if the countries chosen are net exporters or net importers
of oil and hence does not provide clarity in terms of the variations in behaviour of
output and inflation of the net oil exporting and net oil importing economies.
There are limited studies on oil price-inflation nexus in African context and the
results are mixed (Kibunyi et al.,2018; Oyelami and Omomola,2016). For
example, Kibunyi et al (2018) used ARDL model covering the period from 1970 to
2016 in Kenya. They found that fluctuations in oil price have positive effect on
inflation and the effect is in the long run. Furthermore, Alimi et al. (2020) adopted
nonlinear autoregressive distributed lag (NARDL) model to investigate the
68
relationship between oil and inflation in Nigeria with quarterly data covering
2009𝑞1 to 2018𝑞4. The result suggest that increase and decrease in oil price
influence inflation negatively in the long run. In the short run increase in oil
validates positive effect on inflation while decrease in oil price is insignificant in
influencing inflation in Nigeria. This implies that increase is oil price is inflationary
both in the short run and in the long run. The policy implication is that policy that
encourages alternative sources of energy should be sourced to minimize the effect
of oil price shocks on domestic price of goods and services.
In contrast, Oyelami and Omomola (2016) found an insignificant effect of oil price
on inflation in Nigeria. Given the varying results found in literature concerning oil
price-inflation nexus, this study asymmetrical modelled the effect of oil price
changes on inflation by adopting panel ARDL model. The adoption of asymmetrical
panel ARDL model do not only help to determine positive and negative effect of
oil price on inflation, but also provide the short run and long run effect of this
relationship in the context of net oil exporting and net oil importing countries in
Africa.
3.4 Literature Review on the Relationship Between Oil Price and
Exchange Rates
Scholars are of the view that changes in oil price can affect economic activities
(Yildirim and Arifli 2021; Sharma et al. 2021). These changes in oil price can
dramatically alter macroeconomic condition of countries by triggering exchange
rate dynamics (Beckmann et al.2017). And these changes in oil price can either
deteriorate or improve trade balance of oil exporters and oil importers through
decline or rise in revenues to either net oil exporters or net oil importers (Yildirim
and Arifli 2021). Consequently, it may put pressure on country’s exchange rate
and foreign exchange reserve, and this can eventually force exchange rates to
69
either depreciate or appreciate (Beckmann et al.2020). Hence, this study adds to
existing literature by asymmetrically investigating oil price-exchange rates nexus
in the context of net oil exporting and net oil importing countries in Africa using
panel ARDL model. The estimation of oil price-exchange rates nexus with panel
ARDL model is not only to determine the short run and long run effect of this
relationship, but also ascertain the positive and negative effect of oil price change
on exchange rates.
Cifarelli and Paladino, 2010 showed a negative relationship between oil price and
the USD exchange rate using GARCH (1,1)-M model. This finding was endorsed
by Fratzscher et al. (2013) who concluded adverse effect of oil price on exchange
rate in the US in the early 2000s using VAR model. However, Zebende (2011) and
Reboredo et al. (2014) who used wavelet approach had a different view that,
negative and weak correlation exist between oil price changes and the US
exchange rates. However, the weak correlation was improved after the financial
crisis, which aligns with the work documented by Reboredo (2012).
Benhmad (2012) found bidirectional causal relationship between oil price and US
real exchange rates. Consistent with this outcome Throop (1993), Zhou (1995),
Dibooglu (1996) and Amano and van Norden (1998a, 1998b) also evidenced
causality running from oil price to exchange rates. Certainly, Amano et al. (1998a)
empirically analysed the relationship between oil price and US dollar real effective
exchange rate using cointegration theory and documented that oil price seemed
to be the major cause of continued US dollar real exchange rate dynamics. They
revealed that oil price is weakly exogenous in the case of Engle et al. (1983) while
the real exchange rate is found not to be. Meaning that, the degree at which
exchange rate adjusts to the oil price in the long run and not the other way round.
In line with the weak exogeneity outcome, causality tests show that while oil price
70
Granger-cause exchange rate, there is no evidence to support the converse.
Similar conclusions were drawn by Hamilton (1983), Burbidge and Harrison (1984)
and Mork (1989). Amano and van Norden (1998b) evaluated domestic oil price-
exchange rates nexus for US, Germany, and Japan. They clarified why oil price
captured exogenous shocks from terms of trade which explained exchange rate in
the long run, and why oil price is the key factor of the long run exchange rates
dynamics in the countries examined.
The study by Golub (1983) and Krugman (1983) offers theoretical background as
to how fluctuations in oil price predict exchange rates and these models are the
foundation that support empirical results. They reveal that as oil price increases
income is transferred to net oil exporting countries from net oil importing countries
and this validates improvement in the current account balance of net oil exporters
in their local currency. Hence, appreciation in the value of domestic currency of
net oil exporting countries and depreciation in value of domestic currency of net
oil importing countries following an oil price increase.
Wang and Wu (2012) evidenced non-linear bidirectional causality and significant
unidirectional linear causality running from oil prices to exchange rates before
and after the global financial crisis between 2007 and 2009 in China. Their
outcome show that regime shifts and volatility spillover contributed to the non-
linear causality behaviour of the variables. Focusing on Russia, Bouoiyour et al.
(2015) documented causality running from oil price to exchange rate dynamics.
Chen et al. (2016) examined the impact of oil price shocks on exchange rates for
16 OECD countries applying monthly data. While separating oil price shocks, they
adopted Kilian (2009) approach and evidenced that exchange rates responded
substantially different to oil price shocks depending on whether changes in oil
prices were driven by demand or supply shocks. They further suggest that the
71
ability of oil price shocks to explain exchange rates changes improves after the
global financial crisis between 2007 and 2009. Nusair and Olson (2019) examine
the effect of oil price shocks on currencies of Asian countries by employing quantile
regression after accounting for asymmetry and structural breaks. Their finding
shows that oil price shocks asymmetrically affected exchange rates, and the
impact is a function of current market conditions.
Chaudhuri and Daniel (1998) employed cointegration tests and evidenced that the
nonstationary characteristic of US exchange rate during post-Bretton Woods
period is function of fluctuations in oil price. Chen and Chen (2007) adopted panel
cointegration test to estimate the long run association between oil price and
exchange rates of G-7 countries. They concluded that oil price seems to be the
key driving force of exchange rate variations and that oil price have predictive
power over exchange rate. Bénassy-Quéré et al. (2007) and Coudert et al. (2008)
offered evidence for long run relation between oil price and exchange rates in real
terms. They found causality running from oil price to exchange rate, over the
period 1974 to 2004. Coudert et al. (2008) explained that a rise in oil price can
validate improvement of US net foreign asset position compared to other countries
and this can significantly cause appreciation of US dollar. In other vein, some
scholars concluded that variation in the US dollar provide explanation for oil price
fluctuations.
Sadorsky (2000) estimated the cointegrated causal relationship between energy
futures price of crude oil, unleaded gasoline and heating oil and the US dollar
exchange rates. The finding show that exchange rates convey exogenous shocks
to energy futures prices. Thus, the movement in commodity prices may be
associated with variations in the US dollar. Zhang et al. (2008) employed various
econometric techniques and investigated three spillover effects, which are
72
volatility spillover, risk spillover and mean spillover of US dollar exchange rate on
oil price. They arrived at different conclusions with each spillover effect. For
instance, considering the mean spillover, they suggested that the US dollar
depreciation is a function of global crude oil price. Zhang and Wei (2010) adopted
causality and cointegration analysis to consider the global oil market and the gold
market; they documented that US dollar index seems Granger-cause variations in
both gold price and crude oil price.
Thenmozhi and Srinivasan (2016) examine oil price-exchange nexus in 15 major
oil importing countries and concluded insignificant relationship between oil price
and exchange rates in the short-term but significant in the long-run for some
countries. Prasad Bal and Narayan Rath (2015a, 2015b) documented that oil price
and exchange rates in both India and China have a bidirectional nonlinear Granger
causality relationship. Kisswani et al. (2019) explored the relationship between oil
price and exchange rates for the Association of Southeast Asian Nations and
conclude the existence of unidirectional and bidirectional Granger causality
relationships in oil price - exchange rates nexus of the countries studied. Shahbaz
et al. (2014) evidenced significant interaction between oil price and exchange rate
in Pakistan. And they concluded that Pakistani exchange rates validates oil prices
changes. Furthermore, Aloui et al. (2018) found that exchange rate of Saudi
Arabia also has a close relationship with the oil price.
Huang and Guo (2007) focused on Chinese economy and applied vector
autoregression model (VAR) to analyse oil price-exchange rate nexus. They
concluded that, in the long run oil price validated negligeable appreciation of the
CNY exchange rate. Focusing on Gulf Cooperation Council countries, Rasasi (2017)
reported linear and nonlinear oil price shocks have different effects on exchange
rates. Narayan et al. (2008) applied generalised autoregressive conditional

73
heteroskedasticity model (GARCH) covering the period of 2000 to 2006 and
concluded that increase in oil prices cause appreciation of the Fijian dollar. Though,
for the oil exporting country such as Nigeria during the period between 2007 to
2010, fluctuations in oil price substantiated depreciation of naira (Muhammad et
al. 2012).
Lawal and Aweda (2015) explored the relationship between exchange rate, oil
price and inflation rate in Nigeria using ARDL model with monthly data covering
2004 to 2016. They conclude that the short run and long run effect of oil price on
exchange rate negative and significant. This implies that oil price significantly
accounts for exchange rate dynamics in Nigeria. The implication of this result is
that policy aimed at stabilizing variations in exchange movements in Nigeria
should be pursued by monetary authority.
Lizardo and Mollick, (2010) employed data covering 1970 to 2008 and evidenced
that increase in oil price validated depreciation of the US dollar against the
currencies of oil exporting countries including Russia, Canada, and Mexico in the
long run. While the currencies of net oil importing countries net oil importers
including Japan depreciated relative to US dollars. The findings suggest that
significant linkage between oil price and currencies of net oil exporting and oil
importing countries. The policy implication of the finding is that oil price does have
a role in the information set when modelling US dollar movements through both
out-of-sample and in-sample techniques.
Ghosh (2011) evidenced that increase in oil price shocks cause depreciation of
Indian domestic currency using GARCH and exponential GARCH (EGARCH) model
with data covering from July2 2007 to November 28, 2008. Furthermore, he found
that positive and negative oil price shocks have similar effect in terms of
magnitude on exchange rate volatility and that oil price shocks have long-lasting
74
effect on exchange rate volatility. This means that there could be portfolio
switching by investors from foreign assets to domestic assets as result
depreciation of Indian currency. This can cause domestic stock to increase as
result of increase in demand. He recommended policy that hedge exchange rates
against oil price shocks.
Focusing on South Africa, Fowowe (2014) proved that increase in oil price leads
to depreciation of the South Africa Rand against the US dollar using GARCH with
daily data covering from January 2, 2003, to January 27, 2012. The finding shows
that 105 increase in oil price validates 14% depreciation of the rand. This result is
consistent with the theoretical expectations of income shift, that when oil price
increases wealth is transferred from net oil importing countries to net oil exporting
countries. The policy implications indicate that the use of monetary policy in
controlling inflationary pressure from oil price increase can be limited. Again,
investors need to pay particular attention on the relationship between oil price and
exchange rate when designing portfolios.
Brahmasrene et al. (2014) evidenced significant impact of oil price on exchange
rates in the long run and medium term, but insignificant in the short run in US
using Granger causality test and variance decomposition impulse response
function analysis with monthly data covering from January 1996 to December
2009. The findings shows that oil price play a role in determining exchange rate
dynamics in US economy. Hence, information from this finding should be used by
policymakers and investors to adjust their policy towards exchange rate and
portfolios holdings respectively.
Aloui et al. (2013) showed that increase in oil price has correlation with
depreciation of US dollar using copula-GARCH model with data covering 2000 to
2011. The implication is that taken into consideration of the co-movement
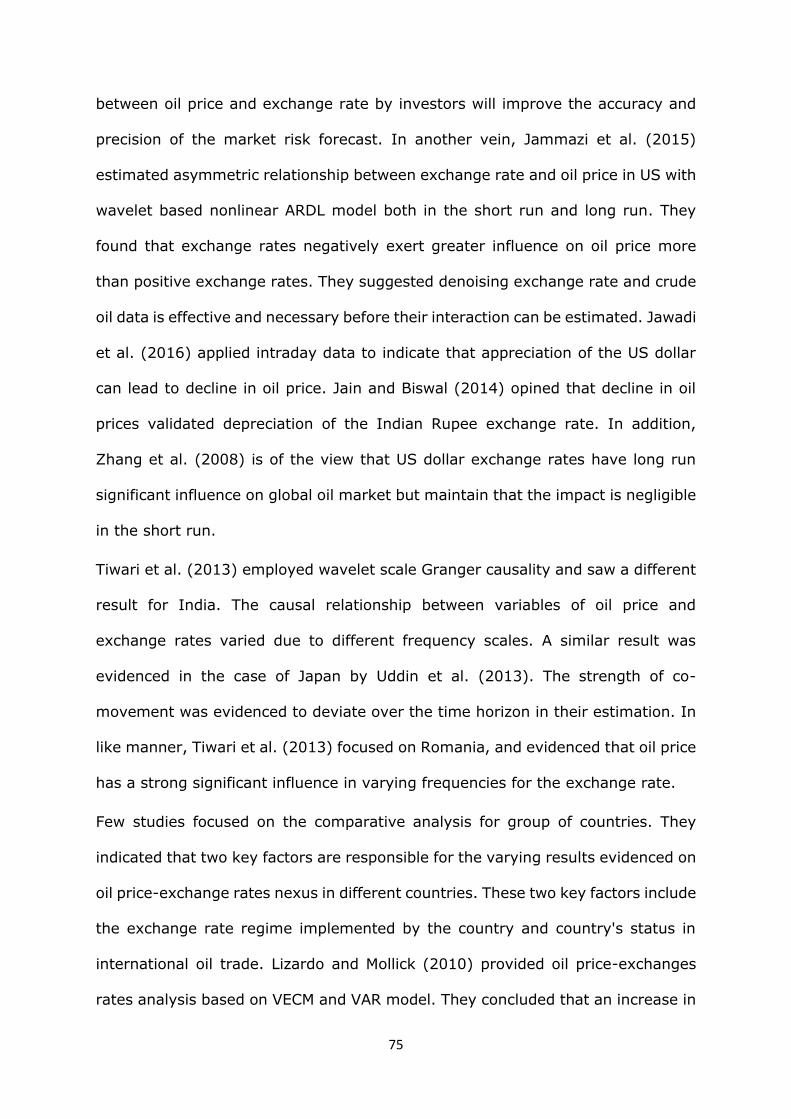
75
between oil price and exchange rate by investors will improve the accuracy and
precision of the market risk forecast. In another vein, Jammazi et al. (2015)
estimated asymmetric relationship between exchange rate and oil price in US with
wavelet based nonlinear ARDL model both in the short run and long run. They
found that exchange rates negatively exert greater influence on oil price more
than positive exchange rates. They suggested denoising exchange rate and crude
oil data is effective and necessary before their interaction can be estimated. Jawadi
et al. (2016) applied intraday data to indicate that appreciation of the US dollar
can lead to decline in oil price. Jain and Biswal (2014) opined that decline in oil
prices validated depreciation of the Indian Rupee exchange rate. In addition,
Zhang et al. (2008) is of the view that US dollar exchange rates have long run
significant influence on global oil market but maintain that the impact is negligible
in the short run.
Tiwari et al. (2013) employed wavelet scale Granger causality and saw a different
result for India. The causal relationship between variables of oil price and
exchange rates varied due to different frequency scales. A similar result was
evidenced in the case of Japan by Uddin et al. (2013). The strength of co-
movement was evidenced to deviate over the time horizon in their estimation. In
like manner, Tiwari et al. (2013) focused on Romania, and evidenced that oil price
has a strong significant influence in varying frequencies for the exchange rate.
Few studies focused on the comparative analysis for group of countries. They
indicated that two key factors are responsible for the varying results evidenced on
oil price-exchange rates nexus in different countries. These two key factors include
the exchange rate regime implemented by the country and country's status in
international oil trade. Lizardo and Mollick (2010) provided oil price-exchanges
rates analysis based on VECM and VAR model. They concluded that an increase in
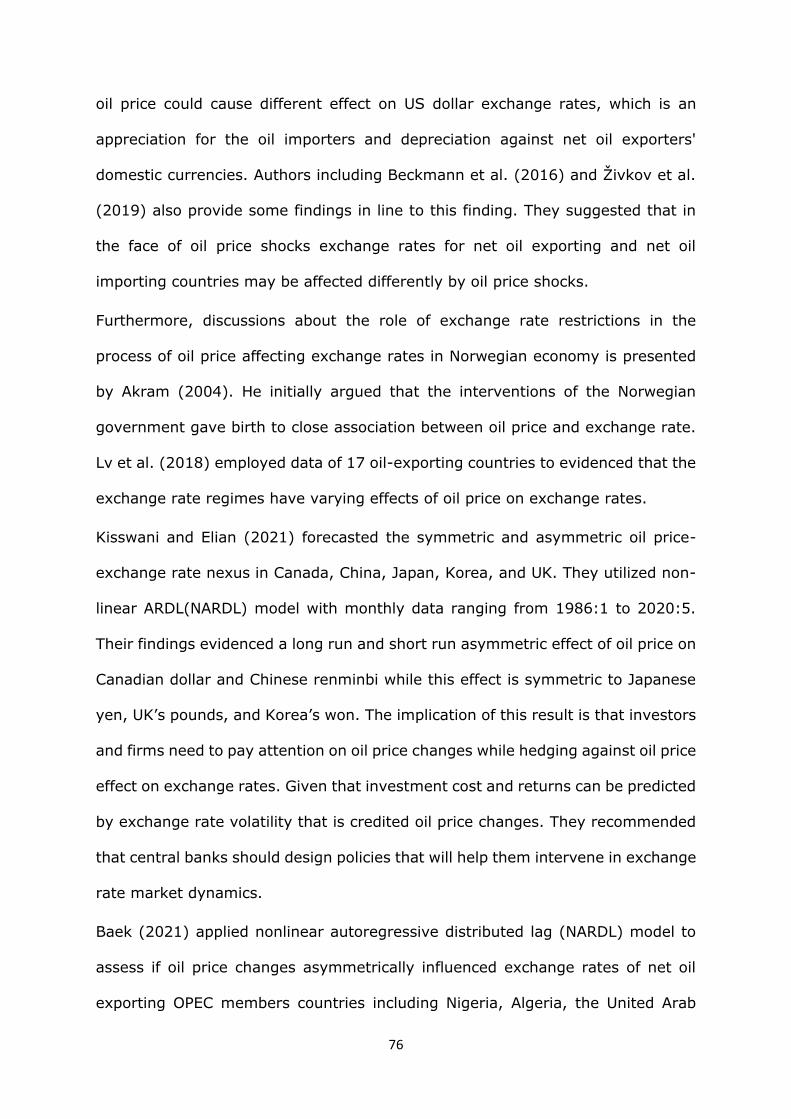
76
oil price could cause different effect on US dollar exchange rates, which is an
appreciation for the oil importers and depreciation against net oil exporters'
domestic currencies. Authors including Beckmann et al. (2016) and Živkov et al.
(2019) also provide some findings in line to this finding. They suggested that in
the face of oil price shocks exchange rates for net oil exporting and net oil
importing countries may be affected differently by oil price shocks.
Furthermore, discussions about the role of exchange rate restrictions in the
process of oil price affecting exchange rates in Norwegian economy is presented
by Akram (2004). He initially argued that the interventions of the Norwegian
government gave birth to close association between oil price and exchange rate.
Lv et al. (2018) employed data of 17 oil-exporting countries to evidenced that the
exchange rate regimes have varying effects of oil price on exchange rates.
Kisswani and Elian (2021) forecasted the symmetric and asymmetric oil price-
exchange rate nexus in Canada, China, Japan, Korea, and UK. They utilized non-
linear ARDL(NARDL) model with monthly data ranging from 1986:1 to 2020:5.
Their findings evidenced a long run and short run asymmetric effect of oil price on
Canadian dollar and Chinese renminbi while this effect is symmetric to Japanese
yen, UK’s pounds, and Korea’s won. The implication of this result is that investors
and firms need to pay attention on oil price changes while hedging against oil price
effect on exchange rates. Given that investment cost and returns can be predicted
by exchange rate volatility that is credited oil price changes. They recommended
that central banks should design policies that will help them intervene in exchange
rate market dynamics.
Baek (2021) applied nonlinear autoregressive distributed lag (NARDL) model to
assess if oil price changes asymmetrically influenced exchange rates of net oil
exporting OPEC members countries including Nigeria, Algeria, the United Arab

77
Emirate, Kuwait, Saudi Arabia, and Venezuela. With monthly dataset from 2000:1
to 2017:6, he discovered that changes in oil price have long run and short run
asymmetric effect on real exchange rate of OPEC countries with floating exchange
rate regime such as Nigeria and Algeria. Whereas the result provided little
evidence of long run and short run asymmetric effect of changes in oil price on
exchange rate of OPEC countries with fixed exchange rate regime such as Kuwait
and Saudi Arabia. The author recommended a policy implication of significant
short run influence of oil price to be applied on domestic currencies of these OPEC
members regardless of their exchange rate regime.
Furthermore, the author is of the view that OPEC members with floating exchange
rate regime should implement expansionary monetary policy aimed at reducing
interest rate and depreciating their domestic currencies in the long run which may
subsequently improve their trade deficit. OPEC members with fixed exchange rate
regime particularly Saudi Arabia, the author recommended change in the
exchange peg level to boost export earnings and current account balance in the
long run. The author is of the view that policies aimed at diversifying export
earnings of OPEC members via long term industrial policies should be encouraged
for OPEC members to maintain their current role in oil global market.
Additionally, Baek and Choi (2021) confirmed asymmetric effect of oil price
changes on Indonesian rupiah both in the short run and long run with nonlinear
ARDL model application. The asymmetric response of Indonesian rupiah to
changes in oil price indicate that Indonesia rupiah is more responsive to oil price
increase than oil price decline. The implication of this relationship is that changes
in oil price triggers exchange rates of Indonesia to experience depreciation or
appreciation. With appreciation of the rupiah Indonesia economy experiences
current account surplus while depreciation validates current account deficit. Since
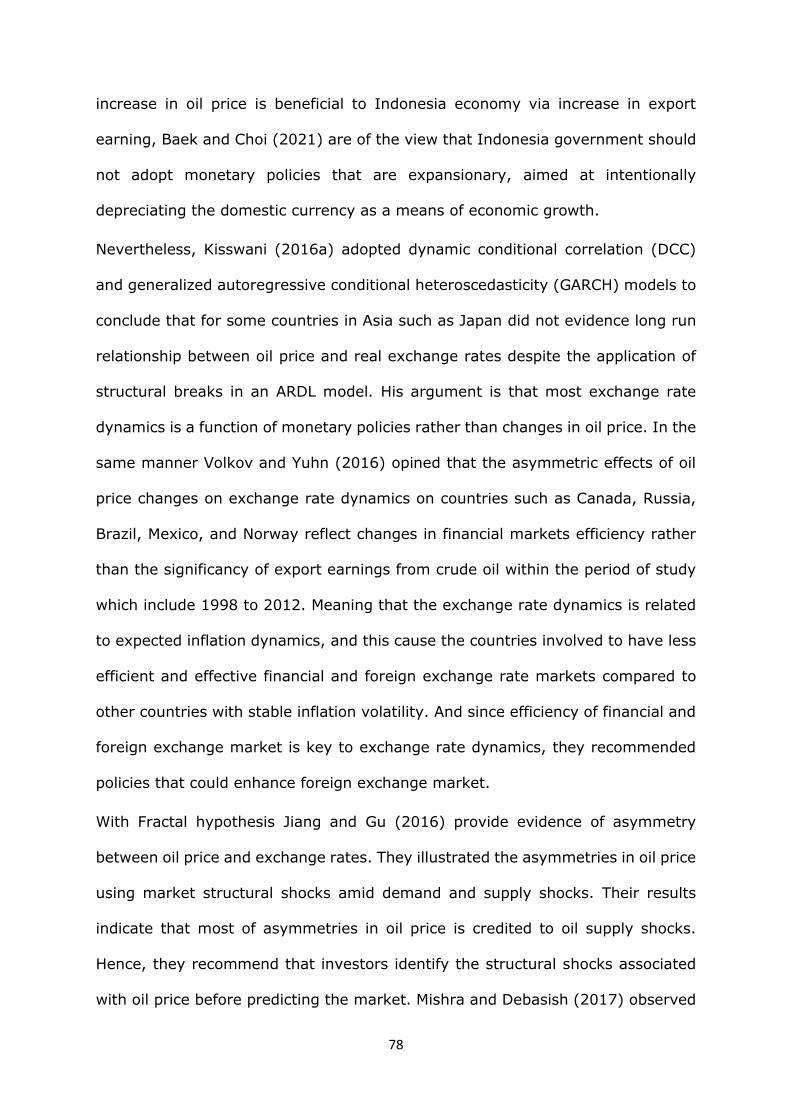
78
increase in oil price is beneficial to Indonesia economy via increase in export
earning, Baek and Choi (2021) are of the view that Indonesia government should
not adopt monetary policies that are expansionary, aimed at intentionally
depreciating the domestic currency as a means of economic growth.
Nevertheless, Kisswani (2016a) adopted dynamic conditional correlation (DCC)
and generalized autoregressive conditional heteroscedasticity (GARCH) models to
conclude that for some countries in Asia such as Japan did not evidence long run
relationship between oil price and real exchange rates despite the application of
structural breaks in an ARDL model. His argument is that most exchange rate
dynamics is a function of monetary policies rather than changes in oil price. In the
same manner Volkov and Yuhn (2016) opined that the asymmetric effects of oil
price changes on exchange rate dynamics on countries such as Canada, Russia,
Brazil, Mexico, and Norway reflect changes in financial markets efficiency rather
than the significancy of export earnings from crude oil within the period of study
which include 1998 to 2012. Meaning that the exchange rate dynamics is related
to expected inflation dynamics, and this cause the countries involved to have less
efficient and effective financial and foreign exchange rate markets compared to
other countries with stable inflation volatility. And since efficiency of financial and
foreign exchange market is key to exchange rate dynamics, they recommended
policies that could enhance foreign exchange market.
With Fractal hypothesis Jiang and Gu (2016) provide evidence of asymmetry
between oil price and exchange rates. They illustrated the asymmetries in oil price
using market structural shocks amid demand and supply shocks. Their results
indicate that most of asymmetries in oil price is credited to oil supply shocks.
Hence, they recommend that investors identify the structural shocks associated
with oil price before predicting the market. Mishra and Debasish (2017) observed
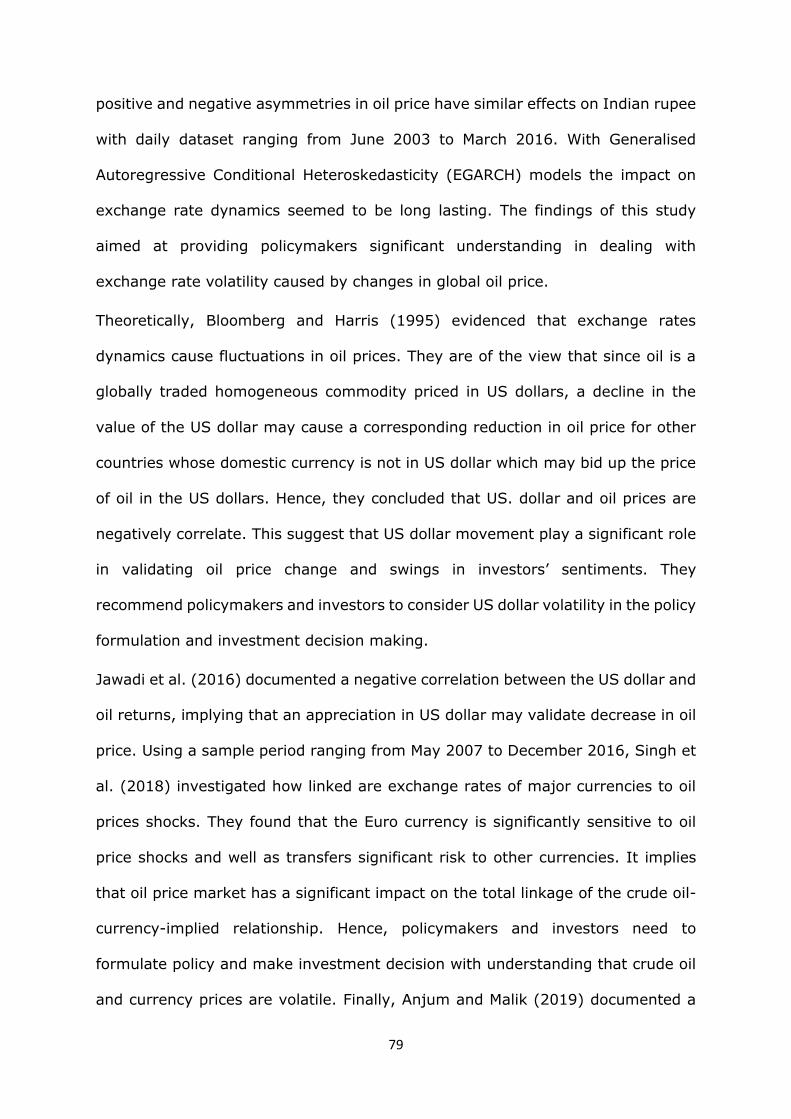
79
positive and negative asymmetries in oil price have similar effects on Indian rupee
with daily dataset ranging from June 2003 to March 2016. With Generalised
Autoregressive Conditional Heteroskedasticity (EGARCH) models the impact on
exchange rate dynamics seemed to be long lasting. The findings of this study
aimed at providing policymakers significant understanding in dealing with
exchange rate volatility caused by changes in global oil price.
Theoretically, Bloomberg and Harris (1995) evidenced that exchange rates
dynamics cause fluctuations in oil prices. They are of the view that since oil is a
globally traded homogeneous commodity priced in US dollars, a decline in the
value of the US dollar may cause a corresponding reduction in oil price for other
countries whose domestic currency is not in US dollar which may bid up the price
of oil in the US dollars. Hence, they concluded that US. dollar and oil prices are
negatively correlate. This suggest that US dollar movement play a significant role
in validating oil price change and swings in investors’ sentiments. They
recommend policymakers and investors to consider US dollar volatility in the policy
formulation and investment decision making.
Jawadi et al. (2016) documented a negative correlation between the US dollar and
oil returns, implying that an appreciation in US dollar may validate decrease in oil
price. Using a sample period ranging from May 2007 to December 2016, Singh et
al. (2018) investigated how linked are exchange rates of major currencies to oil
prices shocks. They found that the Euro currency is significantly sensitive to oil
price shocks and well as transfers significant risk to other currencies. It implies
that oil price market has a significant impact on the total linkage of the crude oil-
currency-implied relationship. Hence, policymakers and investors need to
formulate policy and make investment decision with understanding that crude oil
and currency prices are volatile. Finally, Anjum and Malik (2019) documented a

80
comprehensive overview of the literature on the empirical and theoretical
relationship between oil prices and exchange rates. They evidence that the
consensus in the literature is that there is bidirectional causality between
exchange rates and oil price which implies that there is substantial economic effect
using one variable for forecasting the other.
Amano and Norden (1998) used Granger-causality test and error correction (ECM)
model to show if there was a stable link between oil price shock and US real
effective exchange rate during the post-Bretton Woods. Their findings not only
suggest that fluctuations in oil price could be the main cause of continued real
exchange dynamics but also suggested that fluctuations in oil price may have
significant consequences for future study on exchange performance and should be
incorporated into models of real business cycles.
Buetzer et al. (2016) separated net oil exporting countries and net oil importing
countries in the sample of 43 economies. Their VAR analyses reported that oil
exporting countries tend to experience appreciation pressure mainly from oil
demand shocks, but this is offset by foreign exchange reserves accumulation.
However, set against the findings in literature, Buetzer et al. (2016) argued that
net oil importing countries experience appreciation of exchange rate as well. The
reason they gave is related to the theory that either oil importers peg their
exchange rate, or they accumulated foreign reserves in the wake of these shocks.
As such, their exchange rate is hedged against shocks in oil price. Hence, the lack
of correlation between oil price shocks and exchange rates may be due to
intervention measures taken in foreign exchange rate market by oil surplus
economies (see Olayungbo 2019). Implying that foreign exchange reserve is a
significant shock absorber of the effect of oil price shocks on exchange rate. The
81
recommended that policy aimed at enhancing foreign exchange reserves should
be pursued.
Bayat et al. (2015) employed monthly data to investigate the causal dynamics
between oil price and exchange rate in Czech Republic, Poland, and Hungary. Their
findings on Hungary shows that oil price does not have causal effect on exchange
rate with frequency domain analysis. On Czech Republic and Poland economies,
the frequency domain analysis reveals a long run effect of oil price on exchange
rate. Hence, their results with respect to oil price-exchange rate relationship is
country-specific. They recommend that policymakers should pursue a country-
specific policy regarding oil price-exchange rate relationship.
Kin and Courage (2014) used Generalized Autoregressive Conditional
Heteroscedasticity (GARCH) model with monthly data covering 1994 to 2012 to
analyse the impact of oil prices on exchange rate in South Africa. The findings
showed a significant inverse relationship between oil price and nominal exchange
rate. Meaning that, fluctuations in oil price has predictive power over exchange
rate dynamics in South Africa. Al-Ezzee (2011) underline the role of oil price in
determining exchange rate dynamics in Bahrain using Vector Error Correction
(VECM) model with data covering 1980 to 2005. Increase in oil price is found to
depreciate exchange rate in Bahrain in the long run within the period of study.
This implies that oil price is a determinant factor of exchange rate dynamics in
Bahrain in the long run. Hence, policy aimed at hedging exchange rate against oil
price dynamics should be pursued.
Given that the oil price-exchange rate dynamics are inconclusive in the empirical
findings, this study adopts panel ARDL model to analyse the asymmetric response
of exchange rate to changes in oil price. This is to determine how the asymmetries
82
of negative and positive changes in oil price affect exchange rate in the long run
and in the short run, in net oil exporting and oil importing countries in Africa.
3.5 Literature Review on the Relationship Between Oil Price and
Unemployment Rate
Regarding the relationship between oil price-unemployment rates nexus, findings
from empirical analysis varies from country to country (Zhang and Liu 2020). As
such the relationship between oil price and unemployment dynamics spawn great
interest in the literature (Nusair 2020; Zhang and Liu 2020; Raifu et al. 2020).
Many studies in the literature focused on the channel through which fluctuations
in oil price affect unemployment rate (Nusair 2020; Zhang and Liu 2021).
Loungani (1986) argued that the main reason for increased unemployment rates
in US is the unexpected level of reallocation of work force across sectors due to
increases in oil price. Similarly, Hamilton (1983) evidenced a strong correlation
between oil prices and unemployment rate in US. Mory (1993) advocates an
asymmetric relationship by highlighting that the negative effect of rising oil prices
on unemployment rate was greater more than the positive effect of decrease in
oil price on unemployment rate in US. Keane and Prasad (1996) documented that
the fluctuations in oil prices validates the variations in relative wages and
employment rates across different sectors.
Carruth et al. (1998) used a theoretical framework to empirically demonstrate the
effect of oil price on unemployment rate in US. The efficiency wage framework
used by Carruth et al. (1998) show that without any assumption with respect to
labour supply elasticity, changes in the labour market can be credited to demand
changes created by changes in input prices. In summarising this theoretical
framework, Zhang, and Liu (2021) underline the role of oil price in determining
83
unemployment rate dynamics by exploring if the efficiency wage model is
consistent for US and China. Supporting the efficiency wage model, their finding
shows that oil price and unemployment rate interact through demand, supply, and
inflation channels. For US, the interaction between oil price and unemployment is
mainly explained by monetary policy, geopolitical events, shale revolution and
financial crisis. Whereas in China oil price-unemployment rate nexus is explained
by high oil demand. The significant implication of this study is identifying factors
that caused causal link between oil price and unemployment rate and formulate
policies that hedge unemployment rate from oil price shocks in US and China.
Maijamaâ and Musa (2020) employed VECM technique to explore the relationship
between oil price and unemployment rate in Nigeria with data covering 1991 to
2018. The result showed that oil price is negative and significant in affecting
unemployment rate in the long run. While the short run effect of oil price on
unemployment rate in Nigeria is insignificant. This means that changes in oil price
only account for unemployment rate dynamics in the long run in Nigeria. The policy
implication is that policymakers should encourage policy strategized in providing
reduction in unemployment rate in the long run due to oil price shocks.
Ordóñez et al. (2019) are of the view that although the effect of declining oil price
is weaker compared to increasing oil price in Spain. A decreasing oil price has a
positive predictive power over unemployment rates and an increasing oil price
forecast unemployment rate negatively. The study highlights the need for
designing policy measures aimed at reducing unemployment rate given oil price
increase. Cuestas and Ordonez (2018) evidenced that before the financial crisis
between 2007 and 2009, positive oil price shocks significantly and negatively
affected unemployment rates, while negative oil price shocks kept UK
unemployment rate at low levels since the financial crisis.
84
Cuestas and Gil-Alana (2018) indicated a mixed outcomes for the short run effect,
whereas a rising or falling oil price increase or decreases the equilibrium
unemployment rates in Eastern and Central Europe. Karlsson et al. (2018)
documented evidence that under a time horizon of roughly two years, increase or
decrease in oil price reduces or increase unemployment rate in Norway. Karaki
(2018) focused on US and revealed that positive oil demand shocks reduce
unemployment rate while a negative oil supply shocks validates an increase in
unemployment rate in most US.
The findings of Caporale and Gil-Alana (2002), Gil-Alana and Henry (2003) and
Gil-Alana (2003) put forward that oil prices and unemployment are slightly
cointegrated for Australia, Canada, and UK. Ewing and Thompson (2007) conclude
negative interaction between crude oil price and unemployment rates in US.
Likewise, Lescaroux and Mignon (2008) proved significant impact of oil prices on
unemployment rate in the US. The estimation of Andreopoulos (2009) pointed out
the forecasting ability of oil prices on unemployment rate to only exists in
recessions. Herrera and Karaki (2015) documented that the effect of oil price
shocks on employment in the US exist in manufacturing sector. This occurs mainly
through channels of income transfer and reduced potential output. Karlsson et al.
(2018) found unemployment rate to negatively responded to oil price shocks in
Norway. They argued that the relationship may probably be due to Norway is an
oil exporting country. Adopting nonlinear autoregressive distributed lag (NARDL)
model, on the contrary to earlier study, Kisswani and Kisswani (2019) evidence a
significant impact of negative oil price shocks on unemployment rate rather than
positive oil price shocks in the US. In Greece, Papapetrou (2001) concluded
negative relationship between oil price shocks and unemployment rate. In like
85
manner, Doğrul and Soytas (2010) confirm significant causality running from oil
prices to unemployment rate in Turkey.
Cuestas (2016) opined that in Spain, oil price affects the equilibrium
unemployment rate, and compared with a declining oil price an increasing oil price
has an adverse and significant effect on the equilibrium unemployment rate.
Katircioglu et al. (2015) show that unemployment rate, consumer prices and GDP
are forecasted by the oil price in OECD countries. Andreopoulos (2014) employed
Markov switching models to revealed that the COP can help predict the UR during
recessions. Mitchieka and Gearhart (2019) indicate that oil price affects trade and
mining employment in the long run and short run, whereas employment in service
industry is not affected. Karaki (2018) indicates that oil price shocks cause job
reallocation in the US. Herrera et al. (2017) revealed that jobs were reallocated
away from the gas and oil industry to the manufacturing industries, service
industry and construction, following a decrease in oil price. Herrera and Karaki
(2015) documented those positive oil price shocks cause a rise in job assignment
and decline in US manufacturing industry employment.
Raifu et al. (2020) evidenced the asymmetries in oil price- unemployment rate
relationship in Nigeria using linear and nonlinear ARDL model with quarterly
dataset ranging from 1979𝑞1 to 2018𝑞1. The application of linear and nonlinear
ARDL model help in evidencing the effect of positive and negative oil price shocks
on unemployment rate. The result from linear ARDL model showed insignificant
relationship between oil price and unemployment rate. Similar result is obtained
with short run nonlinear ARDL analysis when oil price dynamics is separated into
increase and decrease effect. Whereas in the long run the result show that
increase in oil price has adverse effect on unemployment rate in Nigeria while
decrease in oil price is insignificant in forecasting unemployment rate in Nigeria.

86
The implication is that increase in oil price has stronger effect on unemployment
rate in Nigeria, hence, the authors recommend the need for government to invest
oil revenues in alternative sources of energy with the objective to reduce firm’s
production cost.
Kocaarslan et al. (2020) investigated the presence of asymmetries in relation to
the interaction between oil price, oil price uncertainty, unemployment rate and
interest rate in US using nonlinear auto-regressive distributed lag (NARDL) model.
The result suggests that an increase in oil price substantiated increase in
unemployment rate while decrease in oil price is insignificant in forecasting
unemployment rate. The authors found that measure of oil price uncertainty is
stronger in predicting unemployment rate more than conditional volatility of crude
oil prices. Given the uncertainty associated with oil price, the authors offered
significant recommendation to policymakers to construct sound economic policies
that can reduce the vulnerability unemployment rate to oil price shocks.
Nusair (2020) focused on Canada and US to analyse oil price-unemployment
nexus using nonlinear ARDL (NARDL) model. The result confirmed that only
decrease in oil price have a significant short run effect in unemployment rate.
Whereas both decrease and increase in oil price have significant positive long
effect on unemployment rate. This shows that increase in oil price cause increased
unemployment rate while decrease in oil price reduces unemployment rate in
Canada. While in the sample of US evidence of asymmetry exist both in the long
run and short run with decrease in oil price having a greater impact on
unemployment rate more than increase in oil price. The study suggested that oil
price is very influential in determining unemployment rate both in Canada and US,
hence, government of these countries should seek policies that will reduce
87
dependence on oil by diversifying energy resources into renewable energy power
plants.
There are very few literatures on the relationship between oil prices and
unemployment in developing countries. Umar and Abdulhakim (2010) explored
Nigeria economy with VAR model and forecasted the significant effect of oil price
on unemployment rate, money supply and GDP. They found insignificant effect of
oil price on price index. The authors concluded that given the volatility of
macroeconomic variables to external shocks, the macroeconomic performance is
subject to oil price volatility, thus, making it difficult to manage macroeconomic
variables. The authors fail to show not only if the effect is positive or negative but
also whether the effect of the oil price volatility on macroeconomic variables is in
the short run or in the long run. However, the authors recommended that
diversification of the economy is necessary to minimize the consequences of
external shocks. This study will extend to the most recent oil price movements
that occurred during and after the financial crisis between 2007 to 2009 and
provide new evidence on oil price unemployment relationship in the context of net
oil importing and exporting countries in Africa using panel ARDL model. The
adoption of panel ARDL model is to evidence the asymmetries associated with oil
price-unemployment rate relationship by separating changes in oil price into
positive and negative short run and long run effects.
3.6 Literature Review on the Relationship Between Oil Price and Food
Supply
Oil price shocks affects energy intensive farming because prices paid by farmers
for oil products or direct energy reflect the domestic oil price markets (Esmaeili
and Shokoohi 2011). Furthermore, agricultural producers buy oil indirectly for
88
their agricultural inputs, for example, nitrogen fertilizers, electricity, and fuel costs
for field operations, drying and irrigation (Srinivasan 2009). With fertilizer costs,
these costs amount to a substantial proportion of the cost incurred in production
of many crops (Esmaeili and Shokoohi 2011). Thus, increase in food prices are
reflection of global oil price and these stimulated economic research on the
relationship between oil price and food price (Musser et al., 2006).
Additionally, changes in food prices are significant for the welfare of both
developed and developing countries (see Neftci and Lu 2008; Frankel 2008; Daude
et al. 2010). This significance has spawned a considerable academic literature with
the focus on food price response to fluctuations in oil price. Seminal empirical work
by Al-Maadid et al. (2017) show that oil price significantly forecasted food price
especially during financial crisis period between 2007 and 2009. An extensive
literature including Roman et al. (2020) and Widarjono et al. (2020) found a close
relationship between oil prices and agricultural commodity prices. Ibrahim (2015)
employed nonlinear autoregressive distributed lag (NARDL) to model the
asymmetries in oil price and food price in Malaysia. He evidenced a long run
significant influence of increase in oil price on food price and insignificant effect of
decrease in oil price on food price. The absence of insignificant influence of
decrease in oil price on food price shows that demand and supply forces is
influential in shaping Malaysia’s food price. Hence, the author recommends policies
that will contain the effect of supply and demand in the food supply chain. And
such policies include anti-competition act and profiteering regulation policy to
hedge against food price volatility in Malaysia. In contrast, Reboredo (2012) used
weekly data ranging from January 1998 to April 2011 to analyse the relationship
between oil price and prices of grain and wheat in China. The agricultural prices
are expressed in US dollar per ton. The empirical result suggested that oil price

89
spike had no causal effect on changes in agricultural price rather the monetary
policy associated with exchange rate dynamics. Implying that spikes in agricultural
prices is not directly a function of oil price change but exchange rate dynamics.
Hence, policy designed to mitigate risk management and hedging strategies is
suggested by the author. This view was supported by Nazlioglu and Soytas (2011)
and Lambert and Milijkovic (2010).
Nazlioglu and Soytas (2011) documented that individual agricultural price are
react naturally to oil price changes in Turkey. They used monthly data covering
from January 1994 to March 2010 with oil price and lira dollar exchange rate in
their analysis. The reaction of agricultural price to oil price is attributed to the use
of explicit inflation targeting and a balancing policy in the exchange rate. The
implication is that monetary policy plays a significant role in determining oil price-
agricultural price relationship in Turkey. Hence, the policy implication is that
balancing real agricultural price dynamics may require an appropriate policy
response.
With global computable general equilibrium model, Gohin and Chantret (2010)
examined the long run relationship between global oil price and global food prices
with the inclusion of macroeconomic linkages. A positive relationship was found
between global oil price and global food price due to the cost-push effect. Meaning
that the omission of these macroeconomic linkages has substantial bearing on the
relationship between oil price and food price. The policy implication is that the
consequences of macroeconomic linkages must be properly considered in
determining oil price-food price relationship. Adopting time series prices on fuels
and agricultural commodities, Zhang et al. (2010) investigated the long-run co-
integration relationship between oil price and agricultural commodity prices. They
documented no direct long run relationships between oil price and agricultural

90
commodity prices. Their argument is that competitive markets efficiently respond
to price signals. Meaning that agricultural prices is a function of both crop yield
and demand and supply response to shift in relative agricultural products. They
suggested an agricultural commodity buffer policies designed to blunt price spikes
caused by demand and supply.
Furthermore, Chen et al. (2010) estimated the relationship between global oil
price and the global grain prices of soybean, wheat, and corn. The empirical
outcome indicates that changes in global oil price significantly predicted the
variations in each grain price during the period covering from the 3rd week in
2005 to the 20th week in 2008. This implies that price of grain commodities is
competing with the resulting demand from biofuels. Given that corn and soybean
are used to produce biodiesel or ethanol during the period of increased crude oil
price, as orthodox agricultural production systems in developed countries depend
hugely on fossil energy (Cruse et al. 2010). This evidenced volatility spillover
among oil price, wheat, and corn markets. This could be essentially explained by
increased linkage between oil price and corn and wheat markets stimulated by
ethanol production. The authors suggested that governments should pursue policy
that will consider dropping subsidy that gave rise to increased bio-fuel industries
which may have contributed to increase in food price.
Abdel and Arshad (2008) confirmed the existence of long run causality running
from petroleum to prices of palm rapeseed, sunflower and soyabean using Engle-
Granger two-stage estimation method with monthly data covering from January
1983 to March 2008. This implies that oil price is a factor growing in significance
in vegetable oil production as the demand for biodiesel has increased. They
suggested incorporating oil price in determining the structural behaviour of
91
vegetable oil. The authors suggested that government should pursue policy that
will shield vegetable oil from oil price shocks.
Obadi and Korček (2014) used VECM to analyse the Granger-causality between oil
price and food price in Malaysia using monthly data covering from January 1975
to September 2013. The result confirmed the existence of long run and short run
relationship between oil price and food price. Causality run from oil price to food
price in the long run while the short run causality shows bidirectional causality
between the variable of food price and oil price. They suggest that policymakers
should account for this relationship in formulating policies relating to oil price and
food price in Malaysia.
Adopting time series econometric technique, Gogoi (2014) examined the long run
relationship between oil price and global food commodity prices such as rice,
wheat, maize, and soybean for the period covering from 1980 to 2011. The
outcome of co-integration estimation showed the existence of long run relationship
between oil prices and the prices of soybean, wheat, and maize, except for rice
prices. His Granger causality test further confirm unidirectional causality with only
oil prices Granger causing each of the four food commodity prices. This implies
that oil price is a significant factor in determining the food prices. Policymakers
should consider policy that will shield food price from oil price shocks.
Using scenario analysis, Tokgoz (2009) evidenced that the effect of oil price on
the European Union agricultural sector is rising with the development of the bio-
fuels sector This shows the significance of trade policy in reacting to increase oil
price and grain prices. They suggested that policy that consider the linkage
between oil price and agriculture should be considered to hedge the vulnerability
of agricultural products from oil price shocks.
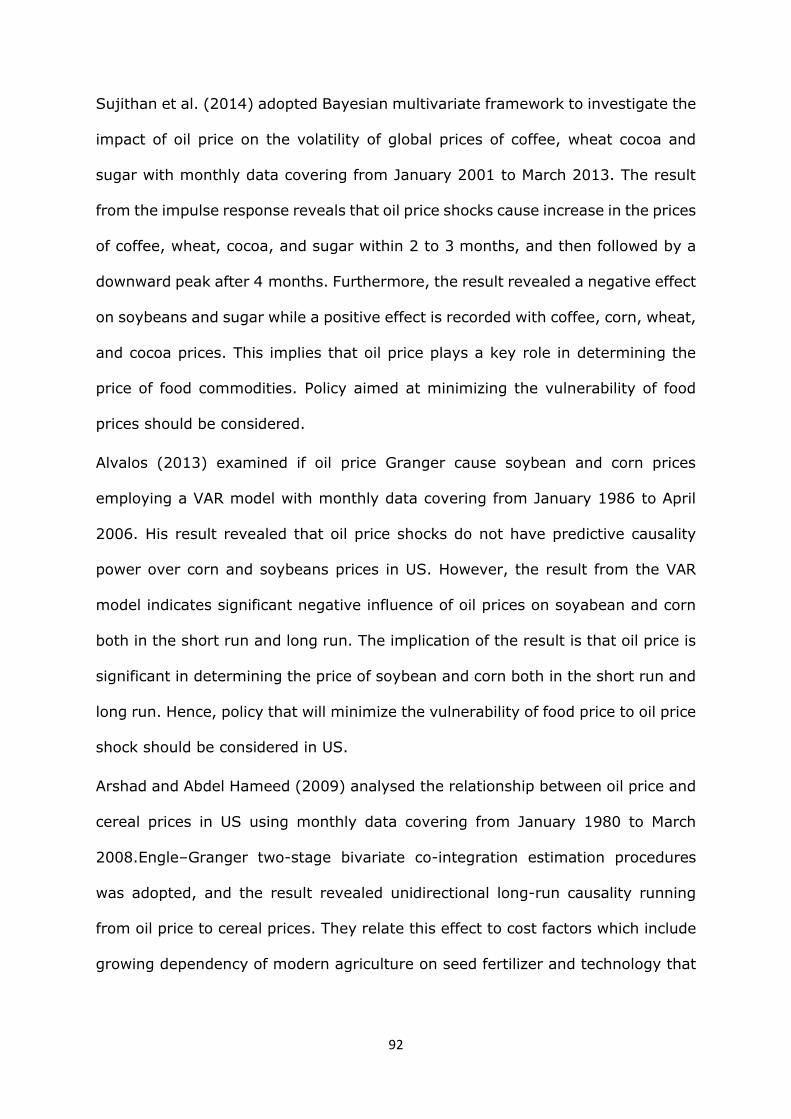
92
Sujithan et al. (2014) adopted Bayesian multivariate framework to investigate the
impact of oil price on the volatility of global prices of coffee, wheat cocoa and
sugar with monthly data covering from January 2001 to March 2013. The result
from the impulse response reveals that oil price shocks cause increase in the prices
of coffee, wheat, cocoa, and sugar within 2 to 3 months, and then followed by a
downward peak after 4 months. Furthermore, the result revealed a negative effect
on soybeans and sugar while a positive effect is recorded with coffee, corn, wheat,
and cocoa prices. This implies that oil price plays a key role in determining the
price of food commodities. Policy aimed at minimizing the vulnerability of food
prices should be considered.
Alvalos (2013) examined if oil price Granger cause soybean and corn prices
employing a VAR model with monthly data covering from January 1986 to April
2006. His result revealed that oil price shocks do not have predictive causality
power over corn and soybeans prices in US. However, the result from the VAR
model indicates significant negative influence of oil prices on soyabean and corn
both in the short run and long run. The implication of the result is that oil price is
significant in determining the price of soybean and corn both in the short run and
long run. Hence, policy that will minimize the vulnerability of food price to oil price
shock should be considered in US.
Arshad and Abdel Hameed (2009) analysed the relationship between oil price and
cereal prices in US using monthly data covering from January 1980 to March
2008.Engle–Granger two-stage bivariate co-integration estimation procedures
was adopted, and the result revealed unidirectional long-run causality running
from oil price to cereal prices. They relate this effect to cost factors which include
growing dependency of modern agriculture on seed fertilizer and technology that
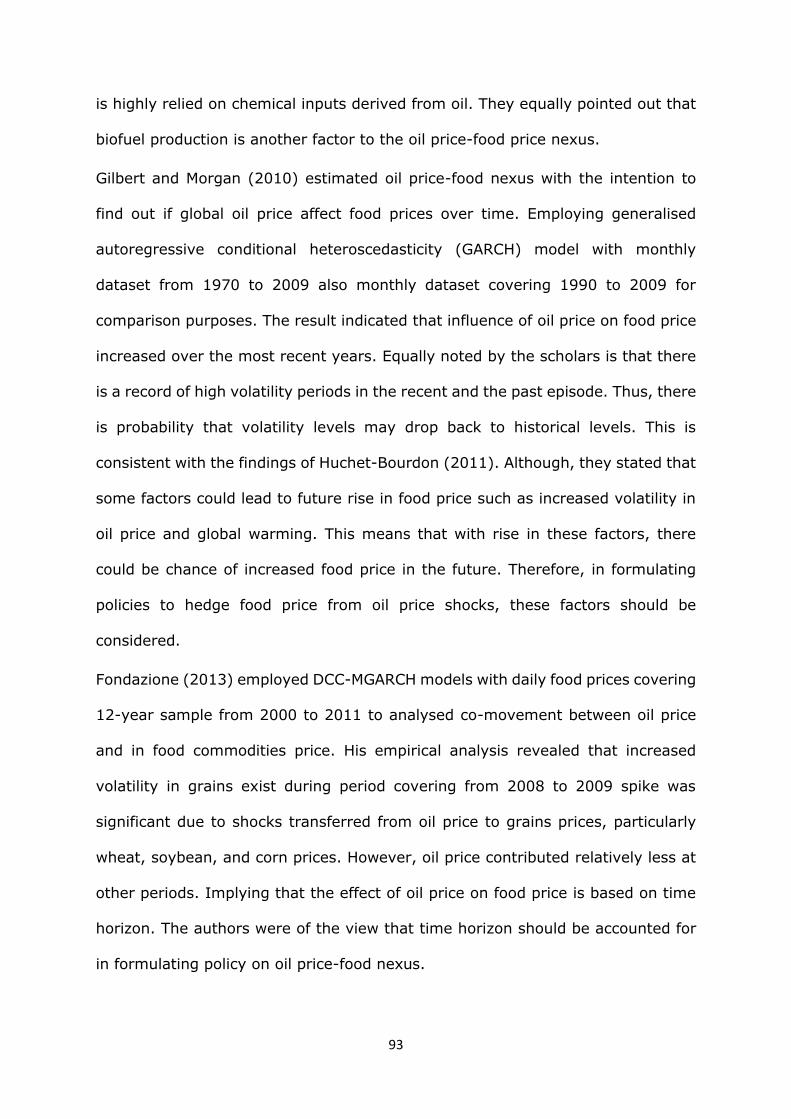
93
is highly relied on chemical inputs derived from oil. They equally pointed out that
biofuel production is another factor to the oil price-food price nexus.
Gilbert and Morgan (2010) estimated oil price-food nexus with the intention to
find out if global oil price affect food prices over time. Employing generalised
autoregressive conditional heteroscedasticity (GARCH) model with monthly
dataset from 1970 to 2009 also monthly dataset covering 1990 to 2009 for
comparison purposes. The result indicated that influence of oil price on food price
increased over the most recent years. Equally noted by the scholars is that there
is a record of high volatility periods in the recent and the past episode. Thus, there
is probability that volatility levels may drop back to historical levels. This is
consistent with the findings of Huchet-Bourdon (2011). Although, they stated that
some factors could lead to future rise in food price such as increased volatility in
oil price and global warming. This means that with rise in these factors, there
could be chance of increased food price in the future. Therefore, in formulating
policies to hedge food price from oil price shocks, these factors should be
considered.
Fondazione (2013) employed DCC-MGARCH models with daily food prices covering
12-year sample from 2000 to 2011 to analysed co-movement between oil price
and in food commodities price. His empirical analysis revealed that increased
volatility in grains exist during period covering from 2008 to 2009 spike was
significant due to shocks transferred from oil price to grains prices, particularly
wheat, soybean, and corn prices. However, oil price contributed relatively less at
other periods. Implying that the effect of oil price on food price is based on time
horizon. The authors were of the view that time horizon should be accounted for
in formulating policy on oil price-food nexus.
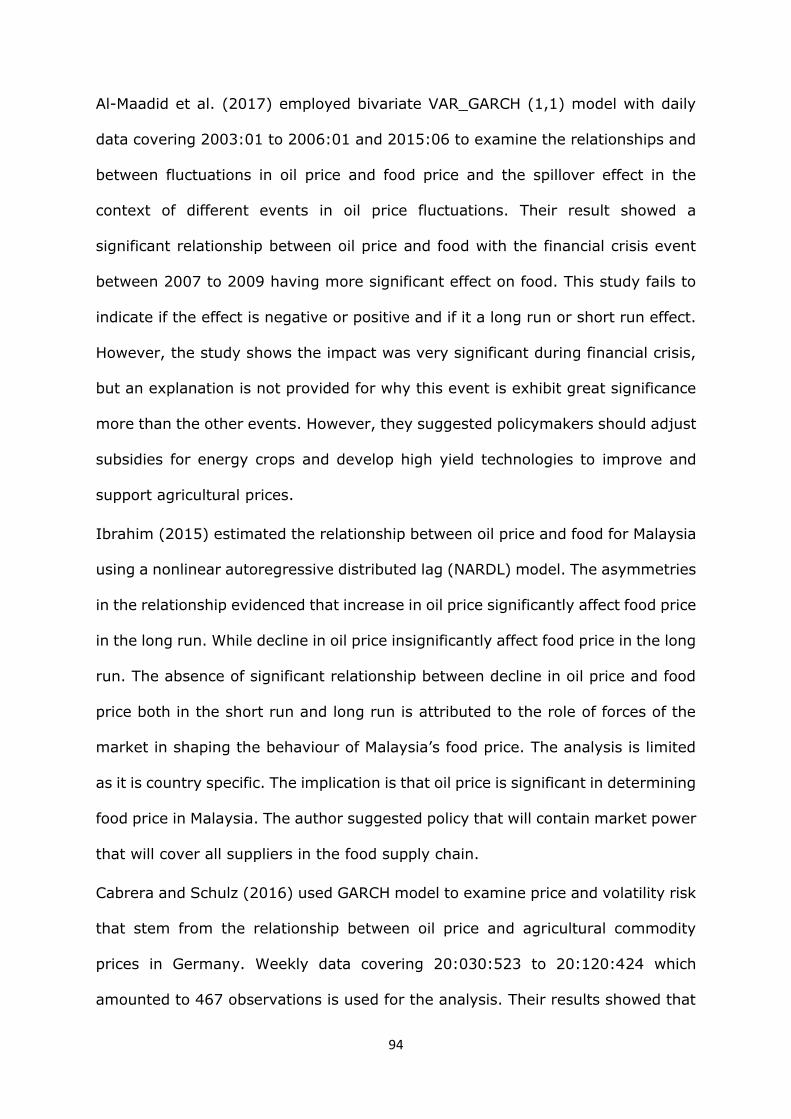
94
Al-Maadid et al. (2017) employed bivariate VAR_GARCH (1,1) model with daily
data covering 2003:01 to 2006:01 and 2015:06 to examine the relationships and
between fluctuations in oil price and food price and the spillover effect in the
context of different events in oil price fluctuations. Their result showed a
significant relationship between oil price and food with the financial crisis event
between 2007 to 2009 having more significant effect on food. This study fails to
indicate if the effect is negative or positive and if it a long run or short run effect.
However, the study shows the impact was very significant during financial crisis,
but an explanation is not provided for why this event is exhibit great significance
more than the other events. However, they suggested policymakers should adjust
subsidies for energy crops and develop high yield technologies to improve and
support agricultural prices.
Ibrahim (2015) estimated the relationship between oil price and food for Malaysia
using a nonlinear autoregressive distributed lag (NARDL) model. The asymmetries
in the relationship evidenced that increase in oil price significantly affect food price
in the long run. While decline in oil price insignificantly affect food price in the long
run. The absence of significant relationship between decline in oil price and food
price both in the short run and long run is attributed to the role of forces of the
market in shaping the behaviour of Malaysia’s food price. The analysis is limited
as it is country specific. The implication is that oil price is significant in determining
food price in Malaysia. The author suggested policy that will contain market power
that will cover all suppliers in the food supply chain.
Cabrera and Schulz (2016) used GARCH model to examine price and volatility risk
that stem from the relationship between oil price and agricultural commodity
prices in Germany. Weekly data covering 20:030:523 to 20:120:424 which
amounted to 467 observations is used for the analysis. Their results showed that
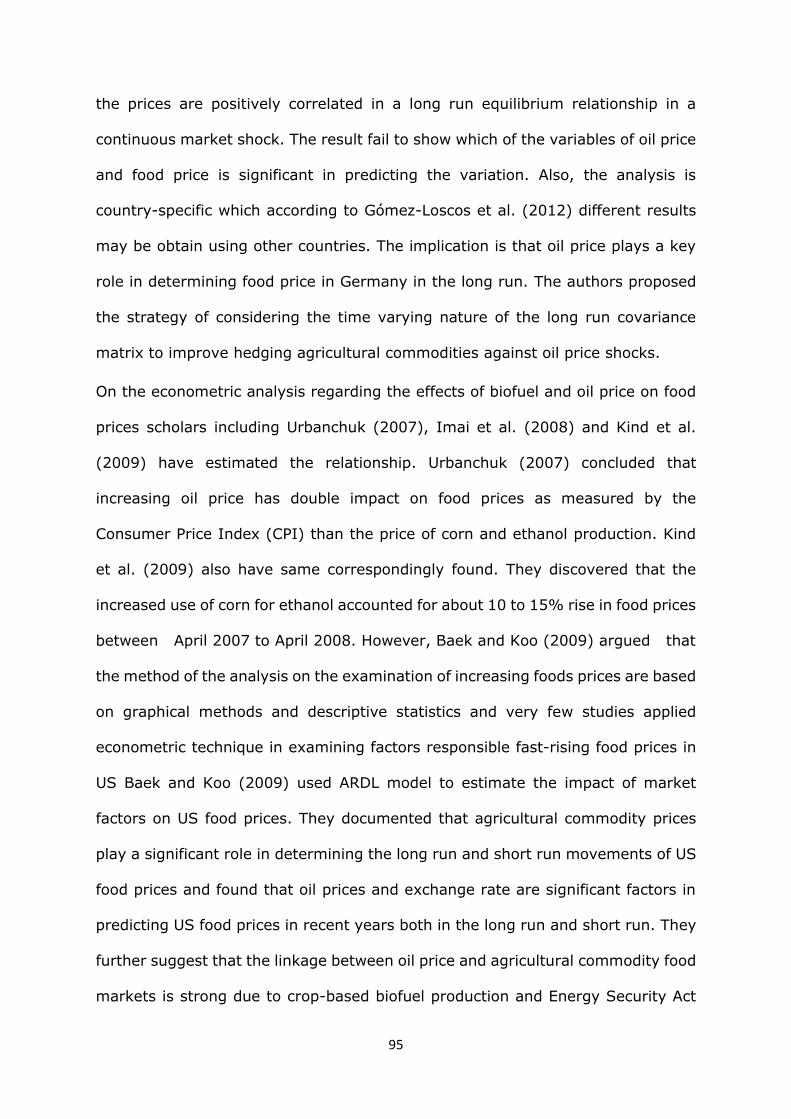
95
the prices are positively correlated in a long run equilibrium relationship in a
continuous market shock. The result fail to show which of the variables of oil price
and food price is significant in predicting the variation. Also, the analysis is
country-specific which according to Gómez-Loscos et al. (2012) different results
may be obtain using other countries. The implication is that oil price plays a key
role in determining food price in Germany in the long run. The authors proposed
the strategy of considering the time varying nature of the long run covariance
matrix to improve hedging agricultural commodities against oil price shocks.
On the econometric analysis regarding the effects of biofuel and oil price on food
prices scholars including Urbanchuk (2007), Imai et al. (2008) and Kind et al.
(2009) have estimated the relationship. Urbanchuk (2007) concluded that
increasing oil price has double impact on food prices as measured by the
Consumer Price Index (CPI) than the price of corn and ethanol production. Kind
et al. (2009) also have same correspondingly found. They discovered that the
increased use of corn for ethanol accounted for about 10 to 15% rise in food prices
between April 2007 to April 2008. However, Baek and Koo (2009) argued that
the method of the analysis on the examination of increasing foods prices are based
on graphical methods and descriptive statistics and very few studies applied
econometric technique in examining factors responsible fast-rising food prices in
US Baek and Koo (2009) used ARDL model to estimate the impact of market
factors on US food prices. They documented that agricultural commodity prices
play a significant role in determining the long run and short run movements of US
food prices and found that oil prices and exchange rate are significant factors in
predicting US food prices in recent years both in the long run and short run. They
further suggest that the linkage between oil price and agricultural commodity food
markets is strong due to crop-based biofuel production and Energy Security Act
96
of 2005 and the Energy Independence of Security Act 2007. The authors
suggested the review of continuous production of biofuel under the above-
mentioned legislations to enable reduction of agricultural commodity and food
prices in US.
Trujillo-Barrera et al. (2011) analysed volatility spillovers in the US from oil price
to agricultural markets covering the period from 2006 to 2011. They concluded
significant spill-overs effect from oil price to ethanol and corn markets. The effect
seems to be significantly evidenced in high volatility periods for oil price markets.
Equally identified by them is significant volatility spillovers from corn to ethanol
markets. From a policy perspective, the report from 2011 G20 Study Group on
commodities identified two channels linking oil price and food prices. These
channels include the growing energy intensity of food production. Implying that
energy is a primary input and a cost component in food production and distribution
(Avalos 2014). The next channel is biofuel production, which substantially
contributes to the increase demand for specific commodities (Arshad and Abdel
Hameed 2009). Hence, policy that account for this relationship should be
considered.
With structural VAR model, Wang et al. (2014) examined the effect of changes in
oil price on agricultural commodity markets. Data from period covering January
1980 to December 2012 with variables of oil price and agricultural commodities
deflated with consumer price index (CPI) of US are used for the analysis. The key
findings showed that the agricultural commodity prices responses to changes in
oil price is a function of oil demand shocks or supply shocks. The analysis did not
reveal if the relationship is a long run or short run and as well if the impact is
negative or positive. The implication is that oil price plays a key role in determining
changes in food price US. Hence, policymakers should unravel if high agricultural
97
commodity prices are driven by global economic activity or other oil market-
specific factor.
Huchet-Bourdon (2011) statistically estimated the historical food commodity price
volatility over the last half century using extended range of agricultural
commodities such as maize butter, soyabean, oil, beef, rice, sugar, whole milk oil
and wheat. He also estimated the relationship between oil price and each of the
mentioned agricultural commodities and fertilizer price employing Spearman’s
correlation coefficient with monthly data. The result show that causal effect exists
between oil price and fertilizer price and between oil price and each agricultural
commodity price. His finding reveals that there may not be tendency of
commodities price volatility increase over the past 50 years for each of the
agricultural product price. However, in general, price volatility in the period
covering from 2006 to 2010 recorded higher increase than that in the 1990s,
however, not higher than that in the 1970s. Implying that oil price is not very
significant in determining food commodities price in the future. The author
suggested policymakers pursuing policy that will minimize agricultural price
volatility by looking at the linkage between oil price and biofuel production and
fertilizer prices.
Few studies examined the relationship between oil prices and food price in
developing countries. For example, Minot (2011) estimated food price volatility in
Africa with the aim of verifying the oil price-food price nexus in Africa. Adopting
F-statistics, he estimated the changes in food price volatility using structural
breaks of period covering between 1980 to 2006 and 2007 to 2010. His analysis
showed that food price volatility in the global market has risen in the past five
years, however, relatively low. The result revealed that in a group of 11 African
98
countries, food price shock is high and has not risen in recent years. Implying that
oil price is not a determining factor in food price volatility in African countries.
Nwoko et al. (2016) focused on Nigeria economy using Generalized Autoregressive
Conditional Heteroskedasticity (GARCH (1, 1)) and VAR models to model long run
and short run oil price- food price nexus. They found a significant positive short
run relationship between oil price and food price. The study recommended
improved market information, trade policies and investment in research and
development as an intervention and strategy to hedge food price from oil price
volatility. Equally recommended by the study is a policy that will enhance
subsidising of refined crude oil price, alternative sources of energy and less
dependence on oil for fertilizer production.
Oluwaseyi (2018) applied GARCH (1,1)-TY to model the influence of oil price on
aggregate price of food (APF) and urban average price of food (APFR) during the
pre-crisis and post-crisis periods in Nigeria. He concluded that both aggregate
price of food (APF) and urban average price of food (APFR) responded positively
to oil price shocks with urban average price of food (APFR) responding more to il
price shocks in the post-crisis periods and full sample period. The study
recommended that government should formulate policies that hedge food price
from oil price shocks. This study complements these studies by empirically
modelling how changes in oil price affect food supply alongside other variables
including GDP, interest, inflation, exchange rate, unemployment rate, external
debt, current account, and foreign reserves in the context of net oil exporting and
importing countries in Africa using panel ARDL model. The adoption of panel ARDL
model is to account for the asymmetries associated with oil price by separating
changes in oil price into positive and negative long run and short run effects.
99
3.7 Literature Review on the Relationship Between Oil Price and
External Debt
In African countries, the study on the effect of oil price changes on external debt
is not as well explored as the evidence found in developed countries. The
mismanagement of public funds through corrupt practices and inadequate public
investment processes has caused the windfall generated from excess crude oil to
be mismanaged with consequences on economic growth (Didia and Ayokunke
2020). Studies, including Chimezie et al. (2020), Al-Tamimi and Jaradat (2019),
Senadza et al. (2017) and Udeh et al. (2016) argue that external debts are
destructive to economic growth, especially when it has adverse terms of trade
effect. Ajayi and Oke (2012) argued that external debt not only cause bad
management but also validates exchange rate devaluation, creating cost for debt
service obligations, budget deficit, money supply effect and inflation. Studies
confirmed that countries that depend mainly on oil export for foreign earnings
seem to suffer from remarkably high level of corruption, authoritarian
government, poverty, government ineffectiveness and geopolitical instability
(Kretzmann and Nooruddin 2005), despite the huge revenues generated from oil.
However, external debt can be useful in stimulating economic growth, particularly
when it is carefully used and managed within the corridors of crucial economic
activities (see Didia and Ayokunke 2020; Sohn 1987). For example, Didia and
Ayokunke (2020) used vector Error Correction (VECM) model with dataset
covering 1980 to 2016 to analyse the effect of external debt and domestic debt in
Nigeria. They found that domestic debt has a positive feedback effect on economic
growth while external debt has a negative feedback effect on economic growth.
The implication of the finding is that as price of oil increase, Nigeria spends more
money, hence, Nigeria will increase external borrowing with hope to get more
100
revenue from oil price increase. The increase in external borrowing may increase
debt overhanging, increase in interest rate and debt servicing causing reduction
in current account, foreign reserves and ultimately decline in economic growth.
On the other the positive significant relationship between domestic debt and
economic growth is a function of the loan and interest paid remained in the
country. The authors recommended that Nigerian government should provide
policies that will enhance investment of external debt into infrastructures that are
of economic yielding value that will enhance the servicing and payment of the loan
and interest associated with the loan on time.
Kretzmann and Nooruddin (2005) showed how the first OPEC oil shock of 1973 to
1974 affected global economic growth negatively. They opined that increase in oil
prices at the end of 1973 to early 1974 was considered a double-edged sword as
countries with enough oil reserves were expected to benefit significantly by the
increase in export revenues while countries that do not have oil reserves and net
oil importing countries were burdened with unbearably large energy bills and
external debt. On the other hand, William (1984) argued that increase in oil prices
from 1973 to 1974 caused serious economic harm to net oil importing countries
as it is most significant exogenous cause of the debt burden of developing net
importing countries and even that of 1979 to 1980s. William (1984) further
projected that net oil importing developing countries lost $141 billion in high
interest payments, high import costs and low export receipts. All these resulted
from 1973 to 1974 oil shocks. Focusing on Latin America, Robert (1985) analysed
oil price and external debt cycle. He argued that due to increase in oil price,
external revenues of net oil exporters increased causing their foreign reserves to
increase. Due to increase in foreign reserves of net oil exporters international
banks such as IMF and World Bank had more money on hand to lend to developing

101
countries who are willing to borrow. Another thing that encouraged international
banks to lend money specially to developing net oil exporting countries is their
potential creditworthiness especially the net oil exporters. These are the common
factors that explain the increase in external loans in both net oil importing and net
oil exporting countries (see Kretzmann and Nooruddin 2005). In line with this
finding, Cline (1984) argued that an increase in oil price validates the increase in
Mexico’s external debt as Mexico borrowed heavily to develop oil production in
1970s.
Net oil exporting countries who had a windfall from oil price increases did not
escape debt crisis as Dutch disease hypothesis set in (Olomola and Adejumo 2006;
Abeysnghe (2001). Net oil exporting countries especially African countries directed
their revenues to increase the imports of manufactured goods. The rise in oil
prices, however, validated the simultaneous increase in the price of manufactured
imported goods from the developed countries. Thus, the import bills of
manufactured goods for developing countries also increased swiftly (Dizaji 2014),
leading to an increase in external debt.
Kretzmann and Nooruddin (2005) examined debt burdens with data covering 1970
to 2000 and found that an increase in oil price caused economic volatility in net
oil exporting countries such as Nigeria, Ecuador and Congo-Brezzaville. This
validates macroeconomic shocks that undermines government revenues. The
explanation for the macroeconomic shock is related to the nature and magnitude
of government spending. Government that spends more are likely to incur debts
to cover their budget. Furthermore, not only those countries that depend mainly
on crude oil for energy need are more likely to be affected by oil price shock but
also developing countries that their economy is exposed to the flukes of
international trade might be expected to have an increased debt burdens given an
102
increased volatility of income and probably trade deficits (Cline 1984; Didia and
Ayokunke 2020). Udeh et al. (2016) used Ordinary Least Square and diagnostic
tests to suggest that external debt has long run negative effect on economic
development in net oil exporting country such as Nigeria. There are few studies
researching oil price and external debt nexus in net oil exporting and net oil
importing countries in Africa. As such this study in complementing previous
studies, focuses on net oil exporting and net importing countries in Africa to
analyse the impact of oil price shocks on external debt alongside other
macroeconomic variables such as GDP, interest rate, inflation, exchange rate,
unemployment rate, food supply, current account, and foreign reserves using
panel ARDL model. Panel ARDL model is adopted in this study to analyse the
asymmetries associated with oil price and external debt relationship both in the
long run and in the short run. The finding will help policymakers and formulate
long run and short run policies that will shield external debt from oil price shocks.
Equally, from the finding investors will be able to make short run and long run
investment decisions.
3.8 Literature Review on the Relationship Between Oil Price and Current
Accounts Balance
Previous studies provide insights on current account dynamics using the Dutch
disease hypothesis (see Chen and Rogoff 2003; Cashin et al., 2004). Chen and
Rogoff (2003) focused on OECD countries including Australia, New Zealand, and
Canada where their main commodities (oil) represent a substantial share of their
exports. The results showed that the US. dollar price of New Zealand and Australia
commodity (oil) exports are significant and stable in influencing their floating real
exchange rate thereby affecting their current account balance. Although, after
103
controlling for commodity (oil) price shocks, the purchasing power parity remind
a puzzle in the residual. This result is relevant to developing oil exporting countries
given that their capital market is liberalized towards floating exchange rates. The
authors are of the view that understanding the responses of exchange rate
towards changes in commodity (oil) and towards current account dynamics can
provide significant information for diverse range of policy issues including inflation
control and the conduct of monetary policy.
Turan et al. (2020) used ARDL model to examine the relationship between oil price
and current account balance in Poland, Czechia, and Hungary with quarterly data
covering 1996𝑞1 to 2018𝑞1 for Hungary, data from 2004𝑞1 to 2017𝑞2 for Poland
and data from 1995𝑞1 to 2017𝑞4 for Czechia. The result show that changes in oil
price has significant effect on the current account balance in Poland and Czechia.
Equally reported is a causal relationship running from oil price to current account
balances in all countries in the sample in the short run. The authors emphasized
the significance of incorporating long and short run effect in the analysis. They
recommended that policies that will encourage alternative and renewable energy
sources, domestic savings and policies that will weaken negative link between oil
price and current account balance, especially in Poland.
Longe et al. (2018) analysed oil price-current accounts nexus in Nigeria using
ARDL model with annual data covering from 1977 to 2015. The result reviewed
that the long run effect of oil price changes on current account negatively and
significantly while the short run effect is positive and insignificant. Implying that
as oil price changes increases current accounts in the short run, it decreases in
the long run. The policy implication is that policymakers should consider the long
run and short run effect of oil price on current accounts in Nigeria while formulating
policy that will shield current accounts from oil price shocks in Nigeria.
104
Qurat-ul-Ain and Tufail (2013) used Vector Autoregression (VAR) model to
evidence the effect of oil price on current account balance and exchange rate on
D-8 countries including Nigeria, Iran, Egypt, Pakistan, Turkey, Bangladesh,
Malaysia, Indonesia with annual data covering 1981 to 2011. The result showed
that increase in oil price improve the current account balance of all net oil
importing countries which is Pakistan, Turkey, and Bangladesh in the short run
and deteriorates in the long run expect Bangladesh. This causes depreciation of
exchange rate for Pakistan, Indonesia, and Turkey while exchange rate
appreciates in Bangladesh in the short run. Whereas all oil exporting countries
experience deterioration of current account in response to oil price shock both in
the long run and short expect Malaysia whose current account increases in the
long run. The recommendations drawn from this study include diversification of
export base from oil to non-oil export to reduce their dependency on oil especially
the oil exporting countries. Also, it recommended that oil importing countries to
develop alternative energy resource to lower its reliance oil resources.
Le and Chang (2013) examined if the variability of trade balances and their oil and
non-oil components is correlated with fluctuations in oil price in net oil exporting
and net oil importing countries of Asia using Toda and Yamamoto approach. The
findings revealed a positive feedback effect from oil price to trade balances of oil
and non-oil components in Malaysia. While the result in Singapore showed that
trade balances of oil and non-oil components responded negatively to changes in
oil price both in the short run and the long run. In Japan, the trade balance of oil
component responded negatively to changes in oil price while the trade balance
of non-oil component responded positively to fluctuations in oil price but cancelled
within 4 months as result of continued increase in oil price. The implication of this
finding that trade is a significant channel through which oil price shocks affect
105
macroeconomic variables and hence, should not be ignored by both policy makers
and in economic modelling. And in modelling this, it significant to distinguished
between net oil exporting from net oil importing countries and the causes of the
shocks, whether driven by supply shocks or demand shocks.
Hou et al (2015) conducted a cross country analysis in the context of net oil
exporting and net oil importing countries in the sub-Saharan Africa over the period
between 2008 and 2015. The result indicates that following 2014 – 2015 oil price
decreases, the African oil exporters experienced the reduction in export revenues
by $63 billion. Particularly, Nigerian exports fell by 14% in half quarter of 2014
deteriorating the current account that cause government expenditure to drop by
8%. the study showed that Tanzania imports of oil reduced by 20% in the first
quarter of 2015 validating an improvement in the current account. Thus, an
increase of about 1-2% point in real disposable as income is transferred from net
oil exporting to net oil importing countries in form of less import payment.
However, the criticism about this study is that it is not empirically analysed.
Gnimassoun et al. (2017) employed time-varying parameter vector
autoregressive (TVP-VAR) model with sign restriction to analyse the relationship
between oil prices and current account in Canada, a net oil exporting country.
Using oil demand and supply shocks framework, the result showed that oil supply
shock has a statistically insignificant effect on current account. While oil demand
shock is found to have a positive long run significant effect on current account
balance. The significant effect of oil demand shock on current account is found to
be a function of propensity to spend oil revenue on imports. Implying that
spending oil revenues on imports have a significant negative effect on current
account balance. Hence, the authors recommended providing policies that will
106
encourage increasing the degree of domestic financial market development and
management of foreign exchange reserves.
Existing literature suggests that the fluctuations in oil prices can trigger a current
account imbalance both in net oil exporting and net oil importing countries.
Besides, the imbalance follows a trend that reflect the cause of the fluctuations in
oil price. This shows that the pass-through of fluctuations in oil price to the current
account is keyed into supply and demand factors (see Stefanski, 2014; Jibril et
al.2020). The pass-through is incomplete without additional adjustment structures
to lessen the impact of the oil price shocks on the current account balance (see
Kilian et al.2009; Gnimassoun et al.2017). According to Gnimassoun et al. (2017)
the adjustment process depends on internal and external factors. For the external
factors, the source and strength of fluctuations in oil price are the most significant
factors to consider with respect to oil price-current account dynamics given that
not all oil price shocks are alike (see Rebucci and Spatafora 2006; Gnimassoun et
al. 2017). The internal factor includes the tendency to spend the extra oil revenues
on imports, the degree of openness, the ability to regulate exchange rate reserves,
the degree of international financial market integration and economic policy
(Gnimassoun et al. 2017). And these factors can detect the dynamics of oil price-
current account balance nexus.
Some of the reviewed literatures have shown the asymmetries in the effects of
changes in oil price that are specific to oil supply and aggregate demand shocks,
while recounting the theoretical channels through which oil price dynamics affect
current account balance via terms of trade. This study intends to complete the
existing literature by adopting panel ARDL model to analyse this relationship in
the context of net oil exporting and net oil importing countries in Africa. Panel
107
ARDL is adopted to separate the dynamics of changes in oil price into positive and
negative long run and short run effects using data covering 1996𝑞1 to 2016𝑞4.
3.9 Literature Review on The Relationship Between Oil Price and Foreign
Reserves
Natural resources including crude oil has been a sources of foreign revenue
generation especially for net oil exporting countries, hence, a means through
which economic growth is promoted (Van der Ploeg and Venables 2011). However,
most net oil exporting economies in Africa have failed to use these resources
generated from crude oil to promote economic growth and development and as
such, failed to save sufficiently and make investments that yield high returns to
support diversification of their economies (Van der Ploeg and Venables 2011;
Onigbinde et al.2014).
Numerous studies especially from developed countries of Europe and Asia on oil
price-foreign reserves nexus emanating from the cross-country analysis are
available in literature (Sachs and Warner 1995; Boschini et al.2007; van der Ploeg
and Poelhekke 2009). For example, Sachs and Warner (1995) found that after
controlling for initial investments in physical and human capital, income per capita,
rule of law and trade openness, oil price dependence (measured by the ratio of
crude oil export to GDP) is negative and statistically significant in predicting GDP
growth per capita, hence, a reduction in foreign reserves. Re-estimating with
institutional quality instead of rule of law established the presence of oil price in
predicting foreign reserves. These outcomes indicate that, ceteris paribus, a rise
in the ratio of crude oil exports to GDP of 10% point reduces average GDP growth
per capita by 0.77% to 1.1% yearly, thus, foreign reserve is depressed. The
108
authors recommended policy aimed at hedging foreign reserves from oil price
fluctuations.
Shaibu and Izedonmi (2020) used ARDL model with dataset covering from 1986
to 2018 to show that shocks in oil price is insignificant in predicting foreign
reserves dynamics in Nigeria. The authors recommended that policies directed at
improving and managing foreign reserves to avoid linkage of resources should be
adopted. Furthermore, the authors recommended embracing policies aimed at
adopting exchange regime that will enable build the economy and ensure
accumulation of more reserves to smoothen out exchange rate volatility.
Olowofeso et al. (2020) analysed the relationship between foreign reserves and
oil price, GDP, exchange rate, investment, consumer price index and interest rate
using ARDL model with quarterly data covering 2000 to 2018 in Nigeria. They
conclude that investment, consumer price index, trade openness, exchange rate
and interest rate have positive long run predictive power over foreign reserves.
While oil price has short run effect on foreign reserves. The authors suggest that
monetary authorities and policymakers should put forward policies that will hedge
foreign reserves from volatility of oil price and exchange rate both in the short run
and in the long run.
Kaka and Ado (2020) investigated the influence of indirect tax, total debt, direct
tax, and oil price on foreign reserves using Ordinary Least Square method with
dataset covering 1980 to 2019 in Nigeria. The outcome shows that indirect tax
and direct tax have insignificant influence on foreign reserves. Whereas oil price
and total debt are significant in influencing foreign reserves. The finding shows
that Nigerian government has not utilized the advantage of her taxation to
generated revenue. The authors recommended that policy aimed at diversifying
Nigeria economy should be created. And such policies include creating small scale
109
and medium industries, development, and extraction of non -oil mineral resources
for export to boost her foreign reserves.
From the analysed literature it has been shown that oil demand and supply shocks
have separate effect on foreign reserves, however literature has disregarded the
possible asymmetries associated with these effects, especially in Africa. However,
studies that analysed these asymmetries in oil prices and foreign reserves nexus
did not differentiate between oil demand and supply shocks. This study bridges
this gap in the literature by analysing the asymmetries associated with the positive
and the negative oil price changes and its effect on foreign reserves in terms of
demand and supply shocks in long run and short run in the context of net oil
exporting and net oil importing countries.
3.10 Summary of the Findings on the Reviewed Literature
This chapter reviewed the literature on the relationship between oil price and
macroeconomic variables. The review literature showed mixed findings on the
relationship between changes in oil prices and key macroeconomic variables (see
Van der Ploeg and Venables 2011; Kaka and Ado 2020;).
Al- Abri (2013) showed no clear demarcation between the short run and long run
effects of changes in oil price on macroeconomic variables. Jiménez-Rodríguez and
Sánchez (2009) fail to differentiate between the net oil exporters and net oil
importers and the data used covered only the earlier period, hence, unable to
provide any information on the current effects of oil price shocks on
macroeconomic variables. Similarly, Ghosh et al. (2009) analyse the effect of
changes in oil price on macroeconomic variables prior to 2008 and it does not
cover the long run effects. Some of the other studies including Jiménez-Rodríguez
and Sánchez (2012) are estimated within the context of developed countries and

110
thus, same conclusions cannot be drawn for developing countries of Africa.
Furthermore, recent studies on African economies are not updated to include most
recent oil price shocks e.g., financial crisis between 2007 and 2009 and plunge in
oil price between 2014 and 2016 and those that included it such as Kaka and Ado
(2020) and Olowofeso et al. (2020) are mainly country specific. Thus, this study
will contribute to the existing literature by jointly modelling short run and long run
asymmetries between oil price and GDP, interest rate, inflation, exchange rate,
unemployment rate, food supply, external debt, current account, and foreign
reserves in the context of net oil exporting and net oil importing countries in Africa.
Utilizing panel ARDL model, this study tends to fill this gap.
111
Chapter Four
Asymmetries in Oil price, Transmission Channel and Related Theories
4.0 Introduction
Previous chapter reviewed the literature on the asymmetric relationship between
oil price and key macroeconomic variables. Various transmission channels and
theories were identified in previous literature through which asymmetries in oil
prices relate with macroeconomic variables (Brown and Yucel 2002; Doğrul and
Soytas 2010; Bouchaour and Al-Zeaud 2012; Oluwaseyi 2018; Kocaarslan et
al.2020). This chapter review studies in literature to understand the channels and
related theories aim at analyzing the asymmetric relationship between oil price
and macroeconomic variables in the context of net oil exporting (Nigeria, Algeria,
and Egypt) and net oil importing (Kenya, and South Africa) countries in Africa.
This chapter is divided into sections. Section 4.1 provides an insight on the
asymmetric relationship between oil price and macroeconomic variables. Section
4.2 describes the channels through which changes in oil price is transmitted into
macroeconomic variables and relate them in terms of relevance to the study.
Section 4.3 presents four theories deemed suitable for their theoretical
underpinning for the study and this include theory of investment under
uncertainty, the theory of reallocation effect, the theory of business cycles and
the income shift theory. Section 4.4 put forward summary of this chapter.
4.1 The Asymmetries in Oil Price
Various scholars have evidenced the asymmetric relationship between oil price
and macroeconomic variables which the related to various channels through which
changes in oil price is transmitted into the macroeconomy (see Bouchaour and Al-
112
Zeaud 2012; Oluwaseyi 2018). Also, evidenced in literature is the related theories
of the asymmetric effect of oil price on macroeconomic variables. The asymmetric
effect is significant because it is assumed that symmetric assumption of oil price-
macroeconomic relationship may hypothetically limit the economic analyses of this
study, which may even cause distortion of the relationship (Cologne and Manera
2009). Researchers including Hashmi et al. (2021), Su et al. (2021) and Nusair
and Olson (2021) emphasized that changes in oil prices have an asymmetric effect
on macroeconomic variables. The asymmetric effect supports decomposing of oil
price variable into positive and negative effect (Mork 1989). It evidences the short
and long run varying effects of increase and decrease in oil price on
macroeconomic variables. (Nusair and Olson 2021). For example, if there is an
unexpected increase in oil price, the cost production of many energies intensive
firms is expected to increase assuming this firms do not hedge against risk in oil
price fluctuations (Nusair and Olson 2021; Kocaarslan et al.2020). Consequently,
the marginal profit of this company may fall and hence, altering economic
activities either in the short run or in the long run (Dixit and Pindyck (1994).
However, the respond of macroeconomic variables to changes in oil price depend
on the nature of positive or negative asymmetric effect associated with the
changes in oil price (Kocaarslan et al. 2020; Chatziantoniou et al. 2021; Nusair
and Olson 2021).
Furthermore, asymmetric effect also determines how changes in oil price influence
microeconomic variables in the long run and in the short run (see Salisu and Isah
2017; Akinsola and Odhiambo 2020). Consequently, studies by Huang et al.
(2005), Zhang (2008), Cologni and Manera (2009) and Khan et al. (2019), also
confirm the significant of studying asymmetries in the oil price- macroeconomic
variables relationship. For example, Kilian and Vigfusson (2017) used NARDL
113
model with data covering 1980Q1 to 2014Q2 and estimated the asymmetric effect
of oil price and on 13 Asian economies. The result evidence that in the short run
economic activity responded asymmetrically to oil price shocks in Bangladesh,
Hong Kong, Indonesia, India, and Japan. The long result evidenced no asymmetric
effect between oil price changes and economic activity in all the countries.
Meaning that oil price changes is only significant in the short run, in determining
variations in macroeconomic variables. Hence, policy aimed at hedging
macroeconomic variables from oil price shocks should be in the short run.
In analyzing the asymmetries of shocks in oil price, some scholars have found that
increase in oil price have a disproportionately larger effect on GDP, interest rate,
unemployment rate and inflation than decrease in oil price shocks (Kocaarslan et
al.2020; Nusair and Olson 2021). While other studies have found that decrease in
oil price have greater effect on macroeconomic variables than increase in oil price
(see Yildirim and Arifli 2021). Also, found in literature is that the long run and
short run effect of changes in oil price on macroeconomic variables, varies (see
Salisu and Isah 2017; Odhiambo and Nyasha 2019; Akinsola and Odhiambo
2020). This may necessitate formulation of short run and long run policies by
policymakers. For example, Akinsola and Odhiambo (2020) evidenced that
changes in oil price do not have short run asymmetric effect on net oil importing
countries while a long run asymmetric effect exists. Hence, they suggested a long
run policy that hedge macroeconomic variables from oil price shocks. In contrast,
Salisu and Isah (2017) found that oil price shock asymmetrically affects stock
prices in net oil exporting and net oil importing countries both in the long run and
in the short run. From the reviewed literature, this study may conclude that there
is little or no consensus on the asymmetric impact of changes in oil price on
macroeconomic variables. While some scholars report a positive relationship (Vu
114
and Nakata 2018; Cunado et al. 2015), others report a negative relationship (Lee
et al.2001; Aziz and Dahalan 2015). Furthermore, while Khan et al. (2019)
accounted for insignificant asymmetric effect of changes in oil price on
macroeconomic variables, others account for nonlinearity on the effect of
fluctuations in oil price on macroeconomic variables (Aziz and Dahalan 2015;
Zhang 2008). To offer a better understanding for the conflicting results reported
in the literature, this study adopts the negative and positive partial sum processes
of changes in oil price and investigate if asymmetry exist between oil price and
macroeconomic variables. The next sections offer further insight on the
asymmetric relationship between oil price and macroeconomic variables by
relating it to theories and channels through which oil price affect macroeconomic
variables. This will further examine if the long run effects of oil price on
macroeconomic variables are different from short run effects across net oil
exporting and net oil importing countries in Africa using ARDL model with data
covering from 1996𝑞1 to 2016𝑞4.
4.2 Channel of Transmission
In this section the transmission channels through which changes in oil price relate
with macroeconomic variables are reviewed and discussed. Scholars including
Davis and Haltiwanger (2001), Lardic and Mignon (2008) Bouchaour and Al-Zeaud
(2012) and Oluwaseyi (2018) have a detail analysis of the channels through which
oil price changes affect macroeconomic variables. For in-depth discussions, the
section of this chapter is divided into subsections: 4.2.1 describes the supply-side
effect channel. Section4.2.2 presents the demand-side effect channel. Section
4.2.3 put forward details of real balance effect and monetary policy channel. 4.2.4
describes the terms of trade channel. Section 4.2.5 put forward the inflation effect
channel. The visual understanding of workings of these channels in relation to how
115
changes in oil price is transmitted into macroeconomic variables is presented in
table 4.1.
4.2.1 Supply-Side Effect Channel
Supply-side effect is one of the channels through which changes in oil price relate
with macroeconomic variables and it is caused by increase in oil prices (Kilian
2009). The marginal cost of production increases following the rise in oil prices,
thus, the productivity and GDP growth rate decline and this can consequently
cause rise in unemployment rate (Doğrul and Soytas 2010; Ahmed 2013;
Kocaarslan et al.2020). With rising production costs, firms may find it difficult to
continue production at the existing production level or full capacity (González and
Nabiyev 2009), resulting into downsizing and decline in economic growth and
eventually increase in unemployment rate (Kocaarslan et al.2020). Within this
context it may be difficult and costly to reallocate capital and specialized labor
from one industry to another, hence, labor need to wait for better job opportunity
(Ahmed 2013; Dogrul and Soytas 2010). This may further contribute negatively
to unemployment rate and economic activity and growth at large.
The rise in oil prices could cause supply shocks, and this has propensity to reduce
potential output (Kilian 2009). The rising prices of oil signal crude oil scarcity
(Gonzalez and Nabiyev 2009). Given that oil is one of the basic inputs in
production (Kilian 2014), hence, the scarcity of crude oil may result in the decline
of output growth and productivity decline. The slowdown in the growth and
productivity can lead to decrease in the growth of wages and increase in the rate
of unemployment at which disposable income decline and purchasing power may
decrease (Ahmed 2013). However, if consumers perceive the increase in oil prices
to be temporary, they have the tendency of smoothing out their consumption
116
through less savings and increased borrowing and this can lead to a rise in the
equilibrium real rate of interest (Brown and Yucel 2002). As the growth in output
decreases and real rate of interest increases, there may be a fall in the demand
for real cash balances and for a certain monetary aggregate growth, the inflation
rate rises (Kilian, and Zhou 2019). The rise in oil prices consequently leads to
reduction in the GDP growth rate, while boosting the real rate of interest and
measured inflation rate (Ratti and Vespignani 2015). Thus, this study will adopt
panel ARDL model and examine this phenomenon by separating the variables of
oil price into positive and negative effect and asymmetrically analyse oil price-
macroeconomic relationship long run and short run effect in the context of net oil
exporting and net oil importing countries in Africa.
4.2.2 Demand-Side Effect Channel
The demand-side effect of oil price changes on macroeconomic variables is
transmitted through consumption and investment (Kilian, and Zhou 2019). If the
increase in oil price is assumed to be short term, or if the assumed temporary
effects on output turn out to have continuing effects, consumers may try to
smooth out their consumption by borrowing more or save less, consequently
shifting total demand and supply curves (Kilian 2014; Kilian, and Zhou 2019).
Such a change in demand and supply may reinforce a decline in GDP growth rate
as investment reduces.
However, the general view among scholars is that exogenous shocks in oil price
are recessionary and inflationary (Hamilton 1996). But this interpretation is
against the views of Kilian (2014) who argued that even if an exogenous shock in
oil price cause negative shift of total supply curve and increase in price level, it
would not be anticipated to generate continued inflation in the absence of real
117
wage rigidities (see Bruno and Sachs 1982). In quantifying the pass-through of
shocks in oil price to inflation, Brown and Yucel (2002) argued that with monetary
policy response of an interest rate increase, demand for real cash balances
declines. With rising interest rate, cost of borrowing increases, hence, investment
and consumption rate are reduced and consequently a decline in output growth
rate. This study, therefore, will complement on this view by adopting panel ARDL
model and asymmetrically investigate oil price-macroeconomic relationship in the
context of net oil exporting and net oil importing countries in Africa. This
relationship will be analyzed asymmetrically by separating the variable of oil price
into positive and negative effect and determine the long run and short run effect
of changes in oil price on macroeconomic variables under consideration.
4.2.3 Real Balance Effect and Monetary Policy
The underlying principle of real balance effect with respect to shocks in oil price is
through its effect on inflation (see Brown and Yucel 2002). An increase in oil price
can stimulate demand for money (Pierce and Enzler 1974). The failure of monetary
authorities to meet with the increasing demand for money may cause an increase
in interest rate (Brown and Yucel 2002). Given an increase in interest rate,
inflation may increase causing economic activities to deteriorate including
depreciation of terms of trade, this can have negative effect on exchange rate,
hence, increase in the cost of goods and services (Beckmann et al.2017). Thus,
this study draws from real balance effect and monetary policy transmission
channel and relate it to interest rate dynamics and test its effect on GDP including
other variables created by oil price dynamics. For example, it is assumed that
increase in oil price increases money demand, causing interest rate to rise in net
oil importing countries. Other the hand, it may create reduction in interest rate in
118
net oil exporting causing increase in purchasing power and investment as it is
assumed that there is increase in money circulation.
4.2.4 Terms of Trade Channel
Terms of trade transmission channel was first examined by Amano and van Norden
(1998a). The study focused on the relationship between oil price and exchange
rate, and their finding revealed bidirectional causality. The fundamental principle
of this channel is to show the level at which changes in oil price affect exchange
rate dynamics (Beckmann et al. 2017; Bénassy-Quéré et al. 2007). When the term
of trade increases, for net oil importing countries, it implies depreciation of
exchange rates, thus, a reduction in purchasing power, this can have a negative
effect on domestic cost-push inflation (Beckmann et al. 2017). It is expected that
when the price of oil increases, domestic currencies of countries who depend so
much on crude oil in the tradeable sector may depreciate, reflecting an increase
in inflation (Sarno 2005 and Kilian and Taylor 2003). For net oil exporting
countries, when the term of trade improves, it implies appreciation of exchange
rate, hence, an increase in purchasing power. This can create increase in economic
activities and consequently increase in GDP growth rate (Buetzer et al. 2016). This
study tends to adopt this phenomenon and analyze how changes in oil price is
transmitted to exchange rate in the context of net oil exporting and net oil
importing countries in Africa. This is done by relating exchange rate dynamics to
fluctuations in GDP growth rate given an increase in oil price. This is based on
assumption that exchange rate dynamics affect investment rate and consumer
purchasing power.
119
4.2.5 Inflation Effect Channel
Inflation effect is another transmission channel through which oil price-
macroeconomic relationship is transmitted into the economy (Tang et al.2009). In
an open economy inflationary targeting is used by monetary authorities to direct
their monetary policies and set their interest rate policy (Brown and Yucel 2002).
When inflation is caused by increase in oil price shocks, a monetary policy
tightening can worsen the long-term output by increasing interest rate and
reduced investment (Tang et al.2009).
Dinh (2019b) and Jungwook and Ronald (2008) pointed out that oil price is directly
relate to the production process and it has a considerable effect on the consumer
price index through increased commodity prices that lead to inflation.
Consequently, output, employment and inflation are impacted by the risen oil price
shock, hence, production cost is caused to increase. The inflationary pressures
can validate reduced demand, and this can create output cuts, leading to
unemployment rate.
For example, Chen et al. (2020) used structural vector autoregression with
stochastic volatility (TVP-SVAR-SV) model with monthly dataset covering 1999 to
2016 and analyze how changes in oil price is transmitted into the macroeconomy
through inflation effect in China. They conclude that oil price increase driven by
demand-side effect affects Chinese macroeconomy through inflation effect arising
especially from import, consumption, and production cost. The authors proposed
that policies aimed at alleviating inflation should emphasis on changes in oil
demand shocks and a need to stimulate consumption and expand demand is
necessary. Furthermore, the authors encouraged risk hedging tools and anti-
inflationary policies to reduce the adverse effect of oil price shocks. This study will
120
investigate the relationship between oil prices and inflation in the context of net
oil exporting and net oil importing countries in Africa. Inflation is measured by
consumer price index. It is expected that oil price dynamics will have effect on
purchasing power index (PPI) of consumers through exchange rate dynamics
caused by terms of trade effect. The results will have important policy implications
because monetary authorities are expected to provide monetary policy that will
shield consumer price index from the dynamics of oil price.
The channels through which oil price dynamics is transmitted into macroeconomic
economy is illustrated in figure 4.1. When oil price increases, it creates supply
shock effect. This is represented by arrow 1. For net oil importing countries output
in long-term decrease as capacity and capital unitization declines. This leads to
decline in income and increase in unemployment rate as shown by arrow 2. This
is consistent not only with the expected theoretical framework of reallocation
effect but also support the views of Beaudreau (2005), Ghosh and Kanjilal (2014)
and Kocaarslan et al. (2020) who were of the view that increase in oil price caused
by supply shocks validates increase in production cost. This can cause reduction
in productivity level or reallocation effect, hence, increase in unemployment rate.
When oil price increase, inflation increase especially in net oil importing countries
as shown in arrow 3. There will be purchasing power parity dynamics, and this
leads to decrease in profit and investment as shown by arrow 4. On one hand,
consumer price index fluctuates given monetary policy intervention through
interest rate dynamics, cost of living and producing decline and this will give
increase in money demand as shown by arrow 9. But with two phase monetary
policy intervention to control inflation through interest rate dynamics. On
investment side, with monetary policy intervention through interest rate
dynamics, investment reduces given an increase interest rate, output in the long-
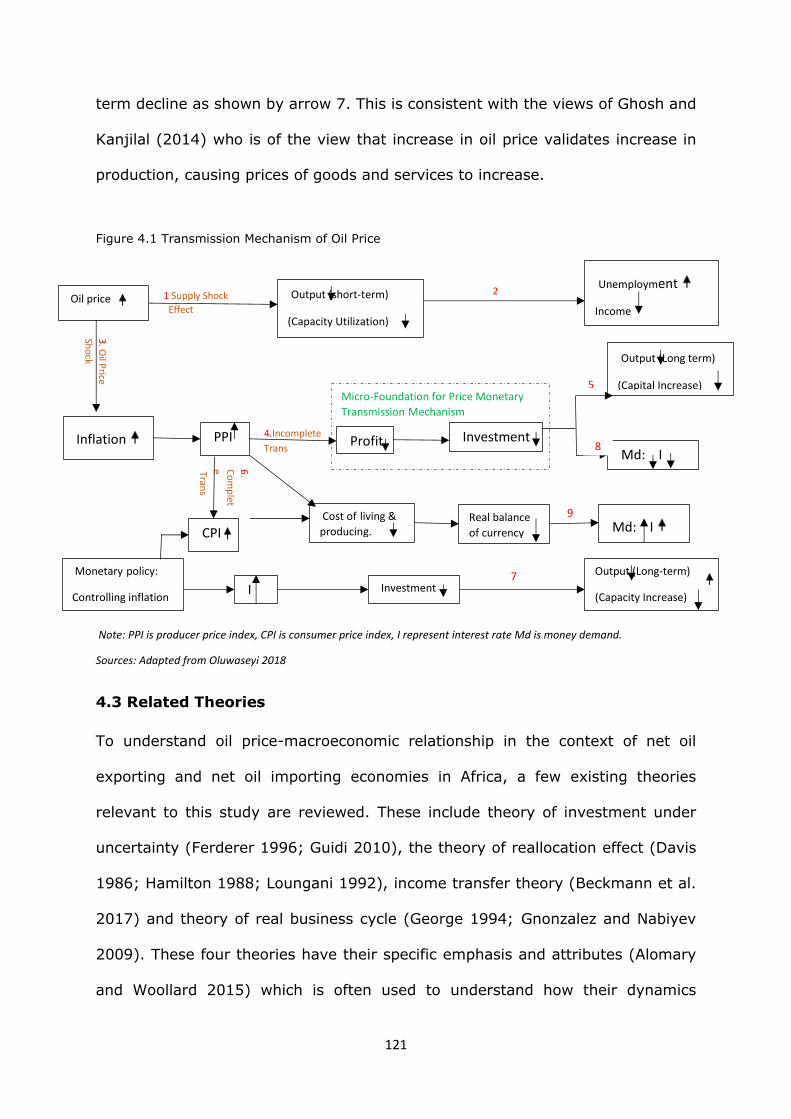
121
5
2 1 Supply Shock
Effect
6.
Co
mp
let
e Trans
3. O
il Price
Sho
ck
4.Incomplete
Trans
Micro-Foundation for Price Monetary
Transmission Mechanism
Real balance
of currency
Oil price
Cost of living &
producing. CPI
Output (Long-term)
(Capacity Increase) Investment I
Monetary policy:
Controlling inflation
Output (Long term)
(Capital Increase)
Md: I Investment Profit PPI Inflation
Md: I
Unemployment
Income
Output (short-term)
(Capacity Utilization)
8
9
7
term decline as shown by arrow 7. This is consistent with the views of Ghosh and
Kanjilal (2014) who is of the view that increase in oil price validates increase in
production, causing prices of goods and services to increase.
Note: PPI is producer price index, CPI is consumer price index, I represent interest rate Md is money demand.
Sources: Adapted from Oluwaseyi 2018
4.3 Related Theories
To understand oil price-macroeconomic relationship in the context of net oil
exporting and net oil importing economies in Africa, a few existing theories
relevant to this study are reviewed. These include theory of investment under
uncertainty (Ferderer 1996; Guidi 2010), the theory of reallocation effect (Davis
1986; Hamilton 1988; Loungani 1992), income transfer theory (Beckmann et al.
2017) and theory of real business cycle (George 1994; Gnonzalez and Nabiyev
2009). These four theories have their specific emphasis and attributes (Alomary
and Woollard 2015) which is often used to understand how their dynamics
Figure 4.1 Transmission Mechanism of Oil Price

122
contributed to analyzing the relationship between oil price and macroeconomic
variables (Trang et al. 2017). The dynamics and characteristics associated with
each theory could be country specific and time varying (Iwayemi and Fowowe
2010; Fowowe 2014).
This section of this chapter is subdivided into sections. Section 4.2.1 describes
theory of reallocation effect. Section 4.2.2 presents theory of investment under
uncertainty. Section 4.2.3 is where theory of income transfer is discussed. Section
4.2.4 put forward theory of real business cycle. These theories are discussed in
detail in the next sections.
4.3.1 Theory of Reallocation
Beaudreau (2005) put forward sector reallocation effect in which the role of oil
price changes is explained through changes in production cost. Beaudreau (2005)
argued that no production can be done without energy, thus, crude oil is very
significant primary production factor. Therefore, when changes in oil price are for
long term, it may cause potential impact on the production cost, and this can lead
to reduction in production level (Brown and Yucel 2002). As such, firms are forced
to change their production structure (Kocaarslan et al.2020) and consequently this
may create reallocation of labor and capital across sectors given a shock in oil
prices (Doğrul and Soytas 2010), and this can have a great effect on
unemployment rate in the long run (Loungani 1986).
Oil price increase has the capability of causing productivity decreases as firms try
to cope with the high input cost, as a result, supply reduces, and prices of goods
and services increase (Ghosh and Kanjilal 2014). This may result into lower
investment decisions or lower demand for goods especially those with long
durability (Trang et al.2017). The impact may be more significant on energy sector
123
as resources are being reallocated from efficient energy sector to less efficient
energy sector (Kocaarslan et al.2020; Dogrul and Soyatas 2010). All these factors
have the capability of affecting macroeconomic variables, hence, slow down
economic activities and growth.
For instance, a simple concept is variations in unemployment equilibrium which is
a function of changings in demand for labor coming from changings in real input
prices for example, price of credit “interest rate” and price of oil (Kocaarslan et al.
2020). Through this, an increase in oil prices cause production cost to increase
and profit margins to reduce (Dixit and Pindyck 1994). For economic equilibrium
adjustment to take place, labor (wage) price will reduce (Brown and Yucel 2002).
Due to the decline in wages, unemployment rates rise as result of the inverse
relation between wages and unemployment, purchasing power may reduce given
a reduction in disposable income (Trang et al.2017; Kocaarslan et al. 2020). The
same mechanism works for increasing interest rates (see Ratti and Vespignani
2015). Thus, this study will consider reallocation effect theory as it provides the
matrix needed to analyze the relationship between oil price and macroeconomic
variables in the context of net oil exporting and oil importing countries in Africa.
4.3.2 Theory of Investment Under Uncertainty
Previous scholars including Bernanke (1983), Majd and Pindyck (1987) and
Ferderer (1996) have suggested that theory of investment uncertainty play a
significant role in analysing oil price- macroeconomic relationship. As such, this
study draws motivation from this theory to analyse how changes in oil price affect
macroeconomic variables in the context of net oil exporting and net oil importing
countries in Africa. According to Elder and Serletis (2010 & 2009), under the
condition of economic uncertainty, firms and households do not tend to make
irreversible investment decisions, and this can bring about investment project
124
postponement until uncertainty disappears (Aloui et al.2016). Given for example,
at microlevel investment decisions can significantly influence macroeconomic
variables negatively through expenditure switching by consumers (Kilian 2014;
Bernanke 1983). Besides decline in purchasing power, uncertainty in oil price can
reduce productivity level and this can validate firms to lay-off workers (Trang et
al.2017). This may result into increase in unemployment rate which may
ultimately reduce GDP growth rate (Kocaarslan et al. 2020; Ahmed 2013).
Furthermore, Guidi (2010) opined that the concern of investors’ behaviour in the
setting of uncertainty have impact on investment returns because of, for instance
the prices of oil may result in the formation of cyclical fluctuations in investments.
With this conclusion Aloui et al. (2016) held the view that rise in uncertainty can
contribute significantly to validate increase price of oil within a certain period due
to hoarding of oil for hedging purposes. Dixit and Pindyck (1994), therefore
suggest that uncertainty is very significant when it comes to investment especially
economic outcome. Hence, reiterating Guidi (2010) argument on returns, the
effect comes into play if for example, the rate at which to borrow increases due to
monetary policy that is put in place to control inflation given an increase in oil
price. With the perseverance of uncertainty, not only that the tendency of
companies to commit their investible resources becomes higher, but also the
willingness of buyers to spend on durables that are illiquid may diminished (Brown
and Yucel 2002). This gives the suggestion that, for instance the uncertainty
concerning the prices of oil has the likelihood of affecting interest rate parity
(Chatziantoniou et al.2021). And as such, company’s joint decision of where and
when to commit resources among the irreversible investments is delayed which
may ultimately affect economic growth.
125
In another manner, the uncertainty regarding future return on investment
stimulates optimizing agents to delay investment for the period in which the
expected additional information value is greater than the short-term return
expected to current investment (Elder and Serletis, 2010). On these claims, one
could say that uncertainty about oil prices is essential and significant in influencing
total consumption, investment and hence unemployment rate and GDP. With this
argument, this study considers this theory suitable to analyse the asymmetric
relationship between oil price and macroeconomic variables in the context of net
oil exporting and net oil importing countries in Africa. This will enable policymakers
and investors formulate effective economic policies and make adequate
investment decision. Figure 4.2 provides the framework to show the basic
mechanism through which uncertainty in oil price affect macroeconomic variables.
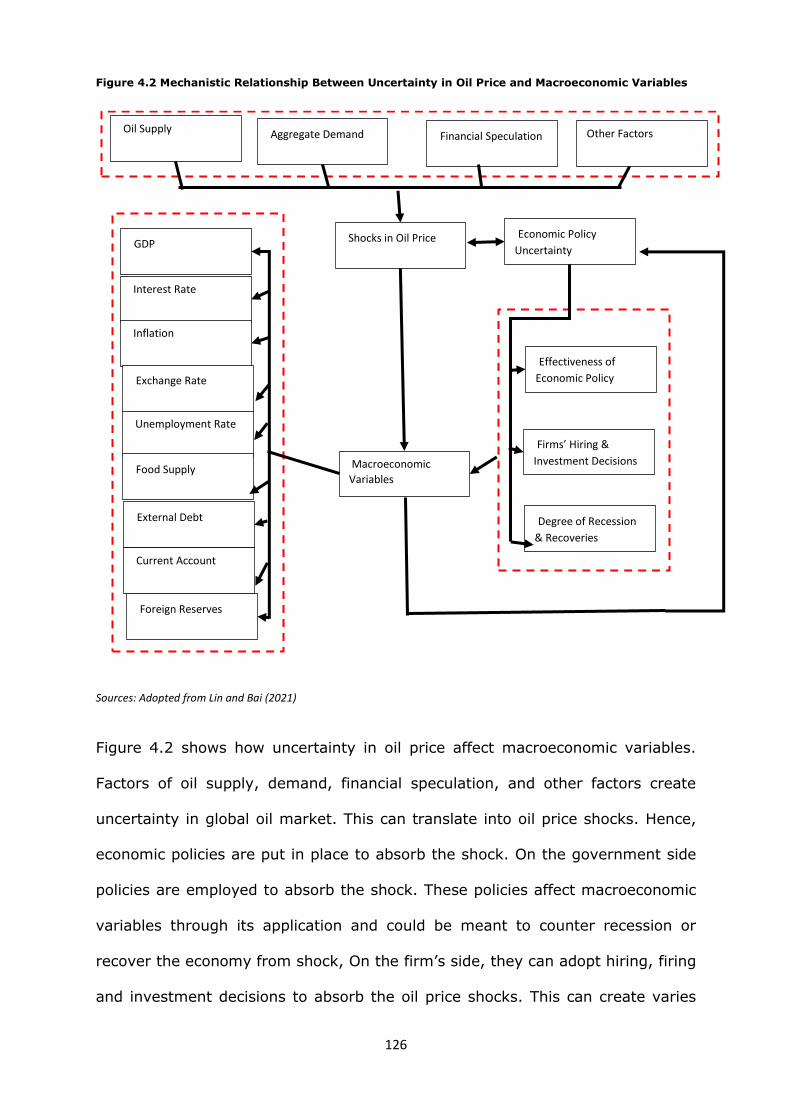
126
Sources: Adopted from Lin and Bai (2021)
Figure 4.2 shows how uncertainty in oil price affect macroeconomic variables.
Factors of oil supply, demand, financial speculation, and other factors create
uncertainty in global oil market. This can translate into oil price shocks. Hence,
economic policies are put in place to absorb the shock. On the government side
policies are employed to absorb the shock. These policies affect macroeconomic
variables through its application and could be meant to counter recession or
recover the economy from shock, On the firm’s side, they can adopt hiring, firing
and investment decisions to absorb the oil price shocks. This can create varies
Other Factors Oil Supply Aggregate Demand Financial Speculation
Effectiveness of
Economic Policy
Firms’ Hiring &
Investment Decisions
Degree of Recession
& Recoveries
Shocks in Oil Price
Macroeconomic
Variables
GDP
Interest Rate
Inflation
Exchange Rate
Unemployment Rate
External Debt
Food Supply
Foreign Reserves
Current Account
Economic Policy
Uncertainty
Figure 4.2 Mechanistic Relationship Between Uncertainty in Oil Price and Macroeconomic Variables
127
degree of effect on macroeconomic variables. The oil price shock can affect
macroeconomic variables directly as shown in figure 4.2. The degree at which
macroeconomic variables is affected is a function of each country’s economic
environment. This aligns with views of Iwayemi and Fowowe (2010) who pointed
out that the effect of oil price shock on macroeconomic variables is country
specific.
4.3.3 Income Transfer Theory
The income transfer effect suggests increase (decrease) in purchasing power in
net oil exporting (oil net importing) countries given an increase (decrease) in oil
prices (Dohner 1981; Brown and Yucel 2002; Beckmann et al. 2017; Udoayang et
al.2020.). This gives rise to decline in consumer demand and, hence, decline in
GDP growth in net oil importing countries whereas the opposite is the case for net
oil exporting countries. As mentioned earlier, the income transfer focuses on
changes in purchasing power due to terms of trade dynamics (Dohner 1981; Fried
and Schultze 1975; Beckmann et al.2017).
The change in purchasing power can cause decline in consumer demand in net oil
importing countries while it will stimulate increase in consumer demand in net oil
exporting countries (Ahmed 2013). Thus, consumer demand for goods produced
in net oil importing countries will reduce globally while supply of savings increase
in the global market (Brown and Yucel 2002). Real interest rate may decrease
given an increase in supply of savings in net oil importing countries (Ratti and
Vespignani 2015).
It is expected that investments stimulated by decrease in global interest rate will
balances off reduction in consumption and cause no change in total demand
(Beckmann et al. 2017; Kocaarslan et al. 2020). Kocaarslan et al. (2020) and
128
Brown and Yucel (2002) suggested that, in a downward sticky price condition, a
decline in demand for goods produced in net oil importing countries may further
deteriorate GDP growth rate. And if the level did not drop, the decline in
consumption may be higher compared to investment increase and this can cause
total demand to fall, thus, a further deterioration in economic activities and growth
(Dohner 1981). Motivated by the claims of income transfer, this study will consider
theory of income transfer suitable for this analysis as it provides the matrix needed
some of the objectives outlined in this study.
4.3.4 Theory of Real Business Cycle
Real Business Cycle theory maintains that fluctuations in business cycle to a large
extent are functions of real oil price shocks which impact global market dynamics
(Brown and Yucel 2002; Su et al. 2021). The advocates of real business cycle are
of the view that economic fluctuations and crisis are outcome of external shock,
such as shocks in technology (González and Nabiyev 2009). While earlier study
revealed that various cyclical events cannot be explained only by model driven by
technology shocks (Dixit and Pindyck 1994). This propelled addition of other
models of disturbances including natural disasters, oil shocks, environmental and
safety policies, periods of bad weather and pandemics such as COVID-19 etc
(George 1994; González and Nabiyev 2009; Su et al. 2021). George (1994) went
ahead to suggest that real business cycle model can be classified through
distinguishing the greatest forces pushing the cycle, which could be in the form of
functions of supply shock or demand shock in the economy (Brown and Yucel
2002). Some authors including Baffes et al. (2015) and Prest (2017) ascribe the
2014 to 2015 oil price shocks to be mainly of supply shocks rather than to be more
of demand shocks and some other shocks such as technological shocks and
appreciation of US as Chen et al. (2015) and Baffes et al. (2015) claimed.
129
The underlying idea behind real business cycle theory is that if an external shock
happened and it directly affects the effectiveness and changes in labour and
capital, it may influence firms’ and workers decisions, causing variations in their
production and consumption patterns and ultimately a negative impact on output
(Finn 1982; González and Nabiyev 2009). The implication of this theory is that it
supports the idea that shocks in oil can affect economic growth. The effect of
business cycles varies in degree and duration; hence, the cycles do not seem to
be the same (González and Nabiyev 2009). The level of effect of changes in oil
price in the economies being examined in this study vary in duration and
magnitude as shown in chapter two of this study and this can be explained by the
fluctuations in economic fundamental that will be analysed in the conclusion. Thus,
given that this theory has some matrix needed to analyse oil price-macroeconomic
relationship in the context of net oil exporting and oil importing countries in Africa,
this study draws motivation from it and consider it fit for this analysis.
4.4 Summary
In this chapter, different transmission channels through which shocks in oil price
causes changes in macroeconomic variables are identified. The channels identified
are supply-side effect (Hosseini et al. 2021; Kocaarslan et al.2020), demand-side
effect (Kilian 2014; Liu et al. 2021), real balance effect (Su et al. 2021), terms
of trade effect (Beckmann et al.2017; Balli et al. 2021) and inflation effect (Yildirim
and Arifli 2021). These channels support the investigation of impact oil price
shocks on terms of trade geared towards imbalance in the economy. Furthermore,
the channels help to examine the potential decline in output level as average cost
of production increases or decrease, consequently leading to GDP growth rate
dynamics and the potential effect on consumer purchasing power (Zakaria et al.
2021).
130
Furthermore, the related theories relevant to this study were discussed and they
include theory of investment under uncertainty (Su et al. 2021; Lin and Bai 2021),
income transfer theory (Knotek and Zaman 2021), reallocation effect (Lee and
Cho 2021) and real business cycle (Usman and Balcilar 2021; Backus et al. 2021).
For example, these theories explain the asymmetries in oil price macroeconomic
relationship (Nusair and Olson, 2021; Liu et al.2021), examine changes in
production structure (Maghyereh and Abdoh 2021) which can cause labor and
capital reallocation and hence, unemployment rate dynamics (Kocaarslan et
al.2020) and disequilibrium in money market (Jin and Xiong 2021; Lin and Bai
2021), which creates inflation dynamics as interest rates increases or decreases
(Brown and Yucel 2002). This study tends to adopt panel ARDL model and examine
the positive and negative asymmetric relationship between changes in oil price
and macroeconomic variables in net oil exporting and importing countries in Africa
in the long run and short run. The results found will be related to the discussed
theories and channels to further investigate if the response of macroeconomic
variables to changes in oil price varies or the same in net oil exporting and
importing countries.
131
CHAPTER FIVE:
RESEARCH METHODOLOGY
5.0 Introduction
In chapter 3, literature was reviewed, and gaps that exist in literature were
identified concerning how asymmetric oil price affect macroeconomic variables. In
identifying these gaps, hypotheses needed to analyse this relationship are
developed in chapter 6. Thus, this chapter, in addition, presents the research
methodology employed to achieve the research aim. Developing research
problems and translating them into suitable research strategies, approaches,
designs, and data collection and analysis methods do not independently happen.
Scholars such as Saunders et al. (2018) view that it requires a researcher
comprehending the various paradigms and their impact on research design and
the method employed. An adopted philosophical underpinning determines the
choice of instruments employed to examine the phenomenon being researched,
affecting the researcher's worldview and formulated hypotheses (Saunders et al.,
2018). A study's rationale is shaped by a researcher's philosophical position and
the purpose of the investigation (Havercamp and Young 2007). The purpose of
this research study is to examine how asymmetric oil price relate to
macroeconomic variables in the context of net oil-exporting and net oil-importing
countries in Africa. In doing so, this study intends to find out if the asymmetric
changes in oil price affect macroeconomic variables in the same way in net oil
exporting and oil importing countries in Africa.
This chapter is designed to expound the research paradigm by utilizing positivism
that anchors on realism from ontological domain, and it also took the objectivism
stance from the domain of epistemology. The axiology of data used is unbiased
132
and value free. This involves hypothesis testing as data is quantitatively analyzed
using panel ARDL model. This is followed by a discussion on research design,
sample size, and data collection and analysis come next in the following chapter.
5.1 Methodology and Methods
Sobh and Perry (2006) defined methodology to mean the specific procedure or
technique a researcher employed in research work to select, process, identify and
analyse the reality of a relationship or topic. The methodology allows the
researcher to critically examine the reality and validity of the relationship between
or among variables. Hence, the understanding of the ontological and the
epistemological perspective of a researcher determines the type of research
method(s) a researcher adopts (Creswell, 2014). Likewise, the understanding of
the components of research philosophy (ontology and epistemology) enhances the
researcher's orientation in giving proper interpretation and as well aid the
researcher to adequately critique and apply research findings to justify or improve
practice (Allison and Pomeroy, 2000). This brought to bearing the following
questions:
• What is the ontological, epistemological stand of this study?
• What is the underpinning philosophical ideology behind this research work?
The answers to these questions inform the methodological approach employed in
carrying out this research. Section 5.1.3.1 gave a summary insight of the research
method adopted in this research.
133
5.1.1 An Overview of Empirical Methodology
Two methods of analysis are employed in this study, and they include descriptive
and econometric methods. In the descriptive method, the mean, the median, the
maximum, the minimum and the standard deviation are used to meaningfully
present the properties of data adopted. Regression analysis is used to summarize
the visual relationship between changes in oil price and macroeconomic variables
both in individual country levels and group countries levels. This provides the basis
for more extensive quantitative empirical analysis using the panel ARDL model
with secondary data covering from 1996𝑞1 to 2016𝑞4. The justification and
advantages of using panel ARDL model is well detailed in chapter 6 section 6.3
and section 6.9.1 respectively.
Empirically, various methods are suitable to examine how macroeconomic
variables respond to changes in oil price in the context of net oil-exporting and
net oil-importing countries in Africa. Nonetheless, this study employed a
quantitative method with a panel ARDL model as a methodological tool. The panel
ARDL model is adopted to test the hypothesis derived which was informed by
chapters three and four. The findings are related to theories and channels through
which asymmetric changes in oil price relate affect macroeconomic variables in
the context of net oil-exporting and net oil-importing countries in Africa. Some
other models such VAR, SVAR, PVAR etc. are capable of accounting for this type
of analysis. Although, the adoption of the panel ARDL model is based on the
outlined characteristics in chapter 1, section 1.5, and chapter 6, sections 6.9.1.
5.2 Research Design
Previous sections of this chapter examine the research approaches, and the
deductive positivism approach was established as the most appropriate for this
134
study. The research design is discussed in this section, and it consists of a
comprehensive plan for data collection for empirical analysis (Bhattacherjee
2012). Thus, this study will explain how the formulated hypotheses are intended
to be answered using the identified research strategy (Bryman and Bell 2015).
The deductive positivism approach adopted is used to quantitatively analyse panel
data of net oil-exporting and oil importing countries in Africa. Time series data of
macroeconomic variables employed were collected from the Data Streams of
International Monetary Fund (IMF) and Thomson Routers while Brent crude oil
price was from DataStream of Energy Information Administration (EIA). EViews
software package was used to analyse the data quantitively using panel ARDL
model, alongside other empirical methods such as Granger-causality test and Wald
test, is used to analyse predictability of the asymmetries in quantitative terms
how changes in oil price affect macroeconomic variables in the context of net oil-
exporting and net oil-importing countries in Africa. The justification for using the
panel ARDL model is well detailed in sections 6.9.1 in chapter 6. The justification
for using Granger -causality and Wald test is detailed in sections 6.10 and 6.11
respectively, in chapter 6.
5.3 Data Collection Technique and Sample Size
This section explained the sample size, data collection methods, and statistical
techniques employed in the empirical analysis. The countries are divided into net
oil-exporting economies and net oil-exporting economies.
5.3.1 Sample Size
The sample size of this study was drawn from net oil-exporting (Nigeria, Algeria,
and Egypt) and net oil-importing (South Africa and Kenya) countries in Africa with
data cover 1996𝑞1 to 2016𝑞4. The justification for choosing these countries is
135
informed by their level of oil export and oil import in Africa. A detailed overview
of selected countries is provided in Chapter 2 sections 2.1 and 2.2. Dividing the
countries into net oil-exporting countries and net oil-importing countries enables
this study to conduct a comparative analysis of the impact of oil price-
macroeconomic relationship on economic activities and growth. This is done to
determine if changes in oil price have the same asymmetric effect on
macroeconomic variable in net oil-exporting and net oil-importing countries in
Africa.
5.3.2 Description of Data and Data Collection Method
The data used for this research is secondary data. The macroeconomic data for
the analysis is collected from the DataStream of the International Monetary Fund
(IMF) and Thompson Routers, while the data for the oil price is collected from the
DataStream of Energy Information Administration (EIA). The data employed are
quarterly data from 1996𝑞1 to 2016𝑞4 to quantitatively examine the aim of the
study. 1996𝑞1 represents the starting quarterly data, while 2016𝑞4 represents the
ending quarterly data making 406 observations for net oil-exporting and net oil-
importing economies.
The period covered in this study captures different shocks in oil prices, including
the oil price boom period of 1996 –1998 associated with OPEC policies, the 2002-
2007 oil price increase related to the industrial revolution in Asia, the 2007-2009
oil price decline associated with the global financial crisis, the 2009-2013 oil price
rise connected with the continued increase in the industrial revolution and the
2014 -2016 oil price decline associated increase in unconventional oil production
and appreciation of U.S dollar. The effects of oil price shocks have been analysed
through theoretical and empirical literature. For example, Lee et al. (2001), Jin
136
(2008), and Zhao et al. (2016) found a negative effect of oil price increase on
GDP, while Du and Wei (2010) found that an increase in oil price positively affect
GDP. Jibril et al. and Lin and Bai (2021) found the asymmetric effect of oil price
on GDP. On the other hand, Khan et al. (2019) found an insignificant asymmetric
effect of oil price on GDP in the Philippines, Thailand, and Singapore.
Nevertheless, this study recognizes existing literature on the relationship between
oil price and macroeconomic variables, including country-specific level
asymmetries (Kocaarslan et al.2020), net oil-exporting asymmetries (Salisu and
Isah 2017), and net oil-importing asymmetries (Akinsola and Odhiambo 2020).
However, there seems to be a lack of research in the context of net oil-exporting
and net oil-importing in Africa. Hence, this study differs from the studies
mentioned by focusing not only analysing the asymmetric effect of oil price on
macroeconomic variables net oil-exporting but also analysed the asymmetric
effect of oil price on macroeconomic variables net oil-importing countries in Africa.
This will enable this study to draw a comparative analysis and determine how oil
price asymmetrically affect macroeconomic variables in each group of net oil
exporting and oil importing countries in Africa for policy formulation and
investment decision making.
This study employs quarterly quantitative data to measure changes in oil prices,
GDP, interest rate, inflation, exchange rates, unemployment rate, food supply,
external debt, current account, and foreign reserves covering the period 1996𝑞1
to 2016𝑞4.
5.3.3 Justification for Variables Selection
The justification for choosing these variables is informed by reviewed literature
and their critical roles in economic development and growth which form the basis
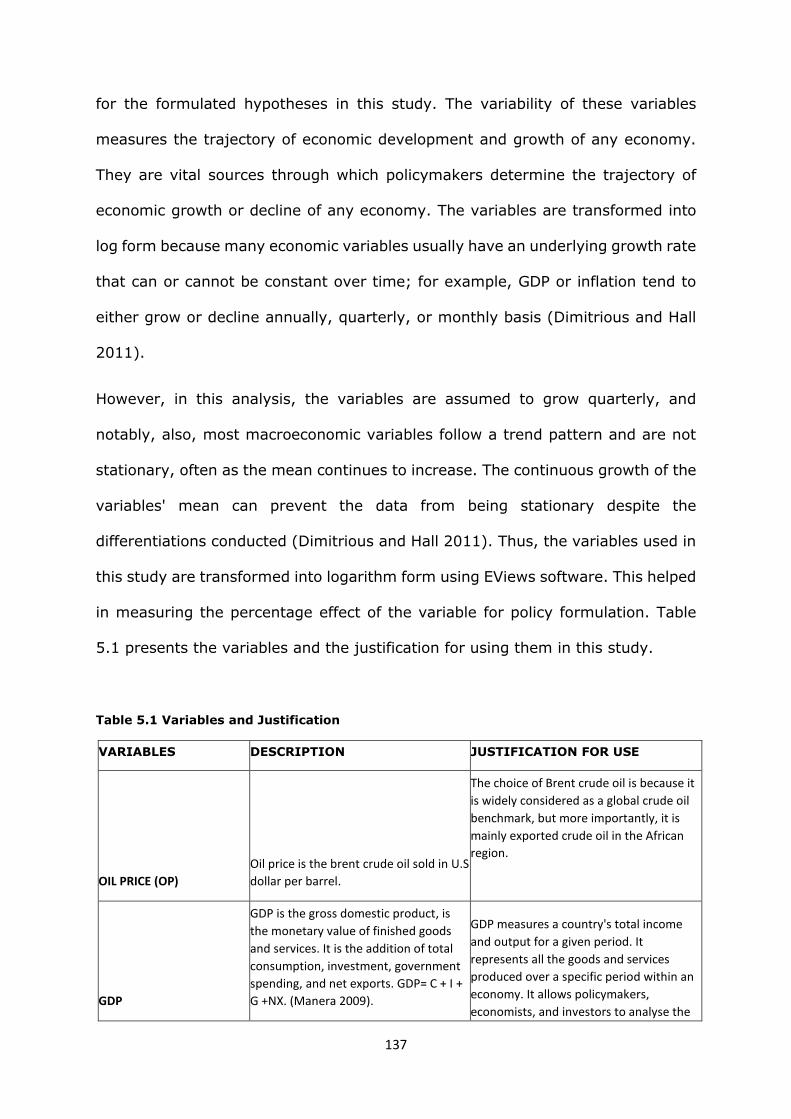
137
for the formulated hypotheses in this study. The variability of these variables
measures the trajectory of economic development and growth of any economy.
They are vital sources through which policymakers determine the trajectory of
economic growth or decline of any economy. The variables are transformed into
log form because many economic variables usually have an underlying growth rate
that can or cannot be constant over time; for example, GDP or inflation tend to
either grow or decline annually, quarterly, or monthly basis (Dimitrious and Hall
2011).
However, in this analysis, the variables are assumed to grow quarterly, and
notably, also, most macroeconomic variables follow a trend pattern and are not
stationary, often as the mean continues to increase. The continuous growth of the
variables' mean can prevent the data from being stationary despite the
differentiations conducted (Dimitrious and Hall 2011). Thus, the variables used in
this study are transformed into logarithm form using EViews software. This helped
in measuring the percentage effect of the variable for policy formulation. Table
5.1 presents the variables and the justification for using them in this study.
Table 5.1 Variables and Justification
VARIABLES DESCRIPTION JUSTIFICATION FOR USE
OIL PRICE (OP)
Oil price is the brent crude oil sold in U.S
dollar per barrel.
The choice of Brent crude oil is because it
is widely considered as a global crude oil
benchmark, but more importantly, it is
mainly exported crude oil in the African
region.
GDP
GDP is the gross domestic product, is
the monetary value of finished goods
and services. It is the addition of total
consumption, investment, government
spending, and net exports. GDP= C + I +
G +NX. (Manera 2009).
GDP measures a country's total income
and output for a given period. It
represents all the goods and services
produced over a specific period within an
economy. It allows policymakers,
economists, and investors to analyse the
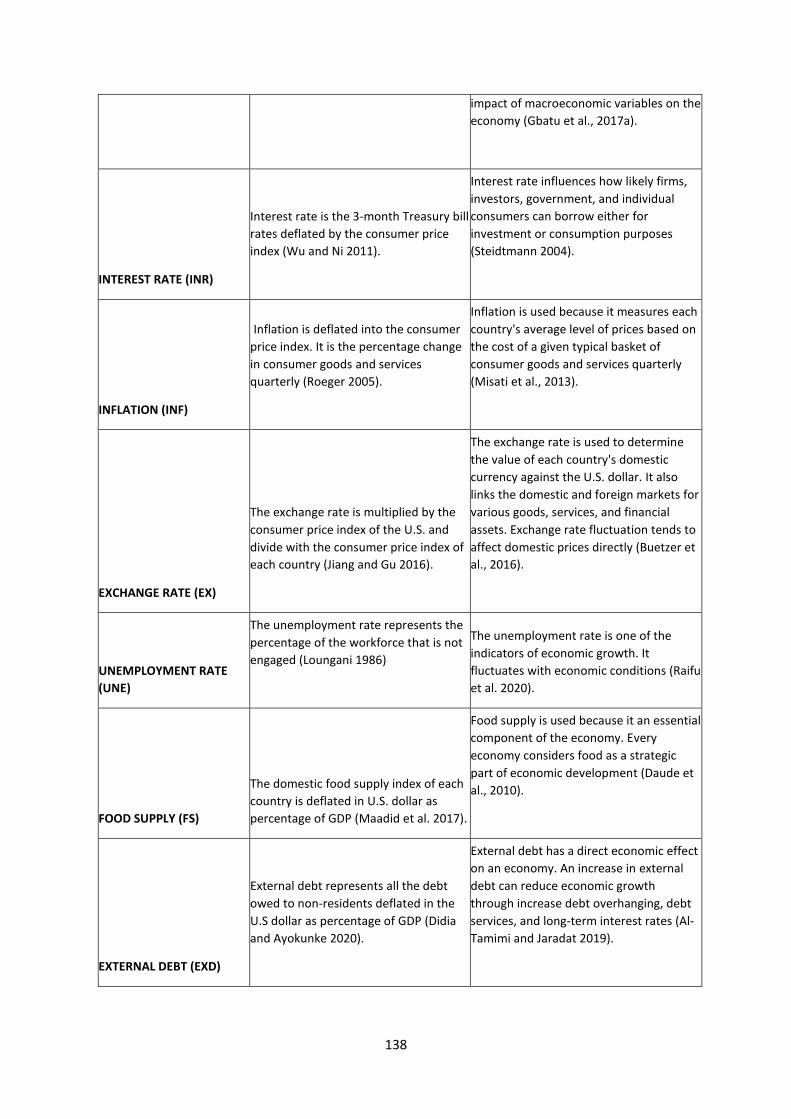
138
impact of macroeconomic variables on the
economy (Gbatu et al., 2017a).
INTEREST RATE (INR)
Interest rate is the 3-month Treasury bill
rates deflated by the consumer price
index (Wu and Ni 2011).
Interest rate influences how likely firms,
investors, government, and individual
consumers can borrow either for
investment or consumption purposes
(Steidtmann 2004).
INFLATION (INF)
Inflation is deflated into the consumer
price index. It is the percentage change
in consumer goods and services
quarterly (Roeger 2005).
Inflation is used because it measures each
country's average level of prices based on
the cost of a given typical basket of
consumer goods and services quarterly
(Misati et al., 2013).
EXCHANGE RATE (EX)
The exchange rate is multiplied by the
consumer price index of the U.S. and
divide with the consumer price index of
each country (Jiang and Gu 2016).
The exchange rate is used to determine
the value of each country's domestic
currency against the U.S. dollar. It also
links the domestic and foreign markets for
various goods, services, and financial
assets. Exchange rate fluctuation tends to
affect domestic prices directly (Buetzer et
al., 2016).
UNEMPLOYMENT RATE
(UNE)
The unemployment rate represents the
percentage of the workforce that is not
engaged (Loungani 1986)
The unemployment rate is one of the
indicators of economic growth. It
fluctuates with economic conditions (Raifu
et al. 2020).
FOOD SUPPLY (FS)
The domestic food supply index of each
country is deflated in U.S. dollar as
percentage of GDP (Maadid et al. 2017).
Food supply is used because it an essential
component of the economy. Every
economy considers food as a strategic
part of economic development (Daude et
al., 2010).
EXTERNAL DEBT (EXD)
External debt represents all the debt
owed to non-residents deflated in the
U.S dollar as percentage of GDP (Didia
and Ayokunke 2020).
External debt has a direct economic effect
on an economy. An increase in external
debt can reduce economic growth
through increase debt overhanging, debt
services, and long-term interest rates (Al-
Tamimi and Jaradat 2019).
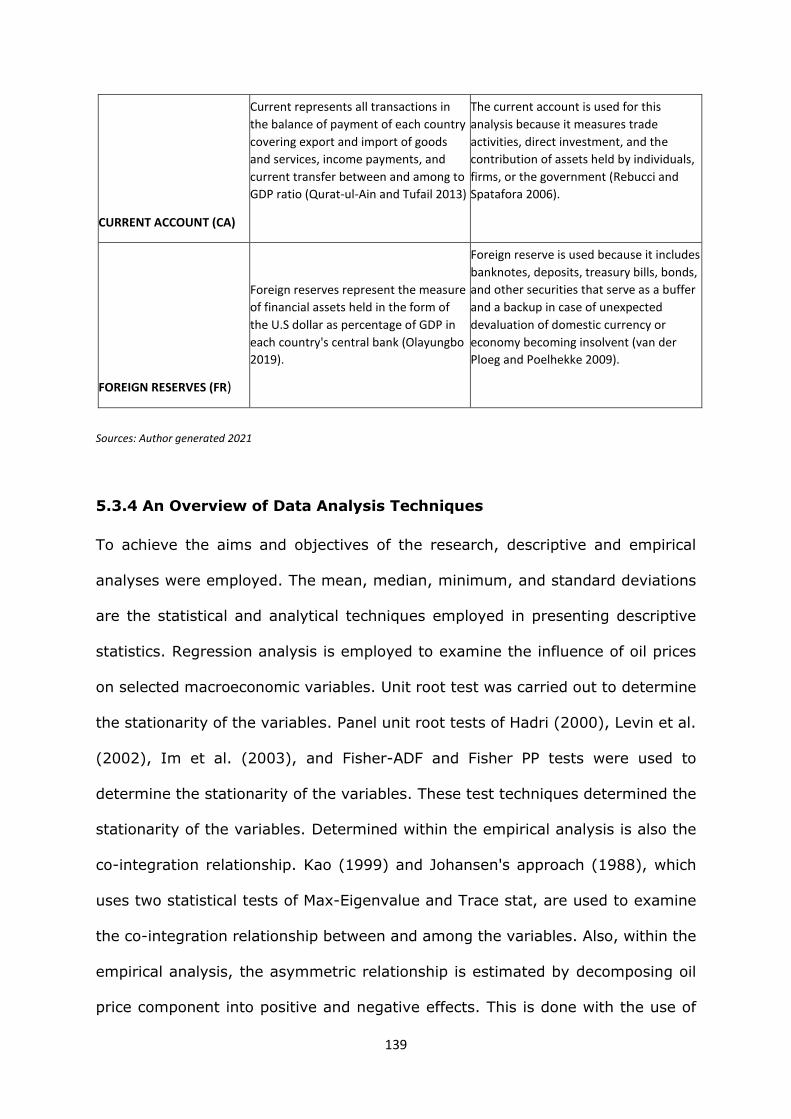
139
CURRENT ACCOUNT (CA)
Current represents all transactions in
the balance of payment of each country
covering export and import of goods
and services, income payments, and
current transfer between and among to
GDP ratio (Qurat-ul-Ain and Tufail 2013)
The current account is used for this
analysis because it measures trade
activities, direct investment, and the
contribution of assets held by individuals,
firms, or the government (Rebucci and
Spatafora 2006).
FOREIGN RESERVES (FR)
Foreign reserves represent the measure
of financial assets held in the form of
the U.S dollar as percentage of GDP in
each country's central bank (Olayungbo
2019).
Foreign reserve is used because it includes
banknotes, deposits, treasury bills, bonds,
and other securities that serve as a buffer
and a backup in case of unexpected
devaluation of domestic currency or
economy becoming insolvent (van der
Ploeg and Poelhekke 2009).
Sources: Author generated 2021
5.3.4 An Overview of Data Analysis Techniques
To achieve the aims and objectives of the research, descriptive and empirical
analyses were employed. The mean, median, minimum, and standard deviations
are the statistical and analytical techniques employed in presenting descriptive
statistics. Regression analysis is employed to examine the influence of oil prices
on selected macroeconomic variables. Unit root test was carried out to determine
the stationarity of the variables. Panel unit root tests of Hadri (2000), Levin et al.
(2002), Im et al. (2003), and Fisher-ADF and Fisher PP tests were used to
determine the stationarity of the variables. These test techniques determined the
stationarity of the variables. Determined within the empirical analysis is also the
co-integration relationship. Kao (1999) and Johansen's approach (1988), which
uses two statistical tests of Max-Eigenvalue and Trace stat, are used to examine
the co-integration relationship between and among the variables. Also, within the
empirical analysis, the asymmetric relationship is estimated by decomposing oil
price component into positive and negative effects. This is done with the use of
140
the panel ARDL model. Here, the short run, and the long run positive and negative
effects of oil price on macroeconomic variables was analysed. Furthermore, the
panel ARDL model is used to test the validity of the formulated hypothesis.
Granger-causality and Wald test form part of the empirical analysis as they were
used for a robust check on the findings from the panel ARDL model.
5.4 An Overview of Econometric Analysis
This section presents the model used for econometric analysis. Oil is one of the
significant factors of production. Thus, a change in oil price can cause production
costs to change (Kilian 2014), which may ultimately affect variations in
macroeconomic variables. This study empirically examines how fluctuations in oil
price affect macroeconomic variables in the context of net oil-exporting and net
oil-importing countries in Africa. This study draws an inference from few studies,
including Akinsola and Odhiambo (2020), Salisu and Isah (2017), Behmiri and
Manso (2013), and Lescaroux and Mignon (2008). For example, Akinsola and
Odhiambo (2020) studied the asymmetric effect of oil price on the economic
growth of low-income oil-importing countries of Ethiopia, Gambia, Mali,
Mozambique, Senegal, Tanzania, and Uganda. Their finding reveals that
fluctuations in the oil price are insignificant in affecting economic growth in the
short run for countries studied. While the long run relationship between oil price
and macroeconomic variables is significant.
Furthermore, the short-run country coefficients indicate that oil price has a
significant but mixed effect on economic growth. Lescaroux and Mignon (2008)
examined the link between oil price and macroeconomic variables in the context
of net oil-exporting and oil-importing countries. They found a long-run Granger
causality running from oil price to other macroeconomic variables. Equally found
is a short-run causal link between oil price and stock price. This study, therefore,
141
examines the effect of fluctuations in oil price on macroeconomic variables in the
context of net oil-exporting and net oil-importing countries in Africa, conditioned
on some variables including GDP, interest rate, inflation, exchange rate,
unemployment rate, food supply, external debt, current account, and foreign
reserves using panel ARDL model.
Focusing on net oil-exporting and net oil-importing countries in Africa, this study
not only differs from the studies mentioned above by using extend literature
review covering the different oil price shock event and data from 1996𝑞1 to 2016𝑞4
to analyse how asymmetric oil price affect macroeconomic variables but also this
study used scattered diagram to construct a relationship analysis (see figure 5.2
to 5.65) to determine how much influence fluctuations in oil price have on the
variables in net oil exporting countries but also in net oil importing countries in
Africa.
5.4.1 An Overview Panel ARDL Model
As previously mentioned, this study employed a panel ARDL econometric model
in Akinsola and Odhiambo (2020), drawn from the shine et al. (2014) nonlinear
ARDL model. A representation of the dynamic heterogeneous panel data model
suitable for estimating large T panels. The justifications for using the panel ARDL
model is that it simultaneously accounts for the asymmetries and the long-run
and short-run effects of fluctuations in oil price on macroeconomic variables.
However, it is worth noting that this study deals with large T dynamic panels. As
such, the dynamic heterogeneous panel data model is considered suitable for this
study to allow the Pesaran (2007) CD test to capture heterogeneity in the
macroeconomic variable index. Also, the Pool Mean Group (PMG) estimator is used
to capture the heterogeneity as it pools and averages the coefficients, unlike the
142
Mean Group (MG) estimator that estimates N time-series regression and averages
the coefficients (Blackburne and Frank 2007). The PMG estimator computes the
individual variables' response to fluctuations in oil price in the asymmetric
scenarios of both long-run and short-run categories of the group of net oil-
exporting and net oil-importing countries. The advantage of using panel ARDL over
other estimation model is well detailed in chapter 6 section 6.9.1.
The steps before using panel ARDL model estimation process is detailed as
follows: The first step is to determine the stationarity of the variables using the
unit root test. The second step is optimal lag length selection. The third step is an
estimation of the co-integration relationship among the variables. Furthermore,
the fourth step is data estimation using the panel ARDL model, where the
asymmetric relationship is determined.
5.4.2 An Overview of Panel Unit Root Test
This study considers five different types of panel unit root tests to check the
stationarity level of an individual variable. They include Hadri (2000), Levin et al.
(2002), Im et al. (2003), and Fisher-ADF and Fisher PP. The Fisher ADP and Fisher
PP are non-parametric unit-root tests (Maddala and Wu, 1999). The assumptions
of the individual panel unit root techniques are explained in table 5.2.
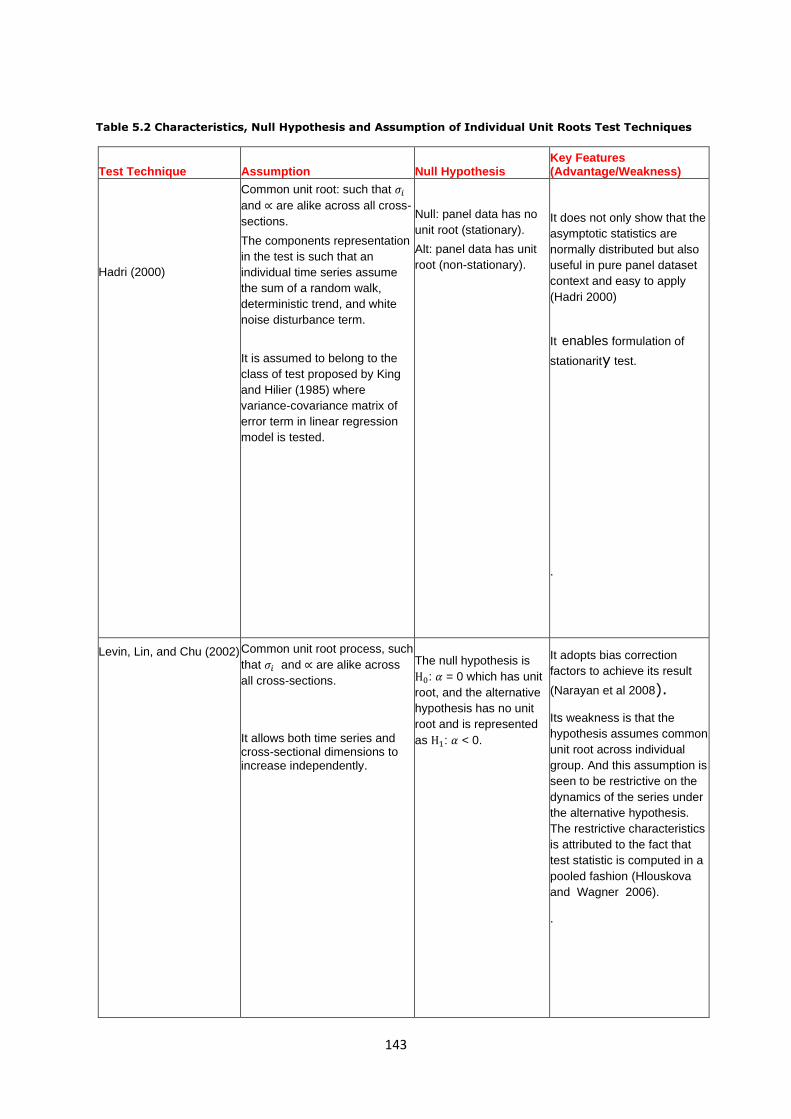
143
Table 5.2 Characteristics, Null Hypothesis and Assumption of Individual Unit Roots Test Techniques
Test Technique Assumption Null Hypothesis Key Features (Advantage/Weakness)
Hadri (2000)
Common unit root: such that 𝜎𝑖
and ∝ are alike across all cross-
sections.
The components representation
in the test is such that an
individual time series assume
the sum of a random walk,
deterministic trend, and white
noise disturbance term.
It is assumed to belong to the
class of test proposed by King
and Hilier (1985) where
variance-covariance matrix of
error term in linear regression
model is tested.
Null: panel data has no
unit root (stationary).
Alt: panel data has unit
root (non-stationary).
It does not only show that the
asymptotic statistics are
normally distributed but also
useful in pure panel dataset
context and easy to apply
(Hadri 2000)
It enables formulation of
stationarity test.
.
Levin, Lin, and Chu (2002)
Common unit root process, such
that 𝜎𝑖 and ∝ are alike across
all cross-sections.
It allows both time series and cross-sectional dimensions to increase independently.
The null hypothesis is
Η0: 𝛼 = 0 which has unit
root, and the alternative
hypothesis has no unit
root and is represented
as Η1: 𝛼 < 0.
It adopts bias correction
factors to achieve its result
(Narayan et al 2008).
Its weakness is that the
hypothesis assumes common
unit root across individual
group. And this assumption is
seen to be restrictive on the
dynamics of the series under
the alternative hypothesis.
The restrictive characteristics
is attributed to the fact that
test statistic is computed in a
pooled fashion (Hlouskova
and Wagner 2006).
.
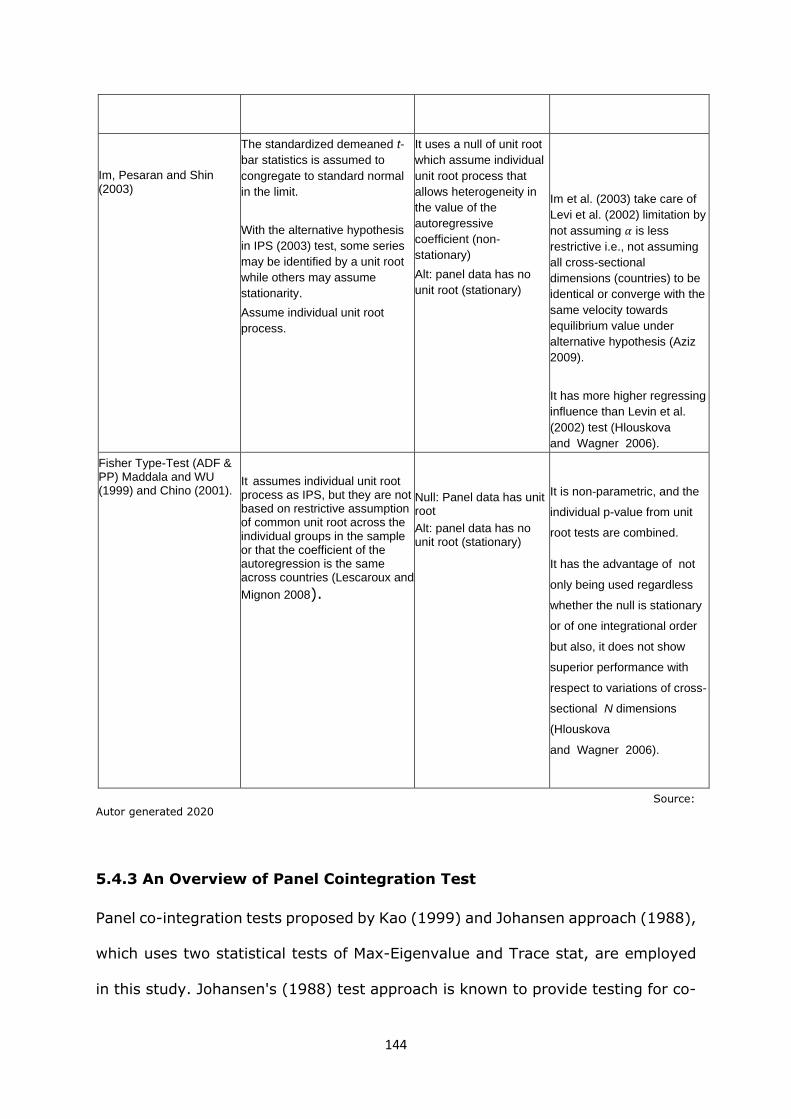
144
Im, Pesaran and Shin (2003)
The standardized demeaned t-
bar statistics is assumed to
congregate to standard normal
in the limit.
With the alternative hypothesis
in IPS (2003) test, some series
may be identified by a unit root
while others may assume
stationarity.
Assume individual unit root
process.
It uses a null of unit root
which assume individual
unit root process that
allows heterogeneity in
the value of the
autoregressive
coefficient (non-
stationary)
Alt: panel data has no
unit root (stationary)
Im et al. (2003) take care of
Levi et al. (2002) limitation by
not assuming 𝛼 is less
restrictive i.e., not assuming
all cross-sectional
dimensions (countries) to be
identical or converge with the
same velocity towards
equilibrium value under
alternative hypothesis (Aziz
2009).
It has more higher regressing
influence than Levin et al.
(2002) test (Hlouskova
and Wagner 2006).
Fisher Type-Test (ADF & PP) Maddala and WU (1999) and Chino (2001).
It assumes individual unit root process as IPS, but they are not based on restrictive assumption of common unit root across the individual groups in the sample or that the coefficient of the autoregression is the same across countries (Lescaroux and
Mignon 2008).
Null: Panel data has unit root
Alt: panel data has no unit root (stationary)
It is non-parametric, and the
individual p-value from unit
root tests are combined.
It has the advantage of not
only being used regardless
whether the null is stationary
or of one integrational order
but also, it does not show
superior performance with
respect to variations of cross-
sectional N dimensions
(Hlouskova
and Wagner 2006).
Source: Autor generated 2020
5.4.3 An Overview of Panel Cointegration Test
Panel co-integration tests proposed by Kao (1999) and Johansen approach (1988),
which uses two statistical tests of Max-Eigenvalue and Trace stat, are employed
in this study. Johansen's (1988) test approach is known to provide testing for co-
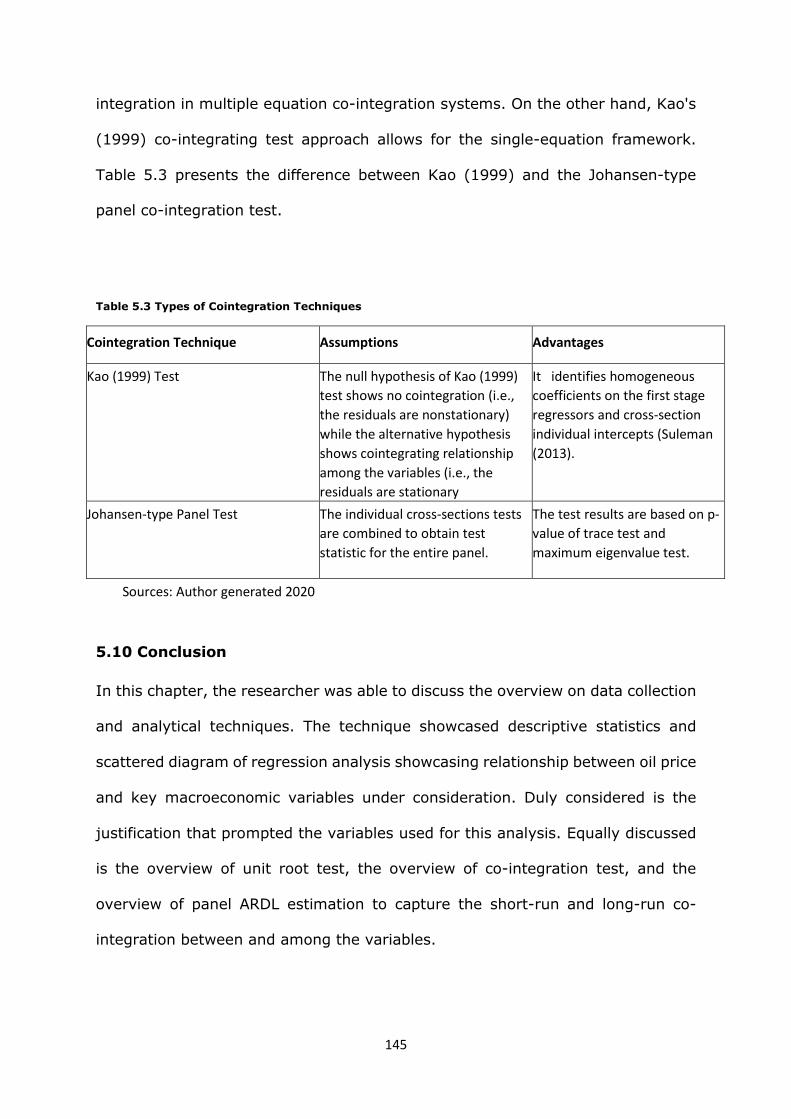
145
integration in multiple equation co-integration systems. On the other hand, Kao's
(1999) co-integrating test approach allows for the single-equation framework.
Table 5.3 presents the difference between Kao (1999) and the Johansen-type
panel co-integration test.
Table 5.3 Types of Cointegration Techniques
Cointegration Technique Assumptions Advantages
Kao (1999) Test
The null hypothesis of Kao (1999)
test shows no cointegration (i.e.,
the residuals are nonstationary)
while the alternative hypothesis
shows cointegrating relationship
among the variables (i.e., the
residuals are stationary
It identifies homogeneous
coefficients on the first stage
regressors and cross-section
individual intercepts (Suleman
(2013).
Johansen-type Panel Test
The individual cross-sections tests
are combined to obtain test
statistic for the entire panel.
The test results are based on p-
value of trace test and
maximum eigenvalue test.
Sources: Author generated 2020
5.10 Conclusion
In this chapter, the researcher was able to discuss the overview on data collection
and analytical techniques. The technique showcased descriptive statistics and
scattered diagram of regression analysis showcasing relationship between oil price
and key macroeconomic variables under consideration. Duly considered is the
justification that prompted the variables used for this analysis. Equally discussed
is the overview of unit root test, the overview of co-integration test, and the
overview of panel ARDL estimation to capture the short-run and long-run co-
integration between and among the variables.
146
However, EViews, a Computer-Assisted Quantitative Data Analysis software, was
used to analyse the quantitative data obtained from International Monetary Fund
(IMF) DataStream, Thompson Router DataStream, and Energy Information
Administration (EIA) DataStream. Descriptive and panel estimation was
considered an appropriate statistical technique to describe the data and analyse
the short-run and long-run relationship among the variables. The optimal lag
length selection was determined including co-integration test analysis of the
variables.
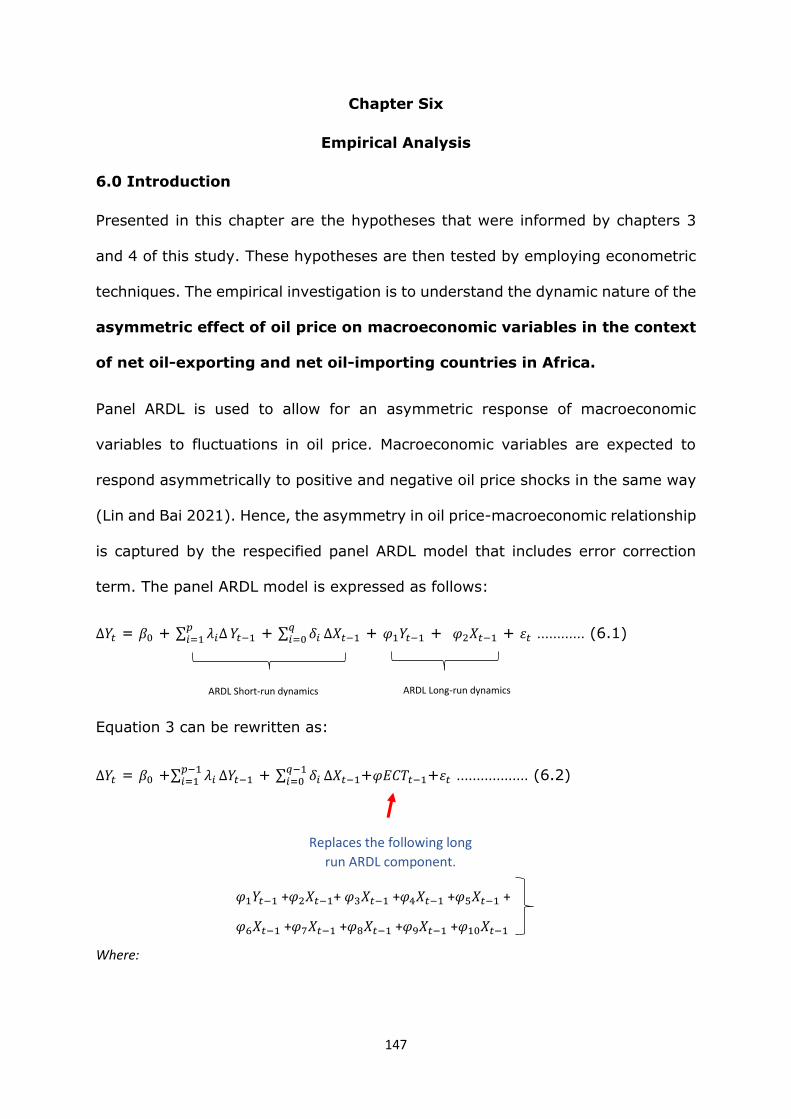
147
Chapter Six
Empirical Analysis
6.0 Introduction
Presented in this chapter are the hypotheses that were informed by chapters 3
and 4 of this study. These hypotheses are then tested by employing econometric
techniques. The empirical investigation is to understand the dynamic nature of the
asymmetric effect of oil price on macroeconomic variables in the context
of net oil-exporting and net oil-importing countries in Africa.
Panel ARDL is used to allow for an asymmetric response of macroeconomic
variables to fluctuations in oil price. Macroeconomic variables are expected to
respond asymmetrically to positive and negative oil price shocks in the same way
(Lin and Bai 2021). Hence, the asymmetry in oil price-macroeconomic relationship
is captured by the respecified panel ARDL model that includes error correction
term. The panel ARDL model is expressed as follows:
∆𝑌𝑡 = 𝛽0 + ∑ 𝜆𝑖∆𝑝𝑖=1 𝑌𝑡−1 + ∑ 𝛿𝑖
𝑞𝑖=0 ∆𝑋𝑡−1 + 𝜑1𝑌𝑡−1 + 𝜑2𝑋𝑡−1 + 휀𝑡 ………… (6.1)
Equation 3 can be rewritten as:
Δ𝑌𝑡 = 𝛽0 +∑ 𝜆𝑖𝑝−1𝑖=1 Δ𝑌𝑡−1 + ∑ 𝛿𝑖
𝑞−1𝑖=0 Δ𝑋𝑡−1+𝜑𝐸𝐶𝑇𝑡−1+휀𝑡 ……………… (6.2)
Where:
ARDL Short-run dynamics ARDL Long-run dynamics
Replaces the following long
run ARDL component.
𝜑1𝑌𝑡−1 +𝜑2𝑋𝑡−1+ 𝜑3𝑋𝑡−1 +𝜑4𝑋𝑡−1 +𝜑5𝑋𝑡−1 +
𝜑6𝑋𝑡−1 +𝜑7𝑋𝑡−1 +𝜑8𝑋𝑡−1 +𝜑9𝑋𝑡−1 +𝜑10𝑋𝑡−1
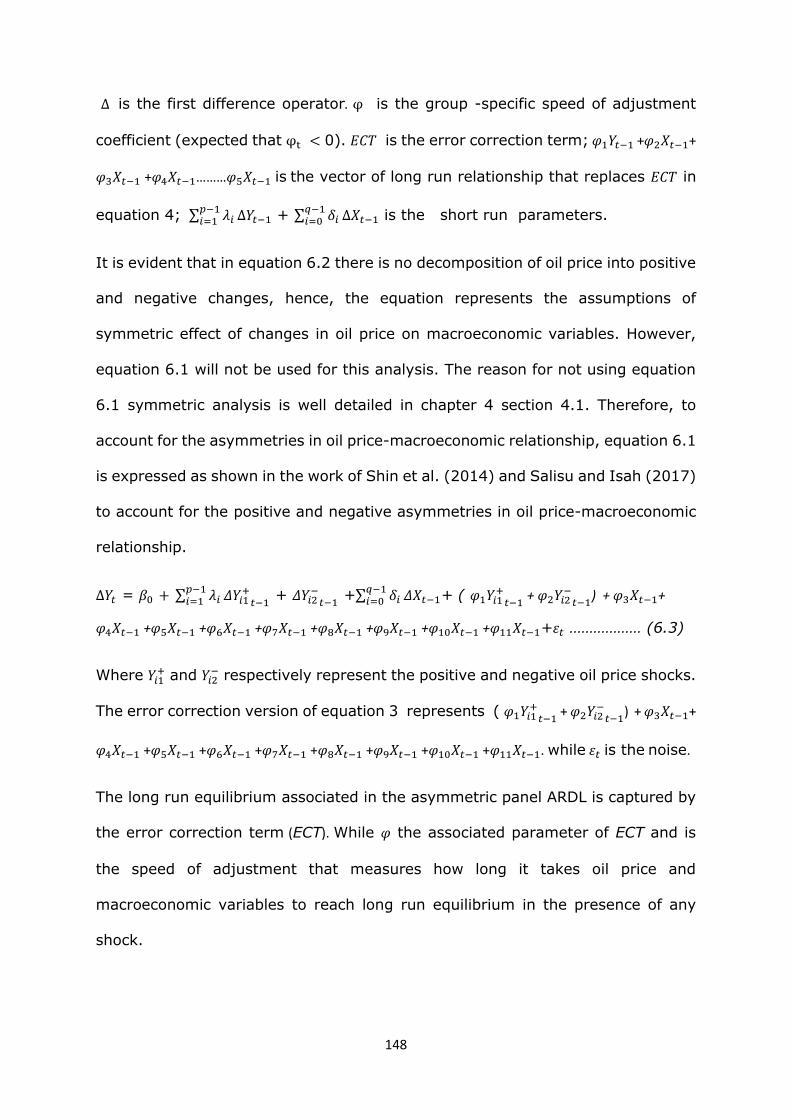
148
∆ is the first difference operator. φ is the group -specific speed of adjustment
coefficient (expected that φt < 0). 𝐸𝐶𝑇 is the error correction term; 𝜑1𝑌𝑡−1 +𝜑2𝑋𝑡−1+
𝜑3𝑋𝑡−1 +𝜑4𝑋𝑡−1………𝜑5𝑋𝑡−1 is the vector of long run relationship that replaces 𝐸𝐶𝑇 in
equation 4; ∑ 𝜆𝑖𝑝−1𝑖=1 Δ𝑌𝑡−1 + ∑ 𝛿𝑖
𝑞−1𝑖=0 Δ𝑋𝑡−1 is the short run parameters.
It is evident that in equation 6.2 there is no decomposition of oil price into positive
and negative changes, hence, the equation represents the assumptions of
symmetric effect of changes in oil price on macroeconomic variables. However,
equation 6.1 will not be used for this analysis. The reason for not using equation
6.1 symmetric analysis is well detailed in chapter 4 section 4.1. Therefore, to
account for the asymmetries in oil price-macroeconomic relationship, equation 6.1
is expressed as shown in the work of Shin et al. (2014) and Salisu and Isah (2017)
to account for the positive and negative asymmetries in oil price-macroeconomic
relationship.
∆𝑌𝑡 = 𝛽0 + ∑ 𝜆𝑖𝑝−1𝑖=1 𝛥𝑌𝑖1
+𝑡−1
+ 𝛥𝑌𝑖2−
𝑡−1 +∑ 𝛿𝑖
𝑞−1𝑖=0 𝛥𝑋𝑡−1+ ( 𝜑1𝑌𝑖1
+𝑡−1
+ 𝜑2𝑌𝑖2−
𝑡−1) + 𝜑3𝑋𝑡−1+
𝜑4𝑋𝑡−1 +𝜑5𝑋𝑡−1 +𝜑6𝑋𝑡−1 +𝜑7𝑋𝑡−1 +𝜑8𝑋𝑡−1 +𝜑9𝑋𝑡−1 +𝜑10𝑋𝑡−1 +𝜑11𝑋𝑡−1+휀𝑡 ……………… (6.3)
Where 𝑌𝑖1+ and 𝑌𝑖2
− respectively represent the positive and negative oil price shocks.
The error correction version of equation 3 represents ( 𝜑1𝑌𝑖1+
𝑡−1 + 𝜑2𝑌𝑖2
−𝑡−1
) + 𝜑3𝑋𝑡−1+
𝜑4𝑋𝑡−1 +𝜑5𝑋𝑡−1 +𝜑6𝑋𝑡−1 +𝜑7𝑋𝑡−1 +𝜑8𝑋𝑡−1 +𝜑9𝑋𝑡−1 +𝜑10𝑋𝑡−1 +𝜑11𝑋𝑡−1. while 휀𝑡 is the noise.
The long run equilibrium associated in the asymmetric panel ARDL is captured by
the error correction term (ECT). While 𝜑 the associated parameter of ECT and is
the speed of adjustment that measures how long it takes oil price and
macroeconomic variables to reach long run equilibrium in the presence of any
shock.

149
This chapter is organised as follows. Section 6.1 present the descriptive analysis
of the data which describes the properties of the variables. Put forward in section
6.2 is the regression analysis that presented how oil price influence
macroeconomic variables using scattered diagram. In section 6.3, the correlation
matrix is presented by considering the correlation between main variables for
further empirical analysis. While section 6.4 detailed the unit root test Section 6.5
presents the cointegration test analysis. Section 6.6 presents and discusses the
hypotheses linked to the reviewed literature and theoretical framework discussed
in chapters 3 and 4. The results obtained from the econometric analysis are
discussed in section 6.7. Section 6.8 presents the long-run and short-run Granger
Causality test. The chapter summary is presented in section 6.9.
6.1 Descriptive Data Analysis
Given that variables are assumed to have time-series properties, this study
followed the standard procedures to consider both the group and the individual
statistical characteristics of the series, starting with descriptive statistics to
summarize the information meaningfully and provide insight into the individual
and group macroeconomic variables selected for this study.
For example, the mean statistic in tables 6.1 to 6.2 indicates that average foreign
reserves are relatively higher in net oil-exporting and net oil-importing countries
as it appears to be higher than other variables on average. More so, the mean
statistical summary for GDP is relatively the lowest in both net oil-exporting and
net oil-importing countries, with respective mean values of 1.39 and 1.03. Equally
revealed is the statistical quarterly mean log value of global oil price, which is 3.8.
Also, the highest maximum log value among the variables in net oil-exporting
countries is foreign reserves with a log value of 13.86, while the maximum log
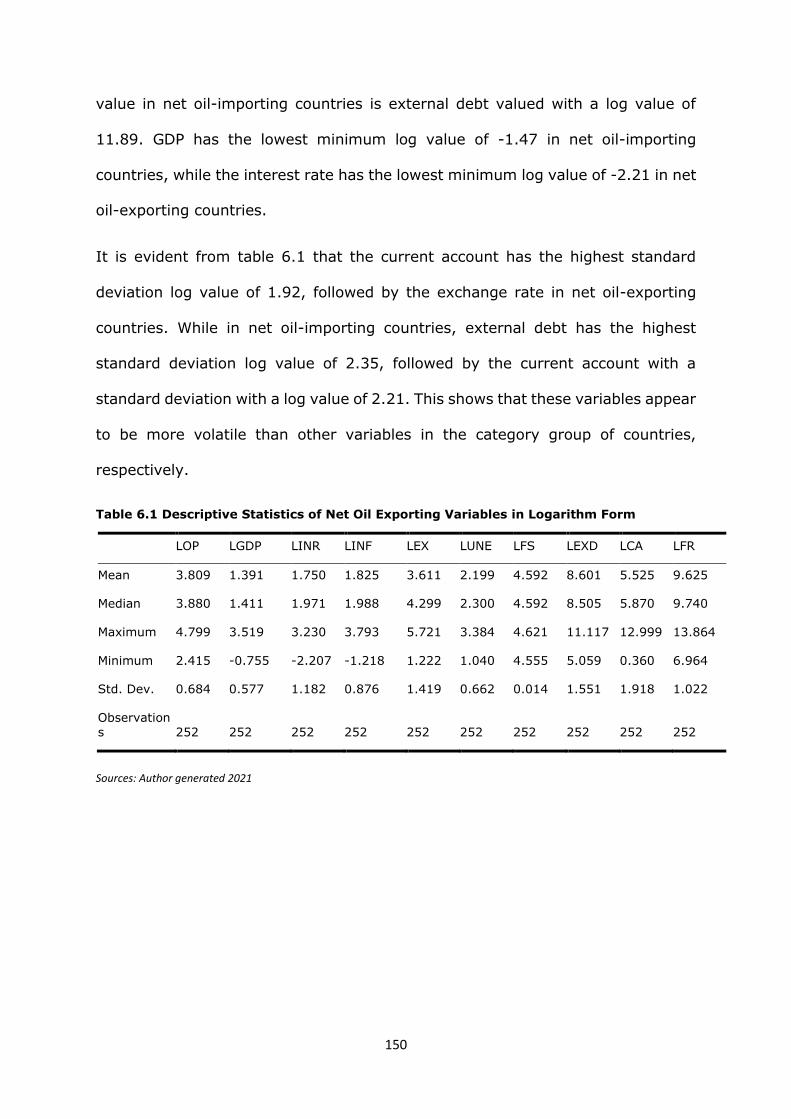
150
value in net oil-importing countries is external debt valued with a log value of
11.89. GDP has the lowest minimum log value of -1.47 in net oil-importing
countries, while the interest rate has the lowest minimum log value of -2.21 in net
oil-exporting countries.
It is evident from table 6.1 that the current account has the highest standard
deviation log value of 1.92, followed by the exchange rate in net oil-exporting
countries. While in net oil-importing countries, external debt has the highest
standard deviation log value of 2.35, followed by the current account with a
standard deviation with a log value of 2.21. This shows that these variables appear
to be more volatile than other variables in the category group of countries,
respectively.
Table 6.1 Descriptive Statistics of Net Oil Exporting Variables in Logarithm Form
LOP LGDP LINR LINF LEX LUNE LFS LEXD LCA LFR
Mean 3.809 1.391 1.750 1.825 3.611 2.199 4.592 8.601 5.525 9.625
Median 3.880 1.411 1.971 1.988 4.299 2.300 4.592 8.505 5.870 9.740
Maximum 4.799 3.519 3.230 3.793 5.721 3.384 4.621 11.117 12.999 13.864
Minimum 2.415 -0.755 -2.207 -1.218 1.222 1.040 4.555 5.059 0.360 6.964
Std. Dev. 0.684 0.577 1.182 0.876 1.419 0.662 0.014 1.551 1.918 1.022
Observations 252 252 252 252 252 252 252 252 252 252
Sources: Author generated 2021
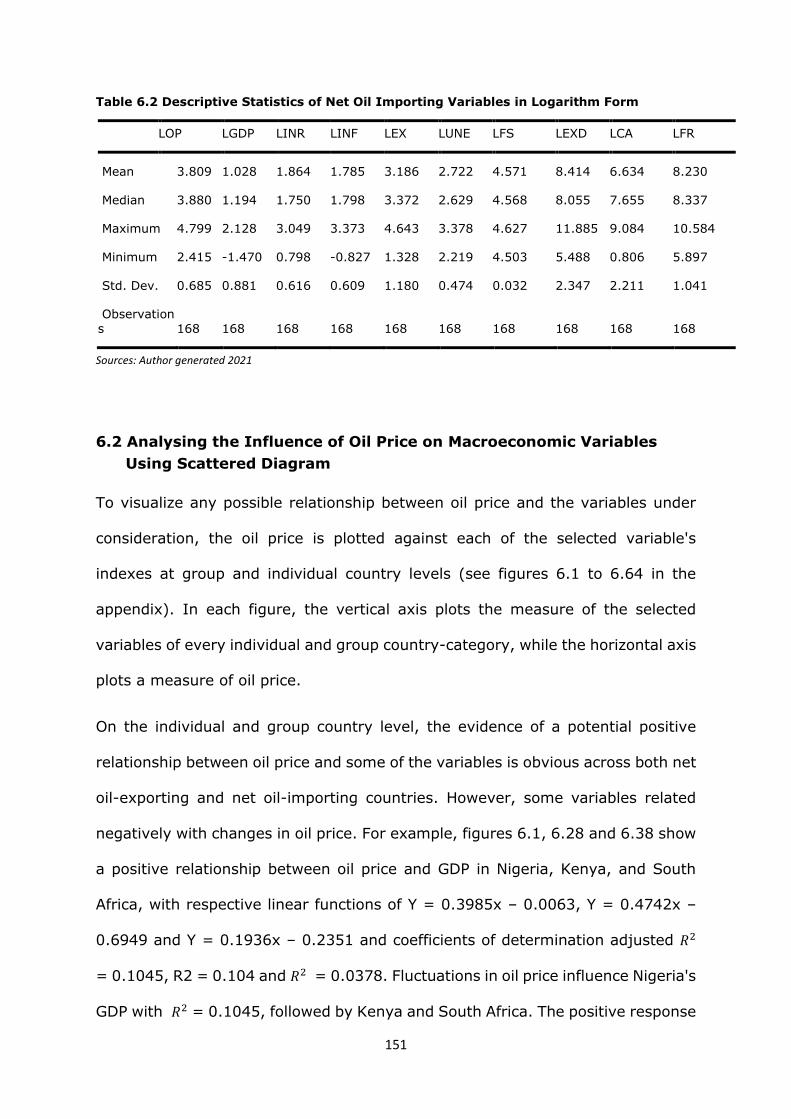
151
Table 6.2 Descriptive Statistics of Net Oil Importing Variables in Logarithm Form
LOP LGDP LINR LINF LEX LUNE LFS LEXD LCA LFR
Mean 3.809 1.028 1.864 1.785 3.186 2.722 4.571 8.414 6.634 8.230
Median 3.880 1.194 1.750 1.798 3.372 2.629 4.568 8.055 7.655 8.337
Maximum 4.799 2.128 3.049 3.373 4.643 3.378 4.627 11.885 9.084 10.584
Minimum 2.415 -1.470 0.798 -0.827 1.328 2.219 4.503 5.488 0.806 5.897
Std. Dev. 0.685 0.881 0.616 0.609 1.180 0.474 0.032 2.347 2.211 1.041
Observation
s 168 168 168 168 168 168 168 168 168 168
Sources: Author generated 2021
6.2 Analysing the Influence of Oil Price on Macroeconomic Variables
Using Scattered Diagram
To visualize any possible relationship between oil price and the variables under
consideration, the oil price is plotted against each of the selected variable's
indexes at group and individual country levels (see figures 6.1 to 6.64 in the
appendix). In each figure, the vertical axis plots the measure of the selected
variables of every individual and group country-category, while the horizontal axis
plots a measure of oil price.
On the individual and group country level, the evidence of a potential positive
relationship between oil price and some of the variables is obvious across both net
oil-exporting and net oil-importing countries. However, some variables related
negatively with changes in oil price. For example, figures 6.1, 6.28 and 6.38 show
a positive relationship between oil price and GDP in Nigeria, Kenya, and South
Africa, with respective linear functions of Υ = 0.3985x – 0.0063, Υ = 0.4742x –
0.6949 and Υ = 0.1936x – 0.2351 and coefficients of determination adjusted 𝑅2
= 0.1045, R2 = 0.104 and 𝑅2 = 0.0378. Fluctuations in oil price influence Nigeria's
GDP with 𝑅2 = 0.1045, followed by Kenya and South Africa. The positive response
152
of GDP to oil price shows that as oil price increases, the GDP growth rate of Nigeria
increases given an increase in economic activities. Oil price positively related with
GDP in Kenya and South Africa despite that they are net oil-importing. This is
consistent with Kibunyi et al. (2018), who attributed the positive relation,
especially in Kenya, to the fact that Kenya imports oil and reexports it to other
countries, including Uganda, South Sudan, and Rwanda.
Oil price negatively influenced GDP in Algeria and Egypt with linear functions of Υ
= -0.1133x + 1.6312 and Υ = -0.1501x + 1.9807 and coefficients of adjusted 𝑅2
= 0.0319 and 𝑅2 = 0.0677, respectively (see figures 6.10 and 6.19). Oil price is
evidenced to have a more negative influence on Egypt's GDP. The negative
influence of oil price on GDP in Algeria and Egypt, even though they are oil
exporters, could be attributed to Dutch Disease syndrome, as Kretzmann and
Nooruddin (2005) explained.
On the group level, fluctuations in oil price evidenced positive relation with GDP
in both net oil-exporting and net oil-importing countries with linear functions of Υ
= 0.0452x + 1.2185 and Υ = 0.3314x + 0.2338 and coefficient of determination
adjusted 𝑅2 = 0.0029 and 𝑅2 = 0.0663, respectively (see figures 6.56 and 6.47).
Fluctuations in the oil price have a more positive influence on GDP in net oil-
importing countries. This result is not only set against the views of Trang et al.
(2017), Fowowe (2014), and Ahmed (2013) but also the theories of reallocation
effect and income transfer, that the impact of fluctuations in oil on net exporting
and net oil-importing countries varies and that fluctuations in oil price have inverse
relationship with GDP in net oil-importing countries (see Lin and Bai 2021; Zhao
et al.2021).

153
Virtually all categories of both groups of countries at individual and group level
evidence a negative relationship between oil price and interest rate. On the
individual country level, Egypt has the highest coefficient of determination
adjusted 𝑅2 value of 0.4954, followed by Kenya with an adjusted 𝑅2 value of
0.2457, Algeria with an adjusted 𝑅2 value of 0.1116, and Nigeria that has the
lowest 𝑅2 value of 0.0006 (see figures 6.2,6.11,6.20,6.29 and 6.38). This is
consistent with the views of Shangle and Solaymani (2020) for Malaysia.
While on the group level, net oil importers' interest rate is influenced more by oil
price with a linear function of Υ = -0.5062x + 3.7915 and coefficient of
determination adjusted 𝑅2 value of 0.3162. Furthermore, the linear function and
coefficient of determination adjusted 𝑅2 value of net oil-exporting countries are Υ
= -0.617x + 4.0994 and 0.1274, respectively (see figures. 6.48 and 6.57). This
result is consistent with the views of Ahmed et al. (2019), Nazlioglu et al. (2019),
and Omolade et al. (2019) that the oil price-interest rate relationship is a function
of the economic structure of countries and their oil dependence.
The influence of fluctuations in oil price on inflation varies within the individual
country level but not on a group country level. The oil price has the greatest
positive influence on Algerian inflation with an adjusted 𝑅2 value of 90107,
followed by Egypt with an adjusted 𝑅2 value of 0.4213 and Kenya having the
lowest positive adjusted 𝑅2 of 0. 281. Nigeria and South Africa's inflation is
negatively influenced by fluctuations in oil price, with Nigeria having the highest
negative impact with an adjusted 𝑅2 of 0.0008 and South Africa with adjusted 𝑅2
= 0.0004 (see figures 6.3, 6.12,6.21,6.30 and 6.39).
On group country levels, fluctuations in oil price related positively with inflations
in both net oil-exporting and net oil-importing countries. However, the influence
154
of oil price on inflation is higher in net oil-importing countries with a coefficient
adjusted 𝑅2 value of 0.0756 while the adjusted 𝑅2 value of net oil exporters is
0.0208 (see figures 6.49 and 6.58). This is consistent with the views of Zakaria et
al. (2021), who concluded a positive relationship between oil price and inflation in
South Africa.
The influence of fluctuations in oil price on the exchange rate is the same for
individual and group country level. On the individual country level, the oil price
has the greatest positive influence on the Egyptian exchange rate with an adjusted
𝑅2 value of 0.434, followed by Nigeria with an adjusted 𝑅2 value of 0.4315 and
Kenya with an adjusted 𝑅2 value of 0.2529. While in Algeria, the exchange rate
is the least on the individual country level with an adjusted 𝑅2 value of 0.1113,
followed by South Africa with an adjusted 𝑅2 value of 0.1574 (see figures
6.4,6.13,6.22,6.31 and 6.40).
The exchange rate of net oil-exporting countries co-moved more positively to
fluctuations in oil price with an adjusted R2 value of 0.0109 than net oil-importing
countries with an adjusted 𝑅2 value of 0.0007 (see figures 6.50 and 6.59). This
indicates that fluctuations in oil price have a more positive influence on net oil-
exporting countries' exchange rates. The positive co-movement between oil price
and exchange rate of these group of countries could be attributed to foreign
exchange rate market intervention to uphold the dynamics of the domestic
currency. This result is against the views of Beckmann et al. (2017) that the effect
of oil price on the exchange rate is not the same for net oil-exporting and net oil-
importing countries.
There is evidence of varying relationship between oil price and unemployment rate
on individual country level. Oil prices positively influence unemployment rate in
155
Nigeria, Egypt, and South Africa. This result is consistent with the views of Nusair
(2020) and Cuestas and Gil-Alana (2018) that oil price and unemployment move
in the same direction in the long run. In contrast, Algerian and Kenyan
unemployment rates are negatively influenced. This result is consistent with the
views of Kocaarshan et al. (2020), who concluded that uncertainty in oil price
shocks has a negative effect on the unemployment rate. The Nigerian
unemployment rate has the highest positive effect with an 𝑅2 value of 0.3609,
followed by Egypt with an 𝑅2 value of 0.1802 and South Africa with an 𝑅2 value
of 0.004. The Algerian unemployment rate has the greatest negative influence
from oil price with an 𝑅2 value of 0.8033, followed by Kenya with an 𝑅2 value of
0.771 (see figures 6.5,6.14,6.23,6.32 and 6.41).
On a group country category, oil price influence on unemployment in both net oil-
exporting and net oil-importing countries is positive.Net oil-exporting countries'
unemployment is influenced more with an 𝑅2 value of 0.02505 to net oil-importing
countries whose 𝑅2 value is 0.0004 (see figures 6.51 and 6.60). This result is
against Van Wijnbergen's (1985) views that co-movement between oil prices and
unemployment varies across counties.
There is evidence of positive relationship between oil price and food supply in
group and individual country levels. On the individual country level, the oil price
has more influence on food supply in Kenya with an 𝑅2 value of 0.9556, followed
by South Africa with an 𝑅2 value of 0.9101 and Nigeria with an 𝑅2 value of 0.8725.
Algerian food supply is the least positively influenced by oil price with an R2 value
of 0.5352, followed by Egypt with an 𝑅2 value of 0.6685 (see figures
6.6,6.15,6.24,6.33 and 6.42). This consistent with views of Baumeister and Kilian
(2014) for U.S.
156
On group country level, oil price positively related with food supply, with net oil-
exporting countries experienced the highest relationship with an 𝑅2 value of
0.4693 compared to net oil-importing countries whose 𝑅2 value is 0.0044 (see
figures 6.52 and 6.61). This result is consistent with Oluwaseyi's (2018) views
that oil price positively influenced average urban food price in Nigeria and supports
Nwoko et al. (2016) that oil prices in oil price relate positively with food price in
Nigeria.
Another pronounced positive association is found between oil price and external
debt at individual and group country levels. The relationship between the variables
is more pronounced in net oil-exporting countries with an 𝑅2 value of 0.1217,
while net oil-importing countries have an 𝑅2 value of 0.0801(see figures 6.53 and
6.62). This evidence is consistent with Kretzmann and Nooruddin (2005) that oil
price increase cause external debt of both net oil-exporting and net oil-importing
countries to rise.
On the individual country level of co-movement between oil price and external
debt, South Africa has the greatest influence with an 𝑅2 value of 0.7569, followed
by Algeria with an 𝑅2 value of 0.6423 and Nigeria 𝑅2 value of 0.528 (see figures
6.7,6.16 and 6.43). The least influenced is Egypt, with an 𝑅2 value of 0.2525,
followed by Kenya with an R2 value of 0.3338 (see figures 6.25 and 6.34).
Furthermore, evidence showed positive relationship between oil price and current
account at individual and group levels. The influence of oil price on the current
account is most substantial in net oil-exporting countries with an 𝑅2 value of
0.1487 compared to net oil-importing countries with an 𝑅2 value of 0.1196 (see
figures 6.54 and 6.63). This finding is against the views of Balli et al. (2021), who
used Russia and China to conclude that shocks in oil price affect the current
157
account balance of net oil-exporting and net oil-importing countries differently.
Supporting this view, Qurat-ul-Ain and Tufail (2013) found that shocks in oil price
improve only the current account for oil-importing countries in the short run but
deteriorate it in the oil-exporting countries. Net oil exporting countries experience
deterioration of current account both in the short run and long run.
While on the individual country level, Egypt's current account related with oil price
more than other countries' current account with an 𝑅2 value of 0.3574, followed
by South Africa with an 𝑅2 value of 0.2572 and Nigeria with an 𝑅2 value of 0.1737
(see figures 6.8, 6.26 and 6.44). The least is Algeria, with an 𝑅2 value of 0.0275,
followed by Kenya with an 𝑅2 value of 0.0968 (6.17 and 6.35). This result is
consistent with the views of Schubert (2014), who opined that, with continuous
increase in oil price, government expenditure gradually falls over time, causing
improvement in the current account.
The oil price has the most substantial positive influence on foreign reserves of net
oil-exporting countries with an 𝑅2 value of 0.4154 compared to net oil-importing
countries whose 𝑅2 value is 0.139 (see figures 6.55 and 6.64). On the individual
country level, oil price influenced the foreign reserves of Algeria more with an 𝑅2
value of 0.7146, followed by Kenya with an 𝑅2 value of 0.6869 and Nigeria with
an 𝑅2 value of 0.588 (see 6.9, 6.18 and 6.36). The least influenced is South Africa,
with an 𝑅2 value of 0.0052, followed by Egypt with an 𝑅2 value of 0.0318 (6.27
and 6.46). This result is against the views of Tiwari et al. (2014) that shocks at oil
prices have negative predictive power over foreign reserves in India.
6.3 Panel Unit Root Test Result
The relevant variables are subjected to a panel unit root test to determine the
stationarity of data considering the heterogeneity of panel data with large T time

158
dimensions and cross-sectional N dimensions. The results of the panel unit root
tests are shown in table 6.3.
This study found that only a series of GDP and inflation are stationary at level and
are integrated of order zero I (0) in both net oil-exporting and net oil-importing
countries. The series of interest rate, current account, and foreign reserves are
stationary at level and are integrated of order zero I (0) in net oil-exporting
economies. While the series of oil price, exchange rate, unemployment rate, food
supply, and external debt are stationary at 1st difference, hence, integrated of
order one I (1) in both net oil-exporting and net oil-importing economies. The
interest rate, current account, and foreign reserves are stationary at 1st difference
and integrated of order one I (1) in net oil-importing economies. Given that the
variables are either integrated of order zero I (0) or integrated of order one I (1)
in both groups of net oil-exporting and net oil-importing countries has reaffirmed
the appropriateness of the choice of panel ARDL model as a preferred analytical
framework in the context of this study.
Conclusively, the stationarity results from the five different test methods suggest
a possible long-run correlational relationship among the variables. This study
estimated a co-integration test using panel co-integration tests of Kao (1999) and
Johansen's (1988) to reaffirm this relationship. However, before carrying out the
co-integration test, the underlying optimal lag length of the panel ARDL model is
determined. In the next section, the optimal lag length selection is presented.
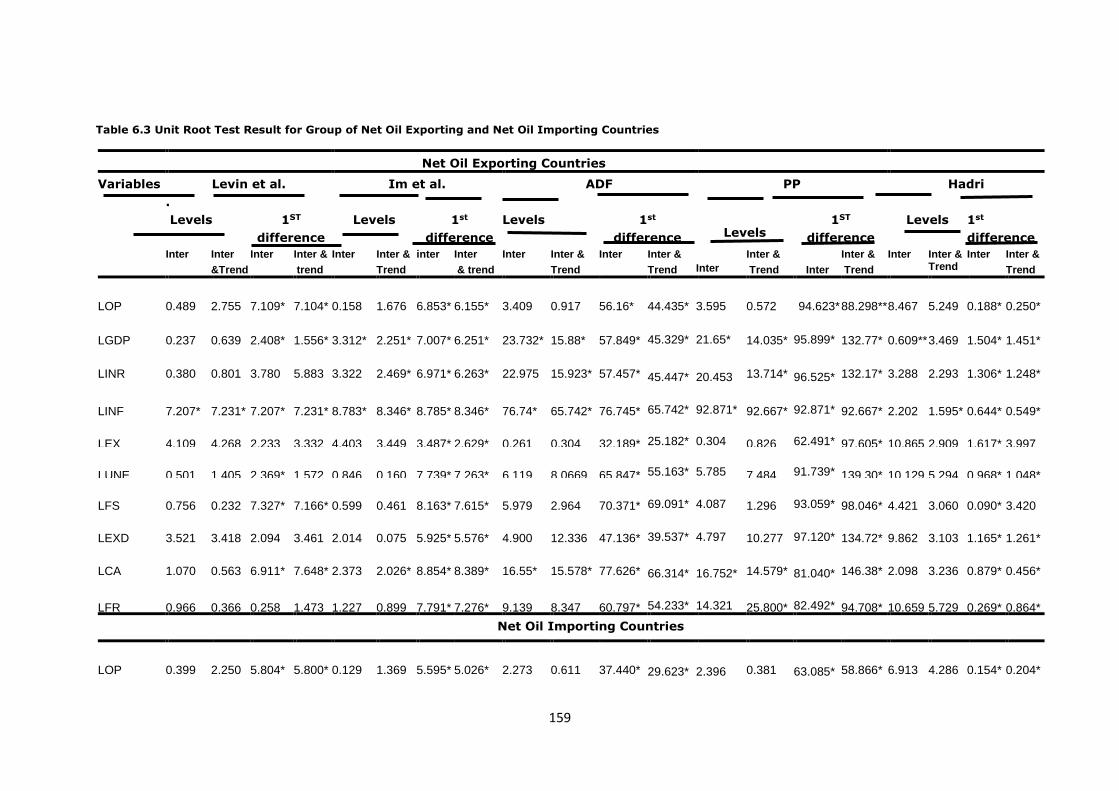
159
Table 6.3 Unit Root Test Result for Group of Net Oil Exporting and Net Oil Importing Countries
Net Oil Exporting Countries
Variables Levin et al.
.
Im et al. ADF PP
Hadri
Levels 1ST
difference
Levels 1st
difference
Levels 1st
difference Levels 1ST
difference
Levels 1st
difference
Inter Inter
&Trend
Inter Inter &
trend
Inter Inter &
Trend
inter Inter
& trend
Inter Inter &
Trend
Inter Inter &
Trend Inter
Inter &
Trend Inter
Inter &
Trend
Inter Inter & Trend
Inter Inter &
Trend
LOP
0.489
2.755
7.109*
7.104*
0.158
1.676
6.853*
6.155*
3.409
0.917
56.16* 44.435* 3.595
0.572 94.623*
88.298**
8.467
5.249
0.188*
0.250*
LGDP
0.237
0.639
2.408*
1.556*
3.312*
2.251*
7.007*
6.251*
23.732*
15.88*
57.849* 45.329* 21.65*
14.035* 95.899*
132.77*
0.609**
3.469
1.504*
1.451*
LINR
0.380
0.801
3.780
5.883
3.322
2.469*
6.971*
6.263*
22.975
15.923*
57.457* 45.447* 20.453
13.714* 96.525*
132.17*
3.288
2.293
1.306*
1.248*
LINF
7.207*
7.231*
7.207*
7.231*
8.783*
8.346*
8.785*
8.346*
76.74*
65.742*
76.745* 65.742* 92.871*
92.667* 92.871*
92.667*
2.202
1.595*
0.644*
0.549*
LEX
4.109
4.268
2.233
3.332
4.403
3.449
3.487*
2.629*
0.261
0.304
32.189* 25.182* 0.304
0.826 62.491*
97.605*
10.865
2.909
1.617*
3.997
LUNE
0.501
1.405
2.369*
1.572
0.846
0.160
7.739*
7.263*
6.119
8.0669
65.847* 55.163* 5.785
7.484 91.739*
139.30*
10.129
5.294
0.968*
1.048*
LFS
0.756
0.232
7.327*
7.166*
0.599
0.461
8.163*
7.615*
5.979
2.964
70.371* 69.091* 4.087
1.296 93.059*
98.046*
4.421
3.060
0.090*
3.420
LEXD
3.521
3.418
2.094
3.461
2.014
0.075
5.925*
5.576*
4.900
12.336
47.136* 39.537* 4.797
10.277 97.120*
134.72*
9.862
3.103
1.165*
1.261*
LCA
1.070
0.563
6.911*
7.648*
2.373
2.026*
8.854*
8.389*
16.55*
15.578*
77.626* 66.314* 16.752*
14.579* 81.040*
146.38*
2.098
3.236
0.879*
0.456*
LFR
0.966
0.366
0.258
1.473
1.227
0.899
7.791*
7.276*
9.139
8.347
60.797* 54.233* 14.321
25.800* 82.492*
94.708*
10.659
5.729
0.269*
0.864*
Net Oil Importing Countries
LOP
0.399
2.250
5.804*
5.800*
0.129
1.369
5.595*
5.026*
2.273
0.611
37.440* 29.623* 2.396
0.381 63.085*
58.866*
6.913
4.286
0.154*
0.204*
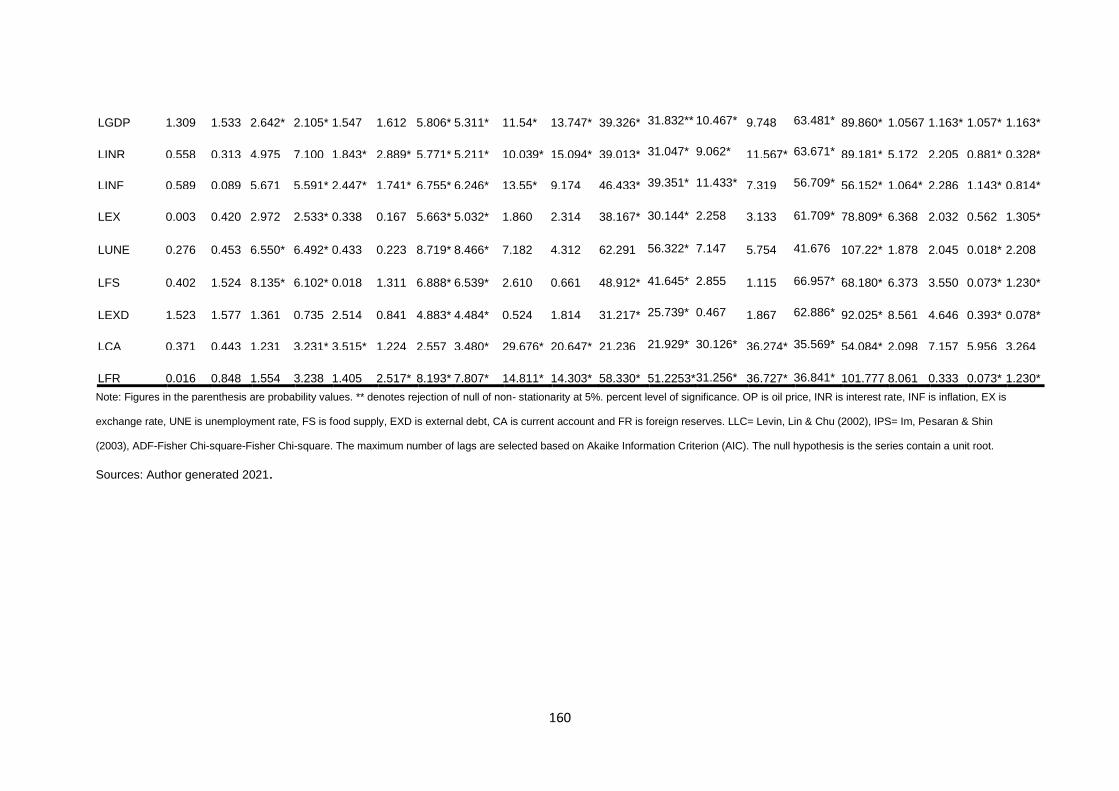
160
LGDP
1.309
1.533
2.642*
2.105*
1.547
1.612
5.806*
5.311*
11.54*
13.747*
39.326* 31.832** 10.467*
9.748 63.481*
89.860*
1.0567*
1.163*
1.057*
1.163*
LINR
0.558
0.313
4.975
7.100
1.843*
2.889*
5.771*
5.211*
10.039*
15.094*
39.013* 31.047* 9.062*
11.567* 63.671*
89.181*
5.172
2.205
0.881*
0.328*
LINF
0.589
0.089
5.671
5.591*
2.447*
1.741*
6.755*1
6.246*
13.55*
9.174
46.433* 39.351* 11.433*
7.319 56.709*
56.152*
1.064*
2.286
1.143*
0.814*
LEX
0.003
0.420
2.972
2.533*
0.338
0.167
5.663*
5.032*
1.860
2.314
38.167* 30.144* 2.258
3.133 61.709*
78.809*
6.368
2.032
0.562
1.305*
LUNE
0.276
0.453
6.550*
6.492*
0.433
0.223
8.719*
8.466*
7.182
4.312
62.291 56.322* 7.147
5.754 41.676
107.22*
1.878
2.045
0.018*
2.208
LFS
0.402
1.524
8.135*
6.102*
0.018
1.311
6.888*
6.539*
2.610
0.661
48.912* 41.645* 2.855
1.115 66.957*
68.180*
6.373
3.550
0.073*
1.230*
LEXD
1.523
1.577
1.361
0.735
2.514
0.841
4.883*
4.484*
0.524
1.814
31.217* 25.739* 0.467
1.867 62.886*
92.025*
8.561
4.646
0.393*
0.078*
LCA
0.371
0.443
1.231
3.231*
3.515*
1.224
2.557
3.480*
29.676*
20.647*
21.236 21.929* 30.126*
36.274* 35.569*
54.084*
2.098
7.157
5.956
3.264
LFR
0.016
0.848
1.554
3.238
1.405
2.517*
8.193*
7.807*
14.811*
14.303*
58.330*
51.2253* 31.256*
36.727* 36.841*
101.777*
8.061
0.333
0.073*
1.230*
Note: Figures in the parenthesis are probability values. ** denotes rejection of null of non- stationarity at 5%. percent level of significance. OP is oil price, INR is interest rate, INF is inflation, EX is
exchange rate, UNE is unemployment rate, FS is food supply, EXD is external debt, CA is current account and FR is foreign reserves. LLC= Levin, Lin & Chu (2002), IPS= Im, Pesaran & Shin
(2003), ADF-Fisher Chi-square-Fisher Chi-square. The maximum number of lags are selected based on Akaike Information Criterion (AIC). The null hypothesis is the series contain a unit root.
Sources: Author generated 2021.
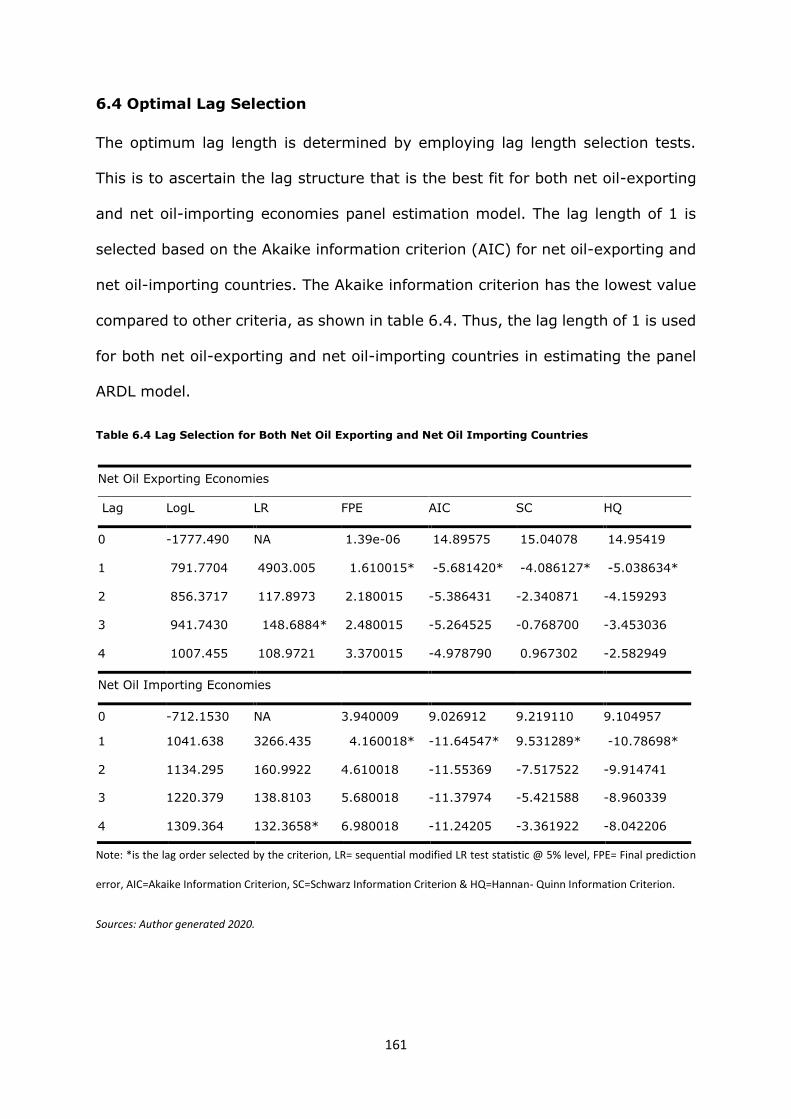
161
6.4 Optimal Lag Selection
The optimum lag length is determined by employing lag length selection tests.
This is to ascertain the lag structure that is the best fit for both net oil-exporting
and net oil-importing economies panel estimation model. The lag length of 1 is
selected based on the Akaike information criterion (AIC) for net oil-exporting and
net oil-importing countries. The Akaike information criterion has the lowest value
compared to other criteria, as shown in table 6.4. Thus, the lag length of 1 is used
for both net oil-exporting and net oil-importing countries in estimating the panel
ARDL model.
Table 6.4 Lag Selection for Both Net Oil Exporting and Net Oil Importing Countries
Net Oil Exporting Economies
Lag LogL LR FPE AIC SC HQ
0 -1777.490 NA 1.39e-06 14.89575 15.04078 14.95419
1 791.7704 4903.005 1.610015* -5.681420* -4.086127* -5.038634*
2 856.3717 117.8973 2.180015 -5.386431 -2.340871 -4.159293
3 941.7430 148.6884* 2.480015 -5.264525 -0.768700 -3.453036
4 1007.455 108.9721 3.370015 -4.978790 0.967302 -2.582949
Net Oil Importing Economies
0 -712.1530 NA 3.940009 9.026912
9.026912
9.219110 9.104957
1 1041.638 3266.435 4.160018* -11.64547* 9.531289* -10.78698*
2 1134.295 160.9922 4.610018 -11.55369 -7.517522 -9.914741
3 1220.379 138.8103 5.680018 -11.37974 -5.421588 -8.960339
4 1309.364 132.3658* 6.980018 -11.24205 -3.361922 -8.042206
Note: *is the lag order selected by the criterion, LR= sequential modified LR test statistic @ 5% level, FPE= Final prediction
error, AIC=Akaike Information Criterion, SC=Schwarz Information Criterion & HQ=Hannan- Quinn Information Criterion.
Sources: Author generated 2020.
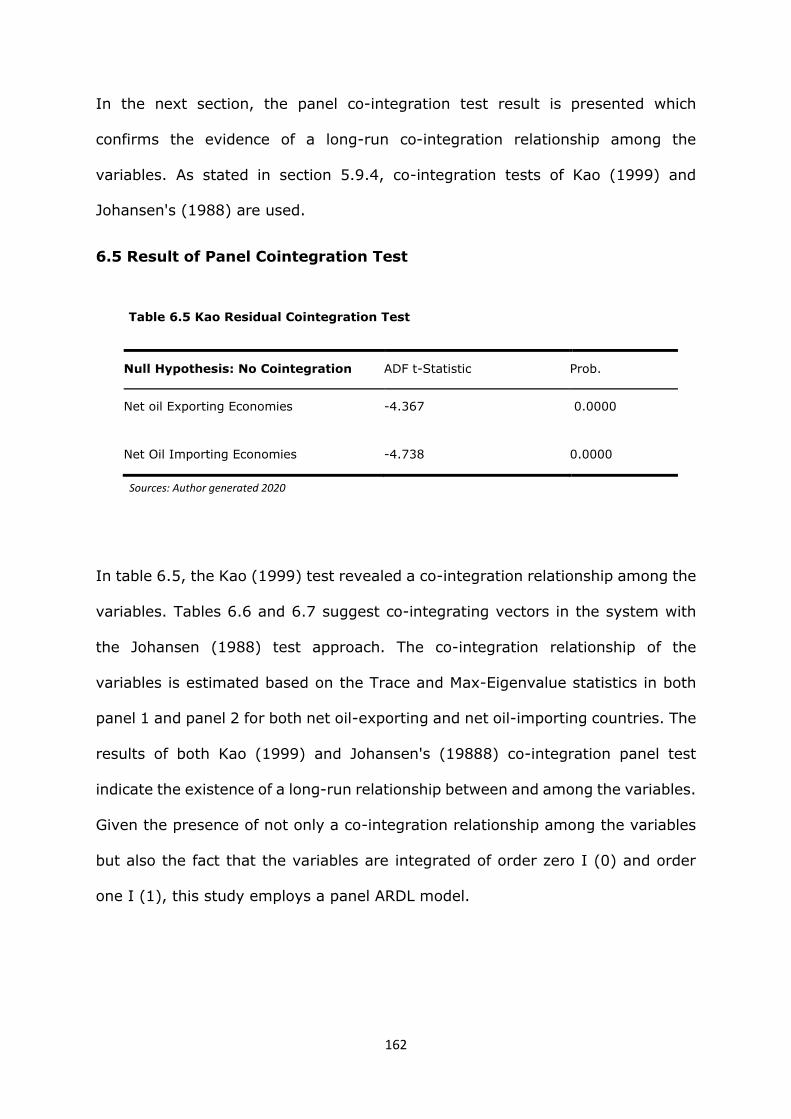
162
In the next section, the panel co-integration test result is presented which
confirms the evidence of a long-run co-integration relationship among the
variables. As stated in section 5.9.4, co-integration tests of Kao (1999) and
Johansen's (1988) are used.
6.5 Result of Panel Cointegration Test
Table 6.5 Kao Residual Cointegration Test
Null Hypothesis: No Cointegration ADF t-Statistic Prob.
Net oil Exporting Economies -4.367 0.0000
Net Oil Importing Economies -4.738 0.0000
Sources: Author generated 2020
In table 6.5, the Kao (1999) test revealed a co-integration relationship among the
variables. Tables 6.6 and 6.7 suggest co-integrating vectors in the system with
the Johansen (1988) test approach. The co-integration relationship of the
variables is estimated based on the Trace and Max-Eigenvalue statistics in both
panel 1 and panel 2 for both net oil-exporting and net oil-importing countries. The
results of both Kao (1999) and Johansen's (19888) co-integration panel test
indicate the existence of a long-run relationship between and among the variables.
Given the presence of not only a co-integration relationship among the variables
but also the fact that the variables are integrated of order zero I (0) and order
one I (1), this study employs a panel ARDL model.
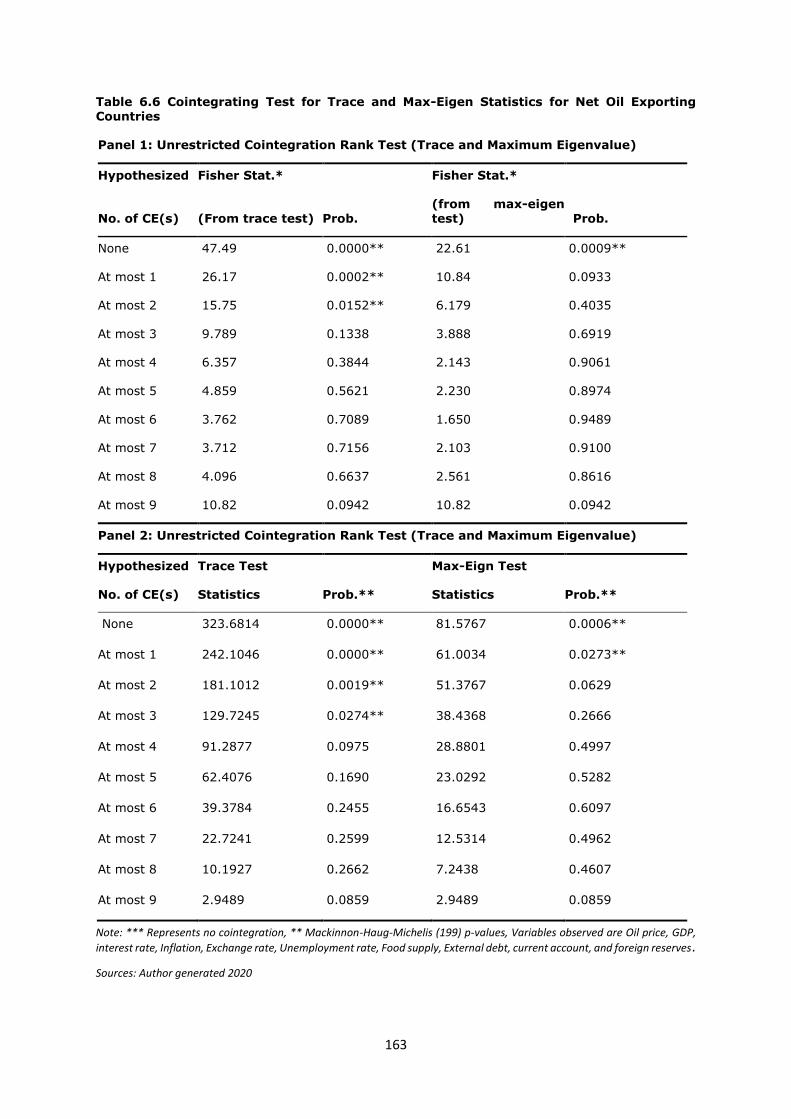
163
Table 6.6 Cointegrating Test for Trace and Max-Eigen Statistics for Net Oil Exporting
Countries
Panel 1: Unrestricted Cointegration Rank Test (Trace and Maximum Eigenvalue)
Hypothesized Fisher Stat.* Fisher Stat.*
No. of CE(s) (From trace test) Prob. (from max-eigen test) Prob.
None 47.49 0.0000** 22.61 0.0009**
At most 1 26.17 0.0002** 10.84 0.0933
At most 2 15.75 0.0152** 6.179 0.4035
At most 3 9.789 0.1338 3.888 0.6919
At most 4 6.357 0.3844 2.143 0.9061
At most 5 4.859 0.5621 2.230 0.8974
At most 6 3.762 0.7089 1.650 0.9489
At most 7 3.712 0.7156 2.103 0.9100
At most 8 4.096 0.6637 2.561 0.8616
At most 9 10.82 0.0942 10.82 0.0942
Panel 2: Unrestricted Cointegration Rank Test (Trace and Maximum Eigenvalue)
Hypothesized Trace Test Max-Eign Test
No. of CE(s) Statistics Prob.** Statistics Prob.**
None 323.6814 0.0000** 81.5767 0.0006**
At most 1 242.1046 0.0000** 61.0034 0.0273**
At most 2 181.1012 0.0019** 51.3767 0.0629
At most 3 129.7245 0.0274** 38.4368 0.2666
At most 4 91.2877 0.0975 28.8801 0.4997
At most 5 62.4076 0.1690 23.0292 0.5282
At most 6 39.3784 0.2455 16.6543 0.6097
At most 7 22.7241 0.2599 12.5314 0.4962
At most 8 10.1927 0.2662 7.2438 0.4607
At most 9 2.9489 0.0859 2.9489 0.0859
Note: *** Represents no cointegration, ** Mackinnon-Haug-Michelis (199) p-values, Variables observed are Oil price, GDP,
interest rate, Inflation, Exchange rate, Unemployment rate, Food supply, External debt, current account, and foreign reserves.
Sources: Author generated 2020
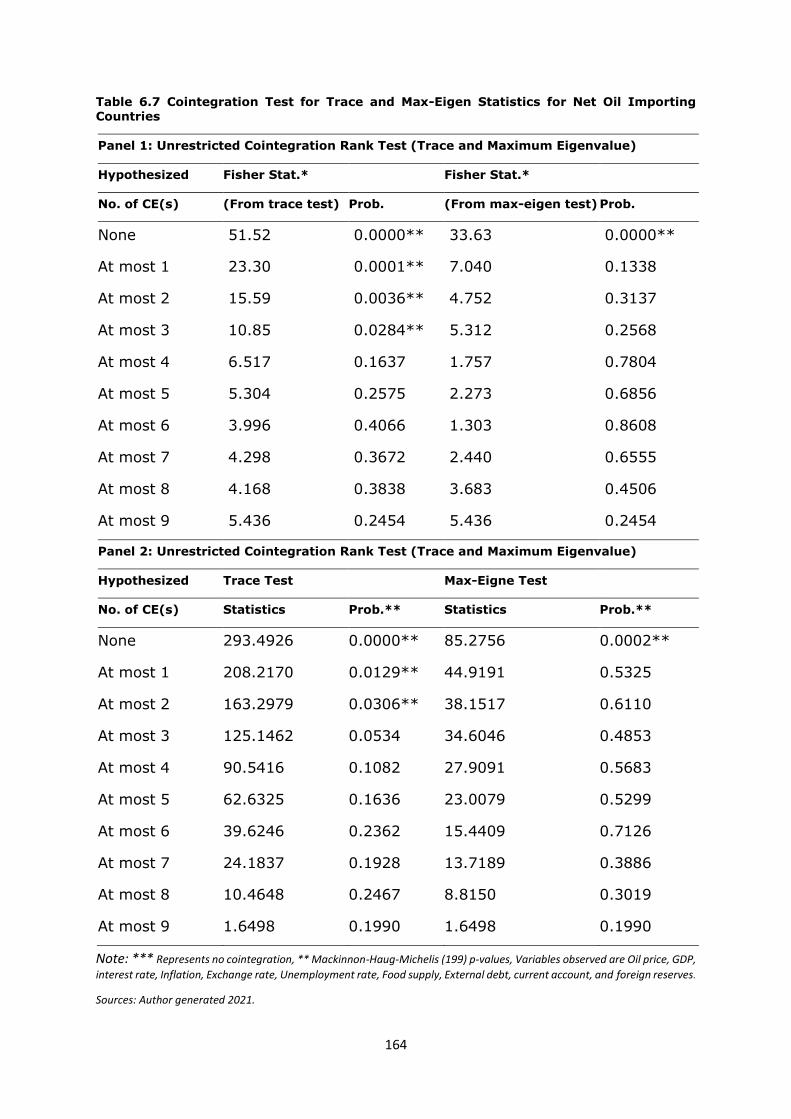
164
Table 6.7 Cointegration Test for Trace and Max-Eigen Statistics for Net Oil Importing
Countries
Panel 1: Unrestricted Cointegration Rank Test (Trace and Maximum Eigenvalue)
Hypothesized Fisher Stat.* Fisher Stat.*
No. of CE(s) (From trace test) Prob. (From max-eigen test) Prob.
None 51.52 0.0000** 33.63 0.0000**
At most 1 23.30 0.0001** 7.040 0.1338
At most 2 15.59 0.0036** 4.752 0.3137
At most 3 10.85 0.0284** 5.312 0.2568
At most 4 6.517 0.1637 1.757 0.7804
At most 5 5.304 0.2575 2.273 0.6856
At most 6 3.996 0.4066 1.303 0.8608
At most 7 4.298 0.3672 2.440 0.6555
At most 8 4.168 0.3838 3.683 0.4506
At most 9 5.436 0.2454 5.436 0.2454
Panel 2: Unrestricted Cointegration Rank Test (Trace and Maximum Eigenvalue)
Hypothesized Trace Test Max-Eigne Test
No. of CE(s) Statistics Prob.** Statistics Prob.**
None 293.4926 0.0000** 85.2756 0.0002**
At most 1 208.2170 0.0129** 44.9191 0.5325
At most 2 163.2979 0.0306** 38.1517 0.6110
At most 3 125.1462 0.0534 34.6046 0.4853
At most 4 90.5416 0.1082 27.9091 0.5683
At most 5 62.6325 0.1636 23.0079 0.5299
At most 6 39.6246 0.2362 15.4409 0.7126
At most 7 24.1837 0.1928 13.7189 0.3886
At most 8 10.4648 0.2467 8.8150 0.3019
At most 9 1.6498 0.1990 1.6498 0.1990
Note: *** Represents no cointegration, ** Mackinnon-Haug-Michelis (199) p-values, Variables observed are Oil price, GDP,
interest rate, Inflation, Exchange rate, Unemployment rate, Food supply, External debt, current account, and foreign reserves.
Sources: Author generated 2021.
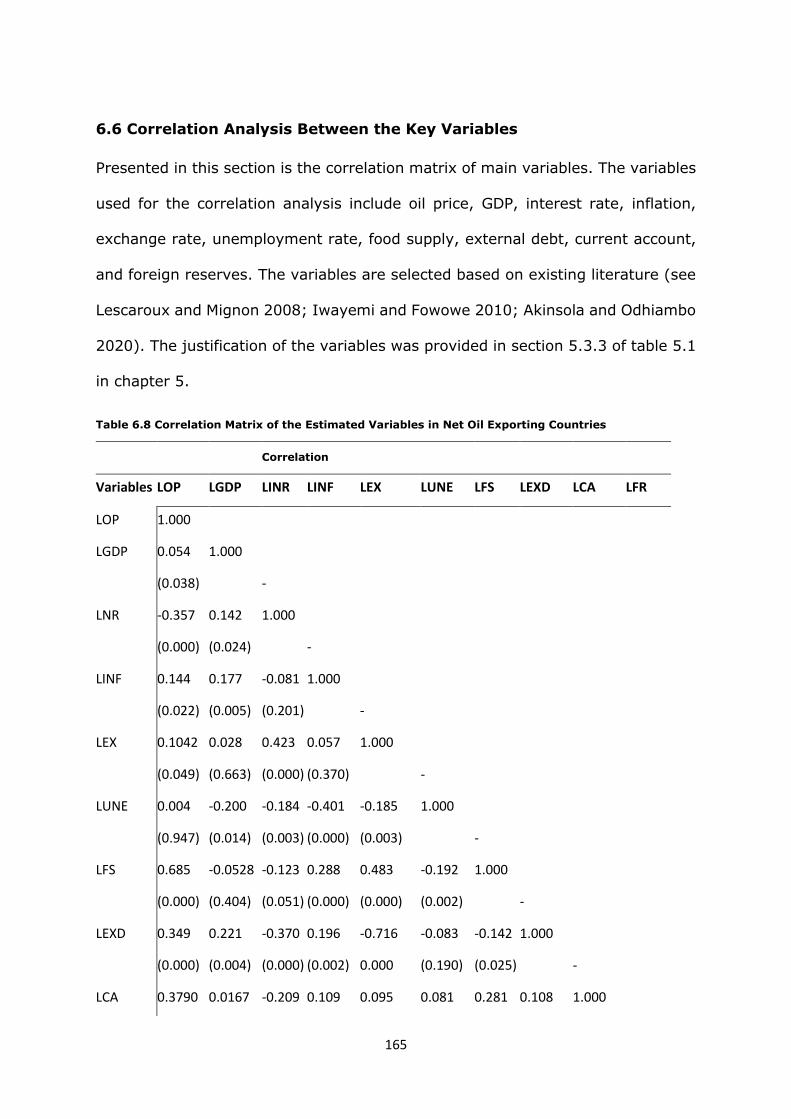
165
6.6 Correlation Analysis Between the Key Variables
Presented in this section is the correlation matrix of main variables. The variables
used for the correlation analysis include oil price, GDP, interest rate, inflation,
exchange rate, unemployment rate, food supply, external debt, current account,
and foreign reserves. The variables are selected based on existing literature (see
Lescaroux and Mignon 2008; Iwayemi and Fowowe 2010; Akinsola and Odhiambo
2020). The justification of the variables was provided in section 5.3.3 of table 5.1
in chapter 5.
Table 6.8 Correlation Matrix of the Estimated Variables in Net Oil Exporting Countries
Correlation
Variables LOP LGDP LINR LINF LEX LUNE LFS LEXD LCA LFR
LOP 1.000
LGDP 0.054 1.000
(0.038) -
LNR -0.357 0.142 1.000
(0.000) (0.024) -
LINF 0.144 0.177 -0.081 1.000
(0.022) (0.005) (0.201) -
LEX 0.1042 0.028 0.423 0.057 1.000
(0.049) (0.663) (0.000) (0.370) -
LUNE 0.004 -0.200 -0.184 -0.401 -0.185 1.000
(0.947) (0.014) (0.003) (0.000) (0.003) -
LFS 0.685 -0.0528 -0.123 0.288 0.483 -0.192 1.000
(0.000) (0.404) (0.051) (0.000) (0.000) (0.002) -
LEXD 0.349 0.221 -0.370 0.196 -0.716 -0.083 -0.142 1.000
(0.000) (0.004) (0.000) (0.002) 0.000 (0.190) (0.025) -
LCA 0.3790 0.0167 -0.209 0.109 0.095 0.081 0.281 0.108 1.000
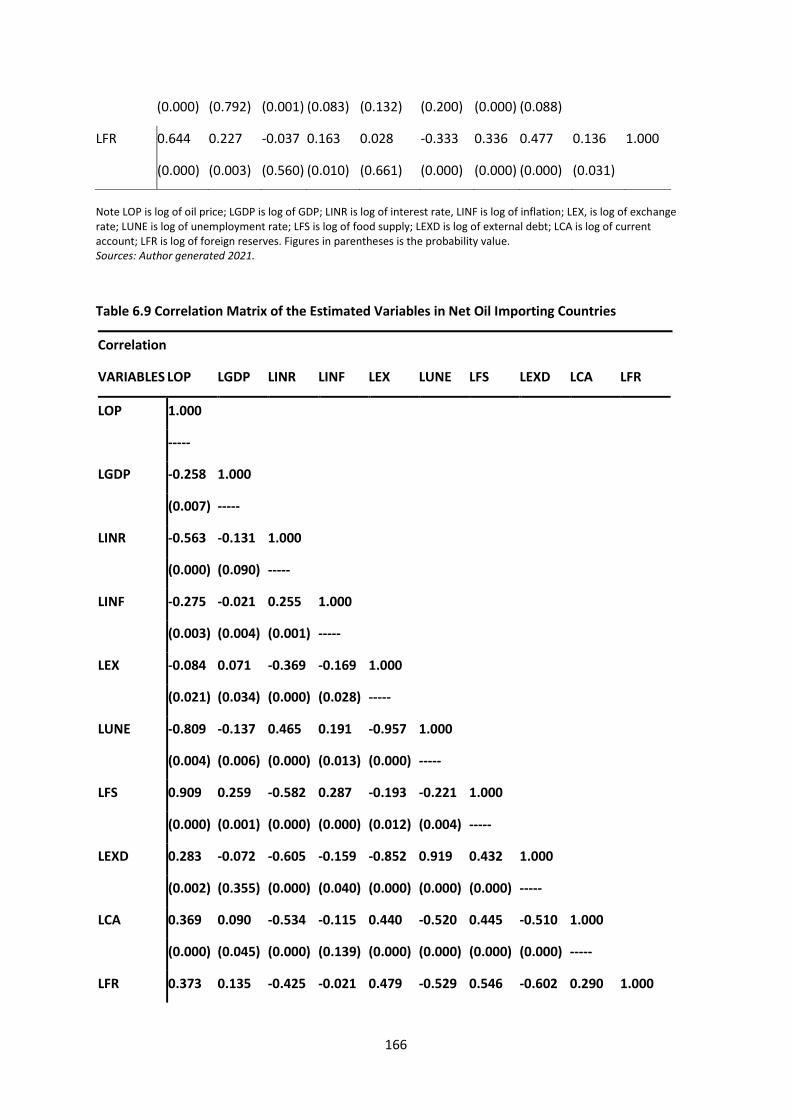
166
Note LOP is log of oil price; LGDP is log of GDP; LINR is log of interest rate, LINF is log of inflation; LEX, is log of exchange rate; LUNE is log of unemployment rate; LFS is log of food supply; LEXD is log of external debt; LCA is log of current account; LFR is log of foreign reserves. Figures in parentheses is the probability value. Sources: Author generated 2021.
Table 6.9 Correlation Matrix of the Estimated Variables in Net Oil Importing Countries
Correlation
VARIABLES LOP LGDP LINR LINF LEX LUNE LFS LEXD LCA LFR
LOP 1.000
-----
LGDP -0.258 1.000
(0.007) -----
LINR -0.563 -0.131 1.000
(0.000) (0.090) -----
LINF -0.275 -0.021 0.255 1.000
(0.003) (0.004) (0.001) -----
LEX -0.084 0.071 -0.369 -0.169 1.000
(0.021) (0.034) (0.000) (0.028) -----
LUNE -0.809 -0.137 0.465 0.191 -0.957 1.000
(0.004) (0.006) (0.000) (0.013) (0.000) -----
LFS 0.909 0.259 -0.582 0.287 -0.193 -0.221 1.000
(0.000) (0.001) (0.000) (0.000) (0.012) (0.004) -----
LEXD 0.283 -0.072 -0.605 -0.159 -0.852 0.919 0.432 1.000
(0.002) (0.355) (0.000) (0.040) (0.000) (0.000) (0.000) -----
LCA 0.369 0.090 -0.534 -0.115 0.440 -0.520 0.445 -0.510 1.000
(0.000) (0.045) (0.000) (0.139) (0.000) (0.000) (0.000) (0.000) -----
LFR 0.373 0.135 -0.425 -0.021 0.479 -0.529 0.546 -0.602 0.290 1.000
(0.000) (0.792) (0.001) (0.083) (0.132) (0.200) (0.000) (0.088)
LFR 0.644 0.227 -0.037 0.163 0.028 -0.333 0.336 0.477 0.136 1.000
(0.000) (0.003) (0.560) (0.010) (0.661) (0.000) (0.000) (0.000) (0.031)
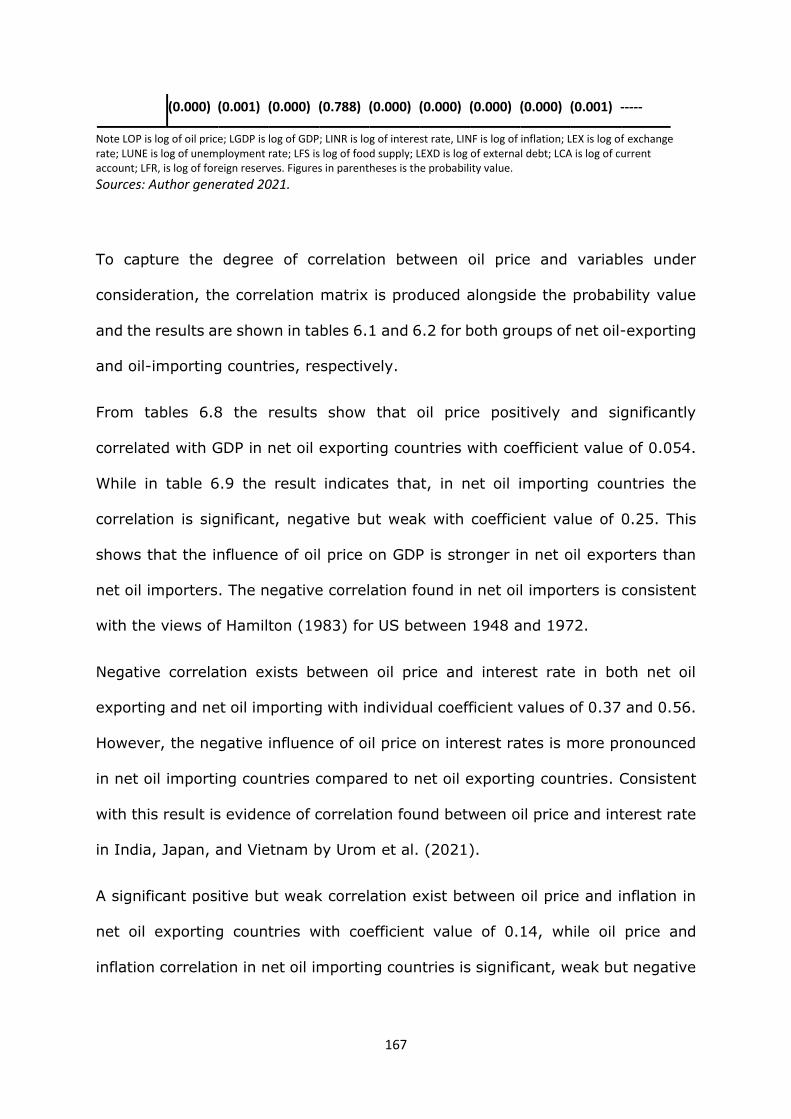
167
(0.000) (0.001) (0.000) (0.788) (0.000) (0.000) (0.000) (0.000) (0.001) -----
Note LOP is log of oil price; LGDP is log of GDP; LINR is log of interest rate, LINF is log of inflation; LEX is log of exchange rate; LUNE is log of unemployment rate; LFS is log of food supply; LEXD is log of external debt; LCA is log of current account; LFR, is log of foreign reserves. Figures in parentheses is the probability value. Sources: Author generated 2021.
To capture the degree of correlation between oil price and variables under
consideration, the correlation matrix is produced alongside the probability value
and the results are shown in tables 6.1 and 6.2 for both groups of net oil-exporting
and oil-importing countries, respectively.
From tables 6.8 the results show that oil price positively and significantly
correlated with GDP in net oil exporting countries with coefficient value of 0.054.
While in table 6.9 the result indicates that, in net oil importing countries the
correlation is significant, negative but weak with coefficient value of 0.25. This
shows that the influence of oil price on GDP is stronger in net oil exporters than
net oil importers. The negative correlation found in net oil importers is consistent
with the views of Hamilton (1983) for US between 1948 and 1972.
Negative correlation exists between oil price and interest rate in both net oil
exporting and net oil importing with individual coefficient values of 0.37 and 0.56.
However, the negative influence of oil price on interest rates is more pronounced
in net oil importing countries compared to net oil exporting countries. Consistent
with this result is evidence of correlation found between oil price and interest rate
in India, Japan, and Vietnam by Urom et al. (2021).
A significant positive but weak correlation exist between oil price and inflation in
net oil exporting countries with coefficient value of 0.14, while oil price and
inflation correlation in net oil importing countries is significant, weak but negative
168
with coefficient value of 0.28 This result is consistent with Su et al. (2020) who
identified correlation between oil price and inflation in Venezuela.
Oil price correlated positively and significantly with exchange rate with coefficient
value of 0.104 in net oil exporting countries but negative and significant in net oil
importing countries with coefficient value of 0.84. The correlation analysis
between oil price and exchange rate shows that exchange rates appreciate in net
oil exporting countries while it depreciates in net oil importing countries. This
supports expectation of income transfer theoretical framework and transmission
mechanism of terms of trade discussed in chapter 4 section 4.3.3. This result is
consistent with the views of Wang et al. ‘s (2020) who evidenced the existence of
correlation between oil price and real exchange rate in China.
Oil price insignificantly correlated with unemployment rates in net oil exporting
countries, while the correlation is strong and negative in net oil importing countries
with coefficient value of 0.81. The result of correlation between oil price and
unemployment rate in net oil importing countries is consistent with the expectation
of theoretical framework of reallocation effect discussed in chapter 4 section 4.3.1,
But the finding in net oil exporting countries is against Cheratian et al.’s (2019)
evidence for Kuwait, United Arab Emirate and Syria.
Oil price drive very strong significant positive correlation with food supply in both
net oil exporting and net oil importing countries with individual coefficient values
of 0.69 and 0.91. However, oil price seems to be more significantly correlated with
food supply in net oil importing countries more than in net oil exporting countries.
The explanation of the strong correlation between oil price and food supply can be
linked to the expectation of real business cycle theory (see chapter 4 section 4.3.4
169
for more detailed discussions). Furthermore, the result is consistent with evidence
of Zingbagba et al. (2020) in São Paulo.
Oil price correlated significantly and positively with external debt in both net oil
exporting and net oil importing countries with individual coefficient values of 0.35
and 0.28. The correlation between oil price and external debt is higher in net oil
exporting countries more than in net oil importing countries. This could be due to
oil exporters leveraging oil wealth to gain access to international capital and the
dramatic increased spending with hope of continued higher oil earnings
(Kretzmann and Nooruddin 2005; Onigbinde et al.2014).
Also, the correlation between oil price and current account is higher in net oil
exporting countries with coefficient value of 0.38 compared to net oil importing
countries whose coefficient value is 0.36. This finding is line with the evidence of
Allegret et al. (2014) that oil price correlate more with current accounts of
countries that have poor developed financial system.
Finally, there is significant positive correlation between oil price and foreign
reserves in both net oil exporting and net oil importing countries. However, the
correlation between oil price and foreign reserves is greater in net oil exporting
countries with coefficient value of 0.64 compared to net oil importing countries
whose coefficient value is 0.37. This shows that net oil exporting countries have
more understanding of the opportunity cost and benefits of holding foreign
reserves compared to oil importers (Oyeniran and Alamu 2020). This result is
consistent with the evidence of Khan et al. (2021) that significant positive
correlation exists between oil price and foreign reserves in Saudi Arabi.
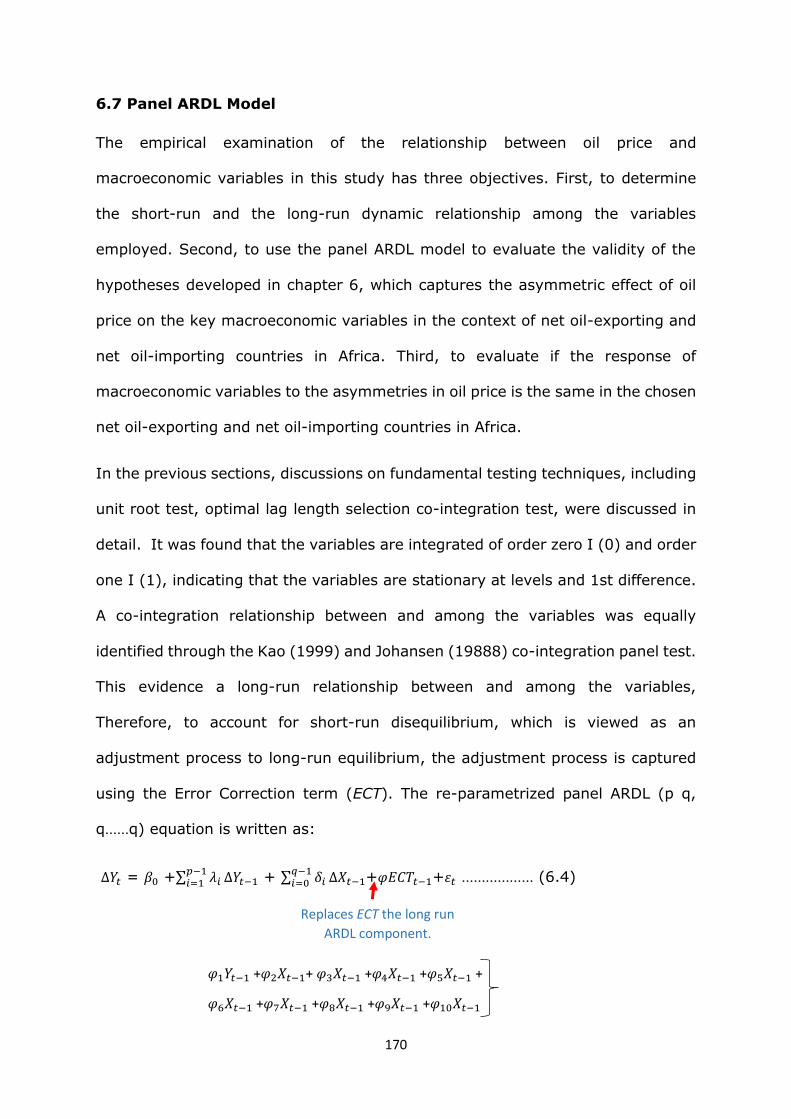
170
6.7 Panel ARDL Model
The empirical examination of the relationship between oil price and
macroeconomic variables in this study has three objectives. First, to determine
the short-run and the long-run dynamic relationship among the variables
employed. Second, to use the panel ARDL model to evaluate the validity of the
hypotheses developed in chapter 6, which captures the asymmetric effect of oil
price on the key macroeconomic variables in the context of net oil-exporting and
net oil-importing countries in Africa. Third, to evaluate if the response of
macroeconomic variables to the asymmetries in oil price is the same in the chosen
net oil-exporting and net oil-importing countries in Africa.
In the previous sections, discussions on fundamental testing techniques, including
unit root test, optimal lag length selection co-integration test, were discussed in
detail. It was found that the variables are integrated of order zero I (0) and order
one I (1), indicating that the variables are stationary at levels and 1st difference.
A co-integration relationship between and among the variables was equally
identified through the Kao (1999) and Johansen (19888) co-integration panel test.
This evidence a long-run relationship between and among the variables,
Therefore, to account for short-run disequilibrium, which is viewed as an
adjustment process to long-run equilibrium, the adjustment process is captured
using the Error Correction term (ECT). The re-parametrized panel ARDL (p q,
q……q) equation is written as:
Δ𝑌𝑡 = 𝛽0 +∑ 𝜆𝑖𝑝−1𝑖=1 Δ𝑌𝑡−1 + ∑ 𝛿𝑖
𝑞−1𝑖=0 Δ𝑋𝑡−1+𝜑𝐸𝐶𝑇𝑡−1+휀𝑡 ……………… (6.4)
Replaces ECT the long run
ARDL component.
𝜑1𝑌𝑡−1 +𝜑2𝑋𝑡−1+ 𝜑3𝑋𝑡−1 +𝜑4𝑋𝑡−1 +𝜑5𝑋𝑡−1 +
𝜑6𝑋𝑡−1 +𝜑7𝑋𝑡−1 +𝜑8𝑋𝑡−1 +𝜑9𝑋𝑡−1 +𝜑10𝑋𝑡−1
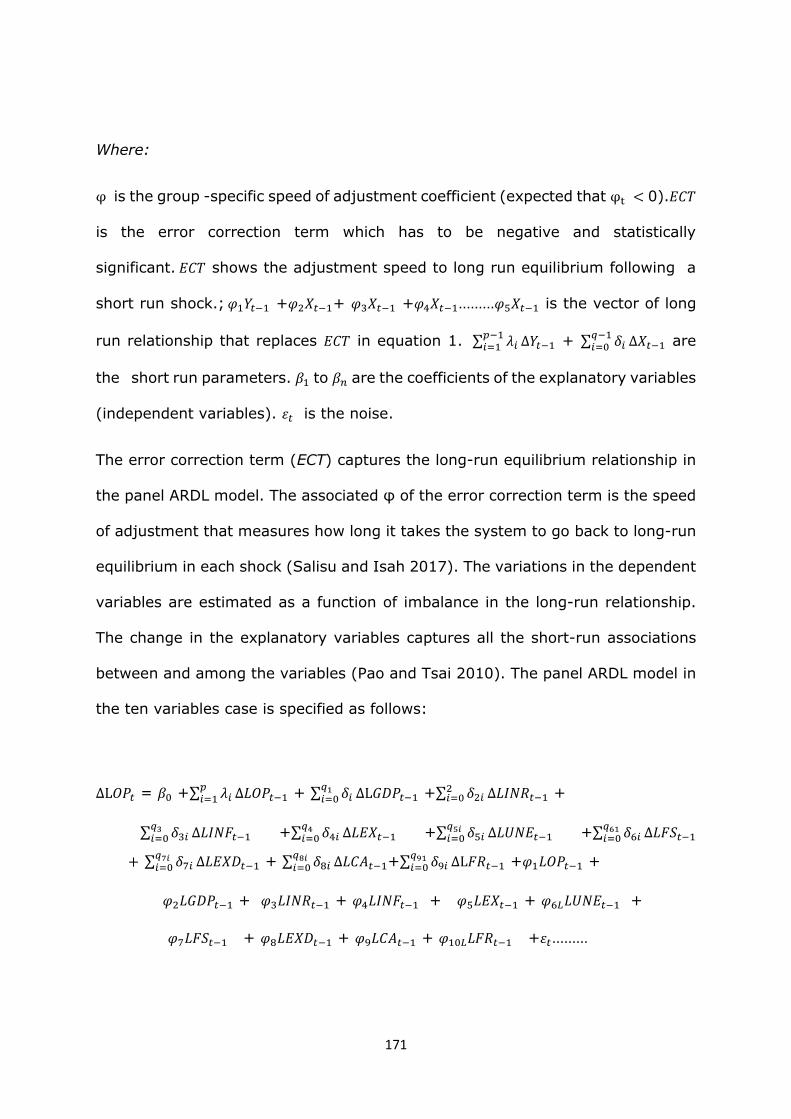
171
Where:
φ is the group -specific speed of adjustment coefficient (expected that φt < 0).𝐸𝐶𝑇
is the error correction term which has to be negative and statistically
significant. 𝐸𝐶𝑇 shows the adjustment speed to long run equilibrium following a
short run shock.; 𝜑1𝑌𝑡−1 +𝜑2𝑋𝑡−1+ 𝜑3𝑋𝑡−1 +𝜑4𝑋𝑡−1………𝜑5𝑋𝑡−1 is the vector of long
run relationship that replaces 𝐸𝐶𝑇 in equation 1. ∑ 𝜆𝑖𝑝−1𝑖=1 Δ𝑌𝑡−1 + ∑ 𝛿𝑖
𝑞−1𝑖=0 Δ𝑋𝑡−1 are
the short run parameters. 𝛽1 to 𝛽𝑛 are the coefficients of the explanatory variables
(independent variables). 휀𝑡 is the noise.
The error correction term (ECT) captures the long-run equilibrium relationship in
the panel ARDL model. The associated φ of the error correction term is the speed
of adjustment that measures how long it takes the system to go back to long-run
equilibrium in each shock (Salisu and Isah 2017). The variations in the dependent
variables are estimated as a function of imbalance in the long-run relationship.
The change in the explanatory variables captures all the short-run associations
between and among the variables (Pao and Tsai 2010). The panel ARDL model in
the ten variables case is specified as follows:
ΔL𝑂𝑃𝑡 = 𝛽0 +∑ 𝜆𝑖𝑝𝑖=1 Δ𝐿𝑂𝑃𝑡−1 + ∑ 𝛿𝑖
𝑞1𝑖=0 ΔL𝐺𝐷𝑃𝑡−1 +∑ 𝛿2𝑖
2𝑖=0 Δ𝐿𝐼𝑁𝑅𝑡−1 +
∑ 𝛿3𝑖𝑞3𝑖=0 Δ𝐿𝐼𝑁𝐹𝑡−1 +∑ 𝛿4𝑖
𝑞4𝑖=0 Δ𝐿𝐸𝑋𝑡−1 +∑ 𝛿5𝑖
𝑞5𝑖𝑖=0 Δ𝐿𝑈𝑁𝐸𝑡−1 +∑ 𝛿6𝑖
𝑞61𝑖=0 Δ𝐿𝐹𝑆𝑡−1
+ ∑ 𝛿7𝑖𝑞7𝑖𝑖=0 Δ𝐿𝐸𝑋𝐷𝑡−1 + ∑ 𝛿8𝑖
𝑞8𝑖𝑖=0 Δ𝐿𝐶𝐴𝑡−1+∑ 𝛿9𝑖
𝑞91𝑖=0 ΔL𝐹𝑅𝑡−1 +𝜑1𝐿𝑂𝑃𝑡−1 +
𝜑2𝐿𝐺𝐷𝑃𝑡−1 + 𝜑3𝐿𝐼𝑁𝑅𝑡−1 + 𝜑4𝐿𝐼𝑁𝐹𝑡−1 + 𝜑5𝐿𝐸𝑋𝑡−1 + 𝜑6𝐿𝐿𝑈𝑁𝐸𝑡−1 +
𝜑7𝐿𝐹𝑆𝑡−1 + 𝜑8𝐿𝐸𝑋𝐷𝑡−1 + 𝜑9𝐿𝐶𝐴𝑡−1 + 𝜑10𝐿𝐿𝐹𝑅𝑡−1 +휀𝑡………
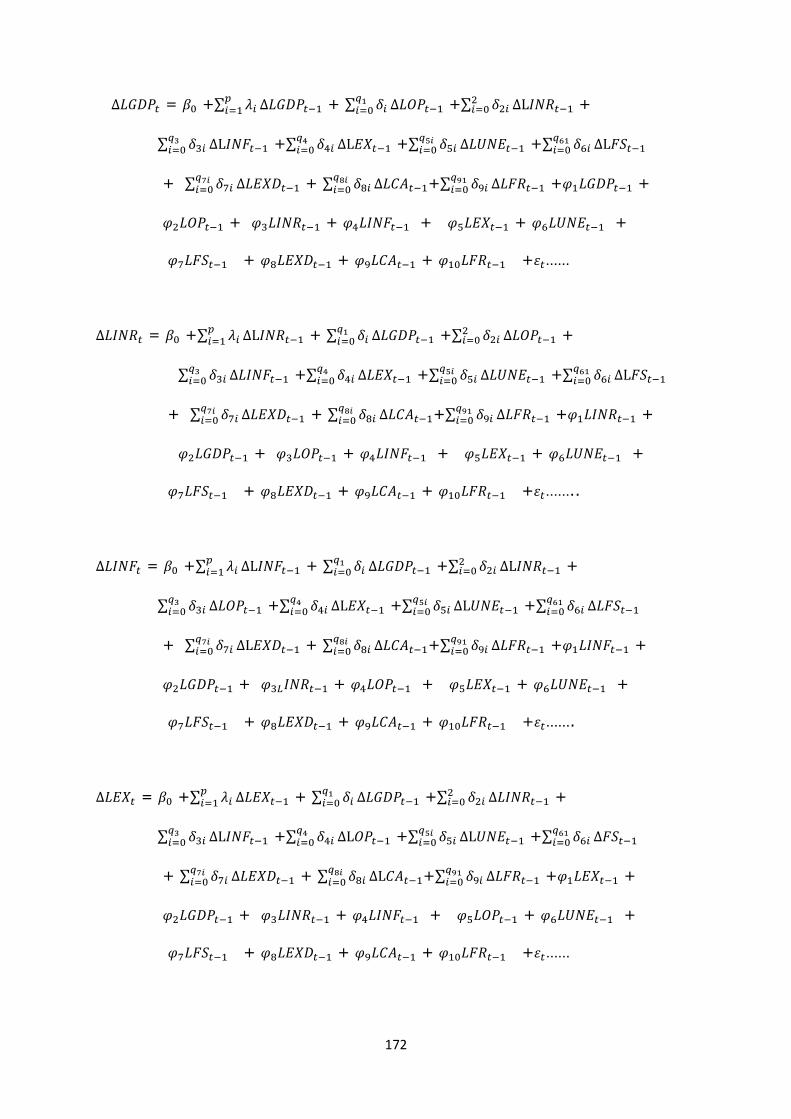
172
Δ𝐿𝐺𝐷𝑃𝑡 = 𝛽0 +∑ 𝜆𝑖𝑝𝑖=1 Δ𝐿𝐺𝐷𝑃𝑡−1 + ∑ 𝛿𝑖
𝑞1𝑖=0 Δ𝐿𝑂𝑃𝑡−1 +∑ 𝛿2𝑖
2𝑖=0 ΔL𝐼𝑁𝑅𝑡−1 +
∑ 𝛿3𝑖𝑞3𝑖=0 ΔL𝐼𝑁𝐹𝑡−1 +∑ 𝛿4𝑖
𝑞4𝑖=0 ΔL𝐸𝑋𝑡−1 +∑ 𝛿5𝑖
𝑞5𝑖𝑖=0 Δ𝐿𝑈𝑁𝐸𝑡−1 +∑ 𝛿6𝑖
𝑞61𝑖=0 ΔL𝐹𝑆𝑡−1
+ ∑ 𝛿7𝑖𝑞7𝑖𝑖=0 Δ𝐿𝐸𝑋𝐷𝑡−1 + ∑ 𝛿8𝑖
𝑞8𝑖𝑖=0 Δ𝐿𝐶𝐴𝑡−1+∑ 𝛿9𝑖
𝑞91𝑖=0 Δ𝐿𝐹𝑅𝑡−1 +𝜑1𝐿𝐺𝐷𝑃𝑡−1 +
𝜑2𝐿𝑂𝑃𝑡−1 + 𝜑3𝐿𝐼𝑁𝑅𝑡−1 + 𝜑4𝐿𝐼𝑁𝐹𝑡−1 + 𝜑5𝐿𝐸𝑋𝑡−1 + 𝜑6𝐿𝑈𝑁𝐸𝑡−1 +
𝜑7𝐿𝐹𝑆𝑡−1 + 𝜑8𝐿𝐸𝑋𝐷𝑡−1 + 𝜑9𝐿𝐶𝐴𝑡−1 + 𝜑10𝐿𝐹𝑅𝑡−1 +휀𝑡……
Δ𝐿𝐼𝑁𝑅𝑡 = 𝛽0 +∑ 𝜆𝑖𝑝𝑖=1 ΔL𝐼𝑁𝑅𝑡−1 + ∑ 𝛿𝑖
𝑞1𝑖=0 Δ𝐿𝐺𝐷𝑃𝑡−1 +∑ 𝛿2𝑖
2𝑖=0 Δ𝐿𝑂𝑃𝑡−1 +
∑ 𝛿3𝑖𝑞3𝑖=0 Δ𝐿𝐼𝑁𝐹𝑡−1 +∑ 𝛿4𝑖
𝑞4𝑖=0 Δ𝐿𝐸𝑋𝑡−1 +∑ 𝛿5𝑖
𝑞5𝑖𝑖=0 Δ𝐿𝑈𝑁𝐸𝑡−1 +∑ 𝛿6𝑖
𝑞61𝑖=0 ΔL𝐹𝑆𝑡−1
+ ∑ 𝛿7𝑖𝑞7𝑖𝑖=0 Δ𝐿𝐸𝑋𝐷𝑡−1 + ∑ 𝛿8𝑖
𝑞8𝑖𝑖=0 Δ𝐿𝐶𝐴𝑡−1+∑ 𝛿9𝑖
𝑞91𝑖=0 Δ𝐿𝐹𝑅𝑡−1 +𝜑1𝐿𝐼𝑁𝑅𝑡−1 +
𝜑2𝐿𝐺𝐷𝑃𝑡−1 + 𝜑3𝐿𝑂𝑃𝑡−1 + 𝜑4𝐿𝐼𝑁𝐹𝑡−1 + 𝜑5𝐿𝐸𝑋𝑡−1 + 𝜑6𝐿𝑈𝑁𝐸𝑡−1 +
𝜑7𝐿𝐹𝑆𝑡−1 + 𝜑8𝐿𝐸𝑋𝐷𝑡−1 + 𝜑9𝐿𝐶𝐴𝑡−1 + 𝜑10𝐿𝐹𝑅𝑡−1 +휀𝑡……..
Δ𝐿𝐼𝑁𝐹𝑡 = 𝛽0 +∑ 𝜆𝑖𝑝𝑖=1 ΔL𝐼𝑁𝐹𝑡−1 + ∑ 𝛿𝑖
𝑞1𝑖=0 Δ𝐿𝐺𝐷𝑃𝑡−1 +∑ 𝛿2𝑖
2𝑖=0 ΔL𝐼𝑁𝑅𝑡−1 +
∑ 𝛿3𝑖𝑞3𝑖=0 Δ𝐿𝑂𝑃𝑡−1 +∑ 𝛿4𝑖
𝑞4𝑖=0 ΔL𝐸𝑋𝑡−1 +∑ 𝛿5𝑖
𝑞5𝑖𝑖=0 ΔL𝑈𝑁𝐸𝑡−1 +∑ 𝛿6𝑖
𝑞61𝑖=0 Δ𝐿𝐹𝑆𝑡−1
+ ∑ 𝛿7𝑖𝑞7𝑖𝑖=0 ΔL𝐸𝑋𝐷𝑡−1 + ∑ 𝛿8𝑖
𝑞8𝑖𝑖=0 Δ𝐿𝐶𝐴𝑡−1+∑ 𝛿9𝑖
𝑞91𝑖=0 Δ𝐿𝐹𝑅𝑡−1 +𝜑1𝐿𝐼𝑁𝐹𝑡−1 +
𝜑2𝐿𝐺𝐷𝑃𝑡−1 + 𝜑3𝐿𝐼𝑁𝑅𝑡−1 + 𝜑4𝐿𝑂𝑃𝑡−1 + 𝜑5𝐿𝐸𝑋𝑡−1 + 𝜑6𝐿𝑈𝑁𝐸𝑡−1 +
𝜑7𝐿𝐹𝑆𝑡−1 + 𝜑8𝐿𝐸𝑋𝐷𝑡−1 + 𝜑9𝐿𝐶𝐴𝑡−1 + 𝜑10𝐿𝐹𝑅𝑡−1 +휀𝑡…….
Δ𝐿𝐸𝑋𝑡 = 𝛽0 +∑ 𝜆𝑖𝑝𝑖=1 Δ𝐿𝐸𝑋𝑡−1 + ∑ 𝛿𝑖
𝑞1𝑖=0 Δ𝐿𝐺𝐷𝑃𝑡−1 +∑ 𝛿2𝑖
2𝑖=0 Δ𝐿𝐼𝑁𝑅𝑡−1 +
∑ 𝛿3𝑖𝑞3𝑖=0 ΔL𝐼𝑁𝐹𝑡−1 +∑ 𝛿4𝑖
𝑞4𝑖=0 ΔL𝑂𝑃𝑡−1 +∑ 𝛿5𝑖
𝑞5𝑖𝑖=0 ΔL𝑈𝑁𝐸𝑡−1 +∑ 𝛿6𝑖
𝑞61𝑖=0 Δ𝐹𝑆𝑡−1
+ ∑ 𝛿7𝑖𝑞7𝑖𝑖=0 Δ𝐿𝐸𝑋𝐷𝑡−1 + ∑ 𝛿8𝑖
𝑞8𝑖𝑖=0 ΔL𝐶𝐴𝑡−1+∑ 𝛿9𝑖
𝑞91𝑖=0 Δ𝐿𝐹𝑅𝑡−1 +𝜑1𝐿𝐸𝑋𝑡−1 +
𝜑2𝐿𝐺𝐷𝑃𝑡−1 + 𝜑3𝐿𝐼𝑁𝑅𝑡−1 + 𝜑4𝐿𝐼𝑁𝐹𝑡−1 + 𝜑5𝐿𝑂𝑃𝑡−1 + 𝜑6𝐿𝑈𝑁𝐸𝑡−1 +
𝜑7𝐿𝐹𝑆𝑡−1 + 𝜑8𝐿𝐸𝑋𝐷𝑡−1 + 𝜑9𝐿𝐶𝐴𝑡−1 + 𝜑10𝐿𝐹𝑅𝑡−1 +휀𝑡……
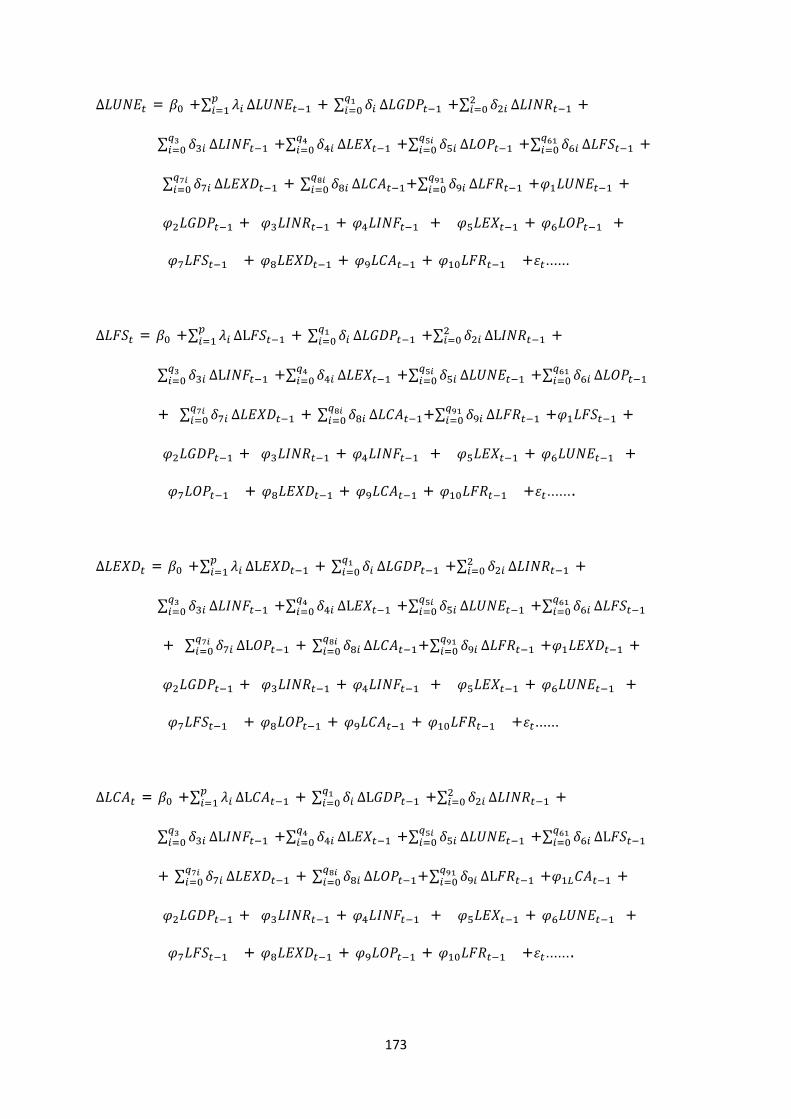
173
Δ𝐿𝑈𝑁𝐸𝑡 = 𝛽0 +∑ 𝜆𝑖𝑝𝑖=1 Δ𝐿𝑈𝑁𝐸𝑡−1 + ∑ 𝛿𝑖
𝑞1𝑖=0 Δ𝐿𝐺𝐷𝑃𝑡−1 +∑ 𝛿2𝑖
2𝑖=0 Δ𝐿𝐼𝑁𝑅𝑡−1 +
∑ 𝛿3𝑖𝑞3𝑖=0 Δ𝐿𝐼𝑁𝐹𝑡−1 +∑ 𝛿4𝑖
𝑞4𝑖=0 Δ𝐿𝐸𝑋𝑡−1 +∑ 𝛿5𝑖
𝑞5𝑖𝑖=0 Δ𝐿𝑂𝑃𝑡−1 +∑ 𝛿6𝑖
𝑞61𝑖=0 Δ𝐿𝐹𝑆𝑡−1 +
∑ 𝛿7𝑖𝑞7𝑖𝑖=0 Δ𝐿𝐸𝑋𝐷𝑡−1 + ∑ 𝛿8𝑖
𝑞8𝑖𝑖=0 Δ𝐿𝐶𝐴𝑡−1+∑ 𝛿9𝑖
𝑞91𝑖=0 Δ𝐿𝐹𝑅𝑡−1 +𝜑1𝐿𝑈𝑁𝐸𝑡−1 +
𝜑2𝐿𝐺𝐷𝑃𝑡−1 + 𝜑3𝐿𝐼𝑁𝑅𝑡−1 + 𝜑4𝐿𝐼𝑁𝐹𝑡−1 + 𝜑5𝐿𝐸𝑋𝑡−1 + 𝜑6𝐿𝑂𝑃𝑡−1 +
𝜑7𝐿𝐹𝑆𝑡−1 + 𝜑8𝐿𝐸𝑋𝐷𝑡−1 + 𝜑9𝐿𝐶𝐴𝑡−1 + 𝜑10𝐿𝐹𝑅𝑡−1 +휀𝑡……
Δ𝐿𝐹𝑆𝑡 = 𝛽0 +∑ 𝜆𝑖𝑝𝑖=1 ΔL𝐹𝑆𝑡−1 + ∑ 𝛿𝑖
𝑞1𝑖=0 Δ𝐿𝐺𝐷𝑃𝑡−1 +∑ 𝛿2𝑖
2𝑖=0 ΔL𝐼𝑁𝑅𝑡−1 +
∑ 𝛿3𝑖𝑞3𝑖=0 ΔL𝐼𝑁𝐹𝑡−1 +∑ 𝛿4𝑖
𝑞4𝑖=0 Δ𝐿𝐸𝑋𝑡−1 +∑ 𝛿5𝑖
𝑞5𝑖𝑖=0 Δ𝐿𝑈𝑁𝐸𝑡−1 +∑ 𝛿6𝑖
𝑞61𝑖=0 Δ𝐿𝑂𝑃𝑡−1
+ ∑ 𝛿7𝑖𝑞7𝑖𝑖=0 Δ𝐿𝐸𝑋𝐷𝑡−1 + ∑ 𝛿8𝑖
𝑞8𝑖𝑖=0 Δ𝐿𝐶𝐴𝑡−1+∑ 𝛿9𝑖
𝑞91𝑖=0 Δ𝐿𝐹𝑅𝑡−1 +𝜑1𝐿𝐹𝑆𝑡−1 +
𝜑2𝐿𝐺𝐷𝑃𝑡−1 + 𝜑3𝐿𝐼𝑁𝑅𝑡−1 + 𝜑4𝐿𝐼𝑁𝐹𝑡−1 + 𝜑5𝐿𝐸𝑋𝑡−1 + 𝜑6𝐿𝑈𝑁𝐸𝑡−1 +
𝜑7𝐿𝑂𝑃𝑡−1 + 𝜑8𝐿𝐸𝑋𝐷𝑡−1 + 𝜑9𝐿𝐶𝐴𝑡−1 + 𝜑10𝐿𝐹𝑅𝑡−1 +휀𝑡…….
Δ𝐿𝐸𝑋𝐷𝑡 = 𝛽0 +∑ 𝜆𝑖𝑝𝑖=1 ΔL𝐸𝑋𝐷𝑡−1 + ∑ 𝛿𝑖
𝑞1𝑖=0 Δ𝐿𝐺𝐷𝑃𝑡−1 +∑ 𝛿2𝑖
2𝑖=0 Δ𝐿𝐼𝑁𝑅𝑡−1 +
∑ 𝛿3𝑖𝑞3𝑖=0 Δ𝐿𝐼𝑁𝐹𝑡−1 +∑ 𝛿4𝑖
𝑞4𝑖=0 ΔL𝐸𝑋𝑡−1 +∑ 𝛿5𝑖
𝑞5𝑖𝑖=0 Δ𝐿𝑈𝑁𝐸𝑡−1 +∑ 𝛿6𝑖
𝑞61𝑖=0 Δ𝐿𝐹𝑆𝑡−1
+ ∑ 𝛿7𝑖𝑞7𝑖𝑖=0 ΔL𝑂𝑃𝑡−1 + ∑ 𝛿8𝑖
𝑞8𝑖𝑖=0 Δ𝐿𝐶𝐴𝑡−1+∑ 𝛿9𝑖
𝑞91𝑖=0 Δ𝐿𝐹𝑅𝑡−1 +𝜑1𝐿𝐸𝑋𝐷𝑡−1 +
𝜑2𝐿𝐺𝐷𝑃𝑡−1 + 𝜑3𝐿𝐼𝑁𝑅𝑡−1 + 𝜑4𝐿𝐼𝑁𝐹𝑡−1 + 𝜑5𝐿𝐸𝑋𝑡−1 + 𝜑6𝐿𝑈𝑁𝐸𝑡−1 +
𝜑7𝐿𝐹𝑆𝑡−1 + 𝜑8𝐿𝑂𝑃𝑡−1 + 𝜑9𝐿𝐶𝐴𝑡−1 + 𝜑10𝐿𝐹𝑅𝑡−1 +휀𝑡……
Δ𝐿𝐶𝐴𝑡 = 𝛽0 +∑ 𝜆𝑖𝑝𝑖=1 ΔL𝐶𝐴𝑡−1 + ∑ 𝛿𝑖
𝑞1𝑖=0 ΔL𝐺𝐷𝑃𝑡−1 +∑ 𝛿2𝑖
2𝑖=0 Δ𝐿𝐼𝑁𝑅𝑡−1 +
∑ 𝛿3𝑖𝑞3𝑖=0 ΔL𝐼𝑁𝐹𝑡−1 +∑ 𝛿4𝑖
𝑞4𝑖=0 ΔL𝐸𝑋𝑡−1 +∑ 𝛿5𝑖
𝑞5𝑖𝑖=0 Δ𝐿𝑈𝑁𝐸𝑡−1 +∑ 𝛿6𝑖
𝑞61𝑖=0 ΔL𝐹𝑆𝑡−1
+ ∑ 𝛿7𝑖𝑞7𝑖𝑖=0 Δ𝐿𝐸𝑋𝐷𝑡−1 + ∑ 𝛿8𝑖
𝑞8𝑖𝑖=0 Δ𝐿𝑂𝑃𝑡−1+∑ 𝛿9𝑖
𝑞91𝑖=0 ΔL𝐹𝑅𝑡−1 +𝜑1𝐿𝐶𝐴𝑡−1 +
𝜑2𝐿𝐺𝐷𝑃𝑡−1 + 𝜑3𝐿𝐼𝑁𝑅𝑡−1 + 𝜑4𝐿𝐼𝑁𝐹𝑡−1 + 𝜑5𝐿𝐸𝑋𝑡−1 + 𝜑6𝐿𝑈𝑁𝐸𝑡−1 +
𝜑7𝐿𝐹𝑆𝑡−1 + 𝜑8𝐿𝐸𝑋𝐷𝑡−1 + 𝜑9𝐿𝑂𝑃𝑡−1 + 𝜑10𝐿𝐹𝑅𝑡−1 +휀𝑡…….
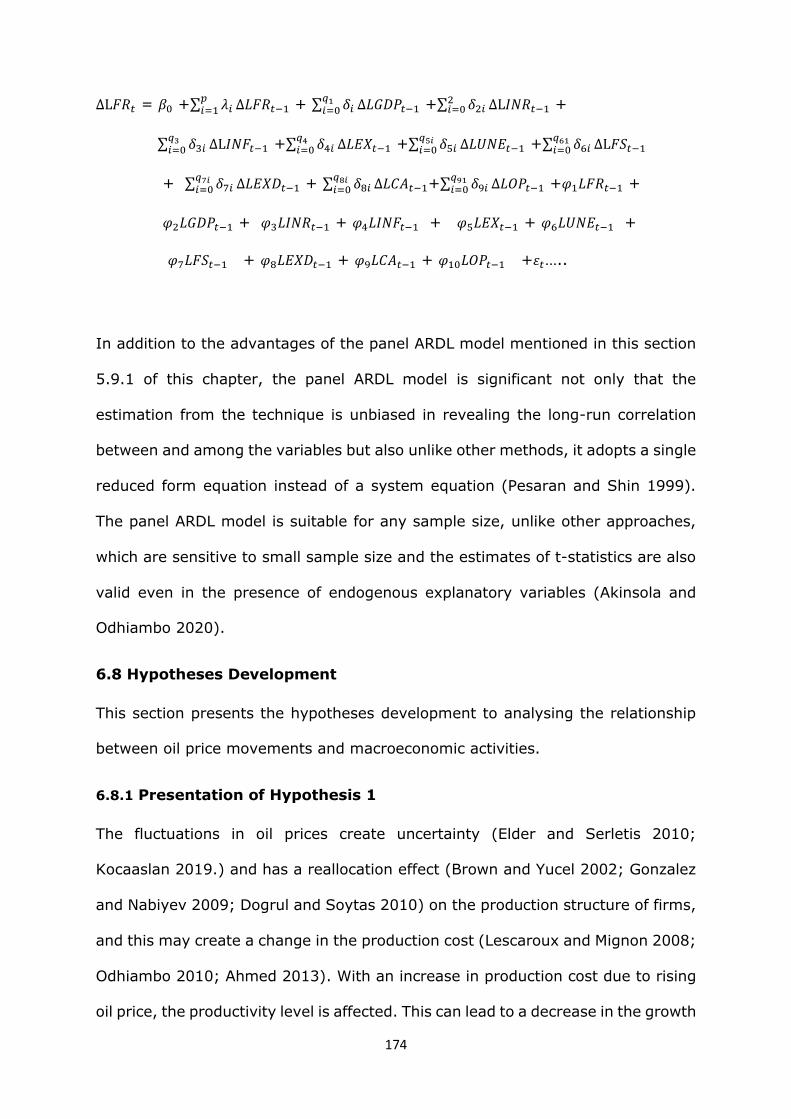
174
ΔL𝐹𝑅𝑡 = 𝛽0 +∑ 𝜆𝑖𝑝𝑖=1 Δ𝐿𝐹𝑅𝑡−1 + ∑ 𝛿𝑖
𝑞1𝑖=0 Δ𝐿𝐺𝐷𝑃𝑡−1 +∑ 𝛿2𝑖
2𝑖=0 ΔL𝐼𝑁𝑅𝑡−1 +
∑ 𝛿3𝑖𝑞3𝑖=0 ΔL𝐼𝑁𝐹𝑡−1 +∑ 𝛿4𝑖
𝑞4𝑖=0 Δ𝐿𝐸𝑋𝑡−1 +∑ 𝛿5𝑖
𝑞5𝑖𝑖=0 Δ𝐿𝑈𝑁𝐸𝑡−1 +∑ 𝛿6𝑖
𝑞61𝑖=0 ΔL𝐹𝑆𝑡−1
+ ∑ 𝛿7𝑖𝑞7𝑖𝑖=0 Δ𝐿𝐸𝑋𝐷𝑡−1 + ∑ 𝛿8𝑖
𝑞8𝑖𝑖=0 Δ𝐿𝐶𝐴𝑡−1+∑ 𝛿9𝑖
𝑞91𝑖=0 Δ𝐿𝑂𝑃𝑡−1 +𝜑1𝐿𝐹𝑅𝑡−1 +
𝜑2𝐿𝐺𝐷𝑃𝑡−1 + 𝜑3𝐿𝐼𝑁𝑅𝑡−1 + 𝜑4𝐿𝐼𝑁𝐹𝑡−1 + 𝜑5𝐿𝐸𝑋𝑡−1 + 𝜑6𝐿𝑈𝑁𝐸𝑡−1 +
𝜑7𝐿𝐹𝑆𝑡−1 + 𝜑8𝐿𝐸𝑋𝐷𝑡−1 + 𝜑9𝐿𝐶𝐴𝑡−1 + 𝜑10𝐿𝑂𝑃𝑡−1 +휀𝑡…..
In addition to the advantages of the panel ARDL model mentioned in this section
5.9.1 of this chapter, the panel ARDL model is significant not only that the
estimation from the technique is unbiased in revealing the long-run correlation
between and among the variables but also unlike other methods, it adopts a single
reduced form equation instead of a system equation (Pesaran and Shin 1999).
The panel ARDL model is suitable for any sample size, unlike other approaches,
which are sensitive to small sample size and the estimates of t-statistics are also
valid even in the presence of endogenous explanatory variables (Akinsola and
Odhiambo 2020).
6.8 Hypotheses Development
This section presents the hypotheses development to analysing the relationship
between oil price movements and macroeconomic activities.
6.8.1 Presentation of Hypothesis 1
The fluctuations in oil prices create uncertainty (Elder and Serletis 2010;
Kocaaslan 2019.) and has a reallocation effect (Brown and Yucel 2002; Gonzalez
and Nabiyev 2009; Dogrul and Soytas 2010) on the production structure of firms,
and this may create a change in the production cost (Lescaroux and Mignon 2008;
Odhiambo 2010; Ahmed 2013). With an increase in production cost due to rising
oil price, the productivity level is affected. This can lead to a decrease in the growth
175
rate of wages, which may have an ultimate effect on unemployment rate at which
the real money held by households and firms may decrease (Nzimande and Msomi
2016). If the real money held by households and firms decreases the purchasing
power is affected, GDP growth rate may be affected, leading to an aggregate
contraction of economic activities and growth rate (Gonzalez and Nabiyev 2009).
However, some studies in the literature argued that monetary policy play a key
role in GDP growth rate dynamics more than changes in oil price (Bernanke et
al.1997; Tang and Xiong 2012; Chatziantoniou et al.2021). For example,
Bernanke et al. (1997) found that the post-war GDP growth rate reduction in the
U.S. is a function of monetary policy tightening rather than oil price-
macroeconomic relationship. This evidence is consistent with the view of Tatom
(1988), who argued that monetary authority behaviour was a possible explanation
of GDP growth rate dynamics.
Mixed empirical and different theoretical explanations on oil price- macroeconomic
variables relationship provide room for further analysis. This study tends to
investigate the hypothesis based on reviewed literature and to add to the existing
empirical evidence. The essence of this study investigating oil price-GDP
relationship in the context of net oil exporting and importing countries, is to obtain
information about the size and how the economies of these countries performed
after oil price shocks. This will help policymakers and investors to make inform
decisions given that GDP is an indicator of the general health of an economy. The
following hypothesis will be tested to verify the effect of changes in oil price on
GDP growth rate in the context of net oil-exporting and net oil-importing countries
in Africa.
𝐻1: Changes in oil price have no significant effect on GDP growth rate in net
176
oil-exporting and importing countries in Africa.
𝐻1 : Changes in oil price have a significant effect on GDP growth rate in net
oil exporting and importing countries in Africa.
6.8.2 Presentation of Hypothesis 2
Existing literature suggests that an increase in oil price substantiates an increase
in money demand and vice versa (Brown and Yucel 2002). When monetary
authorities fail to meet the growing demand for money, interest rates may
increase, validating economic contraction through a rise in inflation and high cost
of borrowing (Ahmed 2013). Tang et al. (2009) believed that given a fluctuation
in oil price, the interest rate disparity ratio could cause countries with the high-
interest rate to experience depreciation of domestic currencies, and countries with
low-interest rates experience appreciation in domestic currencies.
The impact of oil price on economic activities through interest rate has been well
documented in the literature (Urom et al. 2021; Śmiech et al. 2021). Studies
including Hoover and Perez (1994) and Lee et al. (2001) found that oil price
Granger-cause interest rate. Hoover and Perez (1994) found that increase in oil
price has a significant impact on interest rate. Lee et al. (2001) found that an
increase in oil price induces an increase in the call money rate, which strengthens
the Japanese economy's contractionary effect. This is consistent with the view of
Kim et al. (2015) that shocks in oil price is a significant source of interest rate
volatility in China. Contrarily to this view, Friedmann, and Schwartz (1965)
believed that fluctuations in short-term interest rates in the United States are a
function of monetary policy instead of oil price shocks.
Given the inconsistent findings on oil price-interest rate nexus, this study presents
the following hypothesis.
177
𝐻0: Changes in oil price do not have a significant effect on interest rate in
net oil-exporting and importing countries in Africa.
𝐻1: Changes in oil price have a significant effect on interest rate in net oil
exporting and importing countries in Africa.
6.8.3 Presentation of Hypothesis 3
Inflation effect is identified in the literature as one of the channels through which
oil price-macroeconomic relationships affect economic activities and growth (Tang
et al. 2009). In an open economy, it is observed that monetary authorities use
inflation to direct monetary policies and set interest rates (Brown and Yucel 2002).
The use of inflation threshold by monetary authorities is to avoid overheating the
economy through deflation or high inflation (Tang et al.2009).
Given an increase in oil prices, it is expected that the demand for money will
increase in net oil importing countries (Brown and Yucel 2002). Furthermore, to
adjust to the new equilibrium of money demand, interest rate will change,
affecting the prices of goods and services and even borrowing (Ahmed 2013).
When the prices of goods and services are affected, the purchasing power of
household and firms are affected. This may have an aggregate impact on economic
activities and growth.
Using time series analysis, Jumah and Pastuszy (2007) found that an increase in
oil prices has a negative effect on inflation in Ghana. This is consistent with Trang
et al. (2017), that increase in oil price significantly and negatively affect oil price
in Vietnam. In contrast, Miguel et al. (2009) believed that fluctuations in oil price
have little or no effect on inflation in the 1980s. Rather variations in inflation is a

178
function of monetary policy. Supporting this view, Reicher, and Utlaut (2010)
opined that monetary policy is the primary factor determining inflation variations.
This study intends to throw more light in understanding how fluctuations in oil
price affect inflation in the context of net oil-exporting and net oil-importing
countries in Africa. This investigation is significant given that inflation affects all
aspect of the economy such as business, consumer spending, unemployment
rates, investments and government programs including interest rates and tax
policies. Hence, if shocks in oil price affect inflation all these economic indicators
will be affected given that inflation can reduce their economic values. Thus,
examining oil price-inflation nexus will provide information for policymakers and
investors to make inform decisions. Therefore, the following hypothesis is put
forward:
𝐻0: Changes in oil price do not have significant effect on inflation in net oil
exporting and importing countries in Arica.
𝐻1: Changes in oil price have a significant effect on inflation in net oil
exporting and importing countries in Arica.
6.8.4 Presentation of Hypothesis 4
The theory of income transfer suggests that when oil price increases, wealth is
transferred from net oil-importing countries to net oil-exporting countries through
terms of trade dynamics (Beckmann et al. 2017, Ahmed 2013 and Brown and
Yucel 2002). When there is terms trade dynamics, exchange rate is affected (Balli
et al. 2021). An increase in terms of trade given an increase in oil price, cause
exchange rate of net oil importing countries to depreciate, while exchange rate of
net oil exporting countries will appreciate (Beckmann et al.2017).
179
Several studies have argued that the relationship between oil price and exchange
rate is asymmetric. For example, Rautava (2004) forecasted both long run and
short run asymmetric relationship between oil price and exchange rate in Russia.
Chen and Chen (2007) used panel data covering 1972 to 2005 and found
asymmetric long run relationship between oil price and exchange rate in G7
countries. This is consistent with the views of Volkov and Yuhn (2016) whose
predicted significant asymmetric relationship between oil price and exchange rate
in Russia. Lizardo and Molick (2010) forecasted negative long run relationship
between oil price and exchange rate of Canada, Mexico, and Russia. While Brazil
and Mexico. Basher et al. (2012) concluded that oil price and exchange rate exhibit
positive long run relationship in emerging markets.
Beckmann et al. (2017) opined that oil price is a valuable predictor of exchange
rate variation in the short run. Chaudhuri and Daniel (1998) evidenced a long-run
equilibrium relationship between oil price and the U.S. exchange rate following the
1979 oil price increase. They found that the deterioration of the domestic real
exchange rate as oil price declines in the U.K., Japan, and German. In contrast to
the above views, Bayat et al. (2015) used frequency domain analysis and
evidenced that oil price does not have a causal effect on the exchange rate in
Hungary.
This study will test oil price-exchange rate relationship in the context of net oil-
exporting and net oil-importing countries in Africa. The significance of this
empirical analysis is to show that changes in oil price is a significant in determining
exchange rate dynamics. This will provide information for policymakers to make
informed decisions on the type of monetary and fiscal policies to adopt to shield
domestic currency from oil price shocks. The following hypothesis will be tested.
180
𝐻0: Changes in oil price do not have a significant effect on exchange rate in
net oil-exporting and importing countries in Arica.
𝐻1: Changes in oil price have a significant effect on exchange rate in
net oil-exporting and importing countries in Arica.
6.8.5 Presentation of Hypothesis 5
The literature suggests that a rise in oil prices will increase the cost of production
in net oil-importing countries due to reallocation effect and structural adjustment
cost (Ahmed 2013, Brown Yucel 2002). Reallocation effect and structural
adjustment cost affect unemployment rate through production cost. A prolonged
increase in oil price can potentially impact productivity level through production
cost. (Loungani 1986). Firms may be forced to change their production structure
(Doğrul and Soytas 2010) and consequently labour may be reallocated across
sectors given an increase in oil price (Kocaarslan et al.2020), and this can affect
unemployment rate significantly. There is a likelihood of an increase in investment
uncertainty and reduction in productivity level (Kocaarslan et al.2020; Baffes et
al.2015). Given a reduction in When the productivity declines, production
structure may change, which will lead to increase in unemployment rate as
workers are being laid off (Kocaarslan et al.2020; Dogrul and Soytas 2010).
With all other things are held constant, increased uncertainty associated with
changes in oil prices may prompt firms to postpone investment decisions
(Bernanke, 1983). Furthermore, increase in uncertainty can cause investment to
drop (Kilian 2014), given that cash flow for an irreversible investment project is a
function of changes in oil price (Carruth et al.1998).

181
Dogrul and Soytas (2010) used Toda–Yamamoto procedure to show that changes
in oil price have predictive power over the unemployment rate in Turkey. In their
analysis, Carruth et al. (1998) opined those changes in the equilibrium of
unemployment rate are attributed to demand changes triggered by the
fluctuations in oil price. Papapetrou (2001) confirmed an immediate and negative
effect of oil price shocks on unemployment in Greece using monthly data from
1989m1 to 1996m6. Andreopoulos (2009) used quarterly data from the period
1953q2 to 2007q2 to examine causality between oil price and unemployment rate.
His findings reveal that oil prices help forecast unemployment in a recession. In
contrast, Cuestas (2016) found that oil price has no effect on the unemployment
rate, but oil price affects the equilibrium unemployment rate in Spain.
The following hypothesis is developed to test the effects of oil price changes on
unemployment rate in the context of net oil exporting and importing countries in
Africa.
𝐻0: Oil price changes do not have a significant effect on unemployment rate
in net exporting and importing countries in Africa.
𝐻1: Oil price changes have a significant effect on unemployment rate in net
exporting and importing countries in Africa.
6.8.6 Presentation of Hypothesis 6
Business cycle theory suggests that changes in oil price affect macroeconomic
variables through market dynamics (Pönkä and Zheng 2019; Gonzalez and
Nabiyev 2009). The principle of the real business cycle is that if an external shock
from oil price fluctuations occurs, indirectly cause changes on food supply through
its effect on consumer price index (Sharma and Shrivastava 2021). This may

182
directly affect wages given an increase in inflation (Sarwar et al. 2020). If food
constitute a significant part of consumer consumption basket, cost of production
may increase, affecting firms' decisions and workers, which may result in changes
in their production and consumption patterns (Timilsina et al. 2011). This may
eventually affect output and commodity prices, including food supply (Nwoko et
al. 2015, Byrne et al. 2012, Gonzalez and Nabiyev 2009, and Finn 1982). Nwoko
et al. (2015) forecasted that changes in oil price have positive predictive power
over food supply in Nigeria. They identified a long-run relationship between oil
price and variations in food supply. The finding suggests that changes in global oil
price dictate the behaviour of food price in Nigeria. Hence, market forces of
demand and supply shocks of oil price can be used to determine the price of food
in Nigeria.
Using the Bayesian multivariate framework, Sujithan et al. (2014) assessed the
effect of oil price on food price volatility. Their findings show that shocks in oil
price led to an increase in food prices. Timilsina et al. (2011) concluded an inverse
relationship between increase in oil price and food supply in Russia, United States,
South Africa, Malaysia, India, and Brazil. Sarwar et al. (2020) used NRADL model
and forecasted asymmetric significant positive relationship between increase in oil
price and food price in Pakistan.
Therefore, the following hypothesis is developed to support the relationship
between fluctuations in oil price and food supply. Given that food supply
contributes to economic growth, understanding oil price-food supply relationship
will help policymaker provide policy that will shield food supply from oil price
shocks.
𝐻0: Oil price changes do not have a significant effect on food supply in net oil

183
exporting and importing countries in Africa.
𝐻0: Oil price changes significantly affect food supply in net oil-exporting and
oil importing countries in Africa.
6.8.7 Presentation of Hypothesis 7
With the fluctuation in oil prices, for example, increase in oil prices is expected to
facilitate increased accumulation of revenue in net oil exporting countries, hence
reduction in external debt (Kretzmann and Nooruddin 2005). While it is expected
that increase in oil price will create increase in external debt, given a decline in
income held (Cline 1984). The mismanagement of public funds through corrupt
practices and inadequate public investment processes has caused the windfall
generated from excess crude oil to be mismanaged with consequences on
economic growth (Didia and Ayokunke 2020).
In their empirical investigation, Kretzmann and Nooruddin (2005) used
Generalized Method of Moment (GMM) with data covering 1970 to 2000 and found
that an increase in crude oil price led to an increase in external debt in both net
oil-exporting and net importing economies. Consistent with the above view,
Onigbinde et al. (2014) used extended literature reviews and conclude that despite
the increased accumulation of revenue from oil price increase, there is an increase
spike in Nigeria’s external debt. The implication of this finding suggests that the
windfall from increase in oil price is not well utilized for investment and economic
growth. Hence, policymakers should provide policies that encourage increase in
investment and reduction in external debt accumulation. In contrast to the above
views, Jin and Xiong (2021) used New Keynesian model with data from 2003𝑞1 to
2016𝑞4 to show that external debt is a function of monetary policy instead of
changes in oil price in Russia.
184
With the varying results reviewed in literature, it is important to examine the
impact of fluctuations in oil price on external debt dynamics in the context of net
oil exporting and net oil importing countries in Africa. This will help provide
information that will enable policymakers how to utilize the windfall from oil
revenue and shield the economy from external debt shocks. The following
hypothesis is developed:
𝐻0: Changes in oil price do not have a significant effect on external debt in net
oil-exporting and importing countries in Africa.
𝐻1: Changes in oil price have a significant effect on external debt in net oil
exporting and importing countries in Africa.
6.8.8 Presentation of Hypothesis 8
The theory of income shift suggests that changes in oil price validates terms of
trade dynamics. Countries with high dependence on crude oil will experience
exchange rates dynamics from income transfer arising from changes in terms of
trade (Brown and Yucel 2002; Su et al. 2021). The transfer of wealth may reflect
imbalances in current account (deficits or surplus), due to exchange rates
dynamics (Beckmann et al.2017), given changes in oil price (Gnimassoun et al.
2017). The adjustment in exchange rate dynamics can validate increased shift in
current account and reallocation of portfolios (Beckmann et al. 2017; Qurat-ul-Ain
and Tufail 2013), given that domestic currencies of high crude oil dependence
countries will either appreciate or depreciate (Qurat-ul-Ain and Tufail 2013). The
degree of impact of oil price fluctuations on current accounts depends on whether
an economy is an oil exporter or an oil importer (Gnimassoun et al. 2017; Fowowe
2014; Buetzer et al.2012).
185
With panel smooth transition regression models and data covering 1980 to 2000
Allegret et al. (2014) concluded non-linear effect of oil price on current account in
net oil exporting countries. The result of non-linear effect of oil price on current
account is found to be crucially a function of the degree of financial development
of the countries examined. Suggesting that the allocation of financial development
of the accumulated oil price revenues and ability of these countries to formulate
policies that will shield the economy from price shock is very significant.
Beak and Choi (2018) used NARDL model to conclude that increase in oil price
yield current accounts surplus in Indonesian. Consistent with this result, Turan et
al. (2020) used ARDL model and predicted significant relationship between oil
price and current accounts in Poland and Czechia. In Addition, Gnimassoun et al.
(2017) used TVP-VAR model with time restriction and found that oil supply shock
is insignificant in predicting current account, while oil demand shock positively and
significantly forecasted current accounts in Canada.
Qurat-ul-Ain and Tufail (2013) used Vector Autoregression (VAR) model and
evidenced significant deteriorating asymmetric long run and short run effect of oil
price on current accounts in net oil exporting countries. While in net oil importing
increase in oil price asymmetrically improves current accounts dynamics in the
short run.
Given the divergent view and empirical explanations contingent on oil price -
current account relationship gives room for further investigation; this study will
test the following hypothesis:
𝐻0: Changes in oil price do not have a significant effect on current account in
net oil-exporting and importing countries in Africa.
186
𝐻1: Changes in oil price have a significant effect on current account in net oil
exporting and importing countries in Africa.
6.8.9 Presentation of Hypothesis 9
This section presents the hypothesis informed by the theory of income transfer
and terms and trade channel, which reflect how the relationship between oil price
and foreign reserves affect economic activities and growth. Just as explained in
chapter 4, section 4.5.8, when income is transferred from net oil-importing to net
oil-exporting in the form of import payment, it reflects surpluses in net oil-
exporting countries and deficit in net oil-importing countries (Ahmed 2013). The
foreign reserves of net oil-exporting countries increase while that of net oil-
importing countries decreases (Beckmann et al. 2017). However, the magnitude
of oil price fluctuations on foreign reserves, according to scholars such as Buetzer
et al. (2012) and Gnimassoun et al. (2017), depend on the share of oil dependence
the country.
Likewise, terms of trade channel can cause a relative change in export-to-import
ratio dynamics (Beckmann et al.2017), as such domestic currencies of these
countries will either depreciate or appreciate. The adjustment in exchange rate
may amplify portfolio reallocation and increase in foreign reserves (Beckmann et
al. 2017). However, the impact of oil price fluctuations on foreign reserve is
relative to country's share of oil dependency (Gnimassoun et al. 2017)
Olayungbo (2019) used a frequency domain causality approach to evidence that
oil price strongly causes foreign reserves in the short run in Nigeria. Gnimassoun
et al. (2017) and Bénassy-Quéré et al. (2007) revealed that as income is
transferred from net oil-importing to net oil-exporting countries through import
payment, the export ratio of net oil-exporting countries increases, and this may
187
reflect an appreciation of domestic currency and increase in foreign while that of
net oil-importing countries decreases. It is also expected that as the foreign
reserves of net oil-exporting countries increase, they may reinvest their surplus
in foreign assets (Buetzer et al.2016 and Coudert et al.2008 and Bénassy-Quéré
et al. 2007). The accumulated foreign reserve is expected to act as a buffer or
stabilizer given any economic crisis (Lee 2016). In contrast, Jin and Xiong (2021)
opined that policy switching accounts for fluctuations in foreign reserves in Russia.
Given the varying theoretical and empirical explanations on oil price- foreign
reserves nexus, this study intends to show how fluctuations in oil price affect
macroeconomic variables through oil price-foreign reserves dynamics with the
following hypothesis.
𝐻0: Changings in oil price do have a significant effect on foreign reserves in net
oil exporting and importing countries in Africa.
𝐻1 : Changes in oil price have a significant effect on foreign reserves in net oil
exporting and importing countries in Africa.
6.8.10 Presentation of Hypothesis 10
This section presents a hypothesis informed by how fluctuations in oil prices affect
macroeconomic variables in the short run and the long run through demand and
supply channels. In a classic supply-side effect where an increase(decrease) in oil
price is associated with various factors including reduced (increase) availability of
basic input to production in net oil-importing economies (González and Nabiyev
2009), transfer of income from net oil-importing (exporting) to net oil-exporting
(importing) countries (Beckmann et al. 2017) and monetary policy and real
balance effect (Jin and Xiong 2021; Brown and Yucel 2002).
188
For example, in a classical, supply-side effect, the marginal cost of production
increases due to a rise in oil price. Thus, the cost of production increases (Ahmed
2013). Increased production costs make it difficult for the firms to continue
production at existing or total production capacity (Kocaarslan et al.2020).
Therefore, production level reduces, and potential workers are laid off, and this
may lead to an increase in unemployment rate and a potential increase in inflation,
consequently a decline in economic activities and growth in the long run (Brown
and Yucel 2002).
Several studies on the asymmetric relationship between oil price and
macroeconomic variables have been examined in the literature, and the findings
are mixed (see Qin et al. 2016; Malikov 2016; Bastianin et al. 2014; Atil et al.
2014; Venditti 2013; Hooker 2002). For example, Ordonez et al. (2019) found
that an increase in oil price validates unemployment rate negatively, while the
decline in oil price has a positive feedback effect on the unemployment rate in
Spain. Caporale and Gil-Alana (2002) advocated for a long-run swing of oil prices
on unemployment rate in Canada. In contrast, Keane, and Prasad (1996) found a
short-run relationship between oil price and unemployment rate in the U.S.
Considering the long-run impact of oil price-macroeconomic relationship on
economic activities, not only that Dogrul and Soytas (2010) found a long-run
relationship between oil price and unemployment rate in the emerging market.
Furthermore, scholars including Hooker (2002), Carruth et al. (1998), and Rasche
and Tatom (1977b, 1981) found a long-term cointegrating relationship between
oil price, unemployment, and real interest rate.
Baek and Choi (2021) concluded that fluctuations in oil prices have asymmetric
effects on the rupiah exchange rate in Indonesia both in the long run and short
189
run. In contrast, Basnet and Upadhyaya (2015) opined that oil price has little
impact on Indonesia's rupiah exchange rate. Chen and Chen (2007) explored a
sample of G7 countries and conclude that oil price has long-run predictive power
over exchange rate. Reboredo (2012) in identifying oil price-exchange rate nexus,
concludes that oil price is insignificant in affecting exchange rate in E.U. countries.
Batu et al.(2017b) focused on low-income countries and found that the oil price -
GDP relationship is limited to the short run. Cunado and Perez-de Gracia (2003),
in their analysis of oil price-GDP relationship in 14 European countries, revealed
that oil price predicted GDP in the short run of countries examined except the
United Kingdom and Ireland, where a long run relationship exists between oil price
and GDP. In a study carried out by Lescaroux and Mignon (2008), they found a
long-run relationship between oil price and GDP in twelve countries but a long-run
relationship between oil price and unemployment rate and share price in non-
OPEC countries. Cunado and Perez-de Gracia (2013) and Rafiq and Salim (2011)
examined the impact of oil price-macroeconomic relationship on economic
activities and growth and found a short-run relationship.
Oyelami and Olomola (2016), in their study on oil price-macroeconomic relation
in Nigeria and her trading partners, found that oil price supply shocks have a direct
effect on GDP and exchange rate but no immediate effect on short term interest
rate and inflation in Nigeria but immediate effect on the short-term interest rate
and inflation of the developed countries of U.S., E.U., China, and Japan. On the
other hand, Baffes et al. (2015), through income shift theory, noted that when
income is transferred from net oil-exporting to oil-importing countries given a
decrease in oil price, shocks in oil price cause a net positive effect on global
economic activities over the medium term.
190
The divergent explanation contingent on how fluctuations in oil price affect
macroeconomic variables in the long run and short run gives room for further
examination of this relationship in the context of net oil-exporting and net oil-
importing countries in Africa. Therefore, the following hypothesis is formulated.
𝐻0: Changes in oil price do not have the same short-run and long-run effect
on macroeconomic variables in net oil-exporting and net oil-importing countries
in Africa.
𝐻1: Changes in oil price have the same short-run and long-run effect on
macroeconomic variables in net oil-exporting and importing countries in
Africa.
6.8.11 Presentation of Hypothesis 11
Scholars including Gnimassoun et al. (2017) and Iwayemi and Fowowe (2010)
believed that the impact of oil price-macroeconomic relationship on economic
activities and growth is country-specific. Implying oil price-macroeconomic
relationship is a function of country's share in oil. Thus, there are some emphases
on literature that have analysed how fluctuations in oil price affect macroeconomic
variables of countries of net oil-exporting and net oil-importing (see Gbatu et
al.2017a; Salisu and Isah 2017; Rafiq et al. 2016).
Jibril et al. (2020) studied the asymmetric impacts of oil price fluctuations on the
trade balance of 75 oil-importing and 25 oil-exporting countries. They concluded
that the effect is a function of the source of the shock. In support of this view, Lin
and Bai (2021) argued that economic policy uncertainty indices for net oil
exporters and net oil importers respond differently to oil price shock. They found
191
that shocks in oil price have more effect on the economic policy of net oil-exporting
countries than net oil-importing countries.
Hou et al. (2015) estimated the direct effect, indirect effect, and actual impact of
oil price supply shock on the economies of net oil-exporting and net oil-importing
countries in Africa. Their findings showed that the oil price decline of 2014 and
2015 resulted in a 30% drop in crude oil exports of net oil-exporting countries
including Nigeria, Angola, Equatorial Guinea, Congo, Gabon, and Sudan, which
amounted to a loss of $63 billion. While a reduced import of oil worth $15 billion
was experienced in countries including South Africa, Tanzania, Kenya, and
Ethiopia. Inflation dropped by 2% in Tanzania, South Africa, and Kenya, while
Nigeria and Angola experienced a 2% increase in inflation. Equally noted was a
drop in current account, devolution of naira, and an 8% cut in government
spending in Nigeria while Tanzania and South Africa had increased current
account.
Batu et al. (2017a) divided ECOWAS countries into a group of net oil-exporting
and net oil-importing countries and examined the asymmetric effects of oil price
shocks on economic activities and growth. The result showed a linear and
asymmetric impact of oil price on real GDP and exchange rate of net oil-exporting
and net oil-importing ECOWAS countries. Salisu and Isah (2017) found that stock
price responds asymmetrically to oil price in net oil-exporting and oil-importing
countries.
In an empirical analysis of some OECD countries, Jiménez-Rodríguez, and Sánchez
(2005) argued that oil price impacts are non-linear on real GDP. An increase in oil
price has a more significant impact than a decrease in oil price. Moreover, a decline
in oil prices is found to be statistically insignificant in nearly all instances. For net

192
oil-importing countries, shocks in oil price have an adverse effect on economic
activities for all countries (Canada, Euro Area, U.S, Germany, France, and Italy)
excluding Japan. For the net oil-exporting countries, Norway profited from the oil
price shocks while the U.K. was adversely affected by oil price shocks within the
study period.
Given the divergent results on how fluctuations in oil price affect macroeconomic
variables of net oil-exporting and net oil-importing countries in Africa, the
following hypothesis is formulated to show more insight into how fluctuations in
oil price affect macroeconomic variables in the context of net oil-exporting and net
oil-importing countries in Africa.
𝐻0: changes in oil price do not have the same asymmetric effect on macroeconomic
variables in net oil-exporting and net oil-importing countries in Africa.
𝐻1: Changes in oil price have the same asymmetric effect on macroeconomic
variables in net oil-exporting and importing countries in Africa.
6.9 Discussion of Findings
This section reports the results obtained from econometric analyses.
6.9.1 Result from Econometric Analysis Using Panel ARDL Model.
It is reported in section 5.10.1 in chapter 5 that the variables are integrated of
order zero, I (0) and order one I (1). First panel ARDL model is employed to
analyse the asymmetric short run and long-run equilibrium relationship between
oil price and key macroeconomic variables. Second, Granger-causality and Wald
tests are employed for robust check. The Granger-causality test is employed to
determine the direction of the relationship. The Granger-causality is used to test
the long run causal relationship while Wald test techniques examines the short

193
run causal relationship between oil price and variables of GDP, interest rate,
inflation, exchange rate, unemployment rate, food supply, external debt, current
accounts, and foreign reserves. A diagnostic test is carried out using normality
test and cross-sectional dependence test. This is to establish the consistency and
validity of the model used. The normality test shows how normally distributed the
variables are. The existence of cross -sectional dependence can be problematic in
a panel data (Baltagi 2005; Akinsola and Odhiambo 2020). As such its estimation
is significant to evidence if the choice of model is valid or not. Panel ARDL model
has the following advantages:
1. The model has the ability not to be biased in simultaneously showing the long-run
and short-run relationship among variables
2. Unlike other models, panel ARDL model adopts a single reduced form equation
instead of system equation (Pesaran and Shin 1999).
3. It is suitable for any sample size, unlike other methods which are sensitive to
small sample size.
4. The estimation of the panel ARDL model t-statistics are valid even in the presence
of endogenous explanatory variables (Akinsola and Odhiambo 2020).
5. Panel ARDL is suitable for estimation of variables integrated of order zero, I (0)
and order one I (1).
6. In panel ARDL model the dependent and independent variables are permitted to
have unrestricted number of lags (Cheratian et al.2019).
In panel ARDL analysis, if the coefficient φ of ECT is negative, the long-run
relationship among the variables is stable (Hussain 2009). The advantages of ECT
in panel ARDL model are as follows:
194
1. ECT validates the quickness of changes of the determinants for assemblage to
equilibrium.
2. It also provides feedback about the long-term correlation among the determinants
for the group of countries under study (Alsaleh and Abul-Rahim 2019; Salisu and
Isah 2017).
3. It is useful estimating both short-term and long-term effect of one time series on
another.
ECT is widely used in literature. For example, Salisu and Isah (2017) used the
error correction term (ECT) to capture the speed of change at which the
relationship between oil price and stock prices converged to long-run equilibrium
in net oil-exporting and net oil-importing countries.
6.9.1.1 Discussion on Results on Hypothesis 1 Testing
The panel ARDL estimated the short-run and the long-run effect of oil price
changes on GDP are reported in tables 6.10 and 6.11.
It is found that the coefficients of the ECT have a negative sign in both net oil-
exporting and net oil-importing countries. The coefficient of ECT is statistically
significant in net oil-exporting countries, which means that in net oil-exporting
countries, the long-run equilibrium point is significantly reached at a stable rate
of 14.02%. In contrast, the long-run equilibrium point is statistically insignificant
in net oil-importing countries. Implying that in net oil exporting countries, there
exist the presence of significant statistical causal relationship between oil price
and GDP. While in net oil importing countries, the presence of long run causal
relationship exists but it is insignificant.
Different effects are found of changes in oil price on GDP in net oil-exporting and
net oil-importing countries. Net oil exporting countries presented a positive long
195
run asymmetry in response of GDP to oil price change as opposed to a typical
asymmetric negative long run response of GDP to changes in oil price in net oil
importing countries. A 1%-point increase in oil price in the long run positively and
significantly forecasted 5.5% improvement in GDP in net oil-exporting countries,
while it reduces GDP by 3.7% in net oil importing countries. This result aligns with
views of Awartani et al. (2020) for MENA region and Nusair and Olson (2021) for
Indonesia, Korea, Singapore, and Thailand. Meaning that in the long run GDP
growth in net oil exporting countries is linked to changes in oil price. Also, GDP
reduction in net oil importing countries is linked to changes in oil price. These
results are significant, and they can provide information for policymakers in
providing long run policies that are concern with stabilizing the economies of net
oil exporting and importing countries against changes in oil price.
The short run analysis presented a positive response of GDP to oil price changes
as opposed to a typical negative response of GDP to oil price changes in net oil
importing countries. A 1%-point increase in oil price validates a 1.7% increase in
GDP in net oil-exporting countries and a 2.7% decrease in GDP in net oil-importing
countries. Meaning that in the short run oil price Improves GDP growth in net oil
exporting countries, while it contracts GDP growth rate in net oil importing
countries. These results are consistent with the views of Elmezouar et al. (2014)
for Algeria, Chiweza and Aye (2017) for South Africa and Nusair and Olson (2021)
for Indonesia, Korea, Singapore, and Thailand. These results will provide a short
run information for investors and policymakers to strategies and provide policy
that will shield these economies from shocks in oil price.
This finding rejects Hypothesis 1, that changes in oil price do not have significant
effect on the GDP growth rate of net oil-exporting and net oil-importing countries
in Africa. Thus, this result supports the alternative hypothesis that oil price has
196
predictive power over GDP growth rate both in the long run and the short-run in
net oil-exporting and net oil-importing countries. This means that the coefficient
of oil price is not zero as oil price has predictive power over GDP in the context of
net oil exporting and importing countries both in the short run and in the long run.
The results are in line with the theory of income transfer. Income transfer theory
argues that with an increase in oil price, income is transferred from net oil
importing countries to net oil exporting countries. It expected that the increase in
oil price can cause increase in production cost in net oil importing countries to
increase. This may cause reduction in productivity level, hence, reduction in GDP
growth rate. While in net oil exporting countries, the income transfer from net oil
importing given an increase oil price can cause an appreciation of exchange. This
may enhance purchasing power of net oil exporting and ultimately increase in GDP
growth rate.
From the analysis above, the result fails to reject Hypothesis 10 states that
fluctuations in oil price do not have the same short-run and long-run effect on
GDP in net oil-exporting and net oil-importing countries in Africa. This is because
asymmetric positive relationship exists between oil price and GDP in net oil
exporting countries both in the long run and short run. Also found is negative
asymmetric relationship between oil price and GDP in oil importing countries both
in the long run and in the short run
This study stands to accept Hypothesis 11, given that oil price positively and
significantly affects GDP in net oil-exporting countries. However, its impact on GDP
in net oil-importing countries is statistically significant but negative. Thus,
implying that fluctuations in oil price do not have the same effect in net oil-
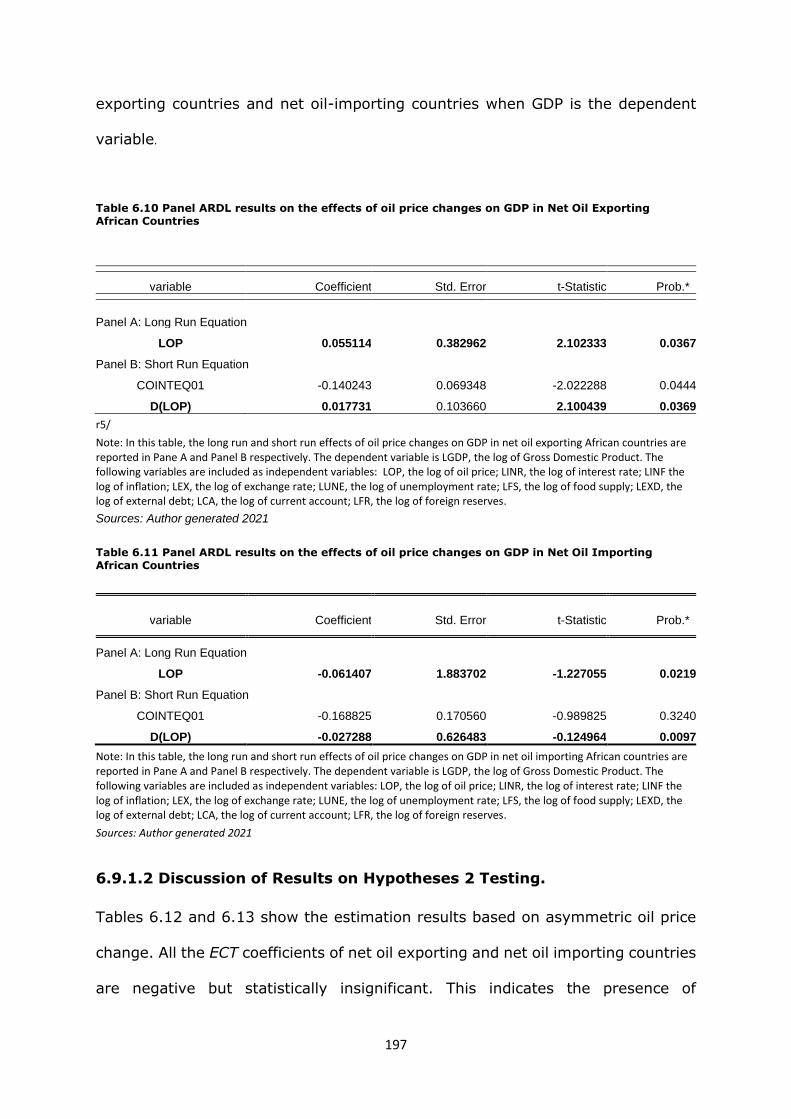
197
exporting countries and net oil-importing countries when GDP is the dependent
variable.
Table 6.10 Panel ARDL results on the effects of oil price changes on GDP in Net Oil Exporting African Countries
variable Coefficient Std. Error t-Statistic Prob.*
Panel A: Long Run Equation
LOP 0.055114 0.382962 2.102333 0.0367
Panel B: Short Run Equation
COINTEQ01 -0.140243 0.069348 -2.022288 0.0444
D(LOP) 0.017731 0.103660 2.100439 0.0369
r5/
Note: In this table, the long run and short run effects of oil price changes on GDP in net oil exporting African countries are reported in Pane A and Panel B respectively. The dependent variable is LGDP, the log of Gross Domestic Product. The following variables are included as independent variables: LOP, the log of oil price; LINR, the log of interest rate; LINF the log of inflation; LEX, the log of exchange rate; LUNE, the log of unemployment rate; LFS, the log of food supply; LEXD, the log of external debt; LCA, the log of current account; LFR, the log of foreign reserves.
Sources: Author generated 2021
Table 6.11 Panel ARDL results on the effects of oil price changes on GDP in Net Oil Importing African Countries
variable Coefficient Std. Error t-Statistic Prob.*
Panel A: Long Run Equation
LOP -0.061407 1.883702 -1.227055 0.0219
Panel B: Short Run Equation
COINTEQ01 -0.168825 0.170560 -0.989825 0.3240
D(LOP) -0.027288 0.626483 -0.124964 0.0097
Note: In this table, the long run and short run effects of oil price changes on GDP in net oil importing African countries are reported in Pane A and Panel B respectively. The dependent variable is LGDP, the log of Gross Domestic Product. The following variables are included as independent variables: LOP, the log of oil price; LINR, the log of interest rate; LINF the log of inflation; LEX, the log of exchange rate; LUNE, the log of unemployment rate; LFS, the log of food supply; LEXD, the log of external debt; LCA, the log of current account; LFR, the log of foreign reserves.
Sources: Author generated 2021
6.9.1.2 Discussion of Results on Hypotheses 2 Testing.
Tables 6.12 and 6.13 show the estimation results based on asymmetric oil price
change. All the ECT coefficients of net oil exporting and net oil importing countries
are negative but statistically insignificant. This indicates the presence of
198
insignificant long run causal equilibrium relationship between oil price and interest
rates in both net oil exporting and net oil importing countries in Africa.
In panel A the results evidenced that positive change in oil prices have significant
adverse effect on interest rate in both net oil exporting and net oil importing
countries in Africa. The increasing effect is greater both in its statistical and
economic importance for the case of net oil exporting countries. A 1%-point
increase in oil prices caused an increase in interest rate by 24.86% and 14.69%
respectively in net oil exporting and importing countries in the long run. This
shows that oil price effect on interest rate is higher in net oil exporting countries
than in oil importing countries. This result is consistent with the views of Ratti and
Vespignani (2015) who found positive innovation in oil price changes validates an
adverse effect on global interest rate. In the short run, changes in oil price are
insignificant in exerting effect on interest rate in both net oil exporting and net oil
importing countries in Africa. These findings show more challenges for
policymakers especially in net oil exporting countries. The increasing effect of oil
price changes on interest rates in both net oil exporting and net oil importing
countries can be explained through channel of real balance effect and monetary
policy (Pierce and Enzler 1974; Brown and Yucel
2002). Increase oil price for oil exporting countries means increase private and
public spending on both tradeable and non-tradeable goods in the economy. While
price of tradeable goods is internationally priced, the price of non-tradeable goods
and services is a function of domestic market. Increase demand for later goods
creates price increase and profit margin at the detriment of domestic
manufacturing and agricultural sectors (Cheratian et al. 2019). To encourage
domestic manufacturing and agricultural development, import bill of tradeable
goods may increase, hence, an adverse effect on interest rate. For oil importing
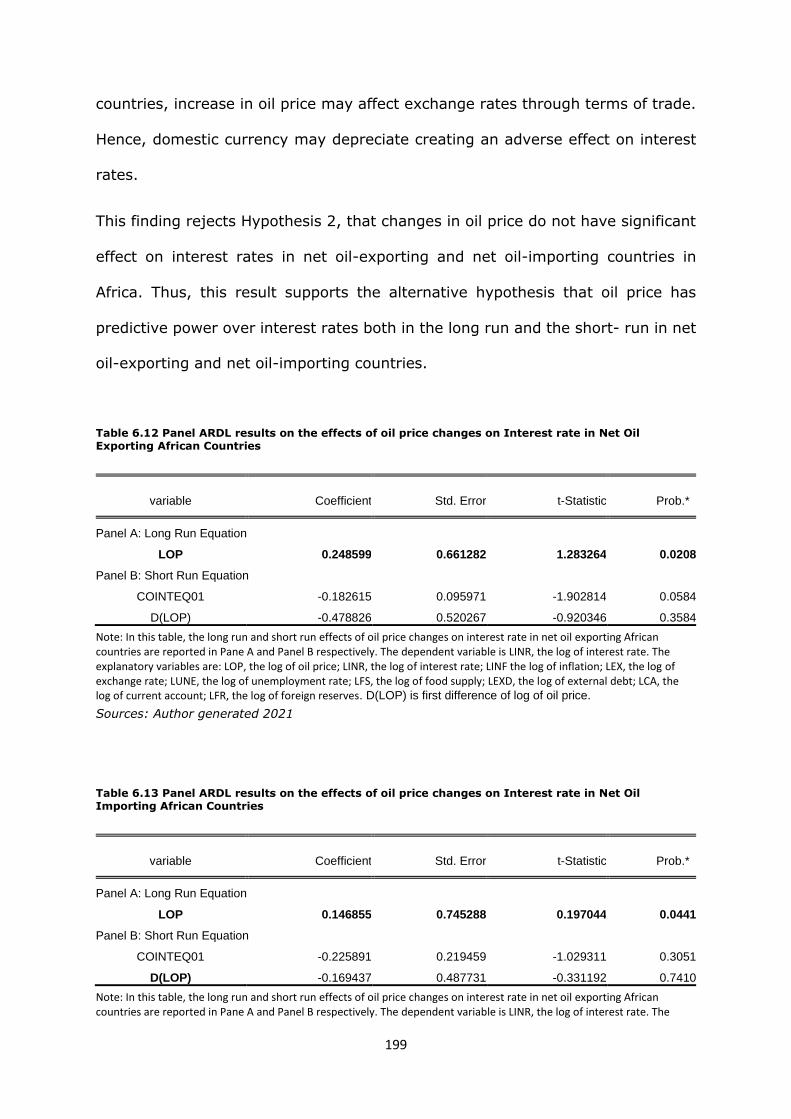
199
countries, increase in oil price may affect exchange rates through terms of trade.
Hence, domestic currency may depreciate creating an adverse effect on interest
rates.
This finding rejects Hypothesis 2, that changes in oil price do not have significant
effect on interest rates in net oil-exporting and net oil-importing countries in
Africa. Thus, this result supports the alternative hypothesis that oil price has
predictive power over interest rates both in the long run and the short- run in net
oil-exporting and net oil-importing countries.
Table 6.12 Panel ARDL results on the effects of oil price changes on Interest rate in Net Oil Exporting African Countries
variable Coefficient Std. Error t-Statistic Prob.*
Panel A: Long Run Equation
LOP 0.248599 0.661282 1.283264 0.0208
Panel B: Short Run Equation
COINTEQ01 -0.182615 0.095971 -1.902814 0.0584
D(LOP) -0.478826 0.520267 -0.920346 0.3584
Note: In this table, the long run and short run effects of oil price changes on interest rate in net oil exporting African countries are reported in Pane A and Panel B respectively. The dependent variable is LINR, the log of interest rate. The explanatory variables are: LOP, the log of oil price; LINR, the log of interest rate; LINF the log of inflation; LEX, the log of exchange rate; LUNE, the log of unemployment rate; LFS, the log of food supply; LEXD, the log of external debt; LCA, the log of current account; LFR, the log of foreign reserves. D(LOP) is first difference of log of oil price.
Sources: Author generated 2021
Table 6.13 Panel ARDL results on the effects of oil price changes on Interest rate in Net Oil Importing African Countries
variable Coefficient Std. Error t-Statistic Prob.*
Panel A: Long Run Equation
LOP 0.146855 0.745288 0.197044 0.0441
Panel B: Short Run Equation
COINTEQ01 -0.225891 0.219459 -1.029311 0.3051
D(LOP) -0.169437 0.487731 -0.331192 0.7410
Note: In this table, the long run and short run effects of oil price changes on interest rate in net oil exporting African countries are reported in Pane A and Panel B respectively. The dependent variable is LINR, the log of interest rate. The
200
explanatory variables are: LOP, the log of oil price; LINR, the log of interest rate; LINF the log of inflation; LEX, the log of exchange rate; LUNE, the log of unemployment rate; LFS, the log of food supply; LEXD, the log of external debt; LCA, the log of current account; LFR, the log of foreign reserves. D(LOP) is first difference of log of oil price.
Sources: Author generated 2021
6.9.1.3 Discussion of Results on Hypotheses 3 Testing.
Tables 6.14 and 6.15 report the estimation results based on asymmetric oil price
changes. All the ECT coefficients in both net oil exporting and net oil importing
countries are negative and statistically significant. Indicating the presence of
significant 25.76% and 32.74% long run causal relationship between oil price and
inflation in net oil exporting and net oil importing, respectively. This result shows
that oil price-inflation nexus converges to long run equilibrium faster in net oil
importing countries more than net oil exporting countries.
Panel A results indicates that positive changes in oil prices have significant adverse
effect on inflation in both net oil exporting and net oil importing countries in Africa.
A 1%-point positive change in oil price validate 17.89% and 8.96% increase in
inflation respectively on net oil exporting and oil importing countries in Africa. This
result is consistent with the views of Misati et al. (2013) who predicted a long run
role of changes in oil price on inflation in Kenya. This result reveals more policy
challenge especially for net oil importing countries. The increasing adverse effect
of oil price changes on inflation can pass into the economy through inflation effect
channel (Tang et al.2009). For example, in an open economy, when inflation is
caused by increase in oil price shocks, monetary policy tightening can worsen the
long-term output by increasing interest rate and reduced investment (Brown and
Yucel 2002; Tang et al.2009). Thus, adverse effect of inflation is experienced.
In the short run, changes in oil price insignificantly affected inflation in net oil
exporting countries while it significantly and positively influences inflation in net
oil importing countries, with 1%-point change in oil price validated 4.92% increase
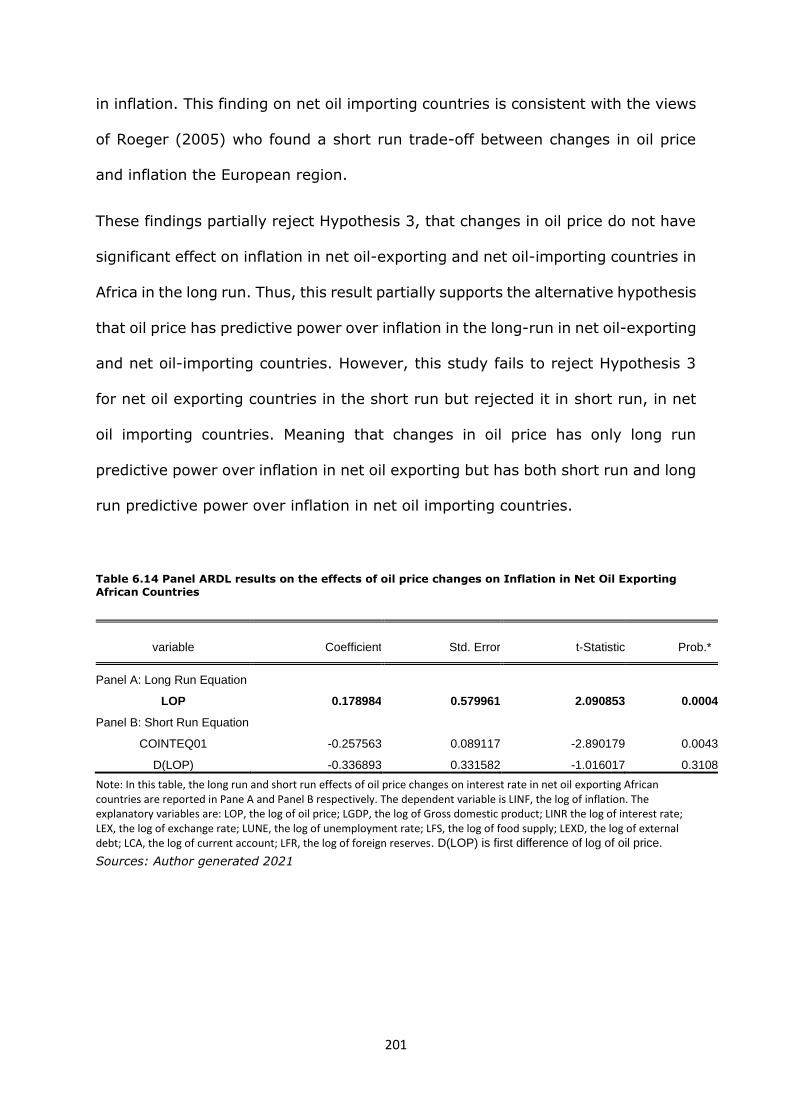
201
in inflation. This finding on net oil importing countries is consistent with the views
of Roeger (2005) who found a short run trade-off between changes in oil price
and inflation the European region.
These findings partially reject Hypothesis 3, that changes in oil price do not have
significant effect on inflation in net oil-exporting and net oil-importing countries in
Africa in the long run. Thus, this result partially supports the alternative hypothesis
that oil price has predictive power over inflation in the long-run in net oil-exporting
and net oil-importing countries. However, this study fails to reject Hypothesis 3
for net oil exporting countries in the short run but rejected it in short run, in net
oil importing countries. Meaning that changes in oil price has only long run
predictive power over inflation in net oil exporting but has both short run and long
run predictive power over inflation in net oil importing countries.
Table 6.14 Panel ARDL results on the effects of oil price changes on Inflation in Net Oil Exporting
African Countries
variable Coefficient Std. Error t-Statistic Prob.*
Panel A: Long Run Equation
LOP 0.178984 0.579961 2.090853 0.0004
Panel B: Short Run Equation
COINTEQ01 -0.257563 0.089117 -2.890179 0.0043
D(LOP) -0.336893 0.331582 -1.016017 0.3108
Note: In this table, the long run and short run effects of oil price changes on interest rate in net oil exporting African countries are reported in Pane A and Panel B respectively. The dependent variable is LINF, the log of inflation. The explanatory variables are: LOP, the log of oil price; LGDP, the log of Gross domestic product; LINR the log of interest rate; LEX, the log of exchange rate; LUNE, the log of unemployment rate; LFS, the log of food supply; LEXD, the log of external debt; LCA, the log of current account; LFR, the log of foreign reserves. D(LOP) is first difference of log of oil price.
Sources: Author generated 2021
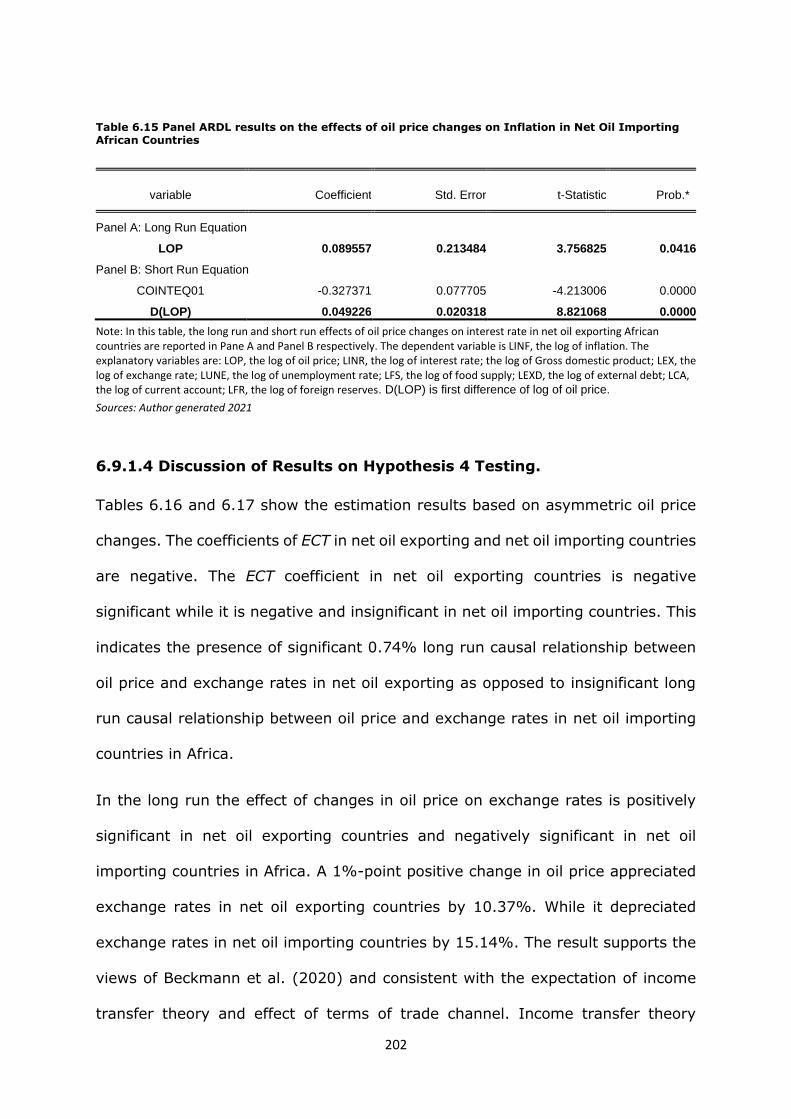
202
Table 6.15 Panel ARDL results on the effects of oil price changes on Inflation in Net Oil Importing African Countries
variable Coefficient Std. Error t-Statistic Prob.*
Panel A: Long Run Equation
LOP 0.089557 0.213484 3.756825 0.0416
Panel B: Short Run Equation
COINTEQ01 -0.327371 0.077705 -4.213006 0.0000
D(LOP) 0.049226 0.020318 8.821068 0.0000
Note: In this table, the long run and short run effects of oil price changes on interest rate in net oil exporting African countries are reported in Pane A and Panel B respectively. The dependent variable is LINF, the log of inflation. The explanatory variables are: LOP, the log of oil price; LINR, the log of interest rate; the log of Gross domestic product; LEX, the log of exchange rate; LUNE, the log of unemployment rate; LFS, the log of food supply; LEXD, the log of external debt; LCA, the log of current account; LFR, the log of foreign reserves. D(LOP) is first difference of log of oil price.
Sources: Author generated 2021
6.9.1.4 Discussion of Results on Hypothesis 4 Testing.
Tables 6.16 and 6.17 show the estimation results based on asymmetric oil price
changes. The coefficients of ECT in net oil exporting and net oil importing countries
are negative. The ECT coefficient in net oil exporting countries is negative
significant while it is negative and insignificant in net oil importing countries. This
indicates the presence of significant 0.74% long run causal relationship between
oil price and exchange rates in net oil exporting as opposed to insignificant long
run causal relationship between oil price and exchange rates in net oil importing
countries in Africa.
In the long run the effect of changes in oil price on exchange rates is positively
significant in net oil exporting countries and negatively significant in net oil
importing countries in Africa. A 1%-point positive change in oil price appreciated
exchange rates in net oil exporting countries by 10.37%. While it depreciated
exchange rates in net oil importing countries by 15.14%. The result supports the
views of Beckmann et al. (2020) and consistent with the expectation of income
transfer theory and effect of terms of trade channel. Income transfer theory
203
advocated that with increase in oil price, the purchasing power of net oil importing
countries increases while that of net oil importing countries decreases. This is as
result of appreciation of exchange rates in net oil exporting countries and
depreciation of exchange rates in net oil importing countries given a terms of trade
dynamics. According to Vieira and da Silva (2018) a possible explanation for
depreciating value of exchange rate especially in net oil importing countries can
attributed to key issue for stimulating the exports sector (export-oriented growth
strategies). The implication of this result is that policymakers should focus on long
term exchange rate policy aimed at shielding the domestic currency form oil price
shocks.
In the short run, exchange rates presented negative response to asymmetric
change in oil price in net oil exporting countries as opposed to a typical
insignificant response of exchange rate to changes in oil price in net oil importing
countries. Meaning that in the short run asymmetric changes in oil price have
more influence over exchange rates in net oil exporting countries than net oil
importing countries. This result will provide policymakers significant
understanding in dealing with exchange rates volatility caused by changes in oil
price in net oil exporting and net oil importing countries.
These findings partially reject Hypothesis 4, that changes in oil price do not have
significant effect on exchange rates in net oil-exporting and net oil-importing
countries in Africa in the long run. The partial rejection is because the response of
exchange rates in the long run is significant in both net oil exporting and importing
countries while the short run exchange response to changes in oil price is
significant in net oil exporting countries and insignificant in net oil importing
countries. Meaning that asymmetric changes in oil price forecasted exchange rates
in net oil exporting countries both in the long run and short run. However, changes
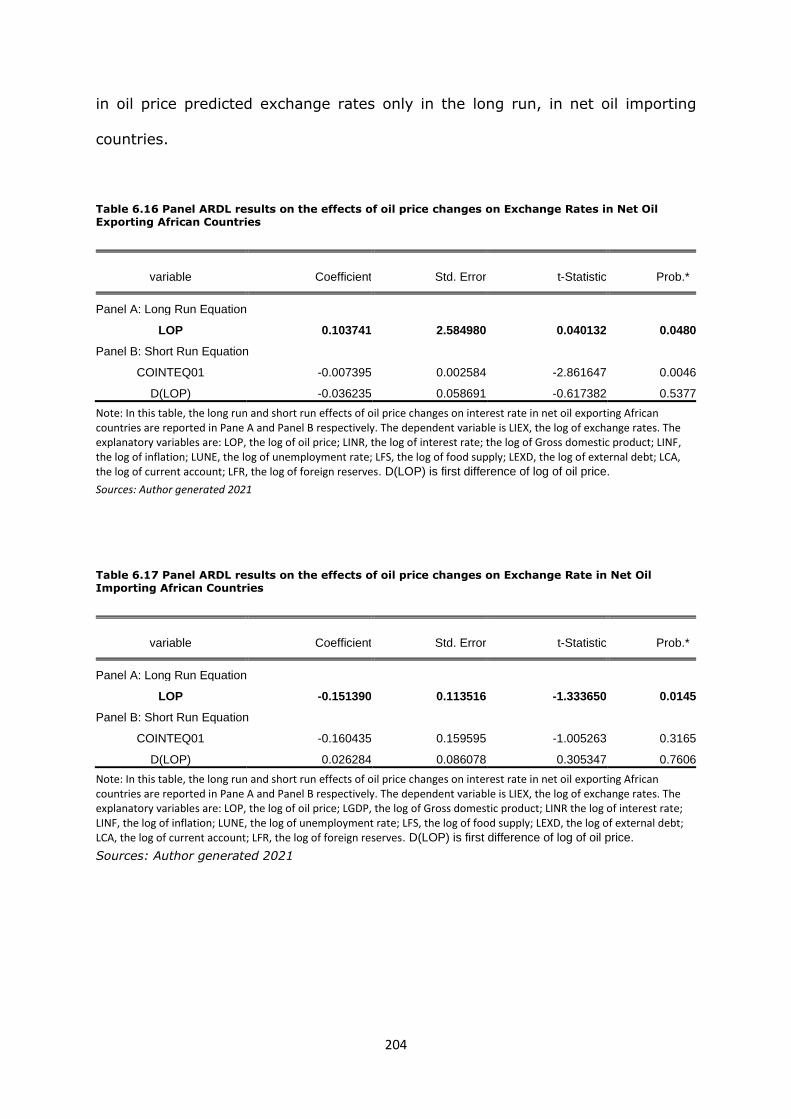
204
in oil price predicted exchange rates only in the long run, in net oil importing
countries.
Table 6.16 Panel ARDL results on the effects of oil price changes on Exchange Rates in Net Oil Exporting African Countries
variable Coefficient Std. Error t-Statistic Prob.*
Panel A: Long Run Equation
LOP 0.103741 2.584980 0.040132 0.0480
Panel B: Short Run Equation
COINTEQ01 -0.007395 0.002584 -2.861647 0.0046
D(LOP) -0.036235 0.058691 -0.617382 0.5377
Note: In this table, the long run and short run effects of oil price changes on interest rate in net oil exporting African countries are reported in Pane A and Panel B respectively. The dependent variable is LIEX, the log of exchange rates. The explanatory variables are: LOP, the log of oil price; LINR, the log of interest rate; the log of Gross domestic product; LINF, the log of inflation; LUNE, the log of unemployment rate; LFS, the log of food supply; LEXD, the log of external debt; LCA, the log of current account; LFR, the log of foreign reserves. D(LOP) is first difference of log of oil price.
Sources: Author generated 2021
Table 6.17 Panel ARDL results on the effects of oil price changes on Exchange Rate in Net Oil Importing African Countries
variable Coefficient Std. Error t-Statistic Prob.*
Panel A: Long Run Equation
LOP -0.151390 0.113516 -1.333650 0.0145
Panel B: Short Run Equation
COINTEQ01 -0.160435 0.159595 -1.005263 0.3165
D(LOP) 0.026284 0.086078 0.305347 0.7606
Note: In this table, the long run and short run effects of oil price changes on interest rate in net oil exporting African countries are reported in Pane A and Panel B respectively. The dependent variable is LIEX, the log of exchange rates. The explanatory variables are: LOP, the log of oil price; LGDP, the log of Gross domestic product; LINR the log of interest rate; LINF, the log of inflation; LUNE, the log of unemployment rate; LFS, the log of food supply; LEXD, the log of external debt; LCA, the log of current account; LFR, the log of foreign reserves. D(LOP) is first difference of log of oil price.
Sources: Author generated 2021
205
6.9.1.5 Discussion of Results on Hypothesis 5 Testing
Tables 6.18 and 6.19 present the estimation results based on asymmetric oil price
changes. All the ECT coefficients of net oil exporting and net oil importing countries
are negative but statistically insignificant. This indicates the presence of
insignificant long run causal relationship between oil price and unemployment rate
in both net oil exporting and net oil importing countries in Africa.
Panel A shows the long run effect of changes in oil price on unemployment rates.
Only net oil importing countries presented a positive and significant response of
unemployment rates to changes in oil price as against a typical insignificant
response of unemployment rates to changes in oil price in net oil exporting
countries in Africa. A 1%-point change in oil price corroborated 10.32% increase
in unemployment rates in net oil importing countries. This shows that changes in
oil price play a significant role in unemployment rate in net oil importing countries
in Africa. This result for net oil importing countries is consistent with the views of
Carruth et al. (1998) for U.S and Cheratian et al. (2019) for MENA region. This
result also supports the expectation of reallocation effect theory. Theory of
reallocation effect put forward that effect of changes in oil price on unemployment
rates is explained through changes in production cost. Long term changes in oil
price can cause potential impact on production cost, and this can lead to reduction
in productivity level and change in production structure (Kocaarslan et al.2020).
Potentially, this can create reallocation of labour and capital across sectors (Trang
et al.2017) and consequently great impact on unemployment rate (Loungani
1986; Doğrul and Soytas 2010).
Net oil exporting countries present a negative response of unemployment rates to
changes in oil price as against a typical insignificant response of unemployment
206
rates to changes in oil price in net oil importing countries in the short run. Meaning
that an asymmetric change in oil price has a short run adverse effect on
unemployment rate in net oil exporting countries than in net oil importing
countries. The short run result found in net oil exporting countries is consistent
with the views of Cheratian et al. (2019) for MENA region. The increasing adverse
effect of positive oil price on unemployment rates in net oil exporting countries
can be explained through increase in employment rate as the economy experience
expansion in economic activities (van Wijnbergen 1984; Olomola and Adejumo
2006). Meaning that long run and short run policies on oil price-unemployment
rate dynamics should target isolating macroeconomic variables from oil price
shocks.
These findings reject Hypothesis 5 that changes in oil price do not have significant
effect on unemployment rates in net oil-importing countries in the long run but
fail to reject it in net oil exporting countries in the long run. However, Hypothesis
5 is rejected in the short run, in net oil exporting countries but fails to be rejected
in the short run, in net oil importing countries. Meaning that asymmetric changes
in oil price have predictive power over unemployment rates in net oil importing
countries in the long run and insignificant to predict unemployment rate in the
long run, in net oil exporting countries. However, changes in oil price predicted
unemployment rates only in the short run, in net oil exporting countries.
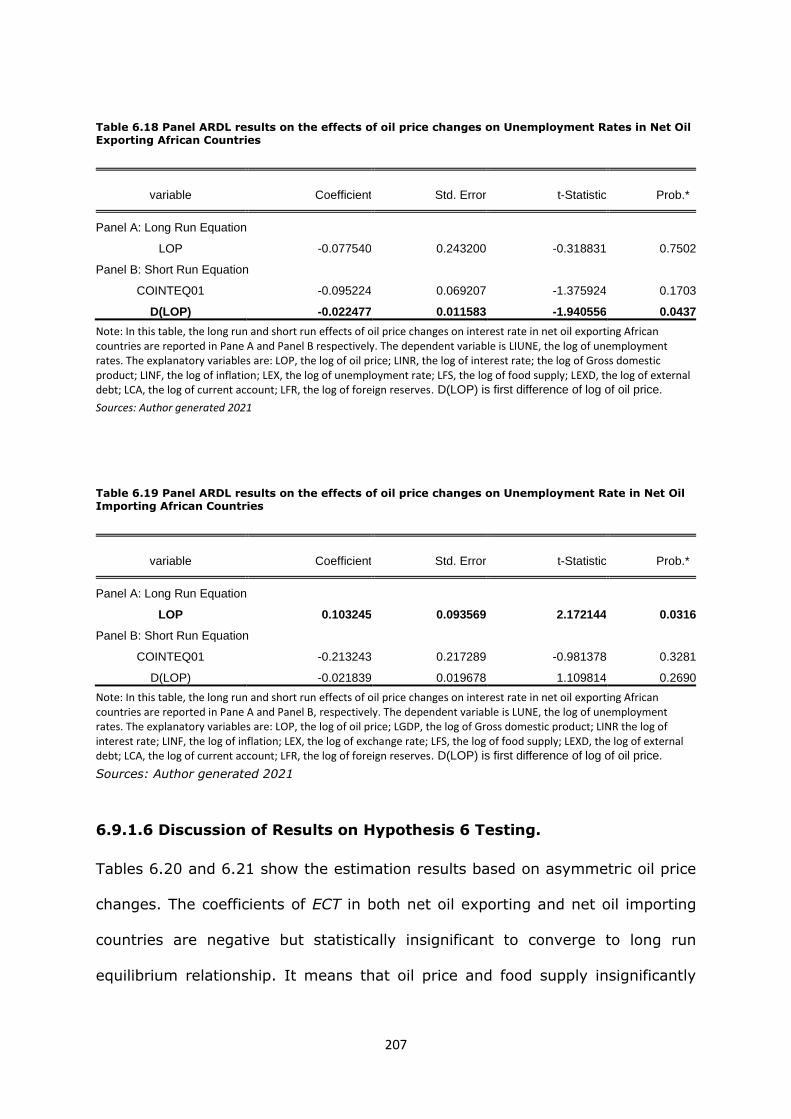
207
Table 6.18 Panel ARDL results on the effects of oil price changes on Unemployment Rates in Net Oil Exporting African Countries
variable Coefficient Std. Error t-Statistic Prob.*
Panel A: Long Run Equation
LOP -0.077540 0.243200 -0.318831 0.7502
Panel B: Short Run Equation
COINTEQ01 -0.095224 0.069207 -1.375924 0.1703
D(LOP) -0.022477 0.011583 -1.940556 0.0437
Note: In this table, the long run and short run effects of oil price changes on interest rate in net oil exporting African countries are reported in Pane A and Panel B respectively. The dependent variable is LIUNE, the log of unemployment rates. The explanatory variables are: LOP, the log of oil price; LINR, the log of interest rate; the log of Gross domestic product; LINF, the log of inflation; LEX, the log of unemployment rate; LFS, the log of food supply; LEXD, the log of external debt; LCA, the log of current account; LFR, the log of foreign reserves. D(LOP) is first difference of log of oil price.
Sources: Author generated 2021
Table 6.19 Panel ARDL results on the effects of oil price changes on Unemployment Rate in Net Oil Importing African Countries
variable Coefficient Std. Error t-Statistic Prob.*
Panel A: Long Run Equation
LOP 0.103245 0.093569 2.172144 0.0316
Panel B: Short Run Equation
COINTEQ01 -0.213243 0.217289 -0.981378 0.3281
D(LOP) -0.021839 0.019678 1.109814 0.2690
Note: In this table, the long run and short run effects of oil price changes on interest rate in net oil exporting African countries are reported in Pane A and Panel B, respectively. The dependent variable is LUNE, the log of unemployment rates. The explanatory variables are: LOP, the log of oil price; LGDP, the log of Gross domestic product; LINR the log of interest rate; LINF, the log of inflation; LEX, the log of exchange rate; LFS, the log of food supply; LEXD, the log of external debt; LCA, the log of current account; LFR, the log of foreign reserves. D(LOP) is first difference of log of oil price.
Sources: Author generated 2021
6.9.1.6 Discussion of Results on Hypothesis 6 Testing.
Tables 6.20 and 6.21 show the estimation results based on asymmetric oil price
changes. The coefficients of ECT in both net oil exporting and net oil importing
countries are negative but statistically insignificant to converge to long run
equilibrium relationship. It means that oil price and food supply insignificantly
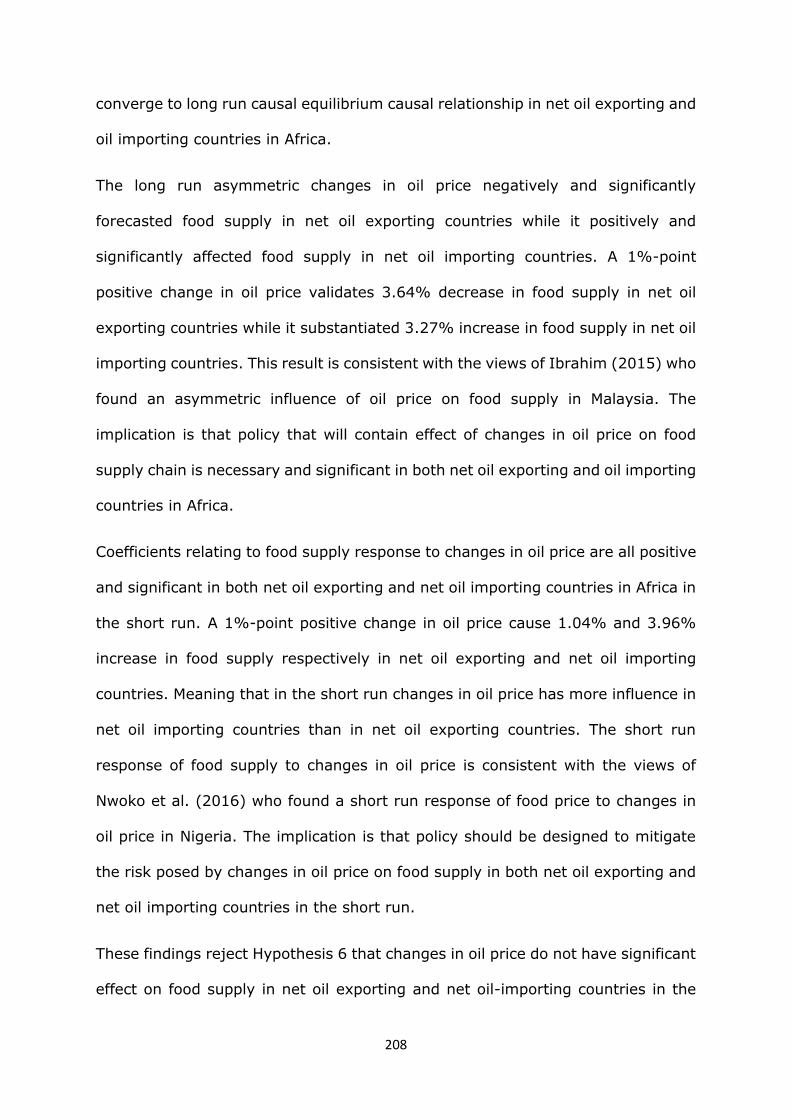
208
converge to long run causal equilibrium causal relationship in net oil exporting and
oil importing countries in Africa.
The long run asymmetric changes in oil price negatively and significantly
forecasted food supply in net oil exporting countries while it positively and
significantly affected food supply in net oil importing countries. A 1%-point
positive change in oil price validates 3.64% decrease in food supply in net oil
exporting countries while it substantiated 3.27% increase in food supply in net oil
importing countries. This result is consistent with the views of Ibrahim (2015) who
found an asymmetric influence of oil price on food supply in Malaysia. The
implication is that policy that will contain effect of changes in oil price on food
supply chain is necessary and significant in both net oil exporting and oil importing
countries in Africa.
Coefficients relating to food supply response to changes in oil price are all positive
and significant in both net oil exporting and net oil importing countries in Africa in
the short run. A 1%-point positive change in oil price cause 1.04% and 3.96%
increase in food supply respectively in net oil exporting and net oil importing
countries. Meaning that in the short run changes in oil price has more influence in
net oil importing countries than in net oil exporting countries. The short run
response of food supply to changes in oil price is consistent with the views of
Nwoko et al. (2016) who found a short run response of food price to changes in
oil price in Nigeria. The implication is that policy should be designed to mitigate
the risk posed by changes in oil price on food supply in both net oil exporting and
net oil importing countries in the short run.
These findings reject Hypothesis 6 that changes in oil price do not have significant
effect on food supply in net oil exporting and net oil-importing countries in the
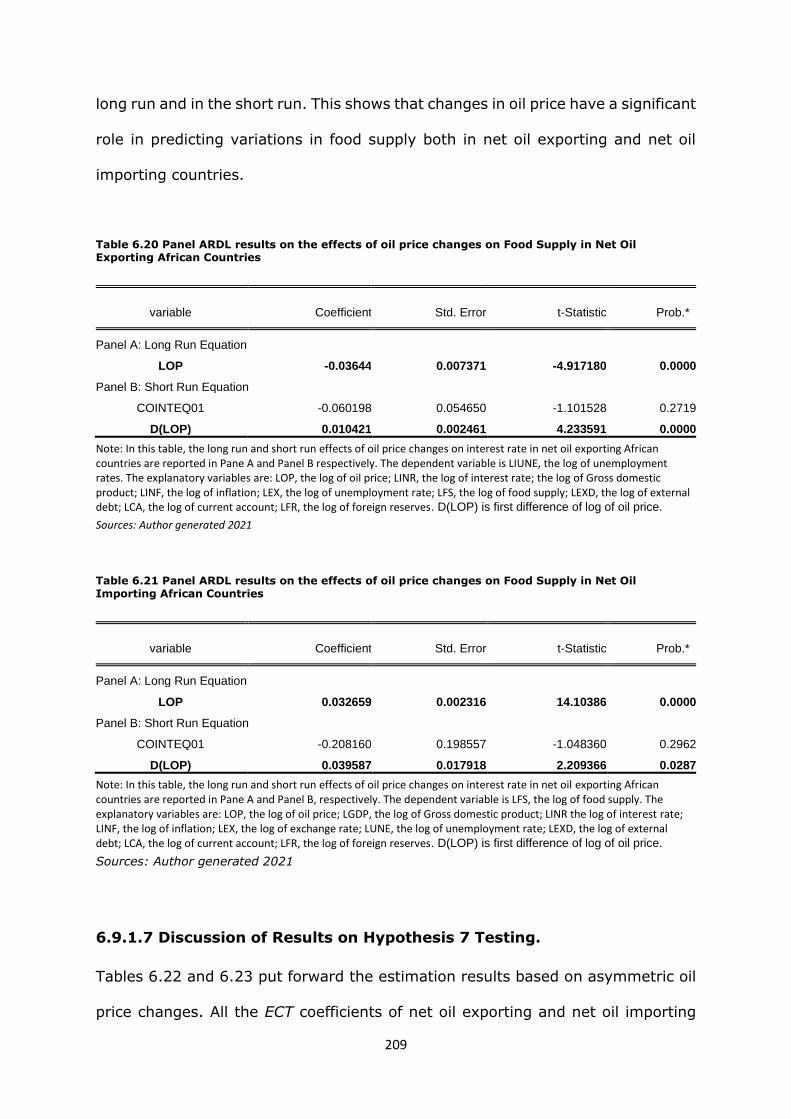
209
long run and in the short run. This shows that changes in oil price have a significant
role in predicting variations in food supply both in net oil exporting and net oil
importing countries.
Table 6.20 Panel ARDL results on the effects of oil price changes on Food Supply in Net Oil Exporting African Countries
variable Coefficient Std. Error t-Statistic Prob.*
Panel A: Long Run Equation
LOP -0.03644 0.007371 -4.917180 0.0000
Panel B: Short Run Equation
COINTEQ01 -0.060198 0.054650 -1.101528 0.2719
D(LOP) 0.010421 0.002461 4.233591 0.0000
Note: In this table, the long run and short run effects of oil price changes on interest rate in net oil exporting African countries are reported in Pane A and Panel B respectively. The dependent variable is LIUNE, the log of unemployment rates. The explanatory variables are: LOP, the log of oil price; LINR, the log of interest rate; the log of Gross domestic product; LINF, the log of inflation; LEX, the log of unemployment rate; LFS, the log of food supply; LEXD, the log of external debt; LCA, the log of current account; LFR, the log of foreign reserves. D(LOP) is first difference of log of oil price.
Sources: Author generated 2021
Table 6.21 Panel ARDL results on the effects of oil price changes on Food Supply in Net Oil Importing African Countries
variable Coefficient Std. Error t-Statistic Prob.*
Panel A: Long Run Equation
LOP 0.032659 0.002316 14.10386 0.0000
Panel B: Short Run Equation
COINTEQ01 -0.208160 0.198557 -1.048360 0.2962
D(LOP) 0.039587 0.017918 2.209366 0.0287
Note: In this table, the long run and short run effects of oil price changes on interest rate in net oil exporting African countries are reported in Pane A and Panel B, respectively. The dependent variable is LFS, the log of food supply. The explanatory variables are: LOP, the log of oil price; LGDP, the log of Gross domestic product; LINR the log of interest rate; LINF, the log of inflation; LEX, the log of exchange rate; LUNE, the log of unemployment rate; LEXD, the log of external debt; LCA, the log of current account; LFR, the log of foreign reserves. D(LOP) is first difference of log of oil price.
Sources: Author generated 2021
6.9.1.7 Discussion of Results on Hypothesis 7 Testing.
Tables 6.22 and 6.23 put forward the estimation results based on asymmetric oil
price changes. All the ECT coefficients of net oil exporting and net oil importing
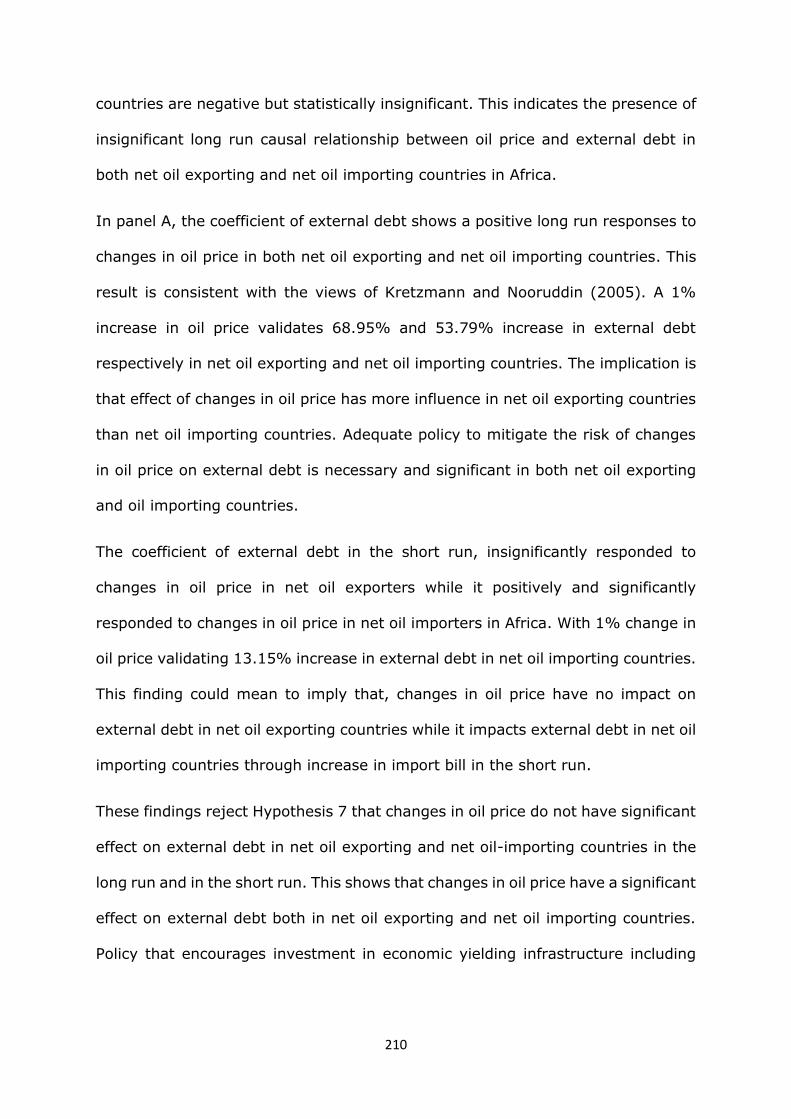
210
countries are negative but statistically insignificant. This indicates the presence of
insignificant long run causal relationship between oil price and external debt in
both net oil exporting and net oil importing countries in Africa.
In panel A, the coefficient of external debt shows a positive long run responses to
changes in oil price in both net oil exporting and net oil importing countries. This
result is consistent with the views of Kretzmann and Nooruddin (2005). A 1%
increase in oil price validates 68.95% and 53.79% increase in external debt
respectively in net oil exporting and net oil importing countries. The implication is
that effect of changes in oil price has more influence in net oil exporting countries
than net oil importing countries. Adequate policy to mitigate the risk of changes
in oil price on external debt is necessary and significant in both net oil exporting
and oil importing countries.
The coefficient of external debt in the short run, insignificantly responded to
changes in oil price in net oil exporters while it positively and significantly
responded to changes in oil price in net oil importers in Africa. With 1% change in
oil price validating 13.15% increase in external debt in net oil importing countries.
This finding could mean to imply that, changes in oil price have no impact on
external debt in net oil exporting countries while it impacts external debt in net oil
importing countries through increase in import bill in the short run.
These findings reject Hypothesis 7 that changes in oil price do not have significant
effect on external debt in net oil exporting and net oil-importing countries in the
long run and in the short run. This shows that changes in oil price have a significant
effect on external debt both in net oil exporting and net oil importing countries.
Policy that encourages investment in economic yielding infrastructure including
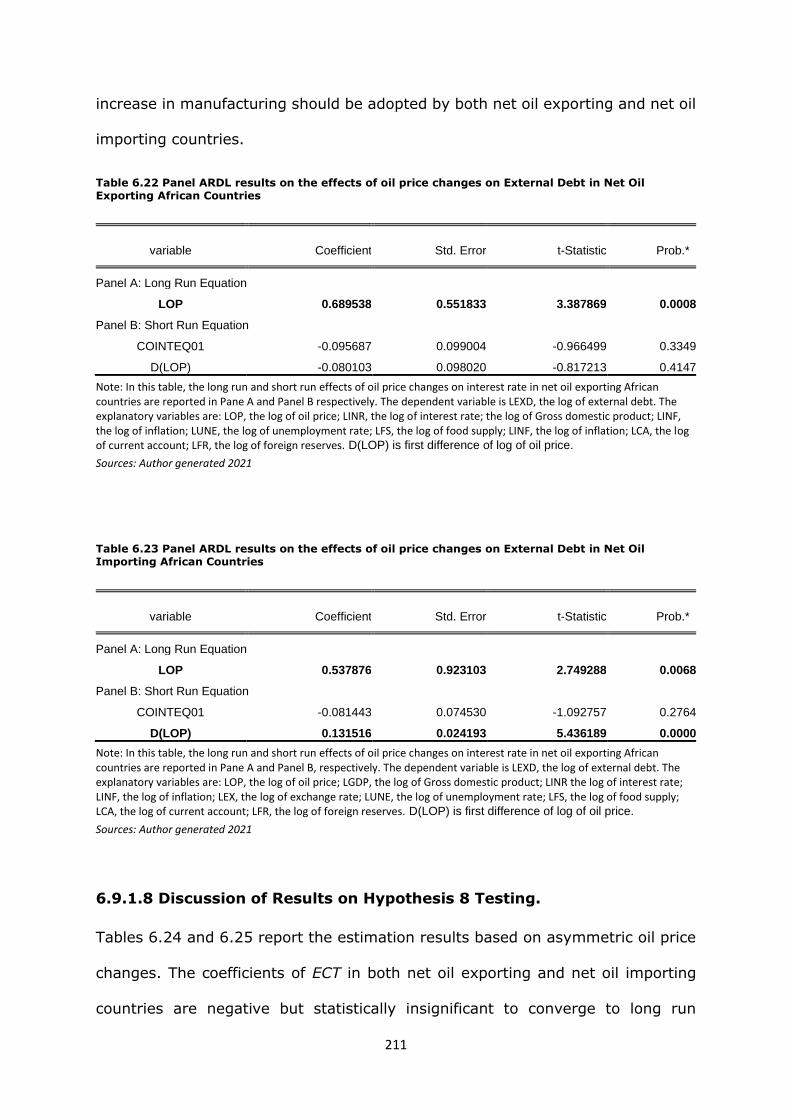
211
increase in manufacturing should be adopted by both net oil exporting and net oil
importing countries.
Table 6.22 Panel ARDL results on the effects of oil price changes on External Debt in Net Oil Exporting African Countries
variable Coefficient Std. Error t-Statistic Prob.*
Panel A: Long Run Equation
LOP 0.689538 0.551833 3.387869 0.0008
Panel B: Short Run Equation
COINTEQ01 -0.095687 0.099004 -0.966499 0.3349
D(LOP) -0.080103 0.098020 -0.817213 0.4147
Note: In this table, the long run and short run effects of oil price changes on interest rate in net oil exporting African countries are reported in Pane A and Panel B respectively. The dependent variable is LEXD, the log of external debt. The explanatory variables are: LOP, the log of oil price; LINR, the log of interest rate; the log of Gross domestic product; LINF, the log of inflation; LUNE, the log of unemployment rate; LFS, the log of food supply; LINF, the log of inflation; LCA, the log of current account; LFR, the log of foreign reserves. D(LOP) is first difference of log of oil price.
Sources: Author generated 2021
Table 6.23 Panel ARDL results on the effects of oil price changes on External Debt in Net Oil Importing African Countries
variable Coefficient Std. Error t-Statistic Prob.*
Panel A: Long Run Equation
LOP 0.537876 0.923103 2.749288 0.0068
Panel B: Short Run Equation
COINTEQ01 -0.081443 0.074530 -1.092757 0.2764
D(LOP) 0.131516 0.024193 5.436189 0.0000
Note: In this table, the long run and short run effects of oil price changes on interest rate in net oil exporting African countries are reported in Pane A and Panel B, respectively. The dependent variable is LEXD, the log of external debt. The explanatory variables are: LOP, the log of oil price; LGDP, the log of Gross domestic product; LINR the log of interest rate; LINF, the log of inflation; LEX, the log of exchange rate; LUNE, the log of unemployment rate; LFS, the log of food supply; LCA, the log of current account; LFR, the log of foreign reserves. D(LOP) is first difference of log of oil price.
Sources: Author generated 2021
6.9.1.8 Discussion of Results on Hypothesis 8 Testing.
Tables 6.24 and 6.25 report the estimation results based on asymmetric oil price
changes. The coefficients of ECT in both net oil exporting and net oil importing
countries are negative but statistically insignificant to converge to long run
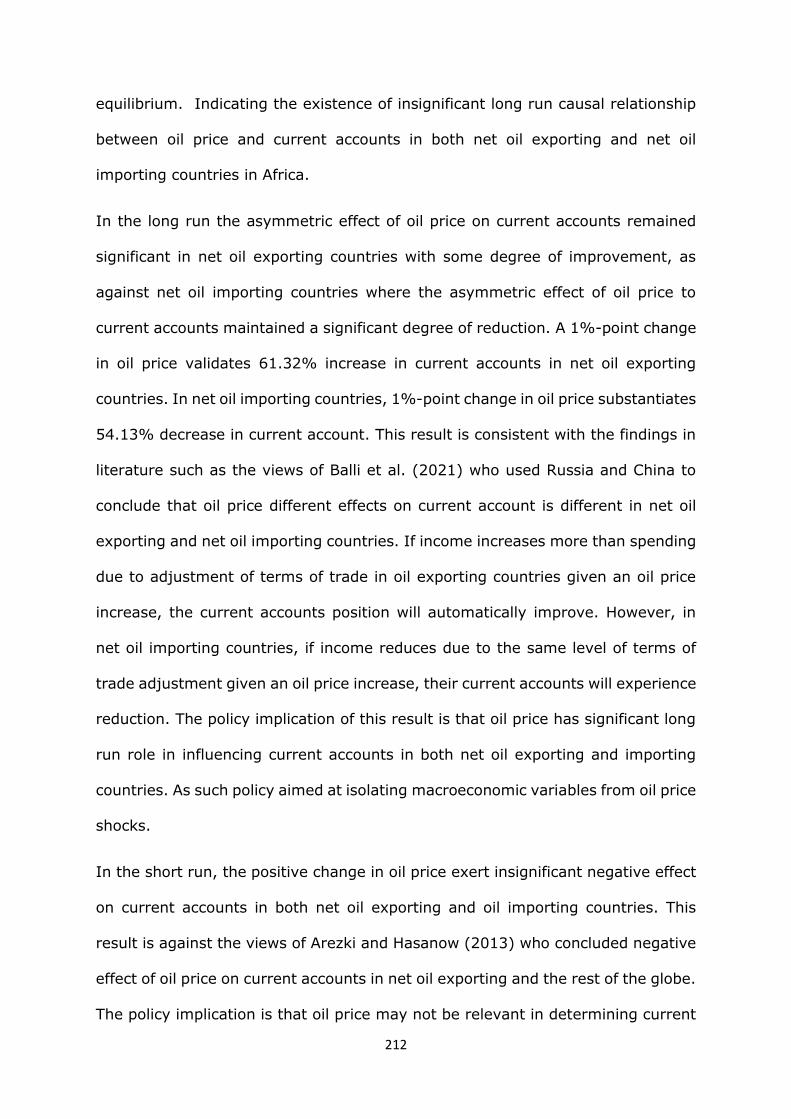
212
equilibrium. Indicating the existence of insignificant long run causal relationship
between oil price and current accounts in both net oil exporting and net oil
importing countries in Africa.
In the long run the asymmetric effect of oil price on current accounts remained
significant in net oil exporting countries with some degree of improvement, as
against net oil importing countries where the asymmetric effect of oil price to
current accounts maintained a significant degree of reduction. A 1%-point change
in oil price validates 61.32% increase in current accounts in net oil exporting
countries. In net oil importing countries, 1%-point change in oil price substantiates
54.13% decrease in current account. This result is consistent with the findings in
literature such as the views of Balli et al. (2021) who used Russia and China to
conclude that oil price different effects on current account is different in net oil
exporting and net oil importing countries. If income increases more than spending
due to adjustment of terms of trade in oil exporting countries given an oil price
increase, the current accounts position will automatically improve. However, in
net oil importing countries, if income reduces due to the same level of terms of
trade adjustment given an oil price increase, their current accounts will experience
reduction. The policy implication of this result is that oil price has significant long
run role in influencing current accounts in both net oil exporting and importing
countries. As such policy aimed at isolating macroeconomic variables from oil price
shocks.
In the short run, the positive change in oil price exert insignificant negative effect
on current accounts in both net oil exporting and oil importing countries. This
result is against the views of Arezki and Hasanow (2013) who concluded negative
effect of oil price on current accounts in net oil exporting and the rest of the globe.
The policy implication is that oil price may not be relevant in determining current
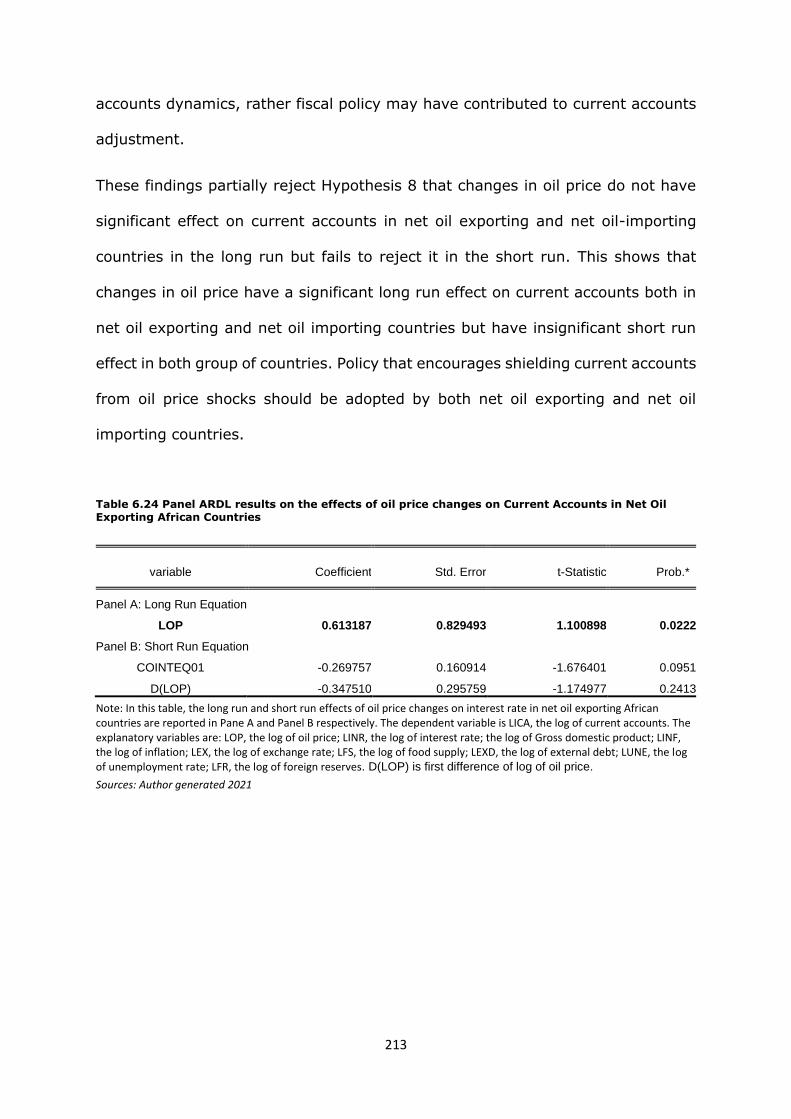
213
accounts dynamics, rather fiscal policy may have contributed to current accounts
adjustment.
These findings partially reject Hypothesis 8 that changes in oil price do not have
significant effect on current accounts in net oil exporting and net oil-importing
countries in the long run but fails to reject it in the short run. This shows that
changes in oil price have a significant long run effect on current accounts both in
net oil exporting and net oil importing countries but have insignificant short run
effect in both group of countries. Policy that encourages shielding current accounts
from oil price shocks should be adopted by both net oil exporting and net oil
importing countries.
Table 6.24 Panel ARDL results on the effects of oil price changes on Current Accounts in Net Oil Exporting African Countries
variable Coefficient Std. Error t-Statistic Prob.*
Panel A: Long Run Equation
LOP 0.613187 0.829493 1.100898 0.0222
Panel B: Short Run Equation
COINTEQ01 -0.269757 0.160914 -1.676401 0.0951
D(LOP) -0.347510 0.295759 -1.174977 0.2413
Note: In this table, the long run and short run effects of oil price changes on interest rate in net oil exporting African countries are reported in Pane A and Panel B respectively. The dependent variable is LICA, the log of current accounts. The explanatory variables are: LOP, the log of oil price; LINR, the log of interest rate; the log of Gross domestic product; LINF, the log of inflation; LEX, the log of exchange rate; LFS, the log of food supply; LEXD, the log of external debt; LUNE, the log of unemployment rate; LFR, the log of foreign reserves. D(LOP) is first difference of log of oil price.
Sources: Author generated 2021

214
Table 6.25 Panel ARDL results on the effects of oil price changes on Current Accounts in Net Oil Importing African Countries
variable Coefficient Std. Error t-Statistic Prob.*
Panel A: Long Run Equation
LOP -0.541271 0.44449 -1.028228 0.0357
Panel B: Short Run Equation
COINTEQ01 -0.005532 0.012216 -0.452857 0.6514
D(LOP) -0.608982 0.596646 -1.020676 0.3092
Note: In this table, the long run and short run effects of oil price changes on interest rate in net oil exporting African countries are reported in Pane A and Panel B, respectively. The dependent variable is LCA, the log of current accounts. The explanatory variables are: LOP, the log of oil price; LGDP, the log of Gross domestic product; LINR the log of interest rate; LINF, the log of inflation; LEX, the log of exchange rate; LFS, the log of food supply; LEXD, the log of external debt; LUNE, the log of unemployment rate; LFR, the log of foreign reserves. D(LOP) is first difference of log of oil price.
Sources: Author generated 2021
6.9.1.9 Discussion of Results on Hypothesis 9 Testing.
Tables 6.26 and 6.27 put forward the estimation results based on asymmetric oil
price changes. The coefficients of ECT in both net oil exporting and net oil
importing countries are negative. However, it is statistically significant in oil
exporters but insignificant in oil importers to converge to long run equilibrium
relationship. It means that with coefficient value of 35.17%, oil price and foreign
reserves significantly converge to long run causal relationship in net oil exporters
but insignificantly converge to long run equilibrium relationship in oil importers in
Africa.
Net oil exporting and importing countries present a long run positive response of
foreign reserves to changes in oil price. Meaning that an asymmetric change in oil
price has a long run improvement on foreign reserves in both net oil exporting
and importing countries. A 1%-point positive change in oil price accounted for
about 52.31% and 20.32% improvement in foreign reserves in net oil exporting
and importing countries, respectively. This shows that in the long run changes in
oil price has more positive influence in oil exporters more than oil importers. Thus,

215
effective long run foreign reserves policy that will take cognizance of oil price shock
should be put in place in both net oil exporting and oil importing countries. And
such policy includes implementing of exchange rates regimes and liquidity
management that will support domestic currency. This result supports the long
run views of Akighir and Kpoghul (2020) on oil price- foreign reserves nexus in
Nigeria.
The coefficient of foreign reserves in the short run, insignificantly responded to
increase in oil price in both net oil exporters and oil importers in Africa. This implies
that changes in oil price is insignificant in influencing foreign reserves in both net
oil exporting and importing countries in Africa. Therefore, policy aimed at
diversification including increase in non-oil exports should be encouraged to
increase the volume of foreign reserves. This result supports the short run views
of Shaibu and Izedonmi (2020) on oil price-external reserves relationship in
Nigeria.
These findings reject Hypothesis 9 that changes in oil price do not have significant
effect on foreign reserves in net oil exporting and net oil-importing countries in
the long run but fails to reject it in the short run. Implying that the coefficient of
oil price is not zero in predicting foreign reserves in the long run in both net oil
exporting and importing countries. However, in the short run oil price is
insignificant in forecasting foreign reserves in net oil exporting and importing
countries. Therefore, it is imperative and significant to pursue long run policy that
will shield foreign reserves from oil price shocks. Equally important is
diversification policy that will encourage export of non-oil products to enhance
foreign reserves increase in both net oil exporting and importing countries in
Africa.
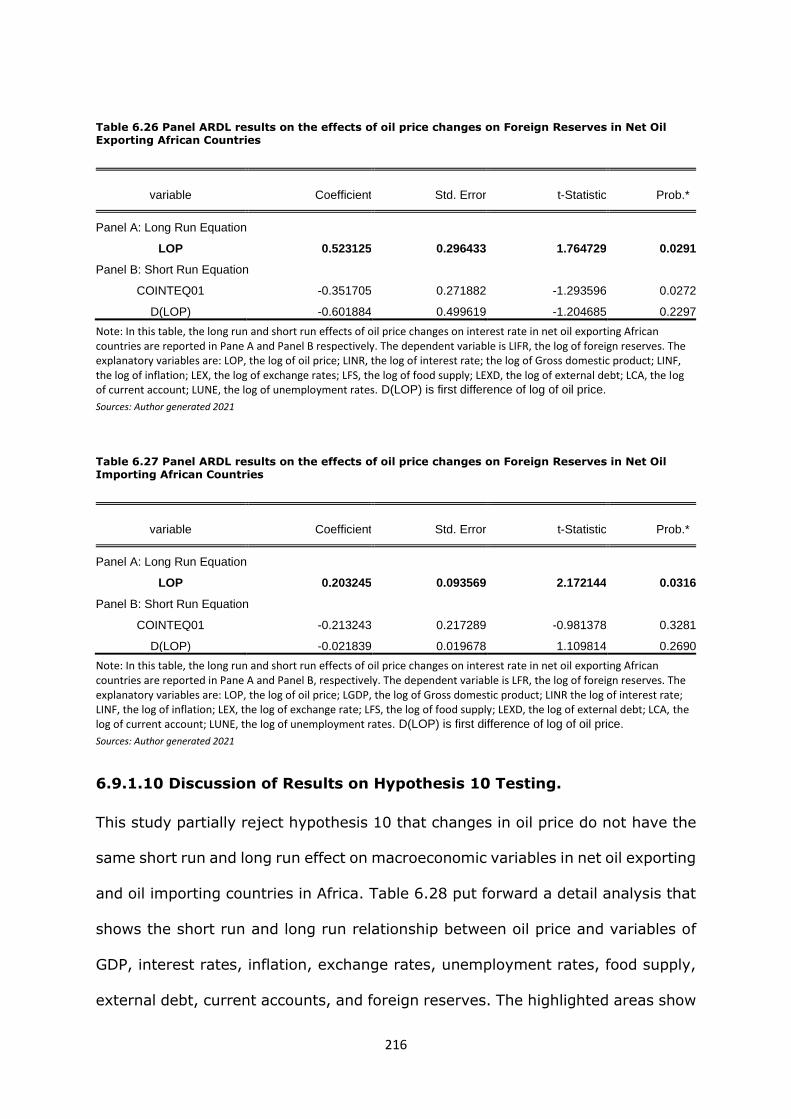
216
Table 6.26 Panel ARDL results on the effects of oil price changes on Foreign Reserves in Net Oil Exporting African Countries
variable Coefficient Std. Error t-Statistic Prob.*
Panel A: Long Run Equation
LOP 0.523125 0.296433 1.764729 0.0291
Panel B: Short Run Equation
COINTEQ01 -0.351705 0.271882 -1.293596 0.0272
D(LOP) -0.601884 0.499619 -1.204685 0.2297
Note: In this table, the long run and short run effects of oil price changes on interest rate in net oil exporting African countries are reported in Pane A and Panel B respectively. The dependent variable is LIFR, the log of foreign reserves. The explanatory variables are: LOP, the log of oil price; LINR, the log of interest rate; the log of Gross domestic product; LINF, the log of inflation; LEX, the log of exchange rates; LFS, the log of food supply; LEXD, the log of external debt; LCA, the log of current account; LUNE, the log of unemployment rates. D(LOP) is first difference of log of oil price.
Sources: Author generated 2021
Table 6.27 Panel ARDL results on the effects of oil price changes on Foreign Reserves in Net Oil Importing African Countries
variable Coefficient Std. Error t-Statistic Prob.*
Panel A: Long Run Equation
LOP 0.203245 0.093569 2.172144 0.0316
Panel B: Short Run Equation
COINTEQ01 -0.213243 0.217289 -0.981378 0.3281
D(LOP) -0.021839 0.019678 1.109814 0.2690
Note: In this table, the long run and short run effects of oil price changes on interest rate in net oil exporting African countries are reported in Pane A and Panel B, respectively. The dependent variable is LFR, the log of foreign reserves. The explanatory variables are: LOP, the log of oil price; LGDP, the log of Gross domestic product; LINR the log of interest rate; LINF, the log of inflation; LEX, the log of exchange rate; LFS, the log of food supply; LEXD, the log of external debt; LCA, the log of current account; LUNE, the log of unemployment rates. D(LOP) is first difference of log of oil price.
Sources: Author generated 2021
6.9.1.10 Discussion of Results on Hypothesis 10 Testing.
This study partially reject hypothesis 10 that changes in oil price do not have the
same short run and long run effect on macroeconomic variables in net oil exporting
and oil importing countries in Africa. Table 6.28 put forward a detail analysis that
shows the short run and long run relationship between oil price and variables of
GDP, interest rates, inflation, exchange rates, unemployment rates, food supply,
external debt, current accounts, and foreign reserves. The highlighted areas show

217
where this study reject Hypothesis 10 and accept alternative Hypothesis that
changes in oil price have the same short run and the long run effect on
macroeconomic variables in net oil exporting and net oil importing countries.
Table 6.28 Short Run and Long Run Analysis of Oil Price and Macroeconomic Variables in Net Oil Exporting and Importing Countries in Africa
Variables Short Run Analysis Long Run Analysis
Net Oil Exporters Net Oil Importers Net Oil Exporters Net Oil Importers
GDP
GDP responded positively and significantly to changes in oil price
GDP responded negatively and significantly to changes in oil
GDP responded positively and significantly to changes in oil price
GDP responded negatively and significantly to changes in oil price
Interest Rates
Positive changes in oil price have adverse effect on interest rates
Positive changes in oil price have adverse effect on interest rates
Positive changes in oil price have adverse effect on interest rates
Positive change in oil price adverse effect on interest rates
Inflation
Significant positive relationship exists between oil price and inflation
Insignificant relationship exists between oil price and inflation
Positive change in oil price have adverse effect on inflation
Positive changes in oil price have adverse effect on inflation.
Exchange Rates
Negative significant response of exchange rates to changes in oil price
Insignificant response of exchange rates to changes in oil price
Positive significant relationship exists between oil price and exchange rates.
Negative significant relationship exists between oil price and exchange rates
Unemployment Rates
Unemployment rates negatively and significantly responded to changes in oil price
Unemployment rates responded insignificantly to changes in oil price.
Unemployment rates positively and significantly responded to oil price.
Unemployment rates insignificantly responded to changes in oil price
Food Supply
Food supply positively and significantly responded to changes in oil
Food supply positively and significantly responded to changes in oil price
Food supply significantly and negatively responded to changes in oil price.
Food supply positively and significantly responded to changes in oil price
External Debt
External debt insignificant responded to changes in oil price
Oil price forecasted external debt positively and significantly.
Eternal debt positively and significantly responded to changes in oil price
Positive and significant relationship exist between oil price and external debt.
Current Accounts
Current accounts insignificantly and negatively responded to changes in oil price
Insignificant negative relationship exists between oil price and current accounts.
Positive and significant relationship between oil price and current accounts
Current accounts negatively and significantly responded to changes in oil
Foreign Reserves
Foreign reserves insignificantly responded to changes in oil price
Oil price insignificantly predicted foreign reserves
Foreign reserves positively and significantly responded to changes in oil price
Oil price positively and significantly forecasted foreign reserves.
Sources: Author generated 2021
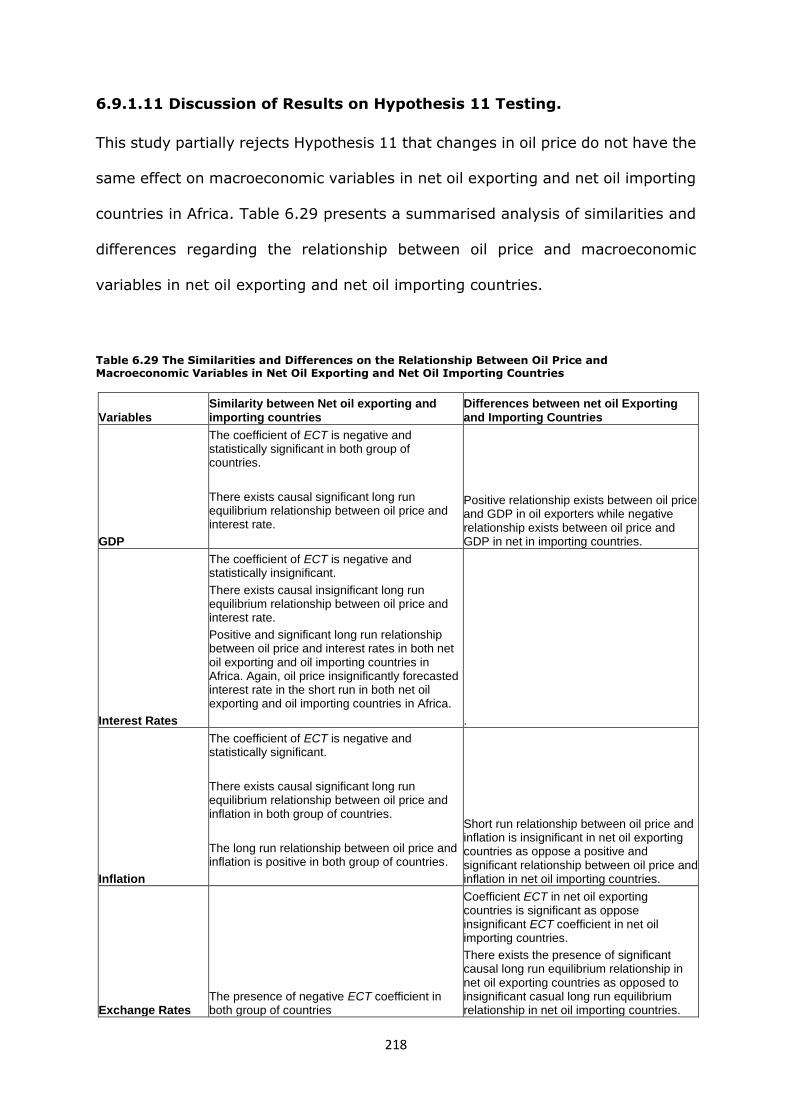
218
6.9.1.11 Discussion of Results on Hypothesis 11 Testing.
This study partially rejects Hypothesis 11 that changes in oil price do not have the
same effect on macroeconomic variables in net oil exporting and net oil importing
countries in Africa. Table 6.29 presents a summarised analysis of similarities and
differences regarding the relationship between oil price and macroeconomic
variables in net oil exporting and net oil importing countries.
Table 6.29 The Similarities and Differences on the Relationship Between Oil Price and Macroeconomic Variables in Net Oil Exporting and Net Oil Importing Countries
Variables Similarity between Net oil exporting and importing countries
Differences between net oil Exporting and Importing Countries
GDP
The coefficient of ECT is negative and statistically significant in both group of countries.
There exists causal significant long run equilibrium relationship between oil price and interest rate.
Positive relationship exists between oil price and GDP in oil exporters while negative relationship exists between oil price and GDP in net in importing countries.
Interest Rates
The coefficient of ECT is negative and statistically insignificant.
There exists causal insignificant long run equilibrium relationship between oil price and interest rate.
Positive and significant long run relationship between oil price and interest rates in both net oil exporting and oil importing countries in Africa. Again, oil price insignificantly forecasted interest rate in the short run in both net oil exporting and oil importing countries in Africa.
.
Inflation
The coefficient of ECT is negative and statistically significant.
There exists causal significant long run equilibrium relationship between oil price and inflation in both group of countries.
The long run relationship between oil price and inflation is positive in both group of countries.
Short run relationship between oil price and inflation is insignificant in net oil exporting countries as oppose a positive and significant relationship between oil price and inflation in net oil importing countries.
Exchange Rates The presence of negative ECT coefficient in both group of countries
Coefficient ECT in net oil exporting countries is significant as oppose insignificant ECT coefficient in net oil importing countries.
There exists the presence of significant causal long run equilibrium relationship in net oil exporting countries as opposed to insignificant casual long run equilibrium relationship in net oil importing countries.
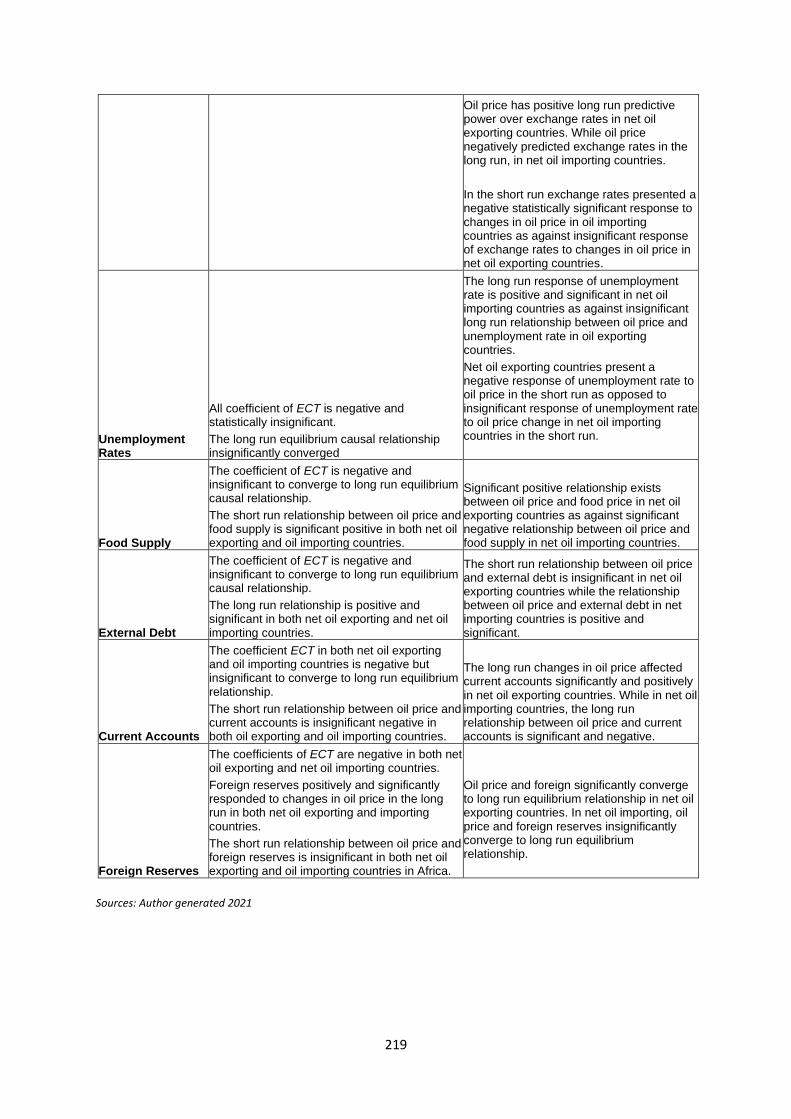
219
Oil price has positive long run predictive power over exchange rates in net oil exporting countries. While oil price negatively predicted exchange rates in the long run, in net oil importing countries.
In the short run exchange rates presented a negative statistically significant response to changes in oil price in oil importing countries as against insignificant response of exchange rates to changes in oil price in net oil exporting countries.
Unemployment Rates
All coefficient of ECT is negative and statistically insignificant.
The long run equilibrium causal relationship insignificantly converged
The long run response of unemployment rate is positive and significant in net oil importing countries as against insignificant long run relationship between oil price and unemployment rate in oil exporting countries.
Net oil exporting countries present a negative response of unemployment rate to oil price in the short run as opposed to insignificant response of unemployment rate to oil price change in net oil importing countries in the short run.
Food Supply
The coefficient of ECT is negative and insignificant to converge to long run equilibrium causal relationship.
The short run relationship between oil price and food supply is significant positive in both net oil exporting and oil importing countries.
Significant positive relationship exists between oil price and food price in net oil exporting countries as against significant negative relationship between oil price and food supply in net oil importing countries.
External Debt
The coefficient of ECT is negative and insignificant to converge to long run equilibrium causal relationship.
The long run relationship is positive and significant in both net oil exporting and net oil importing countries.
The short run relationship between oil price and external debt is insignificant in net oil exporting countries while the relationship between oil price and external debt in net importing countries is positive and significant.
Current Accounts
The coefficient ECT in both net oil exporting and oil importing countries is negative but insignificant to converge to long run equilibrium relationship.
The short run relationship between oil price and current accounts is insignificant negative in both oil exporting and oil importing countries.
The long run changes in oil price affected current accounts significantly and positively in net oil exporting countries. While in net oil importing countries, the long run relationship between oil price and current accounts is significant and negative.
Foreign Reserves
The coefficients of ECT are negative in both net oil exporting and net oil importing countries.
Foreign reserves positively and significantly responded to changes in oil price in the long run in both net oil exporting and importing countries.
The short run relationship between oil price and foreign reserves is insignificant in both net oil exporting and oil importing countries in Africa.
Oil price and foreign significantly converge to long run equilibrium relationship in net oil exporting countries. In net oil importing, oil price and foreign reserves insignificantly converge to long run equilibrium relationship.
Sources: Author generated 2021
220
6.10 Granger-causality Test Results
This section tests the causality between oil price and key macroeconomic variables
using Granger-causality test and Wald test techniques. This is to help check the
robustness of the panel ARDL results. The Granger-causality test is used to
determine the direction of the long run relationship between oil price and the key
macroeconomic variables.
Standard Granger Causality and Dumitrescu-Hurlin causality tests are used. The
test results are reported in table 6.30. Since a nine-variable panel ARDL model is
used, nine panels are generated from the software output. The tests are carried
out for both net oil-exporting and net oil-importing African countries.
The result of standard Granger-causality test technique shows that the null
hypothesis that oil price does not Granger-cause the key macroeconomic variables
is rejected at 5% critical level in both net oil exporting and oil importing countries.
Granger-causality runs from oil price to interest rates in net oil exporting
countries. This result is in line with the study document by Al-hajj et al. (2017) for
Malaysia. Identified also is a bidirectional causality running from oil price to
interest rates and interest rates to oil price in net oil importing countries. This
finding supports the views of Obadi and Korcek (2018) who found bidirectional
causality running from oil price to money supply and vice versa in US.
Furthermore, causality runs from oil price to foreign reserves in net oil exporting
countries. This result support the views of Olayungbo (2019) who found causality
running from oil price to foreign reserves in Nigeria. Besides, oil price is found to
Granger-cause current accounts in net oil importing countries. This finding aligns
with the views of Olayungbo (2019) for Nigeria. Causality is found to run from
GDP to oil price in net oil importing countries. This finding supports the views of
221
Maghrebi et al. (2018) who found causality running from GDP to oil price in Saudi
Arabia.
The results from Dumitrescu-Hurlin causality test shows that the null hypothesis
that oil price does not Granger cause the key macroeconomic variables is rejected
at 5% critical level in both net oil exporting and importing countries. Oil price is
found to Granger-cause foreign reserves in net oil exporting countries. This result
aligns with view of Osuji (2015) who found causality running from oil price to
foreign reserves in Nigeria. Oil price and unemployment cause one other in net oil
exporting countries while causality run from oil price to unemployment rates in
net oil importing countries. The causality running from oil price to unemployment
rates is in line with study documented by Papapetrou (2001) and Doğrul and
Soytas (2010) who found causality running oil price to unemployment rate in
Greece and Turkey respectively but not the other way round. Furthermore, oil
price and interest rates cause each other in net oil importing countries. This result
supported the findings of Raji et al. (2014) who concluded bidirectional causality
between oil price and interest rate in Nigeria. Additionally, causality runs from oil
price to exchange rates in net oil importing countries. This finding is consistent
with views of Kim and Jung (2018) who concluded Granger-causality run from oil
price to exchange rates in US.
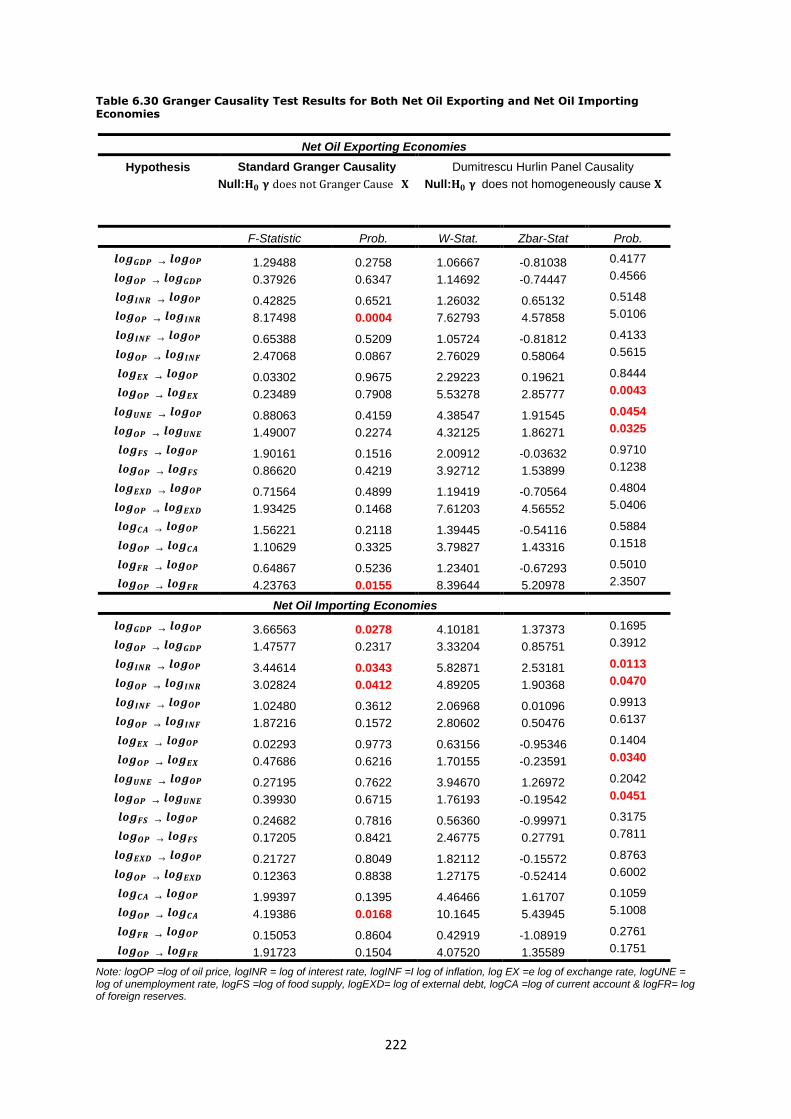
222
Table 6.30 Granger Causality Test Results for Both Net Oil Exporting and Net Oil Importing Economies
Net Oil Exporting Economies
Hypothesis
Standard Granger Causality
Null:𝐇𝟎 𝛄 does not Granger Cause 𝚾
Dumitrescu Hurlin Panel Causality
Null:𝐇𝟎 𝛄 does not homogeneously cause 𝚾
F-Statistic Prob. W-Stat. Zbar-Stat Prob.
𝒍𝒐𝒈𝑮𝑫𝑷 → 𝒍𝒐𝒈𝑶𝑷
𝒍𝒐𝒈𝑶𝑷 → 𝒍𝒐𝒈𝑮𝑫𝑷
1.29488
0.37926
0.2758
0.6347
1.06667
1.14692
-0.81038
-0.74447
0.4177
0.4566
𝒍𝒐𝒈𝑰𝑵𝑹 → 𝒍𝒐𝒈𝑶𝑷
𝒍𝒐𝒈𝑶𝑷 → 𝒍𝒐𝒈𝑰𝑵𝑹
0.42825
8.17498
0.6521
0.0004
1.26032
7.62793
0.65132
4.57858
0.5148
5.0106
𝒍𝒐𝒈𝑰𝑵𝑭 → 𝒍𝒐𝒈𝑶𝑷
𝒍𝒐𝒈𝑶𝑷 → 𝒍𝒐𝒈𝑰𝑵𝑭
0.65388
2.47068
0.5209
0.0867
1.05724
2.76029
-0.81812
0.58064
0.4133
0.5615
𝒍𝒐𝒈𝑬𝑿 → 𝒍𝒐𝒈𝑶𝑷
𝒍𝒐𝒈𝑶𝑷 → 𝒍𝒐𝒈𝑬𝑿
0.03302
0.23489
0.9675
0.7908
2.29223
5.53278
0.19621
2.85777
0.8444
0.0043
𝒍𝒐𝒈𝑼𝑵𝑬 → 𝒍𝒐𝒈𝑶𝑷
𝒍𝒐𝒈𝑶𝑷 → 𝒍𝒐𝒈𝑼𝑵𝑬
0.88063
1.49007
0.4159
0.2274
4.38547
4.32125
1.91545
1.86271
0.0454
0.0325
𝒍𝒐𝒈𝑭𝑺 → 𝒍𝒐𝒈𝑶𝑷
𝒍𝒐𝒈𝑶𝑷 → 𝒍𝒐𝒈𝑭𝑺
1.90161
0.86620
0.1516
0.4219
2.00912
3.92712
-0.03632
1.53899
0.9710
0.1238
𝒍𝒐𝒈𝑬𝑿𝑫 → 𝒍𝒐𝒈𝑶𝑷
𝒍𝒐𝒈𝑶𝑷 → 𝒍𝒐𝒈𝑬𝑿𝑫
0.71564
1.93425
0.4899
0.1468
1.19419
7.61203
-0.70564
4.56552
0.4804
5.0406
𝒍𝒐𝒈𝑪𝑨 → 𝒍𝒐𝒈𝑶𝑷
𝒍𝒐𝒈𝑶𝑷 → 𝒍𝒐𝒈𝑪𝑨
1.56221
1.10629
0.2118
0.3325
1.39445
3.79827
-0.54116
1.43316
0.5884
0.1518
𝒍𝒐𝒈𝑭𝑹 → 𝒍𝒐𝒈𝑶𝑷
𝒍𝒐𝒈𝑶𝑷 → 𝒍𝒐𝒈𝑭𝑹
0.64867
4.23763
0.5236
0.0155
1.23401
8.39644
-0.67293
5.20978
0.5010
2.3507
Net Oil Importing Economies
𝒍𝒐𝒈𝑮𝑫𝑷 → 𝒍𝒐𝒈𝑶𝑷
𝒍𝒐𝒈𝑶𝑷 → 𝒍𝒐𝒈𝑮𝑫𝑷
3.66563
1.47577
0.0278
0.2317
4.10181
3.33204
1.37373
0.85751
0.1695
0.3912
𝒍𝒐𝒈𝑰𝑵𝑹 → 𝒍𝒐𝒈𝑶𝑷
𝒍𝒐𝒈𝑶𝑷 → 𝒍𝒐𝒈𝑰𝑵𝑹
3.44614
3.02824
0.0343
0.0412
5.82871
4.89205
2.53181
1.90368
0.0113
0.0470
𝒍𝒐𝒈𝑰𝑵𝑭 → 𝒍𝒐𝒈𝑶𝑷
𝒍𝒐𝒈𝑶𝑷 → 𝒍𝒐𝒈𝑰𝑵𝑭
1.02480
1.87216
0.3612
0.1572
2.06968
2.80602
0.01096
0.50476
0.9913
0.6137
𝒍𝒐𝒈𝑬𝑿 → 𝒍𝒐𝒈𝑶𝑷
𝒍𝒐𝒈𝑶𝑷 → 𝒍𝒐𝒈𝑬𝑿
0.02293
0.47686
0.9773
0.6216
0.63156
1.70155
-0.95346
-0.23591
0.1404
0.0340
𝒍𝒐𝒈𝑼𝑵𝑬 → 𝒍𝒐𝒈𝑶𝑷
𝒍𝒐𝒈𝑶𝑷 → 𝒍𝒐𝒈𝑼𝑵𝑬
0.27195
0.39930
0.7622
0.6715
3.94670
1.76193
1.26972
-0.19542
0.2042
0.0451
𝒍𝒐𝒈𝑭𝑺 → 𝒍𝒐𝒈𝑶𝑷
𝒍𝒐𝒈𝑶𝑷 → 𝒍𝒐𝒈𝑭𝑺
0.24682
0.17205
0.7816
0.8421
0.56360
2.46775
-0.99971
0.27791
0.3175
0.7811
𝒍𝒐𝒈𝑬𝑿𝑫 → 𝒍𝒐𝒈𝑶𝑷
𝒍𝒐𝒈𝑶𝑷 → 𝒍𝒐𝒈𝑬𝑿𝑫
0.21727
0.12363
0.8049
0.8838
1.82112
1.27175
-0.15572
-0.52414
0.8763
0.6002
𝒍𝒐𝒈𝑪𝑨 → 𝒍𝒐𝒈𝑶𝑷
𝒍𝒐𝒈𝑶𝑷 → 𝒍𝒐𝒈𝑪𝑨
1.99397
4.19386
0.1395
0.0168
4.46466
10.1645
1.61707
5.43945
0.1059
5.1008
𝒍𝒐𝒈𝑭𝑹 → 𝒍𝒐𝒈𝑶𝑷
𝒍𝒐𝒈𝑶𝑷 → 𝒍𝒐𝒈𝑭𝑹
0.15053
1.91723
0.8604
0.1504
0.42919
4.07520
-1.08919
1.35589
0.2761
0.1751
Note: logOP =log of oil price, logINR = log of interest rate, logINF =I log of inflation, log EX =e log of exchange rate, logUNE = log of unemployment rate, logFS =log of food supply, logEXD= log of external debt, logCA =log of current account & logFR= log of foreign reserves.
223
Sources: Author generated 2021
6.11 Wald Test Result
In addition to the Granger-causality test, this section tests if a short-run Granger
Causality exists between log of oil price and key macroeconomic variables in both
net oil-exporting and net oil-importing African countries using Wald test. The lag
length was selected based on the Akaike Information criteria at lag 1 in 6.4 table,
6.4 section 6.4 of this chapter. Wald test which tests the null hypothesis that oil
price coefficient is zero in the key macroeconomic variables equations in both net
oil exporting and oil importing countries is carried out. The results are reported
for net oil exporting and importing African countries in table 6.31 and 6.32,
respectively.
In panels A to I, the probability value of the Wald test evidence that, this study
accepts the hypothesis that changes in oil price are statistically significant at 5%
level in causing variables of GDP, interest rates, exchange rates, unemployment
rates, food supply, current accounts, and foreign reserves in net oil exporting
countries. This finding supports the views of Aliyu (2011) who found short run
causality running from oil price to economic variables in Nigeria. It is also
consistent with the study documented by Nwoke et al. (2016) for Nigeria with
respect to oil price and food price. Panel A to I report the short run Granger
causality experienced by Wald test using the probability value in net oil importing
countries. The result revealed that oil price Granger-cause variables of GDP,
interest rate, exchange rates, inflation, unemployment rates, food supply,
external debt, current accounts, and foreign reserves.

224
Table 6.31 Wald Test results on the effects of oil price changes on key macroeconomic variables in Net Oil Exporting African Countries
Test Statistic Value df Probability
Panel A: Wald test on whether changes in oil prices cause changes in GDP in the short run
t-statistic 0.417788 210 0.6765
F-statistic 0.174547 (1, 210) 0.6765
Chi-square 0.174547 1 0.6761
Null Hypothesis: C(LOP)=0
Null Hypothesis Summary:
Normalized Restriction (= 0) Value Std. Err.
C(LOP) 0.031620 0.075685
Panel B: Wald test on whether changes in oil prices cause changes in interest rates in the short run
t-statistic 1.499696 210 0.1352
F-statistic 2.249089 (1,210) 0.1352
Chi-square 2.249089 1 0.1337
Null Hypothesis: C(LOP)=0
Null Hypothesis Summary:
Normalized Restriction (= 0) Value Std. Err.
C(LOP) 0.369638 0.246475
Panel C: Wald test on whether changes in oil prices cause changes in inflation in the short run
t-statistic 5.381947 210 0.0000
F-statistic 28.96536 (1, 210) 0.0000
Chi-square 28.96536 1 0.0000
Null Hypothesis: C(LOP)=0
Null Hypothesis Summary:
Normalized Restriction (= 0) Value Std. Err.
C(LOP) 0.922905 0.171482
Panel D: Wald test on whether changes in oil prices cause changes in exchange rates in the short run
t-statistic 0.230340 210 0.8181
F-statistic 0.053057 (1, 210) 0.8181
Chi-square 0.053057 1 0.8178
Null Hypothesis: C(LOP)=0
Null Hypothesis Summary:
Normalized Restriction (= 0) Value Std. Err.
C(LOP) 0.2.442829 10.60531
Panel E: Wald test on whether changes in oil prices cause changes in unemployment rates in the short run
t-statistic 0.114282 210 0.9091
F-statistic 0.013060 (1,210) 0.9091
Chi-square 0.013060 1 0.9090
Null Hypothesis C(LOP)=0
Null Hypothesis Summary:
Normalized Restriction (= 0) Value Std. Err.
C(LOP) 0.014654 0.128225
Panel F: Wald test on whether changes in oil prices cause changes in food supply in the short run
t-statistic 0.016336 210 0.9870
F-statistic 0.000267 (1,201) 0.9870
Chi-square 0.000267 1 0.9870
Null Hypothesis C(LOP)=0
Null Hypothesis Summary:
Normalized Restriction (= 0) Value Std. Err.
C(LOP) 1.856488 113.6423
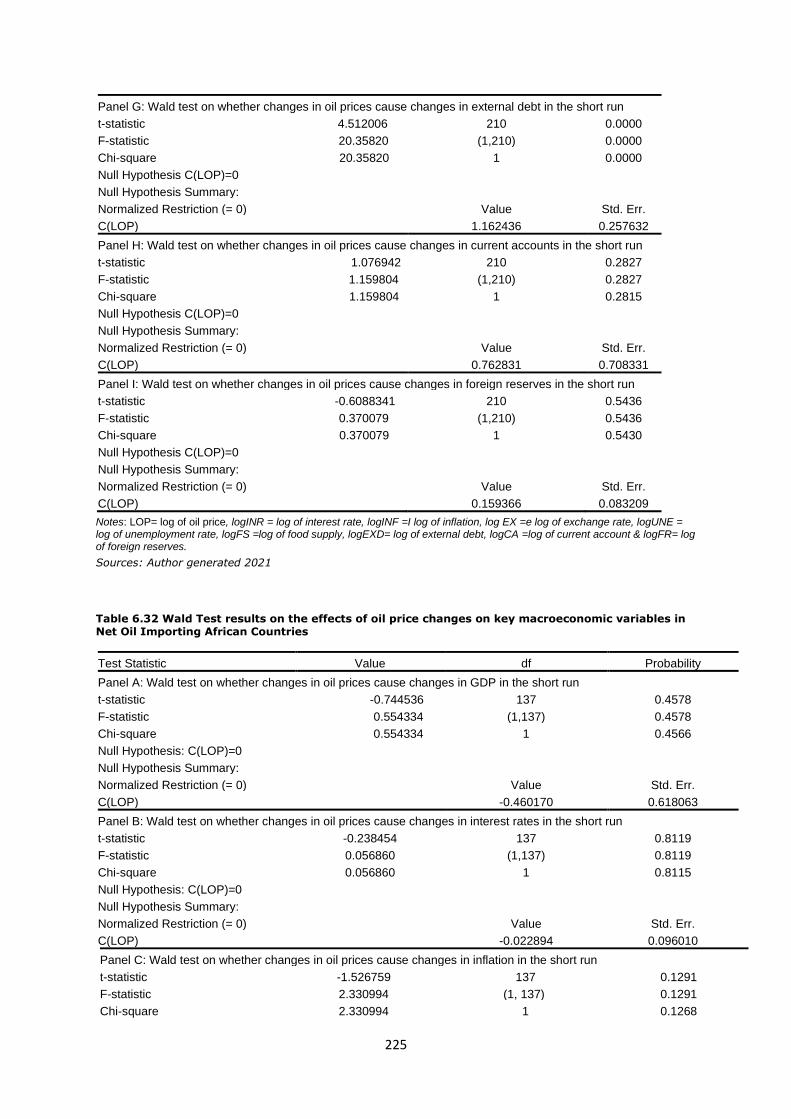
225
Panel G: Wald test on whether changes in oil prices cause changes in external debt in the short run
t-statistic 4.512006 210 0.0000
F-statistic 20.35820 (1,210) 0.0000
Chi-square 20.35820 1 0.0000
Null Hypothesis C(LOP)=0
Null Hypothesis Summary:
Normalized Restriction (= 0) Value Std. Err.
C(LOP) 1.162436 0.257632
Panel H: Wald test on whether changes in oil prices cause changes in current accounts in the short run
t-statistic 1.076942 210 0.2827
F-statistic 1.159804 (1,210) 0.2827
Chi-square 1.159804 1 0.2815
Null Hypothesis C(LOP)=0
Null Hypothesis Summary:
Normalized Restriction (= 0) Value Std. Err.
C(LOP) 0.762831 0.708331
Panel I: Wald test on whether changes in oil prices cause changes in foreign reserves in the short run
t-statistic -0.6088341 210 0.5436
F-statistic 0.370079 (1,210) 0.5436
Chi-square 0.370079 1 0.5430
Null Hypothesis C(LOP)=0
Null Hypothesis Summary:
Normalized Restriction (= 0) Value Std. Err.
C(LOP) 0.159366 0.083209
Notes: LOP= log of oil price, logINR = log of interest rate, logINF =I log of inflation, log EX =e log of exchange rate, logUNE = log of unemployment rate, logFS =log of food supply, logEXD= log of external debt, logCA =log of current account & logFR= log of foreign reserves.
Sources: Author generated 2021
Table 6.32 Wald Test results on the effects of oil price changes on key macroeconomic variables in Net Oil Importing African Countries
Test Statistic Value df Probability
Panel A: Wald test on whether changes in oil prices cause changes in GDP in the short run
t-statistic -0.744536 137 0.4578
F-statistic 0.554334 (1,137) 0.4578
Chi-square 0.554334 1 0.4566
Null Hypothesis: C(LOP)=0
Null Hypothesis Summary:
Normalized Restriction (= 0) Value Std. Err.
C(LOP) -0.460170 0.618063
Panel B: Wald test on whether changes in oil prices cause changes in interest rates in the short run
t-statistic -0.238454 137 0.8119
F-statistic 0.056860 (1,137) 0.8119
Chi-square 0.056860 1 0.8115
Null Hypothesis: C(LOP)=0
Null Hypothesis Summary:
Normalized Restriction (= 0) Value Std. Err.
C(LOP) -0.022894 0.096010
Panel C: Wald test on whether changes in oil prices cause changes in inflation in the short run
t-statistic -1.526759 137 0.1291
F-statistic 2.330994 (1, 137) 0.1291
Chi-square 2.330994 1 0.1268
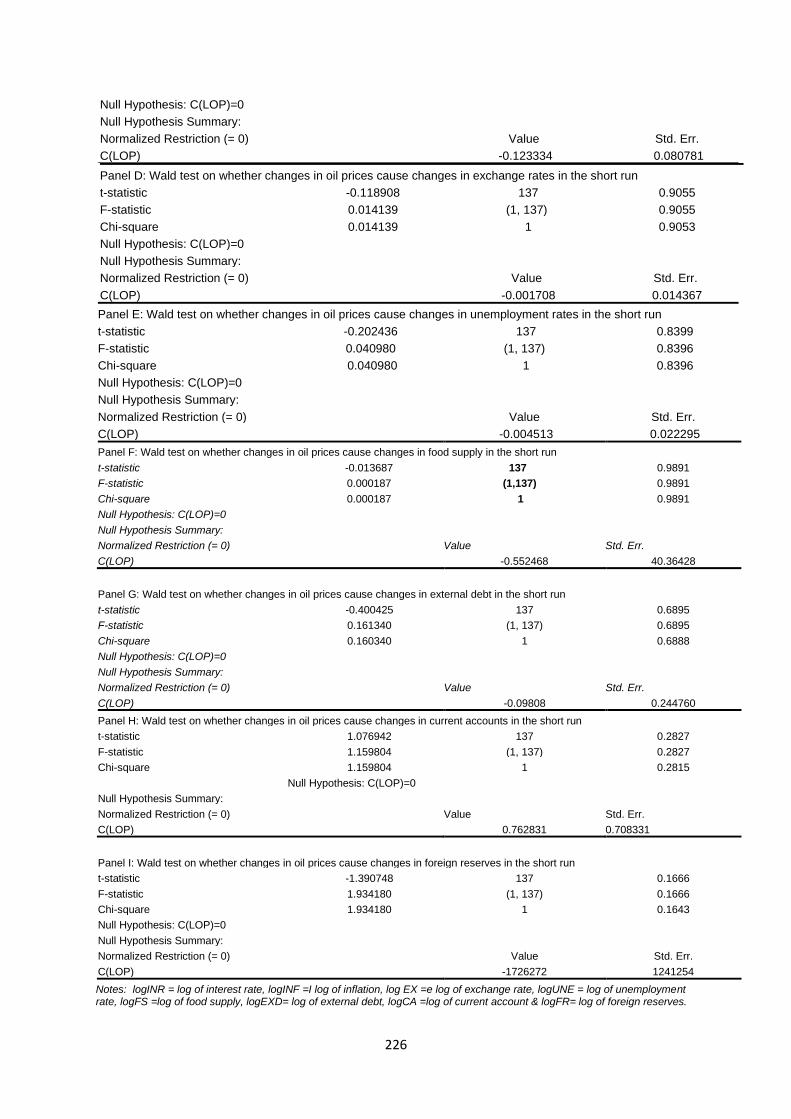
226
Null Hypothesis: C(LOP)=0
Null Hypothesis Summary:
Normalized Restriction (= 0) Value Std. Err.
C(LOP) -0.123334 0.080781
Panel D: Wald test on whether changes in oil prices cause changes in exchange rates in the short run
t-statistic -0.118908 137 0.9055
F-statistic 0.014139 (1, 137) 0.9055
Chi-square 0.014139 1 0.9053
Null Hypothesis: C(LOP)=0
Null Hypothesis Summary:
Normalized Restriction (= 0) Value Std. Err.
C(LOP) -0.001708 0.014367
Panel E: Wald test on whether changes in oil prices cause changes in unemployment rates in the short run
t-statistic -0.202436 137 0.8399
F-statistic 0.040980 (1, 137) 0.8396
Chi-square 0.040980 1 0.8396
Null Hypothesis: C(LOP)=0
Null Hypothesis Summary:
Normalized Restriction (= 0) Value Std. Err.
C(LOP) -0.004513 0.022295
Panel F: Wald test on whether changes in oil prices cause changes in food supply in the short run
t-statistic -0.013687 137 0.9891
F-statistic 0.000187 (1,137) 0.9891
Chi-square 0.000187 1 0.9891
Null Hypothesis: C(LOP)=0
Null Hypothesis Summary:
Normalized Restriction (= 0) Value Std. Err.
C(LOP) -0.552468 40.36428
Panel G: Wald test on whether changes in oil prices cause changes in external debt in the short run
t-statistic -0.400425 137 0.6895
F-statistic 0.161340 (1, 137) 0.6895
Chi-square 0.160340 1 0.6888
Null Hypothesis: C(LOP)=0
Null Hypothesis Summary:
Normalized Restriction (= 0) Value Std. Err.
C(LOP) -0.09808 0.244760
Panel H: Wald test on whether changes in oil prices cause changes in current accounts in the short run
t-statistic 1.076942 137 0.2827
F-statistic 1.159804 (1, 137) 0.2827
Chi-square 1.159804 1 0.2815
Null Hypothesis: C(LOP)=0
Null Hypothesis Summary:
Normalized Restriction (= 0) Value Std. Err.
C(LOP) 0.762831 0.708331
Panel I: Wald test on whether changes in oil prices cause changes in foreign reserves in the short run
t-statistic -1.390748 137 0.1666
F-statistic 1.934180 (1, 137) 0.1666
Chi-square 1.934180 1 0.1643
Null Hypothesis: C(LOP)=0
Null Hypothesis Summary:
Normalized Restriction (= 0) Value Std. Err.
C(LOP) -1726272 1241254
Notes: logINR = log of interest rate, logINF =I log of inflation, log EX =e log of exchange rate, logUNE = log of unemployment rate, logFS =log of food supply, logEXD= log of external debt, logCA =log of current account & logFR= log of foreign reserves.
227
Sources: Author generation 2021
6.12 Summary
In this chapter the researcher was able to establish the properties of the data
using descriptive analysis. Also, the duly analysed is the panel unit root test and
it was observed that the variables are either integrated of order zero 1(0) or
integrated of order one 1(1). There is existence of cointegration relationship
among the variables. The optimal lag selection was carried to avoid spurious
regression and Akaike Information criteria was chosen as the best fit for the
analysis. The correlation matrix between oil price and the key macroeconomic
variables was duly analysed. It was identified that oil price correlate with most of
the variables both in net oil exporting and importing countries in Africa. Duly
developed are the hypotheses that help to analyse the relationship between
changes in oil price and key macroeconomic variables in net oil exporting and net
oil importing countries. Panel ARDL model is used to analyse the relationship
between changes in oil price and the key macroeconomic variables to establish
the validity of the formulated hypotheses. The panel ARDL model is used to
estimate the asymmetric long run and short run relationship between oil price and
the key macroeconomic variables. The panel ARDL model review the existence of
long run and short run relationship between oil price and some of the key
macroeconomic variables in net oil exporting and importing countries in Africa.
An overview discussion on Granger-causality was presented to check the
robustness of the ARDL model. The Standard Granger Causality and Dumitrescu-
Hurlin causality tests were used to establish a long run Granger-causality between
oil price and some of the key macroeconomic variables. Equally evidenced is short

228
run Granger-causality between oil price and some of the key macroeconomic
variables in net oil exporting and oil importing countries.

229
Chapter Seven
Conclusion Limitations and Recommendations
7.0 Introduction
This chapter reflects on the formulated hypothesis and the key findings as
presented in the previous chapters, Equally, contributions, limitations,
recommendations, and possible suggestions for future research work are
discussed. Before continuing, a recap of the of the research aim set to achieve is
discussed.
This study is set out to examine whether variations in macroeconomic variables of
net exporting and net oil-importing countries in Africa respond asymmetrically to
changes in oil price. In trying to achieve the aim of this study, this study discusses
the theoretical framework and channels through which changes in oil price affects
macroeconomic variables. Specifically, the study explores theories of investment
under uncertainty, reallocation effect, income shift and real business cycle to
understand how asymmetric changes in oil price affect macroeconomic variables
in net oil exporting and importing countries in Africa.
Furthermore, terms of trade channel, real balance effect and monetary policy, oil
demand shocks and oil supply shocks are the channels are used to provide deeper
insight on the relationship between oil price and macroeconomic variables in net
oil exporting and importing countries in Africa. There are relevant studies at the
country-specific level (Fowowe 2014; Chiwneza and Aye 2018; Kocaarslan et al.
2020), at the net oil-exporting level (Omojolaibi and Egwaikhide 2013; Omolade
et al.2019; Alao and Payaslioglu 2021), at net oil-importing level (Taghizadeh-
Hesary et al. 2016; Akinsola and Odhiambo 2020) and net oil-exporting and net

230
oil-importing level (Salisu and Isah 2017; Lin and Bai 2021; Olayungbo 2021) that
have discussed oil price-macroeconomic relationship in developed and developing
countries. An empirical study on the asymmetric relationship between changes in
oil price and macroeconomic variables in net oil exporting and importing countries
is still lacking in developing countries of Africa. Previous studies suggest that
further research should extend to examining the asymmetric relationship between
oil price and macroeconomic relationship in net oil exporting and importing
countries in Africa (Omojolaibi and Egwaikhide 2013; Akinsola and Odhiambo
2020). Hence, this this study provides empirical evidence using panel data of net
oil-exporting and net oil-importing countries in Africa to analyse this relationship
and spur a comparative analysis.
This study account for asymmetric effects by adopting a panel ARDL technique as
presented in Shin et al. (2014) time series panel data model. The short run and
long run asymmetric relationship between changes in oil price and macroeconomic
variables is examined in a sample of net oil exporting and importing countries in
Africa. The results from panel ARDL model covering 1996𝑞1 to 2016𝑞4 show
asymmetric long run and short run effect of changes in oil price on most of the
key macroeconomic variables in both net oil exporting and oil importing countries
in Africa. Thus, to model the asymmetries in oil price-macroeconomic relationship,
this study accounts for non-stationarity and heterogeneity, which are significant
underlying dynamic statistical features of panels with large T (Salisu and Isah
2017).
This chapter is structured as follows. Section 7.0 put forward the introduction.
Section 7.1 present a reflection and summary of the analysed hypotheses. Section
7.2 discusses the contribution to knowledge. Policy implication based on research

231
find is discussed in section 7.3. The limitations of the study and suggestions for
further research is presented in section 7.4.
7.1 Summary of Key Findings in Relation to the Literature
This section provides a reflection on the outcome of the analysed empirical study
based on the formulated hypothesis. The importance of this research study
consists of an investigation of how changes in oil price cause variations in
macroeconomic variables in the context of net oil-exporting and net oil-importing
countries in Africa. The long-run and short-run analyses are conducted to give a
deeper insight and spur a comparative analysis of net oil-exporting countries
(Nigeria, Algeria, and Egypt) and net oil-importing countries (Kenya and South
Africa). The econometric quarterly data analysis from 1996q1 to 2016q4 is
employed to test the validity of the formulated hypothesis presented in chapter 6.
Hypothesis 1 analyses show that oil price significantly and positively predicted
GDP in net oil exporting countries as opposed a significant negative effect on GDP
in net oil importing countries both in the long run and in the short run. This finding
reflects the views of Ghosh et al. (2009) and Gbatu et al. (2017). It suggests that
oil price play a significant role in forecasting GDP growth rate both in net oil
exporting and importing countries in the short run and in the long run. For
example, Ghosh et al. (2009) used reduced form of ADL framework to conclude
that oil price has negative effect on US economy both in the short run and in the
long run. Implying that oil price is a very significant predictor of GDP growth in
the US.
Hypothesis 2 analysis indicates that interest rates negatively and statistically
responded to oil price in the long run both in the net oil exporting and oil importing
countries in Africa. This suggest that oil price has a significant role in predicting
232
interest rate both net oil exporting and oil importing countries in the long run. This
is consistent with the views of Ratti and Vespignani (2015) for US.
Ratti and Vespignani (2015) used global factor-augmented error correction model
and establish a negative relationship between oil price and interest rate through
money supply dynamics in US economy. The found that oil price has negative
effect on interest rate through positive shocks of money supply cause significant
change in oil price through global CPI and global industrial production. This means
monetary policy dynamics affect oil price-interest rate relationship.
The short run analysis showed that interest rates negatively responded to oil price
changes in net oil importing countries as opposed to insignificant response to
changes in oil price in net oil exporting countries. This implies that oil price has
more influence on interest rates in net oil importing countries than oil exporting
countries in the short run. It equally suggests oil price is significant in forecasting
interest rates in the short run, in net oil importing countries. This result is
consistent with the study documented by Steidtmann (2004) for US.
Hypothesis 3 analysis shows that both net oil exporting and importing countries
experienced negative and significant response of inflation to oil price in the long
run as Reicher and Utlaut (2010) documented for US. and Misati et al. (2013)
documented for Kenya. The result shows the significance of oil price in predicting
inflation in both net oil exporting and net oil importing countries in the long run.
Misati et al. (2013) used Granger-causality test and structural vector
autoregressive (SVAR) model and examine the dynamic linkage between oil price
and inflation in Kenya. They found a persistent long run relationship between oil
price and inflation in Kenya. This implies that persistent effect of oil price on

233
inflation may affect the consumption level in Kenya, especially the low-income
earners.
The short run analysis revealed positive significant response of inflation to oil price
in net oil importing countries as Kibunyi et al. (2018) documented for Kenya. While
in net oil exporting countries, it is insignificant. This is consistent with views of
Oyelami and Omomola (2016) who found insignificant relationship between oil
price and inflation in Nigeria. This suggests that oil price is significant in predicting
inflation in the short run-in net oil importing countries but insignificant in oil
exporting countries.
For example, Kibunyi et al. (2018) used ARDL model to evidence that inflation
responded significantly and positively to oil price in the long run in Kenya. The
implication is that when oil price create volatility on production cost, with increase
in production cost, inflation will increase. Therefore, policy aimed at minimizing
the effect of oil price on inflation should be encouraged.
Hypothesis 4 analysis evidence that the long run effect of oil price appreciated
exchange rates in net oil exporting countries while it depreciated exchange rate in
net oil importing countries. This suggests that oil price has a significant role in
determining exchange rates dynamics in both net oil exporting and net oil
importing countries in Africa. This result is consistent with views of Chen and Chen
(2007) and Qurat-Ul-Ain and Tufail (2013). For example, Chen and Chen (2007)
employed a panel of G7 countries and evidence that real oil price is statistically
significant in predicting real exchange rate variation. The implication is that if a
country is highly dependent on oil, oil price can cause the price of tradeable goods
to rise relative to price of nontraceable goods in the domestic country would
234
increase more than the price in the US. Hence, this may cause depreciation of
domestic currency against the US dollar.
The short run effect of oil price depreciated exchange rates in net oil exporting
countries, while it is insignificant in net oil importing countries. Implying that oil
price has more influence in net oil importing countries more than oil exporting
countries in the short run. The insignificant short run relationship between oil price
and exchange rate in oil exporting countries contrast the short run view of Musa
et al. (2020) for Nigeria. While the short run result on oil price- exchange rates
nexus in net oil importing countries is consistent with the views of Castro and
Jiménez-Rodríguez (2020) for US. Their finding concluded that oil price forecasted
depreciation of exchange rate in the short run for any period. Suggesting that
inflationary pressure from changes in oil price could be offset by adequate
monetary policy. Furthermore, investors and risk management need to take
consideration of this relationship when creating portfolios.
Hypothesis 5 analysis reveal that the long run effect of oil price on unemployment
rate remained significant and increased in net oil importing countries as Doğrul
and Soytas (2010) Kocaarslan et al. (2020) found in Turkey and US. respectively.
For example, Kocaarslan et al. (2020) employed NARDL model and conclude that
increase in oil price cause increase in unemployment rate in the US. The
implication is that an increase in oil price reflects a worsening economic condition
as companies operates against shrinking profit given an increase in production
cost. hence, unemployment may increase.
The long run effect of oil price on unemployment rates in net oil exporting
countries is insignificant. This result contrast the views of Cheratian et al. (2019)
for MENA region. Suggesting that oil price is insignificant in determining
235
unemployment rates in net oil porting countries in the long run. This could mean
that an increase in oil price may have appreciated the domestic currency, causing
the domestic industries to operate effectively and efficiently, hence job retain and
job creation is constant.
The short run effect of oil price presented significant negative effect on
unemployment rates in net oil exporting countries as opposed insignificant effect
on unemployment rates in net oil importing countries. Meaning that in the short
run oil price has more influence on unemployment rates in net oil exporting
countries than oil importing countries. The short run effect in net oil exporters is
consistent with the views of Cheratian et al. (2019) for MENA region. The overall
negative effect of oil price on unemployment rates following oil price shocks
present a challenging task for policymakers, therefore, improving energy security
by diversifying away from oil may lessen the responsiveness of unemployment
rates to oil price shocks.
Hypothesis 6 analysis shows that in the long run oil price significantly increased
food supply in net oil importing countries as opposed its significant reduction of
food supply in net oil exporting countries. This is a typical indication that changes
in oil price have more influence in net oil importing countries than net oil exporting
countries in the long run. The long run relationship between food supply and oil
price in net oil importing countries is consistent Ibrahim (2015) documentation for
Malaysia. He used NARDL model and affirm the presence of asymmetric long run
relationship between oil price and food price. The implication is that the
adjustment cost associated with this relationship may have impact on low income
earns.
236
Both net oil exporting and oil importing countries experienced positive significant
short run response of food supply to asymmetric changes in oil price. Oil price
more significant in the short run-in influencing food supply in net oil importing
countries than in net oil exporting countries. The short run effect found in both
group of countries is consistent with the views of Ibrahim (2015) for Malaysia and
Nwoko et al (2016) for Nigeria. Just as explained in the last paragraph, the
adjustment cost associated with the oil price-food price relationship may have
effect on low-income earners.
Hypothesis 7 analysis shows that in the long run, both net oil exporting and oil
importing countries presented significant positive response of external debt to oil
price. With oil price having more influence on external debt in oil exporting
countries more than oil importing countries. This result suggests that oil price is a
significant predictor of external debt in both net oil exporting and importing
countries in Africa in the long run. This finding is consistent with the views of
Kretzmann and Nooruddin (2005) for net oil exporting and net oil importing
countries. The implication is that debt burden hinders any opportunity of long-
term economic growth as interest rates on the loan can worsen the external debt
situation.
Net oil importing countries showed that in the short run external debt responded
positively and significantly to oil price as against an insignificant response of
external debt to oil price in oil exporting countries. Meaning that oil price has more
influence in net oil importing countries more than net oil exporting countries in
the short run. The response of external debt to oil price in net oil importing
countries is consistent with views of Namaki et al. (2020) for Iran. While the
insignificant response of external debt to oil price in net oil exporting countries
opposes the views of Adamu (2019) who found evidence of short run effect of oil
237
price on external debt in Nigeria. The policy implication is that if adequate policy
is not formulated to hedge external debt from oil price shocks the economies of
these countries may not grow if the debt is not well utilized, and the economy is
not well diversified, especially net oil importing countries of Africa.
Hypothesis 8 analysis show that the long run effect of oil price on current accounts
accounted for a very significant improvement in current accounts of net oil
exporting countries as Gnimassoun et al. (2017) documented for Canada. In the
long run a 1% increase in oil price improves current accounts of oil exporting
countries by 91.32%. This is larger than its negative effects on current accounts
in net oil importing countries that is reduced to 54.13%. Meaning that oil price as
a significant predictor of current accounts has more influence in net oil exporters
more than oil importers in the long run. This finding is consistent with the views
of Allegret et al. (2014) for net oil exporting countries and Mohammed (2015) for
net oil importing countries. For example, Mohammed (2015) used panel of 46 net
oil importing countries to evidence the adverse effect of oil price on current
accounts of these economies. The implication of his finding is that economy
without a buffer against oil price is vulnerable to external shocks from oil price.
Hence adequate financial system should be put in place to hedge against current
accounts from external shocks.
Both net oil exporting and net oil importing countries presented insignificant short
run relationship between oil price and current accounts. Meaning that oil price
does not have predictive power over current accounts both in net oil exporting
and importing countries in the short run. This result contrast the views of Allegret
et al. (2014) on a sample of oil exporting countries.
238
Hypothesis 9 analysis indicates that the long run effect of oil price forecasted
52.31% and 20.32% improvement in foreign reserves in net oil exporting and oil
importing countries, respectively. The effect is larger in net oil exporting more
than oil importing countries. The implication of this that oil price has more
influence on net oil exporters more than oil importers. Furthermore, it implies that
the dependency on oil price to build foreign reserves of net oil exporting and oil
importing countries can be feasible in the long run. This finding is consistent with
views of Kaka and Ado (2020) for Nigeria.
Net oil exporting and importing countries exhibited insignificant short run
relationship between oil price and foreign reserves as opposed the views of
Olayungbo (2019) who found short run effect of oil price on foreign reserves in
Nigeria. However, the result is consistent with views of Shaibu and Izedonmi
(2020) for Nigeria. This implies that oil price cannot predict foreign reserves
variations both in net oil exporting and importing countries in the short run.
The overall analyses showed that hypothesis 10 is partially rejected in some areas
and accepted in some areas. For example, hypothesis 10 is rejected as oil price
positively and significantly affected GDP both in the short run and in the long run,
in net oil exporting countries. Furthermore, oil price significantly and negatively
affected GDP in the short run and long-run in net oil importing countries. It
suggests that oil price have the same predictive power over GDP in the long run
and short run both in net oil exporting and net oil importing countries. This find is
consistent with the views of Charfeddine and Barkat (2020) for Qatar. They used
both ARDL and NARDL models to show that oil price has the same effect on GDP
in the long run and short run. This implies that these economies are highly
dependent on oil. Hence, policy aimed at diversifying the economy to non-oil
exports should be encouraged.
239
Furthermore, hypothesis 11 is partially rejected from the overall analyses. For
example, oil price significantly and positively affected interest rates in net oil
exporting and oil importing countries in the long run. It suggests that oil price has
a significant role in the long run, in predicting interest rates in net oil exporting
and oil importing countries of Africa. Although, the effect of oil price on interest
rate is in net oil exporting countries than in net oil importing countries of Africa.
Furthermore, oil price has the same positive and significant effect on external debt
in net oil exporting and oil importing countries in the long run. However, the
finding suggests that the effect of oil price on external debt is greater in net oil
exporting than in net oil importing countries of Africa.
In another vein, this study fails to reject Hypothesis 11. For example, the effect
of oil price appreciated exchange rates in the long run, in net oil exporting
countries while it depreciated exchange rate in the long run, in net oil importing
countries. This finding supports the expectation of income transfer theory
discussed in chapter 4. Equally in net oil exporting countries, GDP responded
positively and significantly to oil price. While in net oil importing countries, GDP
negatively and significantly responded to oil price changes. This finding is
consistent with the views of Nusair and Olson (2021) for Indonesia, Singapore,
Malaysia, and Philippines. They used ARDL model to show that asymmetric
changes in oil price have varying effect on output of some of the countries
considered. This implies that investors wishing to invest in different countries need
to consider oil price-macroeconomic relationship in those countries before
investing. Hence, policymakers should put this finding into consideration when
formulating policy that would shield macroeconomic variables from oil price shocks
both in net oil exporting and importing countries in Africa.
240
7.2 Contribution to Knowledge
This study contributed to knowledge through the methodology employed in giving
deeper insight in understanding how changes in oil price affect variations in
macroeconomic variables in the context of net oil-exporting and net oil-importing
countries in Africa. This study contributes to the empirical literature in the
following ways:
7.2.1 Contribution to Literature
The original contribution of this study to literature is that this study has reviewed
the asymmetric relationship between oil price and macroeconomic variables not
only in the context of net oil exporting countries in Africa but also in the context
of net oil importing countries in Africa. This has presented information to
stakeholders on oil price-macroeconomic relationship in the context of net oil
exporting and oil importing countries of Africa. This is significant because the
information provided by this study which is not present in previous studies
including Akinsola and Odhiambo (2020) can help policymakers to formulate long
run and short run policies to hedge macroeconomic variables from oil price shocks
in this group of net oil exporting and oil importing countries in Africa. The
information will also enable investors to make informed investments decisions.
The awareness of this seemly information can form a key aspect that could be
addressed in future research.
7.2.2 Contribution to Methodology
In this section, the discussion how this study contributed to methodology is
presented. The initial analysis in chapters 2 and 5 reveals the relationship between
oil price and macroeconomic variables using extended literature review and
scattered diagram of regression analysis to give further insight on how oil price
241
influence macroeconomic variables in the context of net oil exporting and
importing countries in Africa. The extended literature review provided more
understanding on oil price influence macroeconomic variables by reviewing the
findings of previous scholars on this relationship. In reviewing this relationship
using extended literature review, related major oil price events from 1996𝑞1 to
2016𝑞4. The significance of this analysis is to understand how macroeconomic
variables respond to oil prices following a major oil price shock event. For example,
Hou et al. (2015) analysed the response of macroeconomic variables to oil price
following the oil price shocks between 2014 and 2015. They found that following
the oil price plunge between 2014 and 2015, the current account balance of oil
exporters in Africa reduced while that of oil importers in Africa improved. This is a
result of reduction in the value of oil exports of African countries to developed
countries by 17%. While the value of oil import of country like Tanzania dropped
by 20%. The implication is for policymakers to adjust their macroeconomic policy
based on uncertainties associated with the oil price shock events.
Again, this study contributed to methodology by using scattered diagram of
regression analysis to visually present the relationship between oil price and the
key macroeconomic variables. The variable of oil price is plotted against each of
the key macroeconomic variable’s indexes at group and individual country level.
The visual presentation of the relationship not only enable readers to understand
how oil price influence the key macroeconomic variables by mere looking at the
diagrams but also it would help those who cannot understand the technicalities
involved in empirical analysis or those who are not mathematically inclined to look
at the diagram and understand how oil price have influence on the key
macroeconomic variables. The findings from this analysis provide information

242
exploitable by policymakers and investors for policy formulation and investment
decision making.
7.3 Policy Implication of the Research Study
This section put forward the policy implication identified in analysing oil price-
macroeconomic relationship within the context of net oil exporting and oil
importing countries in Africa. The empirical analysis of this study can be used to
assess the effectiveness of economic reforms and policy plans by net oil-exporting
and net oil-importing countries and directions for future improvement. This study
offers some significant suggestions for policymakers in net oil-exporting and net
oil-importing countries in Africa.
First, the different results obtained from the long run and the short run panel ARDL
model in net oil-exporting countries, for example, on inflation will help
policymakers take long run and short run hedging strategies against inflationary
pressures coming from shocks in oil price. Also, from the panel ARDL result of oil
price-inflation relationship particularly in net oil importing countries, inflation is
found to positively and significantly responded to oil price in the short run and in
the long run. Scholars including Ahuru, and James (2015) pointed out that the
essential reason why oil price has fluctuating effect on inflation in the short run
and in the /long run is because oil is a commodity product, whose price is in US
dollars. If there is any change in US dollar it will affect the exchange rate of
countries whose currencies are not dominated in US dollar. The exchange rates
dynamics created by petrol-dollar nature of oil can affect purchasing power of firm
and individual consumers (Beckmann et al.2017). Hence, this can create inflation
dynamics.
243
In addition, considering GDP response to the short run and the long-run
fluctuations in oil price, it is significant in net oil-exporting countries to encourage
policy that will ensure diversification strategies of exporting non-oil products to
enhance increase of foreign earnings and GDP growth rate since oil seen to play a
significant role in forecasting GDP. Furthermore, policies that encourage
infrastructural, manufacturing, and agricultural development should be put in
place. This will help boost the economy if oil price declines. For net oil importing
countries, it was discovered that sustained increase in oil price affects GDP
negatively. Thus, policies that will enable oil price decline to improve external and
fiscal balance which will support economic growth should be pursued. This will
boost savings and economic growth during oil price decline to reduce the effect of
shocks coming from oil price increase on macroeconomic variables.
Since this study has shown that the magnitude of most of the long-run and short-
run effects of oil price on macroeconomic variables differ in net oil-exporting and
net oil-importing countries in Africa, it is therefore, recommended that
policymakers should pursue long run and short run strategies to hedge
macroeconomic variables from oil price shocks. The government of these countries
and private investors seeking investment opportunities that will enhance economic
activities and growth should cautiously evaluate the fundamental dynamics of the
long run and short run effect of oil price on macroeconomic variables as confirmed
in this study before formulating policies or investing.
This finding is also significant to monetary policy institutions in Africa who are
continually under pressure to promote and ensure economic stability. Their ability
to achieve this significant objective is directly connected to their ability to employ
efficient and effective monetary policies that will hedge macroeconomic variables
from the pressure of shocks from oil prices, especially towards exchange rate and
244
inflation. Given the increasing suggestion of the robust relationship between oil
price and macroeconomic variables, including the findings in this study, it is
virtually difficult to forecast variations in macroeconomic variables without
including oil price as a predictor.
7.4 Limitations of the Study and Suggestions for Further Studies
This study contributes to methodology and literature on the relationship between
oil price and macroeconomic variables. For example, this study reviewed the
asymmetric relationship between oil price and macroeconomic variables not only
in net oil exporting countries in Africa but also in net oil importing countries in
Africa. Also, this study used extended literature review and scattered diagram of
regression analysis to determine the correlation between oil price and
macroeconomic variables. The significance of this analysis is to understand how
macroeconomic variables respond to oil prices following a major oil price event.
However, this study is limited by data, time, COVID-19 pandemic, and lack of
funding, among others. The identified issues for further research are as follows:
In analysing the relationship between changes in oil price and variations in
macroeconomic variables, this study used quarterly data of oil price, GDP, interest
rate, inflation, exchange rate, unemployment rate, food supply, external debt,
current accounts, and foreign reserves to empirically test the formulated
hypotheses. However, it is possible to used monthly data covering large time (T)
and fewer variables if data availability is assured. This will enable obtaining large
observation that covers most of the different shocks in oil price including the effect
of COVID-19 pandemic.
245
Apart from increasing the data, it is equally recommended that more countries in
the context of net oil-exporting and net oil-importing countries in Africa should be
included in the analysis to give a wider coverage of the region.
This study only considered in quantitative terms changes in oil price in examining
variations in macroeconomic variables in the context of net oil-exporting and net
oil-importing countries. It is recommended that mixed method should be
considered in analysing the asymmetric relationship between oil price and
macroeconomic variables. With the mixed method other factors including political,
social, and institutional factors would be incorporated in the analysis. In doing
this, the mix method could be used to show the quantitative aspect of the analysis
and the qualitative aspect of the analysis to provide more robust information for
policy formulation and investment decisions.
246
Bibliography:
Abdulkareem, A. and Abdulhakeem, K.A., 2016. Analysing oil price-
macroeconomic volatility in Nigeria. CBN Journal of Applied Statistics, 7(1), pp.1-
22.
Abosedra, S. and Baghestani, H., 2004. On the predictive accuracy of crude oil
futures prices. Energy policy, 32(12), pp.1389-1393.
Abraham, K.G. and Katz, L.F., 1986. Cyclical unemployment: sectoral shifts or
aggregate disturbances? Journal of political Economy, 94(3, Part 1), pp.507-522.
Acharya, R.H. and Sadath, A.C., 2016. Energy price uncertainty and investment:
Firm level evidence from Indian manufacturing sector. International Journal of
Energy Economics and Policy, 6(3).
Adamu, I.M., 2019. Re-visiting the Drivers for Increasing External Debt. Journal
of Contemporary Issues and Thought, 9, pp.40-53.
Adaramola, A.O., 2012. Oil price shocks and stock market behaviour: The Nigerian
experience. Journal of Economics, 3(1), pp.19-24.
Adebayo, T.S., 2020. Dynamic relationship between oil price and inflation in oil
exporting economy: empirical evidence from wavelet coherence
technique. Energy Economics Letters, 7(1), pp.12-22.
Adebiyi, M.A., Adenuga, A.O., Abeng, M.O. and Omanukwue, P.N., 2009, June. Oil
price shocks, exchange rate and stock market behaviour: Empirical evidence from
Nigeria. In Proceedings of the 14th Annual Conference of the African Econometric
Society.
Adeniyi, O., Oyinlola, A. and Omisakin, O., 2011. Oil price shocks and economic
growth in Nigeria: are thresholds important? OPEC Energy Review, 35(4), pp.308-
333.
Ahad, M. and Anwer, Z., 2020. Asymmetrical relationship between oil price shocks
and trade deficit: Evidence from Pakistan. The Journal of International Trade &
Economic Development, 29(2), pp.163-180.
Ahmad, F., 2013. The effect of oil prices on unemployment: Evidence from
Pakistan. Business and Economics research journal, 4(1), p.43.
Ahmed, K., Bhutto, N.A. and Kalhoro, M.R., 2019. Decomposing the links between
oil price shocks and macroeconomic indicators: Evidence from SAARC
region. Resource’s policy, 61, pp.423-432.
Ahuru, R.R. and James, U.E., 2015. Macroeconomics of oil price volatility. Journal
of Research in National Development, 13(1), pp.253-263.
Aizenman, J. and Lee, J., 2008. Financial versus monetary mercantilism: long‐run
view of large international reserves hoarding. World Economy, 31(5), pp.593-611.
Aizenman, J., Jinjarak, Y. and Park, D., 2011. International reserves and swap
lines: Substitutes or complements? International Review of Economics &
Finance, 20(1), pp.5-18.
247
Ajayi, R.A., 1991. On the simultaneous interactions of external debt, exchange
rates, and other macroeconomic variables: the case of Nigeria (No. 91). Center
for Economic Research on Africa, Department of Economics, School of Business
Administration, Montclair State College.
AKIGHIR, D.T. and KPOGHUL, E.T., OIL EXPORTS, FOREIGN RESERVES AND
ECONOMIC GROWTH IN NIGERIA: A STRUCTURAL VAR APPROACH.
Akinleye, S.O. and Ekpo, S., 2013. Oil price shocks and macroeconomic
performance in Nigeria. Economía Mexicana Nueva Época, volumen Cierre de
época, número II de 2013, pp 565-624.
Akinsola, M.O. and Odhiambo, N.M., 2020. Asymmetric effect of oil price on
economic growth: Panel analysis of low-income oil-importing countries. Energy
Reports, 6, pp.1057-1066.
Akpan, E.O., 2009, March. Oil price shocks and Nigeria’s macro economy. In A
Paper Presented at the Annual Conference of CSAE Conference, Economic
Development in Africa, March (pp. 22-24).
Akram, Q.F., 2000. PPP despite real shocks: An empirical analysis of the
Norwegian real exchange rate (No. 2000/7). Arbeidsnotat.
Akram, Q.F., 2004. Oil prices and exchange rates: Norwegian evidence. The
Econometrics Journal, 7(2), pp.476-504.
Akram, Q.F., 2009. Commodity prices, interest rates and the dollar. Energy
economics, 31(6), pp.838-851.
Akram, Q.F., 2020. Oil price drivers, geopolitical uncertainty, and oil exporters'
currencies. Energy Economics, 89, p.104801.
Al‐Abri, A.S., 2013. Oil price shocks and macroeconomic responses: does the
exchange rate regime matter? OPEC energy review, 37(1), pp.1-19.
Alao, R.O. and Payaslioglu, C., 2021. Oil price uncertainty and industrial
production in oil-exporting countries. Resources Policy, 70, p.101957.
Algia, H. and Abdelfatteh, B., 2016. The Volatility of Oil Prices: What
Factors? Bulletin of Energy Economics (BEE), 4(1), pp.98-110.
Al-hajj, E., Al-mulali, U. and Solarin, S.A., 2017. The influence of oil price shocks
on stock market returns: Fresh evidence from Malaysia. International Journal of
Energy Economics and Policy, 7(5), pp.235-244.
Ali Ahmed, H. and Wadud, I.K.M., 2011. Market based performance: do ownership
structures, or firm policy choice matter? Corporate ownership & control, 8(2),
pp.89-95.
Alimi, A.S., Olaniran, O.D. and Ayuba, T., 2020. An asymmetric evaluation of oil
price-inflation nexus: Evidence from Nigeria. Energy Economics Letters, 7(1),
pp.1-11.
Aliyu, S.U.R., 2009. Impact of oil price shock and exchange rate volatility on
economic growth in Nigeria: An empirical investigation.
248
Alkhateeb, T.T.Y., Mahmood, H., and Sultan, Z.A., 2021. Role of Oil Price in Fiscal
Cyclicality in Saudi Arabia. International Journal of Energy Economics and
Policy, 11(2), p.194.
Allegret, J.P., Couharde, C., Coulibaly, D. and Mignon, V., 2014. Current accounts
and oil price fluctuations in oil-exporting countries: the role of financial
development. Journal of International Money and Finance, 47, pp.185-201.
Al-Maadid, A., Caporale, G.M., Spagnolo, F. and Spagnolo, N., 2017. Spillovers
between food and energy prices and structural breaks. International
Economics, 150, pp.1-18.
Al-mulali, U., 2010. The impact of oil prices on the exchange rate and economic
growth in norway.
Aloui, R., Aïssa, M.S.B. and Nguyen, D.K., 2013. Conditional dependence structure
between oil prices and exchange rates: A copula-GARCH approach. Journal of
International Money and Finance, 32, pp.719-738.
Alquist, R. and Kilian, L., 2010. What do we learn from the price of crude oil
futures? Journal of Applied econometrics, 25(4), pp.539-573.
Al-Sasi, B.O., Taylan, O. and Demirbas, A., 2017. The impact of oil price volatility
on economic growth. Energy Sources, Part B: Economics, Planning, and
Policy, 12(10), pp.847-852.
Ajayi, L.B. and Oke, M.O., 2012. Effect of external debt on economic growth and
development of Nigeria. International journal of business and social
science, 3(12), pp.297-304.
Amano, R.A. and Van Norden, S., 1998. Exchange rates and oil prices. Review of
International Economics, 6(4), pp.683-694.
Amano, R.A. and Van Norden, S., 1998. Oil prices and the rise and fall of the US
real exchange rate. Journal of international Money and finance, 17(2), pp.299-
316.
Andreopoulos, S., 2009. Oil matters: real input prices and US unemployment
revisited. The BE Journal of Macroeconomics, 9(1).
Andrews, C.A., Ironside, P.M., Nosek, C. and Sims, S.L., 2001. Enacting narrative
pedagogy: The lived experiences of students and teachers. Nursing Education
Perspectives, 22(5), p.252.
Anjum, H. and Malik, F., 2019. Oil prices and exchange rates. Routledge Handbook
of Energy Economics, pp.396-404.
Antonakakis, N., Chatziantoniou, I. and Filis, G., 2014. Dynamic spillovers of oil
price shocks and economic policy uncertainty. Energy Economics, 44, pp.433-447.
Apergis, N. and Miller, S.M., 2009. Do structural oil-market shocks affect stock
prices? Energy economics, 31(4), pp.569-575.
249
Arezki, M.R., Jakab, Z., Laxton, M.D., Matsumoto, M.A., Nurbekyan, A., Wang, H.
and Yao, J., 2017. Oil prices and the global economy. International Monetary
Fund.
Arezki, R. and Blanchard, O., 2015. The 2014 oil price slump: Seven key
questions. VoxEU, January 13.
Arezki, R. and Hasanov, F., 2013. Global imbalances and petrodollars. The World
Economy, 36(2), pp.213-232.
Arezki, R., Mottaghi, L., Barone, A., Fan, R.Y., Kiendrebeogo, Y. and Lederman,
D., 2018. Middle East and North Africa Economic Monitor, April 2018: Economic
Transformation. The World Bank.
Arteta, C., Kose, M.A., Stocker, M. and Taskin, T., 2016. Negative interest rate
policies: Sources and implications.
Asaolu, T.O. and Ilo, B.M., 2012. The Nigerian stock market and oil price: A
cointegration analysis. Kuwait chapter of Arabian journal of business and
management review, 33(835), pp.1-10.
Askari, H. and Krichene, N., 2010. An oil demand and supply model incorporating
monetary policy. Energy, 35(5), pp.2013-2021.
Atil, A., Lahiani, A. and Nguyen, D.K., 2014. Asymmetric and nonlinear pass-
through of crude oil prices to gasoline and natural gas prices. Energy Policy, 65,
pp.567-573.
Auty, R.M. and Gelb, A.H., 2001. Political economy of resource-abundant
states. Resource abundance and economic development, pp.126-44.
Auty, R.M., 1998. Social sustainability in mineral‐driven development. Journal of
International Development: The Journal of the Development Studies
Association, 10(4), pp.487-500.
Avalos, F., 2014. Do oil prices drive food prices? The tale of a structural
break. Journal of International Money and Finance, 42, pp.253-271.
Awad Abdel Hameed, A. and Mohamed Arshad, F., 2008. The Impact of Petroleum
Prices on Vegetable Oils Prices: Evidence from Cointegration Tests (No. 138-2016-
1958).
Awartani, B. and Maghyereh, A.I., 2013. Dynamic spillovers between oil and stock
markets in the Gulf Cooperation Council Countries. Energy Economics, 36, pp.28-
42.
Awartani, B., Maghyereh, A. and Ayton, J., 2020. Oil price changes and industrial
output in the MENA region: Nonlinearities and asymmetries. Energy, 196,
p.117043.
Awunyo-Vitor, D., Samanhyia, S. and Bonney, E.A., 2018. Do oil prices influence
economic growth in Ghana? An empirical analysis. Cogent Economics &
Finance, 6(1), p.1496551.
250
Ayadi, O.F., 2005. Oil price fluctuations and the Nigerian economy. OPEC
review, 29(3), pp.199-217.
Aye, G.C., Dadam, V., Gupta, R. and Mamba, B., 2014. Oil price uncertainty and
manufacturing production. Energy Economics, 43, pp.41-47.
Ayisi, R.K., 2020. The asymmetry effect of oil price changes on inflation, and the
welfare implication for Ghana. African Journal of Economic and Management
Studies.
Aysoy, C. and Kıpıcı, A.N., 2005. A quarterly macroeconometric model of the
Turkish economy. Central Bank Review, 5(2), pp.39-71.
Aziz, M.I.A. and Dahalan, J., 2015. Oil price shocks and macroeconomic activities
in Asean-5 countries: a panel VAR approach. Eurasian Journal of Business and
Economics, 8(16), pp.101-120.
Babatunde, M.A., Adenikinju, O. and Adenikinju, A.F., 2013. Oil price shocks and
stock market behaviour in Nigeria. Journal of Economic Studies.
Baccaro, L. and Rei, D., 2007. Institutional determinants of unemployment in
OECD countries: Does the deregulatory view hold water? International
Organization, pp.527-569.
Backus, D.K. and Crucini, M.J., 2000. Oil prices and the terms of trade. Journal of
international Economics, 50(1), pp.185-213.
Backus, D.K., Kehoe, P.J. and Kydtand, F.E., 2021. 11 International Business
Cycles: Theory and Evidence (pp. 331-356). Princeton University Press.
Bacon, R. and Tordo, S., 2004. Crude oil prices: Predicting price differentials based
on quality.
Bacon, R. and Tordo, S., 2005. Crude oil price differentials and differences in oil
qualities: a statistical analysis.
Badel, A. and McGillicuddy, J., 2015. Oil prices and inflation expectations: Is there
a link. The Regional Economist, (July).
Baek, J. and Choi, Y.J., 2021. Do fluctuations in crude oil prices have symmetric
or asymmetric effects on the real exchange rate? Empirical evidence from
Indonesia. The World Economy, 44(1), pp.312-325.
Baek, J., 2021. A new look at the oil price-exchange rate nexus: Asymmetric
evidence from selected OPEC member countries. Economic Analysis and
Policy, 70, pp.172-181.
Baek, J. and Koo, W.W., 2009. On the dynamic relationship between US farm
income and macroeconomic variables. Journal of Agricultural and Applied
Economics, 41(2), pp.521-528.
Baek, J. and Koo, W.W., 2010. Analysing factors affecting US food price
inflation. Canadian Journal of Agricultural Economics/Revue Canadienne
agroeconomic, 58(3), pp.303-320.
251
Baffes, J., Kose, M.A., Ohnsorge, F. and Stocker, M., 2015. The great plunge in oil
prices: Causes, consequences, and policy responses. Consequences, and Policy
Responses (June 2015).
Bai, J. and Ng, S., 2004. A PANIC attack on unit roots and
cointegration. Econometrica, 72(4), pp.1127-1177.
Bakhshi, Z. and Ebrahimi, M., 2016. The effect of real exchange rate on
unemployment. Marketing and Branding Research, 3, pp.4-13.
Bala, U. and Chin, L., 2018. Asymmetric impacts of oil price on inflation: An
empirical study of African OPEC member countries. Energies, 11(11), p.3017.
Balke, N.S., Brown, S.P. and Yucel, M.K., 2002. Oil price shocks and the US
economy: Where does the asymmetry originate? The Energy Journal, 23(3).
Balli, E., Çatık, A.N. and Nugent, J.B., 2021. Time-varying impact of oil shocks on
trade balances: Evidence using the TVP-VAR model. Energy, 217, p.119377.
Barro, R.J., 1984. Rational expectations and macroeconomics in 1984. The
American Economic Review, 74(2), pp.179-182.
Barsky, R.B. and Kilian, L., 2001. Do we really know that oil caused the great
stagflation? A monetary alternative. NBER Macroeconomics annual, 16, pp.137-
183.
Bashar, O.H., Wadud, I.M. and Ahmed, H.J.A., 2013. Oil price uncertainty,
monetary policy and the macroeconomy: The Canadian perspective. Economic
Modelling, 35, pp.249-259.
Basher, S.A. and Sadorsky, P., 2006. Oil price risk and emerging stock
markets. Global finance journal, 17(2), pp.224-251.
Basher, S.A., Haug, A.A. and Sadorsky, P., 2012. Oil prices, exchange rates and
emerging stock markets. Energy Economics, 34(1), pp.227-240.
Basnet, H.C. and Upadhyaya, K.P., 2015. Impact of oil price shocks on output,
inflation, and the real exchange rate: evidence from selected ASEAN
countries. Applied Economics, 47(29), pp.3078-3091.
Bassanini, A. and Duval, R., 2007. The determinants of unemployment across
OECD countries: Reassessing the role of policies and institutions. OECD Economic
Studies, 2006(1), pp.7-86.
Bastianin, A., Galeotti, M. and Manera, M., 2014. Forecasting the oil–gasoline price
relationship: Do asymmetries help? Energy Economics, 46, pp. S44-S56.
Baumeister, C. and Kilian, L., 2014. Do oil price increases cause higher food
prices? Economic Policy, 29(80), pp.691-747.
Baumeister, C. and Kilian, L., 2016. Understanding the Decline in the Price of Oil
since June 2014. Journal of the Association of Environmental and resource
economists, 3(1), pp.131-158.
252
Baumeister, C. and Peersman, G., 2013. The role of time‐varying price elasticities
in accounting for volatility changes in the crude oil market. Journal of Applied
Econometrics, 28(7), pp.1087-1109.
Baumeister, C., Peersman, G. and Van Robays, I., 2009. The Economic
Consequences of Oil Shocks: Differences across Countries and Time| Conference–
2009.
Beaudreau, B.C., 2005. Engineering and economic growth. Structural Change and
Economic Dynamics, 16(2), pp.211-220.
Beck, S.E., 1993. A rational expectations model of time varying risk premia in
commodities futures markets: theory and evidence. International Economic
Review, pp.149-168.
Beckmann, J. and Czudaj, R., 2013. Is there a homogeneous causality pattern
between oil prices and currencies of oil importers and exporters? Energy
Economics, 40, pp.665-678.
Beckmann, J., Czudaj, R. and Arora, V., 2017. The relationship between oil prices
and exchange rates: theory and evidence. US Energy Information Administration
working paper series, pp.1-62.
Beckmann, J., Czudaj, R.L. and Arora, V., 2020. The relationship between oil
prices and exchange rates: Revisiting theory and evidence. Energy Economics, 88,
p.104772.
Behar, M.A. and Ritz, R.A., 2016. An analysis of OPEC’s strategic actions, US shale
growth and the 2014 oil price crash. International Monetary Fund.
Behmiri, N.B. and Manso, J.R.P., 2013. How crude oil consumption impacts on
economic growth of Sub-Saharan Africa? Energy, 54, pp.74-83.
Beidas-Strom, S. and Pescatori, M.A., 2014. Oil price volatility and the role of
speculation. International Monetary Fund.
Bems, R. and de Carvalho Filho, I., 2011. The current account and precautionary
savings for exporters of exhaustible resources. Journal of International
Economics, 84(1), pp.48-64.
Bénassy-Quéré, A., Mignon, V. and Penot, A., 2007. China and the relationship
between the oil price and the dollar. Energy policy, 35(11), pp.5795-5805.
Bergmann, D., O’Connor, D. and Thümmel, A., 2016. An analysis of price and
volatility transmission in butter, palm oil and crude oil markets. Agricultural and
Food Economics, 4(1), pp.1-23.
Bernadell, C., Cardon, P. and Coche, J. eds., 2004. Risk management for central
bank foreign reserves. Frankfurt am Main: European Central Bank.
Bernanke, B., Gertler, M. and Watson, M.W., 2004. Oil shocks and aggregate
macroeconomic behavior: The role of monetary policy: A reply. Journal of Money,
Credit, and Banking, 36(2), pp.287-291.
253
Bernanke, B.S., Gertler, M., Watson, M., Sims, C.A., and Friedman, B.M., 1997.
Systematic monetary policy and the effects of oil price shocks. Brookings papers
on economic activity, 1997(1), pp.91-157.
Berument, H., 1999. The impact of inflation uncertainty on interest rates in the
UK. Scottish Journal of Political Economy, 46(2), pp.207-218.
Berument, M.H., Ceylan, N.B. and Dogan, N., 2010. The impact of oil price shocks
on the economic growth of selected MENA1 countries. The Energy Journal, 31(1).
Berument, M.H., Sahin, A. and Sahin, S., 2014. The relative effects of crude oil
price and exchange rate on petroleum product prices: Evidence from a set of
Northern Mediterranean countries. Economic Modelling, 42, pp.243-249.
Beylis, G. and Cunha, B., 2017. Energy pricing policies for inclusive growth in Latin
America and the Caribbean. The World Bank.
Bicksler, J. and Chen, A.H., 1986. An economic analysis of interest rate swaps. The
Journal of Finance, 41(3), pp.645-655.
Bildirici, M. and Ersin, Ö., 2015. An investigation of the relationship between the
biomass energy consumption, economic growth, and oil prices. Procedia-Social
and Behavioural Sciences, 210, pp.203-212.
Blomberg, S.B. and Harris, E.S., 1995. The commodity-consumer price
connection: fact or fable? Economic Policy Review, 1(3).
Bodart, V., Candelon, B. and Carpantier, J.F., 2012. Real exchanges rates in
commodity producing countries: A reappraisal. Journal of International Money and
Finance, 31(6), pp.1482-1502.
Bouakez, H. and Kano, T., 2008. Terms of trade and current account fluctuations:
The Harberger–Laursen–Metzler effect revisited. Journal of
Macroeconomics, 30(1), pp.260-281.
Bouchaour, C. and Al-Zeaud, H.A., 2012. Oil price distortion and their impact on
Algerian macroeconomic. International Journal of Business and
Management, 7(18), p.99.
Brahmasrene, T., Huang, J.C. and Sissoko, Y., 2014. Crude oil prices and
exchange rates: Causality, variance decomposition and impulse response. Energy
Economics, 44, pp.407-412.
Brook, A.M., Price, R., Sutherland, D., Westerlund, N. and André, C., 2004. Oil
price developments: drivers, economic consequences, and policy responses.
Bulut, L., 2011. External debts and current account adjustments. The BE Journal
of Macroeconomics, 11(1).
Caballero, R.J., Farhi, E. and Gourinchas, P.O., 2008. An equilibrium model of"
global imbalances" and low interest rates. American economic review, 98(1),
pp.358-93.
Cabrera, B.L. and Schulz, F., 2016. Volatility linkages between energy and
agricultural commodity prices. Energy Economics, 54, pp.190-203.

254
Cabrera, B.L. and Schulz, F., 2016. Volatility linkages between energy and
agricultural commodity prices. Energy Economics, 54, pp.190-203.
Calvo, G., 2008. Exploding commodity prices, lax monetary policy, and sovereign
wealth funds.
Caporale, G.M. and Gil-Alana, L.A., 2002. Unemployment and input prices: a
fractional cointegration approach. Applied Economics Letters, 9(6), pp.347-351.
Cashin, P., Mohaddes, K., Raissi, M. and Raissi, M., 2014. The differential effects
of oil demand and supply shocks on the global economy. Energy Economics, 44,
pp.113-134.
Castillo, P., Montoro, C. and Vicente Tuesta, R., 2010. Inflation, oil price volatility
and monetary policy (No. 2010-002). Banco Central de Reserva del Perú.
Castro, C. and Jiménez-Rodríguez, R., 2020. Dynamic interactions between oil
price and exchange rate. PloS one, 15(8), p.e0237172.
Charfeddine, L. and Barkat, K., 2020. Short-and long-run asymmetric effect of oil
prices and oil and gas revenues on the real GDP and economic diversification in
oil-dependent economy. Energy Economics, 86, p.104680.
Charfeddine, L., Klein, T. and Walther, T., 2020. Reviewing the oil price–GDP
growth relationship: A replication study. Energy Economics, 88, p.104786.
Chatziantoniou, I., Filippidis, M., Filis, G. and Gabauer, D., 2021. A closer look into
the global determinants of oil price volatility. Energy Economics, 95, p.105092.
Chen, H., Liu, L., Wang, Y. and Zhu, Y., 2016. Oil price shocks and US dollar
exchange rates. Energy, 112, pp.1036-1048.
Chen, J., Zhu, X. and Li, H., 2020. The pass-through effects of oil price shocks on
China's inflation: A time-varying analysis. Energy Economics, 86, p.104695.
Chen, S.S. and Chen, H.C., 2007. Oil prices and real exchange rates. Energy
economics, 29(3), pp.390-404.
Chen, S.S., 2009. Oil price pass-through into inflation. Energy economics, 31(1),
pp.126-133.
Chen, S.T., Kuo, H.I. and Chen, C.C., 2010. Modeling the relationship between
the oil price and global food prices. Applied Energy, 87(8), pp.2517-2525.
Chen, Y.C. and Rogoff, K., 2003. Commodity currencies. Journal of international
Economics, 60(1), pp.133-160.
Cheng, D., Shi, X., Yu, J. and Zhang, D., 2019. How does the Chinese economy
react to uncertainty in international crude oil prices? International Review of
Economics & Finance, 64, pp.147-164.
Cheong, C., Kim, G.H. and Podivinsky, J.M., 2010. The impact of inflation
uncertainty on interest rates.
255
Cheratian, I., Farzanegan, M.R. and Goltabar, S., 2019. Oil price shocks and
unemployment rate: new evidence from the MENA region (No. 31-2019). MAGKS
Joint Discussion Paper Series in Economics.
Cherif, R. and Hasanov, F., 2013. Oil exporters’ dilemma: How much to save and
how much to invest. World Development, 52, pp.120-131.
Chimezie, P.O., Omankhanlen, A.E. and Eriabie, S.Y.L.V.E.S.T.E.R., 2020. Nexus
between public finance and economic growth in Nigeria. WSEAS Trans. Bus.
Econ, 7, pp.184-194.
Chimnani, H., Bhutto, N.A., Butt, F., Shaikh, S.A. and Devi, W., 2017. The effect
of exchange rate on unemployment rate in Asian countries. In Proceedings of 2nd
International Conference on Business Management.
Chinn, M.D. and Ito, H., 2008. Global current account imbalances: American fiscal
policy versus East Asian savings. Review of International Economics, 16(3),
pp.479-498.
Chisadza, C., Dlamini, J., Gupta, R. and Modise, M.P., 2016. The impact of oil
shocks on the South African economy. Energy Sources, Part B: Economics,
Planning, and Policy, 11(8), pp.739-745.
Chitiga, M., Fofana, I. and Mabugu, R., 2012. The poverty implications of high oil
prices in South Africa. Environment and development Economics, 17(3), pp.293-
313.
Chiweza, J.T. and Aye, G.C., 2018. The effects of oil price uncertainty on economic
activities in South Africa. Cogent Economics & Finance, 6(1), p.1518117.
Choi, S., Furceri, D., Loungani, P., Mishra, S. and Poplawski-Ribeiro, M., 2018. Oil
prices and inflation dynamics: Evidence from advanced and developing
economies. Journal of International Money and Finance, 82, pp.71-96.
Choucri, N., Heye, C. and Lynch, M., 1990. Analyzing oil production in developing
countries: A case study of Egypt. The Energy Journal, 11(3).
Chuku, C.A., 2012. Linear and asymmetric impacts of oil price shocks in an oil‐
importing and‐exporting economy: the case of Nigeria. OPEC Energy
Review, 36(4), pp.413-443.
Chuku, C.A., Akpan, U.F., Sam, N.R. and Effiong, E.L., 2011. Oil price shocks and
the dynamics of current account balances in Nigeria. OPEC Energy Review, 35(2),
pp.119-139.
Cline, W.R., 1984. International debt: Systemic risk and policy response.
Cologni, A. and Manera, M., 2008. Oil prices, inflation, and interest rates in a
structural cointegrated VAR model for the G-7 countries. Energy
economics, 30(3), pp.856-888.
Cologni, A. and Manera, M., 2009. The asymmetric effects of oil shocks on output
growth: A Markov–Switching analysis for the G-7 countries. Economic
Modelling, 26(1), pp.1-29.
256
Cooper, J.C., 2003. Price elasticity of demand for crude oil estimates for 23
countries. OPEC review, 27(1), pp.1-8.
Crossman, A., 2019. An overview of qualitative research methods: Direct
observation, interviews, participation, immersion, focus groups.
Cuestas, J.C. and Gil-Alana, L.A., 2018. Oil price shocks and unemployment in
Central and Eastern Europe. Economic Systems, 42(1), pp.164-173.
Cuestas, J.C., 2016. The impact of supply shocks on unemployment in Spain.
Cuñado, J. and de Gracia, F.P., 2003. Do oil price shocks matter? Evidence for
some European countries. Energy economics, 25(2), pp.137-154.
Cunado, J. and De Gracia, F.P., 2005. Oil prices, economic activity, and inflation:
evidence for some Asian countries. The Quarterly Review of Economics and
Finance, 45(1), pp.65-83.
Cunado, J., Jo, S. and de Gracia, F.P., 2015. Macroeconomic impacts of oil price
shocks in Asian economies. Energy Policy, 86, pp.867-879.
Dabrowski, M., 2015. The impact of the oil-price shock on net oil
exporters. Bruegel Blog.
Darby, M.R., 1982. The price of oil and world inflation and recession. The American
Economic Review, 72(4), pp.738-751.
Daude, C., Melguizo, Á. and Neut, A., 2010. Fiscal policy in Latin America:
countercyclical and sustainable at last? Available at SSRN 1985188.
Davari, H. and Kamalian, A., 2018. Oil price and inflation in Iran: non-linear ARDL
approach. International Journal of Energy Economics and Policy, 8(3), p.295.
de Miguel, C., Manzano, B., Martin-Moreno, J.M. and Ruiz, J., 2009. Disentangling
the effects of oil shocks: the role of rigidities and monetary policy. The Energy
Journal, 30(Special Issue# 2).
Devesh, S. and Affendi, A.M.A., 2021. Modelling the Impact of Oil Price on Food
Imports: Case of Oman. International Journal of Energy Economics and
Policy, 11(4), pp.113-120.
Didia, D. and Ayokunle, P., 2020. External debt, domestic debt, and economic
growth: The case of Nigeria. Advances in Economics and Business, 8(2), pp.85-
94.
Ding, C., Gummi, U.M., Lu, S.B. and Muazu, A., 2020. Modelling the impact of oil
price fluctuations on food price in high and low-income oil exporting
countries. Agricultural Economics, 66(10), pp.458-468.
Dinh, D.V., 2019. Applied individual investment risk measurement method to
forecast expected return rate. International Journal of Applied Mathematics and
Statistics, 58(3), pp.60-72.
257
Du, X., Cindy, L.Y. and Hayes, D.J., 2011. Speculation and volatility spillover in
the crude oil and agricultural commodity markets: A Bayesian analysis. Energy
Economics, 33(3), pp.497-503.
Easterby-Smith, M., Jaspersen, L.J., Thorpe, R. and Valizade, D.
2021. Management and business research. Sage.
Egbetunde, T., 2012. Public debt and economic growth in Nigeria: Evidence from
granger causality. American journal of economics, 2(6), pp.101-106.
Elmezouar, Z.C., Mazri, A., Benzaire, M. and Boudi, A.E.K., 2014. Test of causality
between oil price and GDP growth in Algeria. In Advances in Applied
Mathematics (pp. 205-213). Springer, Cham.
Essama-Nssah, B., 2007. Economy-wide and distributional impacts of an oil price
shock on the South African economy (Vol. 4354). World Bank Publications.
Farzanegan, M.R. and Markwardt, G., 2009. The effects of oil price shocks on the
Iranian economy. Energy Economics, 31(1), pp.134-151.
Fowowe, B., 2014. Modelling the oil price–exchange rate nexus for South
Africa. International Economics, 140, pp.36-48.
Fratzscher, M., Schneider, D. and Van Robays, I., 2013. Oil prices, exchange rates
and asset prices.
Frankel, J., 2008. Monetary policy and commodity prices. VoxEU http://www.
voxeu. org/index. php.
Frankel, J.A., 2006. The effect of monetary policy on real commodity prices (No.
w12713). National Bureau of Economic Research.
Fueki, T., Nakajima, J., Ohyama, S. and Tamanyu, Y., 2021. Identifying oil price
shocks and their consequences: the role of expectations in the crude oil
market. International Finance, 24(1), pp.53-76.
Gbatu, A.P., Wang, Z., Wesseh Jr, P.K. and Tutdel, I.Y.R., 2017. Asymmetric and
dynamic Effects of oil price shocks and exchange rate fluctuations: Evidence from
a panel of economic community of West African States (ECOWAS). International
Journal of Energy Economics and Policy, 7(3), pp.1-13.
Gbatu, A.P., Wang, Z., Wesseh Jr, P.K. and Tutdel, I.Y.R., 2017. The impacts of
oil price shocks on small oil-importing economies: Time series evidence for
Liberia. Energy, 139, pp.975-990.
Gherman, A., Ştefan, G. and Filip, A., 2013. Exchange rate volatility effects on
export competitiveness. Romanian Case. Theoretical and Applied
Economics, 20(9), p.586.
Gohin, A. and Chantret, F., 2010. The long-run impact of energy prices on world
agricultural markets: The role of macro-economic linkages. Energy Policy, 38(1),
pp.333-339.
Ghosh, N., Varvares, C. and Morley, J., 2009. The effects of oil price shocks on
output. Business Economics, 44(4), pp.220-228.
258
González, A. and Nabiyev, S., 2009. Oil price fluctuations and its effect on GDP
growth.
Guo, H. and Kliesen, K.L., 2005. Oil price volatility and US macroeconomic
activity. Review-Federal Reserve Bank of Saint Louis, 87(6), p.669.
Gylfason, T. and Schmid, M., 1983. Does devaluation cause stagflation? Canadian
Journal of Economics, pp.641-654.
Habib, M.M., Bützer, S. and Stracca, L., 2016. Global exchange rate
configurations: do oil shocks matter? IMF Economic Review, 64(3), pp.443-470.
Hamilton, J.D., 1983. Oil and the macroeconomy since World War II. Journal of
political economy, 91(2), pp.228-248.
Hamilton, J.D., 1996. This is what happened to the oil price-macroeconomy
relationship. Journal of Monetary Economics, 38(2), pp.215-220.
Hamilton, J.D., 2013. Historical oil shocks (pp. 258-284). Routledge.
Hammoudeh, S. and Aleisa, E., 2004. Dynamic relationships among GCC stock
markets and NYMEX oil futures. Contemporary Economic Policy, 22(2), pp.250-
269.
Hashmi, S.M., Chang, B.H. and Bhutto, N.A., 2021. Asymmetric effect of oil prices
on stock market prices: new evidence from oil-exporting and oil-importing
countries. Resources Policy, 70, p.101946.
Honarvar, A., 2009. Asymmetry in retail gasoline and crude oil price movements
in the United States: an application of hidden cointegration technique. Energy
Economics, 31(3), pp.395-402.
Hooker, M.A., 1999. Are oil shocks inflationary? Asymmetric and nonlinear
specifications versus changes in regime. Journal of money, credit and banking,
pp.540-561.
Hooker, M.A., 2002. Are oil shocks inflationary? Asymmetric and nonlinear
specifications versus changes in regime. Journal of money, credit and banking,
pp.540-561.
Hosseini, S.H., Shakouri, H. and Kazemi, A., 2021. Oil price future regarding
unconventional oil production and its near-term deployment: A system dynamics
approach. Energy, 222, p.119878.
Huang, Y. and Feng, G.U.O., 2007. The role of oil price shocks on China's real
exchange rate. China Economic Review, 18(4), pp.403-416.
Huang, B.N., Hwang, M.J. and Peng, H.P., 2005. The asymmetry of the impact of
oil price shocks on economic activities: an application of the multivariate threshold
model. Energy Economics, 27(3), pp.455-476.
Huchet-Bourdon, M., 2011. Agricultural commodity price volatility: an overview.
Ibrahim, M.H., 2015. Oil and food prices in Malaysia: a nonlinear ARDL
analysis. Agricultural and Food Economics, 3(1), pp.1-14.
259
Imai, K., Gaiha, R. and Thapa, G., 2008. Food and oil prices. Economics Discussion
Paper Series EDP-0801 (Manchester, UK: University of Manchester).
Ito, K., 2008. Oil price and the Russian economy: A VEC model
approach. International Research Journal of Finance and Economics, 17, pp.68-
74.
Jacquinot, P., Kuismanen, M., Mestre, R. and Spitzer, M., 2009. An assessment of
the inflationary impact of oil shocks in the euro area. The Energy Journal, 30(1).
Jammazi, R., Lahiani, A. and Nguyen, D.K., 2015. A wavelet based nonlinear ARDL
model for assessing the exchange rate pass-through to crude oil prices. Journal of
International Financial Markets, Institutions and Money, 34, pp.173-187.
Jawadi, F., Mallick, S.K. and Sousa, R.M., 2016. Fiscal and monetary policies in
the BRICS: A panel VAR approach. Economic Modelling, 58, pp.535-542.
Jiang, J. and Gu, R., 2016. Asymmetrical long-run dependence between oil price
and US dollar exchange rate—Based on structural oil shocks. Physical A: Statistical
Mechanics and its Applications, 456, pp.75-89.
Jibril, H., Chaudhuri, K. and Mohaddes, K., 2020. Asymmetric oil prices and trade
imbalances: Does the source of the oil shock matter? Energy Policy, 137,
p.111100.
Jiménez-Rodríguez*, R. and Sánchez, M., 2005. Oil price shocks and real GDP
growth: empirical evidence for some OECD countries. Applied economics, 37(2),
pp.201-228.
Jiménez‐Rodríguez, R. and Sánchez, M., 2012. Oil price shocks and Japanese
macroeconomic developments. Asian‐Pacific Economic Literature, 26(1), pp.69-
83.
Jin, H. and Xiong, C., 2021. Fiscal stress and monetary policy stance in oil-
exporting countries. Journal of International Money and Finance, 111, p.102302.
Kaka, E.J. and Ado, A.B., 2020. An investigation of the influence of indirect tax,
oil receipt, debt, and foreign exchange reserves: Nigerian experience. Journal of
Contemporary Accounting, 2(3).
Keane, M.P. and Prasad, E.S., 1996. The employment and wage effects of oil price
changes: a sectoral analysis. The Review of Economics and Statistics, pp.389-400.
Khan, K., Su, C.W. and Tao, R., 2021. Do oil prices cause financial liquidity crunch?
Perspective from geopolitical risk. Defence and Peace Economics, 32(3), pp.312-
324.
Khan, M.A., Husnain, M.I.U., Abbas, Q., and Shah, S.Z.A., 2019. Asymmetric
effects of oil price shocks on Asian economies: a nonlinear analysis. Empirical
Economics, 57(4), pp.1319-1350.
Kilian, L. and Vigfusson, R.J., 2017. The role of oil price shocks in causing US
recessions. Journal of Money, Credit and Banking, 49(8), pp.1747-1776.
Kilian, L. and Zhou, X., 2019. Oil prices, exchange rates and interest rates.
260
Kilian, L., 2009. Not all oil price shocks are alike: Disentangling demand and
supply shocks in the crude oil market. American Economic Review, 99(3),
pp.1053-69.
Kim, J.M. and Jung, H., 2018. Dependence structure between oil prices, exchange
rates, and interest rates. The Energy Journal, 39(2).
Kisswani, K.M. and Elian, M.I., 2021. Analysing the (a) symmetric impacts of oil
price, economic policy uncertainty, and global geopolitical risk on exchange
rate. The Journal of Economic Asymmetries, 24, p.e00204.
Klobodu, E.K.M. and Adams, S., 2016. Capital flows and economic growth in
Ghana. Journal of African Business, 17(3), pp.291-307.
Knotek II, E.S. and Zaman, S., 2021.K Asymmetric responses of consumer
spending to energy prices: A threshold VAR approach. Energy Economics, 95,
p.105127.
Kocaarslan, B., Soytas, M.A. and Soytas, U., 2020. The asymmetric impact of oil
prices, interest rates and oil price uncertainty on unemployment in the US. Energy
Economics, 86, p.104625.
Kocaaslan, O.K., 2019. Oil price uncertainty and unemployment. Energy
Economics, 81, pp.577-583.
KURASAWA, K.A., 2016. Policy Uncertainty and Foreign Exchange Rates: he DCC-
GARCH Model of the US/Japanese Foreign Exchange Rate. International journal of
Economic Sciences, 5(4), pp.1-19.
Lawal, G.O. and Aweda, N.O., 2015. An application of ARDL bounds testing
procedure to the estimation of level relationship between exchange rate, crude oil
price and inflation rate in Nigeria. International Journal of Statistics and
Applications, 5(2), pp.81-90.
Le, T.H. and Chang, Y., 2013. Oil price shocks and trade imbalances. Energy
Economics, 36, pp.78-96.
Lee, B.R., Lee, K. and Ratti, R.A., 2001. Monetary policy, oil price shocks, and the
Japanese economy. Japan and the World Economy, 13(3), pp.321-349.
Lee, J., and Cho, H.C., 2021. Impact of Structural Oil Price Shock Factors on the
Gasoline Market and Macroeconomy in South Korea. Sustainability 2021, 13,
2209.
Lescaroux, F. and Mignon, V., 2008. On the influence of oil prices on economic
activity and other macroeconomic and financial variables. OPEC Energy
Review, 32(4), pp.343-380.
Lin, B. and Bai, R., 2021. Oil prices and economic policy uncertainty: Evidence
from global, oil importers, and exporters’ perspective. Research in International
Business and Finance, 56, p.101357.
Lin, B. and Su, T., 2020. Does oil price have similar effects on the exchange rates
of BRICS? International Review of Financial Analysis, 69, p.101461.
261
Liu, R., Chen, J. and Wen, F., 2021. The nonlinear effect of oil price shocks on
financial stress: Evidence from China. The North American Journal of Economics
and Finance, 55, p.101317.
Lizardo, R.A. and Mollick, A.V., 2010. Oil price fluctuations and US dollar exchange
rates. Energy Economics, 32(2), pp.399-408.
Longe, A.E., Adelokun, O.O. and Omitogun, O., 2018. The current account and oil
price fluctuations nexus in Nigeria. Journal of Competitiveness, 10(2), p.118.
Longe, A.E., Muhammad, S., Ajayi, P.I. and Omitogun, O., 2019. Oil price, trade
openness, current account balances and the official exchange rate in
Nigeria. OPEC Energy Review, 43(4), pp.446-469.
Lopez-Calix, J.R. and Touqeer, I., 2016. Algeria: Comparing the last two oil shocks
and policy responses. Topics in Middle Eastern and African Economies, 18, pp.117-
129.
Lotti, L., 2002. A Note on the Bivariate Orthogonal GARCH Model. Available at
SSRN 304048.
Lyu, Y., Tuo, S., Wei, Y. and Yang, M., 2021. Time-varying effects of global
economic policy uncertainty shocks on crude oil price volatility: new
evidence. Resources Policy, 70, p.101943.
Ma, Y., Chen, Z., Shinwari, R. and Khan, Z., 2021. Financialization, globalization,
and Dutch disease: Is Dutch disease exist for resources rich countries? Resources
Policy, 72, p.102048.
Madueme, S. and Nwosu, O.C., 2010. Oil price shocks and macroeconomic
variables in Nigeria. International Journal of Research in Arts and Social
Sciences, 2, pp.333-342.
Maghrebi, Fatine, Zouaoui Chikr El Mezouar, and Ibrahim Almanjahie. "Test of
causality between oil prices and GDP case study Saudi Arabia." Economic
Computation and Economic Cybernetics Studies and Research 52.3 (2018): 279-
289.
Maghyereh, A. and Abdoh, H., 2021. The impact of extreme structural oil-price
shocks on clean energy and oil stocks. Energy, 225, p.120209.
Mahmood, H. and Murshed, M., 2021. Oil price and economic growth nexus in
Saudi Arabia: Asymmetry analysis. International Journal of Energy Economics and
Policy, 11(1), p.29.
Maijamaâ, R. and Musa, K.S., 2020. Crude oil price fluctuation and unemployment
nexus in Nigeria: Evidence from VECM technique. Energy Economics Letters, 7(2),
pp.94-109.
Malikov, E., 2016. Dynamic responses to oil price shocks: Conditional vs
unconditional (a) symmetry. Economics Letters, 139, pp.31-35.
262
Mallik, G. and Chowdhury, A., 2011. Effect of inflation uncertainty, output
uncertainty and oil price on inflation and growth in Australia. Journal of Economic
Studies.
Minot, N., 2014. Food price volatility in sub-Saharan Africa: Has it really
increased? Food Policy, 45, pp.45-56.
Misati, R.N., Nyamongo, E.M. and Mwangi, I., 2013. Commodity price shocks and
inflation in a net oil‐importing economy. OPEC Energy Review, 37(2), pp.125-148.
Mishra, S. and Debasish, S.S., 2017. Analysis of volatility spill over between oil
price and exchange rate in India: GARCH approach. Available at SSRN 2892670.
Mohammed, M., 2015. Oil Price Fluctuations and Current Accounts in Oil-Importing
Countries: The Role of Financial Development. CAKE Paper Series.
Mork, K.A. and Hall, R.E., 1980. Energy prices, inflation, and recession, 1974-
1975. The Energy Journal, 1(3).
Mork, K.A., 1989. Oil and the macroeconomy when prices go up and down: an
extension of Hamilton's results. Journal of political Economy, 97(3), pp.740-744.
Murshed, M. and Tanha, M.M., 2021. Oil price shocks and renewable energy
transition: Empirical evidence from net oil-importing South Asian
economies. Energy, Ecology and Environment, 6, pp.183-203.
Musa, K.S., Campus, Y., and Tower, N.N.P.C., 2020. Crude oil price and exchange
rate nexus: An ARDL bound approach. Open Access Library Journal, 7(03), p.1.
Namaki, A., Nazari, M. and Gaeeini, H., 2020. Analysis of Sovereign External Debt
Variations by Cross Wavelet Transform. Iranian Journal of Finance, 4(4), pp.126-
139.
Narayan, P.K. and Narayan, S., 2007. Modelling oil price volatility. Energy
policy, 35(12), pp.6549-6553.
Nazlioglu, S. and Soytas, U., 2011. World oil prices and agricultural commodity
prices: Evidence from an emerging market. Energy Economics, 33(3), pp.488-
496.
Nazlioglu, S., Gormus, A. and Soytas, U., 2019. Oil prices and monetary policy in
emerging markets: structural shifts in causal linkages. Emerging Markets Finance
and Trade, 55(1), pp.105-117.
Nusair, S.A. and Olson, D., 2019. The effects of oil price shocks on Asian exchange
rates: Evidence from quantile regression analysis. Energy Economics, 78, pp.44-
63.
Nusair, S.A. and Olson, D., 2021. Asymmetric oil price and Asian economies: A
nonlinear ARDL approach. Energy, 219, p.119594.
Nusair, S.A., 2020. The asymmetric effects of oil price changes on unemployment:
Evidence from Canada and the US. The Journal of Economic Asymmetries, 21,
p.e00153.
263
Obadi, S.M. and Korecek, M., 2018. The crude oil price and speculations:
Investigation using granger causality test. International Journal of Energy
Economics and Policy, 8(3), p.275.
Odera, E.A., 2015. The relationship between international diesel price and the
inflation rate in Kenya (Doctoral dissertation, University of Nairobi).
Ogede, S.J., George, E.O. and Adekunle, I.A., 2020. Exploring the inflationary
effect of oil price volatility in Africa's oil exporting countries (No. WP/20/020).
AGDI Working Paper.
Olayungbo, D.O., 2019. Effects of global oil price on exchange rate, trade balance,
and reserves in Nigeria: A frequency domain causality approach. Journal of Risk
and Financial Management, 12(1), p.43.
Olayungbo, D.O., 2021. Global oil price and food prices in food importing and oil
exporting developing countries: A panel ARDL analysis. Heliyon, 7(3), p.e06357.
Olowofeso, O.E., Ajibola, I.O., Muhammad, R.A., Karu, S. and Orenowo, O.E.,
2020. External Reserves and Selected Key Macroeconomic Variables in Nigeria:
An Empirical Analysis (2000-2018).
Oluwaseyi, A.R., 2018. Oil price volatility spillover effects on food prices in
Nigeria. Available at SSRN 3292722.
Omolade, A., Ngalawa, H. and Kutu, A., 2019. Crude oil price shocks and
macroeconomic performance in Africa’s oil-producing countries. Cogent
Economics & Finance, 7(1), p.1607431.
Ordóñez, J., Monfort, M. and Cuestas, J.C., 2019. Oil prices, unemployment, and
the financial crisis in oil-importing countries: The case of Spain. Energy, 181,
pp.625-634.
Osuji, E., 2015. International oil prices and exchange rate in Nigeria: A causality
analysis. International Journal of Academic Research in Economics and
Management Sciences, 4(3), pp.11-22.
Park, J. and Ratti, R.A., 2008. Oil price shocks and stock markets in the US and
13 European countries. Energy economics, 30(5), pp.2587-2608.
Paris, A., 2018. On the link between oil and agricultural commodity prices: Do
biofuels matter? International Economics, 155, pp.48-60.
Polbin, A., Skrobotov, A. and Zubarev, A., 2020. How the oil price and other
factors of real exchange rate dynamics affect real GDP in Russia. Emerging
Markets Finance and Trade, 56(15), pp.3732-3745.
Pönkä, H. and Zheng, Y., 2019. The role of oil prices on the Russian business
cycle. Research in International Business and Finance, 50, pp.70-78.
Prag, J., 1994. The response of interest rates to unemployment rate
announcements: is there a natural rate of unemployment? Journal of
Macroeconomics, 16(1), pp.171-184.
264
Qin, X., Zhou, C. and Wu, C., 2016. Revisiting asymmetric price transmission in
the US oil-gasoline markets: A multiple threshold error-correction
analysis. Economic Modelling, 52, pp.583-591.
Qurat-Ul-Ain, S. and Tufail, S., 2013. The effect of oil price shocks on the dynamic
relationship between current account and exchange rate: evidence from D-8
Countries. The Pakistan Development Review, pp.537-555.
Rafiq, S., Salim, R. and Bloch, H., 2009. Impact of crude oil price volatility on
economic activities: An empirical investigation in the Thai economy. Resources
Policy, 34(3), pp.121-132.
Raheem, I.D., Bello, A.K. and Agboola, Y.H., 2020. A new insight into oil price-
inflation nexus. Resources Policy, 68, p.101804.
Raifu, I.A., Aminu, A. and Folawewo, A.O., 2020. Investigating the relationship
between changes in oil prices and unemployment rate in Nigeria: linear and
nonlinear autoregressive distributed lag approaches. Future Business
Journal, 6(1), pp.1-18.
Raji, J.O., Jusoh, J. and Jantan, M.D., 2014. Real Money Supply, Price and Fiscal
Deficit in Nigeria: Evidence from Multivariate Granger Causality Tests. Journal of
Economic Cooperation & Development, 35(4).
Ratti, R.A. and Vespignani, J.L., 2016. Oil prices and global factor macroeconomic
variables. Energy Economics, 59, pp.198-212.
Rautava, J., 2004. The role of oil prices and the real exchange rate in Russia's
economy—a cointegration approach. Journal of comparative economics, 32(2),
pp.315-327.
Reboredo, J.C., 2012. Do food and oil prices co-move? Energy policy, 49, pp.456-
467.
Reboredo, J.C., 2012. Modelling oil price and exchange rate co-
movements. Journal of Policy Modelling, 34(3), pp.419-440.
Rebucci, A. and Spatafora, N., 2006. Oil prices and global imbalances. IMF World
Economic Outlook, 4(2006), pp.71-96.
Reicher, C.P. and Utlaut, J.F., 2010. The relationship between oil prices and long-
term interest rates (No. 1637). Kiel working paper.
Rodrik, D., 2006. The social cost of foreign exchange reserves. International
Economic Journal, 20(3), pp.253-266.
Roeger, W., 2005. International oil price changes: impact of oil prices on growth
and inflation in the EU/OECD. International Economics and Economic Policy, 2(1),
pp.15-32.
Roman, M., Górecka, A. and Domagała, J., 2020. The linkages between crude oil
and food prices. Energies, 13(24), p.6545.
Sachs, J.D. and Warner, A.M., 1995. Natural resource abundance and economic
growth (No. w5398). National Bureau of Economic Research.
265
Salisu, A.A. and Isah, K.O., 2017. Revisiting the oil price and stock market nexus:
A nonlinear Panel ARDL approach. Economic Modelling, 66, pp.258-2
Sanchez, M., 2008. The link between interest rates and exchange rates: do
contractionary depreciations make a difference? International Economic
Journal, 22(1), pp.43-61.
Sarwar, M.N., Hussain, H. and Maqbool, M.B., 2020. Pass through effects of oil
price on food and non-food prices in Pakistan: A nonlinear ARDL
approach. Resources Policy, 69, p.101876.
Saymeh, A.A.F. and Orabi, M.M.A., 2013. The effect of interest rate, inflation rate,
GDP, on real economic growth rate in Jordan. Asian Economic and Financial
Review, 3(3), p.341.
Schubert, S.F., 2014. Dynamic effects of oil price shocks and their impact on the
current account. Macroeconomic Dynamics, 18(2), pp.316-337.
Şen, H., Kaya, A., Kaptan, S. and Cömert, M., 2020. Interest rates, inflation, and
exchange rates in fragile EMEs: A fresh look at the long-run interrelationships. The
Journal of International Trade & Economic Development, 29(3), pp.289-318.
Shaibu, I. and Izedonmi, F.I., 2020. An Autoregressive Distributed-Lag Modelling
Approach to Nigeria’s External Reserves Dynamics. INTERNATIONAL JOURNAL OF
ACADEMIC RESEARCH IN BUSINESS AND SOCIAL SCIENCES, 10(2).
Shangle, A. and Solaymani, S., 2020. Responses of monetary policies to oil price
changes in Malaysia. Energy, 200, p.117553.
Sharma, P. and Shrivastava, A.K., 2021. Economic activities and oil price shocks
in Indian outlook: direction of causality and testing cointegration. Global Business
Review, p.0972150921990491.
Sill, K., 2007. The macroeconomics of oil shocks. Federal Reserve Bank of
Philadelphia, Business Review, 1(1), pp.21-31.
Singh, V.K., Nishant, S. and Kumar, P., 2018. Dynamic and directional network
connectedness of crude oil and currencies: Evidence from implied
volatility. Energy Economics, 76, pp.48-63.
Śmiech, S., Papież, M., Rubaszek, M. and Snarska, M., 2021. The role of oil price
uncertainty shocks on oil-exporting countries. Energy Economics, 93, p.105028.
Soile, I. and Babajide, N., 2015. Oil price shocks and Nigeria's economic activity:
Evidence from ARDL co-integration and VECM analysis. Available at SSRN
2624004.
Steidtmann, C., 2004. Economist's corner: oil prices and interest rates. Deloitte
Research.
Su, C.W., Huang, S.W., Qin, M. and Umar, M., 2021. Does crude oil price stimulate
economic policy uncertainty in BRICS? Pacific-Basin Finance Journal, 66,
p.101519.
266
Taghizadeh-Hesary, F., Yoshino, N., Mohammadi Hossein Abadi, M. and
Farboudmanesh, R., 2016. Response of macro variables of emerging and
developed oil importers to oil price movements. Journal of the Asia Pacific
Economy, 21(1), pp.91-102.
Tang, K. and Xiong, W., 2012. Index investment and the financialization of
commodities. Financial Analysts Journal, 68(6), pp.54-74.
Tian, M., Li, W. and Wen, F., 2021. The dynamic impact of oil price shocks on the
stock market and the USD/RMB exchange rate: Evidence from implied volatility
indices. The North American Journal of Economics and Finance, 55, p.101310.
Timilsina, G.R., Mevel, S. and Shrestha, A., 2011. Oil price, biofuels, and food
supply. Energy Policy, 39(12), pp.8098-8105.
Tiwari, A.K., Arouri, M. and Teulon, F., 2014. Oil prices and trade balance: A
frequency domain analysis for India. Economics Bulletin, 34(2), pp.663-680.
Tokgoz, S., 2009. The impact of energy markets on the EU agricultural sector.
Trehan, B. and General, T., 1986. Oil prices, exchange rates and the US economy:
an empirical investigation.
Trehan, B., 2005. Oil price shocks and inflation. FRBSF Economic Letter.
Trujillo-Barrera, A.T. and Mallory, M., 2011. Volatility spillovers in the US crude
oil, corn, and ethanol markets.
Turan, T., Karakas, M., and Ozer, H.A., 2020. How Do Oil Price Changes Affect the
Current Account Balance? Evidence from Co-integration and Causality
Tests. Economic Casopis, 68(1), pp.55-68.
UDEH, S.N., UGWU, J.I. and Onwuka, I.O., 2016. External debt and economic
growth: The Nigeria experience. European Journal of Accounting Auditing and
Finance Research, 4(2), pp.33-48.
Udoayang, J.O., Usang, E.I. and Enya, E.F., 2020. OIL VALUE VARIATIONS AND
COST-EFFECTIVENESS TOWARDS WEALTH CREATION OF OIL AND GAS VENDING
CORPORATIONS. European Journal of Management and Marketing Studies.
Urbanchuk, J.M. and Director, L.E.C.G., 2007. The relative impact of corn and
energy prices in the grocery aisle. LECG LLC, 4, p.2008.
Urom, C., Guesmi, K., Abid, I. and Dagher, L., 2021. Dynamic integration and
transmission channels among interest rates and oil price shocks. The Quarterly
Review of Economics and Finance.
Usman, O. and Balcilar, M., 2021. Exchange rate and oil price pass-through in
BRICS countries: Evidence from the spillover index and rolling-sample
analysis. Energy, p.120666.
Van der Ploeg, F. and Venables, A.J., 2011. Natural resource wealth: The challenge
of managing a windfall.
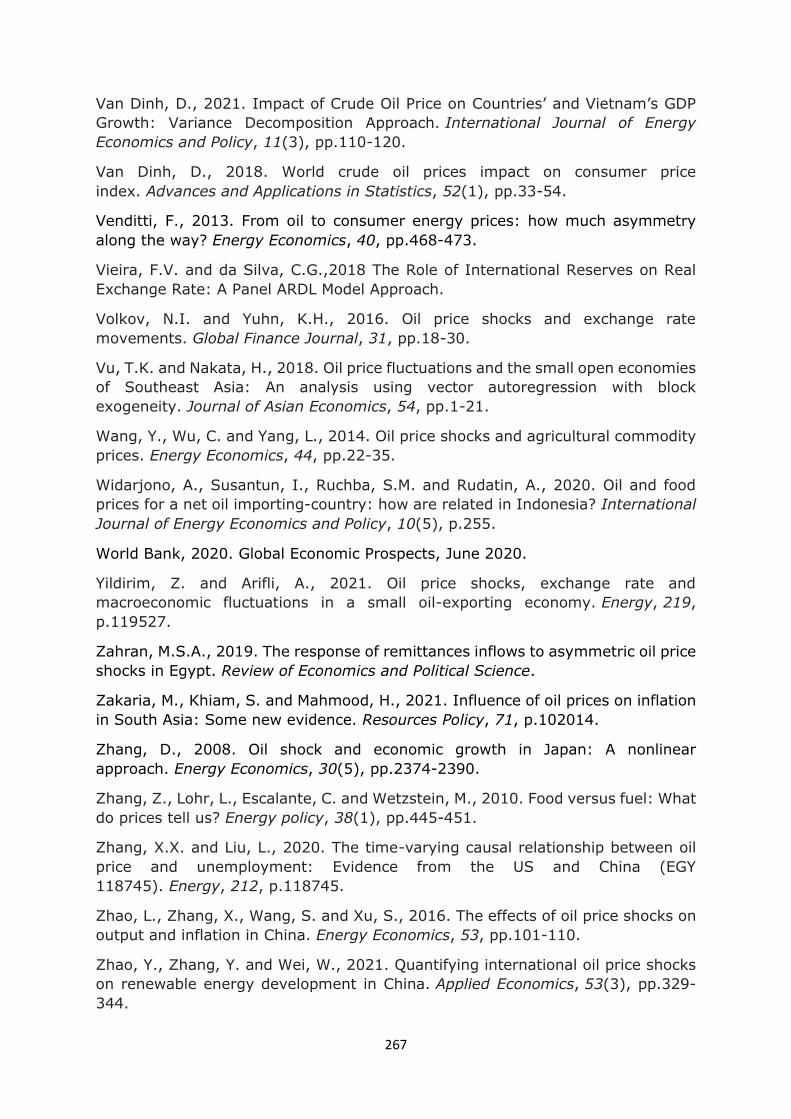
267
Van Dinh, D., 2021. Impact of Crude Oil Price on Countries’ and Vietnam’s GDP
Growth: Variance Decomposition Approach. International Journal of Energy
Economics and Policy, 11(3), pp.110-120.
Van Dinh, D., 2018. World crude oil prices impact on consumer price
index. Advances and Applications in Statistics, 52(1), pp.33-54.
Venditti, F., 2013. From oil to consumer energy prices: how much asymmetry
along the way? Energy Economics, 40, pp.468-473.
Vieira, F.V. and da Silva, C.G.,2018 The Role of International Reserves on Real
Exchange Rate: A Panel ARDL Model Approach.
Volkov, N.I. and Yuhn, K.H., 2016. Oil price shocks and exchange rate
movements. Global Finance Journal, 31, pp.18-30.
Vu, T.K. and Nakata, H., 2018. Oil price fluctuations and the small open economies
of Southeast Asia: An analysis using vector autoregression with block
exogeneity. Journal of Asian Economics, 54, pp.1-21.
Wang, Y., Wu, C. and Yang, L., 2014. Oil price shocks and agricultural commodity
prices. Energy Economics, 44, pp.22-35.
Widarjono, A., Susantun, I., Ruchba, S.M. and Rudatin, A., 2020. Oil and food
prices for a net oil importing-country: how are related in Indonesia? International
Journal of Energy Economics and Policy, 10(5), p.255.
World Bank, 2020. Global Economic Prospects, June 2020.
Yildirim, Z. and Arifli, A., 2021. Oil price shocks, exchange rate and
macroeconomic fluctuations in a small oil-exporting economy. Energy, 219,
p.119527.
Zahran, M.S.A., 2019. The response of remittances inflows to asymmetric oil price
shocks in Egypt. Review of Economics and Political Science.
Zakaria, M., Khiam, S. and Mahmood, H., 2021. Influence of oil prices on inflation
in South Asia: Some new evidence. Resources Policy, 71, p.102014.
Zhang, D., 2008. Oil shock and economic growth in Japan: A nonlinear
approach. Energy Economics, 30(5), pp.2374-2390.
Zhang, Z., Lohr, L., Escalante, C. and Wetzstein, M., 2010. Food versus fuel: What
do prices tell us? Energy policy, 38(1), pp.445-451.
Zhang, X.X. and Liu, L., 2020. The time-varying causal relationship between oil
price and unemployment: Evidence from the US and China (EGY
118745). Energy, 212, p.118745.
Zhao, L., Zhang, X., Wang, S. and Xu, S., 2016. The effects of oil price shocks on
output and inflation in China. Energy Economics, 53, pp.101-110.
Zhao, Y., Zhang, Y. and Wei, W., 2021. Quantifying international oil price shocks
on renewable energy development in China. Applied Economics, 53(3), pp.329-
344.

268
APPENDIX
Nigeria: Figure 6.1 Co-movement Between Oil Price and GDP
Sources: Author generated 2021
y = 0.3985x - 0.0063R² = 0.1045
-1.00
-0.50
0.00
0.50
1.00
1.50
2.00
2.50
3.00
3.50
4.00
0.00 1.00 2.00 3.00 4.00 5.00 6.00 7.00
LG
DP
LOP
Co-movement Between Oil Price and GDP
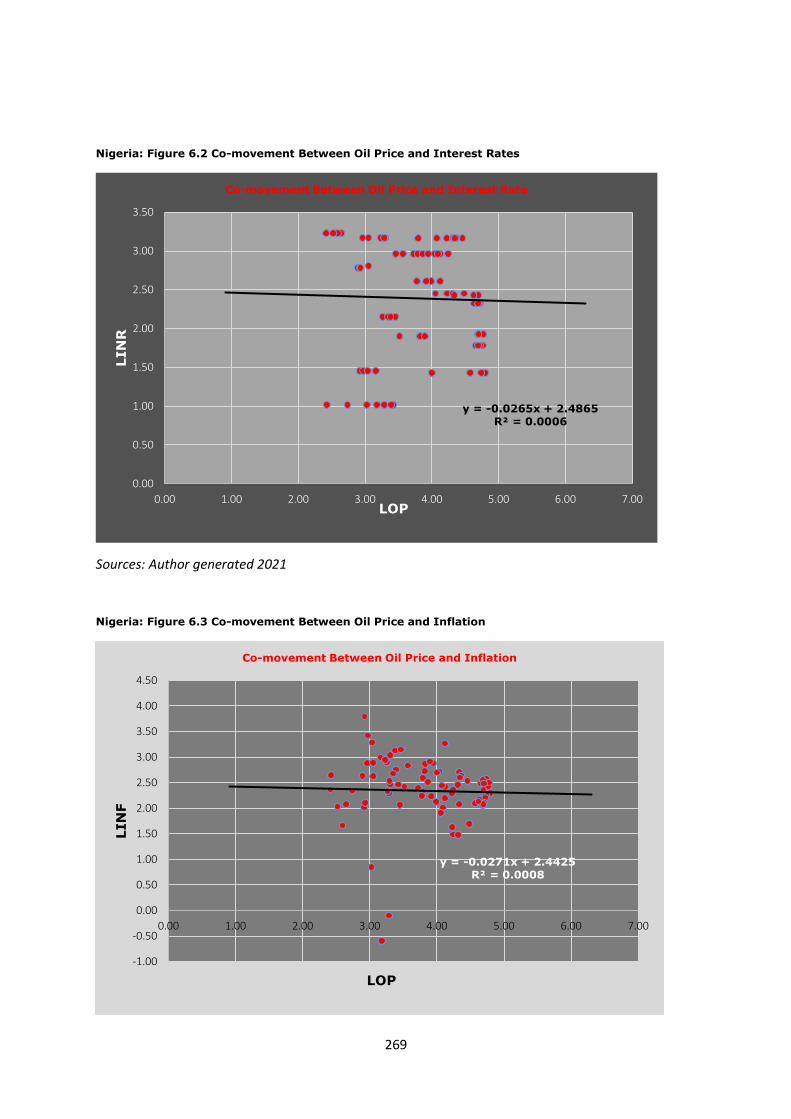
269
Nigeria: Figure 6.2 Co-movement Between Oil Price and Interest Rates
Sources: Author generated 2021
Nigeria: Figure 6.3 Co-movement Between Oil Price and Inflation
y = -0.0265x + 2.4865R² = 0.0006
0.00
0.50
1.00
1.50
2.00
2.50
3.00
3.50
0.00 1.00 2.00 3.00 4.00 5.00 6.00 7.00
LIN
R
LOP
Co-movement Between Oil Price and Interest Rate
y = -0.0271x + 2.4425R² = 0.0008
-1.00
-0.50
0.00
0.50
1.00
1.50
2.00
2.50
3.00
3.50
4.00
4.50
0.00 1.00 2.00 3.00 4.00 5.00 6.00 7.00
LIN
F
LOP
Co-movement Between Oil Price and Inflation
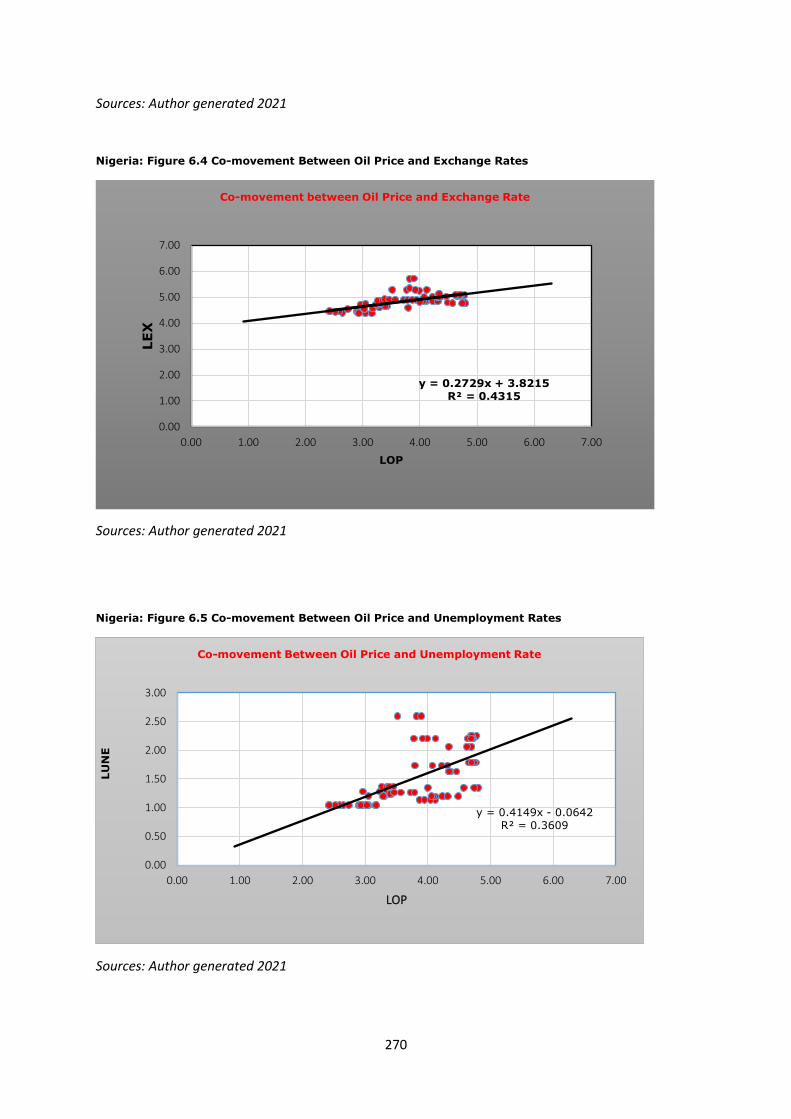
270
Sources: Author generated 2021
Nigeria: Figure 6.4 Co-movement Between Oil Price and Exchange Rates
Sources: Author generated 2021
Nigeria: Figure 6.5 Co-movement Between Oil Price and Unemployment Rates
Sources: Author generated 2021
y = 0.2729x + 3.8215R² = 0.4315
0.00
1.00
2.00
3.00
4.00
5.00
6.00
7.00
0.00 1.00 2.00 3.00 4.00 5.00 6.00 7.00
LE
X
LOP
Co-movement between Oil Price and Exchange Rate
y = 0.4149x - 0.0642R² = 0.3609
0.00
0.50
1.00
1.50
2.00
2.50
3.00
0.00 1.00 2.00 3.00 4.00 5.00 6.00 7.00
LU
NE
LOP
Co-movement Between Oil Price and Unemployment Rate
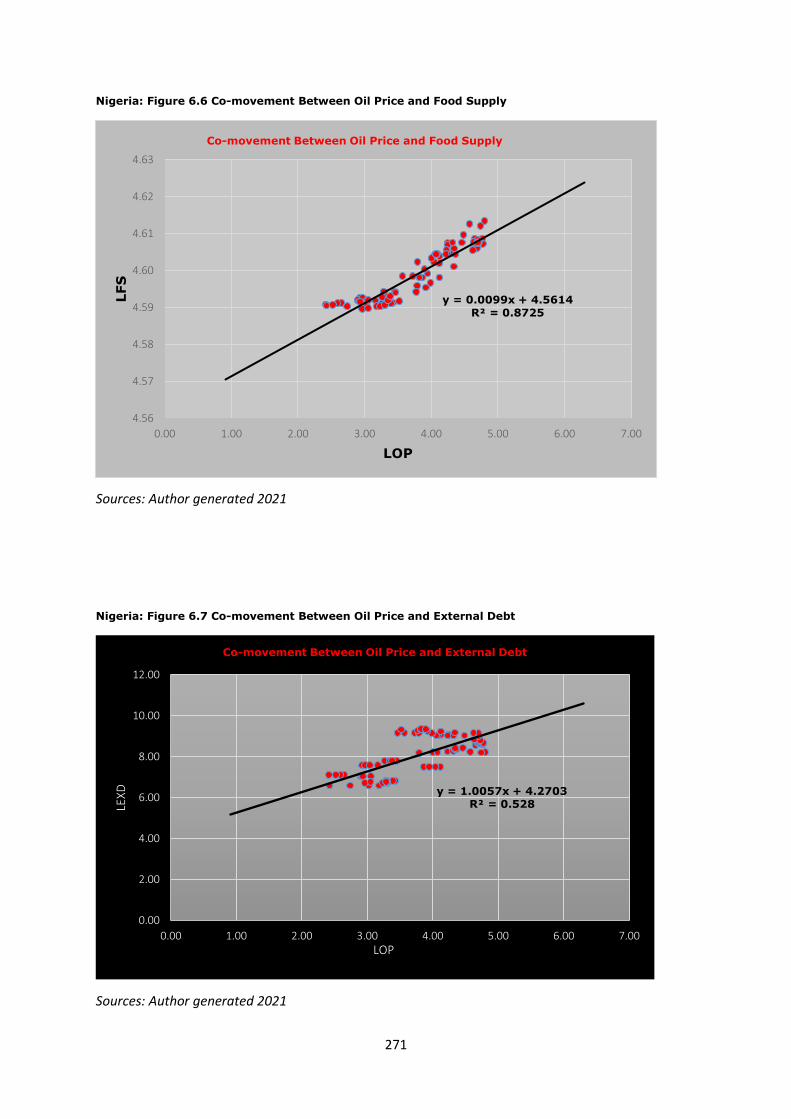
271
Nigeria: Figure 6.6 Co-movement Between Oil Price and Food Supply
Sources: Author generated 2021
Nigeria: Figure 6.7 Co-movement Between Oil Price and External Debt
Sources: Author generated 2021
y = 0.0099x + 4.5614R² = 0.8725
4.56
4.57
4.58
4.59
4.60
4.61
4.62
4.63
0.00 1.00 2.00 3.00 4.00 5.00 6.00 7.00
LFS
LOP
Co-movement Between Oil Price and Food Supply
y = 1.0057x + 4.2703R² = 0.528
0.00
2.00
4.00
6.00
8.00
10.00
12.00
0.00 1.00 2.00 3.00 4.00 5.00 6.00 7.00
LEX
D
LOP
Co-movement Between Oil Price and External Debt
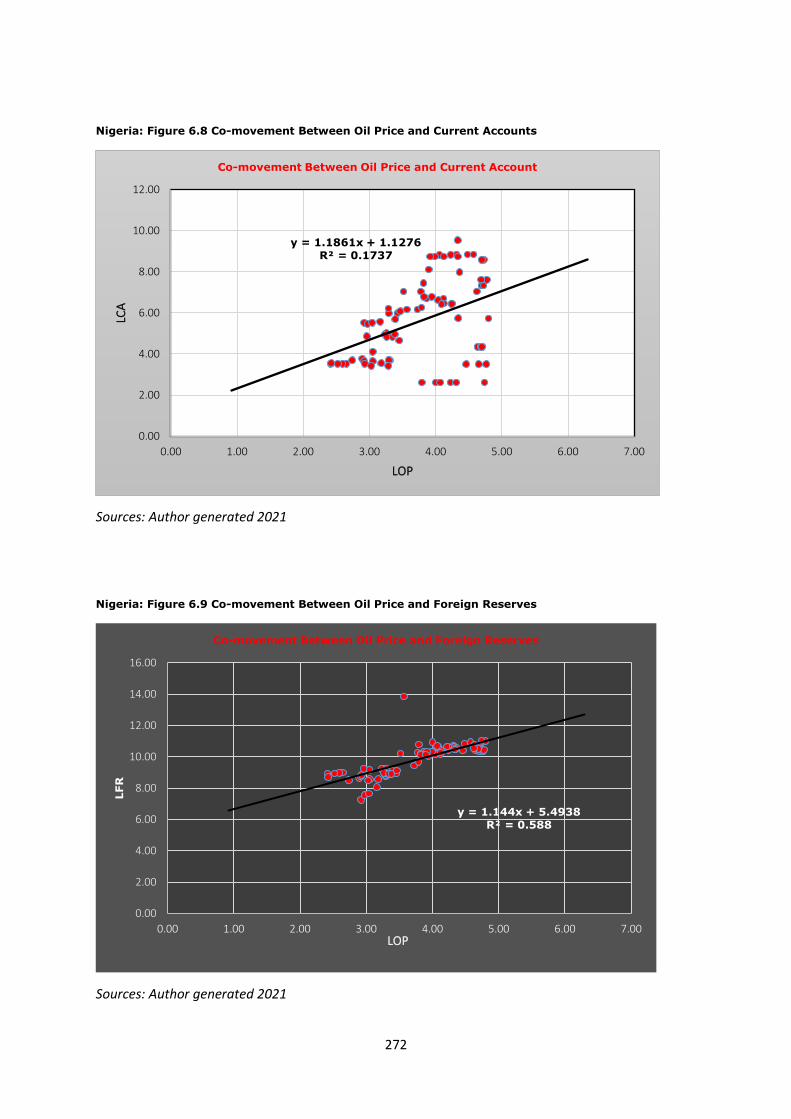
272
Nigeria: Figure 6.8 Co-movement Between Oil Price and Current Accounts
Sources: Author generated 2021
Nigeria: Figure 6.9 Co-movement Between Oil Price and Foreign Reserves
Sources: Author generated 2021
y = 1.1861x + 1.1276R² = 0.1737
0.00
2.00
4.00
6.00
8.00
10.00
12.00
0.00 1.00 2.00 3.00 4.00 5.00 6.00 7.00
LCA
LOP
Co-movement Between Oil Price and Current Account
y = 1.144x + 5.4938R² = 0.588
0.00
2.00
4.00
6.00
8.00
10.00
12.00
14.00
16.00
0.00 1.00 2.00 3.00 4.00 5.00 6.00 7.00
LFR
LOP
Co-movement Between Oil Price and Foreign Reserves
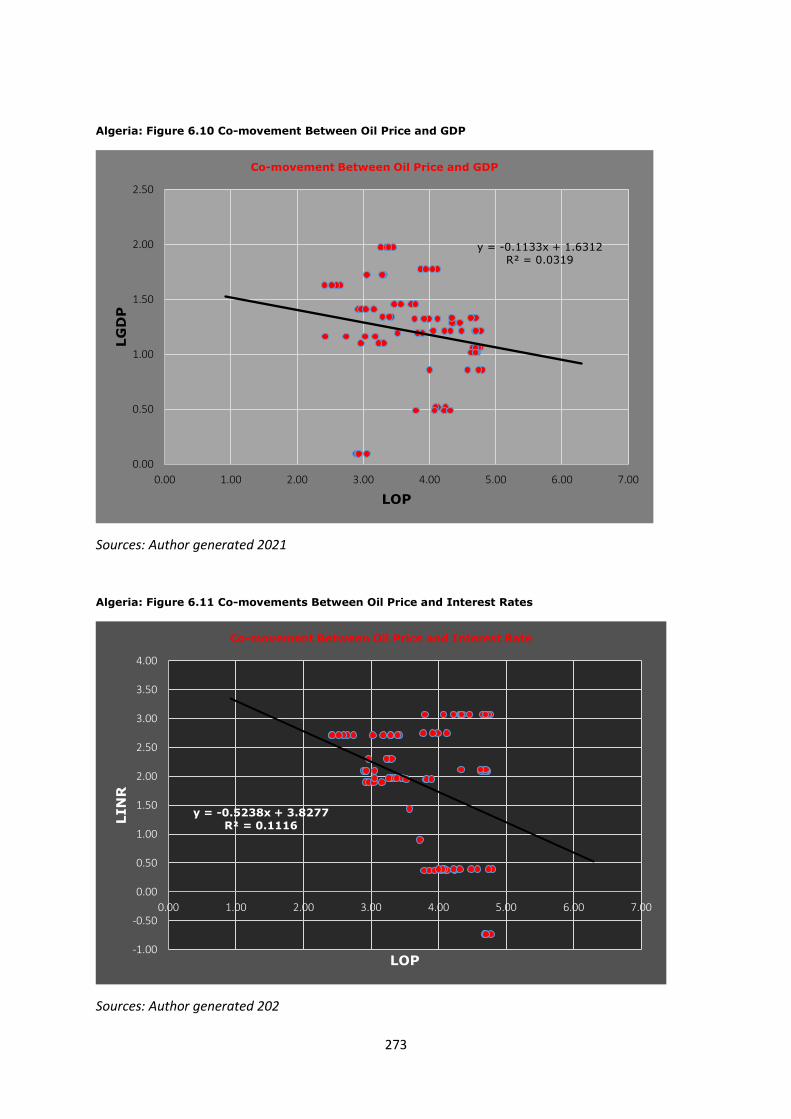
273
Algeria: Figure 6.10 Co-movement Between Oil Price and GDP
Sources: Author generated 2021
Algeria: Figure 6.11 Co-movements Between Oil Price and Interest Rates
Sources: Author generated 202
y = -0.1133x + 1.6312R² = 0.0319
0.00
0.50
1.00
1.50
2.00
2.50
0.00 1.00 2.00 3.00 4.00 5.00 6.00 7.00
LG
DP
LOP
Co-movement Between Oil Price and GDP
y = -0.5238x + 3.8277R² = 0.1116
-1.00
-0.50
0.00
0.50
1.00
1.50
2.00
2.50
3.00
3.50
4.00
0.00 1.00 2.00 3.00 4.00 5.00 6.00 7.00
LIN
R
LOP
Co-movement Between Oil Price and Interest Rate
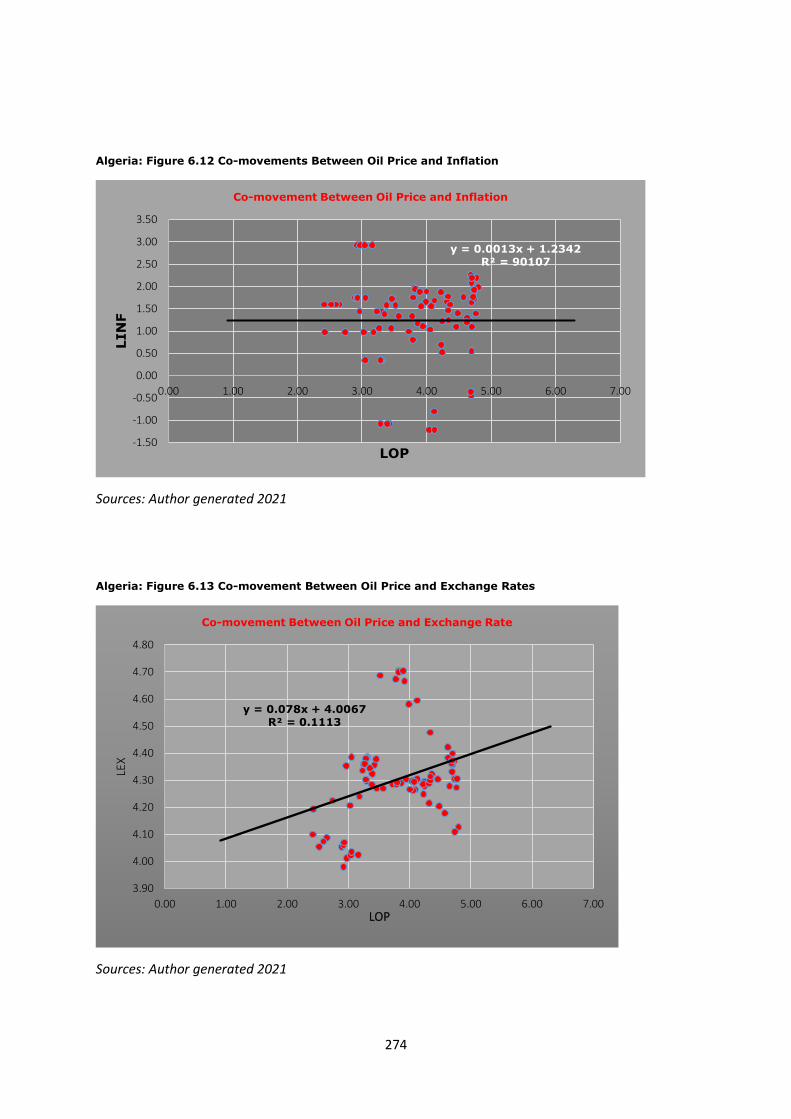
274
Algeria: Figure 6.12 Co-movements Between Oil Price and Inflation
Sources: Author generated 2021
Algeria: Figure 6.13 Co-movement Between Oil Price and Exchange Rates
Sources: Author generated 2021
y = 0.0013x + 1.2342R² = 90107
-1.50
-1.00
-0.50
0.00
0.50
1.00
1.50
2.00
2.50
3.00
3.50
0.00 1.00 2.00 3.00 4.00 5.00 6.00 7.00
LIN
F
LOP
Co-movement Between Oil Price and Inflation
y = 0.078x + 4.0067R² = 0.1113
3.90
4.00
4.10
4.20
4.30
4.40
4.50
4.60
4.70
4.80
0.00 1.00 2.00 3.00 4.00 5.00 6.00 7.00
LEX
LOP
Co-movement Between Oil Price and Exchange Rate
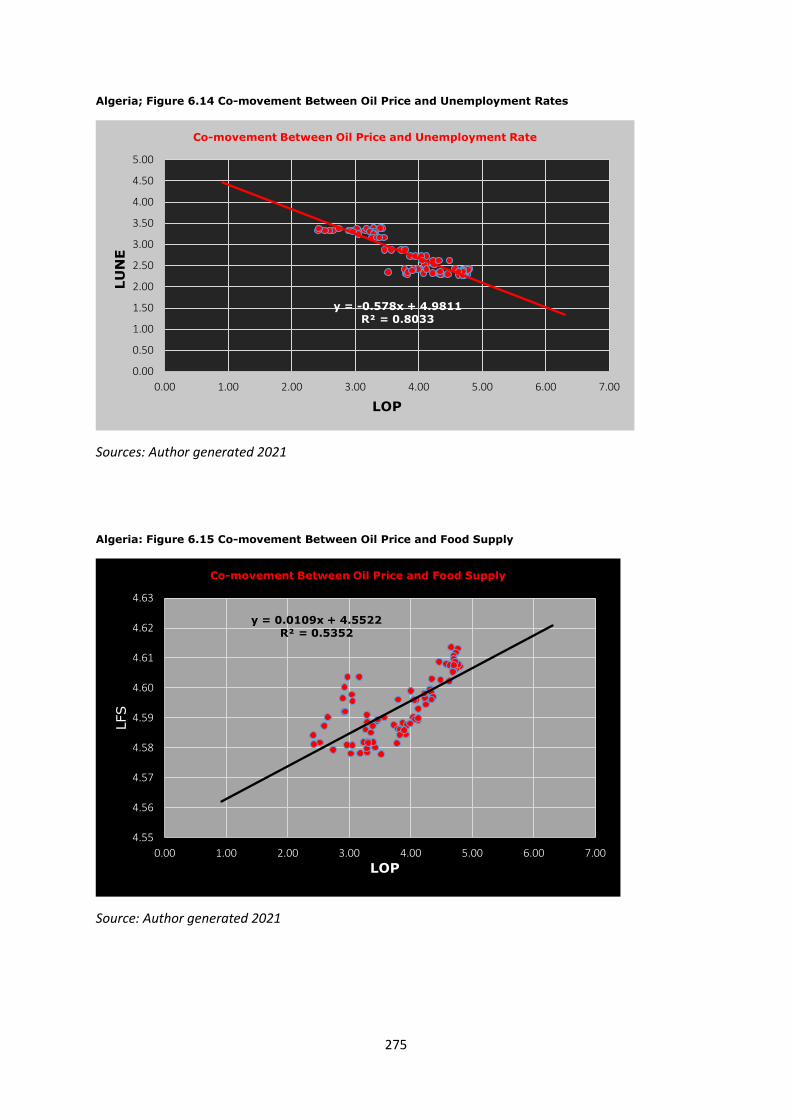
275
Algeria; Figure 6.14 Co-movement Between Oil Price and Unemployment Rates
Sources: Author generated 2021
Algeria: Figure 6.15 Co-movement Between Oil Price and Food Supply
Source: Author generated 2021
y = -0.578x + 4.9811R² = 0.8033
0.00
0.50
1.00
1.50
2.00
2.50
3.00
3.50
4.00
4.50
5.00
0.00 1.00 2.00 3.00 4.00 5.00 6.00 7.00
LU
NE
LOP
Co-movement Between Oil Price and Unemployment Rate
y = 0.0109x + 4.5522R² = 0.5352
4.55
4.56
4.57
4.58
4.59
4.60
4.61
4.62
4.63
0.00 1.00 2.00 3.00 4.00 5.00 6.00 7.00
LFS
LOP
Co-movement Between Oil Price and Food Supply
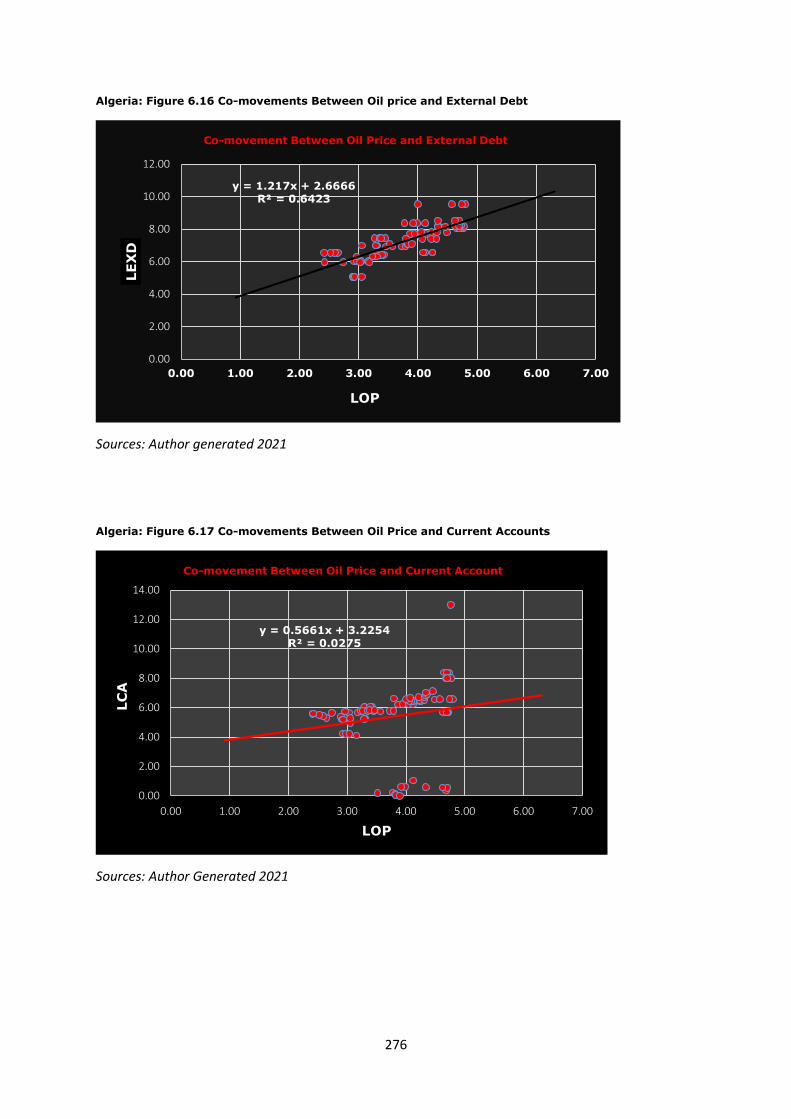
276
Algeria: Figure 6.16 Co-movements Between Oil price and External Debt
Sources: Author generated 2021
Algeria: Figure 6.17 Co-movements Between Oil Price and Current Accounts
Sources: Author Generated 2021
y = 1.217x + 2.6666R² = 0.6423
0.00
2.00
4.00
6.00
8.00
10.00
12.00
0.00 1.00 2.00 3.00 4.00 5.00 6.00 7.00
LE
XD
LOP
Co-movement Between Oil Price and External Debt
y = 0.5661x + 3.2254R² = 0.0275
0.00
2.00
4.00
6.00
8.00
10.00
12.00
14.00
0.00 1.00 2.00 3.00 4.00 5.00 6.00 7.00
LC
A
LOP
Co-movement Between Oil Price and Current Account

277
Algeria: Figure 6.18 Co-movement Between Oil Price and Foreign Reserves
Sources: Author generated 2021
EGYPT: Figure 6.19 Co-movement Between Oil Price and GDP
Sources: Author generated 2021
y = 1.6544x + 2.9861R² = 0.7146
0.00
2.00
4.00
6.00
8.00
10.00
12.00
14.00
16.00
0.00 1.00 2.00 3.00 4.00 5.00 6.00 7.00
LFR
LOP
Co-movement Between Oil Price and Foreign Reseves
y = -0.1501x + 1.9807R² = 0.0672
0.00
0.50
1.00
1.50
2.00
2.50
0.00 1.00 2.00 3.00 4.00 5.00 6.00 7.00
LG
DP
LGDP
Co-movement Between Oil Price and GDP
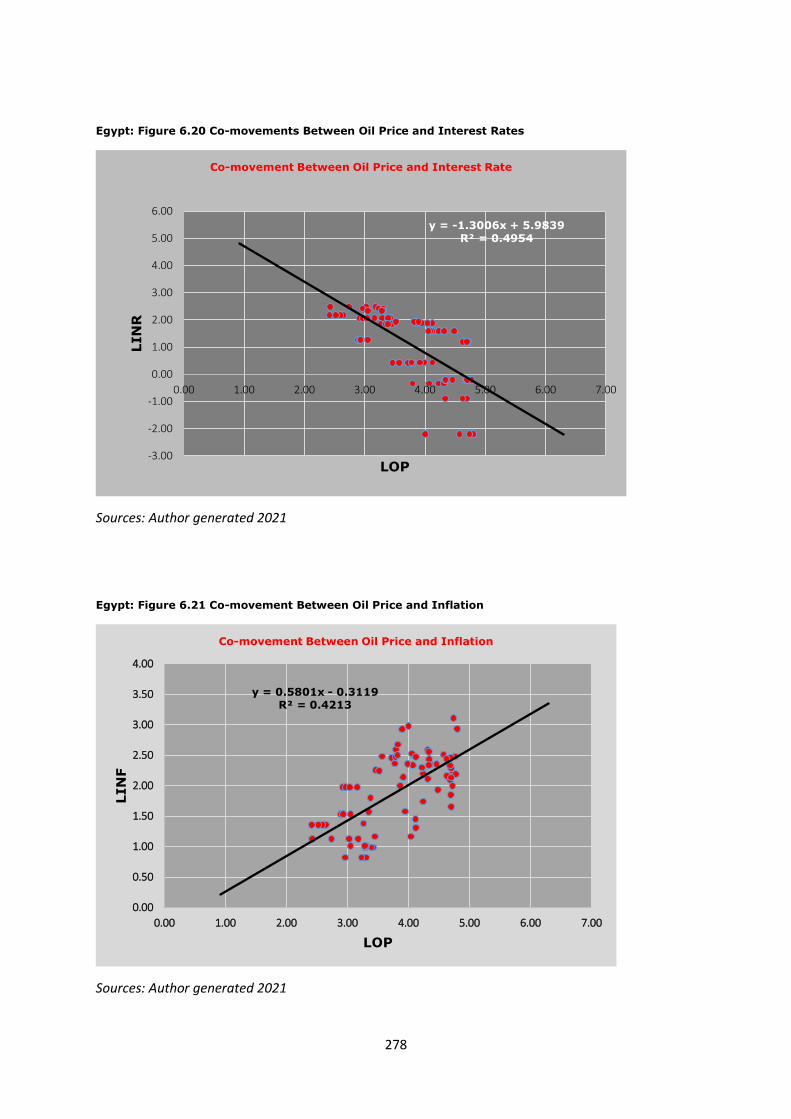
278
Egypt: Figure 6.20 Co-movements Between Oil Price and Interest Rates
Sources: Author generated 2021
Egypt: Figure 6.21 Co-movement Between Oil Price and Inflation
Sources: Author generated 2021
y = -1.3006x + 5.9839R² = 0.4954
-3.00
-2.00
-1.00
0.00
1.00
2.00
3.00
4.00
5.00
6.00
0.00 1.00 2.00 3.00 4.00 5.00 6.00 7.00
LIN
R
LOP
Co-movement Between Oil Price and Interest Rate
y = 0.5801x - 0.3119R² = 0.4213
0.00
0.50
1.00
1.50
2.00
2.50
3.00
3.50
4.00
0.00 1.00 2.00 3.00 4.00 5.00 6.00 7.00
LIN
F
LOP
Co-movement Between Oil Price and Inflation

279
Egypt: Figure 6.22 Co-movements Between Oil Price and Exchange Rates
Sources: Author generated 2021
Egypt: Figure 6.23 Co-movement Between Oil Price and Unemployment Rates
Sources: Author generated 2021
y = 0.2981x + 0.5326R² = 0.434
0.00
0.50
1.00
1.50
2.00
2.50
3.00
3.50
0.00 1.00 2.00 3.00 4.00 5.00 6.00 7.00
LE
X
LOP
Co-movement Between Oil Price and Exchange Rate
y = 0.1754x + 1.633R² = 0.1802
0.00
0.50
1.00
1.50
2.00
2.50
3.00
3.50
4.00
0.00 1.00 2.00 3.00 4.00 5.00 6.00 7.00
LU
NE
LOP
Co-movement Between Oil Price and Unemployment
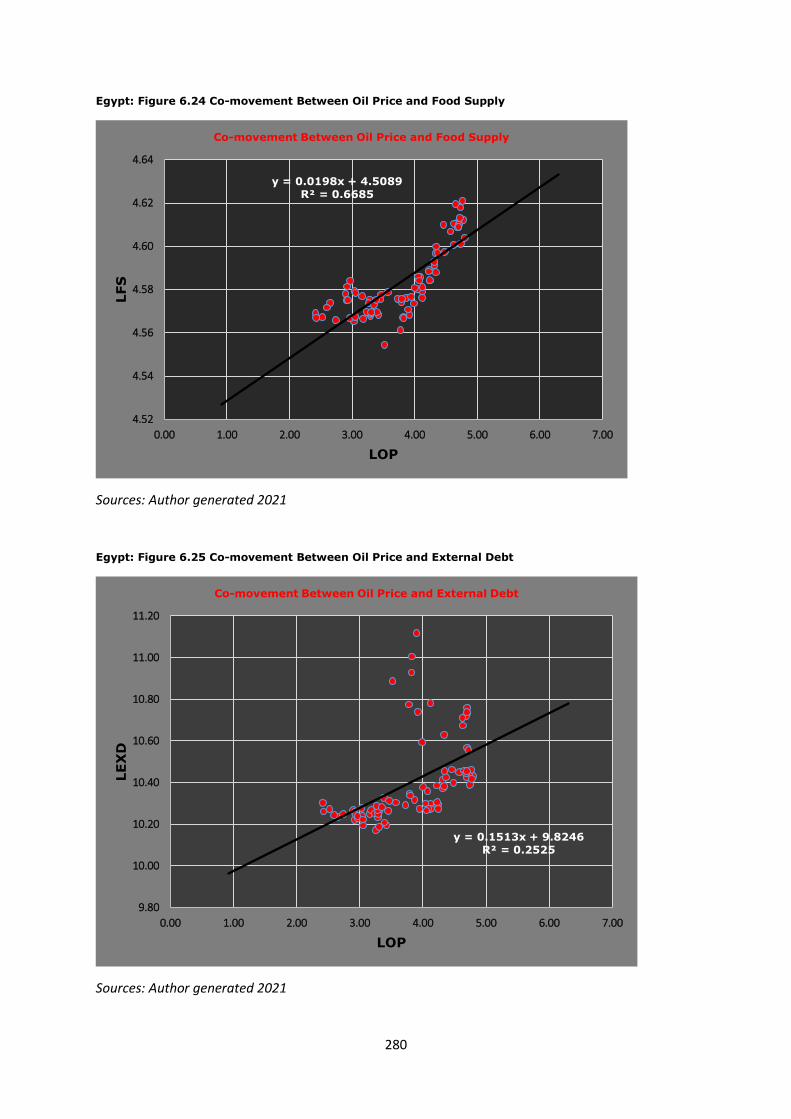
280
Egypt: Figure 6.24 Co-movement Between Oil Price and Food Supply
Sources: Author generated 2021
Egypt: Figure 6.25 Co-movement Between Oil Price and External Debt
Sources: Author generated 2021
y = 0.0198x + 4.5089R² = 0.6685
4.52
4.54
4.56
4.58
4.60
4.62
4.64
0.00 1.00 2.00 3.00 4.00 5.00 6.00 7.00
LFS
LOP
Co-movement Between Oil Price and Food Supply
y = 0.1513x + 9.8246R² = 0.2525
9.80
10.00
10.20
10.40
10.60
10.80
11.00
11.20
0.00 1.00 2.00 3.00 4.00 5.00 6.00 7.00
LE
XD
LOP
Co-movement Between Oil Price and External Debt
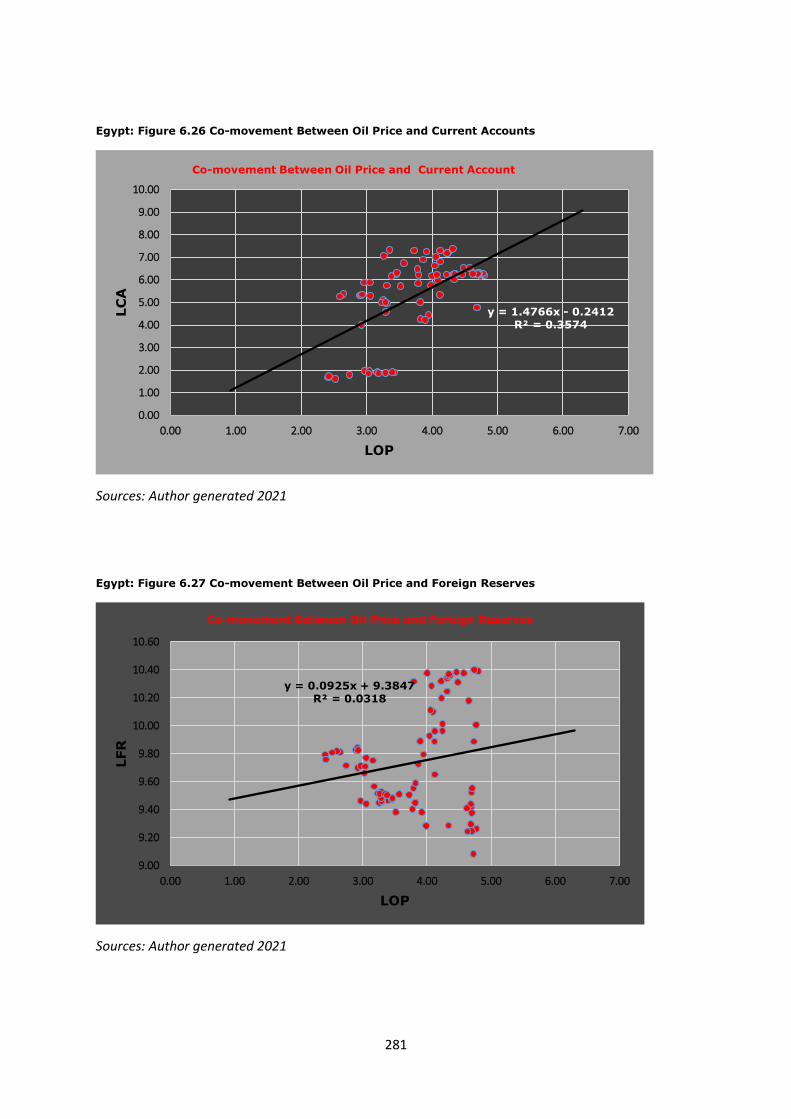
281
Egypt: Figure 6.26 Co-movement Between Oil Price and Current Accounts
Sources: Author generated 2021
Egypt: Figure 6.27 Co-movement Between Oil Price and Foreign Reserves
Sources: Author generated 2021
y = 1.4766x - 0.2412R² = 0.3574
0.00
1.00
2.00
3.00
4.00
5.00
6.00
7.00
8.00
9.00
10.00
0.00 1.00 2.00 3.00 4.00 5.00 6.00 7.00
LC
A
LOP
Co-movement Between Oil Price and Current Account
y = 0.0925x + 9.3847R² = 0.0318
9.00
9.20
9.40
9.60
9.80
10.00
10.20
10.40
10.60
0.00 1.00 2.00 3.00 4.00 5.00 6.00 7.00
LFR
LOP
Co-movement Between Oil Price and Foreign Reserves

282
Kenya: Figure 6.28 Co-movements Between Oil Price and GDP
Sources: Author generated 2021
Kenya: Figure 6.29 Co-movement Between Oil Price and Interest Rates
Sources: Author generated 2021
y = 0.4742x - 0.6949R² = 0.104
-2.00
-1.50
-1.00
-0.50
0.00
0.50
1.00
1.50
2.00
2.50
0.00 1.00 2.00 3.00 4.00 5.00 6.00 7.00
LG
DP
LOP
Co-movment Between Oil Price and GDP
y = -0.4251x + 3.7624R² = 0.2457
0.00
0.50
1.00
1.50
2.00
2.50
3.00
3.50
4.00
0.00 1.00 2.00 3.00 4.00 5.00 6.00 7.00
LIN
R
LOP
Co-movement Between Oil Price and Interest Rate
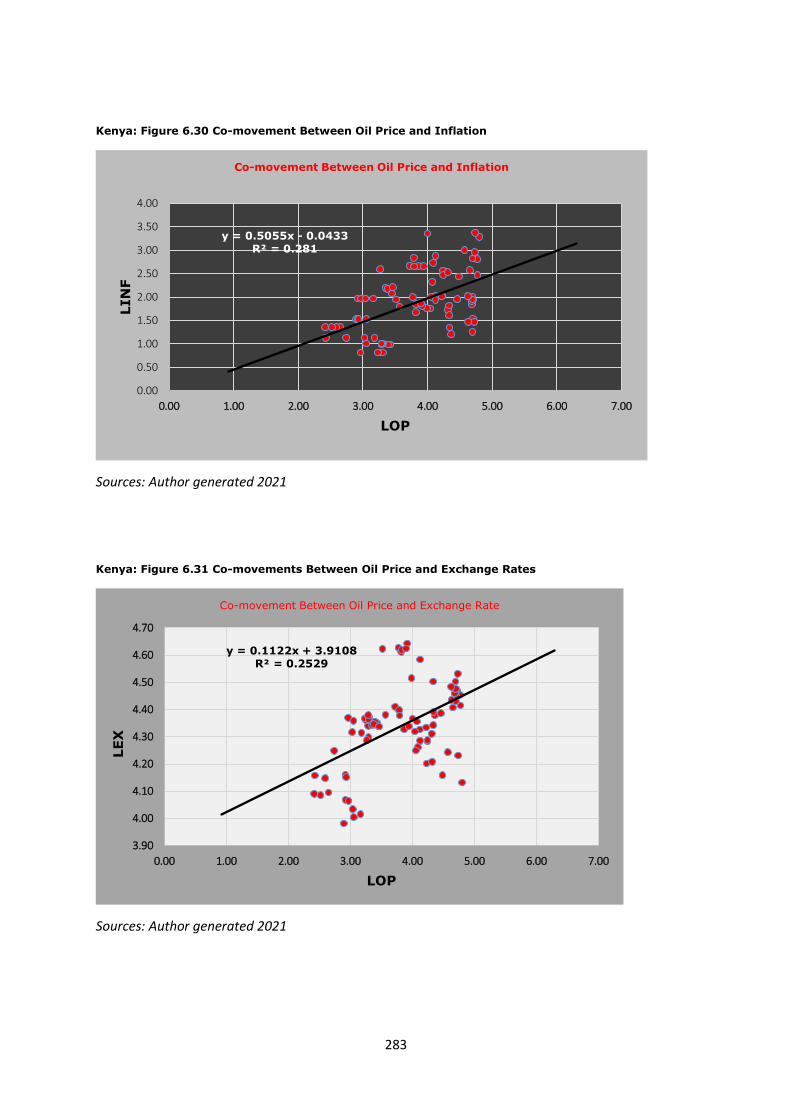
283
Kenya: Figure 6.30 Co-movement Between Oil Price and Inflation
Sources: Author generated 2021
Kenya: Figure 6.31 Co-movements Between Oil Price and Exchange Rates
Sources: Author generated 2021
y = 0.5055x - 0.0433R² = 0.281
0.00
0.50
1.00
1.50
2.00
2.50
3.00
3.50
4.00
0.00 1.00 2.00 3.00 4.00 5.00 6.00 7.00
LIN
F
LOP
Co-movement Between Oil Price and Inflation
y = 0.1122x + 3.9108R² = 0.2529
3.90
4.00
4.10
4.20
4.30
4.40
4.50
4.60
4.70
0.00 1.00 2.00 3.00 4.00 5.00 6.00 7.00
LE
X
LOP
Co-movement Between Oil Price and Exchange Rate
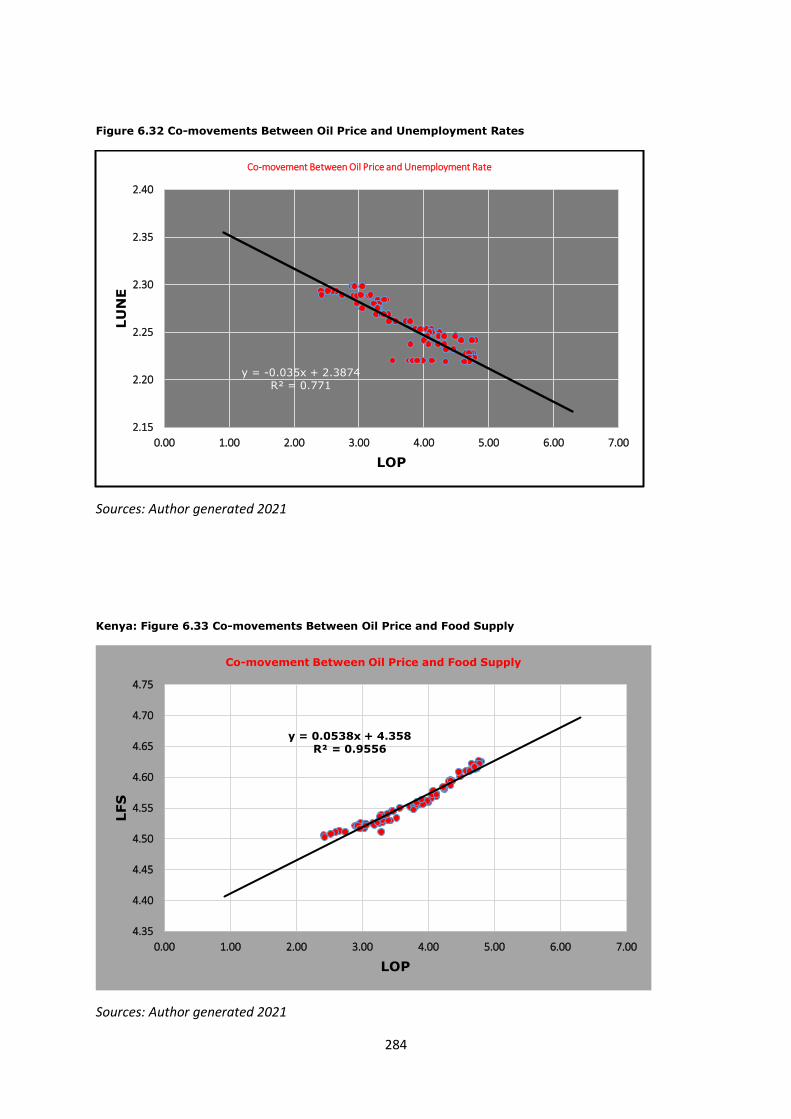
284
Figure 6.32 Co-movements Between Oil Price and Unemployment Rates
Sources: Author generated 2021
Kenya: Figure 6.33 Co-movements Between Oil Price and Food Supply
Sources: Author generated 2021
y = -0.035x + 2.3874R² = 0.771
2.15
2.20
2.25
2.30
2.35
2.40
0.00 1.00 2.00 3.00 4.00 5.00 6.00 7.00
LU
NE
LOP
Co-movement Between Oil Price and Unemployment Rate
y = 0.0538x + 4.358R² = 0.9556
4.35
4.40
4.45
4.50
4.55
4.60
4.65
4.70
4.75
0.00 1.00 2.00 3.00 4.00 5.00 6.00 7.00
LFS
LOP
Co-movement Between Oil Price and Food Supply
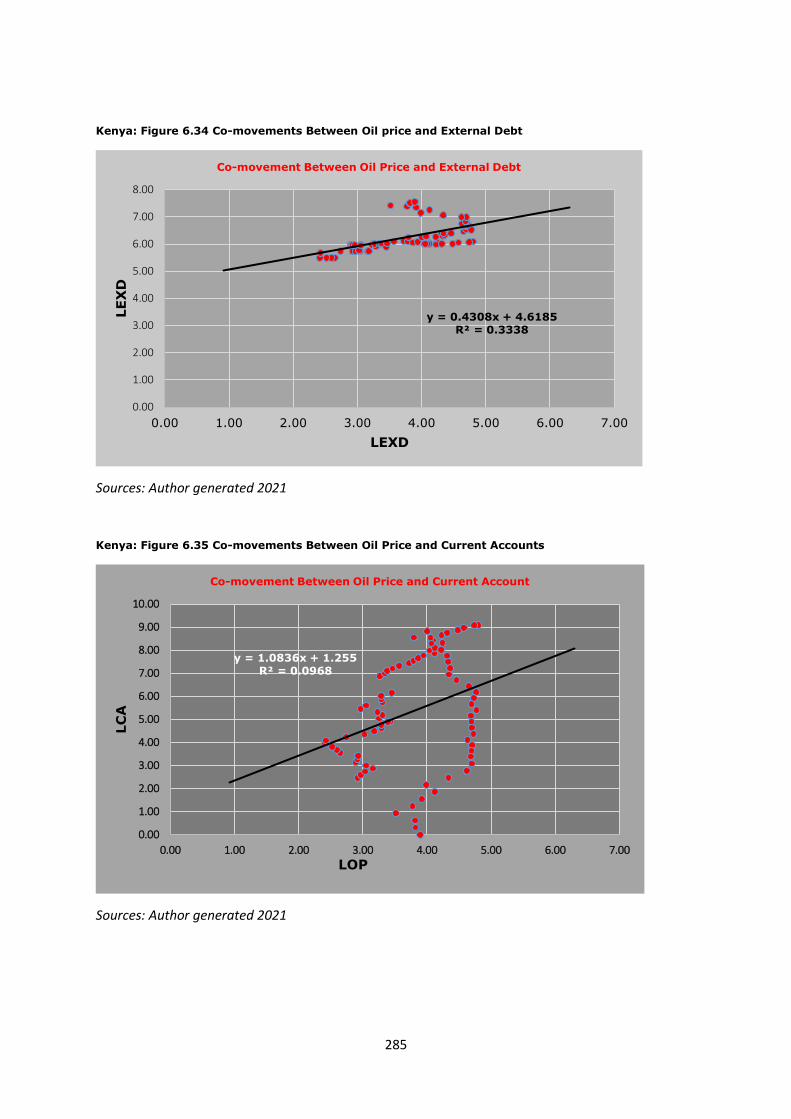
285
Kenya: Figure 6.34 Co-movements Between Oil price and External Debt
Sources: Author generated 2021
Kenya: Figure 6.35 Co-movements Between Oil Price and Current Accounts
Sources: Author generated 2021
y = 0.4308x + 4.6185R² = 0.3338
0.00
1.00
2.00
3.00
4.00
5.00
6.00
7.00
8.00
0.00 1.00 2.00 3.00 4.00 5.00 6.00 7.00
LE
XD
LEXD
Co-movement Between Oil Price and External Debt
y = 1.0836x + 1.255R² = 0.0968
0.00
1.00
2.00
3.00
4.00
5.00
6.00
7.00
8.00
9.00
10.00
0.00 1.00 2.00 3.00 4.00 5.00 6.00 7.00
LC
A
LOP
Co-movement Between Oil Price and Current Account
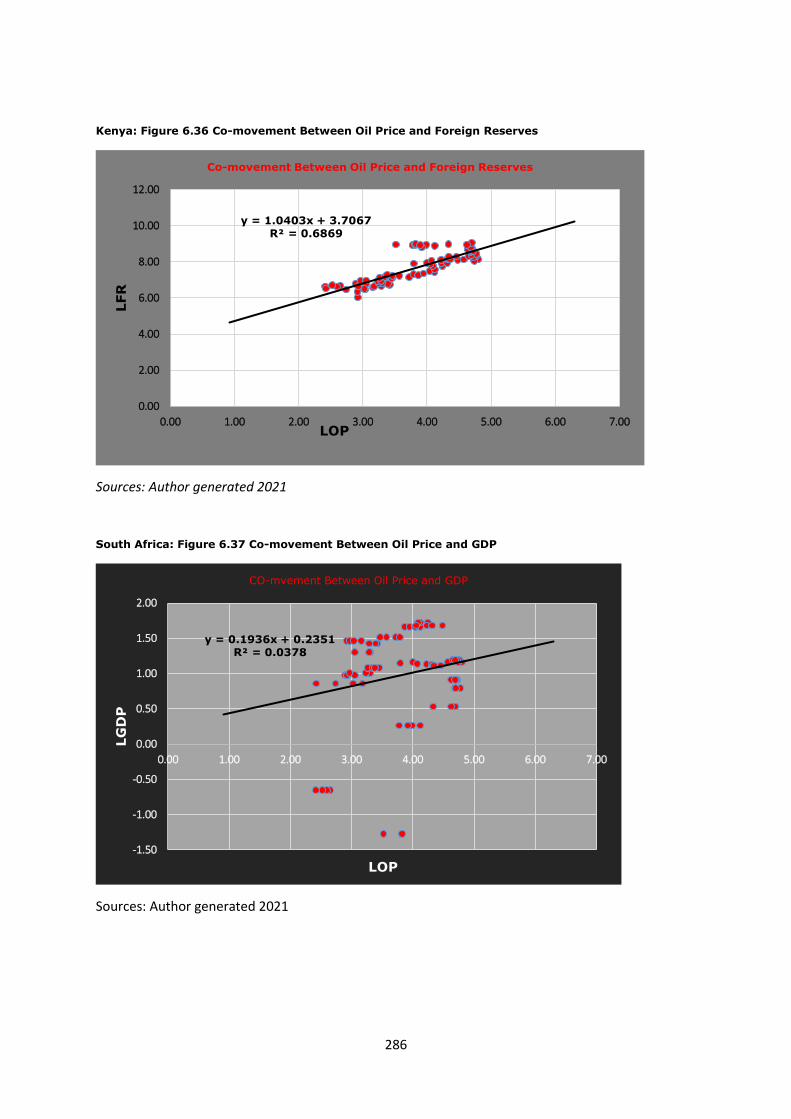
286
Kenya: Figure 6.36 Co-movement Between Oil Price and Foreign Reserves
Sources: Author generated 2021
South Africa: Figure 6.37 Co-movement Between Oil Price and GDP
Sources: Author generated 2021
y = 1.0403x + 3.7067R² = 0.6869
0.00
2.00
4.00
6.00
8.00
10.00
12.00
0.00 1.00 2.00 3.00 4.00 5.00 6.00 7.00
LFR
LOP
Co-movement Between Oil Price and Foreign Reserves
y = 0.1936x + 0.2351R² = 0.0378
-1.50
-1.00
-0.50
0.00
0.50
1.00
1.50
2.00
0.00 1.00 2.00 3.00 4.00 5.00 6.00 7.00
LG
DP
LOP
CO-mvement Between Oil Price and GDP
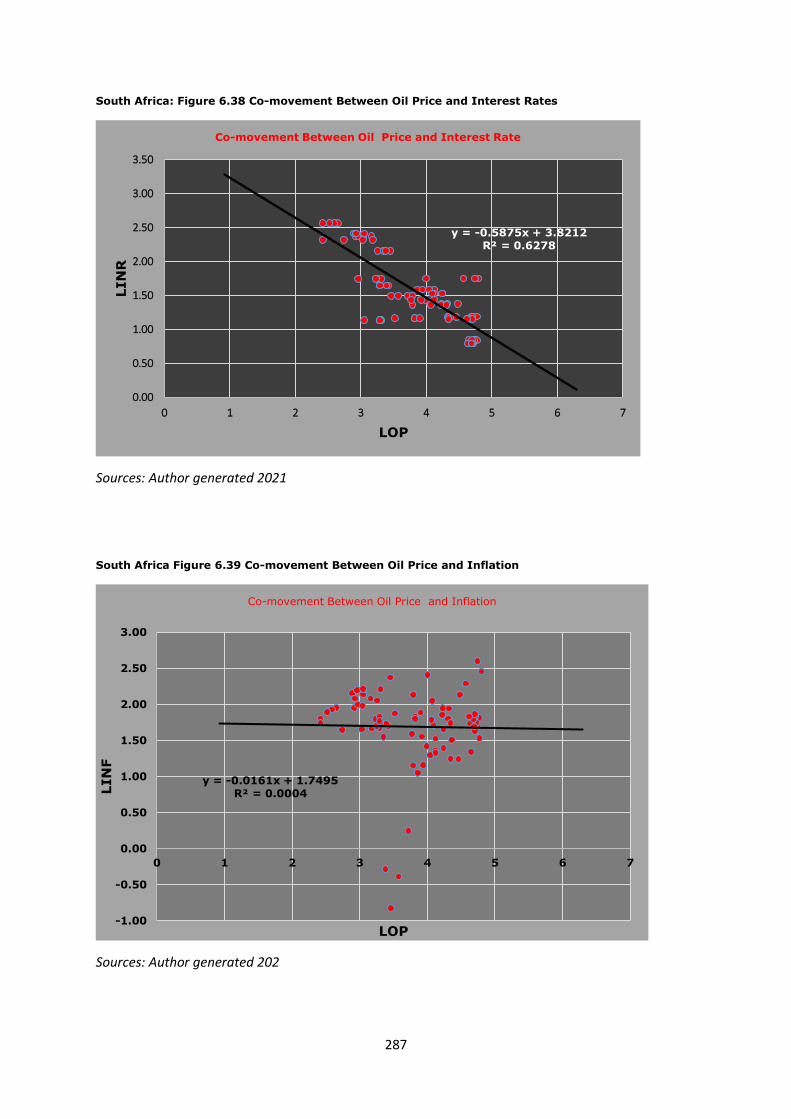
287
South Africa: Figure 6.38 Co-movement Between Oil Price and Interest Rates
Sources: Author generated 2021
South Africa Figure 6.39 Co-movement Between Oil Price and Inflation
Sources: Author generated 202
y = -0.5875x + 3.8212R² = 0.6278
0.00
0.50
1.00
1.50
2.00
2.50
3.00
3.50
0 1 2 3 4 5 6 7
LIN
R
LOP
Co-movement Between Oil Price and Interest Rate
y = -0.0161x + 1.7495R² = 0.0004
-1.00
-0.50
0.00
0.50
1.00
1.50
2.00
2.50
3.00
0 1 2 3 4 5 6 7
LIN
F
LOP
Co-movement Between Oil Price and Inflation
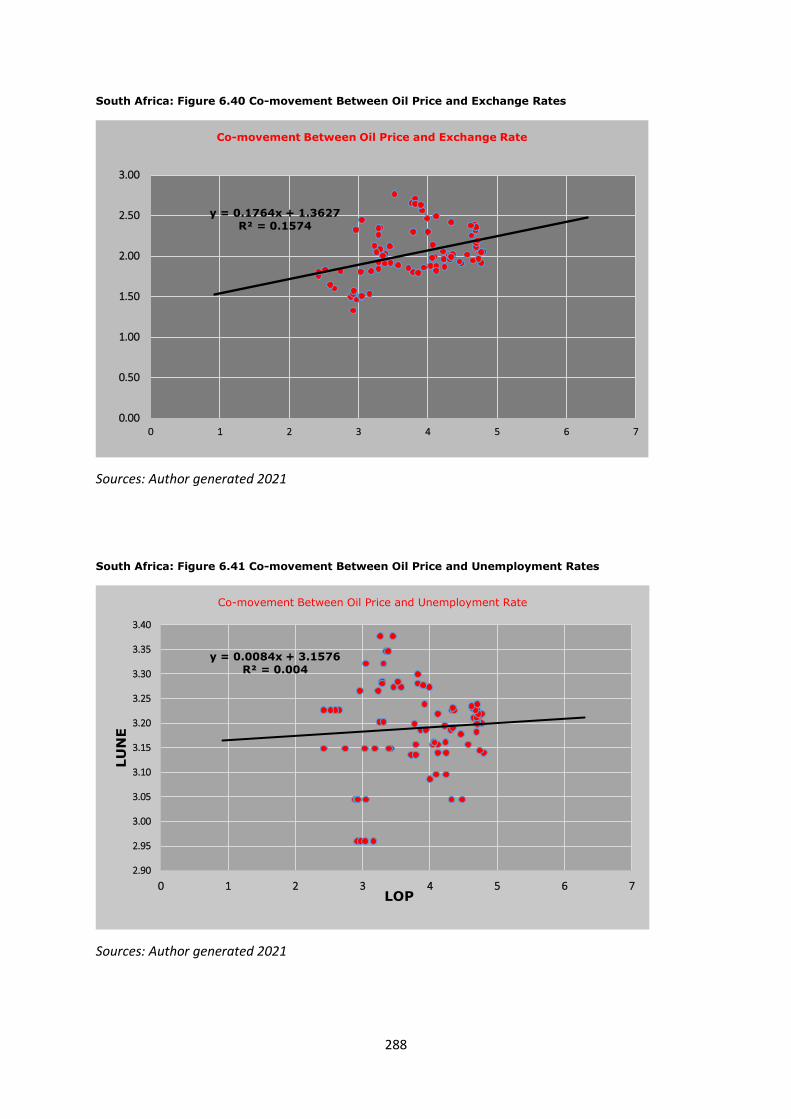
288
South Africa: Figure 6.40 Co-movement Between Oil Price and Exchange Rates
Sources: Author generated 2021
South Africa: Figure 6.41 Co-movement Between Oil Price and Unemployment Rates
Sources: Author generated 2021
y = 0.1764x + 1.3627R² = 0.1574
0.00
0.50
1.00
1.50
2.00
2.50
3.00
0 1 2 3 4 5 6 7
Co-movement Between Oil Price and Exchange Rate
y = 0.0084x + 3.1576R² = 0.004
2.90
2.95
3.00
3.05
3.10
3.15
3.20
3.25
3.30
3.35
3.40
0 1 2 3 4 5 6 7
LU
NE
LOP
Co-movement Between Oil Price and Unemployment Rate
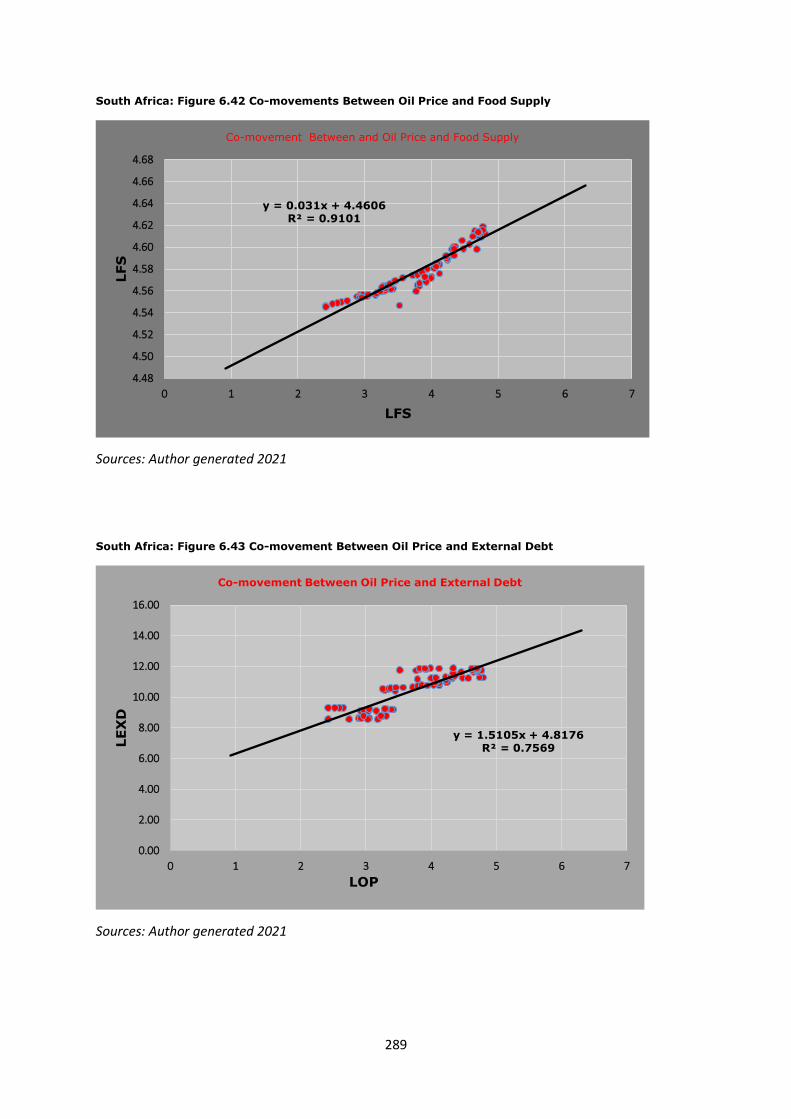
289
South Africa: Figure 6.42 Co-movements Between Oil Price and Food Supply
Sources: Author generated 2021
South Africa: Figure 6.43 Co-movement Between Oil Price and External Debt
Sources: Author generated 2021
y = 0.031x + 4.4606R² = 0.9101
4.48
4.50
4.52
4.54
4.56
4.58
4.60
4.62
4.64
4.66
4.68
0 1 2 3 4 5 6 7
LFS
LFS
Co-movement Between and Oil Price and Food Supply
y = 1.5105x + 4.8176R² = 0.7569
0.00
2.00
4.00
6.00
8.00
10.00
12.00
14.00
16.00
0 1 2 3 4 5 6 7
LE
XD
LOP
Co-movement Between Oil Price and External Debt
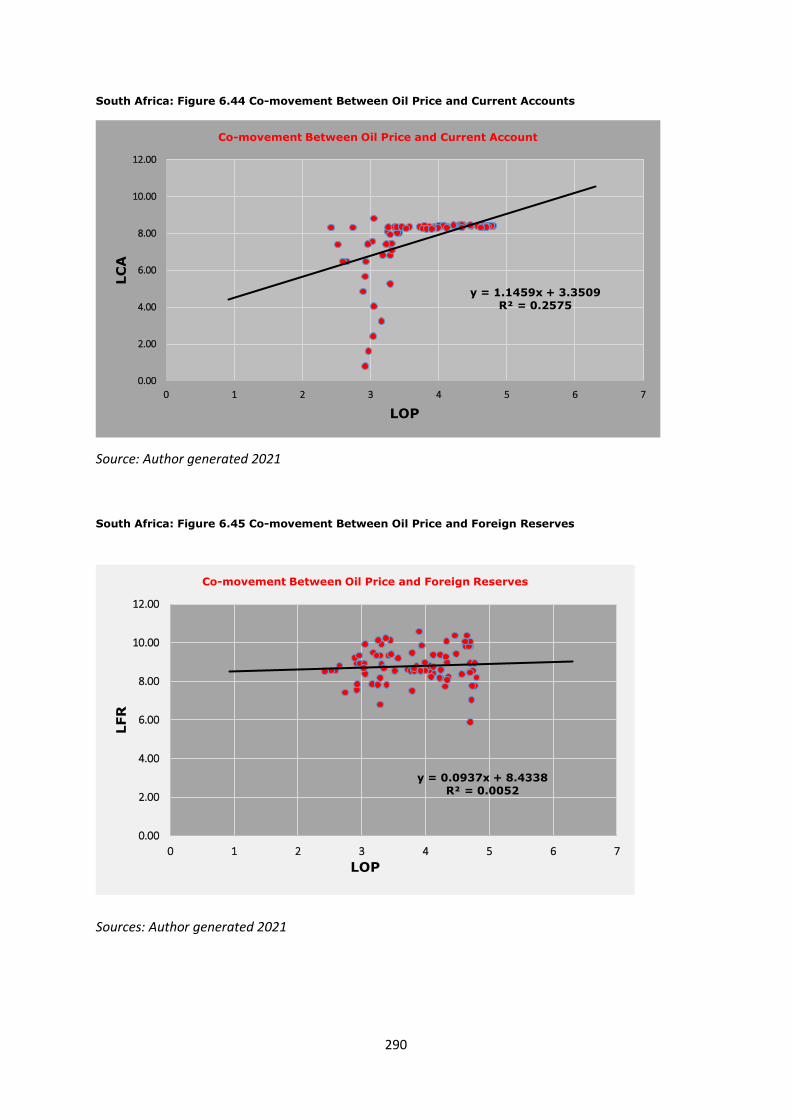
290
South Africa: Figure 6.44 Co-movement Between Oil Price and Current Accounts
Source: Author generated 2021
Sources: Author generated 2021
y = 1.1459x + 3.3509R² = 0.2575
0.00
2.00
4.00
6.00
8.00
10.00
12.00
0 1 2 3 4 5 6 7
LC
A
LOP
Co-movement Between Oil Price and Current Account
y = 0.0937x + 8.4338R² = 0.0052
0.00
2.00
4.00
6.00
8.00
10.00
12.00
0 1 2 3 4 5 6 7
LFR
LOP
Co-movement Between Oil Price and Foreign Reserves
South Africa: Figure 6.45 Co-movement Between Oil Price and Foreign Reserves
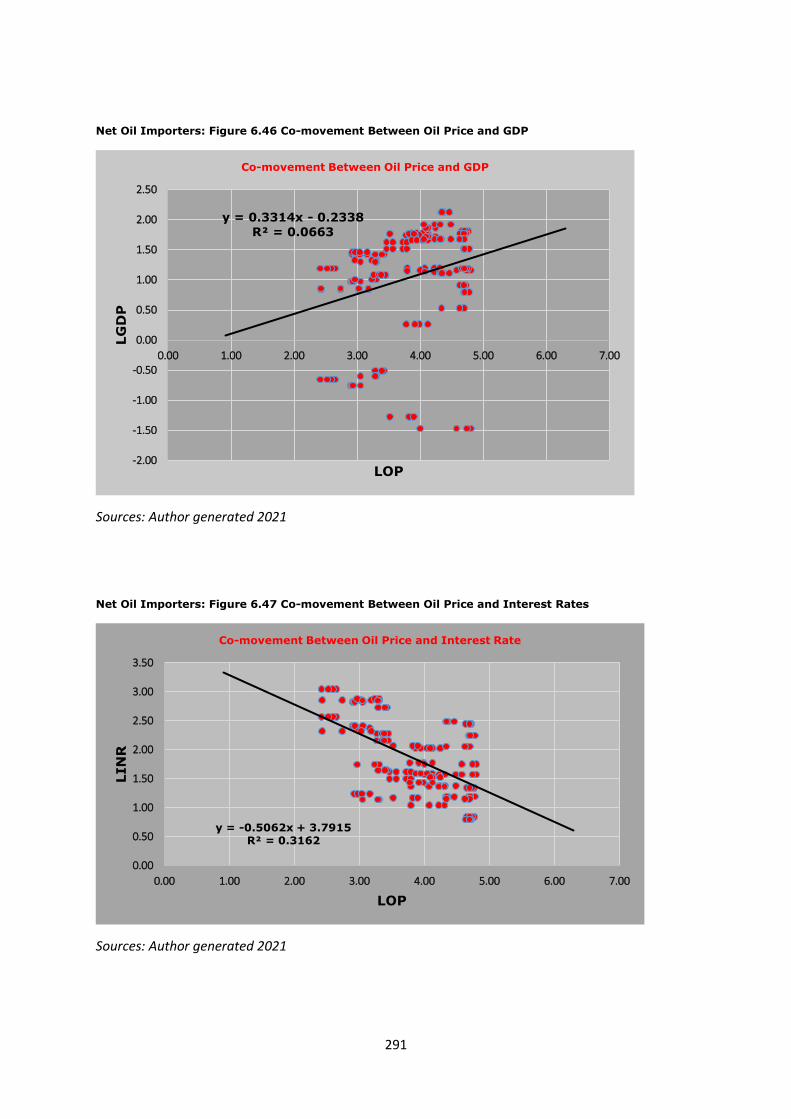
291
Net Oil Importers: Figure 6.46 Co-movement Between Oil Price and GDP
Sources: Author generated 2021
Net Oil Importers: Figure 6.47 Co-movement Between Oil Price and Interest Rates
Sources: Author generated 2021
y = 0.3314x - 0.2338
R² = 0.0663
-2.00
-1.50
-1.00
-0.50
0.00
0.50
1.00
1.50
2.00
2.50
0.00 1.00 2.00 3.00 4.00 5.00 6.00 7.00
LG
DP
LOP
Co-movement Between Oil Price and GDP
y = -0.5062x + 3.7915R² = 0.3162
0.00
0.50
1.00
1.50
2.00
2.50
3.00
3.50
0.00 1.00 2.00 3.00 4.00 5.00 6.00 7.00
LIN
R
LOP
Co-movement Between Oil Price and Interest Rate
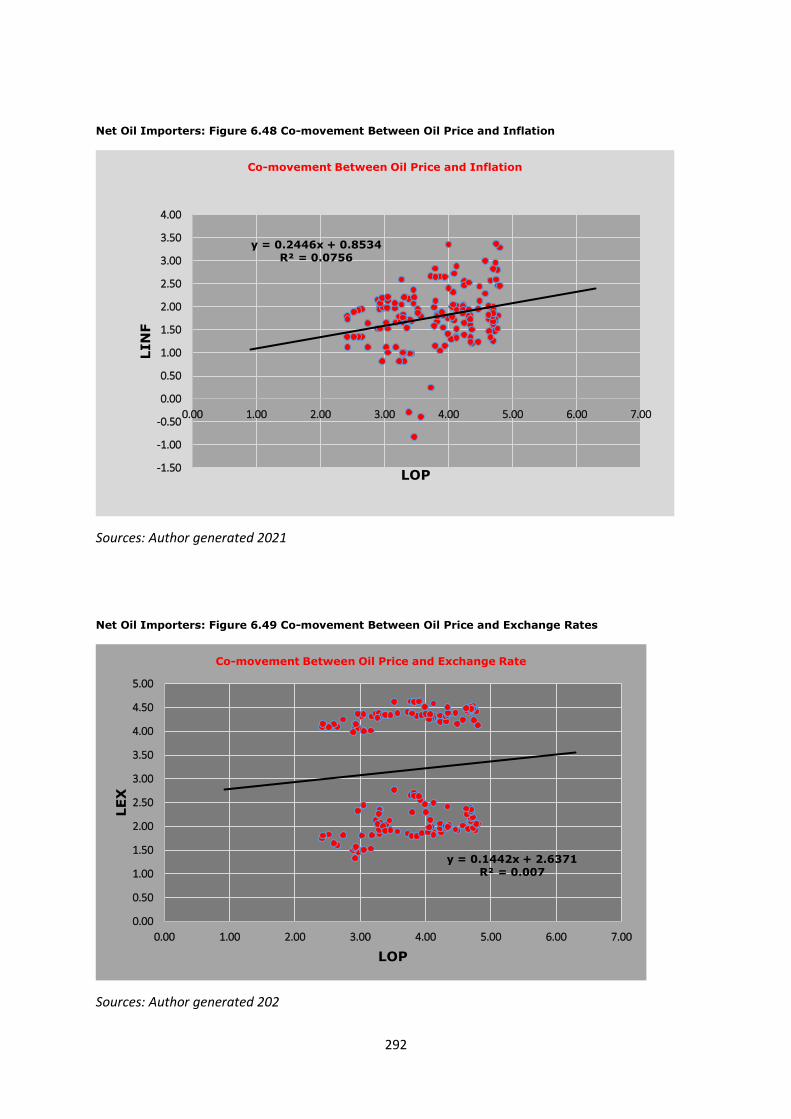
292
Net Oil Importers: Figure 6.48 Co-movement Between Oil Price and Inflation
Sources: Author generated 2021
Net Oil Importers: Figure 6.49 Co-movement Between Oil Price and Exchange Rates
Sources: Author generated 202
y = 0.2446x + 0.8534R² = 0.0756
-1.50
-1.00
-0.50
0.00
0.50
1.00
1.50
2.00
2.50
3.00
3.50
4.00
0.00 1.00 2.00 3.00 4.00 5.00 6.00 7.00
LIN
F
LOP
Co-movement Between Oil Price and Inflation
y = 0.1442x + 2.6371R² = 0.007
0.00
0.50
1.00
1.50
2.00
2.50
3.00
3.50
4.00
4.50
5.00
0.00 1.00 2.00 3.00 4.00 5.00 6.00 7.00
LE
X
LOP
Co-movement Between Oil Price and Exchange Rate

293
Net Oil Importers: Figure 6.50 Co-movement Between Oil Price and Unemployment Rates
Sources: Author generated 2021
Net Oil Importers: Figure 6.51 Co-movements Between Oil Price and Food Supply
Sources: Author generated 2021
y = -0.0133x + 2.7726R² = 0.0004
0.00
0.50
1.00
1.50
2.00
2.50
3.00
3.50
4.00
4.50
5.00
0.00 1.00 2.00 3.00 4.00 5.00 6.00 7.00
LU
NE
LOP
Co-movement Between Oil Price and Unemployment Rate
y = 0.213x + 5.7877R² = 0.0044
0.00
2.00
4.00
6.00
8.00
10.00
12.00
0.00 1.00 2.00 3.00 4.00 5.00 6.00 7.00
LFS
LOP
Co-movement Between Oil Price and Food Supply

294
Net Oil Importers: Figure 6.52 Co-movements Between Oil Price and External Debts
Sources: Author generated 2021
Net Oil Importers: Figure 6.53 Co-movements Between Oil Price and Current Accounts
Sources: Author generated 2021
y = 0.9704x + 4.7188R² = 0.0801
0.00
2.00
4.00
6.00
8.00
10.00
12.00
14.00
0.00 1.00 2.00 3.00 4.00 5.00 6.00 7.00
LE
XD
LOP
Co-movement Between Oil Price and External Debt
y = 1.1214x + 2.4629R² = 0.1196
0.00
2.00
4.00
6.00
8.00
10.00
12.00
0.00 1.00 2.00 3.00 4.00 5.00 6.00 7.00
LC
A
LOP
Co-movement Between Oil Price and Current Account
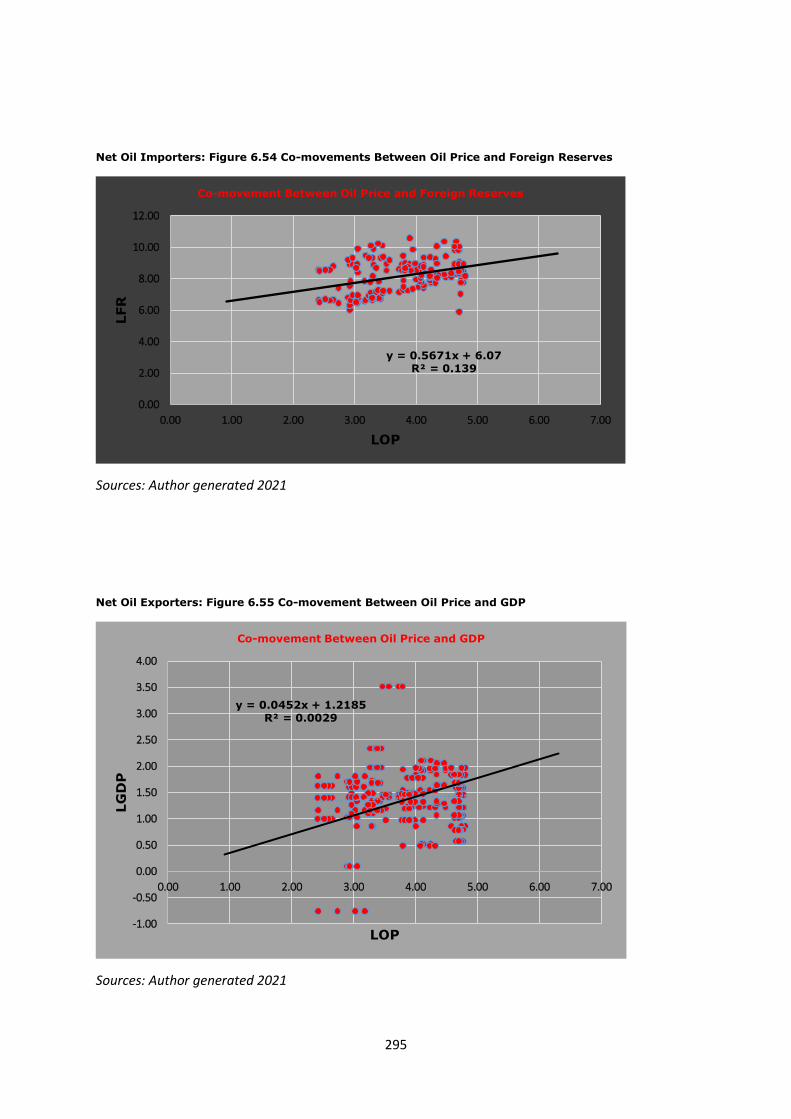
295
Net Oil Importers: Figure 6.54 Co-movements Between Oil Price and Foreign Reserves
Sources: Author generated 2021
Net Oil Exporters: Figure 6.55 Co-movement Between Oil Price and GDP
Sources: Author generated 2021
y = 0.5671x + 6.07R² = 0.139
0.00
2.00
4.00
6.00
8.00
10.00
12.00
0.00 1.00 2.00 3.00 4.00 5.00 6.00 7.00
LFR
LOP
Co-movement Between Oil Price and Foreign Reserves
y = 0.0452x + 1.2185R² = 0.0029
-1.00
-0.50
0.00
0.50
1.00
1.50
2.00
2.50
3.00
3.50
4.00
0.00 1.00 2.00 3.00 4.00 5.00 6.00 7.00
LG
DP
LOP
Co-movement Between Oil Price and GDP
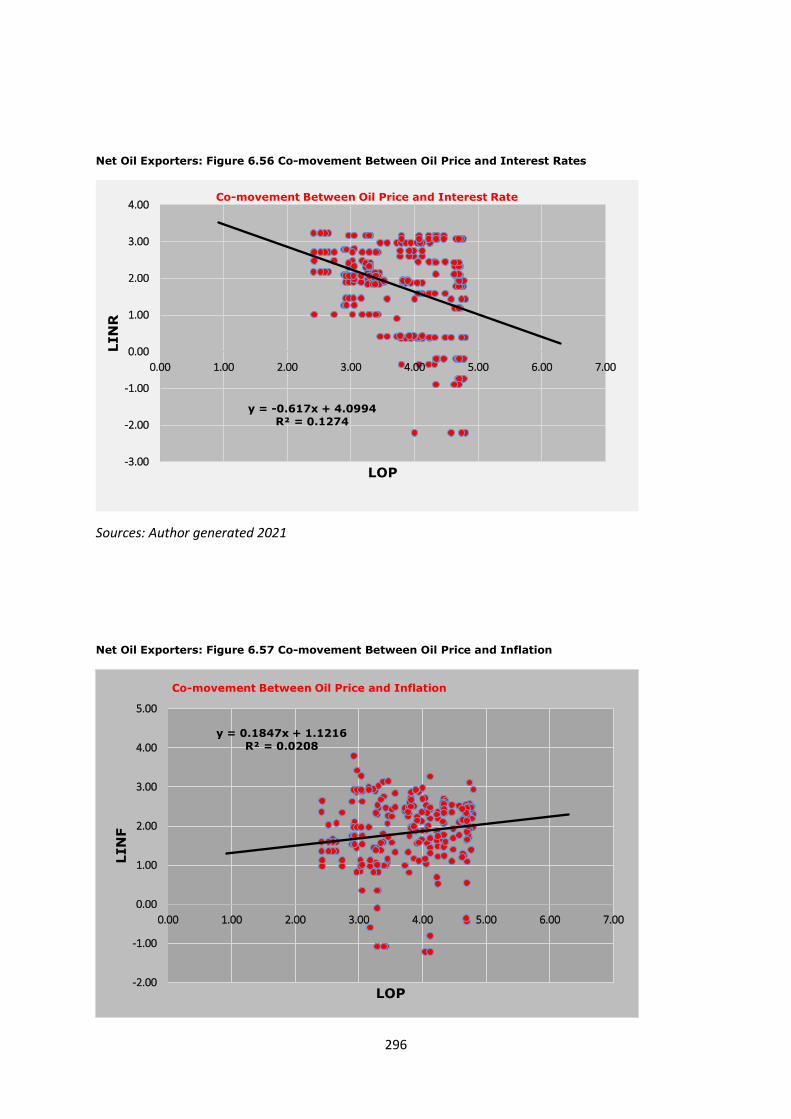
296
Net Oil Exporters: Figure 6.56 Co-movement Between Oil Price and Interest Rates
Sources: Author generated 2021
Net Oil Exporters: Figure 6.57 Co-movement Between Oil Price and Inflation
y = -0.617x + 4.0994R² = 0.1274
-3.00
-2.00
-1.00
0.00
1.00
2.00
3.00
4.00
0.00 1.00 2.00 3.00 4.00 5.00 6.00 7.00
LIN
R
LOP
Co-movement Between Oil Price and Interest Rate
y = 0.1847x + 1.1216R² = 0.0208
-2.00
-1.00
0.00
1.00
2.00
3.00
4.00
5.00
0.00 1.00 2.00 3.00 4.00 5.00 6.00 7.00
LIN
F
LOP
Co-movement Between Oil Price and Inflation

297
Sources: Author generated 2021
Net Oil Exporters: Figure 6.58 Co-movement Between Oil Price and Exchange Rates
Sources: Author generated 2021
Net Oil Exporters: Figure 6.59 Co-movement Between Oil Price and Unemployment Rate
Sources: Author generated r 2021
y = 0.2163x + 2.7869R² = 0.0109
0.00
1.00
2.00
3.00
4.00
5.00
6.00
7.00
0.00 1.00 2.00 3.00 4.00 5.00 6.00 7.00
LE
X
LOP
Co-movement Between Oil Price and Exchange Rate
y = 0.0041x + 2.1833R² = 0.02505
0.00
0.50
1.00
1.50
2.00
2.50
3.00
3.50
4.00
0.00 1.00 2.00 3.00 4.00 5.00 6.00 7.00
LU
NE
LOP
Co-movement Between Oil Price and Unemployment Rate
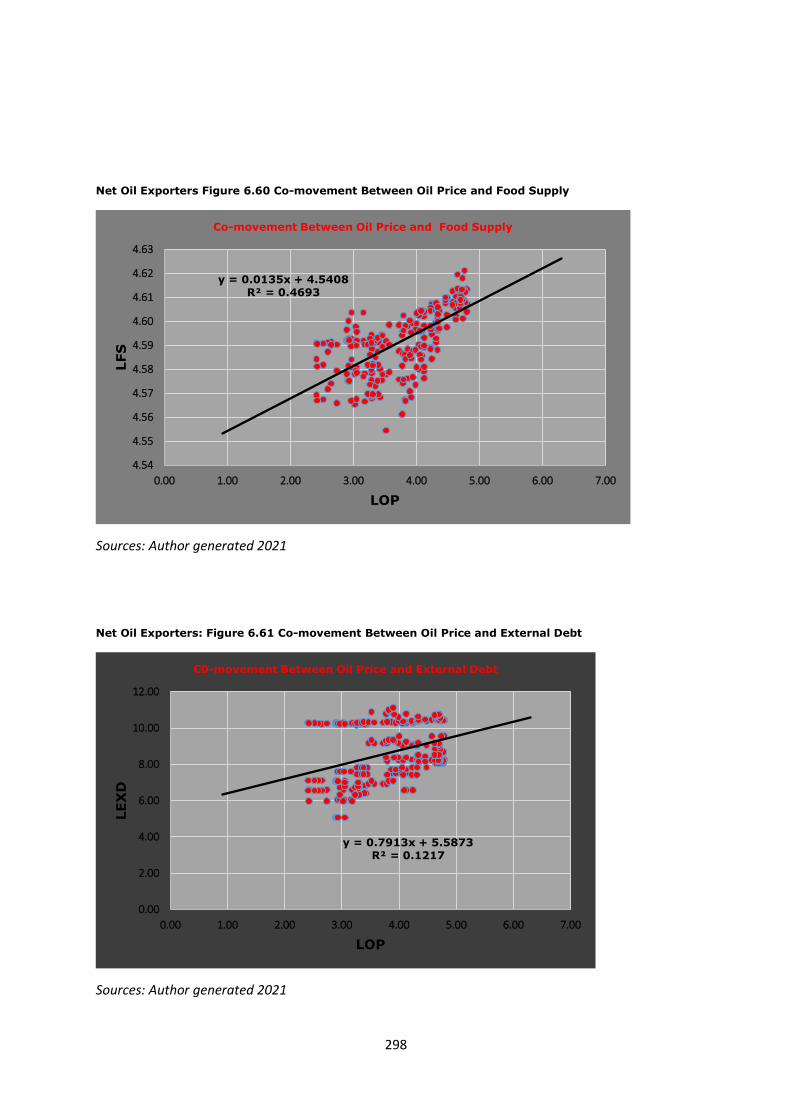
298
Net Oil Exporters Figure 6.60 Co-movement Between Oil Price and Food Supply
Sources: Author generated 2021
Net Oil Exporters: Figure 6.61 Co-movement Between Oil Price and External Debt
Sources: Author generated 2021
y = 0.0135x + 4.5408R² = 0.4693
4.54
4.55
4.56
4.57
4.58
4.59
4.60
4.61
4.62
4.63
0.00 1.00 2.00 3.00 4.00 5.00 6.00 7.00
LFS
LOP
Co-movement Between Oil Price and Food Supply
y = 0.7913x + 5.5873R² = 0.1217
0.00
2.00
4.00
6.00
8.00
10.00
12.00
0.00 1.00 2.00 3.00 4.00 5.00 6.00 7.00
LE
XD
LOP
C0-movement Between Oil Price and External Debt
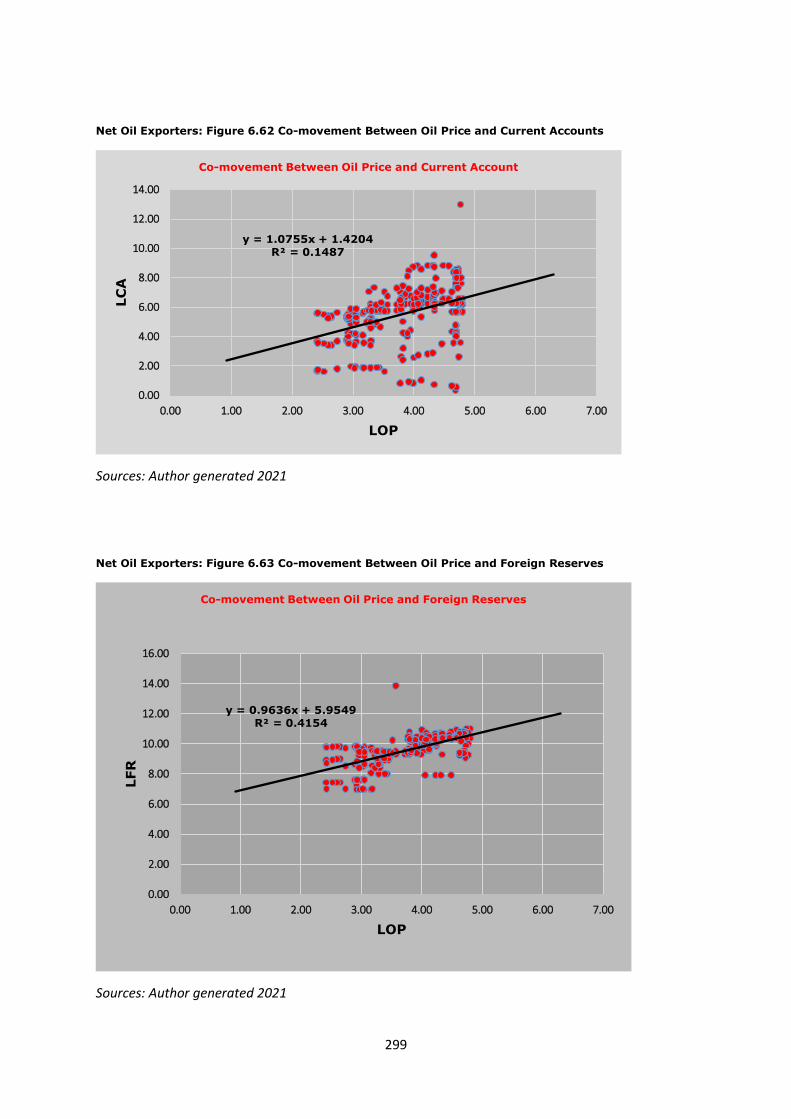
299
Net Oil Exporters: Figure 6.62 Co-movement Between Oil Price and Current Accounts
Sources: Author generated 2021
Net Oil Exporters: Figure 6.63 Co-movement Between Oil Price and Foreign Reserves
Sources: Author generated 2021
y = 1.0755x + 1.4204R² = 0.1487
0.00
2.00
4.00
6.00
8.00
10.00
12.00
14.00
0.00 1.00 2.00 3.00 4.00 5.00 6.00 7.00
LC
A
LOP
Co-movement Between Oil Price and Current Account
y = 0.9636x + 5.9549R² = 0.4154
0.00
2.00
4.00
6.00
8.00
10.00
12.00
14.00
16.00
0.00 1.00 2.00 3.00 4.00 5.00 6.00 7.00
LFR
LOP
Co-movement Between Oil Price and Foreign Reserves