Evaluation of HEPA vacuum cleaning and dry steam cleaning inreducing levels of polycyclic aromatic hydrocarbons and housedust mite allergens in carpets
Chang Ho Yua, Lih-Ming Yiinb,c, Zhi-Hua (Tina) Fana, and George G. Rhoadsc,*
aExposure Science Division, Environmental and Occupational Health Sciences Institute,Piscataway, New Jersey, 08854, USA
bDepartment of Public Health, Tzu-Chi University, Hualien, 97004, Taiwan ROC
cSchool of Public Health – University of Medicine and Dentistry of New Jersey, Room 128, 683Hoes Lane West, Piscataway, New Jersey, 08854, USA
Abstract
Dry steam cleaning, which has gained recent attention as an effective method to reduce house dust
mite (HDM) allergen concentration and loading in carpets, was evaluated in this study for its
efficacy in lowering levels of polycyclic aromatic hydrocarbons (PAHs) as well as HDM
allergens. Fifty urban homes with wail-to-wall carpets, mostly low-income and with known lead
contamination, were studied in 2003 and 2004. Two carpet-cleaning interventions were compared:
Repeated HEPA (High Efficiency Particulate Air filtered) vacuuming alone and repeated HEPA
vacuuming supplemented with dry steam cleaning. Vacuum samples were collected to measure
carpet loading of dust and contaminants immediately before and after cleaning. Paired
comparisons were conducted to evaluate the effectiveness of the cleaning protocols in reducing the
levels of PAHs and HDM allergens in carpets. The results indicated that both cleaning methods
substantially reduced the loading of PAHs and HDM allergens as well as dust in carpets (p <
0.0001). The reductions in loading of dust (64.4%), PAHs (69.1%), and HDM allergens (85.5%),
by dry steam cleaning plus repetitive HEPA vacuuming were larger than the reductions by regular
HEPA vacuuming alone: dust (55.5%), PAHs (58.6%), and HDM allergens (80.8%), although the
difference was statistically significant only for dust and PAHs. We conclude that intensive HEPA
vacuum cleaning substantially reduced the loading of PAHs and HDM allergens in carpets in these
urban homes and that dry steam cleaning added modestly to cleaning effectiveness.
Introduction
House dust is a repository for heavy metals, semi-volatile and non-volatile pesticides,
polycyclic aromatic hydrocarbons (PAHs), persistent organic compounds, and viable
biological particles.1 Once indoors, pollutants associated with dust persist for long periods,
particularly if the dust is embedded in carpets. Previous studies have shown that carpets can
© The Royal Society of Chemistry 2009
[email protected]; Fax; +732-235-4814; Tel: +732-235-4353.
NIH Public AccessAuthor ManuscriptJ Environ Monit. Author manuscript; available in PMC 2014 May 28.
Published in final edited form as:J Environ Monit. 2009 January ; 11(1): 205–211. doi:10.1039/b807821a.
NIH
-PA
Author M
anuscriptN
IH-P
A A
uthor Manuscript
NIH
-PA
Author M
anuscript
harbor large amounts of lead, house dust mite (HDM) allergens, PAHs, and other chemical
substances.2– 5 Without proper cleaning, these contaminants are accessible and potentially
harmful to young children.6–10
Several previous studies have shown that dust lead contamination can be reduced with a
vacuum cleaner, although significant reductions have generally required a thorough and
repetitive vacuuming technique.11–13 It may also be difficult to remove HDM allergens and
PAHs from carpets. One field study demonstrated that a HEPA-filtered vacuum cleaner with
a dirt finder indicator was effective in reducing the carpet loading of dust mite allergens.13
The in-built dirt finder indicator provides a signal when the number of dust particles
vacuumed per second falls below a preset level. The HEPA vacuum filtration is believed to
prevent dust re-entrainment, which may re-contaminate carpet surfaces after using a non-
HEPA vacuum cleaner. However, data demonstrating the importance of this are quite
limited. Hot water extraction, another cleaning method for reducing lead dust in carpets, was
not superior to dry vacuuming based on a limited number of field evaluation studies.5
A recent intervention study indicated that using a dry steam cleaner in addition to regular
vacuuming could further reduce the levels of dust mite allergens for a period of up to eight
weeks as compared to using regular vacuuming alone.4 Dry steam cleaning is believed to
kill dust mites with high temperature vapor (above 100 °C), and simultaneously to soften
and loosen sticky dust which is removed by a towel attached to the cleaning head or by
subsequent regular vacuuming. In addition, the high temperature may help volatilize and
remove PAHs and other chemicals in the carpets. The dry steam cleaner does not use
detergents and only delivers dry vapor (in general, below 6% of water content) into the
carpet pile, which allows carpets to dry within 15 minutes. Based on the foregoing, we
proposed the use of dry steam cleaning with regular HEPA vacuum cleaning to enhance the
removal of common toxicants from carpets.
We evaluated cleaning efficacy on carpets using repetitive HEPA vacuuming with or
without dry steaming for PAHs, HDM allergens, and lead. These species were selected for
study given their putative effects on health. PAHs are carcinogenic14 and their presence in
house dust may be associated with cancer risk;9,15 HDM allergens contribute to allergic
sensitization, development of asthma, and exacerbation of asthma symptoms;16 and lead is
well known for its neurotoxicity, especially to young children.l7 In addition, they represent
three major types of pollutants that are associated with house dust.1 The dramatic
differences among them in chemical and physical properties may lead to different cleaning
efficiency using a given cleaning method. This paper focuses only on PAHs and HDM
allergens; the results for reduction of lead in carpets have been published by Yiin et al.18
Methods
Recruitment and screening visit
We studied 50 homes, mostly low-income, urban residences, having at least one room with
wall-to-wall carpeting. Families with children having elevated blood lead levels (10–25 µg
dL−1) or higher were recruited via referrals from the New Jersey State Health Department or
local health departments in northern New Jersey. The referred subjects were interviewed by
Yu et al. Page 2
J Environ Monit. Author manuscript; available in PMC 2014 May 28.
NIH
-PA
Author M
anuscriptN
IH-P
A A
uthor Manuscript
NIH
-PA
Author M
anuscript
phone or in person. Homes were screened to ascertain the presence of at least one wall-to-
wall carpet. Baseline questionnaires were collected from the parent or caregiver to obtain
demographic information, age of the house, and cleaning habits (e.g., how often, what
method, and brand name of cleaning products). Informed consent was obtained from an
adult member of each household. The study protocols and all supporting documentations
were approved by the UMDNJ-Robert Wood Johnson Medical School Institutional Review
Board.
Interventions
Among carpeted rooms, the one in which a child would be presumed to spend the most time
in a day was selected to test the effectiveness of two cleaning interventions: The HEPA–
HEPA protocol consisted of HEPA vacuuming followed, after about two hours, by repeat
HEPA vacuuming. The HEPA–steam–HEPA protocol consisted of an initial HEPA
vacuuming followed by dry steam cleaning, followed by repeat HEPA vacuuming. Both
protocols started with the same initial vacuuming that was applied to the whole carpet. The
carpet was vacuumed twice in perpendicular directions at a rate of 10 ft2 min−1 using a
HEPA vacuum cleaner (Self Propelled Wind-Tunnel™ Ultra Upright, Hoover Company,
Newton, IA) equipped with a dirt finder indicator. We used a high sensitivity setting for
initial HEPA vacuuming, and used the indicator light as a signal to move the vacuum
cleaner to the next area of carpet.
After the first HEPA vacuuming, the carpet was divided into two halves to separate the
interventions. Thirty to sixty minutes were allowed to permit disturbed dust inside the room
to settle. A dry steam cleaner (VaporJet 2400, VaporTechnologies LLC, Sandy, UT) was
then applied to one half of the carpet. The dry steam cleaning was performed at a rate of 4.3
ft2 min−1 according to the manufacturer’s instructions for carpeting. After the dry steam
cleaning a minimum of 15 minutes was allowed for drying, and the whole experimental area
of carpet was then cleaned again with the same HEPA vacuum using a clean nozzle.
Dust sampling
Two pre-cleaning vacuum dust samples were collected from each of the 50 study carpets
using a template, size 2.76 ft2, with a canister vacuum sampler (Metro Data-Vac/2,
Metropolitan Vacuum Cleaner Co. Inc, Suffern, NY). The templates were located near the
dividing line that separated the two cleaning strategies. One vacuum sample was for the
analysis of PAHs, and one for HDM allergens, each providing a common baseline for the
two cleaning strategies. The post-cleaning samples were collected separately on each half of
the rug to assess the effects of the two cleaning strategies. These were collected using 2.76
ft2 templates located near the location of the pre-cleaning samples. Thus, in total, 50 pre-
cleaning and 100 post-cleaning samples were collected for HDM analysis and an identical
number for PAH analysis. Temperature and relative humidity were measured and recorded
for each dust vacuum sample.
In addition to assessing from the above samples whether there was an overall difference in
cleaning efficacy when dry steam cleaning was added to repeated HEPA vacuuming, we
were also interested to know whether a second HEPA vacuuming after dry steam cleaning
Yu et al. Page 3
J Environ Monit. Author manuscript; available in PMC 2014 May 28.
NIH
-PA
Author M
anuscriptN
IH-P
A A
uthor Manuscript
NIH
-PA
Author M
anuscript
removed a substantial further amount of dust and toxicants. To determine this we collected
extra dust samples for HDM and PAHs after dry steam cleaning and compared these levels
with the levels found after the subsequent (repeated) HEPA vacuuming. Because of budget
limitations these extra samples were limited to 20 homes.
Laboratory analysis
The analysis of PAH content for dust vacuum samples was conducted in our laboratory. All
pre/post-vacuum samples were blinded and delivered to the laboratory in identical,
numbered containers. Each dust sample (0.1–1.0 g, depending on the amount available) was
spiked with 1000 ng of four PAH surrogates, including naphthalene-D8, phenanthrene-D10,
pyrene-D12 and benzo[a]pyrene-D12. After spiking with a known amount of acenaphene-
D10 and anthracene-D10 as internal standards, the samples were extracted with 10 mL
hexane for 30 min in a sonication bath. This procedure was repeated twice. After sonication,
the extract was cleaned with a PTFE filter (pore size: 0.2 µm) to remove any particles in the
solution. After cleaning, the extract was concentrated to ~1 mL at 45 °C with a rotary
evaporator. The extract was then transferred to a 1 mL clean vial and further concentrated to
500 µL under a gentle nitrogen gas stream. The sample extract were stored in the freezer at 4
°C for at least one day for any fine particles left in the extract to settle before injection on
GC/MS.
Prior to injection, 100 µL sample extract from the 500 µL available was filtered and
transferred to a 200 µglass insert. Internal standards, 200 ng of acenaphthene-D10 and
anthracene-D10, were added to the 100 µL extract to monitor any instrumental variation
during sample analysis. A 1 µL sample was injected on GC/MS for PAH analysis. The
analytical conditions were as follows. The injection port temperature was 300 °C. The GC
oven temperature program was: initially at 50 °C for 1.10 min, then a ramp increase of 25
°C min−1 to 125 °C, followed by a rate increase of 8 °C min−1 to 260 °C and 3 °C min−1 to
final temperature of 300 °C with a holding time of 5:00 min. The transfer line temperature
was 270 °C and the ion trap temperature was 220 °C.
Seven levels of PAH calibration standards were used for constructing the calibration curves.
The calibration curves were constructed using the ratio of the response between the target
PAHs and the internal standards, and the R2 was greater than 0.995. The precision of the
instrument was determined by performing seven repeated analyses of a mid-level calibration
standard. The standard deviation of these seven injections was < 25%. Additionally ten
percent of lab blanks (N = 17) and solvent blank were analysed for QA/QC. In general, no
PAHs were detected in the solvent blank or lab blanks. The analytical detection limits
(ADLs) of PAHs using GC/MS ranged from 10–20 pg, and the method detection limits
(MDLs), determined by ADLs and a final concentrated volume (500 µL) for each sample,
were 5–10 ng g−1.
The PAH concentrations and the surrogate recoveries were quantified based on the
calibration curves. The PAH concentrations were corrected with the recoveries of the
surrogates. These considered the loss of PAHs during the sample processing. According to
the volatility of each PAH species, the recovery of naphthalene-D8 was applied to correct
the concentrations of naphthalene, acenaphthylene, acenaphthene and fluorene; the recovery
Yu et al. Page 4
J Environ Monit. Author manuscript; available in PMC 2014 May 28.
NIH
-PA
Author M
anuscriptN
IH-P
A A
uthor Manuscript
NIH
-PA
Author M
anuscript
of phenanthrene-D10 was used to correct the concentrations of phenanthrene and anthracene;
the recovery of pyrene-D10 was used to correct the concentrations of pyrene, fluoranthene,
benzo[a]anthracene and chrysene; and the recovery of benzo[a]pyrene-D12 was used for the
correction of benzo[a]-pyrene and the rest of compounds. The recovery of the surrogates
was 179 ± 87% for naphthalene-D8, 136 ± 61% for phenanthrene-D10, 85 ± 53% for pyrene-
D12 and 88 ± 83% for benzo[a]pyrene-D12. The large variability of the recovery may be due
to the difference between each dust matrix so that the recovery of PAH from the dust
samples differed.
The dust mite allergens analysis for dust vacuum samples was conducted by STL P&K
Microbiology Services Inc. (Cherry Hill, NJ) which is accredited by the American Industrial
Hygiene Association under the Environmental Microbiology Laboratory Accreditation
Program (AIHA-EMLAP). ELISA (Enzyme-Linked Immunosorbent Assay) method was
used to measure two common species of dust mite allergens: Dermatophagoides
pteronyssimis allergen 1 (Der p 1) and Dermatophagoides farinae allergen 1 (Der f 1). The
dust samples were prepared by extracting 100 mg of the fine dust in 2 mL PBS-T (phosphate
buffered saline with 0.05% Tween 20; pH = 7.4). Extracts were clarified by centrifugation at
2500 rpm and the supernatants (1–1.5 mL) were decanted and stored at −20 °C until they
were analysed. Individual HDM allergens were measured using monoclonal antibody-based
enzyme linked immunosorbent assays (ELISAs) as described by Chapman et al.9 The MQL
(method quantification limit) ranged between 0.26 and 0.80 µg g−1 throughout all test
samples.
Statistical analysis
Many HDM allergen concentrations in pre-cleaning (70%) and post-cleaning (82%) samples
were below the MQL. Carpets with pre-cleaning HDM allergen concentration below MQL
were excluded from HDM analysis. To retain all of the remaining 15 sample pairs, we used
a value of half of the MQL for carpets with a post-cleaning HDM level (hat was below
MQL. HDM allergen (combination of Der p 1 and Der f 1) concentrations (µg g−1) and PAH
concentrations (µg g−1) were converted to loadings (µg ft−2) by multiplying the mass of
vacuumed house dust and dividing by the collection template area (2.78 ft2). The reduction
percentages for loading of total dust, PAHs and HDM allergens by two cleaning
interventions were calculated by the following equation:
where, Pre is the pre-cleaning loading, and Post is the post-cleaning loading (either after
HEPA vacuuming alone or after dry steaming plus HEPA vacuuming).
Descriptive statistical analyses were performed for loadings (micrograms per unit square
foot) of PAHs and HDM allergens to examine their distributions. Most data for PAHs and
HDM allergens were skewed to the right. Therefore, data for the levels of PAHs and HDM
allergens were log-transformed (base 10) before conducting statistical analyses. Following
Yu et al. Page 5
J Environ Monit. Author manuscript; available in PMC 2014 May 28.
NIH
-PA
Author M
anuscriptN
IH-P
A A
uthor Manuscript
NIH
-PA
Author M
anuscript
the transformations, normality tests confirmed that the data were approximately normally
distributed.
Paired t-tests were conducted for the pre-cleaning and post-cleaning loadings to estimate the
efficacy of dry steam or HEPA vacuum cleaning on each carpet. The cleaning efficacy by
dry steam cleaner was examined further by conducting paired t-test between post-HEPA
cleaning and post-dry steam cleaning. Due to the asymmetric distribution of reduction
percentages calculated, a non-parametric approach (Wilcoxon two-sample test) was used to
determine the statistical difference in percent reductions. SAS v9.1 (SAS™, Cary, NC) was
used to run all statistical analyses (α = 0.05).
Results
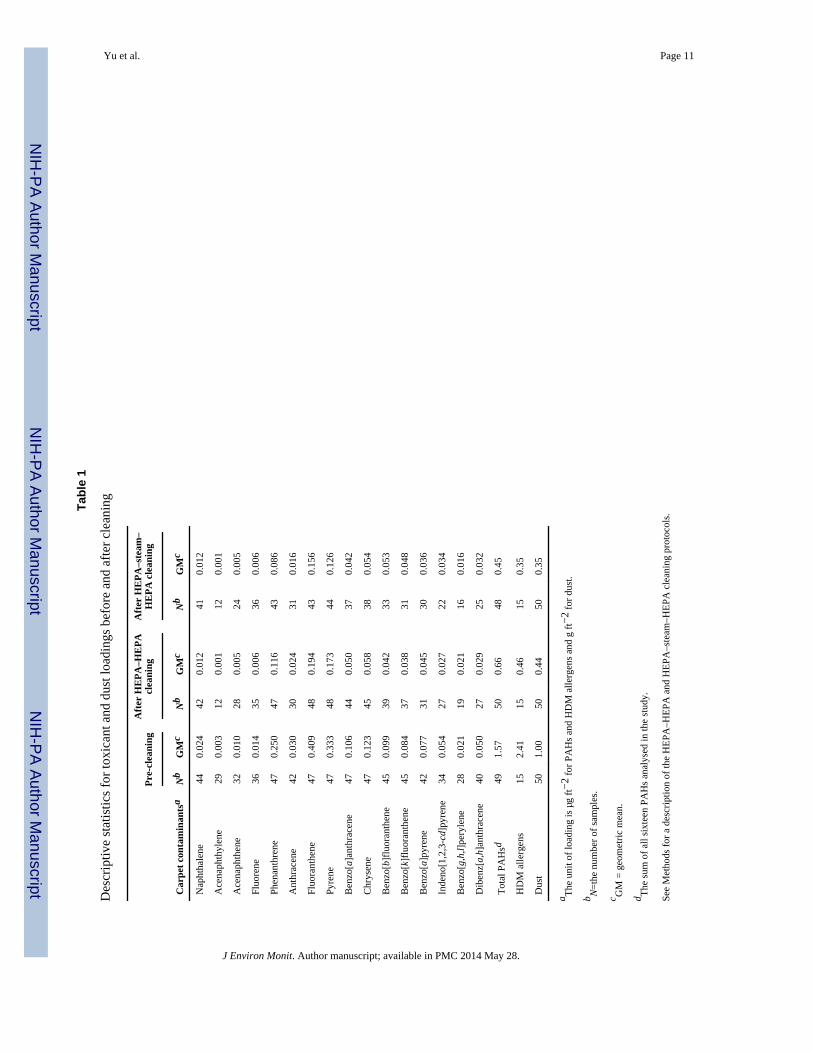
The descriptive statistics for loadings of PAHs and HDM allergens (sum of Der f 1 and Der
p 1) obtained by vacuum sampler are provided in Table 1. Sixteen discreet PAHs were
selected for the analysis in this study. The geometric means (GM) were calculated due to the
skewness of PAH and HDM allergen loadings. Total PAHs calculated by the summation of
all listed sixteen PAHs and dust loadings for three cleaning events are also provided in Table
1. Pre-cleaning samples ranged between 0.013 and 220 µg ft−2 for total PAH and between
0.22 and 10.7 µg ft−2 for HDM allergen loadings. Post-cleaning PAH levels were lower and
ranged from 0.004 to 121 µg ft−2 following the HEPA–HEPA protocol and from 0.006 to
116 µg ft−2 following the HEPA–steam–HEPA protocol, HDM allergens were not detected
in 35 of the 50 carpets tested. Among the 15 with detectable precleaning levels, loadings
ranged from between 0.03 and 1.80 µg ft−2 and post-cleaning levels ranged (combining both
protocols) between 0.03 and 1.76 µg ft−2. Dust loadings were also reduced from pre-
cleaning samples (0.175–4.397 g ft−2) to (0.069–2.308 g ft−2) after HEPA–HEPA and to
(0.072–2.459 g ft−2) after HEPA–steam–HEPA.
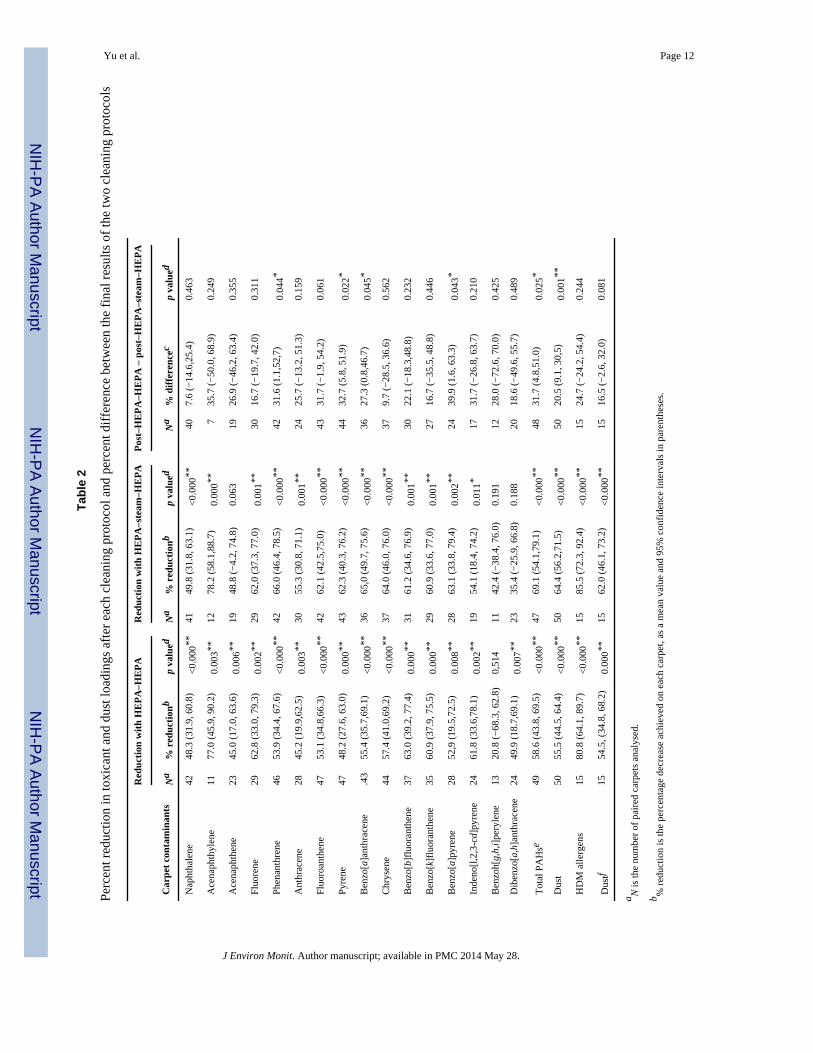
To evaluate the effectiveness of each carpet cleaning strategy, paired t-tests between pre-
cleaning and post-cleaning samples are presented in Table 2. Further, PAH and HDM
allergen reduction achieved by the HEPA–steam–HEPA protocol was compared to cleaning
by the HEPA–HEPA protocol. Mean percent reduction for each set of comparisons and its
95% confidence intervals (CI) were calculated. HEPA–HEPA achieved mean reductions of
58.6% and 80.8% for total PAHs and HDM allergens, respectively, (both p < 0.0001). The
HEPA–steam–HEPA protocol removed 69.1% and 85.5% of total PAH and HDM allergen
loadings from the carpets (p < 0.0001). Compared to HEPA–HEPA, HEPA–steam–HEPA
achieved further 31.7% and 24.7% reductions in total PAH and HDM allergen loadings,
respectively. However, the addition of the dry steam cleaner did not make a statistically
significant difference for many PAHs (except phenanthrene, pyrene, beozo[a]an-thracene
and benzo[a]pyrene) or for HDM allergens. The mean reductions for dust loading were
55.5% and 64.4% by HEPA–HEPA and HEPA–steam–HEPA protocols, respectively. The
additional use of dry steam cleaning reduced total dust loading by 20.5% compared to the
HEPA–HEPA protocol alone (p = 0.0012).
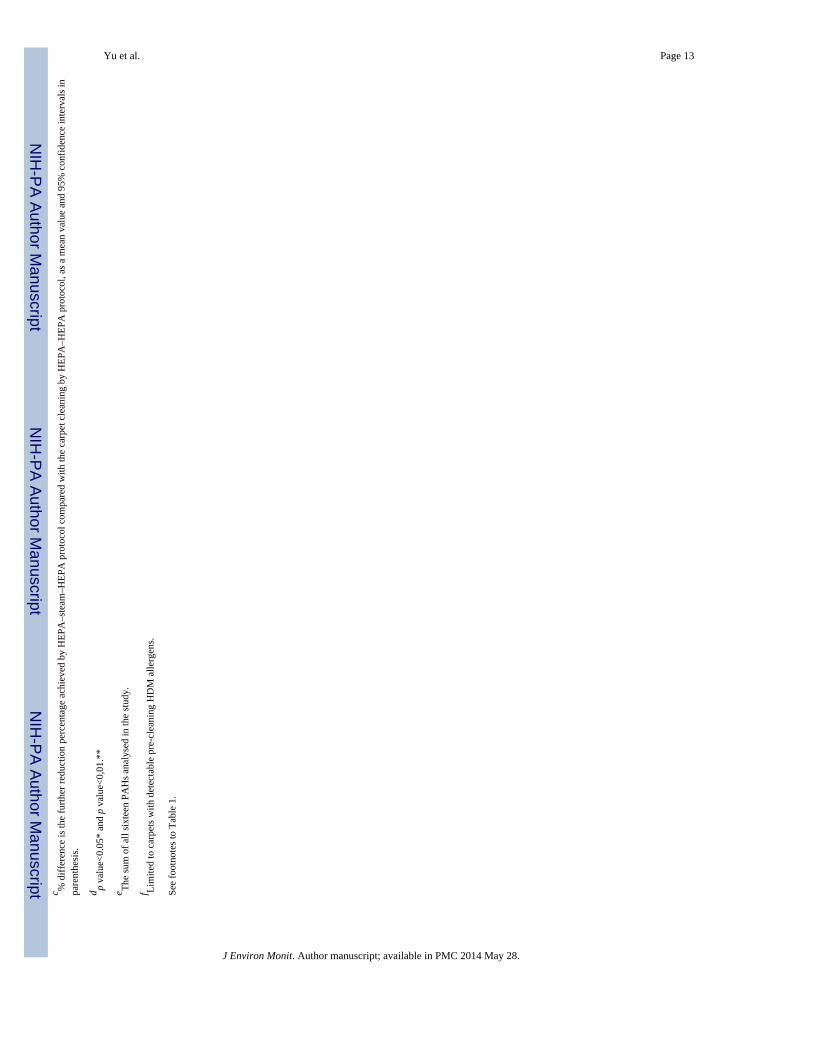
In twenty homes, additional dust samples were collected after dry steam cleaning and before
the final HEPA vacuum cleaning to assess the importance of the follow-up vacuuming after
Yu et al. Page 6
J Environ Monit. Author manuscript; available in PMC 2014 May 28.
NIH
-PA
Author M
anuscriptN
IH-P
A A
uthor Manuscript
NIH
-PA
Author M
anuscript
dry steam cleaning. Descriptive statistics and paired t-tests for total PAH and dust loadings
are provided in Table 3. The HDM allergens were excluded from the analysis due to the
very low number of available data sets (N = 3). The top row in three cleaning protocols
shows data for the portion of the rug that was cleaned twice with the HEPA–HEPA protocol
vacuum and had no dry steam cleaning. Calculating from the geometric means in Table 3,
HEPA followed by dry steam cleaning (without repeat HEPA) yielded PAH loadings that
were 16.6% lower than the levels produced by HEPA–HEPA. The best results (bottom row
in three cleaning protocols) were achieved by the full sequence of HEPA–steam–HEPA,
which reduced PAH loading by 31.9% compared to repeated HEPA vacuum cleaning alone.
However, neither of these PAH differences was statistically significant.
With respect to total dust loadings, HEPA followed by dry steam cleaning (without second
HEPA vacuuming) yielded a geometric mean loading that was 9.2% lower than HEPA–
HEPA, while HEPA–steam–HEPA yielded a loading that was 23.6% lower. Only the latter
reduction was statistically significant (p = 0.04).
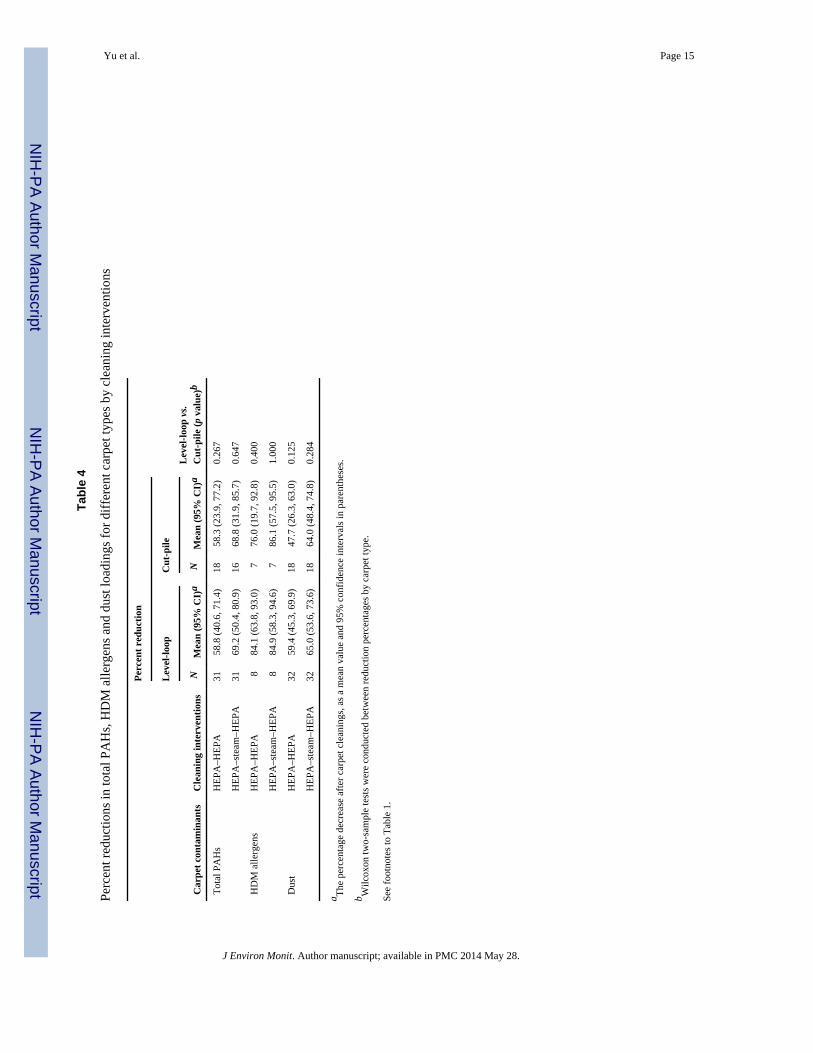
The cleaning results were analysed by carpet type to determine whether this affected
cleaning efficacy. Among the 50 home carpets cleaned, 32 were identified as level-loop and
18 as cut-pile. The mean percent reductions by two carpet cleaning interventions for total
PAH, HDM allergen and lead loadings were calculated and their reduction percentages were
compared by carpet type (Wilcoxon two-sample test; two-sided). As shown in Table 4, the
effect of carpet type did not approach significance (p > 0.10) for any of the carpet
contaminants and cleaning methods tested in this study.
Discussion
The comparison of vacuum samples between the pre-cleaning and post-cleaning indicated
that both cleaning sequences tested in this study reduced the levels of PAHs and HDM
allergens significantly (p < 0.0001) in the carpets of these urban homes. This appeared to be
mainly the result of the substantial (56% and 64%) reductions in geometric mean dust
loadings, as shown in Table 2. Roberts et al.13 reported the reduction of dust loading for
carpets in 11 homes ranged from 15 to 98% (GM = 72.7%), after intensive carpet cleaning
with a vacuum cleaner equipped with HEPA filter bag, supporting the idea that substantial
reduction in accessible carpet toxicants can be achieved by removing dust itself. Previous
studies, evaluating the effectiveness of cleaning interventions to reduce lead burdens in
children, confirmed the relationship of dust loading to lead loading and to blood lead
levels.20
In this study we detected HDM allergens before cleaning in only 15 (30%) of the homes.
Despite this limited number, the decrease in loading of HDM allergens in home carpets was
highly statistically significant for both cleaning protocols. HDM allergen loading is probably
of more concern than HDM allergen concentration in carpet dusts, because it is more likely
related to exposure. The percentage decrease in HDM allergens (81%–86%) was larger than
the reduction in total dust (55%–62%), suggesting that the allergens are more superficial on
the carpets or are associated for other reasons with particles that are relatively easily
removed. While it must be noted that our analysis only included the 30% of homes with the
Yu et al. Page 7
J Environ Monit. Author manuscript; available in PMC 2014 May 28.
NIH
-PA
Author M
anuscriptN
IH-P
A A
uthor Manuscript
NIH
-PA
Author M
anuscript
highest levels of HDM allergens, the effectiveness of these vacuuming protocols in lowering
these high levels was impressive. Our results are consistent with those of Vojta et al.4 who
tested the effectiveness of a dry steam cleaner in reducing the HDM allergen levels in
carpets for screened low-income, urban homes (N = 11; HDM allergen concentration > 10
µg g−1) and found that both intensive vacuuming and vacuuming plus dry steam cleaning
could reduce high levels of HDM allergens. They reported greater and longer lasting
reductions of allergens with dry steam cleaning than with vacuuming alone. We also
achieved lower levels with the addition of dry steam cleaning although the difference from
repeat vacuuming alone was not statistically significant.
Among the 16 PAHs analysed in this study, loadings for most were reduced significantly
from pre-cleaning values by both cleaning protocols (Table 2). Some PAHs, such as
acenaph-thene, benzo[g,h,l]peryiene and dibenzo[a,h]anthracene, were not significantly
reduced after cleaning the carpets by either of the two methods. This may have been due to a
smaller number of available pairs (pre–post cleaning samples; N ≤ 23). However, both
cleaning methods reduced overall PAH carpet loadings significantly in these low-income,
urban homes.
We found that adding dry steam cleaning to the HEPA–HEPA protocol led to further
reductions of loading with PAHs (7.6% to 39.9%), HDM allergens (24.7%), and dust
(20.5%) (Table 2). Significant differences between the protocols were obtained for total
PAHs (p = 0.025) and four individual PAHs (phenanthrene, pyrene, beozo[a]anthracene and
benzo[a]py-rene); for the remaining twelve PAHs, further reductions were obtained after dry
steam cleaning, but the differences were not significant. Yiin et al.18 demonstrated further
reduction of lead dust loadings (wipe samples; N = 50; p = 0.038) on carpet surfaces when
dry steam cleaning was added to repetitive HEPA vacuuming (mean reduction = 40.4%)
under this protocol.
An extra dust sample was collected in 20 homes to determine whether the second HEPA
vacuuming after dry steam cleaning confers a substantial advantage (Table 3). The results
showed that initial HEPA vacuuming followed by dry steam cleaning (without second
HEPA vacuuming) reduced the loadings of dust and total PAHs compared to two
consecutive HEPA vacuumings. However, with the smaller sample size, the differences
were not significant. The addition of the second HEPA vacuuming after dry steam cleaning
further reduced the loadings of total PAH (18.4%) and dust (15.9%), respectively, in carpets
cleaned by initial HEPA vacuuming plus dry steaming only; however, these differences
were not significant, either.
We found that carpet type (level-loop vs. cut-pile) didn’t make a significant difference in
cleaning efficacy, either by HEPA vacuum cleaning alone or HEPA plus dry steam cleaning.
Causer et al.5 showed that carpet cleaning was more complete with low height, low density,
and lightly worn carpets. However in the carpets studied here, level-loop carpets were
usually low-height but densely piled, whereas cut-pile ones were high-height but loosely
piled. These competing physical characteristics may limit any differences in the effects of
the cleaning protocols on toxicant loadings.
Yu et al. Page 8
J Environ Monit. Author manuscript; available in PMC 2014 May 28.
NIH
-PA
Author M
anuscriptN
IH-P
A A
uthor Manuscript
NIH
-PA
Author M
anuscript
Conclusion
A physical intervention study was conducted in 50 low-income, urban households to
evaluate the efficacy of two cleaning protocols (HEPA followed by repeat HEPA vs. HEPA,
dry steam, HEPA) proposed for reducing levels of PAHs and HDM allergens in wall-to-wall
carpets.
The results showed that both HEPA–HEPA and HEPA–steam–HEPA can result in
significant reductions in loadings of PAHs and HDM allergens in carpets (p < 0.0001). We
observed greater percentage reductions in PAHs and HDM allergens when dry steam
cleaning was added to the repetitive HEPA vacuuming protocol, which was statistically
significant for total PAHs and for dust (p < 0.05). There was no evidence that the efficacy of
these cleaning protocols varied between level loop and cut pile carpets.
The cleaning methods tested in this study are effective and practical alternatives when
compared to expensive physical abatement (e.g., removal or replacement of contaminated
carpets) and are potentially feasible for families of modest means.
Acknowledgments
The authors wish to thank the entire ECSC field and study design team for their efforts in completing the manycomponents of the study. We also want to thank Dr Kyung Hwa Jung for the analysis of PAHs in house dustvacuum samples. The research has been funded by U.S. Department of Housing and Urban Development (#NJLHH0111-02). Dr George G. Rhoads is in part supported by NIEHS center grant to UMDNJ (P30 ES05022).
References
1. Lioy PJ, Freeman NCG, Millette JR. Environ. Health Perspect. 2002; 110:969–983. [PubMed:12361921]
2. Lewis RG, Fortune CR, Willis RD, Camann DE, Antley JT. Environ. Health Perspect. 1999;107:721–726. [PubMed: 10464072]
3. Chuang JC, Callahan PJ, Menton RO, Gordon SM. Environ. Sci. Technol. 1995; 29:494–500.[PubMed: 22201397]
4. Vojta PJ, Randels SP, Stout J, Muilenberg M, Burge HA, Lynn H, Mitchell H, O’Connor GT,Zeldin DC. Environ. Health Perspect. 2001; 109:815–819. [PubMed: 11564617]
5. Causer SM, Lewis RD, Batek JM Sr, Ong K-H. J. Occup. Environ. Hyg. 2004; 1:237–242.[PubMed: 15204862]
6. Chuang JC, Callahan PJ, Lyu CW, Wilson NK. J. Exposure Anal. Environ. Epidemiol. 1999; 9:85–98.
7. Butte W, Heinzow B. Rev. Environ. Contain. Toxicol. 2002; 175:1–46.
8. Naspinski C, Lingenfelter R, Cizmas L, Naufal Z, He LY, Islamzadeh A, Li Z, Li Z, McDonald T,Donnelly KC. Environ. Int. 2008; 34:988–993. [PubMed: 18452990]
9. Maertens RM, Yang X, Zhu J, Gagne RW, Douglas GR, White PA. Environ. Sci. Technol. 2008;42:1747–1753. [PubMed: 18441830]
10. Maertens RM, Gagne RW, Douglas GR, Zhu J, White PA. Environ. Sci. Technol. 2008; 42:1754–1760. [PubMed: 18441831]
11. Hilts SR, Hertzman C, Marion SA. Can. J. Public Health. 1995; 86:345–350. [PubMed: 8556684]
12. Lioy PJ, Yiin L-M, Adgate JL, Weisel CP, Rhoads GG. J. Exposure Anal. Environ. Epidemiol.1998; 8:17–35.
13. Roberts JW, Clifford WS, Glass G, Hummer PG. Arch. Environ. Contam. Toxicol. 1999; 36:477–484. [PubMed: 10227868]
Yu et al. Page 9
J Environ Monit. Author manuscript; available in PMC 2014 May 28.
NIH
-PA
Author M
anuscriptN
IH-P
A A
uthor Manuscript
NIH
-PA
Author M
anuscript
14. U.S. Agency for Toxic Substance and Disease Registry. Toxicological Profile for PolycyclicAromatic Hydrocarbons. Atlanta, GA: 1995.
15. Colt JS, Zahm SH, Camann DE, Hartge P. Environ. Health Perspect. 1998; 106:721–724.[PubMed: 9799187]
16. Sporik R, Holgate ST, Platts-Mills TAE, Cogswell JJ. N. Engl. J. Med. 1990; 323:502–507.[PubMed: 2377175]
17. U.S. Agency for Toxic Substance and Disease Registry. Toxicological Profile for Lead. Atlanta,GA: 1999.
18. Yiin L-M, Yu CH, Ashley PJ, Rhoads GG. Occup. Environ. Hyg. 2008; 5:94–99.
19. Chapman MD, Heymann PW, Wilkins SR, Brown MJ, Platts-Mills TAE. J. Allergy Clin.Immunol. 1987; 80:184–194. [PubMed: 3611539]
20. Rhoads GG, Ettinger AS, Weisel CP, Buckley TJ, Goldman KD, Adgate JL, Lioy PJ. Pediatrics.1999; 3:721–726.
Yu et al. Page 10
J Environ Monit. Author manuscript; available in PMC 2014 May 28.
NIH
-PA
Author M
anuscriptN
IH-P
A A
uthor Manuscript
NIH
-PA
Author M
anuscript
NIH
-PA
Author M
anuscriptN
IH-P
A A
uthor Manuscript
NIH
-PA
Author M
anuscript
Yu et al. Page 11
Tab
le 1
Des
crip
tive
stat
istic
s fo
r to
xica
nt a
nd d
ust l
oadi
ngs
befo
re a
nd a
fter
cle
anin
g
Pre
-cle
anin
gA
fter
HE
PA
–HE
PA
clea
ning
Aft
er H
EP
A–s
team
–H
EP
A c
lean
ing
Car
pet
cont
amin
ants
aN
bG
Mc
Nb
GM
cN
bG
Mc
Nap
htha
lene
440.
024
420.
012
410.
012
Ace
naph
thyl
ene
290.
003
120.
001
120.
001
Ace
naph
then
e32
0.01
028
0.00
524
0.00
5
Fluo
rene
360.
014
350.
006
360.
006
Phen
anth
rene
470.
250
470.
116
430.
086
Ant
hrac
ene
420.
030
300.
024
310.
016
Fluo
rant
hene
470.
409
480.
194
430.
156
Pyre
ne47
0.33
348
0.17
344
0.12
6
Ben
zo[a
]ant
hrac
ene
470.
106
440.
050
370.
042
Chr
ysen
e47
0.12
345
0.05
838
0.05
4
Ben
zo[b
]flu
oran
then
e45
0.09
939
0.04
233
0.05
3
Ben
zo[k
]flu
oran
then
e45
0.08
437
0.03
831
0.04
8
Ben
zo[a
]pyr
ene
420.
077
310.
045
300.
036
Inde
no[1
,2,3
-cd]
pyre
ne34
0.05
427
0.02
722
0.03
4
Ben
zo[g
,h,l]
pery
lene
280.
021
190.
021
160.
016
Dib
enz[
a,h]
anth
race
ne40
0.05
027
0.02
925
0.03
2
Tot
al P
AH
sd49
1.57
500.
6648
0.45
HD
M a
llerg
ens
152.
4115
0.46
150.
35
Dus
t50
1.00
500.
4450
0.35
a The
uni
t of
load
ing
is µ
g ft
−2
for
PAH
s an
d H
DM
alle
rgen
s an
d g
ft−
2 fo
r du
st.
b N=
the
num
ber
of s
ampl
es.
c GM
= g
eom
etri
c m
ean.
d The
sum
of
all s
ixte
en P
AH
s an
alys
ed in
the
stud
y.
See
Met
hods
for
a d
escr
iptio
n of
the
HE
PA–H
EPA
and
HE
PA–s
team
–HE
PA c
lean
ing
prot
ocol
s.
J Environ Monit. Author manuscript; available in PMC 2014 May 28.
NIH
-PA
Author M
anuscriptN
IH-P
A A
uthor Manuscript
NIH
-PA
Author M
anuscript
Yu et al. Page 12
Tab
le 2
Perc
ent r
educ
tion
in to
xica
nt a
nd d
ust l
oadi
ngs
afte
r ea
ch c
lean
ing
prot
ocol
and
per
cent
dif
fere
nce
betw
een
the
fina
l res
ults
of
the
two
clea
ning
pro
toco
ls
Red
ucti
on w
ith
HE
PA
–HE
PA
Red
ucti
on w
ith
HE
PA
–ste
am–H
EP
AP
ost–
HE
PA
–HE
PA
– p
ost–
HE
PA
–ste
am–H
EP
A
Car
pet
cont
amin
ants
Na
% r
educ
tion
bp
valu
edN
a%
red
ucti
onb
p va
lued
Na
% d
iffe
renc
ecp
valu
ed
Nap
htha
lene
4248
.3 (
31.9
, 60.
8)<
0.00
0**
4149
.8 (
31.8
, 63.
1)<
0.00
0**
407.
6 (−
14.6
,25.
4)0.
463
Ace
naph
thyl
ene
1177
.0 (
45.9
, 90.
2)0.
003*
*12
78.2
(58
.1,8
8.7)
0.00
0**
735
.7 (
−50
.0, 6
8.9)
0.24
9
Ace
naph
then
e23
45.0
(17
.0, 6
3.6)
0.00
6**
1948
.8 (
−4.
2, 7
4.8)
0.06
319
26.9
(−
46,2
, 63.
4)0.
355
Fluo
rene
2962
.8 (
33.0
, 79.
3)0.
002*
*29
62,0
(37
.3, 7
7.0)
0.00
1**
3016
.7 (
−19
.7, 4
2.0)
0.31
1
Phen
anth
rene
4653
.9 (
34.4
, 67.
6)<
0.00
0**
4266
.0 (
46.4
, 78.
5)<
0.00
0**
4231
.6 (
1.1,
52,7
)0.
044*
Ant
hrac
ene
2845
.2 (
19.9
,62.
5)0.
003*
*30
55.3
(30
.8, 7
1.1)
0.00
1**
2425
.7 (
−13
.2, 5
1.3)
0.15
9
Fluo
roan
then
e47
53.1
(34
.8,6
6.3)
<0.
000*
*42
62.1
(42
.5,7
5.0)
<0.
000*
*43
31.7
(−
1.9,
54.
2)0.
061
Pyre
ne47
48.2
(27
.6, 6
3.0)
0.00
0**
4362
.3 (
40.3
, 76.
2)<
0.00
0**
4432
.7 (
5.8,
51.
9)0.
022*
Ben
zo[a
]ant
hrac
ene
.43
55.4
(35
.7,6
9.1)
<0.
000*
*36
65,0
(49
.7, 7
5.6)
<0.
000*
*36
27.3
(0.
8,46
.7)
0.04
5*
Chr
ysen
e44
57.4
(41
.0,6
9.2)
<0.
000*
*37
64.0
(46
.0, 7
6.0)
<0.
000*
*37
9.7
(−28
.5, 3
6.6)
0.56
2
Ben
zo[b
]flu
oran
then
e37
63.0
(39
.2, 7
7.4)
0.00
0**
3161
.2 (
34.6
, 76.
9)0.
001*
*30
22.1
(−
18.3
,48.
8)0.
232
Ben
zo[k
]flu
oran
then
e35
60.9
(37
.9, 7
5.5)
0.00
0**
2960
.9 (
33.6
, 77.
0)0.
001*
*27
16.7
(−
35.5
, 48.
8)0.
446
Ben
zo[a
]pyr
ene
2852
,9 (
19.5
,72.
5)0.
008*
*28
63.1
(33
.8, 7
9.4)
0.00
2**
2439
.9 (
1.6,
63.
3)0.
043*
Inde
no[l
,2,3
-cd]
pyre
ne24
61.8
(33
.6,7
8.1)
0.00
2**
1954
.1 (
18.4
, 74.
2)0.
011*
1731
.7 (
−26
.8, 6
3.7)
0.21
0
Ben
zoh[
g,h,
i]pe
ryle
ne13
20.8
(−
68.3
, 62.
8)0,
514
1142
.4 (
−38
.4, 7
6.0)
0.19
112
28.0
(−
72.6
, 70.
0)0.
425
Dib
enzo
[a,h
]ant
hrac
ene
2449
.9 (
18.7
,69.
1)0.
007*
*23
35.4
(−
25.9
, 66.
8)0.
188
2018
.6 (
−49
.6, 5
5.7)
0.48
9
Tot
al P
AH
se49
58.6
(43
.8, 6
9.5)
<0.
000*
*47
69.1
(54
.1,7
9.1)
<0.
000*
*48
31.7
(4.
8,51
.0)
0.02
5*
Dus
t50
55.5
(44
.5, 6
4.4)
<0.
000*
*50
64.4
(56
.2,7
1.5)
<0.
000*
*50
20.5
(9.
1, 3
0,5)
0.00
1**
HD
M a
llerg
ens
1580
.8 (
64.1
, 89.
7)<
0.00
0**
1585
.5 (
72.3
, 92.
4)<
0.00
0**
1524
.7 (
−24
.2, 5
4.4)
0.24
4
Dus
tf15
54.5
, (34
.8, 6
8.2)
0.00
0**
1562
.0 (
46.1
, 73.
2)<
0.00
0**
1516
.5 (
−2.
6, 3
2.0)
0.08
1
a N is
the
num
ber
of p
aire
d ca
rpet
s an
alys
ed.
b % r
educ
tion
is th
e pe
rcen
tage
dec
reas
e ac
hiev
ed o
n ea
ch c
arpe
t, as
a m
ean
valu
e an
d 95
% c
onfi
denc
e in
terv
als
in p
aren
thes
es.
J Environ Monit. Author manuscript; available in PMC 2014 May 28.
NIH
-PA
Author M
anuscriptN
IH-P
A A
uthor Manuscript
NIH
-PA
Author M
anuscript
Yu et al. Page 13c %
dif
fere
nce
is th
e fu
rthe
r re
duct
ion
perc
enta
ge a
chie
ved
by H
EPA
–ste
am–H
EPA
pro
toco
l com
pare
d w
ith th
e ca
rpet
cle
anin
g by
HE
PA–H
EPA
pro
toco
l, as
a m
ean
valu
e an
d 95
% c
onfi
denc
e in
terv
als
inpa
rent
hesi
s.
d p va
lue<
0.05
* an
d p
valu
e<0,
01.*
*
e The
sum
of
all s
ixte
en P
AH
s an
alys
ed in
the
stud
y.
f Lim
ited
to c
arpe
ts w
ith d
etec
tabl
e pr
e-cl
eani
ng H
DM
alle
rgen
s.
See
foot
note
s to
Tab
le 1
.
J Environ Monit. Author manuscript; available in PMC 2014 May 28.
NIH
-PA
Author M
anuscriptN
IH-P
A A
uthor Manuscript
NIH
-PA
Author M
anuscript
Yu et al. Page 14
Table 3
PAH and dust loadings in a subset of 20 carpets from which supplementary samples were collected
immediately after dry steam cleaning
Carpet cleaning status Total PAHs GMa Dust GMa
Baselineb 1.01 0.77
HEPA followed by repeat HEPAc 0.48 0.37
HEPA followed by dry steam without second HEPA vacuuming 0.40 0.33
HEPA followed by dry steam followed by second HEPA vacuumingd 0.33 0.28e
aThe unit of loading is µg ft−2 for total PAHs and g ft−2 for dust.
bLoadings of total PAHs and dust before carpet cleaning.
cHEPA–HEPA protocol.
dHEPA–steam–HEPA protocol.
eDiffers significantly from HEPA vacuuming only (p = 0.0437) by paired t-test.
J Environ Monit. Author manuscript; available in PMC 2014 May 28.
NIH
-PA
Author M
anuscriptN
IH-P
A A
uthor Manuscript
NIH
-PA
Author M
anuscript
Yu et al. Page 15
Tab
le 4
Perc
ent r
educ
tions
in to
tal P
AH
s, H
DM
alle
rgen
s an
d du
st lo
adin
gs f
or d
iffe
rent
car
pet t
ypes
by
clea
ning
inte
rven
tions
Car
pet
cont
amin
ants
Cle
anin
g in
terv
enti
ons
Per
cent
red
ucti
on
Lev
el-l
oop
vs.
Cut
-pile
(p
valu
e)b
Lev
el-l
oop
Cut
-pile
NM
ean
(95%
CI)
aN
Mea
n (9
5% C
I)a
Tot
al P
AH
sH
EPA
–HE
PA31
58.8
(40
.6, 7
1.4)
1858
.3 (
23.9
, 77.
2)0.
267
HE
PA–s
team
–HE
PA31
69.2
(50
.4, 8
0.9)
1668
.8 (
31.9
, 85.
7)0.
647
HD
M a
llerg
ens
HE
PA–H
EPA
884
.1 (
63.8
, 93.
0)7
76.0
(19
.7, 9
2.8)
0.40
0
HE
PA–s
team
–HE
PA8
84.9
(58
.3, 9
4.6)
786
.1 (
57.5
, 95.
5)1.
000
Dus
tH
EPA
–HE
PA32
59.4
(45
.3, 6
9.9)
1847
.7 (
26.3
, 63.
0)0.
125
HE
PA–s
team
–HE
PA32
65.0
(53
.6, 7
3.6)
1864
.0 (
48.4
, 74.
8)0.
284
a The
per
cent
age
decr
ease
aft
er c
arpe
t cle
anin
gs, a
s a
mea
n va
lue
and
95%
con
fide
nce
inte
rval
s in
par
enth
eses
.
b Wilc
oxon
two-
sam
ple
test
s w
ere
cond
ucte
d be
twee
n re
duct
ion
perc
enta
ges
by c
arpe
t typ
e.
See
foot
note
s to
Tab
le 1
.
J Environ Monit. Author manuscript; available in PMC 2014 May 28.


![Polycyclic aromatic hydrocarbons (PAH) guidance · Polycyclic aromatic hydrocarbons (Benzo[a]pyrene) General Information Key Points Identity The term polycyclic aromatic hydrocarbons](https://static.cupdf.com/doc/110x72/5af498db7f8b9a8d1c8c6b2b/polycyclic-aromatic-hydrocarbons-pah-guidance-aromatic-hydrocarbons-benzoapyrene.jpg)