Int. Journal of Economics and Management 1(1):91-116(2006) ISSN 1803 - 836X
Evaluation of Factors Affecting Corporate Performance
of Malaysian Listed Companies
M.Z. MOKHTAR, N. F. NIK MOHD KAMIL AND M. S. MUDA
Facuity of Management and Economics, Kolej Universiti Sains dan
Teknologi Malaysia, Kuala Terengganu, Terengganu, Malaysia
ABSTRACT
This study investigates factors that affect corporate performance in
Malaysia. The study utilized three measures of company performance
- Return on Assets (ROA), Return on Sales (ROS), and Economic
Value Added (EVA), to act as dependent variables in order to
examine their relationships with the independent variables. The
results suggest that significant variables that determine Malaysian
corporate success are ISO 9000, capital structure, company size and
category of industry. In establishing the relationship between ISO
9000 registration and performance, all the three measures appear to
have significant positive associations with ISO 9000 registration.
As for the relationship between capital structure and the performance
measures, ROA and ROS have significant negative associations with
capital structure. Other factors that determine Malaysian corporate
success are company size and category of industry.
Keywords: Corporate Performance, Size, Age, Growth,
Capital Structure
INTRODUCTION
As global competition intensifies, an increasingly important issue for companies
is performance. The two major force.s that Malaysian businesses face are the
rapid rate of technological change and increasing industrialization. The rate of
change is likely to accelerate as further development occurs especially in
91
International Journal of Economics and Management
relation to the Multimedia Super Corridor (MSC). It has been suggested that the
MSC will in time become Malaysia's "Silicon Valley" with the traditional
agricultural commodities giving way to new, technology-based industries.
Malaysia's acceptance of the Asian Free Trade Area (AFTA) Agreement in
January 2004 is another contributing factor. AFTA has laid out a
comprehensive program ofregional tariff reduction, to be carried out in phases
through to the year 2008. This deadline was subsequently moved forward to 2004
for Malaysia. Several years later, the program of tariff reductions was broadened
and accelerated, and a host of "AFTA Plus" activities was initiated. This includes
efforts to eliminate non-tariff barriers and quantitative restrictions, harmonize
customs nomenclature, valuation and procedures, and develop common product
certification standards, which could be certified by the International
Organization for Standardization (ISO).
The objective of this study is to determine and analyse empirically the
factors that affect the performance of Malaysian companies. Inparticular, the
study analyses company attributes such as size, capital structure, age, growth,
industrial category and ISO registration and correlates them with corporate
performance measures. Therefore, this study identifies the effects of factors such
as size, capital structure, age, growth, industry category and ISO 9000
registration on corporate performance.
The paper is organized as follows. The factors influencing financial
performance is discussed in the following section. The formulation ofresearch
hypotheses is presented in section 3. Data collection and development of models are
discussed in section 4, followed by the findings, the conclusions, and the
implications.
FACTORS INFLUENCING FINANCIAL PERFORMANCE
In attempting to answer the main research question as to why some firms
perform better than their counterparts, six internal and external factors were
selected. The six company attributes are size, growth, capital structure, age, the
industrial category in which the company operates, and ISO 9000 registration.
92

Evaluation of Factors Affecting Corporate Performance of Malaysian Listed Companies
Company Size
The hypothesis that corporate performance increases with the size of the firm was
developed by Baumol (1956), who concluded that the rate of return of a firm
increases with the firm's size. Hall and Weiss' (1967) studied the relationship
between firm size and profitability on the Fortune 500 Largest Industrial
Corporations for the years 1956 to 1962. They concluded that size did contribute
to high profit rates. Marcus' (l969) study on profitability (ratio of net profits
before tax plus interest payment to total assets) and the size of firms found that
the size of firm influences profitability in some, though not in all manufacturing
industries. Gupta (1969) carried out a study on the effect of size, growth and
industry on the financial structure of a hundred and seventy three American
manufacturing companies for the year 1961 - 1962. Among the findings, activity
ratios and leverage ratios were found to decrease with an increase in the size of
the firm, but tend to increase with the growth of the firm. Liquidity ratio rose
with an increase in the size of the firm but fell with the growth rates. In addition
the bigger firms generated higher profit margin on sales compared to the smaller-
sized firms.
Company's Growth
The most commonly used alternative measure of profitability is the growth
rate. The growth rate used in this study is based on growth in sales. Dess and
Davies (l986) studied the determinants of strategic group membership and
organizational performance of U. S. firms. Based on sales growth, the overall F-
ratio indicated that the groups were significantly different from one another.
Furthermore, Johnson and Soenen (2003) carried out a study on the indicators of
successful companies using Compustat data for 478 companies covering the
period 1982-1998. Factors that discriminate between financially successful and
less successful companies were investigated. Financial success was measured
using three different indicators - the Sharpe ratio, Jensen's alpha, and EVA.
Itwas found that large, profitable firms with efficient working capital management
(i.e., relative short cash conversion cycles) and a certain degree ofuniqueness
(measured by advertising spending relative to sales) outperformed the sample
average on the three performance measures.
93

International Journal of Economics and Management
Company's Capital Structure
Another variable used in the present study is capital structure. Capital structure
ratio is interpreted as the debt-equity ratio. Bajaj et al. (1998) who analyzed the
relationship between ownership, financing decisions and firm performance used
performance measures such as Tobin's Q ratio, and elements of financial structure
such as debt-structure, that is the debt-equity ratio. Bajaj et al. (1998) found that
ownership, which is a signal of firm's 'quality', is positively correlated with Tobin's
Q and also positively correlated with various measures of debt equity ratio.
Company's Age
Another important variable used in this study is the firm's age since
incorporation. Brush and Chaganti (1999) used age, size (based on number of
employees), and industry as factors influencing the performance of 195 service
and retail firms operating in central New Jersey, using a structured
questionnaire. The dependent variable performance was measured in two ways: net
cash flow and log of growth in employees over 3 years. Their analyses
showed that growth was more rapid among the youngest firms.
Industry Category
Industry category or classification is another variable used in this study. The
industry category used includes industrial product, consumer product,
construction, trading and services, plantation and other industries. Porter (1979)
suggested that links exist between a firm's profits and industry structure, and
thus firms in some strategic groups would be more profitable than others.
However, Shepherd (1972) argued that market power is firm-specific and is
dependent on the firm's own market share, implying that profit rates increase
systematically with size within an industry. Yet Marcus (1969) found that the
relationship between firm size and profitability within an industry is erratic,
with some industries exhibiting positive relations, some indicate negative
relations and others apparently showed no statistically significant relations.
However, Mancke (1974) argues that firms that are 'lucky' in their drawings
from probability distributions surrounding competitive moves such as new
94

Evaluation of Factors Affecting Corporate Performance of Malaysian Listed Companies
product introductions will be more profitable. These lucky firms will be able to
fund faster growth, and thus will outdistance their competitors and concentrate
the industry. Thus the leading firms in concentrated industries would be more
profitable because they are 'lucky' and not because they possess real market power.
Table 1 Different Factors That Influence Corporate Performance
Construct Variable - Firm's Size
Firm size and Rate of Return
Firm size and Profitability
Firm size and rate ofretum
Firm size and strategy
Firm size and Stock price performance
Firm size and strategic groups
Firm size and diversification strategy
Firm size and profitability
Firm size and financial structure
Construct Variable - Sales Growth
Growth and conglomerate firms
Growth and managerial pay
Growth and profitability
Growth and strategic groups
Construct Variable - Firm's Capital Structure
Debt Equity and Control type
Market value measurement of debt
Debt Equity and profitability
Debt Equity and ownership
Debt Equity and inflation impact
Construct Variable - Firm's Age
Age and Informativeness ofF/S
Age and CEO compensation
Age and entrepreneurship
Construct Variable - ISO 9000 Accreditation
ISO and Productivity improvements
ISO and Export sales
ISO and company performance
ISO and financial performance
Construct Variable - Industry Category
Industry and profitability
Industry and Firm profits
Industry and firm performance
Representative Study
Baumol, 1956
Hall and Wess, 1967
Hensen and Wemerfelt, 1989
Grinyer et al., 1980
Coughlan and Schmidt, 1985
Lewis and Thomas, 1990
Christensen & Montgomery, 1981
Marcus, 1969
Gupta, 1969
Weston and Mansinghka, 1971
Murphy, 1985
Lee et al., 1990
Dess and Davies, 1986
Kania and McKean, 1978
Mulford, 1985
Lee et al., 1990
Bajaj et al., 1998
Oguie et al., 2001
Black et al., 1997
Rupp and Smith, 2002
Murphy et al., 1996
Corbett et al., 2002
Cebeci and Beskese, 2002
Jeng, 1998
Lima et al., 2000
Bain, 1956
Porter, 1979
Hensen and Wemerfelt, 1989
95

International Journal of Economics and Management
Industry and business unit performance
Industry and firm level performance
Note: This table has been developed from Ketchen et al. (1993)
Schmalensee, 1985
Scherer, 1980
DEVELOPMENT OF THE STUDY HYPOTHESES
Based on the theoretical approach and the literature review on the performance
evaluation studies, this research developed hypotheses based on three financial
corporate performance variables which act as dependent variables:
1. Return on Assets (ROA)
2. Return on Sales (ROS)
3. Economic Value Added (EVA)
The independent variables were divided into twelve groups in order to capture the
dimensions of all theoretical perspectives of company attributes, which include:
1. Company size
2. Company age
3. Capital Structure
4. Company growth
5. ISO 9000 registration
6. Seven industry categories which include industrial product, consumer product,
construction, trading and services, plantation and other industries.
Company Size
The size of a company has persistently been found to have a positive association with the
ROA or profitability of a company (Baumol, 1956; Hall and Weiss 1967; Marcus,
1969; Hensen and Wernerfelt, 1989; Laitinen, 2002). Baurnol (1956) found that the
rate of return of a firm increases with the firm's size. Hall and Weiss' (1967), in
their study of the Fortune 500 Largest Industrial Corporations, found that size did
tend to result in high profit rates. Marcus (1969), in a study on ROA and the size
of firms, found that there is sorne evidence of positive association between size
and the profitability of firill· However, Gupta ( 1969) found that large-sized firms
tend to have higher profit margin on sales than the small-sized firms. Hensen and
Wernerfelt (1989) also used firm size and return on total assets as their measure of
performance and
96

Evaluation of Factors Affecting Corporate Performance of Malaysian Listed Companies
found that size is negatively related to ROA. Inaddition, Laitinen (2002) used
company size as one of the measures of success in investigating the possibilities
of a uniform financial rating of technology companies in Europe from the
perspective of a potential investor. Johnson and Soenen (2003) used EVA and
company size based on total assets, and found that large firms outperformed
the sample average firms on EVA.
Based on the foregoing discussion, this study hypothesizes that the size of
a firm is positively associated with the ROA, ROS and EVA of a company.
This study measures size by the ttal assets of a company, a measure used in a
large number of studies (e.g. Baumol, 1959; Gupta, 1969; Grinyer et al., 1980;
Hensen and Wemerfelt, 1989; Laitenen, 2002; and Johnson and Soenen, 2003).
Company Age
The age of a company has also been hypothesized to be positively associated
with the performance variables (ROA, ROS and EVA) of a company. Carroll
(1983) concluded that the most common finding of the major empirical studies
of mortality is that the death rate of business organizations declines with
increasing age, with organizations more likely to fail in their first few years of
operation. However, Meyer and Zucker (1989) did not expect an organization's
age to necessarily be related to its success. Furthermore, Kalleberg and Leicht
(1991), in their study on determinants of small business survival and success,
found that older companies were less likely to go out of business compared to
younger companies. Brush and Chaganti's (1999) study on factors influencing
the performance of service and retail firms in New Jersey found that growth of
firm was more rapid amongst the youngest firms. Based on these studies, it is
hypothesized that the age of a company is positively associated with ROA,
ROS and EVA.
Capital Structure of a Company
This study hypothesizes that there is a positive association between the capital
structure of a company and its ROA, ROS and EVA. Capital structure is
measured in terms of ratio of debt to total assets, because some companies in
Malaysia were insolvent and had a negative amount of equity due to the 1997
financial crisis. As such measuring capital structure as debt to equity ratio
97

International Journal of Economics and Management
might be misleading (Ku Nor Izah, 2003). The hypotheses was created based on
Bajaj et al. (1998), who found that ownership, which is a signal of firm's
'quality', is positively correlated with various measures of the debt-equity ratio.
Additionally, Johnson and Soenen (2003) found a statistically significant
positive relationship between capital structure and economic value added. Based on
these arguments, this study hypothesised that capital structure is positively
associated with ROA, ROS and EVA.
Growth of a Company
This study hypothesises that there is a positive association between the growth of
a company and its performance measures (ROA, ROS and EVA). Growth is
generally associated with performance and is based on sales growth. Dess and
Davies (1984) found that based on sales growth; there is a significant
difference among the strategic group in their study. However, Grinyer et al.
(1988) found a positive association between profit margins and growth based on
their study on the economic performance of the U.K. Electrical Engineering
Industry. In addition, Johnson and Soenen (2003) found that large, profitable
firms with efficient working capital management outperformed the sample
average firms on the three performance measures (the Sharpe ratio, Jensen's
alpha, and EVA). Based on the foregoing discussion, this study hypothesises
that the growth of a company is positively associated with corporate
performance measure (ROA, ROS and EVA).
ISO 9000 REGISTRATION
In numerous performance studies, ISO has been persistently found to have a
positive association with ROA (Spinard and Sutter, 1996; Haversjo, 2000;
Kearney, 2001; Heras et al., 2002; Corbett et al., 2002 and Mokhtar et al.,
2005). Heras et al. (2002) examined whether the ISO 9000 had led to
improvements in the audited financial performance of 400 certified and 400
non-certified Basque firms over a period of five years. They concluded that
the ISO 9000 registered companies were more profitable than the non-registered
companies. Corbett et al. (2002) also found that after ISO 9000 registration,
companies tended to report abnormal improvements in ROA, and more
98

Evaluation of Factors Affecting Corporate Performance of Malaysian Listed Companies
importantly, these improvements were found to be lasting. In a similar manner,
Raversjo (2000) also used ROA to study the financial performance of 644
Danish registered companies compared to a similar group of non-registered
companies. In addition, he examined whether ISO 9000 registered companies
Were more profitable than non-registered companies. The overall findings were
that registered companies had better earnings than similar non- registered
companies. Besides that, Eriksson and Hansson (2003) used ROS as an indicator
for measuring the impact of TQM on financial performance of Swedish
companies. They found that the award recipients (Swedish Quality Award)
outperformed their competitors for most of the years studied. Mokhtar et al.
(2005), in their study of the impact oflSO 9000, found that ROS did determine
the performance of Malaysian companies. Based on the foregoing discussion,
this study hypothesises that ISO 9000 registration is positively associated with
ROA, ROS and EVA.
INDUSTRIAL CATEGORY
The industrial category of a company has also been hypothesized to have an
association with the ROA, ROS and EVA of the company. Marcus (1969)
found that the relationship between firm size and profitability within an industry
iserratic, with some industries exhibiting positive relations, some negative
relations and others no apparent statistically significant relation at all. However,
Porter (1979) suggested that links exist between a firm's profit and industry
structure, and firms in some strategic groups would be more profitable than
others. Besides that, Schmalensee (1985) found that differences between
industries, as measured by average industry return on assets, account for almost
all the explained variance in business unit performance. Hensen and Wemerfelt
(1989) used accounting rates ofretum and industry variables as their measures
of performance in their study on determinants of firm performance. However,
Liber's (1996) study on the 200 largest US corporations, ranked by economic
value added and market value added, found that the champion in the category
of wealth destroyed by an industry is the automobile business. Based on these
findings, this study hypothesises that category of industry is associated with
the ROA, ROS and EVA of a company. The selected categories of industry
9 9

International Journal of Economics and Management
used in this study are industrial products, consumer products, construction,
property, trading and services, plantation and other industries.
Model 1 - ROA as the Dependent Variable.
Based on the works of Heras et al. (2002), Corbett et al. (2002) and Mokhtar et
al. (2005) among others, this study hypothesises that Return on Assets (ROA) is
positively associated with ISO 9000, size, capital structure, age, growth, and
the seven categories of industry.
Hypotheses Testing on Model 1- ROA as the Dependent Variable
From the foregoing discussion, the hypotheses to be tested, stated in their null
forms, are:
H la: There is no association between ROA and ISO 9000 registration of a
company
Hlb: There is no association between ROA and the size of a company
H l c: There is no association between ROA and the capital structure of a
company
H ld There is no association between ROA and the growth of a company
H le: There is no association between ROA and the age of a company
H 1f: There is no association between ROA and industrial product companies
H 1g: There is no association between ROA and consumer product companies
Hlh: There is no association between ROA and construction companies
H li: There is no association between ROA and property companies
Hlj: There is no association between ROA and trading and services
companies
H lk: There is no association between ROA and plantation companies
H 11: There is no association between ROA and companies in other industries
Model 2 - ROS as the Dependent Variable.
Referring to the works by Lima et al. (2000), Kearney (2001), Eriksson and
Hansson (2003), Naser et al. (2004) and Mokhtar et al. (2005), this study
hypothesises that Return on Sales (ROS) is positively associated with ISO
9000, size, capital structure, age, growth, and the seven categories of industry.
100

Evaluation of Factors Affecting Corporate Performance of Malaysian Listed Companies
Hypotheses Testing on Model 2- ROS as the Dependent Variable.
From the foregoing discussion, the hypotheses to be tested, stated in their null
forms, are:
H2a: There is no association between ROS and ISO 9000 registration of a
company
H2b: There is no association between ROS and the size of a company
H2c: There is no association between ROS and the capital structure of a
company
H2d: There is no association between ROS and the growth of a company H2e:
There is no association between ROS and the age of a company
H2f: There is no association between ROS and industrial product companies
H2g: There is no association between ROS and consumer product companies
H2h: There is no association between ROS and construction companies H2i:
There is no association between ROS and property companies
H2j: There is no association between ROS and trading and services
companies
H2k: There is no association between ROS and plantation companies
H2l: There is no association between ROS and companies in other industries
Model 3 - EVA as the Dependent Variable
Based on the works of, among others, Dess and Davies ( 1984), Bhandari (1988),
Hensen and Wernerfelt (1989), Kalleberg and Leicht ( 1991), Johnson and
Soenen (2003), Naser et al. (2004) and Mokhtar et al. (2005), the third model
hypothesises that EVA is associated with ISO 9000, size, capital structure,
growth, age and industrial category of a company.
Hypotheses Testing on Model 3 - EVA as the Dependent Variable
From the foregoing discussion, the hypotheses to be tested, stated in their null
forms, are:
H3a: There is no association between EVA and ISO 9000 registration of a
company
H3b: There is no association between EVA and the size of a company
H3c: There is no association between EVA and the capital structure of a
company
101

International Journal of Economics and Management
H3d: There is no association between EVA and the growth of a company
H3e: There is no association between EVA and the age of a company
H3f: There is no association between EVA and industrial product companies
H3g: There is no association between EVA and consumer product companies
H3h: There is no association between EVA and construction companies
H3i: There is no association between EVA and property companies
H3j: There is no association between EVA and trading and services companies
H3k: There is no association between EVA and plantation companies
H31: There is no association between EVA and companies from other
industries
DATA COLLECTION AND SAMPLE SELECTION
METHOD
This study uses the secondary data obtained from various sources. The
SIRIM database (http://www.malaysiancertified.com.my) provides a listing
of all ISO 9000 registered companies in Malaysia. The list of potential
companies and all associated financial data were acquired from the Bursa
Malaysia (previously called Kuala Lumpur Stock Exchange) database
(http://bursamalaysia.com), thus ensuring that all the data were comparable.
Data for the years 1998-2001 were used in this study. This time frame was
chosen in order to exclude the period before 1997, the year of serious
economic crisis in Malaysia.
As at the end of 2002, this study identified a random sample consisting
of 162 companies listed on the Bursa Malaysia database, which had a
population of 736 companies listed in 1998
(http://www.klse.com.my/website/listing/ listingstats.htm). The sample
collected accounts for 22 percent of the population. Two samples were
extracted from the database (http://www.klse ris.com.my); one sample was
comprised of 81 ISO 9000 certified companies selected from the SIRIM
database (http://www.malaysiancertified,com.my), and the second sample
consisted of a comparable group of 81 companies that were not registered
with ISO 9000. By the end of 1998, there were 1,707 ISO accredited
companies on the Malaysian Standard (SIRIM) database, also available
at the ISO 9000 Ninth Cycle Survey (http://www.eos.org.eg.lweb_en/
pdf/survey9.pdj), but most of them were not listed on the Kuala Lumpur
Stock Exchange.

102

Evaluation of Factors Affecting Corporate Performance of Malaysian Listed Companies
Findings
The findings of this study which is based on the statistical analysis, starting with
descriptive statistics on the three financial corporate performance measures (ROA,
ROS, and EVA), and twelve company attributes which include size, age, growth,
capital structure, ISO 9000 and the seven categories of industries. Following this,
Pearson's correlations among the dependent and independent variables are
explained in order to illustrate the relationships between all the variables.
Subsequently, the study hypotheses and regression results on the model
development were presented.
Descriptive Statistics
As for the continuous variables, descriptive statistics have been used to describe the
sample data. The descriptive statistics of the variables used in this study are
given in Table 2. With respect to variable ROA, which is the return on assets;
the range of ROA scores is between -.8066 and .2841, with a mean of
-0.043 and a standard deviation of 0.1720. As for ROS, which is the return on
sales, the range of ROS scores is -5.2151 and 1.4650, with a mean of -0.2756 and
a standard deviation of 0.8646. Looking at EVA, which is the economic value
added (Net profit after tax less cost of capital), the range of EVA scores is between
-893,347,000 and 820,425,000, with a mean of -26,633,459 and a standard
deviation of 183,837,622. SIZE (the size of the company based on total assets)
ranges between 4,358,075 and 38,670,900,000, with a mean of 1,401,574,715
and a standard deviation of 4,028,687,121. The variable age, which is the age of
the company since incorporation, the number of companies used in the study
sample is 162, and the range of ages is from 4 to 94 years, with a mean of 28.44
and a standard deviation of 17.94. Looking at growth, which is the growth of
the company based on sales growth, the range of GROWTH scores is between
-0.52 and 11.90, with a mean of 0.1557 and a standard deviation of 1.1059. As for
CAPSTRUC, this is the ratio of total debt to total assets; the range of CAPSTRUC
scores is between 0.0803 and 17.4579, with a mean of 1.0327 and a standard
deviation of 1.7438.
103

Table 2 Descriptive statistics of all the variables used in this study
N Minimum Maximum Mean Std. Dev. Skewness Kurtosis
Stat. Statistic Statistic Statistic Statistic Statistic Statistic
Evaluation of Factors Affecting Corporate Performance of Malaysian Listed Companies
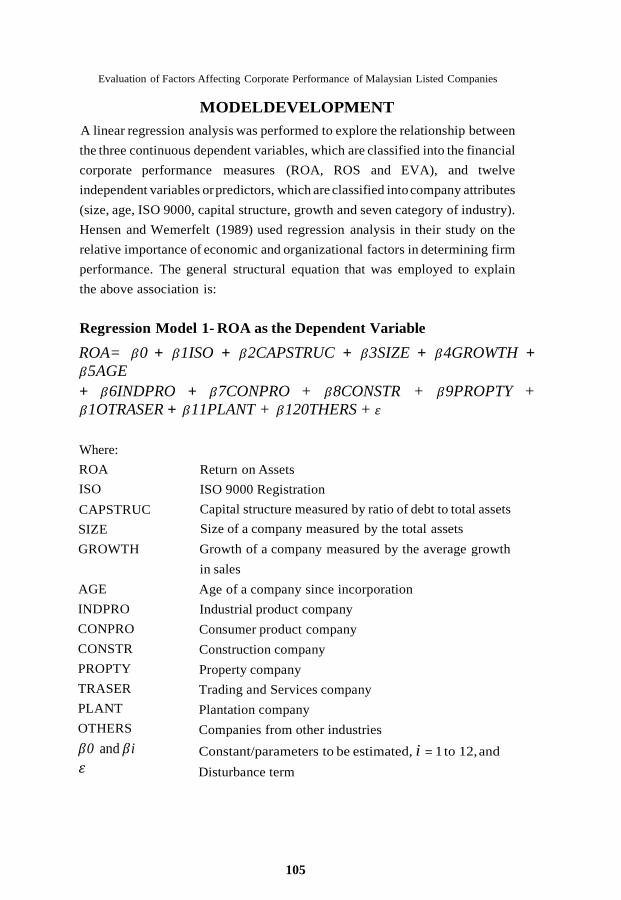
MODEL DEVELOPMENT
A linear regression analysis was performed to explore the relationship between
the three continuous dependent variables, which are classified into the financial
corporate performance measures (ROA, ROS and EVA), and twelve
independent variables or predictors, which are classified into company attributes
(size, age, ISO 9000, capital structure, growth and seven category of industry).
Hensen and Wemerfelt (1989) used regression analysis in their study on the
relative importance of economic and organizational factors in determining firm
performance. The general structural equation that was employed to explain
the above association is:
Regression Model 1- ROA as the Dependent Variable
ROA= 𝛽0 + 𝛽1ISO + 𝛽2CAPSTRUC + 𝛽3SIZE + 𝛽4GROWTH +
𝛽5AGE
+ 𝛽6INDPRO + 𝛽7CONPRO + 𝛽8CONSTR + 𝛽9PROPTY +
𝛽1OTRASER + 𝛽11PLANT + 𝛽120THERS + 휀
Where:
ROA
ISO
CAPSTRUC
SIZE
GROWTH
AGE
INDPRO
CONPRO
CONSTR
PROPTY
TRASER
PLANT
OTHERS
𝛽0 and 𝛽i
휀
Return on Assets
ISO 9000 Registration
Capital structure measured by ratio of debt to total assets
Size of a company measured by the total assets
Growth of a company measured by the average growth
in sales
Age of a company since incorporation
Industrial product company
Consumer product company
Construction company
Property company
Trading and Services company
Plantation company
Companies from other industries
Constant/parameters to be estimated, i = 1 to 12, and
Disturbance term
105

International Journal of Economics and Management
Analysis ofregression results on Model 1 (ROA) as the dependent variable
A linear regression analysis was performed to estimate the coefficients and the
direction ofrelationships between the dependent and the independent variables
in each of the three regression models specified in the study.
Various tests have been performed to assess the severity of the
multicollinearity problem. Referring to the correlation analysis shown in Table
3, the results suggest a low correlation among the variables. The largest reported
value (0.730) is between ROA and the Capital Structure variable. In this respect,
Kennedy (1985) suggests that correlation values below 0.80 do not pose a
potential multicollinearity problem. While the correlation matrix can be used
to detect potential multicollinearity problems between two explanatory
variables, the absence of high correlations does not always mean that there is
no multicollinearity. To deal with this problem, a diagnostic procedure that
utilises the Variance Inflation Factor (VIF) was also undertaken. VIFs for all
variables, as reported in Table 5 are below 8.993. According to Silver (1997)
multicollinearity is viewed as a serious problem only when the VIF exceeds
10. Hence, the explanatory variables used in this study do not seem to pose a
serious multicollinearity problem and this allows for standard interpretation
of the regression coefficients.
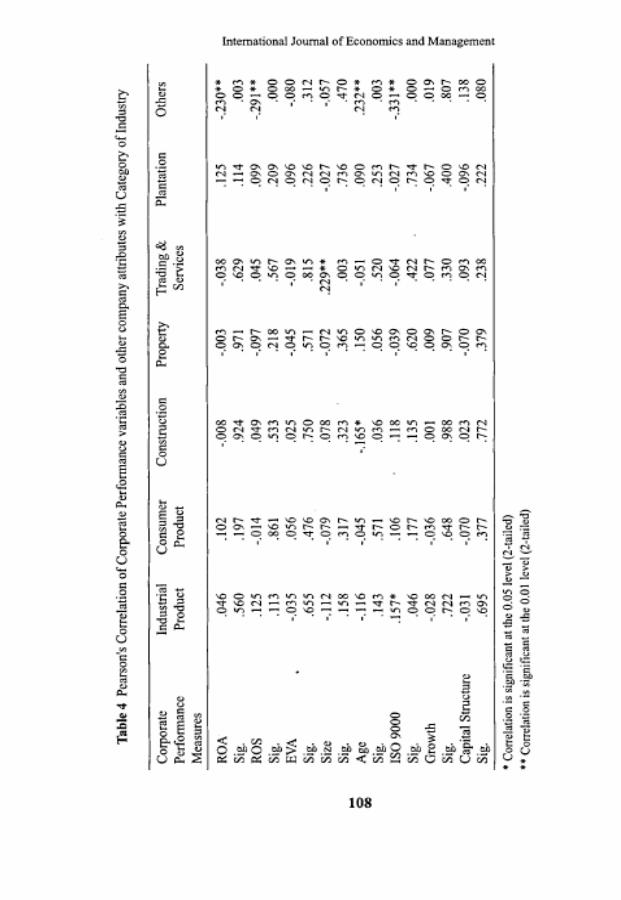
Table 3 Pearson's Correlations of Corporate Performance variables with Size,
Capital Structure, Age, Growth and ISO 9000
Corporate
Performance Measures Size Capital
Structure Age Growth ISO 9000
ROA .122 -.730** -.030 .134 .471** Sig. .123 .000 .709 .090 .000 ROS .115 -.384** -.128 .022 .443** Sig. .145 .000 .105 .777 .000 EVA .169* -.177* -.024 .071 .382** Sig. .031 .024 .763 .371 .000 Capital Structure -.062 Sig. .434 Age -.008 -.078 Sig. .923 .323 Growth -.016 -.075 -.135 Sig. .842 .342 .087
106

Evaluation of Factors Affecting Corporate Performance of Malaysian Listed Companies
ISO 9000
Sig.
.157*
.046
-.232**
.003
-.164*
.037
.136
.084
* Correlation is significant at the 0.05 level (2-tailed)
** Correlation is significant at the 0.01 level (2-tailed)
With regard to the fitness of the model, the significance value of the model
(Significant F) is at p<0.000, is less than 0.05 (Table 5). It can be concluded that
the model could fit the data. In this model, the R-square (R") value shows that
64.3 percent of the variation in ROA was explained by all the company
attributes, which include age, ISO 9000, size, growth, capital structure and the
category of industry that the company operates in. The adjusted R" value of
0.614 and the F value of 22.371 mean that the model describes 61.4 percent of the
variance in ROA and is significant at the 5 percent level. There is insufficient
evidence to support the hypotheses that ROA is directly related to the company's age,
company's size, company's growth, and the category of industry that the
companies are operating in, namely industrial products, consumer products,
construction, property, trading and services, plantation and other industries.
Thus, the null hypotheses (Hlb, H id, Hie, Hlf, H lg, H l h, H l i, H lj, H lk, Hll)
could not be rejected at a 5 percent significance level.
ISO 9000 and capital structure are the only variables significantly
associated with ROA. The beta coefficient for ISO 9000 shows a value of
0.302 and a significance level of p<0.000, suggesting that the relationship
between ISO 9000 and ROA is positive and is significant at the 5 percent
level. This implies that companies registered with ISO 9000 have a higher
ROA than companies that are not registered with ISO 9000. Although the
association is not strong, the findings support the hypothesis that ROA is
positively associated with ISO 9000 (Heras et al., 2002; Corbett et al., 2002). The
null hypotheses (Hla) and (Hie) that there is no association between ROA
and ISO 9000 is rejected at a 5 percent significance level. However, as for
capital structure, the beta coefficient shows a value of (0.646) and a
significance level of p<0.000, which means that the relationship between capital
structure and ROA is negatively related and is significant at the 5 percent
level. Therefore companies with low capital structure have a higher ROA than
companies with high capital structure.
107

Evaluaion of Factors Affecting Corporate Performance of Malaysian Listed Companies
Regression Model 2 - ROS as the Dependent Variable.
Based on the study hypotheses created, the general structural regression
equation that was used to explain the above association is:
Regression Model 2
ROS = 𝛽0 + 𝛽11SO + 𝛽2CAPSTRUC + 𝛽3SIZE + 𝛽4GROWTH + 𝛽5AGE
+ 𝛽6INDPRO + 𝛽7CONPRO + 𝛽8CONSTR + 𝛽9PROPTY + 𝛽10TRASER
+ 𝛽11PLANT + 𝛽120THERS + 휀
Analysis of Regression Results, Model 2 - ROS as the Dependent
Variable
Table 5 reports the linear regression results for Model 2 where Return on
Sales (ROS) is the dependent variable and was regressed against twelve
independent variables. In order to determine the fitness of the model, referring to
Table 5 for the regression results, the significant value of the model (Significant
F) shows that p<0.000, which is less than 0.05, so it can be concluded that the
model does fit the data. The R-square (R") value shows that
33.4 percent of the variation in ROS was explained by all the company
attributes, which include age, ISO 9000, size, growth, capital structure and the
seven categories of industry within which the companies operate. The adjusted R"
value of 0.281 and the F value of 6.238 show that the model describes 28.1 percent
of the variance in ROS and is significant at the 5 percent level. There is not
enough evidence to support the hypotheses that ROS is directly related to the
company's age, company's size, company's growth, and the category of industry
that the companies are operating in, namely industrial products, consumer
products, construction, property, trading and services, plantation and other
industries. Thus, the null hypotheses (H2b, H2d, H2e, H2f, H2g, H2h, H2i, H2j,
H2k, H21) could not be rejected at a 5 percent significance level.
As shown in Table 5, ISO 9000 and capital structure are the only variables that
are significantly associated with ROS. The beta coefficient (0.335) and
significance level (p<0.000) suggest that the relationship between ISO 9000 and
ROS is positive and is significant at the 5 percent level. This implies that
109

International Journal of Economics and Management
companies that are registered with ISO 9000 have a higher ROS than companies
that are not. However, as for capital structure (ratio of debt to total assets), the
beta coefficient shows a value of -0.307 and significance level of p<0.000,
which means that the relationship between capital structure and ROS is
negatively related and is significant at the 5 percent level. This indicates that
companies with low debt to total assets ratios have a higher ROS than companies
with high debt to total assets ratios. Although the association is not strong, the
findings support the hypothesis that tiere is a relationship between ROS and
ISO 9000 (positive association) and between ROS and capital structure
(negative association). The null hypotheses (H2a and H2c) that there is no
relationship between ROS and ISO 9000 are rejected at a 5 percent significance
level. The beta coefficient also shows that ISO 9000 makes a stronger
statistically significant contribution than capital structure in contributing to
the prediction of the dependent variable (ROS).
110


'
International Journal of Economics and Management
Regression Model 3 - EVA as the Dependent Variable.
Based on hypotheses created by this study, the general structural equation that
was employed to explain the above association is:
Regression Model 3
EVA= 𝛽0 + 𝛽1ISO + 𝛽2CAPSTRUC + 𝛽3SIZE + 𝛽4GROWTH + 𝛽5AGE
+ 𝛽6INDPRO + 𝛽 7CONPRO + 𝛽8CONSTR + 𝛽9PROPTY + 𝛽10TRASER
+ 𝛽11PLANT + 𝛽12OTHERS + 휀
Analysis of Regression Results, Model 3, with EVA as the
Dependent Variable
Table 5 reports the linear regression results for Model 3 where Economic Value
Added (EVA) is the dependent variable and was regressed against twelve
independent variables, namely company's age, ISO 9000, company's size,
company's growth, company's capital structure and the industrial category of
the company.
The fitness of the model was examined. The significance value of the
model (Significant F) is p<0.001, which is less than 0.05 concludes that the
model could fit the data. As shown in Table 5, the R-square (R") value suggests
that 20.2 percent of the variation in EVA was explained by all the company
attributes, which include age, ISO 9000, size, growth, capital structure and the
category of industry within which the company operates. The adjusted R" value
of 0.138 and the F value of 3.147 mean that the model describes 13.8 percent
of the variance in EVA and is significant at the 5 percent level. There is no
sufficient evident to support the hypotheses that.EVA is directly related to the
companies' age, size, growth, capital structure or the category of industry that
the companies are operating in. Thus, the null hypotheses (H3b, H3c, H3d,
H3e, H3f, H3g, H3h, H3i, H3j, H3k, H31) could not be rejected at a 5 percent
significance level.
As indicated in Table 5, the only variable that is significantly associated
with EVA is ISO 9000. The beta coefficient (0.376) and significance level
(p<0.000) suggest that the relationship between ISO 9000 and EVA is positive
and is significant at the 5 percent level. This implies that companies that are
112
Evaluation of Factors Affecting Corporate Performance of Malaysian Listed Companies
registered with ISO 9000 have a higher EVA compared to companies that are not
registered with ISO 9000. Although the association is not strong, the findings support
the hypothesis that EVA is positively associated with ISO 9000. The null
hypothesis (Hla) that there is no association between EVA and ISO 9000 is
rejected at a 5 percent significance level.
CONCLUSIONS AND IMPLICATIONS
Based on the results of this study, several important conclusions can be made. In
Regression Model 1, ISO 9000 was found to be positively associated with ROA,
whereas capital structure was found to be negatively associated with ROA. This
indicates that companies that are registered with ISO 9000 are better in asset
management compared to companies that are not registered with that
international standard. The negative association between capital structure and
ROA means that companies whose capital structure is characterised by low
debt to total assets are better in their asset management than those with high debt
to total assets capital structure. This may arise due to the fact that ROA was
calculated on net income and high debt, which may be due to high interest cost,
and therefore the company incurs a lower ROA.
Under Regression Model 2, where ROS was the dependent variable, ISO
9000 was found to have a positive relation with ROS but capital structure is
negatively related with ROS. This shows that companies that are registered with
ISO 9000 are better in their sales utilization than companies that are not. The
negative relation between capital structure and ROS shows that low debt to total
assets capital structure companies perform better in their sales utilization than high
debt to total assets capital structure companies. As ROS was also based on net
income, high debt incurs high interest cost and therefore the company
generates a lower net income. In regression model 3, where EVA was the
dependent variable, ISO 9000 was the only variable among the twelve company
attributes that was found to have a positive relation with EVA. This indicates that
companies that are registered with ISO 9000 have a better economic value
added than companies that are not registered with ISO 9000. Based on these
results, investors are better off if they invest in large asset based companies that
are registered with ISO 9000. The lessons for the
113

International Journal of Economics and Management
companies are as follows. Since ISO 9000 brings good performance, it is
advisable for companies to be registered with ISO 9000. Companies which
have already registered with ISO 9000 should continue to target for TQM
registration. As for the policy makers, they should stress the importance of
ISO 9000 registration. The government should also consider giving incentives
to companies that have not yet registered with ISO 9000. Provision of subsidies
or reduction of cost of certification in order to secure the ISO 9000 registration
would facilitate this process.
REFERENCES
Bajaj, M., Chan, Y. S. and Dasgupta, S. (1998) The Relationship Between Ownership,
Financing Decisions and Firm Performance: A Signalling Model, International
Economic Review, 39, 723-745.
Baumol, W. J. (1956) On the Role of Marketing Theory, Journal of Marketing, 21,
413- 418.
Baumol, W. J. (1959) Business Behavior, Value and Growth. MacMillan: New York.
Bhandari, L. C. (1988) Debt/Equity Ratio and Expected Common Stock Returns:
Empirical Evidence, Journal of Finance, 43, 507-528.
Brush, C. G. and Chaganti, R. (1999) Business without Glamour? An Analysis of
Resources on Performance by Size and Age in Small Service and Retail Firms,
Journal of Business Venturing, 14, 233-25.
Carroll, G. R. (1983) A Stochastic Model of Organizational Mortality: Review and
Reanalysis, Social Science Research, 12, 303-329.
Cheng, N. S., Eng, L. L., Mak, Y. T. and Chong, C. L. (2003) Performance Measures
in
the Media and Software Division of Kao (Singapore) Private Limited, Journal of
Accounting Education, 21, 157-18.
Corbett, C. J., Montes, M. J., Kirsch, D. A. and Alvarez-Gil, M. J. (2002) Does ISO
9000 Certification Pay? ISO Management Systems, July-August, 31-39.
Dess, G. G. and Davis, P. S. (1984) Porter's (1980) Generic Strategies as Determinants
of Strategic Group Membership and Organizational Performance, Academy of
Management Journal, 27, 467-88.
Eriksson, H. and Hansson, J. (2003) The Impact of TQM on Financial Performance,
Measuring Business Excellence, 7, 36-50.
114

Evaluation of Factors Affecting Corporate Performance of Malaysian Listed Companies
Griffith, J. M., Fogelberg, L. and Weeks, H. S. (2002) CEO Ownership, Corporate
Control and Bank Performance, Journal of Economics and Finance, 26, 170-183.
Grinyer, P. H., Yasai-Ardekani, M. and Al-Bazzaz, S. (1980) Strategy, Structure, the
Environment, and Financial Performance in 48 United Kingdom Companies, The
Academy of Management Journal, 23, 193-220.
Gupta, M. C. ( 1969) The Effect of Size, Growth and Industry on the Financial Structure
of Manufacturing Companies, The Journal of Finance, 24, 517-529.
Hall, M. and Weiss, L. (1967) Firm Size and Profitability, The Review of Economics
and Statistics, 49, 319-331.
Haversjo, T. (2000) The Financial Effects of ISO 9000 Registration for Danish
Companies, Managerial Auditing Journal, 15, 47-52.
Hensen, G. S. and Wernerfelt, B. (1989) Determinants of Firm Performance: The
Relative Importance of Economic and Organizational Factors, Strategic Management
Journal, 10, 399-411.
Heras, I., Casadesus, M. and Dick, G. P. M. (2002) ISO 9000 Certification and the
Bottom Line: A Comparative Study of the Profitability of Basque Region Companies,
Managerial Auditing Journal, 17, 72-78.
International Organisation for Standardization (ISO) (2001) The ISO Survey of ISO
9000 and ISO I 4000 Certificates (Tenth Cycle), International Organisations for
Standardisation, Geneva.
Irwin Professional and Dunn and Bradstreet Information Services (1996) ISO 9000
Survey, Irwin Professional Publishing and Dunn and Bradstreet Information Services,
Parsippany, New Jersey.
Johnson, R. and Soenen, L. (2003) Indicators of Successful Companies, European
Management Journal, 21, 364-369.
Kalleberg, A. L. and Leicht, K. T. (1991) Gender and Organizational Performance:
Determinants of Small Business Survival and Success, Academy of Management
Journal, 34, 136-161.
Kearney, A. T. (2001) Global Winners, Manufacturing Engineering, Dearbon, 126, 16.
Kennedy, P. ( 1985) A Guide to Econometrics (2nd ed.). The MIT Press: Cambridge. I
Ketchen, D. J. Jr., Thomas, J. B. and Snow, C. C. (1993) Organizational Configurations
and Performance: A Comparison of Theoretical Approach, Academy of Management
Journal, 36, 1278-1314.
115
International Journal of Economics and Management
Ku Nor Izah, K. I.(2003) The Timeliness of Quarterly Financial Reports of Companies
in Malaysia, PhD. Thesis, Cardiff University.
Laitinen, E. K. (2002) Financial Rating of European Technology Companies: An
International Comparison, Journal of Business Finance and Accounting, 29, 871-
901.
Lieber, R. B. (1996) Who are the Real Wealth Creators? Fortune, 134, 107-113.
Lima, M. A. M., Resende, M. and Hasenclever, L. (2000) Quality Certification and
Performance of Brazilian Firms: An Empirical Study, International Journal of
Production Economics, 66, 143-14.
Mancke, R. B. (1974) Causes of Inter-firm Profitability Differences: A New
Interpretation of the Evidence, Quarterly Journal of Economics, 88, 181-193.
Marcus, M. (1969) Profitability and Size ofFirm: Some Further Evidence, The Review of
Economics and Statistics, 51, 104-107.
Meyer, M. W. and Zucker, L. G. (1989) Permanently Failing Organizations. Sage:
California.
Mokhtar, M. Z., Karbhari, Y. and Naser, K. (2005) Company Financial Performance
and ISO 9000 Registration: Evidence from Malaysia, Asia Pacific Business Review,
11, 349-367.
Naser, K., Karbhari, Y. and Mokhtar, M. Z. (2004) Impact ofISO 9000 Registration on
Company Performance, Managerial Auditing Journal, 19, 509-516.
Pallant, J. (200 l ) SPSS Survival Manual. Open University Press: Philadelphia.
Porter, M. E. (1979) The Structure Within Industries and Companies' Performance,
Review of Economics and Statistics, 61, 214-227.
Schmalensee, R. (1985) Do Markets Differ Much? The American Economic Review, 75, 341-352.
Shepherd, W. G. (1972) The Elements of Market Structure, Review of Economics and
Statistics, 54, 25-37.
Silver, M. (1997) Business Statistics (2nd ed.). McGraw-Hill Publishing Company:
New York.
Spinard, F., William, S. and Mark, P. (1996) Banking's Top Performers, American
Bankers' Association Banking Journal, New York, 88, 34-35.
116