FOURTH QUARTER 2014 RESULTS12 MARCH 2015
LUCA BETTONTE, CEO

2
DISCLAIMER
This document contains certain forward-looking information that is subject to a number of factors that may influence the accuracy of the statements and the projections upon which the statements are based.There can be non assurance that the projections or forecasts will ultimately prove to be accurate; accordingly, the Company makes no representation or warranty as to the accuracy of such information or the likelihood that the Company will perform as projected.

3
AGENDA
4Q 2014 Highlights✓ Key Figures✓ 2014 Main Achievements
Results Review✓ Business Environment✓ 4Q 2014 Group EBITDA✓ Results by Segments
Key Financials✓ Profit & Loss✓ Investments ✓ Cash Flow Statement
2015 Guidance and ConclusionsAppendix

4
RC Ebitda Adj (€ mn)
HIGHLIGHTS: KEY FIGURESRC Net Profit (€ mn)
Strong reduction in NFP thanks also to CIP6 early termination
POWER
RENEWABLES
INTEGRATED DOWNSTREAM
CORPORATE
569
358
267
(5)(30)
59(2) (7)
20134Q 2014
2014 4Q 2013
132
204
245
(24)44
2283
669
(6)2013
4Q 2014
38
3
2014 4Q 2013
Highlights
Leverage
DERIVATIVES
ADJ. NFP EXCL. DERIVATIVES
34%
24%
538
31/12/2014
349
189
868
147
31/12/2013
1,015
491
91
76
1
Adj NFP (€ mn)

5
2013LIKE-FOR-LIKE(1)
IMPROVEMENT VS. GUIDANCE
538
EBITDA:
NFP:
✓Slight growth on a like-for-like basis
✓Results beat guidance, due to strong Renewables and Power,
along with corporate cost reduction
Better operating performance and strong reduction in NFP
✓Lower NFP due to strong cash generation (including M&A)
≈800
2014 GUIDANCE
2014 ACTUAL
2014 ACTUAL
2014 INITIAL GUIDANCE
487
RENEWABLES CORPORATEIDPOWER
≈470491
(1) 2013 EBITDA re-stated to take into account ISAB Energy only for 1H and excluding Coastal Refining for the full year Highlights
RC Ebitda Adj (€ mn)
Adj NFP (€ mn)
≈700
2014 NEW GUIDANCE

6
2014 MAIN ACHIEVEMENTS AND RECENT DEVELOPMENTS
Highlights
• Unicredit enters in ERG Renew share capital with a 7.14% stake
• Raised Project Financing for €167mn for Gebeleisis and Topolog wind farms in Romania and Palazzo San Gervasio in Italy
• 80MW in Poland under construction, expected to enter into operation by 2015
Renewables
• Agreement for disposal of ISAB Energy, and exit from CIP6:
- June 2014: acquisition of ISAB Energy minorities from GDF Suez for €153mn
- June 30, 2014: ISAB Energy disposal to LUKOIL for a cash-in of €26mn
- August 2014: exit from CIP6 convention for a cash-in of €515mn
Power
• EOS disposal as of December 29, 2014 for a cash-in of €30mn
• Exit from oil Supply & Trading activities as of January 1, 2015Oil

7
RESULTS REVIEW
CFO
PAOLO MERLI

8
BUSINESS ENVIRONMENT
4Q 2013 1Q 2014 2Q 2014 3Q 2014 4Q 2014
ITALIAN PRICE ZONAL PRICE SICILY CIP6
Electricity Prices (€/MWh)119
10091
65
Results Review
4Q 2013 1Q 2014 2Q 2014 3Q 2014 4Q 2014
Renewables: Electricity Prices (€/MWh)
154 156
9192 91 92
(1) Italian price is theoretical price based on National Average Electricity Price (PUN) + GC
95
79
FRANCE ITALY BULGARIA GERMANY ROMANIA(1)
82
59
104
4Q 2013 1Q 2014 2Q 2014 3Q 2014 4Q 2014
Industry Retail Fuels Volumes (M tons)
5.66 5.64
4Q 2013 1Q 2014 2Q 2014 3Q 2014 4Q 2014
EMC Margin ($/bbl)
(3.0)
(0.6)
97

9
1,292
2013
569 22 (154)
48 5
Renewables Corporate 2014
491
FY 2014 GROUP EBITDA
Integrated Downstream
Improved results in Renewables
Decrease in Power figures due to ISAB Energy plant disposal
(1) ISAB Energy EBITDA in FY13 was at €253.9mn, while in FY14 it is at €104.5mn due to ISAB Energy disposal as of July 1, 2014
Results Review
Power(1)

10
RC Ebitda (€ mn)
RENEWABLES RESULTS
2,403
Volumes (GWh)
8
219
Results Review
6
(1) LUKERG: ERG ‘s stake = 50% in Bulgaria and Romania
11
ERG Wind
29
1,154
ERG Wind
594
111
449
51283
ERG Wind
245
59
49
4
ERG Wind
121
ITALY FRANCE LUKERG(1)GERMANY
127
51
155
43
3
2,010
4Q 2013
2013
4Q 2014
2014
4Q 2013
2013
4Q 2014
2014
Higher production both in Italy and abroad
2,580
2,051
264
122144
481
3277
41
632
120
ERG Wind
276
ERG Wind
267
66
8
233
14
12
56
24
4
1,113
ERG Wind
31
ERG Wind
3

11
RC Ebitda (€ mn)
POWER RESULTS
Volumes (GWh)
Strong ERG Power results
ISAB Energy plant disposal effective as of July, 1Results Review
104100
2419
254
104
59
2
ERG POWERISAB ENERGY
204
83
2013
4Q 2013
2014
4Q 2014
358
22
4,665
2013
4Q 2013
6,805
707
1,592
2014
4Q 2014
2,042
2,623
707
4,142
2,663
923
669

(5)
44
(2)
9
(51)
(13)
4855
18
20
12
RC Ebitda (€ mn)
INTEGRATED DOWNSTREAM RESULTS
TOTALERG Market Share (%)
Improved margins at TotalERG offset by operating loss in Trading
11.5%
10.6%
Results Review
RC Ebitda (€ mn)
2Q 20144Q 2013 1Q 2014 3Q 2014 4Q 2014
Refining: processed Volumes(2) (k tons)
1,385 1,275376 204
2,215
540
3,600
916
(1) TOTALERG Refining EBITDA includes Logistics(2) Volumes relate to 100% of TOTALERG stake in Sarpom (24%)
TOTALERG REFININGCOASTAL REFINING
TOTAL INTEGRATED DOWNSTREAMTOTALERG REFININGTOTALERG MARKETINGEOSERG SUPPLY & TRADINGCOASTAL REFINING
(1)
20134Q 2013
20144Q 2014
20134Q 2013
20144Q 2014
204
1,275
(9)(8)
1
(0.3)
10(9) (8)
(0.4) (2)
0.31
65

13
KEY FINANCIALS
14
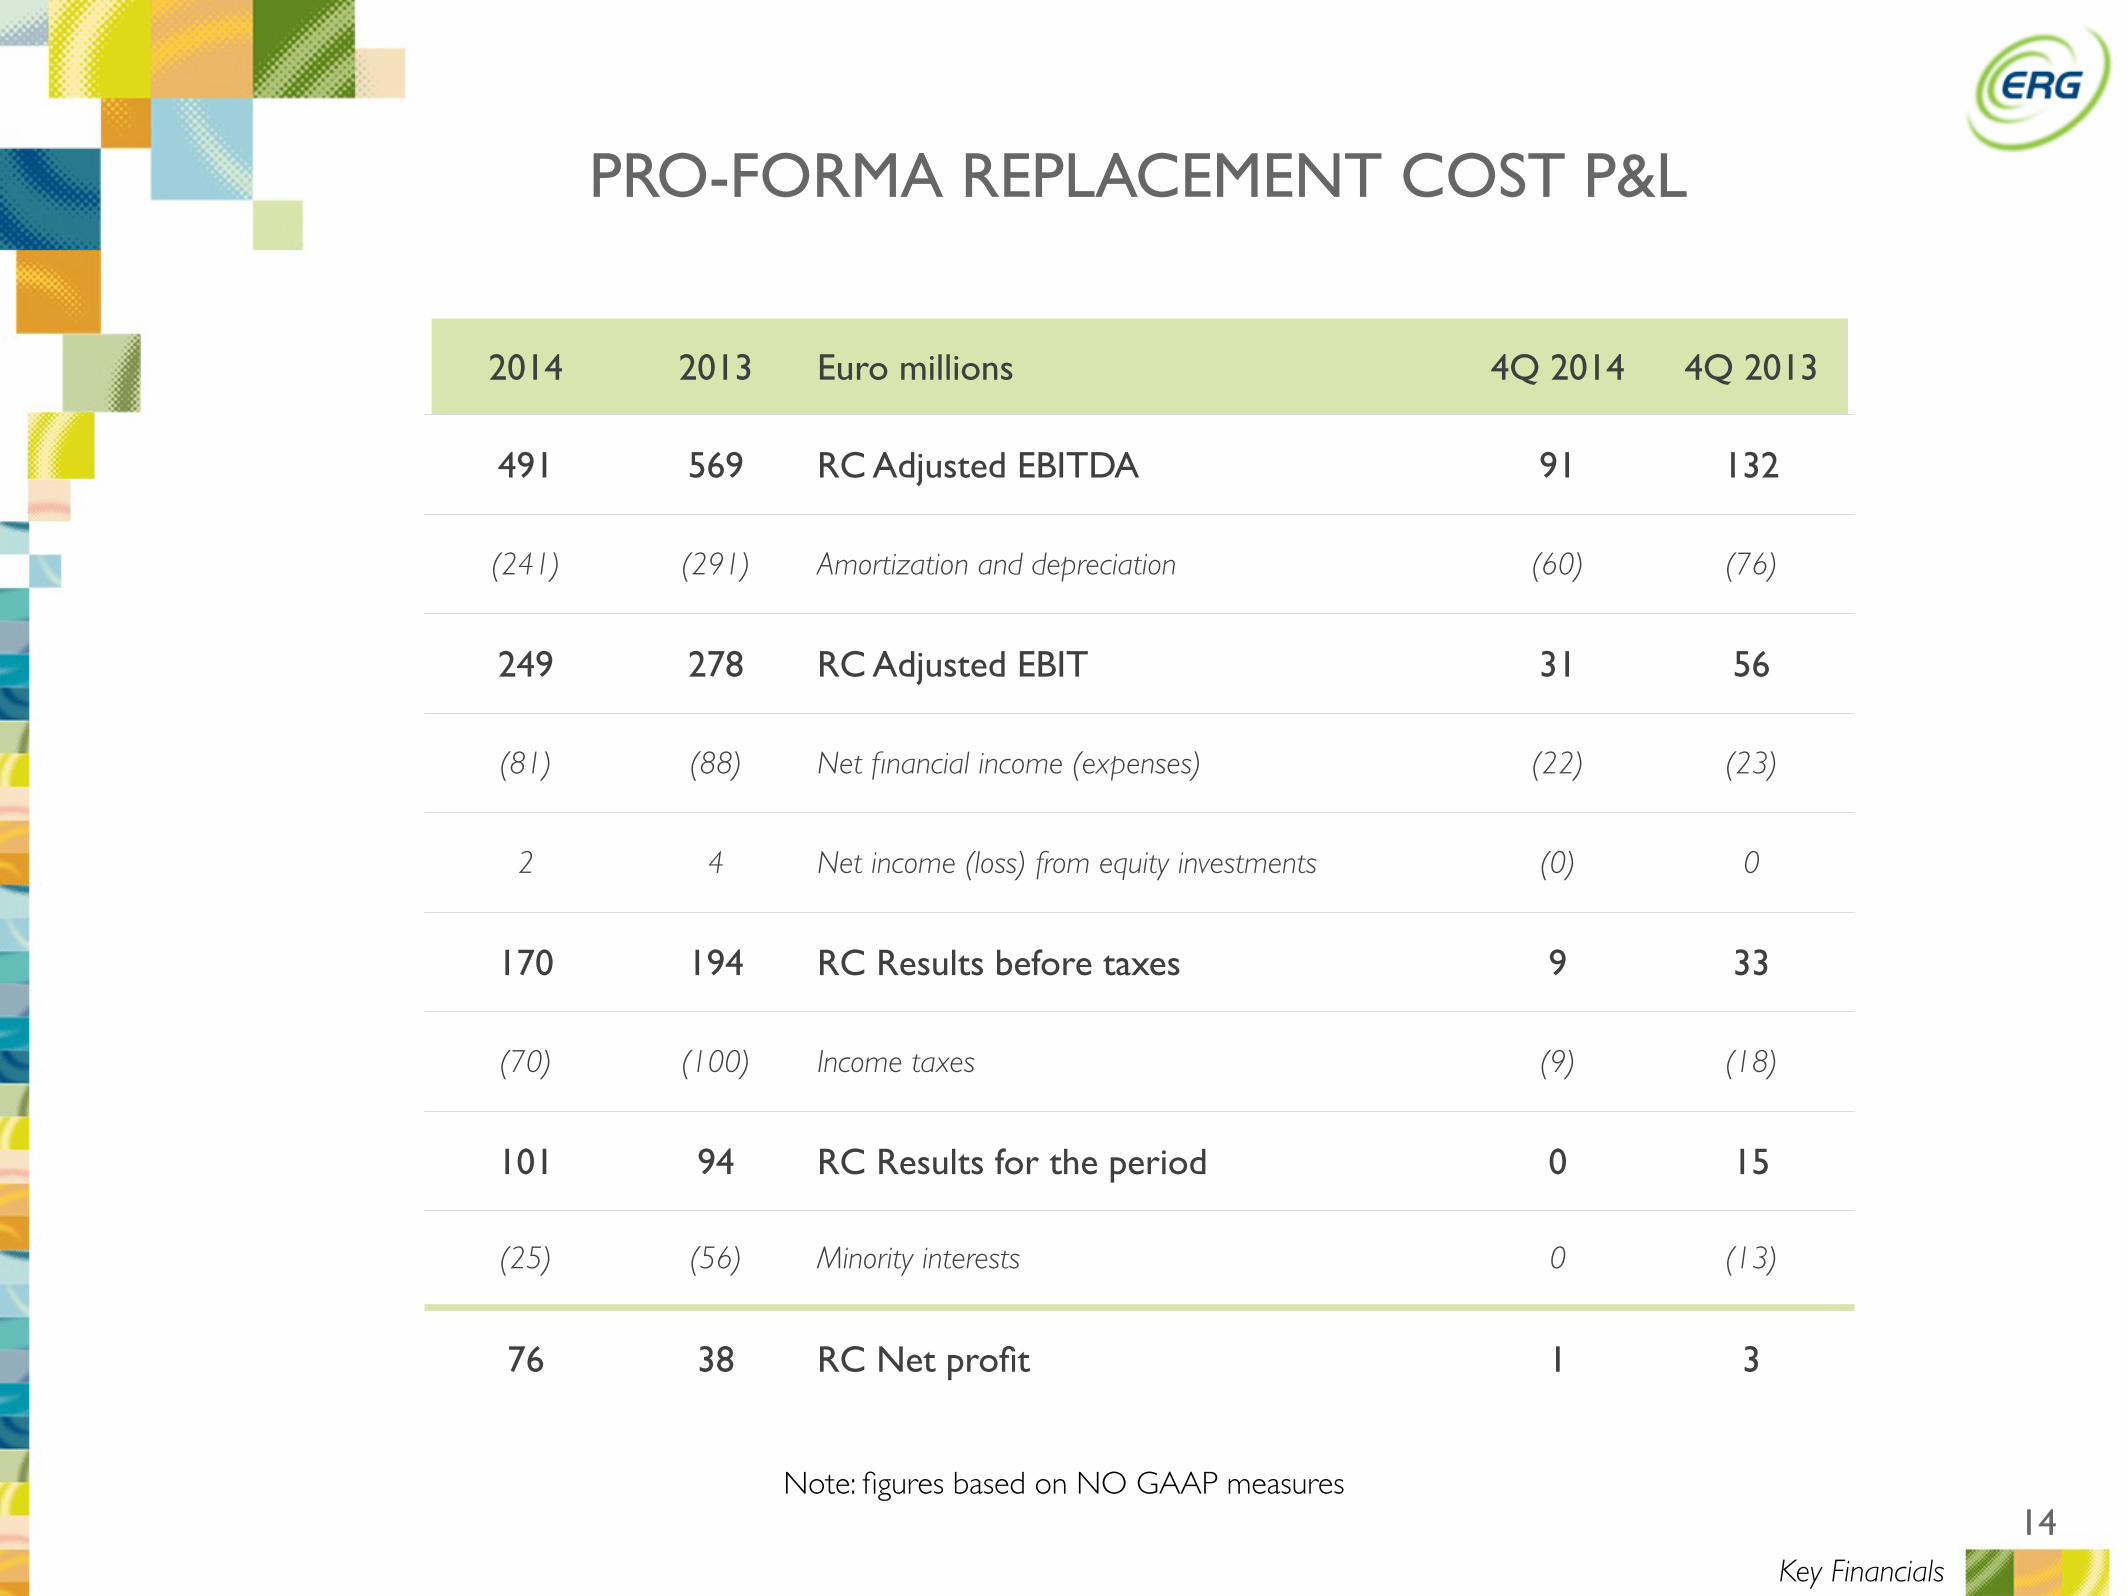
PRO-FORMA REPLACEMENT COST P&L
Note: figures based on NO GAAP measures
Key Financials
2014 2013 Euro millions 4Q 2014 4Q 2013
491 569 RC Adjusted EBITDA 91 132
(241) (291) Amortization and depreciation (60) (76)
249 278 RC Adjusted EBIT 31 56
(81) (88) Net financial income (expenses) (22) (23)
2 4 Net income (loss) from equity investments (0) 0
170 194 RC Results before taxes 9 33
(70) (100) Income taxes (9) (18)
101 94 RC Results for the period 0 15
(25) (56) Minority interests 0 (13)
76 38 RC Net profit 1 3

15
ADJUSTED INVESTMENTS
Key Financials
CORPORATEINTEGRATED DOWNSTREAMRENEWABLESPOWER
(2)(1)
41 3414 12
170
38
51
9
26
1411
4
89
20134Q 2013
(€ mn)
20144Q 2014
238
77
2 3
(3)
(4)
(1) Renewables adjusted for LUKERG Renew (50%)(2) Integrated Downstream adjusted for TOTALERG (51%)(3) It includes investment for the acquisition of Gebeleisis (ca. €55mn) and Hrabrovo (ca. €9mn) wind farms, plus ERG Renew O&M (ca. €10mn)(4) It includes investment for the acquisition of ERG Renew O&M (ca. €10mn)
25
0.7 0.6

16
538
34%
24%
16%
Adj. Net Debt
31/12/2013
Cash Flowfrom
operation
WorkingCapital
CAPEX Financial Charges
Adj. Net Debt
31/12/2014
NFP 51% TotalErg and 50% LUKERG Renew
Net Debt31/12/2014reported
Leverage
FY 2014 ADJUSTED CASH FLOW STATEMENT
(208)
ERG Renew Capital Increase
Dividends Acquisition 49% IE/IES
(450)
1,799
1,015143
Disposal IE plant to
ISAB
1,234
1,041
153
(515)
Dividends to
minorities
Taxesand Other(1)
22
(28)
Cash-in from CIP6
early termination
89
81
330
(50)100
(22)
Key Financials
(368)
(1) Including EOS Disposal for €(4)mn

17
2015 GUIDANCE AND CONCLUSIONS
CEO
LUCA BETTONTE

18
491
2014
2015 GUIDANCE
2015 FCST
89
LIQUIDITY PF OTHER AT MLT
538
RENEWABLES CORPORATEIDPOWER
EBITDA:
CAPEX:
NFP:
✓EBITDA reduction mainly due to the exit from CIP6
✓Slight growth on a like-for-like basis driven by Renewables
✓CAPEX driven by development in Wind
✓New Business Plan under definition
Group’s transformation still ongoing
≈150
✓Higher CAPEX
✓Tax settlement on ISAB Energy transaction
2014 2015 FCST
2014 2015 FCST
≈400
2014 PRO-FORMA(1)
390
(1) 2014 Pro-forma EBITDA excluding ISAB Energy, ERG Supply & Trading and EOS
≈650

19
APPENDIX

20
1,292
4Q 2013
132 7
11
(61)
(2)
Power(1)Renewables Integrated Downstream Corporate 4Q 2014
91
4Q 2014 GROUP EBITDA
Improved results in Renewables
Decrease in Power figures due to ISAB Energy plant disposal
(1) ISAB Energy EBITDA in 4Q13 was at €59mn, while in 4Q14 it is at €2mnAppendix

21
26%
24%
16%
Adj. Net Debt
30/09/2014
Cash Flowfrom operation
WorkingCapital
CAPEX Financial Charges
Adj. Net Debt
31/12/2014
NFP 51% TotalErg and
50% LUKERG Renew
Net Debt31/12/2014reported
Leverage
4Q 2014 ADJUSTED CASH FLOW STATEMENT
38
(91)
330
640
(2)
53825 (208)
ISAB Energy Price
Adjustment
(94) 22
Appendix(1) Including EOS Disposal for €(4)mn
Taxesand Other(1)

22
FY AND 4Q 2014 RESULTS
Appendix
2014 2013 Euro millions 4Q 2014 4Q 2013
4,350 10,368 Adjusted Revenues 1,081 2,843
491 569 RC EBITDA Adjusted 91 132
267 245 - Renewables 66 59
204 358 - Power 22 83
44 (5) - Integrated Downstream 9 (2)
(24) (30) - Corporate (6) (7)

23
2014 2013 4Q 2014 4Q 2013
1,341 1,340 Installed capacity (end-period, MW) 1,341 1,340
of which:
1,087 1,087 - Italy 1,087 1,087
86 86 - Germany 86 86
64 64 - France 64 64
27 27 - Bulgaria (1) 27 27
77 76 - Romania (1) 77 76
2,580 2,403 Electricity Production (GWh) 632 594
of which:
2,051 2,010 - Italy 481 449
144 155 - Germany 41 51
122 127 - France 32 43
67 57 - Bulgaria (1) 22 17
196 54 - Romania (1) 55 34
RENEWABLES: KEY FIGURES (1/2)
Appendix(1) ERG ‘s stake = 50%

24
2014 2013 Euro millions 4Q 2014 4Q 2013
RC EBITDA:
233 219 Italy 56 49
12 11 Germany 4 4
8 8 France 2 3
14 6 LUKERG (1) 4 3
of which:
4 4 - Bulgaria (1) 2 1
10 2 - Romania (1) 3 2
267 245 Total RC EBITDA 66 59
(137) (126) Depreciation (39) (32)
130 119 RC EBIT 27 27
Appendix(1) ERG ‘s stake = 50%
RENEWABLES: KEY FIGURES (2/2)

25
ISAB ENERGY: KEY FIGURES
Appendix
2014 2013 4Q 2014 4Q 2013
2,042 4,142 Sales (GWh) 0 923
251 653 Sales (€ mn) 2 171
104 254 RC EBITDA (€ mn) 2 59
78 202 RC EBIT (€ mn) 1 44
100 119 CIP6 tariffs (€/MWh) 100 119
61 173 EBITDA IT GAAP (€ mn) 1 45

26
ERG POWER: KEY FIGURES
Appendix
2014 2013 Euro millions 4Q 2014 4Q 2013
2,623 2,663 Electricity Production (GWh) 707 669
100 104 RC EBITDA 19 24
(27) (28) Depreciation (6) (7)
73 76 RC EBIT 14 17

27
INTEGRATED DOWNSTREAM: KEY FIGURES
Appendix
(1) Estimated market share referring to 100% of TOTALERG
2014 2013 Euro millions 4Q 2014 4Q 2013
44 (5) Adjusted RC EBITDA 9 (2)
47 39 - TOTALERG (51%) 18 10
5 6 - ERG Oil Sicilia 0 1
(8) 1 - ERG Supply & Trading (9) (0)
n.a. (51) - Coastal Refining n.a. (13)
(48) (83) Adjusted Depreciation (13) (22)
(5) (87) Adjusted RC EBIT (4) (24)
34 41 Investments 12 14
10.7% 11.3% TOTALERG retail market share(1) 10.6% 11.5%

28
2014 2013 Euro millions 4Q 2014 4Q 2013
38 170 Renewables 9 51
14 26 Power 4 11
34 41 Integrated Downstream(3) 12 14
3 2 Corporate 1 1
89 238 Adjusted Total 25 77
INVESTMENTS
(1) It includes investment for the acquisition of Gebeleisis (ca. €55mn) and Hrabrovo (ca. €9mn) wind farms, plus ERG Renew O&M (ca. €10mn)
(2) It includes ERG quota of investments made by LUKERG Renew(3) It includes ERG quota of investments made by TOTALERG(4) It includes investment for the acquisition of ERG Renew O&M (ca. €10mn)
(1) (2)
Appendix
(4)