25, June 2017, V.1 | 1
Environmental Change Detection from SAR Images in ArcGIS
Adapted from coursework developed by Franz J Meyer, Ph.D., Alaska Satellite Facility
In this document you will find
A. Background
B. Materials List
C. Steps
D. Example Image
E. Other Applications
F. Further Reading
A) Background
Due to their 24/7 observation capabilities, SAR data are relevant for a broad range of
applications in environmental monitoring and emergency response. However, identifying
changes in images with complex content is difficult, as the image content often masks the
signatures of change. A simple and highly effective change detection approach is the log-
ratio scaling method. It is based on a differential analysis of repeated images and has
shown to be effective in background suppression and change features enhancement.
B) Materials List
Computer running Windows
Two RTC images
o Options to obtain images:
Download and unzip sample images Image 1 and Image 2
Download and unzip RTC ALOS PALSAR images using Vertex
Process RTC images using Sentinel data
ArcGIS
Note: To identify RTC images suitable for change detection, ensure images are from the
same season. This is important for change detection operations as it avoids seasonal
changes and focuses on true environmental changes in a change detection analysis.
Making remote-sensing data accessible since 1991

25, June 2017, V.1 | 2
C) Steps
1. Open ArcMap (part of ArcGIS Desktop)
2. Import the two RTC images into the Data Frame
using Add Data function
a. In the top menu, navigate to File > Add Data
and click on Add Data
b. Select the HH polarization
Note: Do not create Pyramids when
prompted
3. Open the Raster Calculator
a. Type “Raster Calculator” in the search box and click
on the Raster Calculator link in the results
*If Search not visible, Windows > Search or Ctrl + F*
Note: Ensure that the Spatial Analyst extension is
enabled: Navigate to Customize > Extensions and
select Spatial Analyst
4. Calculate log-ratio image
a. In the Raster Calculator, create the following
expression:
i. Log10(“newer image”/“older image”)
Note: The newer image has the larger orbit
number; e.g., 24566 is newer than 18527.
*Double-click file name to add to expression*
b. Output raster to directory of your choosing
Note: If saving to folder, extension required
(e.g., log-ratio_layer.tif)
c. Click OK

25, June 2017, V.1 | 3
5. OPTIONAL: To improve visualization, apply a change to the image properties
a. Right-click on one of the images in the Layers Panel and select Properties
b. Click on the Display tab
c. Under Resample during display using: select Cubic Convolution
d. Click OK
6. OPTIONAL: Add a base layer to be able to compare image features to known
landmarks
a. Navigate to File > Add Data and click on Add Basemap
b. Select a basemap, such as Imagery or Imagery with Labels
25, June 2017, V.1 | 4
D) Example Image
Figure 1: Log-ratio image with the ArcMap Imagery basemap
Credit: ASF DAAC 2017; Includes Material © JAXA/METI 2009, 2010.
The resulting log-ratio image over Huntsville, Alabama was created from a pair of images
acquired on 7/17/2009 and 9/04/2010, approximately one year apart. As the data are
seasonally coordinated, differences between the images should largely be due to
environmental changes between the image acquisition times, such as urban
development, changes in river flow, or differences in agricultural activity.
It can be seen that most of the original image content (city of Huntsville, hills and
vegetation structures near town, etc.) was effectively suppressed from the image. In
the log-ratio image, unchanged features have intermediate gray tones (gray value
around zero) while change features are either bright white or dark black. Black
features indicate areas where radar brightness decreased while in white areas, the
brightness has increased.
25, June 2017, V.1 | 5
E) Other Applications
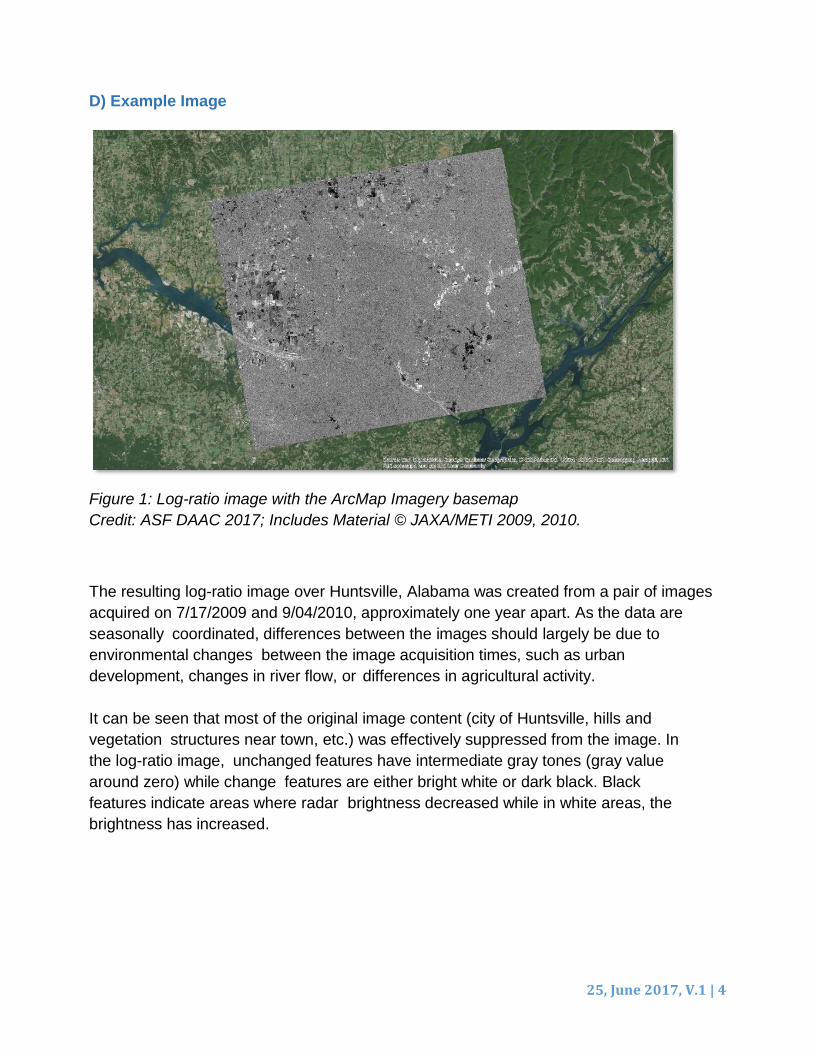
Figure 2: Logging roads can clearly be identified these optical satellite data of an area around Altamira, Brazil.
Illegal Logging/Deforestation
Background
The region near Altamira, Brazil is one of the most active logging regions of the Amazon rainforest. While some of the logging activities in this area are legitimate, illegal logging operations have flourished over the last decade. Existing logging roads can be clearly identified in optical satellite images such as those used by Bing Maps© (Figure 2). However, frequent rain and cloud cover make change detection based on optical remote sensing data impractical. Steps
Select and download High-Res Terrain Corrected ALOS PALSAR repeated images over the logging areas near the Brazilian city of Altamira. Target similar seasons. Due to the evergreen vegetation in this tropical area, there is no preference for which season you choose. Use the Log-Ratio Scaling method as outlined in Section C. Note: To use Sentinel-1 data, please use high res GRD data. You must first extract, project, and scale to byte before the data can be used in the GIS environment.

25, June 2017, V.1 | 5
F) Further Reading
• Chatelain, F., Tourneret, J. Y., Inglada, J., and Ferrari, A., 2007, Bivariate Gamma
Distributions for Image Registration and Change Detection: IEEE Transactions on
Image Processing, v. 16, no. 7, p. 1796-1806.
• Cha, Miriam, Rhonda D. Phillips, Patrick J. Wolfe, and Christ D. Richmond.
"Two-Stage Change Detection for Synthetic Aperture Radar." (2015).
• Dogan, Ozan, and Daniele Perissin. "Detection of Multitransition Abrupt Changes
in Multitemporal SAR Images." Selected Topics in Applied Earth Observations
and Remote Sensing, IEEE Journal of 7, no. 8 (2014): 3239-3247.
• F. Bovolo and L. Bruzzone, "A detail-preserving scale-driven approach to
change detection in multitemporal SAR images," Geoscience and Remote
Sensing, IEEE Transactions on, vol. 43, pp. 2963-2972, 2005.
• J. Inglada and G. Mercier, "A new statistical similarity measure for change
detection in multitemporal SAR images and its extension to multiscale change
analysis," Geoscience and Remote Sensing, IEEE Transactions on, vol. 45, pp.
1432-1445, 2007.
• L. Bruzzone and D. F. Prieto, "Automatic analysis of the difference image for
unsupervised change detection," Geoscience and Remote Sensing, IEEE
Transactions on, vol. 38, pp. 1171-1182, 2000.
• R. J. Dekker, "Speckle filtering in satellite SAR change detection imagery,"
International Journal of Remote Sensing, vol. 19, pp. 1133-1146, 1998.
• S. Huang, "Change mechanism analysis and integration change detection
method on SAR images," The International Archives of the Photogrammetry,
Remote Sensing and Spatial Information Sciences. Vol. XXXVII. Part B7, 2008.
• S.-H. Yun, E. J. Fielding, F. H. Webb, and M. Simons, "Damage proxy
map from interferometric synthetic aperture radar coherence," ed: Google
Patents, 2012.
• T. Celik, "A Bayesian approach to unsupervised multiscale change detection in
synthetic aperture radar images," Signal processing, vol. 90, pp. 1471-1485,
2010.
• Y. Bazi, L. Bruzzone, and F. Melgani, "An unsupervised approach based on the
generalized Gaussian model to automatic change detection in multitemporal SAR
images," Geoscience and Remote Sensing, IEEE Transactions on, vol. 43, pp.
874-887, 2005.
• Xiong, Boli, Qi Chen, Yongmei Jiang, and Gangyao Kuang. "A threshold
selection method using two SAR change detection measures based on the
Markov random field model." Geoscience and Remote Sensing Letters, IEEE9,
no. 2 (2012): 287-291.