1
The Lester Center for Entrepreneurship and InnovationHaas School of Business, UC Berkeley Copyright © 2005 J.S. Engel
Entrepreneurship and Venture Capital Entrepreneurship and Venture Capital
Jerome S. EngelAdjunct Professor, Haas School of Business
Executive Director, Lester Center For Entrepreneurship and Innovation University of California at Berkeley
The Lester Center for Entrepreneurship and InnovationHaas School of Business, UC Berkeley Copyright © 2005 J.S. Engel
Jerry Engel
• UC Berkeley– Founder and Executive Director of the Lester Center
for Entrepreneurship and Innovation– Chair: Entrepreneurship Faculty– Teach Entrepreneurship, Venture Capital & Private Equity,
Technology Commercialization in the MBA and Executive Ed• Outside of Academe:
– Venture Capital• Monitor Venture Partners, General Partner• Co-founded: Kline Hawkes Capital early ’90s
– Entrepreneur• Co-Founder: AllBusiness.com, ElectraScan Inc., CardioProfile• Angel Investor, Board member, Advisor: Maxis, Leapfrog, MedAmerica
– Big Company Experience• 1980s: Ernst & Young, Managing Partner, Entrepreneurial Services
» Clients: Apple, Intel, Genentech, Sun, Autodesk,Fair Isaac, The Learning Company and more..
• 1970s: KPMG
The Lester Center for Entrepreneurship and InnovationHaas School of Business, UC Berkeley Copyright © 2005 J.S. Engel
Entrepreneurship and Venture Capital
• What are the Drivers of Innovation?• Why are Entrepreneurship and Venture Capital
Important?• What is Entrepreneurship?• How Does Venture Capital Work• What are the current trends?• What does all this mean to me?

2
Drivers of Innovation in the US
High Tech Model
The Lester Center for Entrepreneurship and InnovationHaas School of Business, UC Berkeley Copyright © 2005 J.S. Engel
U.S. Example:Private R&D Spending Increasing
0
50
100
150
200
250
300
1955 1960 1965 1970 1975 1980 1985 1990 1995 2000
Bill
ions
of 1
996
Dol
lar
TOTAL
PRIVATE
FEDERAL
Note: Expenditures are deflated using the GDP implicit price deflator.Source: National Science Board (2000) and Economic Report of the President (2002)
The Lester Center for Entrepreneurship and InnovationHaas School of Business, UC Berkeley Copyright © 2005 J.S. Engel
The Proportion of Research Expenditure atOur Largest Corporations is Decreasing
Company Size 1981 1989 1999 2000
<1000 employees 4.4% 9.2% 22.5% 22.4%1,000 - 4,999 6.1% 7.6% 13.6% 15.4%5,000 - 9,999 5.8% 5.5% 9.0% 8.4%10,000 - 24,999 13.1% 10.0% 13.6% 14.4%25,000+ 70.7% 67.7% 41.3% 39.5%
Original - H. Chesbrough, 2003 Updated J. Engel 2003Source: National Science Foundation, Science Resource Studies, Survey of Industrial Research Development, 1991,1999 and 2000.
3
The Lester Center for Entrepreneurship and InnovationHaas School of Business, UC Berkeley Copyright © 2005 J.S. Engel
Time to Market Adoption Continues to Decrease
32.75
24.10
13.84
5.75
3.40
0
5
10
15
20
25
30
35
1887–1906 1907–1926 1927–1946 1947–1966 1967–1986
Lag
in A
ppea
ran c
e of
C
ompe
t itio
n ( y
ears
)
Interval between the introduction of an innovation and competitive entry, 1887-1986. Agarwal and Gort 2001
The Lester Center for Entrepreneurship and InnovationHaas School of Business, UC Berkeley Copyright © 2005 J.S. Engel
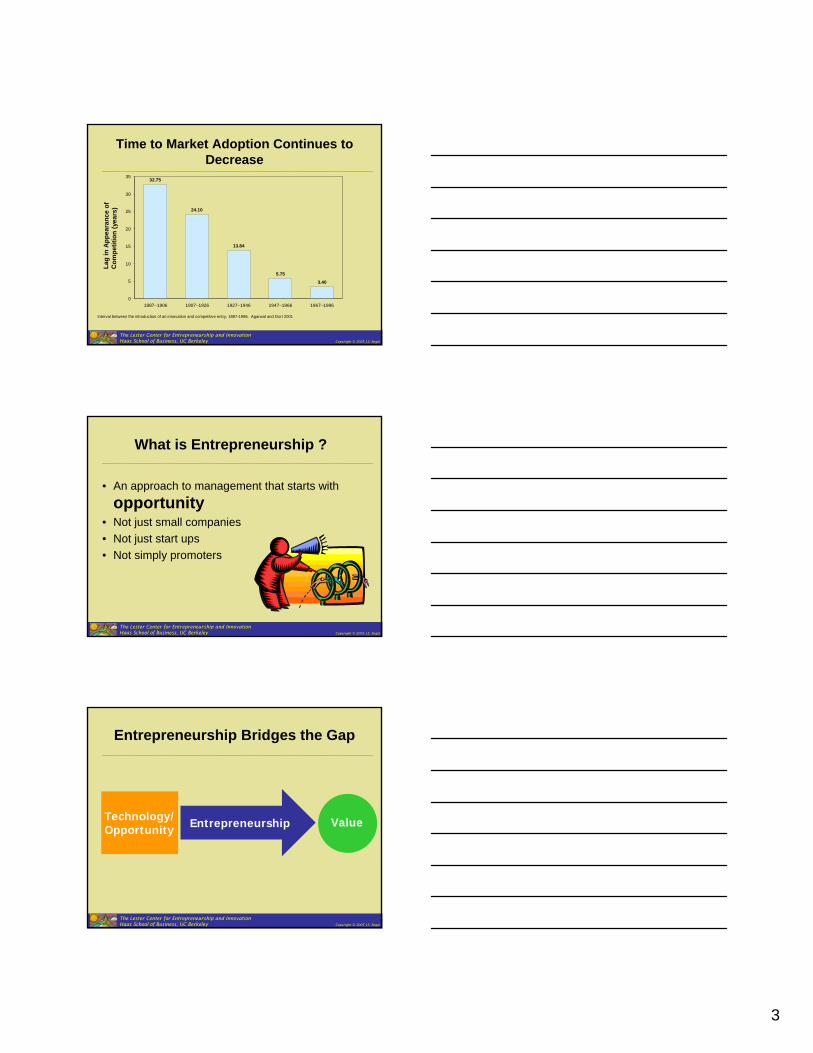
What is Entrepreneurship ?
• An approach to management that starts with opportunity
• Not just small companies• Not just start ups• Not simply promoters
The Lester Center for Entrepreneurship and InnovationHaas School of Business, UC Berkeley Copyright © 2005 J.S. Engel
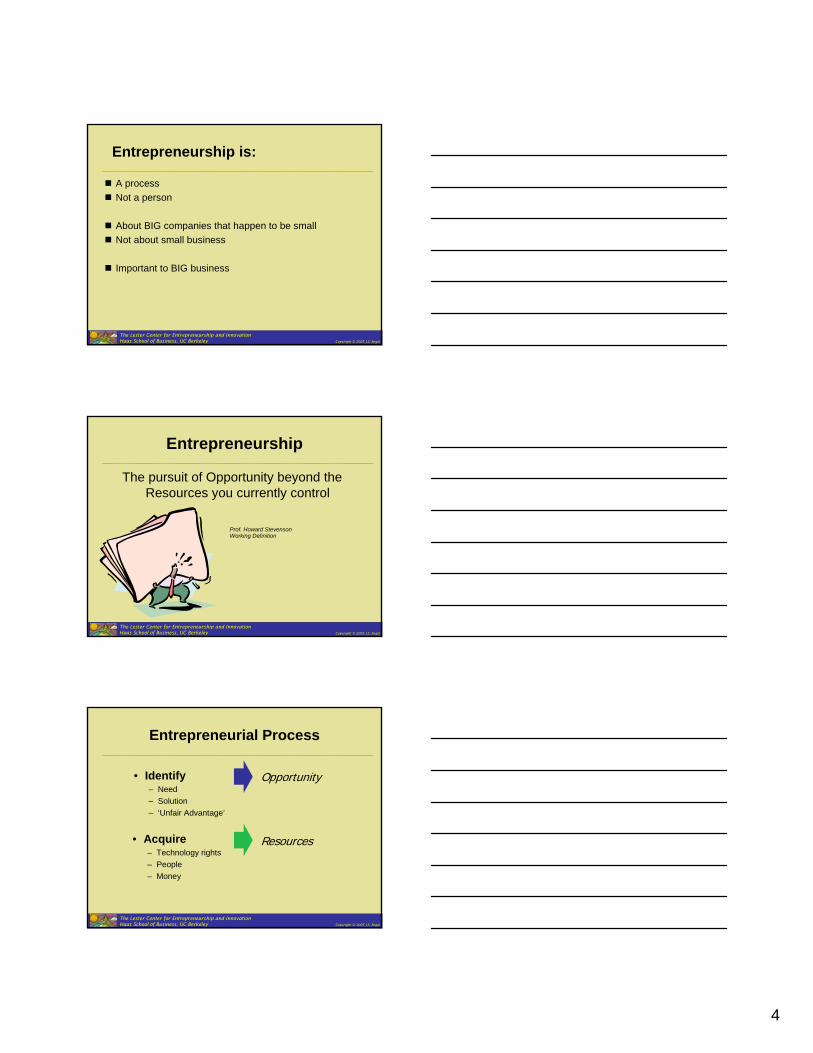
Entrepreneurship Bridges the Gap
Technology/Opportunity
ValueEntrepreneurship
4
The Lester Center for Entrepreneurship and InnovationHaas School of Business, UC Berkeley Copyright © 2005 J.S. Engel
Entrepreneurship is:
A processNot a person
About BIG companies that happen to be smallNot about small business
Important to BIG business
The Lester Center for Entrepreneurship and InnovationHaas School of Business, UC Berkeley Copyright © 2005 J.S. Engel
Entrepreneurship
The pursuit of Opportunity beyond the Resources you currently control
Prof. Howard StevensonWorking Definition
The Lester Center for Entrepreneurship and InnovationHaas School of Business, UC Berkeley Copyright © 2005 J.S. Engel
Entrepreneurial Process
• Identify– Need– Solution– ‘Unfair Advantage’
• Acquire– Technology rights– People– Money
Resources
Opportunity

5
The Lester Center for Entrepreneurship and InnovationHaas School of Business, UC Berkeley Copyright © 2005 J.S. Engel
The Entrepreneur’s Task….
• Key Resources– Technology– Money– People
People
MoneyTechnology
The Lester Center for Entrepreneurship and InnovationHaas School of Business, UC Berkeley Copyright © 2005 J.S. Engel
Major Trends……
• Technology– Discoveries of large companies and universities
commercialized by small companies• Money
– From Venture Capitalists: new structures for pooling risk-tolerant investors
• People– The rise of the professional entrepreneur and
entrepreneurial teams as a management process
The Lester Center for Entrepreneurship and InnovationHaas School of Business, UC Berkeley Copyright © 2005 J.S. Engel
Entrepreneurial Process
• Key Mechanisms:
– Mobile Technology
– Mobile People
– Mobile Money
People
MoneyTechnology

6
The Lester Center for Entrepreneurship and InnovationHaas School of Business, UC Berkeley Copyright © 2005 J.S. Engel
Entrepreneurial Process
• Mobile Technology– Transfer of
technology from research institutions to commercial application
• Formal - through licensing
• Informal - through people
People
MoneyTechnology
The Lester Center for Entrepreneurship and InnovationHaas School of Business, UC Berkeley Copyright © 2005 J.S. Engel
Entrepreneurial Process
• Mobile People– The emergence of
the “professional”entrepreneurial management team
• Lifestyle: personal mobility, multiple employers
• Equity compensation• Acceptance of the
risk of failure
People
MoneyTechnology
The Lester Center for Entrepreneurship and InnovationHaas School of Business, UC Berkeley Copyright © 2005 J.S. Engel
Entrepreneurial Process
• Mobile Money– New forms of Private
Equity• International
investments by US Venture Capital
• Multinational corporations become more active
• Buy-out funds becoming more active
• Increased sophistication of the Angel communities
People
MoneyTechnology

7
Liquidity Cycle in Venture Capital
CompanyCompanyliquidityliquidityeventsevents
VCVCinvestmentsinvestments
in companiesin companies
CompanyCompanygrowthgrowth
LPLPinvestmentinvestment
in VCin VC
VCVCinvestmentsinvestmentsin companiesin companies
VC: A Cyclical IndustryUS Fundraising
Fund
s Ra
ised
($B
)
$11.5
$24.5
$18.3
$9.4$13.1
$49.8
$83.5
$57.6
$26.7
$17.0$12.7
$0
$20
$40
$60
$80
1996 1997 1998 1999 2000 2001 2002 2003 2004 2005 1H06
Am
ount
Inv e
s ted
($ B
) Num
ber of Deals
Investment Levels Reflect the Same Cycle
Deal Flow and Equity into Venture-Backed Companies
Source: Dow Jones VentureOne/Ernst &Young
$9.2$13.1
$17.9
$49.5
$94.8
$36.4
$22.1 $19.5 $22.2 $23.4
$13.0
19122211
2547
4590
6333
3280
24022193 2293 2351
1213
$0
$25
$50
$75
$100
1996 1997 1998 1999 2000 2001 2002 2003 2004 2005 1H06
0
1,000
2,000
3,000
4,000
5,000
6,000
Amount Invested ($B) Number of Deals

8
VC InvestmentVC Investment1980 1980 –– 2006 The Long View2006 The Long View
($ in billions)
$41.0
$13.0$22.2
$8.2
$21.3
$4.2$3.7
$23.4$19.5$21.5
$54.7
$105.9
$14.9$11.5
$3.6$2.2$2.8$3.3$3.4$3.3$3.1$2.8$3.0$3.0$1.6$1.2$0.6$0
$20
$40
$60
$80
$100
$120
'80 '82 '84 '86 '88 '90 '92 '94 '96 '98 '00 '02 '04 1H'06
Annual Venture Capital Investments 1980 to YTD 1H 2006
U.S. Investment: Overall
IT Leads Deal AllocationDeal Flow Allocation by Industry Sector
0%
20%
40%
60%
80%
100%
3Q03 1Q04 3Q04 1Q05 3Q05 1Q06 3Q06
Other
Business,Consumer,Retail
IT
Healthcare% o
f To
t al V
C Ro
und s
24%
62%
12%
27%
16%
26%
60%
9%
65%
5%
13%
2%
Source: Dow Jones VentureOne/Ernst &Young
5%
9
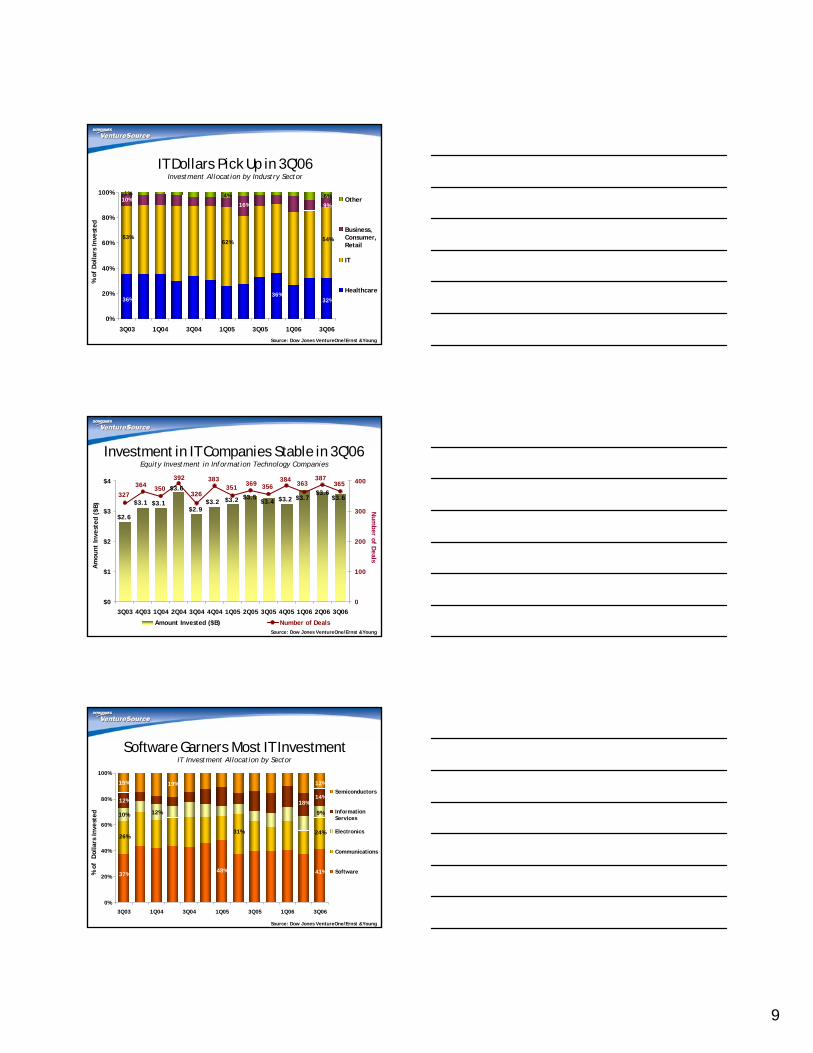
IT Dollars Pick Up in 3Q’06Investment Allocation by Industry Sector
0%
20%
40%
60%
80%
100%
3Q03 1Q04 3Q04 1Q05 3Q05 1Q06 3Q06
Other
Business,Consumer,Retail
IT
Healthcare
% o
f D
olla
r s In
vest
e d
36%
53%
16%
32%
54%
12%
16%6%
62%
4%
36%
10%1%
9%
Source: Dow Jones VentureOne/Ernst &Young
Investment in IT Companies Stable in 3Q’06Equity Investment in Information Technology Companies
$3.6$3.6
$3.7$3.2$3.4$3.5$3.2$3.2
$2.9
$3.6
$3.1$3.1
$2.6
365387
363384
356369351
383
326
392
350364327
$0
$1
$2
$3
$4
3Q03 4Q03 1Q04 2Q04 3Q04 4Q04 1Q05 2Q05 3Q05 4Q05 1Q06 2Q06 3Q060
100
200
300
400
Amount Invested ($B) Number of Deals
Am
ount
Inv e
s ted
($ B
)
Num
ber of Deals
Source: Dow Jones VentureOne/Ernst &Young
Software Garners Most IT InvestmentIT Investment Allocation by Sector
0%
20%
40%
60%
80%
100%
3Q03 1Q04 3Q04 1Q05 3Q05 1Q06 3Q06
Semiconductors
InformationServices
Electronics
Communications
Software% o
f D
o lla
rs I n
vest
e d
37%
26%
12%
15%
10%
41%
24%
14%
9%
12%
18%
12%
31%
48%
19%
Source: Dow Jones VentureOne/Ernst &Young

10
Bay Area Draws Most Investment DollarsRegional Investment in the United States 3Q’06
Potomac4%
Research Triangle
2%
All Other US19%
Washington State3%
Texas5%
New York Metro8% New England
10%
Southern California
11%
Bay Area 38%
Source: Dow Jones VentureOne/Ernst &Young
45% of Deals in California CompaniesRegional Deal Flow in the United States 3Q’06
Bay Area 35%
New England11%
Southern California
10%
Texas5%
New York Metro7%
Potomac4%
Washington State3%
All Other US24%
Research Triangle
1%
Source: Dow Jones VentureOne/Ernst &Young
European Investment: Overview

11
Perspective on European MarketEquity Investment in Venture-Backed Companies, US vs. Europe ($)
Overall Investment
3Q03 4Q03 1Q04 2Q04 3Q04 4Q04 1Q05 2Q05 3Q05 4Q05 1Q06 2Q06 3Q06$0
$1
$2
$3
$4
$5
$6
$7
European Equity Investment
U.S. Equity Investment
Am
ount
Inv e
s ted
($ B
)
Source: Dow Jones VentureOne/Ernst &Young
Biopharm Leads InvestingEquity Investment in European Venture-Backed Companies by Industry, 3Q‘06
Media2%
Biopharmaceuticals36%
Medical Devices7%
Healthcare Services0.3%
Communications12%
Medical IS1%
Products1%Services
1%
Retail1%
Software14%
Semiconductors15%
Information Services6%
Electronics4%
Info. Tech.51%
Bus. Cons. Retail
9%Healthcare
44%
Source: Dow Jones VentureOne/Ernst &Young
UK & France Garner Over Half of Deal FlowTotal Deals in Europe by Country, 3Q’06
United Kingdom 30%
France23%
Sweden12%
Germany9%
Denmark6%
Switzerland3%
Ireland2%
Other15%
Source: Dow Jones VentureOne/Ernst &Young

12
Valuation of the Venture Capital Funded Venture
U.S. Investment: Valuations
This section will be updated in December.
Valuations Continue Upward TrendMedian Premoney Valuation by Year
$9.3$11.1
$13.0
$15.5
$21.0
$25.2
$16.0
$10.7 $10.0
$13.0$15.0
$20.0
$0
$5
$10
$15
$20
$25
1995 1996 1997 1998 1999 2000 2001 2002 2003 2004 2005 1H06
Med
i an
Pre m
o ne y
Val
u ati
on (
$M)
13
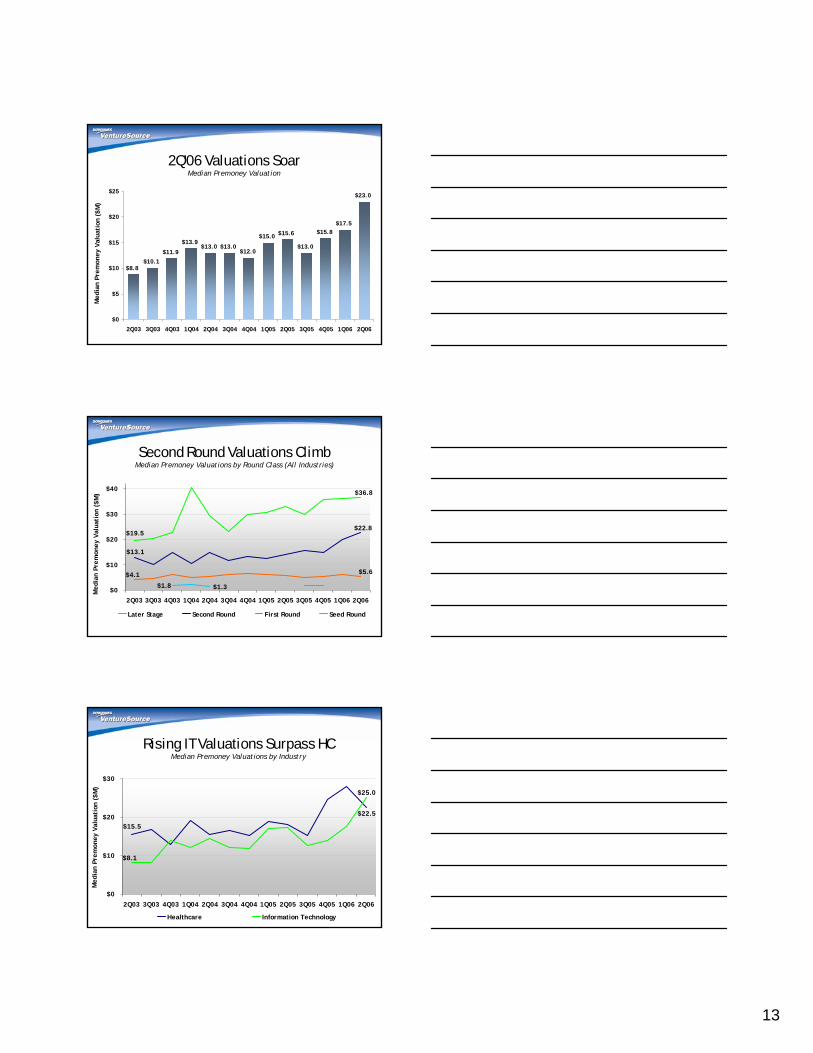
2Q’06 Valuations SoarMedian Premoney Valuation
$8.8$10.1
$11.9
$13.9$13.0 $13.0
$12.0
$15.0 $15.6
$13.0
$15.8$17.5
$23.0
$0
$5
$10
$15
$20
$25
2Q03 3Q03 4Q03 1Q04 2Q04 3Q04 4Q04 1Q05 2Q05 3Q05 4Q05 1Q06 2Q06
Med
i an
Pre m
o ne y
Val
u ati
on (
$M)
Second Round Valuations ClimbMedian Premoney Valuations by Round Class (All Industries)
$1.3
$36.8
$19.5$22.8
$13.1
$5.6$4.1
$1.8$0
$10
$20
$30
$40
2Q03 3Q03 4Q03 1Q04 2Q04 3Q04 4Q04 1Q05 2Q05 3Q05 4Q05 1Q06 2Q06
Later Stage Second Round First Round Seed Round
Med
i an
Pre m
o ne y
Val
u ati
on (
$M)
Rising IT Valuations Surpass HCMedian Premoney Valuations by Industry
$22.5
$15.5
$25.0
$8.1
$0
$10
$20
$30
2Q03 3Q03 4Q03 1Q04 2Q04 3Q04 4Q04 1Q05 2Q05 3Q05 4Q05 1Q06 2Q06
Healthcare Information Technology
Med
i an
Pre m
o ne y
Val
u ati
on (
$M)

14
U.S. Liquidity
M&As Remain Primary Exit OptionPercentage Breakdown of Venture Backed Liquidity Events: IPO vs. M&A
0% 20% 40% 60% 80% 100%
1996
1997
1998
1999
2000
2001
2002
2003
2004
2005
YTD06*
IPOs M&AsYTD06*: 1Q06 – 3Q06
The Lester Center for Entrepreneurship and InnovationHaas School of Business, UC Berkeley Copyright © 2005 J.S. Engel
What are the Trends we have Observed?• Venture Capital is a very special and unique
category of PE• It is highly concentrated in a few unique
locations and industries• Cyclicality and uncertainty are key factors • There are surprising consistencies given these
factors• UC Berkeley, right here, right now – is a unique
and great place to study VC!

15
Thank You