www.elsevier.com/locate/cogbrainres
Cognitive Brain Research 20 (2004) 67–80
Research report
Emotion–attention network interactions during a visual oddball task
Harlan M. Fichtenholtza, Heather L. Deanb, Daniel G. Dillona, Hiroshi Yamasakic,Gregory McCarthyd, Kevin S. LaBara,*
aCenter for Cognitive Neuroscience, Duke University, Room B203, LSRC Building, Durham, NC 27708-0999, USAbDepartment of Neurobiology, Duke University Medical Center, Durham, NC 27710, USA
cDepartment of Integrative Physiology, National Institute for Physiological Sciences, Okazaki 444-0806, JapandBrain Imaging and Analysis Center, Duke University Medical Center, Durham, NC 27710, USA
Accepted 28 January 2004
Available online 16 March 2004
Abstract
Emotional and attentional functions are known to be distributed along ventral and dorsal networks in the brain, respectively. However, the
interactions between these systems remain to be specified. The present study used event-related functional magnetic resonance imaging
(fMRI) to investigate how attentional focus can modulate the neural activity elicited by scenes that vary in emotional content. In a visual
oddball task, aversive and neutral scenes were presented intermittently among circles and squares. The squares were frequent standard events,
whereas the other novel stimulus categories occurred rarely. One experimental group [N = 10] was instructed to count the circles, whereas
another group [N= 12] counted the emotional scenes. A main effect of emotion was found in the amygdala (AMG) and ventral frontotemporal
cortices. In these regions, activation was significantly greater for emotional than neutral stimuli but was invariant to attentional focus. A main
effect of attentional focus was found in dorsal frontoparietal cortices, whose activity signaled task-relevant target events irrespective of
emotional content. The only brain region that was sensitive to both emotion and attentional focus was the anterior cingulate gyrus (ACG).
When circles were task-relevant, the ACG responded equally to circle targets and distracting emotional scenes. The ACG response to
emotional scenes increased when they were task-relevant, and the response to circles concomitantly decreased. These findings support and
extend prominent network theories of emotion–attention interactions that highlight the integrative role played by the anterior cingulate.
D 2004 Elsevier B.V. All rights reserved.
Theme: Neural basis of behavior
Topic: Motivation and emotion
Keywords: Emotion; Attention; Anterior cingulate gyrus; Functional MRI; Target detection; Novelty
1. Introduction uted systems is the cingulate cortex, which may play a
Emotional processing and attentional control have been
attributed to two large-scale neural networks. Stimuli with
emotional content engage fronto-limbic structures, including
the amygdala (AMG) and ventral prefrontal cortex, and
modulate activity along hierarchically organized sensory
processing streams (for review, see Refs. [1,46]). In contrast,
a network of regions in posterior parietal and dorsolateral
prefrontal cortices mediate attentional control (for review,
see Ref. [14]). A common link between these two distrib-
0926-6410/$ - see front matter D 2004 Elsevier B.V. All rights reserved.
doi:10.1016/j.cogbrainres.2004.01.006
* Corresponding author. Tel.: +1-919-681-0664; fax: +1-919-681-0815.
E-mail address: [email protected] (K.S. LaBar).
unique role in emotion–attention interactions.
The representation and integration of emotional and at-
tentional information within the cingulate cortex is not well
understood. Nimchinsky et al. [42] have described a specific
neuronal phenotype (spindle neurons) in the anterior cingu-
late gyrus (ACG) and distributed along its length that is
hypothesized to link emotional and cognitive functions.
Others have defined functional subdivisions within the cin-
gulate cortex that are specialized for different aspects of
behavior [6,12,55,59]. For example, Mega et al. [36] suggest
that the cingulate cortex consists of four functional compo-
nents—a visceral effector, a cognitive effector, a skeletomo-
tor effector, and a sensory processing region. Allman et al. [2]
posit that although affective and cognitive tasks produce

H.M. Fichtenholtz et al. / Cognitive Brain Research 20 (2004) 67–8068
different foci of cingulate activity, the spatial extent of the
resulting activations overlap and the regions may not be
completely distinct. Furthermore, spindle neurons are found
in both the affective and cognitive divisions of the ACG as
defined functionally [7].
Mayberg [34] has suggested that ventral cortical and
subcortical regions which constitute much of the emotional
processing network are specialized for ‘‘vegetative–somat-
ic’’ functions, whereas dorsal areas included in the attentional
orienting network are specialized for ‘‘attentional–cogni-
tive’’ functions. These networks follow and extend the dorsal
and ventral streams of visual processing (e.g., Ref. [20]).
Mayberg hypothesizes that the rostral portion of the ACG
serves as an intermediary between these processing streams.
Mesulam [37] also postulates that the cingulate cortex is
critical for the integration of emotional or motivational
relevance with attention due to its connections between
limbic structures and sensory association cortices. Finally,
the ACGwas central to Papez’s [43] theory of emotion, where
the cingulate was viewed as the ‘‘seat of dynamic vigilance,’’
the location of integration between emotional and executive
processing.
Although clinical observations and animal models of
cingulate neglect have supported some aspects of these
anatomical theories [21,37,39,43,58], few functional imaging
studies have directly investigated the relationship between
emotional and attentional processing systems in the brain.
The existing studies have generally taken two approaches to
this interaction. The first approach has investigated how
attentional resources are allocated when there is competition
between task-relevant stimulus attributes and concurrent
emotional information that elicits a prepotent sensory or
response bias. For instance, Stroop interference tasks appear
to engage different subdivisions of ACG depending on
whether the target stimuli are aversive or neutral, with
emotional Stroop effects localized to more ventral regions
of the ACG [6,59]. Other studies have investigated the
processing of emotional facial expression under conditions
of attention and inattention during spatial cueing tasks in
which other neutral stimuli were simultaneously presented.
Vuilleumier et al. [56] showed that amygdala responses to
displays of facial affect were not modulated by visuospatial
attention, but responses in other brain regions (e.g., fusiform
gyrus) were. In contrast, Pessoa et al. [45] showed that
responses to emotional faces in both the amygdala and
fusiform gyrus were modulated by attention when resources
were presumably more exhausted. Both of these studies
showed an interaction between emotional and attentional
processing in the ACG.
The second approach has been to investigate how the
neural representation of an emotional stimulus changes when
participants selectively attend to their emotional responses to
the stimulus versus some other stimulus features (e.g., spatial
attributes). Lane et al. [28] showed that when participants
attended to their own emotional responses (pleasant/neutral/
unpleasant) to a stimulus, there was greater ACG activity than
when participants were attending to the spatial setting of the
stimulus (indoor/outdoor/either). In an additional study, Lane
et al. [30] reported activity in the ACG that co-varied
positively with the participants’ emotional awareness (see
also Ref. [31]). This could be interpreted as participants
exhibiting greater ACG activity when they attended to the
emotional aspect of a stimulus to a greater extent.
The visual oddball task is another experimental paradigm
that is well suited to investigate the relationship between
emotional and attentional processing. In a typical oddball
paradigm, participants detect rare task-relevant target events
embedded in a sequential stream of frequent standard
stimuli [11]. In this task, the direction of one’s attentional
focus over time is assigned to a specific, rarely occurring
stimulus category that is deemed task-relevant. Whenever
an exemplar of this stimulus category appears, participants
are asked to initiate a motor response and/or mentally count
the number of oddball exemplars. The introduction of
equally rare, task-irrelevant stimuli (distracters) to oddball
tasks allows for the manipulation of attentional focus across
different stimulus categories.
Thus, by presenting infrequent, emotionally evocative
stimuli in an oddball task and varying whether those stimuli
serve as attentional targets or distracters, one can investigate
the effect of attentional focus (as defined by task relevancy)
on emotional stimulus processing. In a previous event-
related functional magnetic resonance imaging (fMRI) study
[60], we asked participants to discriminate infrequent novel
targets (circles) embedded within a stream of frequent
standard stimuli (squares) and two categories of novel,
task-irrelevant distracters (aversive and neutral scenes).
Activation was seen in the amygdala and associated ventral
stream regions in response to the task-irrelevant aversive
scenes but not the attentional targets. The opposite pattern
was found in the dorsal frontoparietal cortex. The one region
that responded to both attentional targets and emotional
distracters was the ACG.
The present study was designed as a follow-up to the
Yamasaki et al. [60] study in which we reversed the emotional
salience of the targets and novel distracters. In our previous
study, attentional focus and emotional information process-
ing were segregated in time across different categories of
stimuli. Here, we contrast this condition, where circles were
task-relevant (Group 1) with another group of participants for
whom the emotional scenes were task-relevant (Group 2).
Consequently, for participants in Group 2, attentional focus
and emotional processing converged on a common target
stimulus. Comparing results across the two groups will
enable a more comprehensive understanding of the neural
substrates that mediate the interaction between emotional
salience and attentional focus.
The present experiment tested several hypotheses. First,
due to the convergence of attentional focus and emotional
processing on a single stimulus, the aversive scenes should
recruit both ventral emotional and dorsal attentional networks
for participants in Group 2. Second, some research suggests
H.M. Fichtenholtz et al. / Cognitive Brain Research 20 (2004) 67–80 69
that the ability of emotional stimuli to elicit activity in ventral
stream regions is relatively automatic [31] (see Ref. [46] for
review) and should not be affected by task relevancy (but see
Ref. [45]). Consequently, the response of ventral stream
regions to emotional stimuli should be equivalent across
Groups 1 and 2. Third, the results of Yamasaki et al. [60]
suggest that the processing of emotional distracters and
attentional targets within the oddball paradigm occurs in
the same broad region of the ACG. Therefore, when the
emotional scenes are task relevant (i.e., in Group 2), atten-
tional and emotional processing should be integrated and
engender more ACG activity than in Group 1, where these
functions are distributed across different stimulus categories
over time. Finally, we test whether the oddball response in
dorsal brain regions is invariant to emotional content. Be-
cause dorsal frontoparietal cortex is consistently activated in
oddball tasks that have used a variety of target stimuli
[8,9,25,35,49], we expect to see similar activity in these
regions across the two experimental groups.
2. Method
2.1. Participants
Twenty-nine healthy right-handed adults were randomly
assigned to one of two groups. Group 1 consisted of 13
participants. Data from three participants were not analyzed
due to excessive head movement. Head motion was analyzed
using a center of mass measurement, and participants were
discarded if they showedmore than 3mm of movement in the
X, Y, or Z planes. The analyzed group consisted of 10
participants (four males). Some of the region-of-interest
(ROI) data from this group were previously reported by
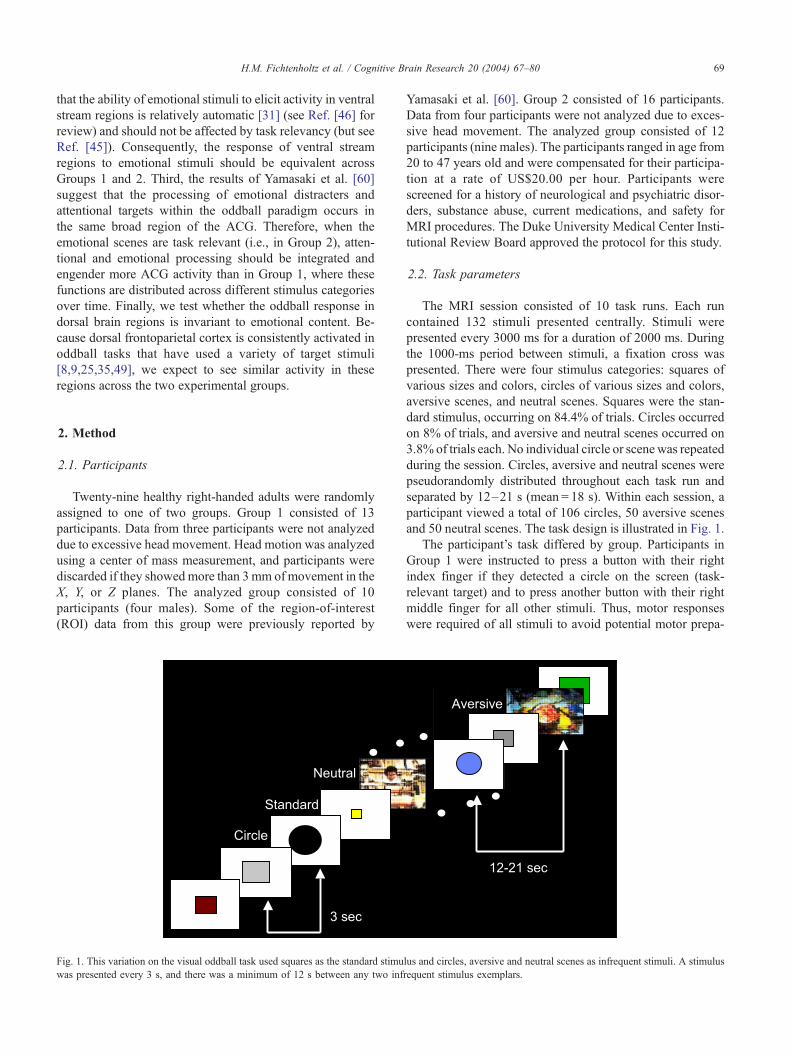
Fig. 1. This variation on the visual oddball task used squares as the standard stimu
was presented every 3 s, and there was a minimum of 12 s between any two inf
Yamasaki et al. [60]. Group 2 consisted of 16 participants.
Data from four participants were not analyzed due to exces-
sive head movement. The analyzed group consisted of 12
participants (nine males). The participants ranged in age from
20 to 47 years old and were compensated for their participa-
tion at a rate of US$20.00 per hour. Participants were
screened for a history of neurological and psychiatric disor-
ders, substance abuse, current medications, and safety for
MRI procedures. The Duke University Medical Center Insti-
tutional Review Board approved the protocol for this study.
2.2. Task parameters
The MRI session consisted of 10 task runs. Each run
contained 132 stimuli presented centrally. Stimuli were
presented every 3000 ms for a duration of 2000 ms. During
the 1000-ms period between stimuli, a fixation cross was
presented. There were four stimulus categories: squares of
various sizes and colors, circles of various sizes and colors,
aversive scenes, and neutral scenes. Squares were the stan-
dard stimulus, occurring on 84.4% of trials. Circles occurred
on 8% of trials, and aversive and neutral scenes occurred on
3.8% of trials each. No individual circle or scene was repeated
during the session. Circles, aversive and neutral scenes were
pseudorandomly distributed throughout each task run and
separated by 12–21 s (mean = 18 s). Within each session, a
participant viewed a total of 106 circles, 50 aversive scenes
and 50 neutral scenes. The task design is illustrated in Fig. 1.
The participant’s task differed by group. Participants in
Group 1 were instructed to press a button with their right
index finger if they detected a circle on the screen (task-
relevant target) and to press another button with their right
middle finger for all other stimuli. Thus, motor responses
were required of all stimuli to avoid potential motor prepa-
lus and circles, aversive and neutral scenes as infrequent stimuli. A stimulus
requent stimulus exemplars.
H.M. Fichtenholtz et al. / Cognitive Brain Research 20 (2004) 67–8070
ration and execution confounds across stimulus categories.
Participants were also instructed to keep a mental count of
the number of targets, which was reported to the experiment-
er at the end of each run. The instructions for participants in
Group 2 were identical, except that they pressed a button and
kept a mental count of aversive scenes (task-relevant target).
To re-emphasize, the only difference between the two exper-
imental groups was the assignment of the task-relevant target
category. All sensory stimuli, response requirements and task
parameters were identical across the groups.
2.3. Stimuli
Aversive scenes were selected from the International
Affective Picture System (IAPS) [33] and depicted human
violence, mutilation, and disease. Neutral scenes depicted
everyday activities and were compiled from the IAPS set and
in-house sources to equate the stimulus categories for mean
luminance and chromatic features. Mean luminance was
adjusted to fall between 112.5 and 113.5 luminance units
with a S.D. between 62.5 and 63.5 using Photoshop software
(Adobe Systems, San Jose, CA). All of the scenes contained
human figures or body parts. The scenes were selected
according to ratings for arousal (1 = low, 9 = high) and valence
(1 = negative, 9 = positive). Ratings were provided in the
IAPS norms and from a pilot group of participants. Arousal
ratings were between 5 and 8 for aversive scenes and between
1 and 3 for neutral scenes. Valence ratings were between 1 and
3 for aversive scenes and between 4 and 6 for neutral scenes.
By using these ranges, there was no overlap between the
ratings for the two groups of scenes. The circles and squares
were trial-unique and varied in their size and color.
2.4. MRI acquisition
Images were acquired using a 1.5T General Electric NVi
scanner (Milwaukee, WI) equipped with 41 mT/m gra-
dients. Head movement was minimized by supporting the
participant’s head in a vacuum cushion. A localizer series
was acquired to identify the anterior (AC) and posterior
(PC) commissures. A high-resolution T1-weighted structur-
al series was acquired parallel to the AC–PC plane (34
slices, TR = 450 ms, TE = 20 ms, FOV = 24 cm, ma-
trix = 2562, slice thickness = 3.75 mm). A second T1-
weighted series was acquired perpendicular to the AC–PC
plane using the same parameters. Gradient echo echoplanar
images (34 slices, TR = 3000 ms, TE = 40 ms, FOV= 24 cm,
matrix = 642, flip angle = 90j, slice thickness = 3.75 mm;
resulting in 3.75 mm3 isotropic voxels) sensitive to blood-
oxygenation-level-dependent contrast were acquired using
the same prescription as the T1-weighted structural images.
2.5. fMRI data analysis
Two data analysis methods were used based on voxel-wise
statistical parametric mapping (SPM) and anatomical ROI
drawings. Anatomical ROIs were drawn for each participant
individually based on high-resolution coronal anatomical
images. ROIs were drawn using an in-house mouse driven
computer program (Brain Imaging and Analysis Center,
Duke University). The program ran within the Matlab envi-
ronment (Mathworks, Natick, MA) on a PC-DOS platform.
Anatomical constraints were defined for each participant
individually, guided by the anatomical borders described in
Talairach and Tournoux [52] and Duvernoy [15]. Slices were
indexed by their distance from the anterior commissure to
allow the activations in these regions to be compared across
participants. ROIs were drawn separately for each hemi-
sphere. There were 14 ROIs drawn for each participant.
The ROIs were drawn on a slice-by-slice basis for the middle
frontal gyrus (MFG) on 8 slices, inferior frontal gyrus (IFG)
on 8 slices, cingulate gyrus (CG) on 16 slices, intraparietal
sulcus (IPS) on 12 slices, supramarginal gyrus (SMG) on 5
slices, FFG on 14 slices, and AMG on 3 slices. These
procedures have been described previously by Jha and
McCarthy [24] and Yamasaki et al. [60].
Volumes were corrected for their interleaved acquisition
sequence using a cubic spline interpolation to realign each
voxel’s time course to the time-to-repetition (TR) onset. No
spatial preprocessing was performed. Following the method
of McCarthy et al. [35], epochs of interest were defined
around the onsets of the circles, aversive and neutral scenes.
Each epoch consisted of the two TRs prior to the stimulus
(beginning at � 6 s) and the five TRs after the stimulus
(ending at 15 s). The raw MR signal was extracted for each
epoch and averaged for each stimulus type. An average of the
MR signal for all of the voxels within each ROI was plotted to
represent the experimentally derived hemodynamic response
function for each ROI during each stimulus condition. The
average MR signal values were converted to percent signal
change relative to the average of the pre-stimulus baseline
points. The only stimuli presented during the baseline period
of each epoch were the standard stimuli, to allow responses
from the novel stimulus categories to return to baseline. The
interval between successive events of interest (targets, dis-
tracters) was sufficiently long (>12 s) to minimize possible
refractory effects [22,23]. In addition to the length of time
between stimuli of interest, any remaining overlap was
consistent across all stimulus types since event ordering
was randomized. The rapid nature of the stimulus presenta-
tion provides a baseline for analyses comparing the novel
stimulus categories to each other, which was our main interest
a priori, but precludes identification of brain regions activated
by the standards themselves. The percent signal change at the
peak time point (6 s post-stimulus) was analyzed by repeated-
measures analysis of variance (ANOVA) followed by post
hoc comparisons using the Student–Neuman–Keuls test to
further investigate the main effects due to stimulus category
and group. An alpha level of 0.05 was used to determine
significant differences in all contrasts.
Data were also analyzed using SPM99 [16] to identify
regions of activation outside those hypothesized a priori. The

H.M. Fichtenholtz et al. / Cognitive Brain Research 20 (2004) 67–80 71
functional images were corrected for their interleaved acqui-
sition order and realigned to the first image to correct for head
motion. The realigned images were then co-registered to the
co-planar anatomical image for each participant. The co-
planar anatomical images were spatially normalized to a
common stereotactic space using the Montreal Neurological
Institute (MNI) template included in SPM99. The functional
images were then normalized to the common space using the
parameters defined by the co-planar anatomical image and
smoothed using an 8-mm isotropic Gaussian kernel.
The responses to the infrequent stimulus categories were
isolated by convolving a vector of onset times of the circles,
aversive and neutral scenes with a synthetic hemodynamic
response function that emphasized transient activity in re-
sponse to the events. The general linear model was used to
model the effects of interest and other confounding effects,
such as session effects or motion related artifacts, for each
participant. Across participant comparisons were made using
a random effects model which accounts for between partic-
ipant variability and allows for the generalization of the
results beyond the current group of participants. This is
especially critical for between-subjects designs. Two con-
junction analyses were performed by computing a composite
image of the active voxels across the two experimental
groups for aversive scenes and attentional targets. Conjunc-
tion images were calculated by finding voxels that reached a
significant threshold of p < 0.001 within each condition
included in the conjunction, for an overall level of
p < 0.000001 across two conditions. Statistical maps were
thresholded at the level of p < 0.001 uncorrected for all
analyses. The conjunction images provide information about
the extent of the common activations, but not their intensity.
To get this information, images were computed by multiply-
ing the activation T-maps for each condition of interest with
the original conjunction map. This procedure provides a
combined T-value for each cluster of activation across both
conditions. Coordinates of activated clusters were converted
from the MNI template to the stereotactic space described by
Talairach and Tournoux [52] according to methods described
by Lancaster et al. [27].
Table 1
Response times as a function of stimulus category
Mean S.E.M.
Group 1
Squares 517.3 51.0
Circles 674.1 46.4
Aversive scenes 705.6 48.3
Neutral scenes 669.3 45.7
Group 2
Squares 575.1 42.7
Circles 571.9 43.6
Aversive scenes 1005.9 48.6
Neutral scenes 1020.9 53.1
Circles were task-relevant for Group 1, and aversive scenes were task-
relevant for Group 2.
3. Results
3.1. Behavioral performance
Due to technical problems, button response data from
five subjects in Group 2 were not available for analysis;
thus, analyses of behavioral performance were conducted on
10 participants from Group 1 and 7 participants from Group
2. Mean (F S.E.M.) accuracy for target detection was high
for both groups (Group 1: 93.5%F 1.3; Group 2: 94.2%F1.3). There was no significant difference in accuracy be-
tween the two groups (t(15) =� 0.34, p = 0.74).
A two-way mixed ANOVA of reaction time (RT) data,
including group and stimulus type as factors, revealed
significant main effects of group and stimulus type and a
significant group� stimulus type interaction (F(1,15) =
5.49, p < 0.03; F(3,45) = 112.78, p < 0.001; F(3,45) = 51.78,
p < 0.001, respectively). Post hoc t tests across groups
revealed that Group 2 showed significantly longer RTs in
response to both the neutral and aversive scenes than Group
1 (t(15) = 4.99, p < 0.001; t(15) = 4.24, p < 0.001, respective-
ly). Within Group 1, subjects took longer to respond to
aversive than neutral scenes (t(9) = 2.95, p < 0.02), with an
intermediate RT to circles that was not significantly different
from either category. Furthermore, all stimulus types
showed longer RTs than standards. Within Group 2, RTs
in response to aversive and neutral scenes did not differ and
were longer than the RTs in response to circles and stand-
ards, which did not differ from each other. Means and
S.E.M.s can be found in Table 1.
These results suggest that participants in Group 2 were
taking longer to perform the task in order to achieve the
same level of accuracy. For both groups, RTs to the aversive
and neutral scenes were longer than the RTs to the standard
stimuli. This difference was also seen for the task-relevant
circles for Group 1.
3.2. fMRI results: ventral regions of interest
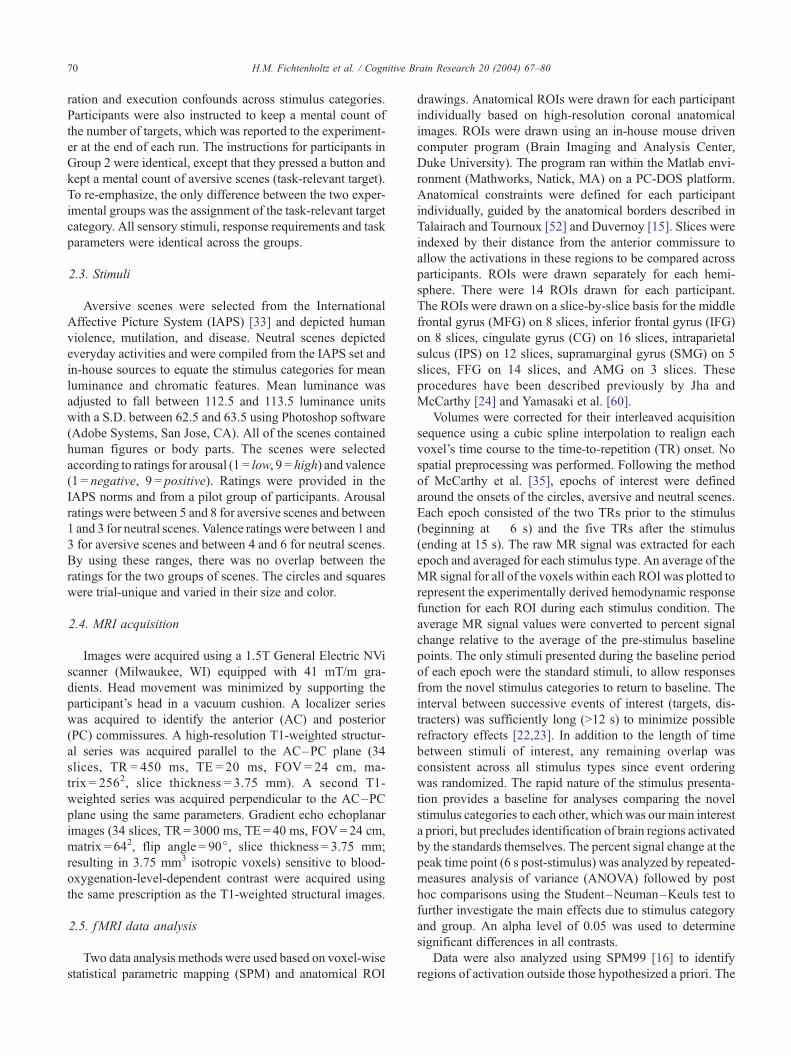
3.2.1. Amygdala and fusiform gyrus
Within the AMG and FFG, there were main effects of
stimulus type (F(2,40) = 15.05, p < 0.001 and F(2,40) =
159.06, p < 0.001, respectively). Post hoc comparisons
showed that aversive scenes generated larger responses than
neutral scenes, which, in turn, elicited larger responses than
circles (see Fig. 2).
3.2.2. Inferior frontal gyrus
A two-way ANOVA revealed a significant group�stim-
ulus type interaction (F(2,40) = 4.26, p = 0.021). A follow-up
one-way ANOVA for Group 1, where circles were task-
relevant, revealed a significant main effect of stimulus type
(F(2,18) = 22.37, p < 0.001). Post hoc comparisons showed
that aversive scenes generated a larger response than neutral
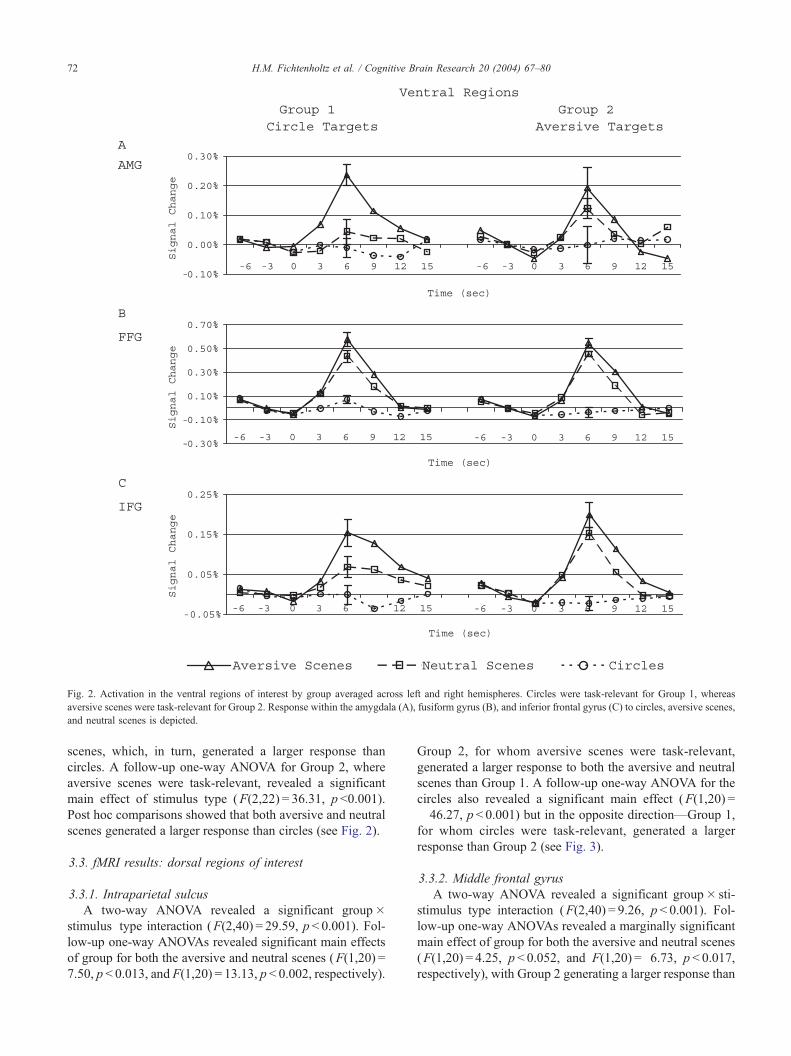
Fig. 2. Activation in the ventral regions of interest by group averaged across left and right hemispheres. Circles were task-relevant for Group 1, whereas
aversive scenes were task-relevant for Group 2. Response within the amygdala (A), fusiform gyrus (B), and inferior frontal gyrus (C) to circles, aversive scenes,
and neutral scenes is depicted.
H.M. Fichtenholtz et al. / Cognitive Brain Research 20 (2004) 67–8072
scenes, which, in turn, generated a larger response than
circles. A follow-up one-way ANOVA for Group 2, where
aversive scenes were task-relevant, revealed a significant
main effect of stimulus type (F(2,22) = 36.31, p <0.001).
Post hoc comparisons showed that both aversive and neutral
scenes generated a larger response than circles (see Fig. 2).
3.3. fMRI results: dorsal regions of interest
3.3.1. Intraparietal sulcus
A two-way ANOVA revealed a significant group�stimulus type interaction (F(2,40) = 29.59, p < 0.001). Fol-
low-up one-way ANOVAs revealed significant main effects
of group for both the aversive and neutral scenes (F(1,20) =
7.50, p < 0.013, and F(1,20) = 13.13, p < 0.002, respectively).
Group 2, for whom aversive scenes were task-relevant,
generated a larger response to both the aversive and neutral
scenes than Group 1. A follow-up one-way ANOVA for the
circles also revealed a significant main effect (F(1,20) =
� 46.27, p < 0.001) but in the opposite direction—Group 1,
for whom circles were task-relevant, generated a larger
response than Group 2 (see Fig. 3).
3.3.2. Middle frontal gyrus
A two-way ANOVA revealed a significant group� sti-
stimulus type interaction (F(2,40) = 9.26, p < 0.001). Fol-
low-up one-way ANOVAs revealed a marginally significant
main effect of group for both the aversive and neutral scenes
(F(1,20) = 4.25, p < 0.052, and F(1,20) = 6.73, p < 0.017,
respectively), with Group 2 generating a larger response than
Fig. 3. Activation in the dorsal regions of interest by group averaged across left and right hemispheres. Circles were task-relevant for Group 1, whereas aversive
scenes were task-relevant for Group 2. Response within the intraparietal sulcus (A), middle frontal gyrus (B), and supramarginal gyrus (C) to circles, aversive
scenes, and neutral scenes is depicted.
H.M. Fichtenholtz et al. / Cognitive Brain Research 20 (2004) 67–80 73
Group 1. A follow-up one-way ANOVA for the circles also
revealed a significant main effect of group (F(1,20) = 4.94,
p < 0.038), but in the opposite direction—Group 1 generated
a larger response than Group 2 (see Fig. 3).
3.3.3. Supramarginal gyrus
A two-way ANOVA revealed a significant group�stimulus type interaction (F(2,40) = 14.26, p < 0.001). A
follow-up one-way ANOVA for the aversive scenes revealed
a significant main effect of group (F(1,20) = 5.08, p<0.036),
with Group 2 generating a larger response than Group 1. A
follow-up one-way ANOVA for the circles revealed a
significant main effect of group (F(1,20) =41.21, p <
0.001), with Group 1 generating a larger response than
Group 2. A follow-up one-way ANOVA for the neutral
scenes revealed no significant effects (F(1,20) = 0.97, p =
0.336; see Fig. 3).
3.4. fMRI results: cingulate gyrus
The CG was split into four regions along its rostrocaudal
extent. The most anterior region (1) extended from 1.875 to
0.75 cm anterior to the AC. The second most anterior
region (2) extended from 0.375 cm anterior to the AC to
0.75 cm posterior to the AC. The second most posterior
region (3) extended from 1.125 to 2.25 cm posterior to the
AC. The most posterior region (4) extended from 2.625 to
3.75 cm posterior to the AC. Regions (1) and (2) encom-
passed Brodmann’s area 24, whereas regions (3) and (4)
encompassed Broadmann’s area 23 ([51]; see Fig. 4 inset).
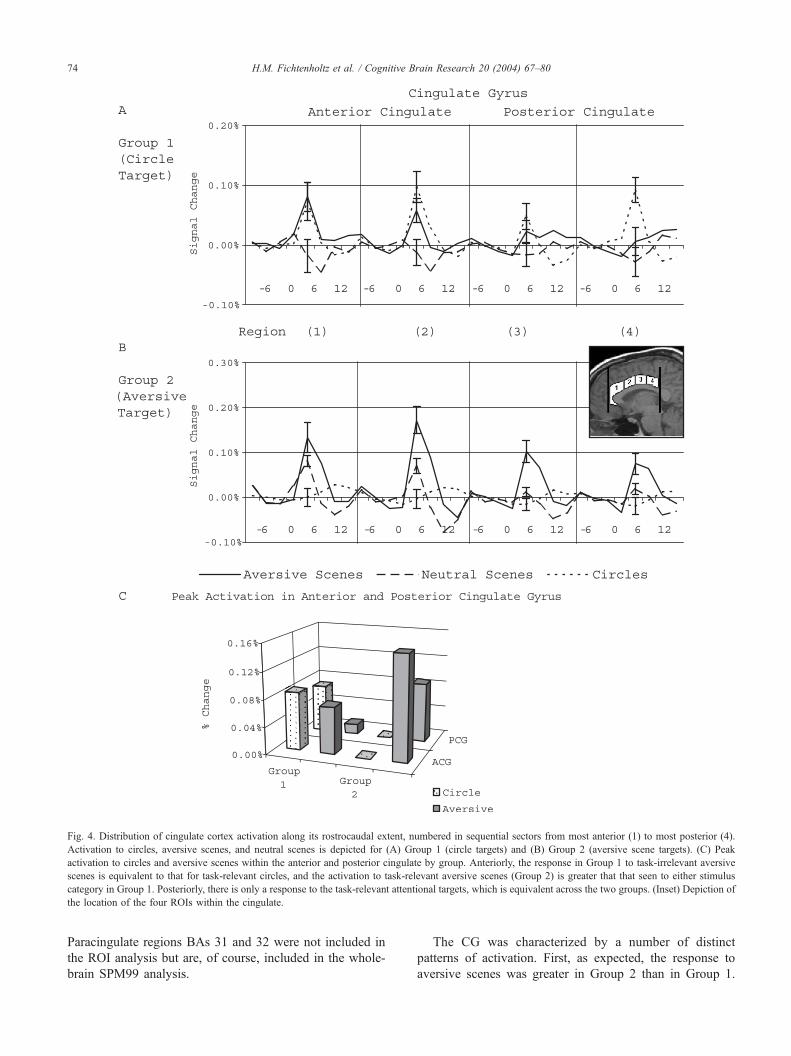
Fig. 4. Distribution of cingulate cortex activation along its rostrocaudal extent, numbered in sequential sectors from most anterior (1) to most posterior (4).
Activation to circles, aversive scenes, and neutral scenes is depicted for (A) Group 1 (circle targets) and (B) Group 2 (aversive scene targets). (C) Peak
activation to circles and aversive scenes within the anterior and posterior cingulate by group. Anteriorly, the response in Group 1 to task-irrelevant aversive
scenes is equivalent to that for task-relevant circles, and the activation to task-relevant aversive scenes (Group 2) is greater that that seen to either stimulus
category in Group 1. Posteriorly, there is only a response to the task-relevant attentional targets, which is equivalent across the two groups. (Inset) Depiction of
the location of the four ROIs within the cingulate.
H.M. Fichtenholtz et al. / Cognitive Brain Research 20 (2004) 67–8074
Paracingulate regions BAs 31 and 32 were not included in
the ROI analysis but are, of course, included in the whole-
brain SPM99 analysis.
The CG was characterized by a number of distinct
patterns of activation. First, as expected, the response to
aversive scenes was greater in Group 2 than in Group 1.
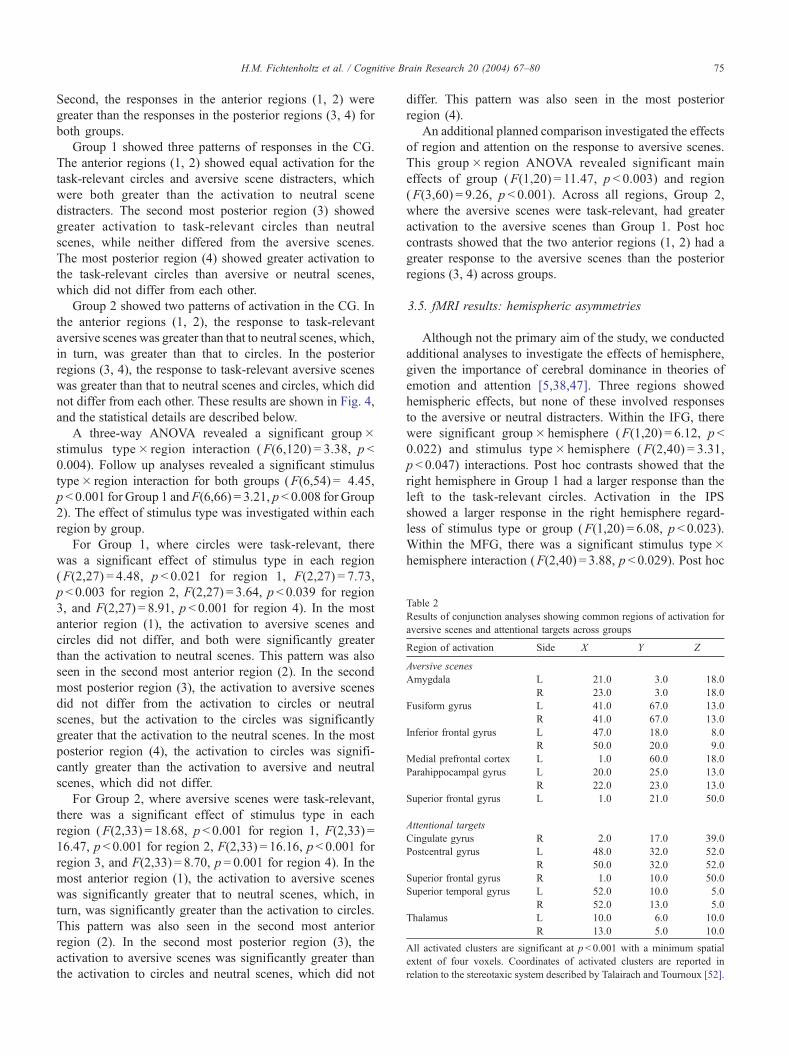
Table 2
Results of conjunction analyses showing common regions of activation for
aversive scenes and attentional targets across groups
Region of activation Side X Y Z
Aversive scenes
Amygdala L � 21.0 � 3.0 � 18.0
R 23.0 � 3.0 � 18.0
Fusiform gyrus L � 41.0 � 67.0 � 13.0
R 41.0 � 67.0 � 13.0
Inferior frontal gyrus L � 47.0 18.0 � 8.0
R 50.0 20.0 � 9.0
Medial prefrontal cortex L � 1.0 60.0 18.0
Parahippocampal gyrus L � 20.0 � 25.0 � 13.0
R 22.0 � 23.0 � 13.0
Superior frontal gyrus L � 1.0 21.0 50.0
Attentional targets
Cingulate gyrus R 2.0 17.0 39.0
Postcentral gyrus L � 48.0 � 32.0 52.0
R 50.0 � 32.0 52.0
Superior frontal gyrus R 1.0 10.0 50.0
Superior temporal gyrus L � 52.0 10.0 � 5.0
R 52.0 13.0 � 5.0
Thalamus L � 10.0 � 6.0 10.0
R 13.0 � 5.0 10.0
All activated clusters are significant at p< 0.001 with a minimum spatial
extent of four voxels. Coordinates of activated clusters are reported in
relation to the stereotaxic system described by Talairach and Tournoux [52].
H.M. Fichtenholtz et al. / Cognitive Brain Research 20 (2004) 67–80 75
Second, the responses in the anterior regions (1, 2) were
greater than the responses in the posterior regions (3, 4) for
both groups.
Group 1 showed three patterns of responses in the CG.
The anterior regions (1, 2) showed equal activation for the
task-relevant circles and aversive scene distracters, which
were both greater than the activation to neutral scene
distracters. The second most posterior region (3) showed
greater activation to task-relevant circles than neutral
scenes, while neither differed from the aversive scenes.
The most posterior region (4) showed greater activation to
the task-relevant circles than aversive or neutral scenes,
which did not differ from each other.
Group 2 showed two patterns of activation in the CG. In
the anterior regions (1, 2), the response to task-relevant
aversive scenes was greater than that to neutral scenes, which,
in turn, was greater than that to circles. In the posterior
regions (3, 4), the response to task-relevant aversive scenes
was greater than that to neutral scenes and circles, which did
not differ from each other. These results are shown in Fig. 4,
and the statistical details are described below.
A three-way ANOVA revealed a significant group�stimulus type� region interaction (F(6,120) = 3.38, p <
0.004). Follow up analyses revealed a significant stimulus
type� region interaction for both groups (F(6,54) = 4.45,
p < 0.001 for Group 1 andF(6,66) = 3.21, p < 0.008 for Group
2). The effect of stimulus type was investigated within each
region by group.
For Group 1, where circles were task-relevant, there
was a significant effect of stimulus type in each region
(F(2,27) = 4.48, p < 0.021 for region 1, F(2,27) = 7.73,
p < 0.003 for region 2, F(2,27) = 3.64, p < 0.039 for region
3, and F(2,27) = 8.91, p < 0.001 for region 4). In the most
anterior region (1), the activation to aversive scenes and
circles did not differ, and both were significantly greater
than the activation to neutral scenes. This pattern was also
seen in the second most anterior region (2). In the second
most posterior region (3), the activation to aversive scenes
did not differ from the activation to circles or neutral
scenes, but the activation to the circles was significantly
greater that the activation to the neutral scenes. In the most
posterior region (4), the activation to circles was signifi-
cantly greater than the activation to aversive and neutral
scenes, which did not differ.
For Group 2, where aversive scenes were task-relevant,
there was a significant effect of stimulus type in each
region (F(2,33) = 18.68, p < 0.001 for region 1, F(2,33) =
16.47, p < 0.001 for region 2, F(2,33) = 16.16, p < 0.001 for
region 3, and F(2,33) = 8.70, p = 0.001 for region 4). In the
most anterior region (1), the activation to aversive scenes
was significantly greater that to neutral scenes, which, in
turn, was significantly greater than the activation to circles.
This pattern was also seen in the second most anterior
region (2). In the second most posterior region (3), the
activation to aversive scenes was significantly greater than
the activation to circles and neutral scenes, which did not
differ. This pattern was also seen in the most posterior
region (4).
An additional planned comparison investigated the effects
of region and attention on the response to aversive scenes.
This group� region ANOVA revealed significant main
effects of group (F(1,20) = 11.47, p < 0.003) and region
(F(3,60) = 9.26, p < 0.001). Across all regions, Group 2,
where the aversive scenes were task-relevant, had greater
activation to the aversive scenes than Group 1. Post hoc
contrasts showed that the two anterior regions (1, 2) had a
greater response to the aversive scenes than the posterior
regions (3, 4) across groups.
3.5. fMRI results: hemispheric asymmetries
Although not the primary aim of the study, we conducted
additional analyses to investigate the effects of hemisphere,
given the importance of cerebral dominance in theories of
emotion and attention [5,38,47]. Three regions showed
hemispheric effects, but none of these involved responses
to the aversive or neutral distracters. Within the IFG, there
were significant group� hemisphere (F(1,20) = 6.12, p <
0.022) and stimulus type� hemisphere (F(2,40) = 3.31,
p < 0.047) interactions. Post hoc contrasts showed that the
right hemisphere in Group 1 had a larger response than the
left to the task-relevant circles. Activation in the IPS
showed a larger response in the right hemisphere regard-
less of stimulus type or group (F(1,20) = 6.08, p < 0.023).
Within the MFG, there was a significant stimulus type�hemisphere interaction (F(2,40) = 3.88, p < 0.029). Post hoc
Fig. 5. Statistical parametric maps from the voxelwise conjunction analyses across groups. (A) Conjunction of attentional targets across groups (circles from
Group 1 and aversive scenes from Group 2), p< 0.001 uncorrected within each group. (B) Conjunction analysis of aversive scenes across groups, p< 0.001
uncorrected within each group. Talairach coordinates of all activated regions are provided in Table 2.
H.M. Fichtenholtz et al. / Cognitive Brain Research 20 (2004) 67–8076
contrasts showed that the right hemisphere showed larger
activation than the left to the circles.
To summarize, in each of these regions the response in
the right hemisphere was greater than the left hemisphere. In
the IPS this was true for all stimulus types across groups,
but in the IFG and MFG the hemispheric asymmetry was
only apparent in response to the task-relevant circles (Group
1). In the IFG, the response to the circles by Group 1 went
below baseline in the post-stimulus period, which accounts
for the hemispheric asymmetry effect.
3.6. fMRI results: SPM analysis
Two conjunction analyses were performed to determine
the regions that were responsive to (a) the emotional content
of a stimulus (regardless of task relevancy) and (b) the task-
relevance of a stimulus (regardless of emotional content).
The results of these analyses are presented in Table 2 and
Fig. 5.
The conjunction of aversive scenes across both groups
revealed activation bilaterally in the amygdala, FFG, IFG,
and parahippocampal gyrus. There was also activation in the
left medial prefrontal cortex and left superior frontal gyrus.
The conjunction of attentional targets across both groups
revealed activation bilaterally in the postcentral gyrus,
superior temporal gyrus and thalamus, as well as activation
in the right ACG and superior frontal gyrus.
4. Discussion
Using a visual oddball task, the current study demon-
strated that a network of regions in the ventral portion of
the brain were sensitive to aversive emotional content
irrespective of attentional focus, as defined by task rele-
vancy. These brain areas included the AMG, IFG, FFG,
parahippocampal gyrus, and visual association cortices. An
additional dorsal network of brain regions was sensitive to
the attentional focus placed upon task-relevant stimuli
irrespective of their emotional content. These brain areas
included the IPS, SMG, MFG, and PCG. The ACG
contributed to both attentional and emotional functions.
The response in the ACG was equivalent to both task-
relevant targets and emotionally salient distracters in Group
1, where attentional and emotional processing were distrib-
uted across different stimulus categories over time. In
Group 2, where attentional and emotional processing con-
verged on a common stimulus target, the response in the
ACG was super-additive relative to that observed for Group
1. This pattern of results supports anatomical theories
suggesting that the anterior cingulate serves to integrate
emotional and attentional streams of processing in the brain
[34,37,43]. Below, we discuss the findings relative to other
studies of emotional scene encoding and attentional oddball
tasks.
4.1. Ventral regions
Emotional scene encoding is known to engage multiple
stages of visual processing along the ventral stream as well
as fronto-limbic structures [29,32,44,53]. The common
areas of activation across studies include the extrastriate
cortex, AMG, FFG, and IFG. The present study showed that
activity along these ventral regions was similar across the
two experimental groups despite longer RTs when the
emotional scenes were task relevant. These brain regions
thus appear to be insensitive to time-on-task when accuracy
is equated. In a review of this literature, Phan et al. [46]
suggest that these ventral regions may be active specifically
in response to the visual presentation of emotional informa-

H.M. Fichtenholtz et al. / Cognitive Brain Research 20 (2004) 67–80 77
tion and the induction of fear by these stimuli (specifically
activation in the amygdala). They also suggest that the
ventral fronto-limbic and occipital regions are active in
response to the emotional content of the stimulus regardless
of which stimulus has the attentional focus during the task.
The current results provide direct support for this claim.
Similar findings have been reported in the amygdala during
attentional studies of fearful facial expressions [3,56]. How-
ever, other research suggests that amygdalar processing of
facial expressions is enhanced when the emotion is task-
relevant [18,19] or under conditions of high attentional load
[45]. Still other studies have shown enhancement of amyg-
dala responses under passive, subliminal, or unattended
processing conditions ([3]—disgust expression, [40,54]). It
is not yet clear which factors contribute to these discrepant
results (stimulus type, emotional category, attentional de-
mands, task design, anatomical locus, etc.).
The present study also revealed a suppression of left IFG
activity to circles when they were attentional targets (Group
1) but not when aversive scenes were attentional targets
(Group 2). There was also a trend towards suppression of
MFG activity to the aversive scenes when the circles were
attentional targets (Group 1) but not when the scenes were
the attentional targets (Group 2). In both cases, the responses
were below baseline during the post-stimulus period. In other
words, different compartments within the prefrontal cortex
that primarily index cognitive and emotional functions,
respectively, appeared to interact differently according to
whether attentional and emotional processing were distrib-
uted across objects over time or were focused concurrently
on the same stimulus category. This pattern is consistent
with the observation by Drevets and Raichle [13] that
neural activity may be reduced in areas responsible for
emotional processing during cognitive operations and vice
versa (i.e., Group 1 showed IFG deactivations to circle
targets but simultaneous MFG activations to the same
stimuli). Although the orbitofrontal cortex is also an
important prefrontal component for emotional processing,
signal dropout due to susceptibility artifacts prevented our
ability to image this area using conventional EPI imaging
(see Ref. [26]).
4.2. Dorsal regions
The dorsal frontoparietal regions engaged by attentional
targets in the present study are consistent with those
reported in previous oddball tasks [4,8,9,25,35,49]. Further-
more, we show here that these dorsal regions respond to
task-relevant oddball stimuli similarly despite variations in
their emotional properties.
Previous oddball tasks that have included task-irrelevant
distracters in the experimental design have reported mixed
results with respect to neural processing of stimulus prob-
ability [8,9,25]. In contrast to the current study, where no
dorsal activation was seen in response to the distracters,
Clark et al. [9] showed activity in left superior parietal
gyrus and right postcentral gyrus to distracting stimuli.
Other studies have described results more consistent with
the current findings, with no significant activation in dorsal
regions to distracting stimuli but a trend towards signifi-
cance in the medial prefrontal cortex and anterior cingulate
[8,25]. Despite some variability in distracter-related activa-
tion, there is much consistency across studies with respect
to dorsal stream processing of attentional (oddball) targets
and their characteristic electrophysiological signature,
namely a P300 response (reviewed in Ref. [17]). The
frontoparietal activations are also consistent with other
studies in which attention was distributed across time rather
than space [10].
Finally, we comment on the lack of dorsal stream
processing to emotional stimuli when they are not task-
relevant. Although some studies have shown parietal cortex
activation during emotional processing tasks [29,41,48,
50,57,59], the present study raises the question of whether
attentional demands are driving such effects. Some of the
studies showing dorsal activation have used tasks in which
the emotional information is task-relevant, which may have
consequently introduced a confound between emotional and
attentional factors. Others have compared passive viewing
to an active task condition where the two conditions are not
equally demanding. Lane et al. [28] also showed greater
parietal lobe responses to aversive scenes when participants
evaluated their spatial setting rather than their emotional
content. This finding supports the results of the present
study regarding the influence of task relevancy on recruiting
dorsal stream responses to emotional stimuli.
4.3. Emotion and attention: cingulate gyrus
Previous researchers have divided the ACG into func-
tionally distinct regions, with more rostral and ventral areas
subserving emotional functions and more caudal and dorsal
areas subserving cognitive functions [12,55]. These distinc-
tions have been supported by recent functional imaging
studies largely using Stroop interference paradigms where
emotion and attention conflict in a task-relevant manner
[6,59]. The present study took a different approach to the
topic of attentional and emotional representation within the
cingulate gyrus. Namely, we examined how cingulate activ-
ity varied when emotional and attentional processing were
distributed in time (Group 1) and conjointly engaged (Group
2). By comparing activity across the experimental groups,
one can understand how the cingulate signals these functions
both in isolation and in combination.
The ROI analysis divided the cingulate gyrus into four
regions along its rostrocaudal extent. The results implicate
a functional boundary between the first two and last two
regions. The anterior regions (1, 2) encompassing BA 24
responded equally to the attentional targets (circles) and
the emotional distracters for Group 1. Importantly, these
regions more than doubled their activity in response to
emotional stimuli in Group 2, for whom the emotional

H.M. Fichtenholtz et al. / Cognitive Brain Research 20 (2004) 67–8078
scenes served as attentional targets. In contrast, the poste-
rior regions (3, 4) encompassing BA 23 were only engaged
to the attentional targets regardless of emotional content.
The results show clear differences between anterior and
posterior divisions of the cingulate, but they do not support
a dissociation between affective and cognitive subdivisions
within the ACG [7]. Our conclusions are limited, though,
by the resolution of the methods employed. The ROIs
were drawn in coronal section and may not have been
ideal for extracting such subdivisions of the ACG. None-
theless, the analysis showed that even rostral BA 24,
which is hypothesized to lie in the affective division of
ACG, was sensitive to both emotional and attentional
factors. The voxelwise SPM analysis did suggest a
dorsal–ventral gradient in the location of the most acti-
vated (peak) voxels, with circle targets engaging more
dorsal areas of the ACG. However, peak activity to
emotional scenes was in front of ACG proper, located in
Brodmann area 9/10, and there was additional activity to
the aversive scenes in a dorsal region of the ACG (Fig. 5).
Thus, the affective and cognitive subdivisions of the
anterior cingulate may not be separable under all task
conditions. Instead, the findings support anatomic theories
that the ACG is a site where the integration of the
emotional value and the task-relevancy of a stimulus are
combined [2,34,37,43].
4.4. Limitations
The present study has three main limitations. First, only
aversive scenes were used as emotional stimuli. Therefore,
the relative contributions of arousal and valence could not be
ascertained. Second, because of the small sample sizes, we
could not analyze the influence of gender on brain activation
patterns. Third, the attentional demands placed upon partic-
ipants may have differed across the two conditions, despite
similar dorsal stream responses to aversive scenes across
groups. This is reflected both in the increased RTs to scenes
in Group 2 (Table 1) and in the partial recruitment of dorsal
stream regions to neutral scenes in Group 2 (Fig. 3). This
possible difference in attentional demands is an unavoidable
consequence of varying the assignment of target stimuli
across the two groups while keeping all other task parameters
the same. Although detection accuracy was equivalent across
groups, future studies should strive to equate both accuracy
and RTs across groups.
4.5. Conclusions
The present study provides insight into the interactions
between emotional and attentional processing networks in
the brain. Viewing emotional material, regardless of task
relevancy, elicited activation in ventral stream regions,
including the amygdala and higher-level extrastriate cortex.
Responding to task-relevant stimuli, irrespective of their
emotional content, elicited activation in dorsal frontoparietal
and posterior cingulate areas known to be involved in
attentional control. Activation in the ACG was sensitive to
both attentional and emotional factors and potentially serves
as a critical node linking these two functions. Not only was
the ACG responsive to both aversive scenes and attentional
targets when presented intermittently (Group 1), but its
activity more than doubled when the aversive scenes be-
came the attentional targets (Group 2). These findings
support and extend prominent network theories of emo-
tion–attention interactions that highlight the integrative role
played by the anterior cingulate.
Acknowledgements
This work was supported by National Institutes of Health
grants P50 MH60451 and R01 DA14094, a Young
Investigator Award from the National Alliance for Research
on Schizophrenia and Depression, and a Ralph E. Powe
Junior Faculty Enhancement Award from Oak Ridge
Associated Universities.
References
[1] R. Adolphs, Neural systems for recognizing emotion, Curr. Opin.
Neurobiol. 12 (2002) 169–177.
[2] J.M. Allman, A. Hakeem, J.M. Erwin, E. Nimchinsky, P. Hof, The
anterior cingulate cortex: the evolution of an interface between emo-
tion and cognition, Ann. N. Y. Acad. Sci. 935 (2001) 107–117.
[3] A.K. Anderson, K. Christoff, D. Panitz, E. De Rosa, J.D.E. Gabrieli,
Neural correlates of the automatic processing of threat facial signals,
J. Neurosci. 23 (2003) 5627–5633.
[4] B.A. Ardekani, S.J. Choi, G.-A. Hossein-Zadeh, B. Porjesz, J.L.
Tanabe, K.O. Lim, R. Bilder, J.A. Helpern, H. Begleiter, Functional
magnetic resonance imaging of brain activity in the visual oddball
task, Cogn. Brain Res. 14 (2002) 347–356.
[5] J.C. Borod, B.A. Cicero, L.K. Obler, J. Welkowitz, H.M. Erhan, C.
Santschi, I.S. Grunwald, R.M. Agosti, J.R. Whalen, Right hemisphere
emotional perception: evidence across multiple channels, Neuropsy-
chology 12 (1998) 446–458.
[6] G. Bush, P.J. Whalen, B.R. Rosen, M.A. Jenike, S.C. McInerney, S.L.
Rauch, The counting Stroop: an interference task specialized for func-
tional neuroimaging-validation study with functional MRI, Hum.
Brain Mapp. 6 (1998) 270–282.
[7] G. Bush, P. Luu, M.I. Posner, Cognitive and emotional influences in
anterior cingulate cortex, Trends Cogn. Sci. 4 (2000) 215–222.
[8] V.P. Clark, S. Fannon, S. Lai, R. Benson, L. Bauer, Responses to rare
visual target and distractor stimuli using event-related fMRI, J. Neu-
rophysiol. 83 (2000) 3133–3139.
[9] V.P. Clark, S. Fannon, S. Lai, R. Benson, Paradigm-dependant mo-
dulation of event-related fMRI activity evoked by the oddball task,
Hum. Brain Mapp. 14 (2001) 116–127.
[10] J.T. Coull, A.C. Nobre, Where and when to pay attention: the neural
systems for directing attention to spatial locations and to time inter-
vals as revealed by both PET and fMRI, J. Neurosci. 18 (1998)
7426–7435.
[11] E. Courchesne, S.A. Hillyard, R. Galambos, Stimulus novelty, task
relevance and the visual evoked potential in man, Electroencephalogr.
Clin. Neurophysiol. 39 (1975) 131–143.
[12] O. Devinsky, M.J. Morrell, B.A. Vogt, Contributions of anterior cin-
gulate cortex to behaviour, Brain 118 (1995) 279–306.
H.M. Fichtenholtz et al. / Cognitive Brain Research 20 (2004) 67–80 79
[13] W.C. Drevets, M.E. Raichle, Suppression of regional cerebral blood
flow during emotional versus higher cognitive processes: implications
for interactions between emotion and cognition, Cogn. Emot. 12
(1998) 353–385.
[14] J. Driver, R.S.J. Frackowaik, Neurobiological measures of human
selective attention, Neuropsychologia 39 (2001) 1257–1262.
[15] H.M. Duvernoy, The Human Brain: Surface, Blood Supply, and Three
Dimensional Sectional Anatomy, Springer-Verlag, Wien, 1999.
[16] R.S.J. Frackowiak, K.J. Friston, C.D. Frith, R.J. Dolan, J.C.
Mazziotta, Human Brain Function, Academic Press, New York,
1997.
[17] D. Friedman, Y.M. Cycowicz, H. Gaeta, The novelty P3: an event-
related brain potential (ERP) sign of the brain’s evaluation of novelty,
Neurosci. Biobehav. Rev. 25 (2001) 355–373.
[18] R.C. Gur, L. Schroeder, T. Turner, C. McGrath, R.M. Chan, B.I.
Turetsky, D. Alsop, J. Maldjian, R.E. Gur, Brain activation during
facial emotion processing, NeuroImage 16 (2002) 651–662.
[19] A.R. Hariri, S.Y. Bookheimer, J.C. Mazziotta, Modulating emotional
responses: effects of a neocortical network on the limbic system,
NeuroReport 11 (2000) 43–48.
[20] J.V. Haxby, C.L. Grady, B. Horwitz, L.G. Ungerleider, M. Mishkin,
R.E. Carson, P. Herscovitch, M.B. Schapiro, S.I. Rapoport, Dissoci-
ation of object and spatial visual processing in human extrastriate
cortex, Proc. Natl. Acad. Sci. U. S. A. 88 (1991) 1621–1625.
[21] K.M. Heilman, R.T. Watson, E. Valenstein, A.R. Damasio, Localiza-
tion of lesions in neglect, in: A. Kertesz (Ed.), Localization in Neu-
ropsychology, Academic Press, New York, 1983, pp. 455–470.
[22] S.A. Huettel, G. McCarthy, Evidence for a refractory period in the
hemodynamic response to visual stimuli as measured by MRI, Neuro-
Image 11 (2000) 547–553.
[23] S.A. Huettel, G. McCarthy, Regional differences in the refractory
period of the hemodynamic response: an event-related fMRI study,
NeuroImage 14 (2001) 967–976.
[24] A.P. Jha, G. McCarthy, The influence of memory load upon delay-
interval activity in a working-memory task: an event-related functio-
nal MRI study, J. Cogn. Neurosci. 12 (S2) (2000) 90–105.
[25] E. Kirino, A. Belger, P. Goldman-Rakic, G. McCarthy, Prefrontal
activation evoked by infrequent target and novel stimuli in a visual
target detection task: an event-related functional magnetic resonance
imaging study, J. Neurosci. 20 (2000) 6612–6618.
[26] K.S. LaBar, D.R. Gitelman, M.-M. Mesulam, T.B. Parrish, Impact of
signal-to-noise on functional MRI of the human amygdala, Neuro-
Report 12 (2001) 3461–3464.
[27] J.L. Lancaster, M.G. Woldorff, L.M. Parsons, M. Liotti, C.S. Freitas,
L. Rainey, P.V. Kochunov, D. Nickerson, S.A. Mikiten, P.T. Fox,
Automated Talairach Atlas labels for functional brain mapping,
Hum. Brain Mapp. 10 (2000) 120–131.
[28] R.D. Lane, G.R. Fink, P.M.-L. Chau, R.J. Dolan, Neural activation
during selective attention to subjective emotional responses, Neuro-
Report 8 (1997) 3969–3972.
[29] R.D. Lane, E.M. Reiman, M.M. Bradley, P.J. Lang, G.L. Ahern, R.J.
Davidson, G.E. Schwartz, Neuroanatomical correlates of pleasant and
unpleasant emotion, Neuropsychologia 35 (1997) 1437–1444.
[30] R.D. Lane, E.M. Reiman, B. Axelrod, L.-S. Yun, A. Holmes, G.E.
Schwartz, Neural correlates of levels of emotional awareness: evi-
dence of an interaction between emotion and attention in the anterior
cingulate cortex, J. Cogn. Neurosci. 10 (1998) 525–535.
[31] R.D. Lane, P.M.-L. Chua, R.J. Dolan, Common effects of emotional
valence, arousal and attention on neural activation during visual pro-
cessing of pictures, Neuropsychologia 37 (1999) 989–997.
[32] P.J. Lang, M.M. Bradley, J.R. Fitzsimmons, B.N. Cuthbert, J.D. Scott,
B. Moulder, V. Nangia, Emotional arousal and activation of the visual
cortex: an fMRI analysis, Psychophysiology 35 (1998) 199–210.
[33] P.J. Lang, M.M. Bradley, B.N. Cuthbert, International Affective Pic-
tures System (IAPS): Instruction Manual and Affective Ratings, The
Center for Research in Psychophysiology, University of Florida,
Gainesville, FL, 2001.
[34] H.S. Mayberg, Limbic–cortical dysregulation: a proposed model of
depression, J. Neuropsychiatry Clin. Neurosci. 9 (1997) 471–481.
[35] G. McCarthy, M. Luby, J. Gore, P. Goldman-Rakic, Infrequent events
transiently activate human prefrontal and parietal cortex as measured
by functional MRI, J. Neurophysiol. 77 (1997) 1630–1634.
[36] M.S. Mega, J.L. Cummings, S. Salloway, P. Malloy, The limbic sys-
tem: an anatomic, phylogenetic, and clinical perspective, J. Neuro-
psychiatry Clin. Neurosci. 9 (1997) 315–330.
[37] M.-M. Mesulam, A cortical network for directed attention and unila-
teral neglect, Ann. Neurol. 10 (1981) 309–325.
[38] M.-M. Mesulam, Patterns in behavioral neuroanatomy: association
areas, the limbic system, and hemispheric specialization, in: M.-M.
Mesulam (Ed.), Principles of Behavioral Neurology, Davis, Philadel-
phia, 1985, pp. 1–70.
[39] M.-M. Mesulam, Spatial attention and neglect: parietal, frontal and
cingulate contributions to the mental representation and attentional
targeting of salient extrapersonal events, Philos. Trans. R. Soc., B
354 (1999) 1325–1346.
[40] J.S. Morris, A. Ohman, R.J. Dolan, Conscious and unconscious
emotional learning in the human amygdala, Nature 393 (1998)
467–470.
[41] J. Narumoto, T. Okada, N. Sadato, K. Fukui, Y. Yonekura, Attention
to emotion modulates fMRI activity in human right superior temporal
sulcus, Cogn. Brain Res. 12 (2001) 225–231.
[42] E. Nimchinsky, E. Gilissen, J.M. Allman, D.P. Perl, J.M. Erwin, P.R.
Hof, A neuronal morphologic type unique to humans and great apes,
Proc. Natl. Acad. Sci. U. S. A. 96 (1999) 5268–5273.
[43] J.W. Papez, A proposed mechanism of emotion, Arch. Neurol. Psy-
chiatry 38 (1937) 725–742.
[44] S. Paradiso, D.L. Johnson, N.C. Andreasen, D.S. O’Leary,
G.L. Watkins, L.L. Boles Ponto, R.D. Hichwa, Cerebral blood flow
changes with attribution of emotional valence to pleasant, unpleasant,
and neutral visual stimuli in a PET study of normal subjects, Am. J.
Psychiatry 156 (1999) 1618–1629.
[45] L. Pessoa, M. McKenna, E. Gutierrez, L.G. Ungerleider, Neural
processing of emotional faces requires attention, Proc. Natl. Acad.
Sci. U. S. A. 99 (2002) 11458–11463.
[46] K.L. Phan, T. Wager, S.F. Taylor, I. Liberzon, Functional neuroanat-
omy of emotion: a meta-analysis of emotion activation studies in PET
and fMRI, NeuroImage 16 (2002) 331–348.
[47] G.E. Schwartz, R.J. Davidson, F. Maer, Right hemisphere lateraliza-
tion for emotion in the human brain: interactions with cognition,
Science 190 (1975) 286–288.
[48] J.R. Simpson, D. Ongur, E. Akbudak, T.E. Conturo, J.M. Ollinger,
A.Z. Snyder, D.A. Gusnard, M.E. Raichle, The emotional modulation
of cognitive processing: an fMRI study, J. Cogn. Neurosci. 12 (2000)
157–170.
[49] A.A. Stevens, P. Skudlarski, J.C. Gatenby, J.C. Gore, Event-related
fMRI of auditory and visual oddball tasks, Magn. Reson. Imaging 18
(2000) 495–502.
[50] B.A. Strange, R.N.A. Henson, K.J. Friston, R.J. Dolan, Brian mecha-
nisms for detecting perceptual, semantic, and emotional deviance,
NeuroImage 12 (2000) 425–433.
[51] T. Takahashi, Y. Kawasaki, K. Kurokawa, H. Hagino, S. Nohara, I.
Yamashita, K. Nakamura, M. Murata, M. Matsui, M. Suzuki, H. Seto,
M. Kurachi, Lack of normal structural asymmetry of the anterior
cingulate gyrus in female patients with schizophrenia: a volumetric
magnetic resonance imaging study, Schizophr. Res. 55 (2002) 69–81.
[52] J. Talairach, P. Tournoux, Co-Planar Stereotaxic Atlas of the Human
Brain, Thieme Medical Publishers, New York, 1988.
[53] S.F. Taylor, I. Liberzon, L.M. Fig, L.R. Decker, S. Minoshima, R.A.
Koeppe, The effect of emotional content on visual recognition me-
mory: a PET activation study, NeuroImage 8 (1998) 188–197.
[54] S.F. Taylor, K.L. Phan, L.R. Decker, I. Liberzon, Subjective rating of
emotionally salient stimuli modulates neural activity, NeuroImage 18
(2003) 650–659.
[55] B.A. Vogt, E.A. Nimchinsky, L.J. Vogt, P.R. Hof, Human cingulate

H.M. Fichtenholtz et al. / Cognitive Brain Research 20 (2004) 67–8080
cortex: surface features, flat maps, and cytoarchitecture, J. Comp.
Neurol. 359 (1995) 490–506.
[56] P. Vuilleumier, J.L. Armony, J. Driver, R.J. Dolan, Effects of attention
and emotion on face processing in the human brain: an event-related
fMRI study, Neuron 30 (2001) 829–841.
[57] P. Vuilleumier, J.L. Armony, K. Clarke, M. Husain, J. Driver, R.J.
Dolan, Neural response to emotional faces with and without aware-
ness: event-related fMRI in a parietal patient with visual extinction
and spatial neglect, Neuropsychologia 40 (2002) 2156–2166.
[58] R.T. Watson, K.M. Heilman, J.C. Cauthen, F.A. King, Neglect after
cingulectomy, Neurology 23 (1973) 1003–1007.
[59] P.J. Whalen, G. Bush, R.J. McNally, S. Wilhelm, S.C. McInerney,
M.A. Jenike, S.L. Rauch, The emotional counting Stroop paradigm: a
functional magnetic resonance imaging probe of the anterior cingulate
affective division, Biol. Psychiatry 44 (1998) 1219–1228.
[60] H. Yamasaki, K.S. LaBar, G. McCarthy, Dissociable prefrontal brain
systems for attention and emotion, Proc. Natl. Acad. Sci. U. S. A. 99
(2002) 11447–11451.