RESEARCH PAPER
Effects of grain boundary width and crystallite sizeon conductivity and magnetic properties of magnetitenanoparticles
K. L. Lopez Maldonado • P. de la Presa • M. A. de la Rubia •
P. Crespo • J. de Frutos • A. Hernando • J. A. Matutes Aquino •
J. T. Elizalde Galindo
Received: 31 March 2014 / Accepted: 23 May 2014
� Springer Science+Business Media Dordrecht 2014
Abstract The structural, electrical, and magnetic
properties of magnetite nanoparticles, with crystallite
sizes 30, 40, and 50 nm, are studied. These crystallite
sizes correspond to average particle sizes of 33, 87, and
90 nm, respectively, as determined by TEM. By
HRTEM images, it is observed that grain boundary
widths decrease as crystallite size increases. Electrical
and microstructural properties are correlated based on
the theoretical definition of charging energy. Conduc-
tion phenomena are investigated as a function of grain
boundaries widths, which in turn depend on crystallite
size: the calculations suggest that charging energy has
a strong dependence on crystallite size. By zero-field-
cooling and susceptibility measurements, it is observed
that Verwey transition is crystallite size dependent,
with values ranging from 85 to 95 K. In addition, a kink
at the out-phase susceptibility curves at 35 K, and a
strong change in coercivity is associated to a spin-glass
transition, which is independent of crystallite size but
frequency dependent. The activation energy associated
to this transition is calculated to be around 6–7 meV.
Finally, magnetic saturation and coercivity are found
to be not significantly affected by crystallite size, with
saturation values close to fine powders values. A
detailed knowledge on the effects of grain boundary
width and crystallite size on conductivity and magnetic
properties is relevant for optimization of materials that
can be used in magnetoresistive devices.
Keywords Magnetite � Nanoparticles � Verwey
transition � Spin-glass � Impedance spectroscopy �Magnetic properties
Introduction
Magnetic nanoparticles (NPs) are subject of continu-
ous and growing interest from fundamental and
K. L. Lopez Maldonado � J. T. Elizalde Galindo (&)
Instituto de Ingenierıa y Tecnologıa, Universidad
Autonoma de Ciudad Juarez, Av. Del Charro 450 norte,
32310 Ciudad Juarez, Mexico
e-mail: [email protected]
P. de la Presa � P. Crespo � A. Hernando
Instituto de Magnetismo Aplicado (UCM-ADIF-CSIC),
PO Box 155, 28230 Las Rozas, Spain
P. de la Presa � A. Hernando
Dpto. Fısica de Materiales, Univ. Complutense de Madrid,
Madrid, Spain
M. A. de la Rubia � J. de Frutos
Dpto. Electroceramica, Instituto de Ceramica y Vidrio
(CSIC), Madrid, Spain
M. A. de la Rubia � J. de Frutos
Grupo Poemma, ETSI Telecomunicacion (UPM), Madrid,
Spain
J. A. Matutes Aquino
Centro de Investigacion en Materiales Avanzados, Miguel
de Cervantes 120, 31109 Chihuahua, Mexico
123
J Nanopart Res (2014) 16:2482
DOI 10.1007/s11051-014-2482-3
technological viewpoint. These NPs have remarkable
magnetic properties which differ markedly from their
parent massive materials; these different properties
make them unique physical objects useful for techno-
logical and medical applications (Batlle and Labarta
2002; Crespo et al. 2013; Hernando 1999; Knobel
et al. 2008). In this field, magnetite (Fe3O4) is a good
option for technological applications in a wide tem-
perature range due to its magnetic properties: high
Curie temperature, large magnetic saturation, large
critical size, etc. Furthermore, magnetite is a half-
metallic ferrimagnet and band structure calculations
indicate that 100 % of spin polarization is expected for
this structure; this high polarization property leads to a
tunnel magneto-resistance effect (TMR) (Coey 1999).
Therefore, in the last decades, magnetite has been
studied for spintronic applications, trying to get a high
degree of spin polarization, and a high TMR coeffi-
cient. However, the experimentally observed TMR
coefficient on magnetite is found to be far below the
expected values. For this reason, many researches
focus on the study of the microstructural and physical
properties bearing on magnetite magnetoresistance
(Mi et al. 2007; Zhang et al. 2007; Zhou et al. 2010).
As occurs in other magnetic NPs, surface and interface
properties, such as the alignment of moments at grain
boundaries, play a key role in applications like
magnetoresistive devices. The effects of average
crystallite/grain size and particle size distribution on
the physical properties are permanently subject to
study (Cabrera et al. 2008; Koksharov 2009; Kol-
esnichenko 2009; Mi et al. 2007). In addition, several
studies suggest that the surface effects, like different
composition at grain boundaries or low crystallinity
degrees, bear on different ways to the interaction
between magnetic moments of neighboring grains or
between magnetic moments inside grains and surface
spins (Mi et al. 2007; Zhou et al. 2010). Kodama et al.
(1997) show that surface spin disorder on ferrites NPs
is mainly related to their singular magnetic properties.
Nowadays, the effects of crystallite and particle sizes
and surface effects on the physical and magnetoresis-
tive properties of magnetite are matters of great
importance.
Another interesting structural characteristic appear-
ing in magnetite is Verwey transition. Verwey tran-
sition is reported for bulk magnetite at *125 K, and
during this transformation the structure undergoes
from monoclinic to cubic structure above Verwey
temperature, TV, where the resistance changes by two
orders of magnitude (Garcıa and Subıas 2004; Walz
2002). Although this transition has not been com-
pletely understood by now, an effect of crystallite/
particle size on TV in nanostructured systems is
expected. Several authors report that TV diminishes
at the nanoscale (Goya et al. 2003; Sarkar et al. 2012;
Verges et al. 2008), suggesting that the transition is
strongly correlated to the microstructural effects such
as particle and/or crystallite size and surface effects.
Consequently, the investigation of TV dependence on
particle microstructure is a research matter (Janu et al.
2007; Lopez Maldonado et al. 2013; Sarkar et al. 2012;
Verges et al. 2008).
In this work, the magnetic and electrical properties
of magnetite NPs are studied as a function of
crystallite and particle size, aiming to understand the
influence of particle/crystallite size and grain bound-
ary width on these properties. Charging energy, and its
dependence on crystallite sizes, is studied by imped-
ance spectroscopy. Besides, magnetic measurements
are used to study Verwey and spin-glass transitions.
Frequency and crystallite size dependences are ana-
lyzed. Finally, activation energy for the spin-glass to
be broken is calculated.
Experimental methodology
Synthesis
Synthesis of magnetite NPs is carried out based on
aging technique (Lopez Maldonado et al. 2013;
Verges et al. 2008), where a basic solution is prepared
in a round bottom flask containing 180 ml of water
with NaOH and KNO3 at concentrations in the order of
10-2 and 10-1 M, respectively. Then, a second
solution (20 ml) is prepared using 10-2 M H2SO4
and FeSO4 with concentrations varying from 0.11 to
0.34 M in order to achieve different crystallite sizes in
the samples (see Table 1). Both solutions are left
under N2 flux bubbling during 2 h. Then, ferrous
solution is added slowly at a constant rate under
stirring into basic one. After 5 min under magnetic
stirring, the system is boiled and aged during 2 h; a
condenser is used for refluxing. Finally, the mixed
solution is cooled down to room temperature (RT).
The black precipitated is magnetically decanted and
washed several times; then it is left to overnight dry.
2482 Page 2 of 12 J Nanopart Res (2014) 16:2482
123
Three samples with different crystallite sizes are
synthesized by varying OH concentrations.
Characterization
Crystal structure and average crystallite size, hDi, are
measured by X-ray diffraction (XRD) using Cu-Karadiation in a PANalytical X’Pert Pro MPD diffrac-
tometer, with 2h ranging from 25� to 70�. Cell
parameters are calculated by means of UNITCELL
software (Holland and Redfern 1997). Particle size
and morphology are studied by transmission electron
microscopy (TEM) using a JEOL JEM-2200FS TEM.
For the observation of the sample in the microscope,
the particles are dispersed in isobutyl alcohol and a
drop of the suspension is placed onto a copper grid
covered by a carbon film. For electrical characteriza-
tion, the samples are shaped into pellets of 6.7 mm of
diameter and 1 mm of thickness by applying a 40 kN
force. The electrical properties of the pellets are
measured by the two probes method with the contacts
placed onto both pellets faces. The electrodes are
conductive copper tapes AT526 35 Micron Copper
Foil Shielding from Advance Tapes. The impedance
characterizations are carried out using a Solartron
Impedance Analyzer (Model 1260) supplemented
with a 1296 dielectric interface modulus that allows
determining impedances in the teraohms range. The
measurements are carried out at RT with VAC = 0.5 V
in a frequency range from 10-1 to 106 Hz. For
temperature-dependent impedance measurements,
the samples are set in a cryostat Janis Research Co.
VNF 100 with temperature varying from 77 to 280 K
with 20 K steps.
Magnetic susceptibility curves are measured in an
Oxford Instrument from 5 to 150 K with 5 K steps,
with applied magnetic field HAC = 50 Oe and fre-
quency ranging from 100 to 774 Hz. Magnetization
measurements are carried out using a SQUID Physical
Properties Measurement System (PPMS). Hysteresis
loops are performed at 5, 50, 90, 120, and 300 K with
maximum applied field Hmax = 20 kOe. Zero field
cooled (ZFC) curves are measured from 5 to 300 K
and 100 Oe applied field.
Results and discussion
X-ray diffraction
Magnetite has an inverse spinel cubic crystal structure
with space group Fd�3m, 32 O2? ions arranged in a face
centered cubic lattice, in which 8 of 64 available
tetrahedral sites are occupied by Fe3? cations, and 16
of 32 available octahedral sites are equally occupied
by Fe3? and Fe2? cations (Dezsi et al. 2008; Ogale
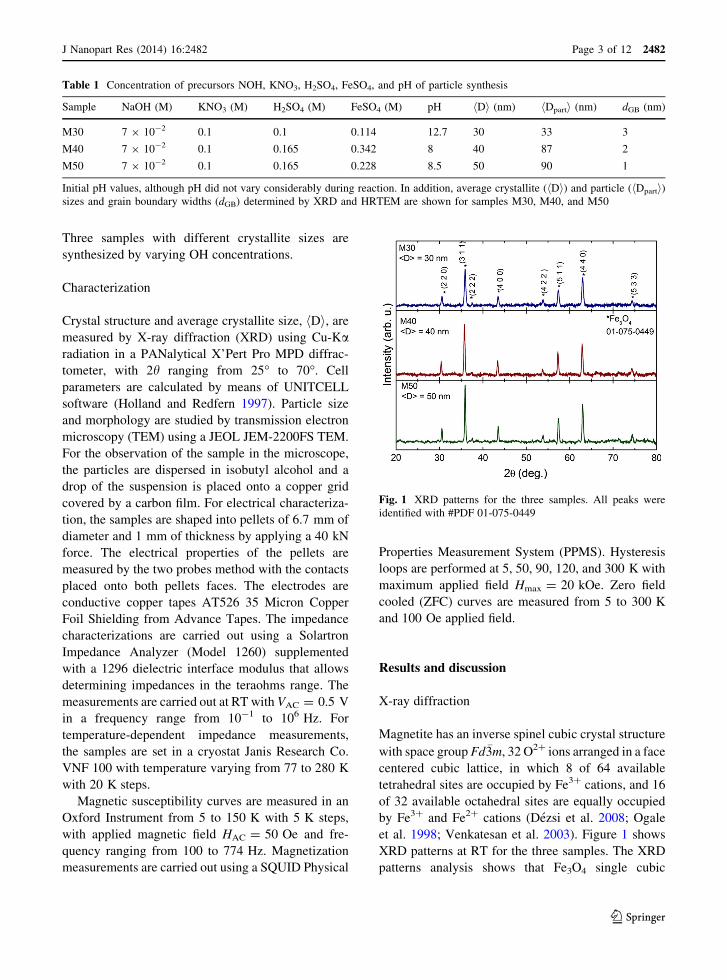
et al. 1998; Venkatesan et al. 2003). Figure 1 shows
XRD patterns at RT for the three samples. The XRD
patterns analysis shows that Fe3O4 single cubic
Table 1 Concentration of precursors NOH, KNO3, H2SO4, FeSO4, and pH of particle synthesis
Sample NaOH (M) KNO3 (M) H2SO4 (M) FeSO4 (M) pH hDi (nm) hDparti (nm) dGB (nm)
M30 7 9 10-2 0.1 0.1 0.114 12.7 30 33 3
M40 7 9 10-2 0.1 0.165 0.342 8 40 87 2
M50 7 9 10-2 0.1 0.165 0.228 8.5 50 90 1
Initial pH values, although pH did not vary considerably during reaction. In addition, average crystallite (hDi) and particle (hDparti)sizes and grain boundary widths (dGB) determined by XRD and HRTEM are shown for samples M30, M40, and M50
Fig. 1 XRD patterns for the three samples. All peaks were
identified with #PDF 01-075-0449
J Nanopart Res (2014) 16:2482 Page 3 of 12 2482
123
crystalline phase is achieved in all samples (#PDF01-
075-0449); no secondary phases are observed. Vari-
ation in mean crystallite size, hDi, as expected from
the peak broadening, is calculated using Scherrer’s
formula from FWHM of (311) peak; mean hDi values
30, 40, and 50 nm are obtained for the three samples
named M30, M40, and M50, respectively. The differ-
ences in relative intensity for (311) and (440) planes
between M30 and the other two samples are attributed
to the morphologies variation, as will be shown later.
Cell parameter is close to 8.35 A for all samples, in
agreement with the expected value (Coey 2010).
Microscopy
In order to understand the differences in relative
intensities observed by XRD, morphology and grain
size analysis are carried out from TEM micrographies.
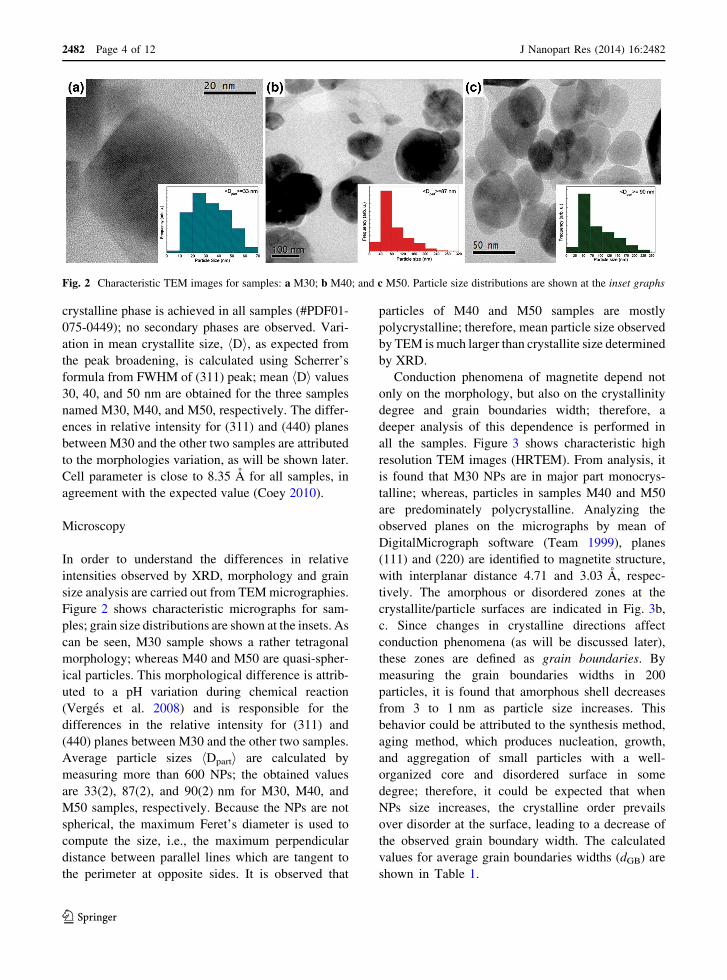
Figure 2 shows characteristic micrographs for sam-
ples; grain size distributions are shown at the insets. As
can be seen, M30 sample shows a rather tetragonal
morphology; whereas M40 and M50 are quasi-spher-
ical particles. This morphological difference is attrib-
uted to a pH variation during chemical reaction
(Verges et al. 2008) and is responsible for the
differences in the relative intensity for (311) and
(440) planes between M30 and the other two samples.
Average particle sizes hDparti are calculated by
measuring more than 600 NPs; the obtained values
are 33(2), 87(2), and 90(2) nm for M30, M40, and
M50 samples, respectively. Because the NPs are not
spherical, the maximum Feret’s diameter is used to
compute the size, i.e., the maximum perpendicular
distance between parallel lines which are tangent to
the perimeter at opposite sides. It is observed that
particles of M40 and M50 samples are mostly
polycrystalline; therefore, mean particle size observed
by TEM is much larger than crystallite size determined
by XRD.
Conduction phenomena of magnetite depend not
only on the morphology, but also on the crystallinity
degree and grain boundaries width; therefore, a
deeper analysis of this dependence is performed in
all the samples. Figure 3 shows characteristic high
resolution TEM images (HRTEM). From analysis, it
is found that M30 NPs are in major part monocrys-
talline; whereas, particles in samples M40 and M50
are predominately polycrystalline. Analyzing the
observed planes on the micrographs by mean of
DigitalMicrograph software (Team 1999), planes
(111) and (220) are identified to magnetite structure,
with interplanar distance 4.71 and 3.03 A, respec-
tively. The amorphous or disordered zones at the
crystallite/particle surfaces are indicated in Fig. 3b,
c. Since changes in crystalline directions affect
conduction phenomena (as will be discussed later),
these zones are defined as grain boundaries. By
measuring the grain boundaries widths in 200
particles, it is found that amorphous shell decreases
from 3 to 1 nm as particle size increases. This
behavior could be attributed to the synthesis method,
aging method, which produces nucleation, growth,
and aggregation of small particles with a well-
organized core and disordered surface in some
degree; therefore, it could be expected that when
NPs size increases, the crystalline order prevails
over disorder at the surface, leading to a decrease of
the observed grain boundary width. The calculated
values for average grain boundaries widths (dGB) are
shown in Table 1.
Fig. 2 Characteristic TEM images for samples: a M30; b M40; and c M50. Particle size distributions are shown at the inset graphs
2482 Page 4 of 12 J Nanopart Res (2014) 16:2482
123
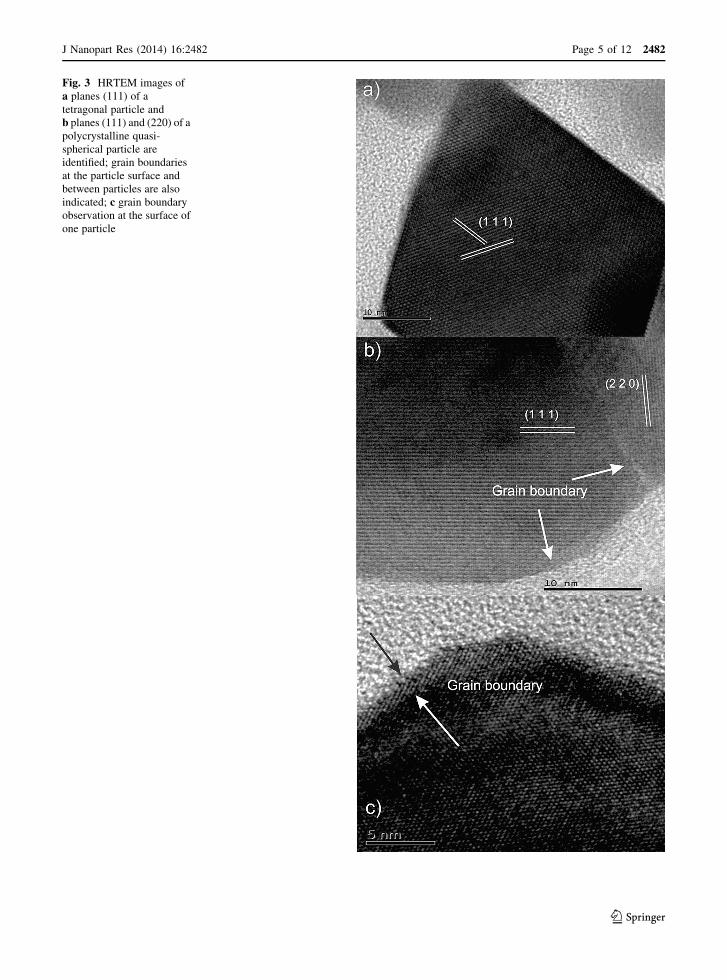
Fig. 3 HRTEM images of
a planes (111) of a
tetragonal particle and
b planes (111) and (220) of a
polycrystalline quasi-
spherical particle are
identified; grain boundaries
at the particle surface and
between particles are also
indicated; c grain boundary
observation at the surface of
one particle
J Nanopart Res (2014) 16:2482 Page 5 of 12 2482
123
Electrical characterization
After microstructural and crystallinity analysis, and
continuing to achieve a good understanding on the
physical properties of magnetite, the electrical prop-
erties of samples are studied by impedance spectros-
copy in AC electric field. With this analysis, it is
possible to determine the different phenomena that
contribute to electrical conduction owing to the
physical and chemical properties of the samples.
When applying an AC field, the impedance is
defined as the ratio between applied voltage and
generated current intensity. Due to the phase differ-
ence between these magnitudes, impedance is a
complex function of frequency:
Z xð Þ ¼ Z 0 xð Þ þ iZ 00 xð Þ ð1Þ
where Z 0 and Z 00 are real and complex impedance,
respectively, i is the imaginary unit, x ¼ 2pf is the
angular frequency in rad/s, and f is ac electric field
frequency. In the measured frequency range, the
dielectric response is dominated by relaxation phe-
nomena because of the displacement of trapped space
charges at the interfaces (Maxwell–Wagner–Sillars
relaxation) (Macdonal and Johnson 2005).
Using this technique, the system can be resembled
mathematically to an equivalent circuit, where the real
part referring to loading transfer or polarization and
electrode resistance is represented by resistors, and the
complex component is given by capacitance. There-
fore, the impedance ZðxÞ is defined as follows:
ZðxÞ ¼ RðxÞ þ XðxÞ ð2Þ
where RðxÞis the resistance and XðxÞ is the reactance
which is related to capacitance; the conductance CðxÞis the inverse of RðxÞ. Given the relationship between
impedance, conductance, and resistance, the following
discussion can help to clarify the conduction phenom-
ena and their connection with microstructural and
crystallinity properties.
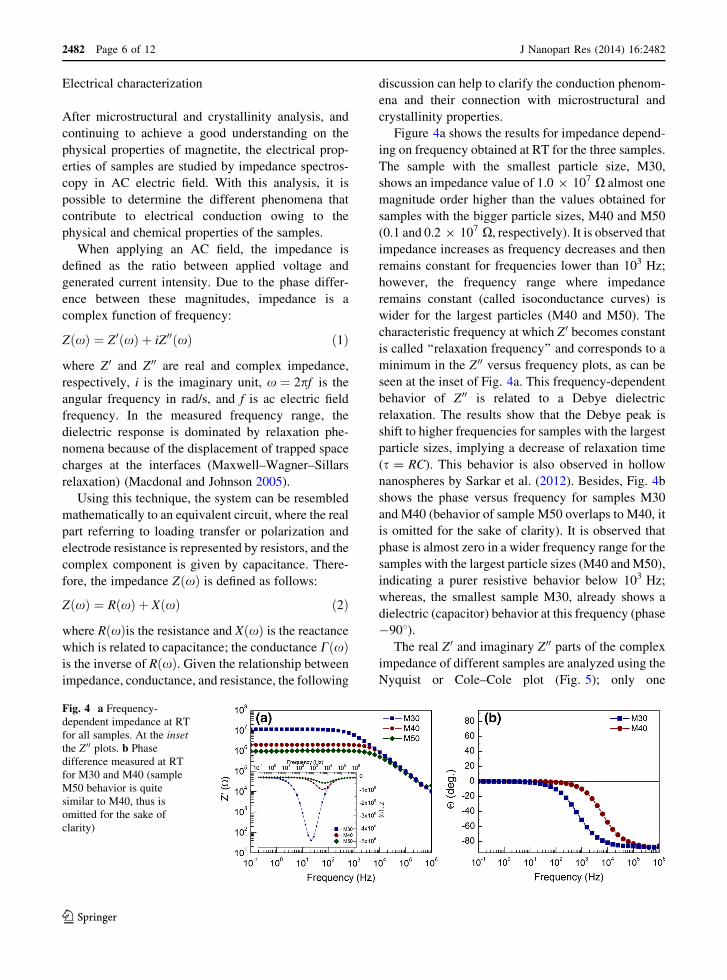
Figure 4a shows the results for impedance depend-
ing on frequency obtained at RT for the three samples.
The sample with the smallest particle size, M30,
shows an impedance value of 1.0 9 107 X almost one
magnitude order higher than the values obtained for
samples with the bigger particle sizes, M40 and M50
(0.1 and 0.2 9 107 X, respectively). It is observed that
impedance increases as frequency decreases and then
remains constant for frequencies lower than 103 Hz;
however, the frequency range where impedance
remains constant (called isoconductance curves) is
wider for the largest particles (M40 and M50). The
characteristic frequency at which Z 0 becomes constant
is called ‘‘relaxation frequency’’ and corresponds to a
minimum in the Z 00 versus frequency plots, as can be
seen at the inset of Fig. 4a. This frequency-dependent
behavior of Z 00 is related to a Debye dielectric
relaxation. The results show that the Debye peak is
shift to higher frequencies for samples with the largest
particle sizes, implying a decrease of relaxation time
(s = RC). This behavior is also observed in hollow
nanospheres by Sarkar et al. (2012). Besides, Fig. 4b
shows the phase versus frequency for samples M30
and M40 (behavior of sample M50 overlaps to M40, it
is omitted for the sake of clarity). It is observed that
phase is almost zero in a wider frequency range for the
samples with the largest particle sizes (M40 and M50),
indicating a purer resistive behavior below 103 Hz;
whereas, the smallest sample M30, already shows a
dielectric (capacitor) behavior at this frequency (phase
-908).The real Z 0 and imaginary Z 00 parts of the complex
impedance of different samples are analyzed using the
Nyquist or Cole–Cole plot (Fig. 5); only one
Fig. 4 a Frequency-
dependent impedance at RT
for all samples. At the inset
the Z 00 plots. b Phase
difference measured at RT
for M30 and M40 (sample
M50 behavior is quite
similar to M40, thus is
omitted for the sake of
clarity)
2482 Page 6 of 12 J Nanopart Res (2014) 16:2482
123
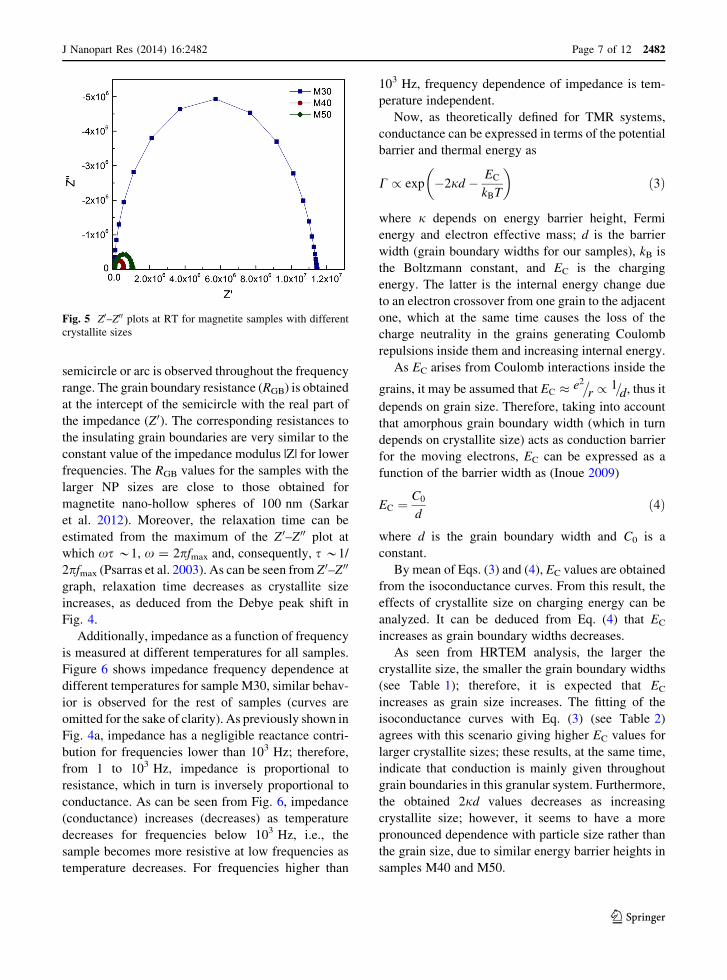
semicircle or arc is observed throughout the frequency
range. The grain boundary resistance (RGB) is obtained
at the intercept of the semicircle with the real part of
the impedance (Z 0). The corresponding resistances to
the insulating grain boundaries are very similar to the
constant value of the impedance modulus |Z| for lower
frequencies. The RGB values for the samples with the
larger NP sizes are close to those obtained for
magnetite nano-hollow spheres of 100 nm (Sarkar
et al. 2012). Moreover, the relaxation time can be
estimated from the maximum of the Z 0–Z 00 plot at
which xs *1, x = 2pfmax and, consequently, s *1/
2pfmax (Psarras et al. 2003). As can be seen from Z 0–Z 00
graph, relaxation time decreases as crystallite size
increases, as deduced from the Debye peak shift in
Fig. 4.
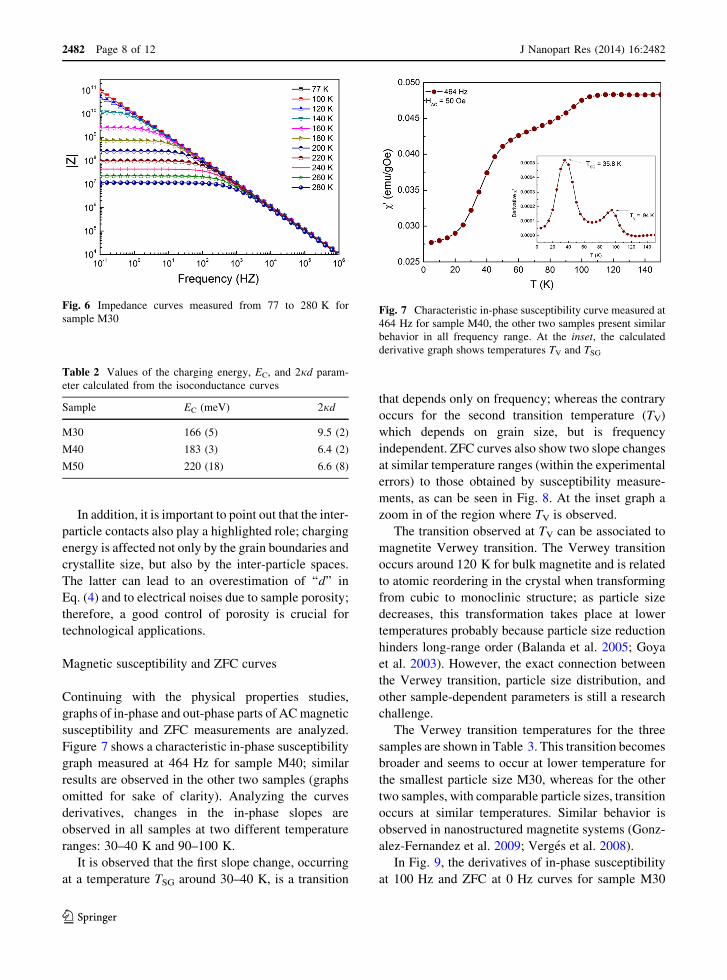
Additionally, impedance as a function of frequency
is measured at different temperatures for all samples.
Figure 6 shows impedance frequency dependence at
different temperatures for sample M30, similar behav-
ior is observed for the rest of samples (curves are
omitted for the sake of clarity). As previously shown in
Fig. 4a, impedance has a negligible reactance contri-
bution for frequencies lower than 103 Hz; therefore,
from 1 to 103 Hz, impedance is proportional to
resistance, which in turn is inversely proportional to
conductance. As can be seen from Fig. 6, impedance
(conductance) increases (decreases) as temperature
decreases for frequencies below 103 Hz, i.e., the
sample becomes more resistive at low frequencies as
temperature decreases. For frequencies higher than
103 Hz, frequency dependence of impedance is tem-
perature independent.
Now, as theoretically defined for TMR systems,
conductance can be expressed in terms of the potential
barrier and thermal energy as
C / exp �2jd � EC
kBT
� �ð3Þ
where j depends on energy barrier height, Fermi
energy and electron effective mass; d is the barrier
width (grain boundary widths for our samples), kB is
the Boltzmann constant, and EC is the charging
energy. The latter is the internal energy change due
to an electron crossover from one grain to the adjacent
one, which at the same time causes the loss of the
charge neutrality in the grains generating Coulomb
repulsions inside them and increasing internal energy.
As EC arises from Coulomb interactions inside the
grains, it may be assumed that EC � e2�r / 1=d, thus it
depends on grain size. Therefore, taking into account
that amorphous grain boundary width (which in turn
depends on crystallite size) acts as conduction barrier
for the moving electrons, EC can be expressed as a
function of the barrier width as (Inoue 2009)
EC ¼C0
dð4Þ
where d is the grain boundary width and C0 is a
constant.
By mean of Eqs. (3) and (4), EC values are obtained
from the isoconductance curves. From this result, the
effects of crystallite size on charging energy can be
analyzed. It can be deduced from Eq. (4) that EC
increases as grain boundary widths decreases.
As seen from HRTEM analysis, the larger the
crystallite size, the smaller the grain boundary widths
(see Table 1); therefore, it is expected that EC
increases as grain size increases. The fitting of the
isoconductance curves with Eq. (3) (see Table 2)
agrees with this scenario giving higher EC values for
larger crystallite sizes; these results, at the same time,
indicate that conduction is mainly given throughout
grain boundaries in this granular system. Furthermore,
the obtained 2jd values decreases as increasing
crystallite size; however, it seems to have a more
pronounced dependence with particle size rather than
the grain size, due to similar energy barrier heights in
samples M40 and M50.
Fig. 5 Z0–Z00 plots at RT for magnetite samples with different
crystallite sizes
J Nanopart Res (2014) 16:2482 Page 7 of 12 2482
123
In addition, it is important to point out that the inter-
particle contacts also play a highlighted role; charging
energy is affected not only by the grain boundaries and
crystallite size, but also by the inter-particle spaces.
The latter can lead to an overestimation of ‘‘d’’ in
Eq. (4) and to electrical noises due to sample porosity;
therefore, a good control of porosity is crucial for
technological applications.
Magnetic susceptibility and ZFC curves
Continuing with the physical properties studies,
graphs of in-phase and out-phase parts of AC magnetic
susceptibility and ZFC measurements are analyzed.
Figure 7 shows a characteristic in-phase susceptibility
graph measured at 464 Hz for sample M40; similar
results are observed in the other two samples (graphs
omitted for sake of clarity). Analyzing the curves
derivatives, changes in the in-phase slopes are
observed in all samples at two different temperature
ranges: 30–40 K and 90–100 K.
It is observed that the first slope change, occurring
at a temperature TSG around 30–40 K, is a transition
that depends only on frequency; whereas the contrary
occurs for the second transition temperature (TV)
which depends on grain size, but is frequency
independent. ZFC curves also show two slope changes
at similar temperature ranges (within the experimental
errors) to those obtained by susceptibility measure-
ments, as can be seen in Fig. 8. At the inset graph a
zoom in of the region where TV is observed.
The transition observed at TV can be associated to
magnetite Verwey transition. The Verwey transition
occurs around 120 K for bulk magnetite and is related
to atomic reordering in the crystal when transforming
from cubic to monoclinic structure; as particle size
decreases, this transformation takes place at lower
temperatures probably because particle size reduction
hinders long-range order (Balanda et al. 2005; Goya
et al. 2003). However, the exact connection between
the Verwey transition, particle size distribution, and
other sample-dependent parameters is still a research
challenge.
The Verwey transition temperatures for the three
samples are shown in Table 3. This transition becomes
broader and seems to occur at lower temperature for
the smallest particle size M30, whereas for the other
two samples, with comparable particle sizes, transition
occurs at similar temperatures. Similar behavior is
observed in nanostructured magnetite systems (Gonz-
alez-Fernandez et al. 2009; Verges et al. 2008).
In Fig. 9, the derivatives of in-phase susceptibility
at 100 Hz and ZFC at 0 Hz curves for sample M30
Fig. 6 Impedance curves measured from 77 to 280 K for
sample M30
Table 2 Values of the charging energy, EC, and 2jd param-
eter calculated from the isoconductance curves
Sample EC (meV) 2jd
M30 166 (5) 9.5 (2)
M40 183 (3) 6.4 (2)
M50 220 (18) 6.6 (8)
Fig. 7 Characteristic in-phase susceptibility curve measured at
464 Hz for sample M40, the other two samples present similar
behavior in all frequency range. At the inset, the calculated
derivative graph shows temperatures TV and TSG
2482 Page 8 of 12 J Nanopart Res (2014) 16:2482
123
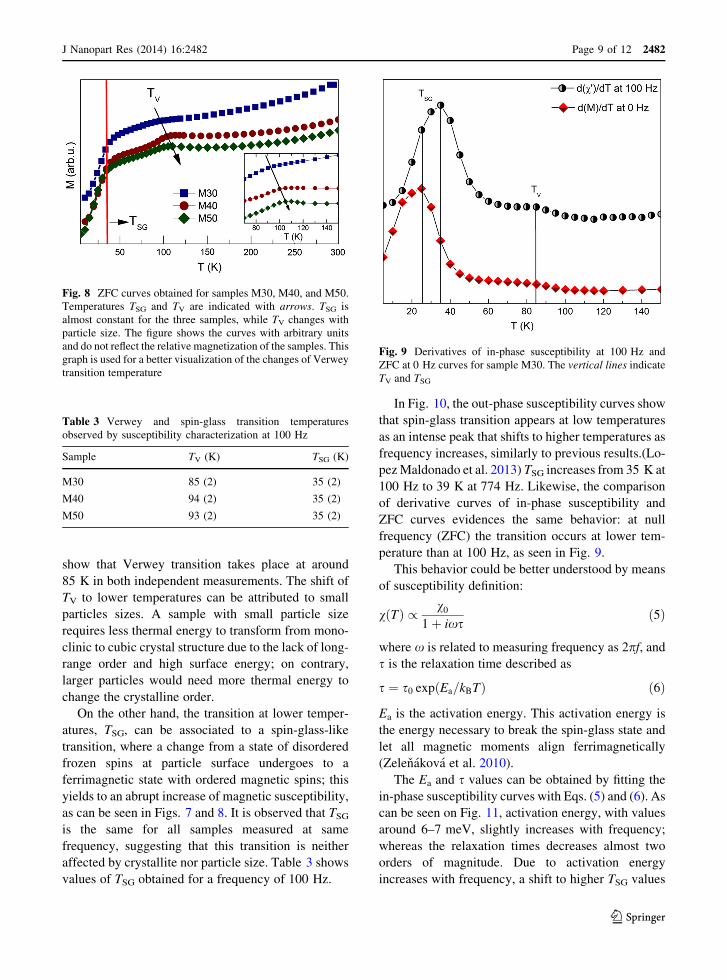
show that Verwey transition takes place at around
85 K in both independent measurements. The shift of
TV to lower temperatures can be attributed to small
particles sizes. A sample with small particle size
requires less thermal energy to transform from mono-
clinic to cubic crystal structure due to the lack of long-
range order and high surface energy; on contrary,
larger particles would need more thermal energy to
change the crystalline order.
On the other hand, the transition at lower temper-
atures, TSG, can be associated to a spin-glass-like
transition, where a change from a state of disordered
frozen spins at particle surface undergoes to a
ferrimagnetic state with ordered magnetic spins; this
yields to an abrupt increase of magnetic susceptibility,
as can be seen in Figs. 7 and 8. It is observed that TSG
is the same for all samples measured at same
frequency, suggesting that this transition is neither
affected by crystallite nor particle size. Table 3 shows
values of TSG obtained for a frequency of 100 Hz.
In Fig. 10, the out-phase susceptibility curves show
that spin-glass transition appears at low temperatures
as an intense peak that shifts to higher temperatures as
frequency increases, similarly to previous results.(Lo-
pez Maldonado et al. 2013) TSG increases from 35 K at
100 Hz to 39 K at 774 Hz. Likewise, the comparison
of derivative curves of in-phase susceptibility and
ZFC curves evidences the same behavior: at null
frequency (ZFC) the transition occurs at lower tem-
perature than at 100 Hz, as seen in Fig. 9.
This behavior could be better understood by means
of susceptibility definition:
vðTÞ / v0
1þ ixsð5Þ
where x is related to measuring frequency as 2pf, and
s is the relaxation time described as
s ¼ s0 expðEa=kBTÞ ð6Þ
Ea is the activation energy. This activation energy is
the energy necessary to break the spin-glass state and
let all magnetic moments align ferrimagnetically
(Zelenakova et al. 2010).
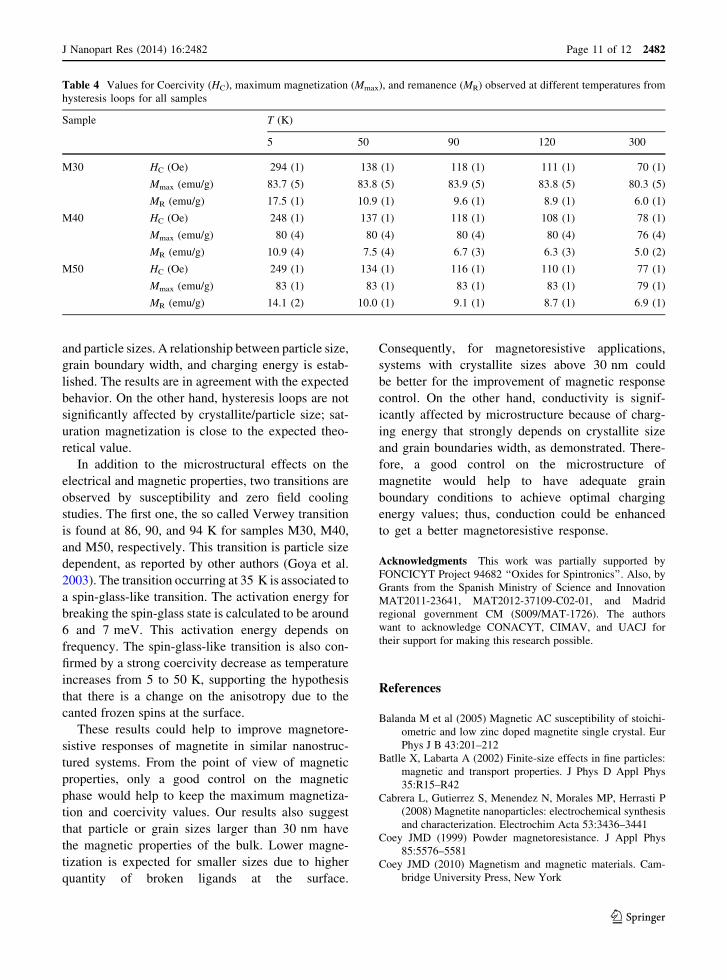
The Ea and s values can be obtained by fitting the
in-phase susceptibility curves with Eqs. (5) and (6). As
can be seen on Fig. 11, activation energy, with values
around 6–7 meV, slightly increases with frequency;
whereas the relaxation times decreases almost two
orders of magnitude. Due to activation energy
increases with frequency, a shift to higher TSG values
Fig. 8 ZFC curves obtained for samples M30, M40, and M50.
Temperatures TSG and TV are indicated with arrows. TSG is
almost constant for the three samples, while TV changes with
particle size. The figure shows the curves with arbitrary units
and do not reflect the relative magnetization of the samples. This
graph is used for a better visualization of the changes of Verwey
transition temperature
Table 3 Verwey and spin-glass transition temperatures
observed by susceptibility characterization at 100 Hz
Sample TV (K) TSG (K)
M30 85 (2) 35 (2)
M40 94 (2) 35 (2)
M50 93 (2) 35 (2)
Fig. 9 Derivatives of in-phase susceptibility at 100 Hz and
ZFC at 0 Hz curves for sample M30. The vertical lines indicate
TV and TSG
J Nanopart Res (2014) 16:2482 Page 9 of 12 2482
123
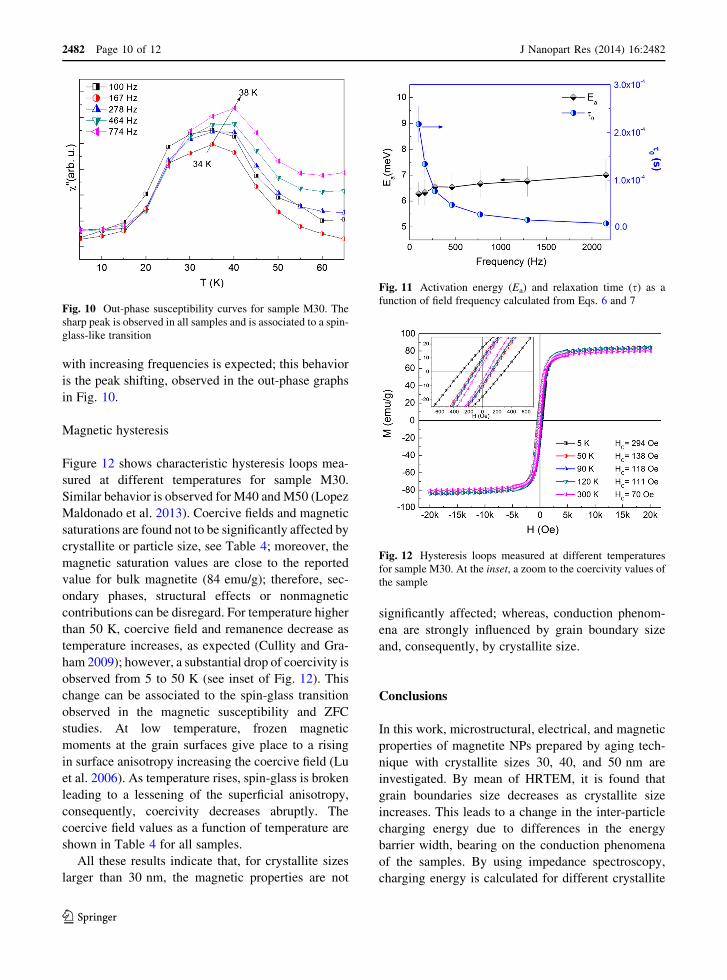
with increasing frequencies is expected; this behavior
is the peak shifting, observed in the out-phase graphs
in Fig. 10.
Magnetic hysteresis
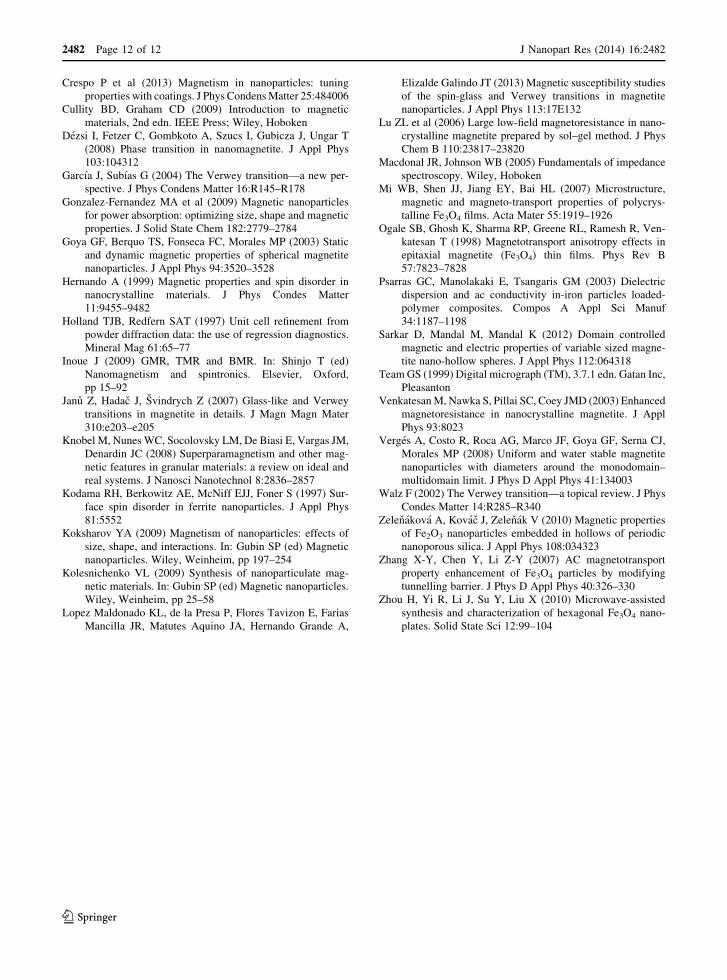
Figure 12 shows characteristic hysteresis loops mea-
sured at different temperatures for sample M30.
Similar behavior is observed for M40 and M50 (Lopez
Maldonado et al. 2013). Coercive fields and magnetic
saturations are found not to be significantly affected by
crystallite or particle size, see Table 4; moreover, the
magnetic saturation values are close to the reported
value for bulk magnetite (84 emu/g); therefore, sec-
ondary phases, structural effects or nonmagnetic
contributions can be disregard. For temperature higher
than 50 K, coercive field and remanence decrease as
temperature increases, as expected (Cullity and Gra-
ham 2009); however, a substantial drop of coercivity is
observed from 5 to 50 K (see inset of Fig. 12). This
change can be associated to the spin-glass transition
observed in the magnetic susceptibility and ZFC
studies. At low temperature, frozen magnetic
moments at the grain surfaces give place to a rising
in surface anisotropy increasing the coercive field (Lu
et al. 2006). As temperature rises, spin-glass is broken
leading to a lessening of the superficial anisotropy,
consequently, coercivity decreases abruptly. The
coercive field values as a function of temperature are
shown in Table 4 for all samples.
All these results indicate that, for crystallite sizes
larger than 30 nm, the magnetic properties are not
significantly affected; whereas, conduction phenom-
ena are strongly influenced by grain boundary size
and, consequently, by crystallite size.
Conclusions
In this work, microstructural, electrical, and magnetic
properties of magnetite NPs prepared by aging tech-
nique with crystallite sizes 30, 40, and 50 nm are
investigated. By mean of HRTEM, it is found that
grain boundaries size decreases as crystallite size
increases. This leads to a change in the inter-particle
charging energy due to differences in the energy
barrier width, bearing on the conduction phenomena
of the samples. By using impedance spectroscopy,
charging energy is calculated for different crystallite
Fig. 10 Out-phase susceptibility curves for sample M30. The
sharp peak is observed in all samples and is associated to a spin-
glass-like transition
Fig. 11 Activation energy (Ea) and relaxation time (s) as a
function of field frequency calculated from Eqs. 6 and 7
Fig. 12 Hysteresis loops measured at different temperatures
for sample M30. At the inset, a zoom to the coercivity values of
the sample
2482 Page 10 of 12 J Nanopart Res (2014) 16:2482
123
and particle sizes. A relationship between particle size,
grain boundary width, and charging energy is estab-
lished. The results are in agreement with the expected
behavior. On the other hand, hysteresis loops are not
significantly affected by crystallite/particle size; sat-
uration magnetization is close to the expected theo-
retical value.
In addition to the microstructural effects on the
electrical and magnetic properties, two transitions are
observed by susceptibility and zero field cooling
studies. The first one, the so called Verwey transition
is found at 86, 90, and 94 K for samples M30, M40,
and M50, respectively. This transition is particle size
dependent, as reported by other authors (Goya et al.
2003). The transition occurring at 35 K is associated to
a spin-glass-like transition. The activation energy for
breaking the spin-glass state is calculated to be around
6 and 7 meV. This activation energy depends on
frequency. The spin-glass-like transition is also con-
firmed by a strong coercivity decrease as temperature
increases from 5 to 50 K, supporting the hypothesis
that there is a change on the anisotropy due to the
canted frozen spins at the surface.
These results could help to improve magnetore-
sistive responses of magnetite in similar nanostruc-
tured systems. From the point of view of magnetic
properties, only a good control on the magnetic
phase would help to keep the maximum magnetiza-
tion and coercivity values. Our results also suggest
that particle or grain sizes larger than 30 nm have
the magnetic properties of the bulk. Lower magne-
tization is expected for smaller sizes due to higher
quantity of broken ligands at the surface.
Consequently, for magnetoresistive applications,
systems with crystallite sizes above 30 nm could
be better for the improvement of magnetic response
control. On the other hand, conductivity is signif-
icantly affected by microstructure because of charg-
ing energy that strongly depends on crystallite size
and grain boundaries width, as demonstrated. There-
fore, a good control on the microstructure of
magnetite would help to have adequate grain
boundary conditions to achieve optimal charging
energy values; thus, conduction could be enhanced
to get a better magnetoresistive response.
Acknowledgments This work was partially supported by
FONCICYT Project 94682 ‘‘Oxides for Spintronics’’. Also, by
Grants from the Spanish Ministry of Science and Innovation
MAT2011-23641, MAT2012-37109-C02-01, and Madrid
regional government CM (S009/MAT-1726). The authors
want to acknowledge CONACYT, CIMAV, and UACJ for
their support for making this research possible.
References
Balanda M et al (2005) Magnetic AC susceptibility of stoichi-
ometric and low zinc doped magnetite single crystal. Eur
Phys J B 43:201–212
Batlle X, Labarta A (2002) Finite-size effects in fine particles:
magnetic and transport properties. J Phys D Appl Phys
35:R15–R42
Cabrera L, Gutierrez S, Menendez N, Morales MP, Herrasti P
(2008) Magnetite nanoparticles: electrochemical synthesis
and characterization. Electrochim Acta 53:3436–3441
Coey JMD (1999) Powder magnetoresistance. J Appl Phys
85:5576–5581
Coey JMD (2010) Magnetism and magnetic materials. Cam-
bridge University Press, New York
Table 4 Values for Coercivity (HC), maximum magnetization (Mmax), and remanence (MR) observed at different temperatures from
hysteresis loops for all samples
Sample T (K)
5 50 90 120 300
M30 HC (Oe) 294 (1) 138 (1) 118 (1) 111 (1) 70 (1)
Mmax (emu/g) 83.7 (5) 83.8 (5) 83.9 (5) 83.8 (5) 80.3 (5)
MR (emu/g) 17.5 (1) 10.9 (1) 9.6 (1) 8.9 (1) 6.0 (1)
M40 HC (Oe) 248 (1) 137 (1) 118 (1) 108 (1) 78 (1)
Mmax (emu/g) 80 (4) 80 (4) 80 (4) 80 (4) 76 (4)
MR (emu/g) 10.9 (4) 7.5 (4) 6.7 (3) 6.3 (3) 5.0 (2)
M50 HC (Oe) 249 (1) 134 (1) 116 (1) 110 (1) 77 (1)
Mmax (emu/g) 83 (1) 83 (1) 83 (1) 83 (1) 79 (1)
MR (emu/g) 14.1 (2) 10.0 (1) 9.1 (1) 8.7 (1) 6.9 (1)
J Nanopart Res (2014) 16:2482 Page 11 of 12 2482
123
Crespo P et al (2013) Magnetism in nanoparticles: tuning
properties with coatings. J Phys Condens Matter 25:484006
Cullity BD, Graham CD (2009) Introduction to magnetic
materials, 2nd edn. IEEE Press; Wiley, Hoboken
Dezsi I, Fetzer C, Gombkoto A, Szucs I, Gubicza J, Ungar T
(2008) Phase transition in nanomagnetite. J Appl Phys
103:104312
Garcıa J, Subıas G (2004) The Verwey transition—a new per-
spective. J Phys Condens Matter 16:R145–R178
Gonzalez-Fernandez MA et al (2009) Magnetic nanoparticles
for power absorption: optimizing size, shape and magnetic
properties. J Solid State Chem 182:2779–2784
Goya GF, Berquo TS, Fonseca FC, Morales MP (2003) Static
and dynamic magnetic properties of spherical magnetite
nanoparticles. J Appl Phys 94:3520–3528
Hernando A (1999) Magnetic properties and spin disorder in
nanocrystalline materials. J Phys Condes Matter
11:9455–9482
Holland TJB, Redfern SAT (1997) Unit cell refinement from
powder diffraction data: the use of regression diagnostics.
Mineral Mag 61:65–77
Inoue J (2009) GMR, TMR and BMR. In: Shinjo T (ed)
Nanomagnetism and spintronics. Elsevier, Oxford,
pp 15–92
Janu Z, Hadac J, Svindrych Z (2007) Glass-like and Verwey
transitions in magnetite in details. J Magn Magn Mater
310:e203–e205
Knobel M, Nunes WC, Socolovsky LM, De Biasi E, Vargas JM,
Denardin JC (2008) Superparamagnetism and other mag-
netic features in granular materials: a review on ideal and
real systems. J Nanosci Nanotechnol 8:2836–2857
Kodama RH, Berkowitz AE, McNiff EJJ, Foner S (1997) Sur-
face spin disorder in ferrite nanoparticles. J Appl Phys
81:5552
Koksharov YA (2009) Magnetism of nanoparticles: effects of
size, shape, and interactions. In: Gubin SP (ed) Magnetic
nanoparticles. Wiley, Weinheim, pp 197–254
Kolesnichenko VL (2009) Synthesis of nanoparticulate mag-
netic materials. In: Gubin SP (ed) Magnetic nanoparticles.
Wiley, Weinheim, pp 25–58
Lopez Maldonado KL, de la Presa P, Flores Tavizon E, Farias
Mancilla JR, Matutes Aquino JA, Hernando Grande A,
Elizalde Galindo JT (2013) Magnetic susceptibility studies
of the spin-glass and Verwey transitions in magnetite
nanoparticles. J Appl Phys 113:17E132
Lu ZL et al (2006) Large low-field magnetoresistance in nano-
crystalline magnetite prepared by sol–gel method. J Phys
Chem B 110:23817–23820
Macdonal JR, Johnson WB (2005) Fundamentals of impedance
spectroscopy. Wiley, Hoboken
Mi WB, Shen JJ, Jiang EY, Bai HL (2007) Microstructure,
magnetic and magneto-transport properties of polycrys-
talline Fe3O4 films. Acta Mater 55:1919–1926
Ogale SB, Ghosh K, Sharma RP, Greene RL, Ramesh R, Ven-
katesan T (1998) Magnetotransport anisotropy effects in
epitaxial magnetite (Fe3O4) thin films. Phys Rev B
57:7823–7828
Psarras GC, Manolakaki E, Tsangaris GM (2003) Dielectric
dispersion and ac conductivity in-iron particles loaded-
polymer composites. Compos A Appl Sci Manuf
34:1187–1198
Sarkar D, Mandal M, Mandal K (2012) Domain controlled
magnetic and electric properties of variable sized magne-
tite nano-hollow spheres. J Appl Phys 112:064318
Team GS (1999) Digital micrograph (TM), 3.7.1 edn. Gatan Inc,
Pleasanton
Venkatesan M, Nawka S, Pillai SC, Coey JMD (2003) Enhanced
magnetoresistance in nanocrystalline magnetite. J Appl
Phys 93:8023
Verges A, Costo R, Roca AG, Marco JF, Goya GF, Serna CJ,
Morales MP (2008) Uniform and water stable magnetite
nanoparticles with diameters around the monodomain–
multidomain limit. J Phys D Appl Phys 41:134003
Walz F (2002) The Verwey transition—a topical review. J Phys
Condes Matter 14:R285–R340
Zelenakova A, Kovac J, Zelenak V (2010) Magnetic properties
of Fe2O3 nanoparticles embedded in hollows of periodic
nanoporous silica. J Appl Phys 108:034323
Zhang X-Y, Chen Y, Li Z-Y (2007) AC magnetotransport
property enhancement of Fe3O4 particles by modifying
tunnelling barrier. J Phys D Appl Phys 40:326–330
Zhou H, Yi R, Li J, Su Y, Liu X (2010) Microwave-assisted
synthesis and characterization of hexagonal Fe3O4 nano-
plates. Solid State Sci 12:99–104
2482 Page 12 of 12 J Nanopart Res (2014) 16:2482
123