J. DOUGLAS OLIVER Effects of Biogenic and Simulated Nutrient Enrichment on Fish and Other Components of Okefenokee Swamp Marshes (under the direction of BERNARD C. PATTEN)
Biogenic and simulated nutrient enrichment increased
levels of various ecological components of Okefenokee Swamp
marshes. Fertilization by wading birds and an artificial
experimental source increased stores of phosphorus in
diverse links of the food web. Simulation modeling lent
support to the hypothesis that birds mediated such changes
that persisted after they abandoned this ecosystem.
To simulate nutrient enrichment from birds, I placed
pots of enriched agar inside clear enclosures. In the
laboratory, pots released a mean of 45 mg NH4-N d- 1 and 11
mg P04-P d- 1 into water. In the marsh, mesocosms containing
pots had higher stocks of zooplankton (primarily
Diaphanosoma brachyurum) than controls. These results
demonstrate that simulation of enrichment remaining after
birds left can cause significant effects on zooplankton
primary consumers in the marshes.
Evidence was presented for residual enrichment by a
biotic component of the ecosystem itself, the birds. One to
two years after they abandoned the marsh, it showed con-
tinued nutrient effects. Elevated available phosphorus in
sediments contributed to enhanced levels of phytoplankton.
Planktivorous fish were greater in biomass than at reference
sites. These results and the zooplankton data suggest

Tn
residual enrichment effects of birds on sediments, and in
directly on plankton and fish.
I measured the trophic transfer to Leptolucania ornrnata
and Garnbusia affinis, in situ. Both fishes ate mainly in
sect larvae (such as Chironomidae) and Cladocera. Consump
tion by both species in summer (26.31 mg m- 2 d- 1 ) supports a
hypothesis that invertebrate prey production must be sub
stantial in such blackwater marshes.
Trophic model dynamics were checked by seasonal data
before, during and after simulated nutrient input from
birds. The model reasonably estimates effects of enrichment
on benthic detritus, aquatic macrophytes and phytoplankton,
and conservatively estimates the increase of zooplankton and
fish. Simulated levels decreased after simulated abandon
ment, and the decreases generally followed field trends.
The model indicates that nesting birds can have considerable
effects on aspects of an ecosystem not normally associated
with them.
On the applied side, wetlands have been suggested for
natural sewage treatment. Results described here indicate a
sizeable capacity to buffer pulses of sewage nutrients, by
time-delayed release.
INDEX WORDS: Fish, Okefenokee Swamp, Marsh, Mesocosm,
Phosphorus, Plankton, Simulation Model

EFFECTS OF BIOGENIC AND SIMULATED NUTRIENT ENRICHMENT ON
FISH AND OTHER COMPONENTS OF OKEFENOKEE SWAMP MARSHES
by
J. DOUGLAS OLIVER
B.Sc., University of Toronto, 1975
M.Sc., University of Toronto, 1977
A Dissertation Submitted to the Graduate Faculty
of the University of Georgia in Partial Fulfillment
of the
Requirements for the Degree
DOCTOR OF PHILOSOPHY
ATHENS, GEORGIA
1987

--
(C) 1987
J. Douglas Oliver
All Rights Reserved

EFFECTS OF BIOGENIC AND SIMULATED NUTRIENT ENRICHMENT ON
FISH AND OTHER COMPONENTS OF OKEFENOKEE SWAMP MARSHES
by
J. DOUGLAS OLIVER
Approved:
;: -'---) - . I (I / :. -d~ Date (- c ,1../.:& " __ -~~~~-0~~~~~'~~t~'~~~--'~!U~J,~{~,.~,~,--- ~ ,
Major Professor --, ,.
I</~/"; , . . /
/ -,. '. i.> !.' ,_.- - ,', - Date.... " -----
Chairman, Reading Committee
Approved:
~~~:,; aduate Dean (J

Soli Christo Gloria
iv

ACKNOWLEDGMENTS
I thank my major professor, Bernard C. Patten, for his
advice and support (through National Science Foundation
grants BSR 81 14823 and BSR 82 15587). Okefenokee National
Wildlife Refuge allowed unhampered access to many good re
search sites. Drs. J. Whit Gibbons, Ronnie J. Gilbert,
Eugene P. Odum and Robert E. Reinert gave of their valuable
time to serve on my Committee. Drs. Steve Schoenberg and
Tarzan Legovit coauthored papers in this dissertation and
gave encouragement and ideas. Other "Swampers" such as B.J.
Freeman and Anita Caudle Smith provided insights. Many
other friends in Athens gave logistic support and I thank
you all. My parents, Mr. and Mrs. G. Wilfrid Oliver, always
encouraged my studies and provided support in numerous ways.
v

FIGURE
Acknowledgments
TABLE OF CONTENTS
PAGE
v
List of Tables . . . . . . . . . . . . . . . . . . . .. ix
List of Figures . . . . . . . . . . . . . . . . . . .. xi
Chapter 1. Introduction ................. 1
Chapter 2. A system for examining the response of aqua-
tic ecosystems to gradual chemical inputs, and
field application in Okefenokee Swamp, Georgia ... 16
Introduction . . . .
Methods .
Results
. 17
19
22
Discussion . . . . . . . . . . . . . . . . . . . . . 23
Summary . . . . . . . . . . . . . . . . . . . . . . 26
References .
Tables . . .
Figures . . . . . . . . . .
28
· . 31
32
Chapter 3. Residual influence of macronutrient enrich
ment on the aquatic food web of an Okefenokee Swamp
abandoned bird rookery . · . 36
Introduction . · . 37
Site Descriptions . . 41
vi

Methods .
Results .
Discussion .
References
Figures . . . . . . . . . . .
vii
42
43
46
53
59
Chapter 4. Consumption, evacuation rates and diets of
pygmy killifish, Leptolucania ommata, and mosquito
fish, Gambusia affinis (Osteichthyes: Atheriniformes)
in Okefenokee Swamp . . . . . . . . . 71
Introduction . . . . . . . . . . . . . . . . . . . . 72
Methods . . . . . . . . . . . . . . . . . . . . . . 74
Analyses and Results . · 76
Diets . · 76
Feeding Dynamics . . . . . . . . . . . . . . . 76
Gambusia affinis .. . ........ 76
Leptolucania ommata
Discussion
Literature Cited .
Tables . .
Figures . . . . . . . . . . . . . . . . .
· . 78
· 79
· . 85
· . 90
92
Chapter 5. Okefenokee marshland before, during and after
nutrient enrichment by a bird rookery . . 96
Introduction . . . . . . . . . . . . . . . . . . . . 97
Area of Study 99
Methods . . 100
Overview . . . . . . . . . . . . . . . . . . . .. 103

Results and Discussion . . . . . . . . . . . . . . Control Site (Without Birds)
viii
104
104
Active Rookery . . . . . . . . . . . 107
Abandoned Rookery . . . . . . . . . . . . . . 111
Conclusions . . . . . . . . . . . . . . . . . . . . 114
References .
Tables . . .
Figures . . . . . .
117
124
. 135
Chapter 6. Conclusions .. .......... 153
Appendix. FORTRAN model of marshland on the west side
of Okefenokee Swamp . . 158

b
LIST OF TABLES
TABLE PAGE
Chapter 2
1. Average water parameters in mesocosms with and
without (NH4)2HP04 pots. Depth shown in em, temp
erature in °C, and oxygen fluctuation in mg L- l .
Nitrogen, phosphorus and chlorophyll concentrations
shown in;ng L- l . Samples were taken between June 5
and August 29, 1983. Parentheses show (minimum-
maximum range, n) .
Chapter 4
1. Percent of total dry diet (and standard error) at
tributable to various foods in winter and summer.
Numbers of foreguts (in brackets) are about equally
represented from all parts of diel cycle .
2. Evacuation rates and food consumption. Food in mg,
fish in g dry weight
31
. 90
. 91
Chapter 5
1. Sources and sinks of phosphorus. . . . 124
2. Initial states based on initial simulation day
(August 29) ..... 125
3. Literature-based values for nonlinearities . . . . . 126
ix

x
4. Literature-based constants. 128
5. Comparison of initial states to states after 11
simulated years without birds (in mg P m- 2 ) .... 134

b
LIST OF FIGURES
FIGURES
Chapter 2
1. Zooplankton in Okefenokee Swamp. Stars represent
densities in mesocosms with (NH4)2HP04 pots (see
text), circles in mesocosms without pots. Bars
represent +S.E. N = 3 for each datum except n = 2
PAGE
on August 11. Note log scales on ordinates. . . . 33
2. NH4-N and P04-P released by pots through time. Solid
symbols represent values in Okefenokee blackwater,
open symbols in deionized water. Bars represent
is.E., n = 4 for each datum. Log scales on
ordinates . . . . . .
Chapter 3
1. Map of marsh sites mentioned in the text. Solid
lines on the enlarged map delineate the Okefenokee
Swamp watershed, its enclosed islands and
watercourses . .
2. Equilibrium phosphate concentrations at R, RC, LCP,
and MP sites. N = 3 for each datum except n = 2
35
. 60
for LCP and MP. Vertical bars denote +S.E. . . . . 62
xi

3. Phytoplankton chlorophyll ~ concentrations in the
water column at Rand RC. N = 2 for each datum.
xii
Bars (and parenthetical numbers) represent range 64
4. Zooplankton densities in corrals receiving artificial
enrichment of Nand P (stars) versus no enrichment
(circles), 1983. N = 3 for each datum except n = 2
on August 11. Bars represent ±S.E. Note log
scales on ordinates. Modified from Oliver (1985). 66
5. Fish biomass (wet g m- 2 ) in R contrasted with two
other Okefenokee sites (RC and LCP). Each value is
an average over n = 8, except that n = 6 in October
1982 at LCP, n = 7 in November at Rand RC, n = 12
in January 1983 at RC, n = 7 in February at LCP,
n = 5 in June at R, n = 7 in August-September at R,
and n = 7 in October 1983 at RC. A plus sign indi
cates that biomass at R is significantly greater, a
negative significantly less than at other sites
(P < 0.05). See text . .
6. Interactions via macronutrient transfer in an aquatic
ecosystem (Okefenokee Swamp marsh). Solid arrows
indicate positive direct relationships, dashed
arrows show indirect relationships, and a dotted
68
arrow indicates a possible relationship. See text . 70
Chapter 4
1. Foregut content and food consumption of G. affinis in
summer. In upper panel, filled circles and solid
lines show diel content trends in field fish; open
b ______________ ~~ __________ ~_~
h
xiii
squares and dashed lines show changes in content of
fish held in food-free tanks. In lower panel,
filled circles and solid lines show trends in con
sumption during each time period; open circle and
dotted lines show presumed trend based on
difference between the final (4:30 PM) and initial
(8:50 PM) consumption values
2. Foregut content and food consumption of L. ommata.
• 93
(See Fig. 1 legend for details). ....... 95
Chapter 5
1. Map of the marsh sites mentioned in the text. Solid
lines on the enlarged map delineate the Okefenokee
watershed, its enclosed islands and watercourses. 136
2. An Okefenokee marsh system and its interacting envir
onment. Rectangles are major system components and
"clouds" are sources and sinks of phosphorus . 138
3. P inputs to Okefenokee Swamp via rain and birds. Al
though wading bird data represent input from a
normal nesting of 8000 birds, the step function is
similar (but lower or higher) when smaller or
larger numbers of birds are simulated . . 140
4. Primary producer and SRP dynamics when no birds are
present. Bars show ±S.E. for macrophytes and range
of duplicate values for phytoplankton . . . . . . . 142
5. Animal dynamics when no birds are present. Bars show
+S.E. 144

xiv
6. Primary producer and benthic detritus dynamics
without birds. (In Fig. a and c, controls
correspond to simulated cases in 4a and 4c) . 146
7. Animal dynamics in the active rookery compared with
dynamics without birds
8. Primary producer and SRP dynamics in the abandoned
rookery. In a, field data are based on abandoned
rookery macrophyte densities times P concentrations
in macrophytes of I) active rookery and II) control
sites. (Nesting birds left the site in August
1981, thus graphs represent dynamics 1.1-2.1 years
after abandonment) . . . .
9. Detritus and animal dynamics in the abandoned
148
150
rookery . . . . . . . . . 152

b
CHAPTER 1
INTRODUCTION
"By enriching adjacent waters with the biogenous elements contained in their droppings, birds significantly affect the scale of the organic cycle in the areas of . their nesting sites. Fish-eating birds are not, therefore, a closed side branch in the network of the biocoenosis, and they do not, as it previously seemed, remove from the hydrosphere the organic matter which they transform" (Golovkin and Zelikman 1965).
Fish can interact with higher order consumers such as
wild aquatic birds, via nutrients. First, it is clear that
an increase in abundance of fish that are subject to avian
predation might increase the birds, by means of enhanced
macronutrient/biomass transfer (Lack 1954, Browder 1978,
Furness 1982). Second and more controversial is whether or
not a reverse stimulation takes place, i.e. whether or not
natural aggregations of birds increase abundances of fish,
via fertilization resulting from excretion (suggested by
Wheeler 1945). In the first case, ingestion is responsible
for the effects of fish on birds, whereas in the second,
the reverse process of egestion would be indirectly r~spon-
sible for the effect of birds on fish.
Nutrient effects are not usually considered to extend
between widely diverse ecosystem components such as from
birds to fish, via guano and the intervening food web.
Nevertheless, this dissertation proposes that such
1

b
2
effects can be significant, even continuing after birds
have left the system. In the process of investigating
these ideas, new information is brought to light on various
aquatic components of the captivating marshes of Okefenokee
Swamp.
Okefenokee Swamp is the largest entirely freshwater
wetland in the United States. It extends over some 1800
krn2 , and 21 percent of this area is aquatic macrophyte
marshland (Finn and Rykiel 1979). Various researchers have
shown that the Okefenokee ecosystem is not high in avail
able nutrients (such as phosphorus and nitrogen, Auble
1982). It is underlain by nutrient poor sand and clay and
is ombrotrophic, or rain-fed (Rykiel 1977). Thus, an ex
ogenous source of nutrients might be expected to have con
siderable effect on the ecosystem.
Stinner (1983) demonstrated that nesting wading birds
significantly enriched a marsh near Mack's Island in
Okefenokee Swamp. They brought in food for their young
from a radius of up to 20 krn. Resulting concentrations of
guano caused levels of nutrients such as phosphorus (P) to
increase significantly in aquatic macrophytes and in water.
Biomass of macrophytes also increased.
I hypothesized that such enrichment would move up
through the food web and cause increases in nutrient stores
of various trophic levels. In particular, the sediment
complex, phytoplankton, zooplankton, insect larvae and fish

3
were expected to increase. This general theme is inves
tigated in this dissertation. Such trophic effects from
the "bottom-up" in the ecosystem may be significant to the
development of a theory of indirect effects (Kerfoot 1987).
In order to detect possible enhancement of fish in the
bird rookery relative to other sites, a quantitative fish
trapping method was needed. Finally we were successful
with a 1-m x 1-m portable drop trap (Freeman et ale 1984).
This method, which recovered 90% of tagged marsh fish, was
adopted as standard.
Wading birds did not return to the rookery marsh from
1981 until 1984. The reason for abandonment is unknown,
but may have been because of unusually low water levels in
1981. Since the rookery site was no longer active, I ex
amined the abandoned site for possible nutrient effects
that might be residual. All data for this dissertation
were collected prior to the return of birds. (However,
nesting wading birds were in the rookery site again later.
Mack's Island rookery had "high usage" in 1984, 700 nesting
wading birds in 1985, 30000 in 1986, and 6000 in 1987
(Okefenokee Nat. Wildl. Refuge, 1984-1987)).
Although several components were shown to be affected
by wading birds, an important food web link, zooplankton,
had not been quantified in the abandoned rookery, so it was
quantified in mesocosms. A new gradual chemical release
device was used to artificially enrich experimental

4
mesocosms with P and nitrogen (N) in situ, to determine if
zooplankton could be indirectly enhanced by these
nutrients. These mesocosm experiments were also designed
as an independent confirmation that such macronutrients
could limit production in the Okefenokee marsh ecosystem.
Results of this mesocosm experiment are given in Chapter 2.
Chapter 3 describes direct and indirect nutrient ef
fects of birds on diverse components, such as the sediment
complex, phytoplankton and fish. Evidence that nutrients
could significantly affect the marsh ecosystem (Stinner
1983) even after birds had abandoned the site (Chapter 3),
led me to model nutrient effects before, during and after
enrichment by the birds. By doing so, not only is it pos
sible to simulate the sequence of changes to various
trophic levels, but to address questions that are otherwise
impossible to answer after birds have left. For example,
by how much might guano enrichment have increased the
biomass of Okefenokee marsh fish, relative to unenriched
marshland? Chapter 5 addresses such effects in light of
the ecosystem simulation model.
In order to build an appropriate trophic model of the
marsh, I needed to find answers to two questions about
Okefenokee fish feeding, in Chapter 4:
1) What taxa are Okefenokee marsh fish eating, i.e. what
trophic links are appropriate?

b
2) How much are typical marsh fish eating (consumption
rates), i.e. what are the magnitudes of trophic flows?
5
Finally, the system model brings together results of
all chapters formally (Chapter 5),-and Conclusions distills
them (Chapter 6).
Other researchers have demonstrated that nutrient ele
ments such as P can have considerable effects on an aquatic
ecosystem. Eutrophication has been well documented (e.g.,
Edmondson 1972, Wetzel 1975) and enhancement of production
of phytoplankton (DeCosta et ale 1983), zooplankton (Vanni
1987) and fish (Hall et ale 1970) are commonly seen. In
fact, southern farm ponds are often artificially fertilized
to increase fish production for man's harvest (Swingle
1956, Stickney 1979). Fertilization also can cause in
creased nutrients in sediments (Schindler et ale 1977,
Richardson and Marshall 1986) and in shallow, marshy land,
can cause increased biomass and P concentration of macro
phytic vegetation (Dolan et ale 1981).
Furthermore, it has been documented that bird guano can
result in elevated levels of various aquatic components.
Guano can fertilize phytoplankton (Leah et ale 1978, Devol
et ale 1984) and zooplankton (Golovkin and Zelikman 1965,
Zelikman and Golovkin 1972). In some countries, man
deliberately raises domestic ducks in conjunction with pond
fish in order to increase fish production (via guano or
uneaten duck food, Huet 1971, Woynarovich 1979, Chen 1983).

6
Thus, it might not be surprising if natural populations of
wading birds could increase natural populations of phyto
plankton, zooplankton, and fish.
On the other hand, no one has documented indirect en
hancement of higher trophic levels (such as fish) by wild
populations of birds. In fact, Schaefer's classic (1970)
paper showed that Peruvian anchoveta recruitment increased
when abundance of guano birds decreased, a situation that
he attributed to intense predation by these fish-eating
birds. Furthermore, natural nutrient enrichment of the an
choveta fishery is primarily due to deep-water upwelling
rather than to guano (Lack 1954, Parsons et ale 1984). At
St. Brandon's Islands, large guano inputs accompanied a
highly productive fishery relative to other islands of the
western Indian Ocean, but Wheeler (1945) did not know if
guano fertilization was rapid enough to overcome tidal dis
sipation to allow a causal link. Onuf et ale (1977) stated
that enrichment of mangroves by egrets and pelicans in
creased mangrove biomass and N content which then caused
increased consumption by lepidopteran and coloeopteran
insects, but they did not report any further effects on any
higher trophic levels. The present dissertation suggests
that wild birds not only enhance primary producers and
zooplankton primary consumers, but also secondary-tertiary
consumers such as fish. Evidence is also presented for in
direct time-delayed mediation of such enrichment by birds,

via slow movement from sediments (benthic detritus,
Chapters 3 and 5).
7
Patten (1982) has emphasized the importance of time
delayed indirect effects in the ecosystem (e.g., effects of
enrichment by birds on fish, via intermediate components).
His mathematical analyses (Higashi and Patten 1986) suggest
that such indirect effects can exceed direct effects (e.g.,
possibly the effects of zooplankton on fish, Fig. 2 of
Chapter 5). Although this dissertation is not a test of
such theory, it does support the notion that indirect ef
fects such as the effect of birds on plankton and fish can
be significant in the ecosystem.
Many authors have presented other evidences that in
direct effects can be highly significant. Aside from pre
viously cited references, the following are some trophi
cally mediated examples from various aquatic systems.
Kerfoot (1987) stated that increases of fish density in a
Vermont lake increased Mesocyclops zooplankton because
positive effects along indirect pathways were greater than
direct (negative) predation by the fish. He pointed out,
however, that the balance between the two path strengths
was sensitive enough to fish density that the overall in
teraction could easily shift from positive to negative, at
high fish density.
Dungan (1987) showed that on a rocky intertidal
surface, algal grazing by a limpet (Collisella) freed space

8
on the surface, thus indirectly increasing the abundance of
a barnacle (Chthamalus), and thus also its predator (the
gastropod, Acanthina). In return, the predatory gastropod
indirectly increased the limpet by removing the barnacle,
thus increasing the limpet's food and space.
Moss (1976) stated that high levels of artificial P and
N fertilization of ponds caused changes in the epiphytic
diatom community that could be "directly ascribed to fer
tilization and some [indirectly] to a change in ... the host
macrophyte." He believed that shading by increased
phytoplankton indirectly caused a reduction in biomass of
epiphytic diatoms. Furthermore, at high fertilization, the
presence of fish caused increased biomass of epiphytes,
probably indirectly through predation of grazing inverte
brates. Papers from the recent book by Kerfoot and Sih
(1987) cite and review other indirect effects in aquatic
ecosystems.
The effects of nutrients on aquatic systems are more
than a matter of academic analysis. Possible practical
significance involves use of wetlands for treatment of
sewage and other wastes. Many authors (e.g., Dolan et ale
1981, Winchester and Emenhiser 1983, Fritz and Helle 1984,
Ewel and Odum 1984) have discussed the application of
secondarily treated sewage to wetlands for the purpose of
an inexpensive natural tertiary treatment (largely via
nutrient movement to sediments, Nichols 1983, Dierberg and

9
Brezonik 1984). The present dissertation examines similar
nutrient additions from birds and artificial devices
(Chapters 2 and 5), and their effects on wetland ecology.
Long-term return toward initial natural states is also con
sidered (Chapter 5), and may be of future use for analysis
of the return of former sewage-treatment wetlands toward
their natural conditions.

References
Auble, G.T. 1982. Biogeochemistry of Okefenokee Swamp:
litterfall, litter decomposition, and surface water
dissolved cation concentrations. Ph.D. Dissertation,
Univ. Georgia, Athens.
Chen, H.H. 1983. Taiwan. Pp. 415-426 In E.E. Brown (ed.),
World Fish Farming, Second ed., Avi Publ., Westport,
CN.
10
DeCosta, J., Janicki, A., Shellito, G. and Wilcox, G. 1983.
The effect of phosphorus additions in enclosures on the
phytoplankton and zooplankton of an acid lake. Oikos
40: 283-294.
Devol, A.H., Dos Santos, A., Forsberg, B.R. and Zaret, T.M.
1984. Nutrient addition experiments in Lago
Jacaretinga, Central Amazon, Brazil: 2. The effect of
humic and fulvic acids. Hydrobiologia 109: 97-103.
Dierberg, F.E. and Brezonik, P.L. 1984. Nitrogen and phos
phorus mass balances in a cypress dome receiving
wastewater. Pp. 112-118 In K.C. Ewel and H.T. Odum
(eds.), Cypress Swamps, Univ. Presses of Florida,
Gainesville, FL.
Dolan, T.J., Bayley, SeE., Zoltek, J., Jr. and Hermann,
A.J. 1981. Phosphorus dynamics of a Florida freshwater
marsh receiving treated wastewater. J. Appl. Ecol. 18:
205-219.

Dungan, M.L. 1987. Indirect mutualism: Complementaryef
fects of grazing and predation in a rocky intertidal
community. Pp. 188-200 In W.C. Kerfoot and A. Sih
(eds.), Predation: Direct and Indirect Impacts on
Aquatic Communities, Univ. Press of New England,
Hanover, NH.
11
Edmondson, W.T. 1972. Nutrients and phytoplankton in Lake
Washington. Pp. 172-193 In G.E. Likens (ed.), Nutrients
and Eutrophication: The Limiting-Nutrient Controversy.
Am. Soc. Limnol. Oceanogr., Lawrence, KS.
Finn, J.T. and Rykiel, E.J., Jr. 1979. Effect of the
Suwanee River sill on Okefenokee Swamp water level.
Water Resour. Res. 15: 313-320.
Freeman, B.J., Greening, R.S. and Oliver, J.D. 1984. Com
parison of three methods for sampling fishes and macro
invertebrates in a vegetated freshwater wetland. J.
Freshw. Ecol. 2: 603-609.
Fritz, W.R. and Helle, s.C. 1984. Feasibility of cypress
wetland tertiary treatment. Pp. 249-257 In K.C. Ewel
and H.T. Odum (eds.), Cypress Swamps. Univ. Presses of
Florida, Gainesville, FL.
Furness, R.W. 1982. Competition between fisheries and
seabird communities. Pp. 225-307 In J.R.S. Blaxter,
F.S. Russell and M. Yonge (eds.), Adv. Mar. Biol. Vol.
20, Academic Press, New York.

12
Golovkin, A.N. and Zelikman, E.A. 1965. Development of
Calanus in the nesting grounds of colonial seabirds on
the Murmansk coast. Okeanologiya 5: 117-128.
Hall, D.J., Cooper, W.E. and Werner, E.E. 1970. An ex
perimental approach to the production dynamics and
structure of freshwater animal communities. Limnol.
Oceanogr. 15: 839-928.
Higashi, M. and Patten, B.C. 1986. Further aspects of the
analysis of indirect effects in ecosystems. Ecol.
Modelling 31: 69-77.
Huet, M. 1971. Textbook of Fish Culture. Fishing News
Books, Surrey, U.K. 436 pp.
Kerfoot, W.C. 1987. Cascading effects and indirect
pathways. Pp. 57-70 In W.C. Kerfoot and A. Sih (eds.),
Predation: Direct and Indirect Impacts on Aquatic
Communities, Univ. Press of New England, Hanover, NH.
Kerfoot, W.C. and Sih, A. 1987. Predation: Direct and In
direct Impacts on Aquatic Communities, Univ. Press of
New England, Hanover, NH.
Lack, D. 1954. The Natural Regulation of Animal Numbers.
Oxford Univ. Press, London.
Leah, R.T., Moss, B. and Forrest, D.E. 1978. Experiments
with large enclosures in a fertile, shallow, brackish
lake, Hickling Broad, United Kingdom. Int. Revue ges.
Hydrobiol. 63: 291-310.

13
Moss, B. 1976. The effects of fertilization and fish on
community structure and biomass of aquatic macrophytes
and epiphytic algal populations: an ecosystem
experiment. J. Ecol. 64: 313-342.
Nichols, D.S. 1983. Capacity of natural wetlands to remove
nutrients from wastewater. J. Water Poll. Cont. Fed.
55:495-505.
Ewel, K.C and Odum, H.T. Cypress Swamps, Univ. Presses of
Florida, Gainesville, FL.
Okefenokee Nat. Wildl. Refuge. 1984-1987. Annual reports on
Mack's Island rookery. Unpublished. Folkston, GA.
Onuf, C.P., Teal, J.M. and Valiela, I. 1977. Interactions
of nutrients, plant growth and herbivory in a mangrove
ecosystem. Ecology 58: 514-526.
Parsons, T.R., Takahashi, M. and Hargrave, B. 1984.
Biological Oceanographic Processes, 3rd ed. Pergamon
Press, New York.
Patten, B.C. 1982. Environs: relativistic elementary par
ticles for ecology. Am. Nat. 119: 179-219.
Richardson, C.J. and Marshall, P.E. 1986. Processes con
trolling movement, storage, and export of phosphorus in
a fen peatland. Ecol. Monogr. 56: 279-302.
Rykiel, E.J., Jr. 1977. The Okefenokee Swamp watershed:
water balance and nutrient budgets. Ph.D. Dissertation,
Univ. Georgia, Athens.

b
Schaefer, M.B. 1970. Men, birds and anchovies in the Peru
Current- dynamic interactions. Trans. Am. Fish. Soc.
99: 461-467.
14
Schindler, D.W., Hesslein, R. and Kipphut, G. 1977. Inter
actions between sediments and overlying waters in an
experimentally eutrophied Precambrian Shield lake. Pp.
235-243 In H.L. Golterman (ed.), Interactions between
Sediments and Fresh Water. Junk Publ., The Hague,
Netherlands.
Stickney, R.R. 1979. Principles of Warmwater Aquaculture.
John Wiley and Sons, New York.
Stinner, D.H. 1983. Colonial wading birds and nutrient cy
cling in the Okefenokee Swamp ecosystem. Ph.D.
Dissertation, Univ. Georgia, Athens.
Swingle, H.S. 1956. Determination of balance in farm fish
ponds. Trans. N. Am. Wildl. Conf. 21: 298-322.
Vanni, M.J. 1987. Effects of nutrients and zooplankton size
on the structure of a phytoplankton community. Ecology
68: 624-635.
Wetzel, R.G. 1975. Limnology. W.B. Saunders, Philadelphia,
PA.
Wheeler, J.F.G. 1945. Plant nutrients in the sea. Nature
155: 731-732.
Winchester, B.H. and Emenhiser, T.C. 1983. Dry season
wastewater assimilation by a North Florida hardwood
swamp. Wetlands 3: 90-107.
--
15
Woynarovich, E. 1979. The feasibility of combining animal
husbandry with fish production, with special reference
to duck and pig production. Pp. 203-208 In T.V.R. Pil
lay and W.A. Dill (Eds.), Advances in Aquaculture, FAO,
Fishing News Books, Surrey, U.K.
Zelikman, E.A. and Golovkin, A.N. 1972. Composition, struc
ture and productivity of neritic plankton communities
near the bird colonies of the northern shores of Novaya
Zemlaya. Mar. BioI. 17: 265-274.

CHAPTER 2
A SYSTEM FOR EXAMINING THE RESPONSE OF AQUATIC ECOSYSTEMS
TO GRADUAL CHEMICAL INPUTS, AND FIELD APPLICATION IN
OKEFENOKEE SWAMP, GEORGIA
1J . Douglas Oliver. 1985. Archiv fur Hydrobiologie 102: 415-
423.
16

17
Introduction
Ecologists sometimes want to add a chemical to aquatic
ecosystems and analyze responses. The primary purpose of the
present study is to describe a system that introduces sus
tained and standardizable chemical inputs to aquatic ecosys
tems on an areal basis. The second purpose is to determine
responses of an Okefenokee Swamp marsh (particularly the
plankton) to nitrogen and phosphorus inputs that simulate en
richment from a bird rookery. The third purpose is to quan
tify the input system's Nand P releases into water.
Laboratory microcosms are useful in ecological research,
but artificial. On the other hand, field experiments are more
natural, but less controllable; when a chemical is added to a
field site it may become dispersed rapidly unless the whole
area is treated. Furthermore, adding a chemical continuously
is difficult and usually it is necessary to pulse the system.
Mesocosm experimentation offers a promising compromise
between microcosm and field methodologies (Odum 1983, Grice &
Reeve 1982, Odum 1984). A mesocosm is enclosed so area or
volume can be quantified and so any chemical treatment is
contained within a reasonably natural environment. Mesocosms
should be large enough so that the ratio of wall area to
enclosed area or volume is minimized, yet small enough to be
replicated and nondestructively sampled. Personal observa
tion and another worker's (S.A. Schoenberg of the University

--
18
of Georgia) experience suggest that such a mesocosm should
enclose about 2 m2 .
Initially, a standard medical intravenous setup was con
nected to a carboy, in an attempt to obtain constant release
of dissolved chemical. However the rate of dripping could
not be maintained for more than a few hours, so this setup
was discarded. Alternatively, clay pots were filled with
nutrient-enriched agar for releasing Nand P. Fairchild et
ale (1983) developed this technique for examining the
response of algae that attached to pots in a lake, but also
noted significant releases of N03-N and P04-P into the sur
rounding water.
In some previous studies, effects of natural nutrient
inputs from bird guano on aquatic systems have been docu
mented and sometimes effects on plankton have been noted.
Golovkin & Garkavaya (1975) reported an increase in
phosphate, organic nitrogen and nitrate in marine waters ad
jacent to bird colonies. This stimulated the development of
planktonic algae and this affected the next link in
production, the zooplankton (Calanus sp.) (Where Nand P
were added in organic form directly over an inundated rock
ledge, the algae that predominated were flagellates whereas
guano that was first allowed to mineralize resulted in an in
crease in diatoms.) Similarly, Manny et ale (1975) looked at
the effect of more than 6000 migrant Canada geese (Branta
canadensis) on Wintergreen Lake, Michigan. They found that

b
19
these birds "were the chief cause of hypereutrophic primary
productivity conditions". Leentvar (1967) showed that gulls'
(Larus ridibundus) guano increased phosphate concentration in
a Dutch acid oligotrophic fen and that unicellular flagel
lates (Chlamydomonas) appeared in increasing numbers. McColl
& Burger (1976) found that Franklin's gulls (Larus pipixcan)
nesting among cattails (Typha) in shallow Minnesota pools
caused large increases in Nand P in the immediate vicinity
of the gulls, but possible effects on biota were not
examined.
Methods
To calculate release rates of Nand P into water that
approached natural input rates into Okefenokee Swamp, natural
daily inputs had to be calculated first. Stinner (1983)
showed that wading birds, predominantly white ibis (Eudocimus
albus), added 4.6 g m- 2 yr- 1 total phosphorus via guano, to a
rookery that was located in a macrophytic marsh in Okefenokee
Swamp. She found that the major input occurred from about
May to August. It follows that the average input of P was
approximately 4.6 g m- 2 /100 d = 46 mg P m- 2 d- 1 , i.e. about
92 mg d- 1 into a 2 m2 area. Since Stinner (1983) did not
measure N input, this was estimated assuming an N/P ratio of
1.29 g N /0.39 g P (Manny et ale 1975), to calculate 152

mg N m- 2 d- 1 , i.e. 304 mg N d- 1 into 2 m2 . This guano N
probably changes to NH4-N through time (Leentvaar 1967).
20
To get artificial release rates of Nand P into water
(through clay pot walls) that approached the natural input
rates mentioned above, I modified pots of Fairchild et ale
(1983). Each of their release experiment pots had been an
8.8 cm O.D. (245 mL) clay flower pot inverted and sealed to a
Petri dish, filled with 2% agar containing 0.1 M NaN03 or
K2P04 and sealed by a rubber stopper. Fairchild et ale were
in the process of testing release rates but thought that such
a pot might release about 1 mmole N (14 mg) and 1 mmole P (31
mg) d- 1 (pers. comm. 1983). Because simulation of rookery
input implied higher release values and implied NH4-N instead
of N03-N, I chose larger, 15 cm O.D. (1 L) clay pots and
filled them with 0.2 M (NH4)2HP04 in 2% agar.
Mesocosms were constructed of a frame of 10 cm x 15 cm
mesh steel fencing, covered on both sides by 0.15-mm nylon
reinforced plastic film (Almac Plastics, Md.), stapled
together where it extended beyond the fencing. Ends of the
enclosure were joined by twisting wire ends together, then
sealing the plastic by duct tape. They were partially flat
tened for carrying ready-made to the field. Enclosures were
secured by 5 cm x 5 cm wooden stakes and cord. Fish were
eliminated by shocking at high voltage. Enclosures were lo
cated at a site approximately 200 m east of the entrance to
the Suwannee River sill (an earthen dam that borders the west

b
21
side of Okefenokee Swamp). This area (mean depth 0.52 m) is
similar to the rookery described by Stinner (1983). Vegeta
tion is dominated by the spatterdock (Nuphar). The area is
virtually devoid of guano input from nesting birds.
A plastic tube of 6.4 cm I.D. was used to collect a top
to bottom sample from each of the three mesocosms containing
a pot (experimentals) and from each of the three without pots
(controls). Between 1 and 6 L (the amount depending in
versely on relative concentration of plankton were filtered
through 64 ~m mesh for zooplankton, and preserved in buffered
formalin and sucrose. Another 30-200 mL were passed through
a glass fiber filter (1.2 ~ retention), frozen and later
analyzed fluorometrically for phytoplankton chlorophyll ~,
according to Holm-Hansen et ale (1965) and Turner Designs
(1983). A third sample was put on ice, then analyzed by
standard persulfate digestion and Technicon II Autoanalyzer.
To determine temperatures that biota and pots experienced,
bottom water temperature was measured by oxygen/temperature
probe. Sampling was repeated approximately every three weeks
from May 16 - August 29, then pots were replaced so there
would continue to be a relatively undepleted source of Nand
P. To see whether or not net community productivity was in
creased by Nand P, dusk-dawn-dusk oxygen profiles were
measured on three occasions (Hall & Moll 1975).
To estimate release rates of Nand P in the laboratory,
15 L of deionized water and one 0.2 M (NH4)2HP04 pot were put

b
22
into each of four replicate carboys. Every 24 h (± 0.3 h),
water was stirred and one, two, four, eight and 16 days after
initiation, the water in each was sampled by a top to bottom
core tube. Carboys were refilled to 15 L daily. Because
release rates are probably dependent on temperature, water
temperatures were monitored.
The experiment was repeated for two days using black
water from Okefenokee Swamp to determine if its chemical com
position influenced release rates. Such blackwater is high
in dissolved organic compounds such as fulvic acids (Beck &
Reuter 1974) and low in pH (4).
Results
Neither total N nor P water concentrations were sig
nificantly different in experimental mesocosms than in con
trols (Table 1). Water column chlorophyll ~ and diel 02
fluctuation also were not significantly different.
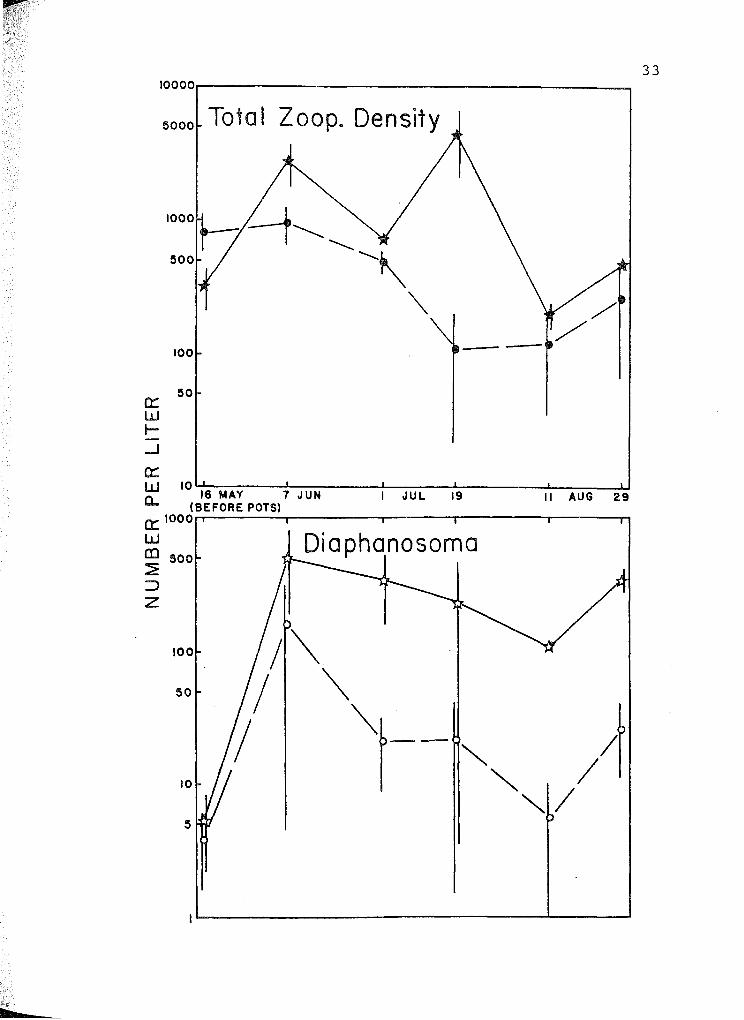
On the other hand, there were more zooplankton in ex
perimental mesocosms than in controls (Fig. 1, Mann-Whitney U
= 146, P < 0.025). This is largely due to an increased abun
dance of Diaphanosoma brachyurum (Cladocera: Sididae) in ex
perimentals ( U = 155, P < 0.005).
In the laboratory, release of NH4-N into deionized water
decreased through time, with an average release of 45 mg
NH4-N d- 1 (Fig. 2). Release of P04-P into deionized water

b
23
declined over the initial two days but then appeared to
increase, with an overall average of 11 mg d- 1 . Blackwater
caused greater release rates of NH4-N and P04-P from pots
than did deionized water, at least during the initial two
days of release. Average water temperature during release
into deionized water was 21.6oC (range 17.3-25.2o C, n = 44).
Average water temperature during blackwater release was
21.90 C (range 18.3-24.8o C, n = 8).
Discussion
Release was substantial for at least 16 d, thus the
modified clay pot is successful as a chemical source for
aquatic mesocosms. This conclusion is consistent with Fair
child et ale (1984) who found considerable release from 245
mL pots for at least 23 d. They illustrated release rates of
P04-P into distilled water (0.05 M K2HP04 pots; 150 ~ole d- 1
= 5 mg P04-P d- 1 ) which were similar to rates shown in the
present paper (l-L 0.2 M (NH4)2HP04 pots; 11 mg P04-P d- 1 ).
Likewise, their release rates of N from 0.5 M NaN03 pots
(average of 5000 ~mole N03-N d- 1 = 70 mg N03-N d- 1 ) were
similar to those that I observed from 0.2 M (NH4)2P04 pots
(releasing 45 mg NH4-N d- 1 ). (I have averaged release rates
of Fairchild et ale (1984), above. They found that release
rates in general declined through time as nutrients in pots

b
24
decreased, although P04-P release from 0.05 M K2HP04 pots ap
peared to increase somewhat for the initial several days).
Release rates from 0.2 M (NH4)2HP04 pots into deionized
water, though substantial, were less than Nand P added by
guano of wading birds to 2 m2 of rookery. As mentioned in
Methods, such birds added about 92 mg TP d- 1 and 304
mg TN d- 1 to such an area. However these rates of guano in
put are maximal since they were from the center of the most
heavily nested part of Okefenokee that was discovered, and
they do not consider later processes such as losses of chemi
cal from the area by diffusion and by slow water movements,
and possible non-availability of some of the Nand P due to
low solubilities. Furthermore, release from pots into
Okefenokee mesocosrns was probably greater than my deionized
release data would suggest, since pots in the field ex
perienced higher temperatures (Table 1 & Results) and much
more water (about 1000 L) for the dissolution of chemical
than did laboratory pots, and since release into blackwater
was shown to be higher than into deionized water. Thus the
rnesocosm system appeared to be simulating effects of addition
of Nand P at rates approaching those of a wading bird
rookery, but at some distance from the center of nesting.
Although (NH4)2HP04 pots released substantial amounts of
Nand P, these amounts did not result in increases in N in
the water column nor in significant increases in P within
mesocosms. This lack of effect on mesocosm water

b
25
concentrations may have been due to natural loss to system
components such as adsorption to sediments. This is sup
ported by the low equilibrium phosphate concentration (4 ~g
P04-P L- 1 ) in sediments at the site and time of the mesocosm
study (Chapter 3), and suggests that P added to mesocosms was
to some extent adsorbed by sediments. Other workers have
suggested such loss of nutrients to be important in
enclosures (Twinch & Breen 1978) and in natural wetlands
(e.g., Nichols 1983).
Pots resulted in higher densities of zooplankton and in
particular of Diaphanosoma brachyurum which eats phytoplank
ton and bacteria. However neither chlorophyll ~, a measure
of phytoplankton abundance, nor diel oxygen production, a
measure of net community production, were increased. Perhaps
zooplankton were increased via some phytoplankton stimulation
due to pots, then they kept the phytoplankton in check via
increased phytoplanktivory. (Lynch & Shapiro [1981] have
shown that enclosures containing large herbivorous zooplank
ton had lower phytoplankton biomass than those in which such
zooplankton were removed. Similarly, Timms & Moss [1984]
found that a shallow wetland's chlorophyll a concentration
was decreased if Cladocera were present). An alternative ex
planation for the experimental mesocosm's increased zooplank
ton without increased phytoplankton is that zooplankton may
have increased due to possible stimulation of bacteria by
pots.

bt
26
'i The use of pots in 2-m~ clear enclosures was an effec-
tive means of applying chemicals to an aquatic ecosystem.
Release was gradual and pots could be left in position for at
least two to three weeks before replacement. Pots were inex-
pensive i.e. less than US$lO.OO each, sturdy, made of readily
available materials, and capable of being built easily and
quickly (four were constructed via 0.5 man-hr effort). The
enclosure part of the mesocosm system also proved to be cost-
effective ($25.00), portable and sturdy. Inorganic nutrients
were added to aquatic mesocosms, and presumably other chemi-
cals such as selected algicides and pesticides cQuld be added
via the pot/enclosure system, to test their environmental im-
pacts in the field.
Comparative ecosystem ecology could be investigated
using the technique. Various vegetated aquatic areas and
shallow lakes could receive 2-m2 enclosures and pots of
standardized concentration to compare responses (to a
pollutant, for example) that vary with latitude or habitat
type.
Summary
A mesocosm system for examining the response of aquatic
ecosystems to gradual chemical input has been described.
Clear 2-m2 enclosures made of plastic film and steel fencing
were placed in an Okefenokee Swamp marsh. Half of these

>
27
enclosures contained 1-L porous clay pots filled with 0.2 M
(NH4)2HP04-enriched agar to simulate Nand P fertilization by
birds. Diel 02 fluctuation, chlorophyll ~ and total Nand P
concentrations in water were not significantly different in
experimental mesocosms than in controls (Table 1), but abun
dance of zooplankton (primarily Diaphanosoma brachyurum) was
increased (Fig. 1). In the laboratory, pots released an
average of 45 mg NH4-N d- 1 and 11 mg P04-P d- 1 into deionized
water and more than this into Okefenokee blackwater (Fig. 2).
b
28
References
Beck, K.C. & Reuter, J.H. (1974): Organic and inorganic
geochemistry of some coastal plain rivers in the United
states. - Geochim. Cosmochim. Acta 38: 341-364.
Fairchild, G.W., Richardson, W.B. & Lowe, R.L. (1983):
Abstract 87. - Abstr. N. Am. Benthol. Soc. Thirty-first
Ann. Meet., La Crosse, Wisc.
Fairchild, G.W., Lowe, R.L. & Richardson, W.R. (1984):
Nutrient-diffusing substrates as an in situ bioassay
using periphyton: Algal growth responses to combinations
of Nand P. - Ecology 66: 465-472.
Golovkin, A.N. & Garkavaya, G.P. (1975): Fertilization of
water of the Murmansk Coast by bird excreta near various
types of colonies. - Biol. Morya (Vladivost.) 5: 49-57.
Grice, G.D. & Reeve, M.R. (1982): Introduction and descrip
tion of experimental ecosystems. Pp. 1-9. - In: Grice,
G.D. & Reeve, M.R. (eds.), Marine mesocosms. - Springer
Verlag, New York, Heidelberg, and Berlin.
Hall, c.s. & Moll, R. (1975): Methods of assessing aquatic
primary productivity. Pp. 19-53 - In: Lieth, H. &
Whittaker, R.H. (eds.), Primary productivity of the
biosphere. - Springer-Verlag, New York.
Holm-Hansen, 0., Lorenzen, C.J., Holmes, R.W. & Strickland,
J.D.H.: (1965). Fluorometric determination of chloro
phyll. - J. Cons. perm. into Explor. Mer 30(1): 3-15.

b
Leentvaar, P. (1967): Observations in guanotrophic
environments. - Hydrobiologia 29: 441-489.
Manny, B.H., Wetzel, R.G., & Johnson, W.C. (1975): Annual
contribution of carbon, nitrogen-and phosphorus by
migrant Canada geese to a hardwater lake. - Verh.
Internat. Verein. Limnol. 19: 949-951.
29
McColl, J.G. & Burger, J. (1976): Chemical inputs by a colony
of Franklin's Gulls nesting in cattails. - Am. Midl.
Nat. 96(2): 270-282.
Nichols, D.S. (1983): Capacity of natural wetlands to remove
nutrients from wastewater. - J. Wat. Poll. Cont. Fed.
55 (5): 495-505.
Odum, E.P. (1983): Basic ecology. - Saunders College Publ.,
New York.
Odum, E.F. (1984): The mesocosm. - BioScience 34: 558-562.
Stinner, D.H. (1983): Colonial wading birds and nutrient cy
cling in the Okefenokee Swamp ecosystem. - Ph.D. Thesis,
University of Georgia, Athens.
Taylor, A.W. & Kunishi, H.M. (1971): Phosphate equilibria on
stream sediments and soil in a watershed draining an ag
ricultural region. - J. Agr. Food Chern. 19(5): 827-831.
Timms, R.M. & Moss, B. (1984): Prevention of growth of poten
tially dense phytoplankton populations by zooplankton
grazing, in the presence of zooplanktivorous fish, in a
shallow wetland ecosystem. - Limnol. Oceanog. 29(3):
472-486.

b
30
Turner Designs. (1983): Fluorometric Facts Bull. 101, Mtn.
View, Calif.
Twinch, A.J. & Breen, C.M. (1978): Enrichment studies using
isolation columns. II. The effects of phosphorus
enrichment. - Aquat. Botany 4: 161-168.

b
31
Table 1. Average water parameters in mesocosms with and without
(NH4)2HP04 pots. Depth shown in cm, temperature in °e, and oxygen
fluctuation in mg L-1. Nitrogen, phosphorus and chlorophyll con
centrations shown in ug L-1. Samples were taken between June 5
and August 29, 1983. Parentheses show (minimum-maximum range, n).
With Pots Without Pots
Depth 52.3 42.0- 61.0, 15) 52.0 45.0- 67.0, 15)
Bottom Temp. 25.8 23.1- 27.8, 26) 25.5 23.1- 28.0, 26)
Total N 1330.3 (993.9-2008.9, 14) 1342.0 (773.7-2083.8, 14)
Total P 20.2 0.0- 119.1, 14) 12.2 0.0- 39.6, 14)
ehl. ~ 25.9 4.3- 61.9, 13) 22.9 3.1- 64.7, 13)
Diel °2 Fluct. 1.8 1. 5- 2.5, 8 ) 1.3 -1.2- 3.5, 8 )

b
32
Fig. 1. Zooplankton in Okefenokee Swamp. Stars represent
densities in mesocosms with (NH4)2HP04 pots (see text),
circles in mesocosms without pots. Bars represent
+S.E. N = 3 for each datum except n = 2 on August 11.
Note log scales on ordinates.
....
10000.....---------------____ -..
5000 Total Zoop_ Density
0::: W t-......J
0:::
100
50
W 10 16 MAY 7 J UN a.. (BEFORE POTS) 0::: 1000
I JUL 19 " AUG 29
W m 500 :::E
Di a phanosoma
:::> z
100
50
10
" ) '" / I ""/
33

b
34
Fig. 2. NH4-N and P04-P released by pots through time.
Solid symbols represent values in Okefenokee black
water, open symbols in deionized water. Bars represent
±S.E., n = 4 for each datum. Log scales on ordinates.

35
200~--------------------------------------------~
100 ~\ N 70 '\ 50 ~"
" - P---r->- 30 -<t 0
a:: IJJ 20 a.. DAYS AFTER ADDING (NH4)2 HP04 POT t!)
~ 100 2 4 8 16
I.LJ fJ)
70 <[ I.LJ ...J I.LJ 50 0::
30 p ~\ 20
\ //~ ---r 10 \
7
\ ~/ 5 }// 3
2
b

b
CHAPTER 3
RESIDUAL INFLUENCE OF MACRONUTRIENT ENRICHMENT
ON THE AQUATIC FOOD WEB OF AN OKEFENOKEE SWAMP
ABANDONED BIRD ROOKERyl
IJ. Douglas Oliver and Steven A. Schoenberg. To be submitted
to Oikos.
36

b
37
Introduction
Okefenokee Swamp, a large (1800 km2 ) wetland in
southeastern Georgia and adjacent Florida, has blackwaters
that are not high in available nutrients (Auble 1982).
However, guano enriched at least one part of Okefenokee, a
now abandoned ibis (Eudocimus albus) rookery, for at least 11
years (Stinner 1983). Other workers have documented guano
effects on aquatic ecosystem nutrients and plankton, but not
residual effects after birds had left, nor effects on higher
trophic levels such as fish. McColl and Burger (1976) found
that Franklin's gulls (Larus pipixcan) nesting among cattails
(Typha) in shallow Minnesota pools caused large increases in
aquatic P and N in the immediate vicinity of the gulls.
Similarly, Manny et ale (1975) found that more than 6000
migrant Canada geese (Branta canadensis) were the chief cause
of hypereutrophic primary productivity in Wintergreen Lake,
Michigan. Leentvar (1967) showed that guano of gulls (Larus
ridibundus) increased phosphate concentration in a Dutch acid
oligotrophic fen and that unicellular flagellates
(Chlamydomonas) appeared in increasing numbers. Golovkin and
Garkavaya (1975) reported an increase in phosphate, organic
nitrogen and nitrate in marine waters adjacent to bird
colonies. This stimulated the development of planktonic
algae and this affected the next link in production, the
zooplankton (Calanus sp.) In some countries, people

38
deliberately raise domestic ducks in conjunction with pond
fish in order to cause increased production of the latter
(via guano or uneaten duck food, Huet 1971, Woynarovich 1979,
Chen 1983). Thus, natural populations of birds can increase .
natural populations of phytoplankton and zooplankton, and it
might not be surprising if they could increase fish.
On the other hand, no one has documented enhancement of
higher trophic levels (such as fish) by wild populations of
birds. Although Wheeler (1945) indicated that St. Brandon's
Islands had large guano inputs and a highly productive
fishery relative to other islands of the western Indian
Ocean, he did not know if guano fertilization was rapid
enough to overcome tidal dissipation to allow a causal link.
Onuf et ale (1977) stated that enrichment by egrets and
pelicans increased mangrove consumption by lepidopteran and
coleopteran insects, but they did not report any further ef-
fects on any higher trophic levels. The present paper sug-
gests that wild birds not only enhance primary producers and
zooplankton primary consumers, but also secondary consumers
such as fish. Evidence is also presented for indirect time~
delayed mediation of enrichment by birds, via slow macro-
nutrient movement from sediments.
Despite the importance of blackwater systems worldwide,
there have been few descriptions of effects of impinging
enrichment. Based on the conclusion of Fittkau et ale (1975)
that available nutrients are usually low, enrichment effects
b

b
39
should be substantial. For example, Rai and Hill (1980)
stated that in Amazonian lakes, dissolved nutrients (such as
P and N) were generally much less abundant in blackwaters
than in whitewaters and should be considered limiting factors
in the blackwaters. Schmidt (1976) indicated that additions
of P, N and trace elements resulted in only "relatively
unimportant" phytoplankton growth stimulation in an Amazonian
whitewater lake, but resulted in considerable stimula~ion of
Rio Negro blackwaters. However, Devol et al. (1984) showed
that P + N addition resulted in several-fold increases in
phytoplankton from an Amazonian lake, whether or not black
water humic and fulvic acids were also present. In spite of
the presence of organic compounds that attenuate light and
thus might affect production, blackwaters may be limited by
macronutrients, according to these few studies.
Although such short-term bioassays are available for
nutrient effects, there has been even less study of residual
responses after enrichment of blackwaters has ceased. In
clearwater systems such as Lake 304 in Ontario, Schindler
(1974) showed that after two years of enrichment and large
phytoplankton responses, cessation of P enrichment brought
phytoplankton back to pre-enrichment levels within one year.
In Lake Washington after diversion of sewage P and other
nutrients, winter phosphate and summer phytoplankton declined
to equilibrium levels in about three years (Edmondson and
Lehman 1981). In a blackwater system, a cypress wetland,

h
40
Dierberg and Brezonik (1983) found that addition of
secondarily-treated sewage caused increased nutrients in
water, and that 1.7 years after the cessation of sewage
pumping, total P in water still had not returned to natural
levels. They concluded that sediments and vegetation on the
swamp floor released P to overlying water long after the ad
dition of nutrients. In summary, residual nutrients and
their biotic effects can remain significant in clearwater
systems for about one to several years after enrichment, but
to our knowledge, only one previous paper has examined such
effects in blackwaters.
In the present study, we have taken advantage of a
natural change in nutrient conditions to examine the effects
of residual nutrients on a blackwater system. We hypothesiz
ed residual indirect positive effects of bird guano on
phytoplankton, zooplankton and fish biomass in the recently
abandoned wading bird rookery. Input by the birds was ex
pected to cause sediments to have more P available to the
overlying water, which might then result in higher standing
stocks of phytoplankton, and higher densities of fish than at
sites that lacked such a rookery. We examined another link
in this food chain, zooplankton, after we fertilized
enclosures at macronutrient levels representing residual en
richment after birds had left.

b
41
Site Descriptions
Our sites are all shallow (i1.2 m depth), vegetated
marshes within Okefenokee National Wildlife Refuge, Georgia.
They have blackwater containing humic and fulvic acids, with
a pH of 3.8 (e.g., Beck, Reuter and Perdue 1974). Floating
and submerged macrophytes (Nuphar luteum, Utricularia spp.,
Cabomba pulcherrima) dominate the rookery site at Mack's Is
land (R, Fig. 1). During each spring-summer period from at
least 1970-1981, 2000-30000 wading birds (predominantly
Eudocimus albus), nested in shrubs and trees adjacent to this
site. In 1979-1980, Stinner (1983) found significant in
creases in macronutrients in the water column and in aquatic
macrophytes. She estimated that the total amount of phos
phorus addition by the birds, 4.6 g m- 2 yr- 1 , was comparable
to crop field fertilization. In 1981, following a severe
drought in much of the southern United States, the birds did
not return, terminating the nutrient input at this site.
For comparison with the rookery, we chose a control site
(RC) 1.6 km away, because it has similar depth and floating
and submersed vegetation (e.g., Nuphar luteum, Utricularia
spp.) We also compared R with two Okefenokee marshes of
different vegetation. Little Cooter Prairie (LCP) is a shal
lower (iO.5 m) site in which floating and submerged macro
phytes (Nymphaea odorata, Utricularia spp.) accompanyemer
gents (Eriocaulon compressum, Rhynchospora inundata, Orontium

h
42
aquaticum, Greening and Gerritsen 1987). Mizell Prairie (MP)
is even shallower, and during the course of our study, it
frequently had no standing water. It is dominated by sedge
(Carex walteriana) with an understory of Sphagnum. These
three comparison sites have lacked bird rookeries for at
least 15 years.
Methods
We characterized sediment nutrient availability to the
overlying water column by determining the equilibrium phos
phate concentration (Taylor and Kunishi 1971). First, we
collected 2-3 samples of sediment from each site, then com
bined 2.5 g wet subsamples with 25 ml of 0.01 ~ CaC12 con
taining 0-320 ~g P04-P 1-1 . Mixtures were vortexed every
five minutes for 30 minutes and centrifuged (4500 x g). We
determined supernatant concentrations by the ascorbate method
(Anonymous 1973) and calculated equilibrium phosphate con
centration (that concentration at which phosphate was neither
adsorbed nor desorbed) at each of four sampling times between
January and August, 1983.
We measured levels of several components at six-weekly
intervals from late 1982 to late 1983. Phosphate concentra
tions from the bottom of the water column were averaged over
all sampling dates. To estimate phytoplankton biomass, we
sampled whole water by an integrating tube, passed it through

~ ..
h
Whatman GF/C filters, ground filters in 90% acetone, and
quantified chlorophyll ~ fluorometrically (Turner 1983).
43
Fish collected by 1-m2 drop traps (n = 5-12/site) were
preserved in buffered formalin (Freeman et ale 1984); biomass
is expressed as wet weight.
We conducted enclosure experiments at RC to determine if
levels of nutrients equivalent to those left by birds would
stimulate zooplankton prey available to fish. Clay pots
filled with (NH4)2HP04-enriched agar 1Fairchild et ale 1985,
Oliver 1985) continually enriched each of three 2-m2 corrals.
Three other corrals were unenriched controls. In order to
directly assess the enrichment effect on zooplankton, we
removed fish by electroshocking. Zooplankton were quantified
by filtering integrated water column samples through 64 ~
mesh and preserving in buffered formalin and sucrose.
Results
As hypothesized, levels of several components of the
food web were elevated at the abandoned rookery. Sediment
nutrient availability, phytoplankton, zooplankton and fish
were higher than at reference sites during at least the early
part of the second year following abandonment.
Sediment nutrient availability measurements helped
reveal long-term effects of former rookery activities on the
ecosystem. Across all sample dates,equilibrium phosphate

b
44
concentrations were significantly greater at R than at RC
(two-way nonparametric ANOVA, p <0.001, Zar 1984). RC can be
considered a valid reference site, because equilibrium phos
phate concentration at RC was not significantly different
than that at other Okefenokee sites, LCP and MP (Fig. 2).
These results indicate that about 1-2 years after birds aban
doned the rookery, nutrient availability at R was still
greater than at other sites. As may be expected from the
greater available phosphorus in sediments, R water had a
higher mean (and SE) value of 37.7 ~g/L P04-P (8.1), compared
to 18.2 (5.8) at RC, 7.9 (3.9) at LCP, and 7.5 (2.1) at MP,
for samples taken at various times between November 20, 1982
and October 9, 1983; however these means are not sig
nificantly different. It is possible that phytoplankton
rapidly assimilated much of the released phosphate which
thereby stimulated their growth.
In fact, greater nutrient availability at the rookery
site accompanied greater biomass of phytoplankton (Fig. 3).
The trend over all sampling dates is clear: Chlorophyll a was
greater at R than at RC. Seasonal patterns at the two sites
were similar, increasing together in summer, then decreasing
in late fall and winter. However, the factor by which the
chlorophyll a level at R exceeded that at RC declined after
March 1983; the mean R:RC ratio from July 1982 to March 1983
was 6.6, but after March was only 3.9. Thus, despite year to
year changes in absolute levels of phytoplankton, there was

b
45
some indication that greater levels in the abandoned rookery
were approaching those in the control.
As with phytoplankton primary producers, primary con
sumers showed greater abundance in enriched than in unen
riched marshland. Enrichment experiments had 4.4 times as
many zooplankton as controls (Fig. 4, Mann-Whitney U = 146, p
<0.025). These increases were largely a result of 6.5 times
as many Diaphanosoma brachyurum, a phytoplanktivorous
cladoceran, in experimentals (U = ISS, p <0.005). In
Okefenokee blackwater, zooplankton increased in response to
macronutrient enrichment.
Levels of planktivorous fish were elevated in the aban
doned rookery, then declined. We sampled fish from October
1982 through October 1983, i.e. 1.1-2.1 years after birds had
left R. Fig. 5 indicates that fish biomass was greater in R
than in RC or LCP from October 1982 until about February
1983. Specifically, biomass of Leptolucania ommata was sig
nificantly greater at R than at the other sites in October
1982 and in January and February of 1983 (Scheffe multiple
contrasts and nonparametric contrasts, p <0.05 at each date).
Gambusia affinis was greater at R than at other sites in Oc
tober 1982. Enneacanthus gloriosus was greater there in
February. Biomass of "other genera" was also significantly
greater, in October and January. Total biomass of all fish
was significantly greater at R, in October and January (p
<0.05 for all of the above). Thus, most ichthyofauna showed

h
some significant residual elevation at the rookery in the
early samples that followed abandonment.
46
Fish biomass did not exhibit significant differences
among sites at later dates (more than 1.5 years after birds
ceased fertilization). For example, the large mean biomass
of "other genera" at RC in October 1983 (Fig. 5) resulted
from one unusually large fish in one of the traps; fish
weight at RC was not significantly greater than at the other
two sites (nonparametric contrast, p >0.05). These data sug
gest that the effect of enrichment on higher order consumers
rapidly diminishes. This contrasts with the slower diminu
tion of algal primary producers.
Discussion
The suggestion that blackwater systems are severely
nutrient-limited is supported by the results of this study.
However, instead of describing changes due to an external
anthropomorphic influence, we have documented effects of
nutrients from avifauna, which differ in being part of the
system itself. Analysis of sediment nutrient availability
suggests that excess nutrients are deposited into sediments
and delay the recovery of the system from enrichment for at
least two years. More importantly, our observations indicate
a stimulation of higher trophic levels, including zooplankton
and fish. Therefore, it is reasonable to hypothesize that

b
47
the influx of macronutrients from birds could provide an
indirect, positive feedback mechanism which enhances their
production as well.
Nesting wading birds evidently did raise the equilibrium
phosphate concentration of sediments at the rookery site, by
means of guano. A (positive) interaction arrow in Fig. 6 in
dicates this nutrient effect of wading birds on Okefenokee's
microbially rich sediment complex (Murray and Hodson 1984),
with no direct effect on the birds. Water column P04-P was
not significantly greater at R than at other sites, but this
may have been due to the several-fold higher levels of
phytoplankton present. Higher phytoplankton and equilibrium
phosphate concentrations are consistent with enhanced macro
nutrient availability.
Some of the increased sediment phosphate availability at
R must have been taken up by phytoplankton, and probably con
tributed to the elevated biomass of phytoplankton there. The
most common nutrient limitation in freshwaters is phosphorus,
and phytoplankton can take up P04-P very rapidly (Wetzel
1975). In Okefenokee marshes, sediments have a high N:P
ratio of 64:1 and P is likely to be limiting (Flebbe 1982).
A linkage between sediments and phytoplankton, via residual
nutrient transfer, is illustrated (Fig. 6).
Many of the dominant zooplankton found in Okefenokee
marshes (e.g. Cladocera) are phytoplanktivorous. When we
fertilized corrals continuously at levels below those that

48
wading birds added to the Rookery during nesting (about 30%
and 19% of nesting P and N, respectively; Oliver 1985), rep
resenting residual enrichment sometime after the birds had
left, zooplankton biomass increased significantly. Abundance
of the phytoplanktivorous cladoceran Diaphanosoma brachyurum
was especially elevated. The residual enrichment from nest
ing birds appears to indirectly increase biomass levels of
consumers through stimulation of algal resources (Fig. 6,
phytoplankton --> zooplankton).
Because zooplankton and zooplanktivorous invertebrates
comprise a major portion of the diet of fish in Okefenokee
marshes (about 50% by weight, Chapter 4), it was reasonable
that enrichment from sediments would lead to greater abun
dance of fish than in non-rookery sites. During the early
samples, 1.1-1.5 years after birds left, biomass of various
fish taxa were significantly greater in R relative to
reference sites. Biomass declined to levels comparable to
other sites thereafter. The increased weight of fish at R
was mainly a result of greater levels of "other genera"
(mostly the zooplanktivorous species Centrarchus macropterus,
Fundulus chrysotus, and Etheostoma fusiforme.) Our data sup
port the hypothesis that residual nutrients enhance the fish
component (at the expense of zooplankton, Fig. 6).
Fish biomass at the rookery site declined relatively
soon, 1.5 years after abandonment by birds, while sediment
available P and phytoplankton were still elevated. Perhaps

49
very high levels of enrichment during the active rookery
(Stinner 1983) had contributed to earlier higher levels of
fish. One and a half years after birds abandoned the site,
macronutrient levels were still high enough to sustain
elevated sediment equilibrium phosphate concentration and
phytoplankton, but apparently not enough to sustain the fish
production/biomass ratio of active rookery years.
The direct connections between components that are
described above suggest some indirect influences in the
ecosystem. To show these influences, we multiply the posi
tive signs of consecutive direct interactions together, to
yield indirect interactions (Levins 1975). The product of a
positive interaction from wading birds to sediments, followed
by a positive interaction from sediments to phytoplankton
thus becomes a positive indirect effect (Fig. 6, dashed arrow
from wading birds to phytoplankton). This effect is in ac
cord with intuitive and known effects of P or N enrichment by
birds on phytoplankton (Manny et ale 1975, Leentvaar 1967,
McColl and Burger 1976). The remaining solid arrows of Fig.
6 are resolved into the remaining dashed arrows via similar
multiplications, resulting in the elucidation of residual in
direct positive effects of nesting wading birds on the
zooplankton and fish communities.
Indirect effects between ecosystem components, via in
termediate components, are increasingly recognized as poten
tially important within an ecosystem (Vandermeer 1980,
h
50
Dethier and Duggins 1984). Patten (1982) has emphasized the
importance of indirect effects (e.g., effects of enrichment
by birds on fish). His mathematical analyses (Higashi and
Patten 1986) have suggested that such indirect effects can
exceed direct effects (e.g., possibly the effects of zoo
plankton on fish). Although the present paper is not a test
of such theory, it does support the notion that indirect ef
fects such as the effect of birds on plankton and fish can be
significant in an ecosystem.
Would wading birds have benefitted from any stimulation
of fish densities that they had indirectly caused? . Was there
a significant positive feedback from fish to birds, to close
a cycle in the wetland ecosystem (Fig. 6)? White ibis eat a
substantial fraction of the weight of their diet as fish,
about 20% in southern Florida (Kushlan and Kushlan 1975), so
there could have been a significant trophic pathway from fish
to birds. Furthermore, most consumed fish are about 2 cm
long (Kushlan 1979) and this size is common in Okefenokee
marshes (Chapter 4). Wading birds did not appear to forage
in the neighborhood of the rookery itself (Stinner 1983);
foraging white ibis generally prefer shallower marshes (5-10
cm, Kushlan 1979). Ibis from R foraged up to 20 km away
(Stinner 1983). Many wetlands within this radius are linked
by water to the rookery site. It is possible that fish
populations increased by nutrients from nesting birds dis
persed into surrounding marshes where wading birds from the

h
51
rookery ate them. However, because of the low probability of
such distant encounters, a measurable positive feedback seems
unlikely. In other aquatic ecosystems, water birds do eat a
significant portion of the resident fish (e.g., Schaefer
1970). Thus, a positive feedback might be significant in
other systems if bird rookeries are adjacent to feeding
grounds.
In Okefenokee blackwater marshes, results suggest that
residual levels of macronutrients left by nesting wading
birds affected several trophic levels. Equilibrium phosphate
concentration of the sediment complex was elevated at the
abandoned rookery, and levels of phytoplankton were cor
respondingly elevated. These field results are corroborated
by results from laboratory experiments, which indicated that
sediments from the abandoned rookery released more P04-P to
overlying water than sediments from other Okefenokee marshes,
and overlying phytoplankton were then increased to greater
levels (Schoenberg and Oliver in press). Experimental en
richment of Okefenokee corrals corresponding to levels left
after birds had abandoned the site caused elevation of
zooplankton primary consumers. Lastly, biomass of various
fish taxa showed significant elevation in biomass at the
rookery site, from the beginning of the study until 1.5 years
after abandonment by birds. These results suggest that
residual levels of nutrients left by nesting wading birds af
fected Okefenokee blackwaters, and that diverse components of

b
52
the system (such as wading birds, the sediment complex,
plankton and fish) were linked through direct and indirect
macronutrient/biomass transfers.

b
53
References
Anonymous. 1973. Industrial methods nos. 155-71W, 154-71W,
158-71WjA. - Technicon Industrial Systems, Tarrytown,
NY.
Auble, G. T. 1982. Biogeochemistry of Okefenokee Swamp:
litterfall, litter decomposition, and surface water dis
solved cation concentrations. - Ph.D. Dissertation,
Univ. Georgia, Athens.
Beck, K. C., Reuter, J. H. and Perdue, E. M. 1974. Organic
and inorganic geochemistry of some coastal plain rivers
of the southeastern United states. - Geochim. Cosmochim.
Acta 38: 341-364.
Chen, H. H. 1983. Taiwan. - Pp. 415-426 In: Brown, E. E.
(ed.), World Fish Farming, 2nd ed., Avi Publ., Westport,
CN.
Dethier, M. N. and Duggins, D. O. 1984. An "indirect
commensalism" between marine herbivores and the impor
tance of competitive hierarchies. - Am. Nat. 124: 205-
219.
Devol, A. H., Dos Santos, A., Forsberg, B. R. and Zaret, T.
M. 1984. Nutrient addition experiments in Lago
Jacaretinga, Central Amazon, Brazil: 2. The effect of
humic and fulvic acids. - Hydrobiologia 109: 97-103.

h
54
Dierberg, F. E. and Brezonik, P. L. 1983. Tertiary treatment
of municipal wasterwater by cypress domes. - Water Res.
17: 1027-1040.
Edmondson, W. T. and Lehman, J. T. 1981. The effect of
changes in the nutrient income on the condition of Lake
Washington. - Limnol. Oceanogr. 26: 1-29.
Fairchild, G. W., Lowe, R. L. and Richardson, W. B. 1985. Al
gal periphyton growth on nutrient-diffusing substrates:
An in situ bioassay. - Ecology 66: 465-472.
Fittkau, E. J., Irmler, U., Junk, W. J., Reiss, F. and
Schmidt, G. W. 1975. Productivity, biomass, and popula
tion dynamics in Amazonian water bodies. - Pp. 289-311
In: Golley, F. B. (ed.), Ecological Studies Vol. 11,
Springer-Verlag, New York.
Flebbe, P. A. 1982. Biogeochemistry of carbon, nitrogen, and
phosphorus in the aquatic subsystem of selected
Okefenokee Swamp sites. - Ph.D. Dissertation, Univ.
Georgia, Athens.
Freeman, B. J., Greening, H. S. and Oliver, J. D. 1984. Com
parison of three methods for sampling fishes and macro
invertebrates in a vegetated freshwater wetland. - J.
Freshw. Ecol. 2: 603-609.
Golovkin, A. N. and Garkavaya, G. P. 1975. Fertilization of
water of the Murmansk Coast by bird excreta near various
types of colonies. - Biol. Morya (Vladivostok) 5: 49-57.

55
Greening, H. S. and Gerritsen, J.1987. Changes in macrophyte
community structure following drought in the Okefenokee
Swamp, Georgia, U.S.A. - Aquat. Bot. 28: 113-128.
Higashi, M. and Patten, B. C. 1986. Further aspects of the
analysis of indirect effects in ecosystems. - Ecol.
Modelling 31: 69-77.
Huet, M. 1971. Textbook of Fish Culture. - Fishing News
Books, Surrey, U.K.
Kerfoot, W. C. 1987. Cascading effects and indirect pathways.
- Pp. 57-70 In: Kerfoot, W. C. and Sih, A. (eds.),
Predation: Direct and Indirect Impacts on Aquatic
Communities, Univ. Press of New England, Hanover, NH.
Kushlan, J. A. 1979. Feeding ecology and prey selection in
the white ibis. - Condor 81: 376-389.
- and Kushlan, M. S. 1975. Food of the white ibis in southern
Florida. - Fla. Field Nat. 3: 31-38.
Leentvaar, P. 1967. Observations in guanotrophic
environments. - Hydrobiologia 29: 441-489.
Levins, R. 1975. Evolution in communities near equilibrium. -
In: Cody, M. L. and Diamond, J. M. (eds.), Ecology and
evolution of communities. Belknap Press, Cambridge,
Mass., pp. 16-50.
Manny, B. H., Wetzel, R. J. and Johnson, W. C. 1975. Annual
contribution of carbon, nitrogen and phosphorus by
migrant Canada geese to a hardwater lake. - Verh.
Internat. Verein. theoret. Limnol. 19: 949-951.

56
McColl, J. G. and Burger, J. 1976. Chemical inputs by a
colony of Franklin's Gulls nesting in cattails. - Am.
Midl. Nat. 96: 270-282.
Murray, R. E. and Hodson, R. E. 1984. Microbial biomass and
utilization of dissolved organic matter in the
Okefenokee Swamp ecosystem. - Appl. Envir. Microbiol.
47: 685-692.
Oliver, J. D. 1985. A system for examining the response of
aquatic ecosystems to gradual chemical inputs, and field
application in Okefenokee Swamp, Georgia. - Arch.
Hydrobiol. 102: 415-423.
Consumption, evacuation rates and diets of pygmy
killifish, Leptolucania ommata, and mosquitofish,
Gambusia affinis (Osteichthyes: Atheriniformes) in
Okefenokee Swamp. Chapter 4.
Onuf, C. P., Teal, J. M. and Valiela, I. 1977. Interactions
of nutrients, plant growth and herbivory in a mangrove
ecosystem. - Ecology 58: 514-526.
Patten, B. C. 1982. Environs: relativistic elementary par
ticles for ecology. - Am. Nat. 119: 179-219.
Rai, H. and Hill, G. 1980. Classification of central Amazon
lakes on the basis of their microbiological and physico
chemical characteristics. - Hydrobiologia 72: 85-99.
Schaefer, M. B. 1970. Men, birds and anchovies in the Peru
Current- dynamic interactions. - Trans. Am. Fish. Soc.
99: 461-467.

Schindler, D. W. 1974. Eutrophication and recovery in ex
perimental lakes: Implications for lake management.
57
Schmidt, G. W. 1976. Primary production of phytoplankton in
three types of Amazonian waters, VI. - Amazoniana 5.
Schoenberg, S. A. and Oliver, J. D. In press. Temporal
dynamics and spatial variation of algae in relation to
hydrology and sediment characteristics in the Okefenokee
Swamp, Georgia. - Hydrobiologia.
Stinner, D. H. 1983. Colonial wading birds and nutrient cy
cling in the Okefenokee Swamp. - Ph.D. Dissertation,
University of Georgia, Athens.
Taylor, A. W. and Kunishi, H. M. 1971. Phosphate equilibria
on stream sediments and soil in a watershed draining an
agricultural region. - J. Agr. Food Chern. 19: 827-831.
Turner, G. K. 1983. Chlorophyll and pheophytin. -
Fluorometric Facts Bull. 101, Turner Designs, Mountain
View, CA.
Vandermeer, J. 1980. Indirect mutualism: variations on a
theme by Stephen Levine. - Am. Nat. 116: 441-448.
Wetzel, R. G. 1975. Limnology. - W. B. Saunders,
Philadelphia.
Wheeler, J. F. G. 1945. Plant nutrients in the sea. - Nature
155: 731-732.
Woynarovich, E. 1979. The feasibility of combining animal
husbandry with fish production, with special reference
to duck and pig production. - Pp. 203-208 In: Pillay,

h
T. V. R. and Dill, W. A. (Eds.), Advances in
Aquaculture, FAO, Fishing News Books, Surrey, U.K.
58
Zar, J. H. 1984. Biostatistical analysis. 2nd ed. - Prentice
Hall, Englewood Cliffs, N. J.

h
59
Fig. 1. Map of marsh sites mentioned in the text. Solid
lines on the enlarged map delineate 'the Okefenokee
Swamp watershed, its enclosed islands and watercourses.

60
Okefenokee Swamp
GA
• ~~ LCP ~ 0
~
Florida {J
------~-~
o B 16 I I
Km
61
Fig. 2. Equilibrium phosphate concentrations at R, RC, LCP,
and MP sites. N = 3 for each datum except n = 2 for
LCP and MP. Vertical bars denote +S.E.

o orc:t
o rt')
0:::
o C\I
62
0... ~ C\.I
I
=*=a~ 0
~ ". g "'0, :
\'\ :; ---&-lIII'" I
/1" ~ I. :; / I
I . ~ ---I ~ ;-- CD
./ g: II ~
1 /7 I'
I ! / /
II • U 0... 0::: U
...J
o - o
(d-pOd 8dd) SJ..N3V'JI03S .:10 Jd3
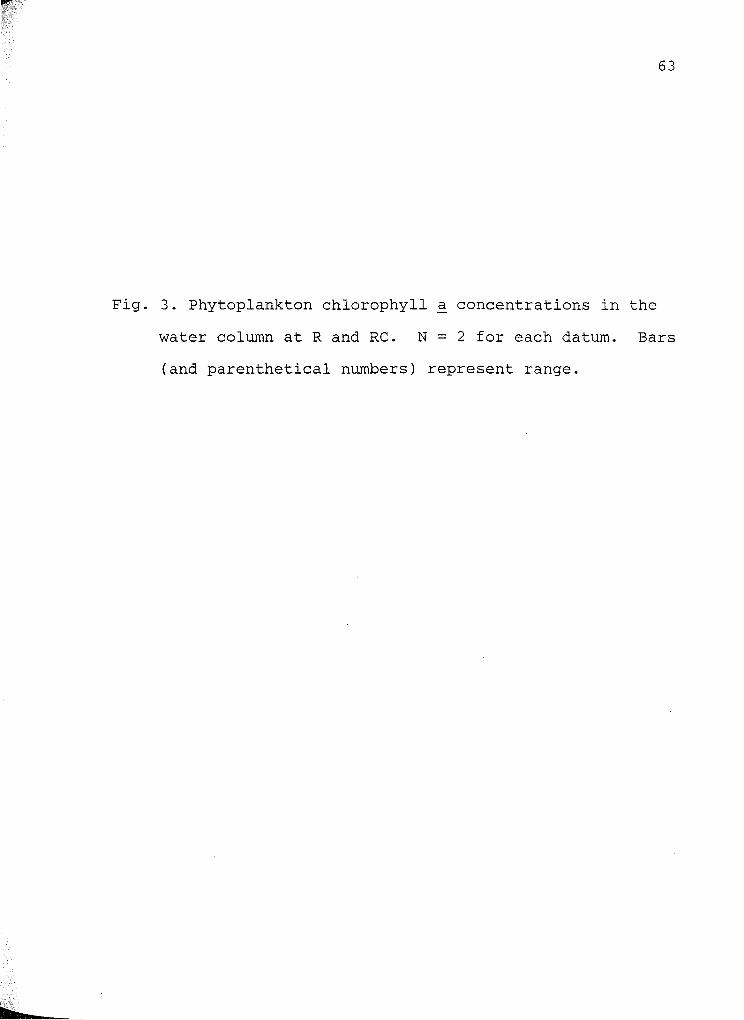
h
63
Fig. 3. Phytoplankton chlorophyll a concentrations in the
water column at Rand Re. N = 2 for each datum. Bars
(and parenthetical numbers) represent range.

140
120 , 0'» :::l.
100 ... 01
.....J 80 .....J >-:c c.. 60 0 0:: 0 .....J 40 :c U
20
64
454 395
PHYTOPLANKTON (177) <fl
~I
rn oRe
AUG OCT DEC FEB 1982
(gil
1
APR JUN AUG OCT 1983

65
Fig. 4. Zooplankton densities in corrals receiving artific
ial enrichment of Nand P (stars) versus no enrichment
(circles), 1983. N = 3 for each datum except n = 2 on
August 11. Bars represent ±S.E. Note log scales on
ordinates. Modified from Oliver (1985).

.,.,
10000,..----------__________ ---.
!SOOO
1000
500
100
50 0:::: W t-.....J
0::::
Total Zoop_
W a..
10U-------~------~ __ ~~ _____ ~ ____ _W
16 MAY 7 JUN I JUL 19 II AUG 29 (BEFORE POTS)
0:: 1000
W CD 500 ~ :::> z
100
50
10
5
Diaphanosoma
'" ) '" / I
""'/
66

b
67
Fig. 5. Fish biomass (wet g m- 2 ) in R contrasted with two
other Okefenokee sites (RC and LCP). Each value is an
average over n = 8, except that n = 6 in October 1982
at LCP, n = 7 in November at Rand RC, n = 12 in
January 1983 at RC, n = 7 in February at LCP, n = 5 in
June at R, n = 7 in August-September at R, and n = 7 in
October 1983 at Re. A plus sign indicates that biomass
at R is significantly greater, a negative significantly
less than at other sites (P < 0.05). See text.

(f) (f) -<{
2: o CO
I (f)
LL
6~--------------------------~
4
2 +
+ Lep-to 1 ucani a
+
III R 12] RC D LCP
O+A~~~~~~~~--~~~~~
3 + 2
1
Gambusia
O+A~~~~~--~~~~~~~~
6
4 + Enneacanthus
O+-~~~~~~~~AU~~~~W
3
30
20 + 10
Elassoma
Other Genera
O+&~~~~~~~~~~~---U~
40 30 + 20 10 O+-~~~~~~~~~~~~~~
820C NO JA 83 FE MA AP JU JL AU-SE OC
68
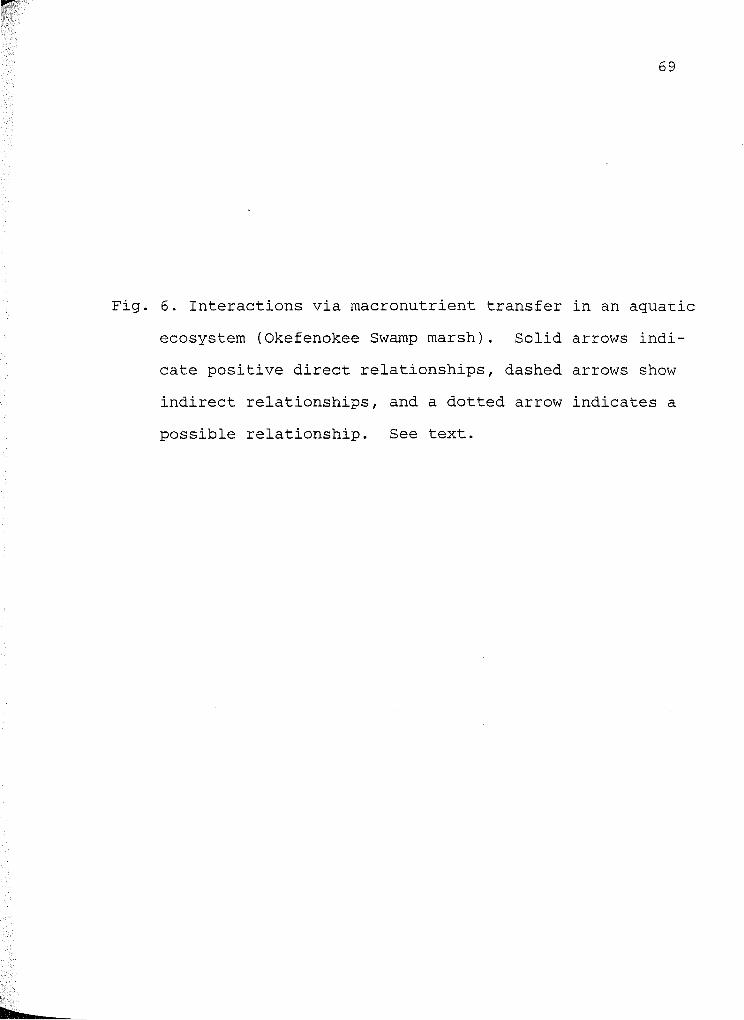
69
Fig. 6. Interactions via macronutrient transfer in an aquatic
ecosystem (Okefenokee Swamp marsh). Solid arrows indi
cate positive direct relationships, dashed arrows show
indirect relationships, and a dotted arrow indicates a
possible relationship. See text.

Positive feedback? .....................
, " " , .. - ~
:".. . .... . , . . , . : : . .
~------~----~ , WADING
, , . . ~ ~ ~ - - 1"'---",,",-': ----,
SEDIMENT COMPLEX
~ "'--" "-
'" '" PHYTOPLANKTON
70
b
CHAPTER 4
CONSUMPTION, EVACUATION RATES AND DIETS OF PYGMY KILLIFISH,
LEPTOLUCANIA OMMATA, AND MOSQUITOFISH, GAMBUSIA AFFINIS
(OSTEICHTHYES: ATHERINIFORMES) IN OKEFENOKEE SWAMpl
lJ. Douglas Oliver. Submitted to Brimleyana, 9/3/87.
71

b
72
Introduction
Researchers know relatively little about fishes of
freshwater wetlands and their feeding (Weller 1981). They
have examined diets of fishes from wetlands, but most often
from salt and estuarine marshes (e.g., Wetzel 1969, Har
rington and Harrington 1961, Kjelson et al. 1975). To my
knowledge, there are no previous studies on consumption or
evacuation rates of any fish in any salt or freshwater
wetland.
The purposes of this study are to determine the diets
and rates of consumption and evacuation under field con
ditions, for two of the most abundant fishes of a marsh on
the west side of Okefenokee Swamp, Georgia, a large fresh
water wetland. Consumption and evacuation rates will be
used for a model of this marsh, and represent the first
feeding dynamics for the fish species, Leptolucania ommata
and Gambusia affinis. To quantify dynamics at the ecosystem
level and to estimate minimum invertebrate prey production,
I then use measures of daily food consumption to estimate
area-based consumption (consumption per m2 ) by these fish.
Such invertebrate production estimates may help to resolve
whether blackwater habitats have low secondary productivity,
as suggested for tropical blackwaters (Janzen 1974, Fittkau
et al. 1975, Araujo-Lima et al. 1986), or substantial
productivity (Freeman and Freeman 1985). Methods are field-

b
73
based to obviate elaborate laboratory feeding studies and to
obtain data under natural conditions.
The two fishes examined are L. ommata, the pygmy
killifish, and ~ affinis, the mosquitofish, small members
of the Atheriniformes. L. ommata lives in quiet, densely
vegetated freshwaters from southern Georgia and Alabama to
Florida (McClane 1955, Laerm et ale 1980). G. affinis is
native to southern coastal United States but has been intro
duced to warm waters around much of the world, primarily to
consume juvenile mosquitos (Hess and Tarzwell 1942, Hurlbert
and Mulla 1981). In marshes on the west side of Okefenokee
Swamp, ~ ommata, G. affinis, Enneacanthus gloriosus and
Elassoma okefenokee are by far the most numerous fishes (R
and RC sites, Chapter 3). The individuals in this study are
adults of common length distribution (~. ommata of 13-20 mm,
G. affinis of 15-25 mm standard length).
The study site is a shallow subtropical marsh which has
large daily temperature fluctuations. It lies approximately
200 m east of the entrance to the Suwannee River sill (an
earthen dam that borders the west side of Okefenokee Swamp).
This blackwater area (mean depth 43 to 113 cm) had floating
and submersed macrophytic vegetation (mainly Nuphar luteum
and Utricularia spp.) Daily water temperature ranges were
4-20 oC during the winter experiments, and 26-37o C during
summer experiments.

...
74
Methods
I obtained evacuation rates by two related methods,
simultaneously. This allowed comparison of results obtained
by both (cf. single method analysis, e.g., Sainsbury 1986).
In the first ("tank") method, the decline in gut contents of
fish held without food was converted to evacuation rate
(Staples 1975, Garcia and Adelman 1985). Clear immersed
tanks at the edge of the marsh tracked ambient water tem
peratures and light levels. Okefenokee water was filtered
into them through a mesh «64 ~) to remove potential food
items. At 4-h intervals, large fish captured by seine were
placed into different tanks than smaller fish so they would
neither frighten nor consume the latter. I preserved about
half the fish quickly in buffered formalin and preserved the
rest approximately 4 h later, for comparison of gut
contents. In the "field" method, the decline in gut con
tents between field samples of adjacent periods during non
feeding times of day yielded a second measure of evacuation
rates. (See FEEDING DYNAMICS for an example of evacuation
analyses) .
In the laboratory, lengths of foods in foreguts were
converted to weights. (Foreguts were analyzed because their
contents declined consistently with time in tanks, whereas
hindguts continued to receive food from foreguts in some
cases). I examined foregut contents under a dissecting

",
75
microscope and measured lengths of food items. Length
weight regressions in Dumont et ala (1975) yielded dry
weights of Ostracoda, Harpacticoida, nauplii and most
Cladocera. Hall et ale (1970) gave macrothricid weights.
Insect head capsule widths were converted to weights (Smock
1980). Ruttner-Kolisko (1977) and J. Gerritsen and H.S.
Greening (pers. comm.) gave rotifer length-weight
conversions. A regression by Gerritsen for Okefenokee Swamp
(pers. comm.) derived cyclopoid weights. Maximum carapace
widths of araneids were converted to weights (Barber 1983,
Edgar 1971). Weights of Acari were estimated from the
regression of Oribatei by Persson and Lohm (1977). An un
published length-weight regression yielded weights of
Gambusia affinis in foreguts. Foregut content (S) was ex
pressed in relative units, i.e., mg dry food(g dry fish)-l,
assuming 20% dry to wet weight conversion for fish (e.g.,
Lagler et ale 1977).
I calculated evacuation rates, daily food consumption
and area-based consumption for both fishes. Area-based con
sumption equals the dry weight equivalent of fish biomass
(Chapter 3) times calculated daily food consumption (Staples
1975, adjusted in Elliott and Persson 1978; Persson 1982,
Garcia and Adelman 1985).

76
Analyses and Results
DIETS
Chironomids and Cladocera dominated the diet of
Leptolucania ommata. Major foods were non-tanypode
Chironomidae, tanypode Chironomidae, unidentified Insecta
and Cladocera (Table 1). Oribatid mites, not usually found
in fish guts (B.J. Freeman of the University of Georgia,
pers. comm.), were eaten by both ~ ommata and G. affinis.
In Gambusia affinis, insects strongly predominated in
the diet, but other arthropods and some fish were eaten. In
summer, Tanypodinae and odonate larvae were significant
foods (Table 1). Cladocera, Cyclopoida and Araneae composed
more of the diet in summer than in winter. In both winter
and summer, non-tanypode Chironomidae and unidentified In
secta were dominant food items. G. affinis showed some can
nibalism (in summer, about 3%).
FEEDING DYNAMICS
Gambusia affinis
The balance between consumption and evacuation may be
inferred from diel changes in foregut content (solid lines
on Fig. 1). When the slope of the line is positive, con
sumption rate is greater than evacuation rate during the
specified time period; when negative, consumption is less
than evacuation.

77
Analysis of evacuation rates is based on comparisons of
gut content trends obtained by field vs tank methods.
During certain periods, (such as 10:55 AM until 2:55 PM,)
fish in the field actively fed, resulting in an increase in
their foregut contents (Fig. 1). For such periods, it is
necessary to use fish held in food-free tanks (dashed lines)
for calculating evacuation rates. At other times (6:50 PM
until 10:50 PM), foregut contents declined in field fish and
in tank-held fish. For these periods, field fish were un
confined and egesting in their natural environment and
provide the better estimate of evacuation rate. Evacuation
rate,
r = In(So+1)-ln(St+1 ) ,
t
in which So is relative foregut content before and St is
relative foregut content after time t (adapted from Elliott
and Persson 1978; 1 added to allow logarithmic transforma
tion of zeros). The same equation applies for determining
evacuation in tank-held fish. When evacuation data were
missing for a period, evacuation rate was presumed to be an
average of rates before and after that period. Finally, the
various rates during the day were weighted by time to
produce an average evacuation rate (Table 2).

78
Evacuation rates for each of the time periods were used
in calculating consumption over each of these periods. Each
such evacuation rate was combined with average foregut con-
tent before and after the period to yield consumption during
the period (adapted from Elliott and Persson 1978):
Daily food consumption, LCt , is the sum of consumption rates
over each period. For G. affinis in summer, the graph of
consumption vs time (bottom panel of Fig. 1) indicates that
peak consumption occurred in the afternoon.
G. affinis from winter samples showed feeding trends
similar to summer but at lower levels. Evacuation rate and
daily food consumption were lower in February than in August
(Table 2). There was a single feeding peak in late after-
noon, as in summer. Low daily food consumption combined
with low fish biomass to produce very low area-based
consumption.
Leptolucania ommata
L. ommata showed diel feeding patterns similar to ~
affinis. Foregut content in summer peaked in late afternoon
(Fig. 2). Consumption showed one daily peak, in the
afternoon. In winter (March 1984), L. ommata also consumed
.....

b
79
maximally in the afternoon, as other species-season combina
tions had done.
L. ommata had seasonal feeding dynamics similar to ~
affinis. Evacuation rate in summer was 0.279 h- 1 , similar
to the 0.262 h- 1 calculated for G. affinis in summer (Table
2). Evacuation rate in winter was also similar in the two
species, 0.143 and 0.157 h- 1 , respectively. In both
species, daily food consumption increased from winter to
summer by a factor of about 4 (3.85 for ~ ommata, 4.62 for
G. affinis).
An inconsistency in a third set of ~ ommata data ap
peared resolvable. In winter 1985 (February), estimated
evacuation rate was 0.345 h- 1 and daily food consumption was
214.1 mg g-l d- 1 , values that were higher than in summer.
Closer analysis revealed that if one unusually large insect
had not been present in each of two foreguts (out of 3 fore
guts examined), rates would have been much lower, 0.074 h- 1
and 39.0 mg g-l d- 1 . Thus L. ommata rates from February
1985 are considered anomalous and those from March 1984 are
taken as more appropriate winter values.

b
80
Discussion
Diets, evacuation and consumption by the two fishes in
wetlands were similar to values reported for fishes in other
types of habitats. The diet of Leptolucania ommata in the
Okefenokee marsh was mainly chironomid ,larvae and other in
sects as well as Cladocera. Similarly, in the nearby St.
Johns River system, ~ ommata ate mainly chironomids,
Cladocera and Copepoda (McLane 1955).
Gambusia in Okefenokee consumed mainly insects and
Cladocera. They ate chironomids, odonates, other insects
and various Cladocera (Table 1). G. affinis at Gulf Breeze,
Florida, ate mostly insects, copepods, algae and plant
detritus (Wetzel 1971). (Probably the two latter food
categories were different than at Okefenokee because the
Gulf Breeze fish were from a different type of environment,
a salt-marsh canal). G. affinis in shallow areas of Wheeler
Reservoir, Alabama, ate mostly Entomostraca (presumably
Cladocera or Copepoda), Chironomidae, and juvenile insects
(Anopheles) (Hess and Tarzwell 1942). Thus, Gambusia in
Okefenokee fed primarily on the same kinds of foods that
they ate in other nearby regions.
However the Okefenokee site was unusual in being a
freshwater marsh, and it had some unusual fish foods. The
two fishes in this algal, detrital system ate oribatid
mites, which are often associated with such substrates

(Pennak 1978). Nevertheless, Oribatei were a minor com
ponent of their diets (Table 1).
81
The two fishes fed on similar kinds of foods. This may
not be surprising since I captured them in the same areas
and observed them feeding at about the same depth, near the
surface. These fishes may minimize competition between
their similar trophic niches by some temporal partitioning
of food resources. ~ affinis appears to do some feeding at
night (Fig. 1; Maglio and Rosen 1969) whereas ~ ommata ap
pears to confine feeding to daylight (Fig. 2). That
G. affinis may feed at night is consistent with their pos
session of open cephalic canals containing "neuromasts al
most if not, in contact with the surface film. Disturbances
on the surface caused by trapped insects would probably be
sensed ... rapidly" (Rosen and Mendelson 1960). G. affinis
may minimize competition for food by maintaining activity at
night (Wetzel 1971) and feeding even when light levels are
low.
Both fishes showed peak consumption rates at about the
same time of day, the afternoon. Afternoon usually had
bright sunlight and the highest temperatures of the day, and
these factors may have contributed to increased consumption.
Increased temperatures usually result in increased consump
tion by fish that are heat-tolerant (Reddy 1975, Mann 1978,
Smagula and Adelman 1982, Garcia and Adelman 1985) and high
illumination may make feeding more effective, particularly

bn
in a vegetated, blackwater environment like an Okefenokee
macrophytic marsh.
82
Evacuation rates of the two fishes were alike, and
similar to rates reported for other fishes. Foregut evacua
tion rates were 0.143 and 0.279 h- 1 for L. ommata in winter
and summer, respectively. Similarly, rates for §-=.. affinis
were 0.157 and 0.262. Doble and Eggers (1978) reported
rates of 0.109 and 0.267 h- 1 for Oncorhynchus nerka small
juveniles in winter and summer. Persson (1982) found rates
of 0.129 and 0.499 h-1 for Rutilus rutilus held at 12 and
24 0 C in the laboratory. Thus, evacuation rates for L.
ommata and ~ affinis appear to be well within the range of
values reported for various fishes.
Consumption measures of Gambusia and Leptolucania in
Okefenokee Swamp are in the same range as estimates for
other fishes. Daily food consumption by ~ ommata was 24.2
and 93.1 mg g-l d- 1 (dry weights), in winter and summer,
respectively. Values for G. affinis were 32.1 and 148.3
mg g-l d- 1 . Doble and Eggers (1978) found that Oncorhynchus
nerka juveniles ate 15.3 and 44.1 mg g-l d- 1 in Lake
Washington in winter and summer, respectively. Garcia and
Adelman (1985) reported that Cyprinus carpio in the Missis
sippi River consumed 204 mg g-l d- 1 in summer (assuming a
fish dry to wet ratio of 20%). Thorpe (1977) reported sum
mer consumption by Perca fluviatilis in Loch Leven to be 54
mg g-l d- 1 (dry weights, assuming fish dry to wet ratio of

b
20% and prey wet to dry ratio of 6; Freeman and Freeman
1985) but this was an underestimate (Elliott and Persson
1978). Basimi and Grove (1985) reported that summer con-
sumption by small Pleuronec-tes platessa off the coast of
Wales was 43 mg g-l d- 1 (assuming the same ratios). Food
consumption rates of ~ ommata and G. affinis from the
83
Okefenokee wetland obviously fall within the range of fish
from other types of environments.
As expected, area-based consumption by the two fishes
was low in winter and higher in summer. Leptolucania ommata
in the Okefenokee marsh consumed 0.71 and 22.99 mg m- 2 d- 1
in winter and summer, respectively. Gambusia affinis ate
less because of their lower biomass; they consumed 0.33 and
3 3 2 mg m- 2 d-1 ' . t d t . 1 . In Wln er an summer, respec lve y. In
comparison, in a small New Zealand lake with only one fish
species, Staples (1975) reported that Philypnodon breviceps
in summer consumed 203 mg m- 2 d- 1 (assuming a wet to dry
ratio of 6), but this value was an underestimate (Elliott
and Persson 1978). In a New Zealand stream where trout and
eels were also present (Hopkins 1970, in Staples 1975), the
maximum reported area-based consumption by P. breviceps was
equivalent to 74 mg m- 2 d- 1 .
Consumption data support a hypothesis that invertebrate
prey production in Okefenokee blackwater marshes is
substantial. Consumption values in spring and fall are
usually between winter and summer values (e.g., Staples

....,
84
1975, Doble and Eggers 1978). Thus, averaging winter and
summer consumption values may give a reasonable estimate of
average daily food consumption for the whole year. Such
averaging of consumption values (from Table 2) yields es
timates of 58.7 and 90.2 mg g-l d- 1 for L. ommata and
~ affinis, respectively. When each of these values is mul
tiplied by average dry biomass per m2 (Chapter 3) for each
of these fishes, consumption by both ~ ommata and G.
affinis is calculated to be 7.37 mg m- 2 d- 1 . Assuming a wet
to dry conversion of 6, invertebrate prey production would
have to be at least 160 kg ha- 1 yr- 1 (wet weight), just to
meet consumption needs of these fish. At a recently aban
doned bird rookery on the west side of Okefenokee, guano
fertilization apparently increased standing stocks of
several trophic levels, including fish (Chapter 3): Average
annual biomass estimates of L. ommata and G. affinis were
elevated. Invertebrate production may have been substan
tial, at least 730 kg ha- 1 yr- 1 , just to meet consumption by
these fish. This estimate of invertebrate prey production
is on the same order as the 680 kg ha- 1 yr- 1 estimated for a
marsh on the east side of Okefenokee Swamp (Freeman and
Freeman 1985) .

Literature Cited
Araujo-Lima, C. A. R. M., L. P. S. Portugal, and E. G.
Ferreira. 1986. Fish-macrophyte relationship in the
Anavilhanas Archipelago, a black water system in the
Central Amazon. J. Fish Biol. 29:1-11.
85
Barber, M. Craig. 1983. Nutrient dynamics of orb weaving
spiders (Araneae: Araneidae) in Okefenokee shrub
swamps. Ph.D. Dissertation, Univ. Georgia, Athens. 192
pp.
Basimi, R. A., and D. J. Grove. 1985. Estimates of daily
food intake by an inshore population of Pleuronectes
plates sa L. off eastern Anglesey, North Wales. J. Fish
Biol. 27:505-520.
Doble, B. D., and D. M. Eggers. 1978. Diel feeding
chronology, rate of gastric evacuation, daily ration,
and prey selectivity in Lake Washington juvenile
sockeye salmon (Oncorhynchus nerka). Trans. Am. Fish.
Soc. 107:36-45.
Dumont, Henri J., I. Van de Velde, and S. Dumont. 1975. The
dry weight estimate of biomass in a selection of
Cladocera, Copepoda and Rotifera from the plankton,
periphyton and benthos of continental waters. Oecologia
(Berl.) 19:75-97.

86
Edgar, W. D. 1971. Aspects of the ecological energetics of
the wolf spider Pardosa (Lycosa) lugubris (Walckenaer).
Oecologia (Berl.) 7:136-154.
Elliott, J. M., and L. Persson. 1978. The estimation of
daily rates of food consumption for fish. J. animo
Ecol. 47:977-991.
Fittkau, E. J., U. Irmler, W. J. Junk, F. Reiss, and G. W.
Schmidt. 1975. Productivity, biomass, and population
dynamics in Amazonian water bodies. Pp. 289-311 In F.
B. Golley and E. Medina, (eds.), Tropical Ecological
Systems, Ecol. Stud. 11, pp. 289-311. Springer, New
York. 398 pp.
Freeman, B. J., and M. C. Freeman. 1985. Production of
fishes in a subtropical blackwater ecosystem: The
Okefenokee Swamp. Limnol. Oceanogr. lQ:686-692.
Garcia, L. M., and I. R. Adelman. 1985. An in situ estimate
of daily food consumption and alimentary canal evacua
tion rates of common carp, Cyprinus carpio L. J. Fish
Biol. 27:487-493.
Hall, Donald J., W. E. Cooper, and E. E. Werner. 1970.
Dynamics and structure of freshwater animal
communities. Limnol. Oceanogr. 15:839-928.
Harrington, R. W., Jr., and E. S. Harrington. 1961. Food
selection among fishes invading a high subtropical salt
marsh: From onset of flooding through the progress of a
mosquito brood. Ecology 42:646-666.

b
87
Hess, A. D., and C. M. Tarzwell. 1942. The feeding habits of
Gambusia affinis affinis, with special reference to the
malaria mosquito, Anopheles quadrimaculatus. Am. J.
Hyg. 35:142-151.
Hurlbert, S. H., and M. S. Mulla. 1981. Impacts of
mosquitofish (Gambusia affinis) predation on plankton
communities. Hydrobiologia ~:125-151.
Janzen, Daniel H. 1974. Tropical blackwater rivers, anilnals,
and mast fruiting by Dipterocarpaceae. Biotropica £:69-
103.
Kjelson, M. A., D. S. Peters, G. W. Thayer, and G. N.
Johnson. 1975. The general feeding ecology of postlar
val fishes in the Newport River estuary. Fish. Bull.
73:137-144.
Laerm, Joshua, B. J. Freeman, L. J. Vitt, and L. Logan.
1980. Vertebrates of the Okefenokee Swamp. Brimleyana
4:47-73.
Lagler, Karl F., J. E. Bardach, R. R. Miller, and D. R. M.
Passino. 1977. Ichthyology, 2nd ed. Wiley, New York.
506 pp.
Maglio, V. J., and D. E. Rosen. 1969. Changing preference
for substrate color by reproductively active
mosquitofish, Gambusia affinis (Baird and Girard)
(Poeciliidae, Atheriniformes). Am. Mus. Novitates
2397:1-37.

h
88
Mann, Kenneth H. 1978. Estimating the food consumption of
fish in nature. Pp. 250-273 In S. D. Gerking (ed.),
Ecology of Freshwater Fish Production. Wiley, New York.
520 pp.
McLane, William M. 1955. The fishes of the St. Johns River
system. Ph.D. Dissertation, Univ. Florida, Gainesville.
367 pp.
Oliver, J. Douglas., and S. A. Schoenberg. Residual influence
of macronutrient enrichment on the aquatic food web of
an Okefenokee Swamp abandoned bird rookery. Chapter 3.
Pennak, Robert W. 1978. Fresh-water Invertebrates of the
United States, 2nd ed. Wiley-Interscience, New York.
803 pp.
Persson, Lennart. 1982. Rate of food evacuation in roach
(Rutilus rutilus) in relation to temperature, and the
application of evacuation rate estimates for studies on
the rate of food consumption. Freshw. Biol. 12:203-210.
Persson, T., and U. Lohm. 1977. Energetical Significance of
the Annelids and Arthropods in a Swedish Grassland
Soil. Swedish Natural Science Research Council,
Stockholm. 211 pp.
Reddy, S. R. 1975. Effect of water temperature on the
predatory efficiency of Gambusia affinis. Experientia
31:801-802.

89
Ruttner-Kolisko, A. 1977. Suggestions for biomass calcula
tions of plankton rotifers. Arch. Hydrobiol. Beih.
Ergen. Limnol. ~:71-76.
Sainsbury, K. J. 1986. Estimation of food consumption from
field observations of fish feeding cycles. J. Fish
BioI. 29:23-36.
Smagula, C. M., and I. R. Adelman. 1982. Day-to-day varia
tion in food consumption by largemouth bass. Trans. Am.
Fish. Soc. 111:543-548.
Smock, Leonard A. 1980. Relationships between body size and
biomass of aquatic insects. Freshw. Ecol. 10:375-383.
Staples, D. J. 1975. Production biology of the upland bully
Philypnodon breviceps Stokell in a small New Zealand
lake III. Production, food consumption and efficiency
of food utilization. J. Fish BioI. 7:47-69.
Weller, Milton W. 1981. Freshwater Marshes. Univ. Minnesota
Press, Minneapolis. 146 pp.
Wetzel, R. L. 1971. Analysis of cohabitation by Gambusia af
finis and Poecilia latipinna (Pisces: Poeciliidae) in a
salt-marsh canal in Florida. M. S. Thesis, Univ. West
Florida, Pensacola. 67 pp.

r
Table 1. Percent of total dry diet (and standard error) attributable to various foods in winter and
summer. Numbers of fore guts (in brackets) are about equally represented from all pa.t:·ts of diel cycle.
Food category
Chydoridae
Macrothricidae
Other Cladocera
Ostracoda
Harpacticoida
Cyclopoida
Nauplii
Rotifera
Leptolucanid 0mnata
March, 1984 [27]
4.66 (1.54)
1.06 (0.45)
9.44 (3.04)
0.00 (0.00)
0.30 (0.16)
0.61 (0.56)
0.05 (0.05)
0.00 (0.00)
August, 1984 [30]
2.23 (0.53)
0.52 (0.21)
5.71 (2.39)
0.00 (0.00)
0.00 (0.00)
1.26 (0.47)
0.01 (0.01)
0.02 (0.01)
Non-tanypode Chironomidae 46.56 (20.64) 43.63 (23.20)
Tanypodinae
Hemiptera
Odonata
unidentified Insecta
Araneae
oribatei
Other AcaL·i
Fish (G. affinis)
TOTAL
35.67 (21.92)
0.00 (0.00)
0.00 (0.00)
1.65 (1.65)
0.00 (0.00)
0.00 (0.00)
0.00 (0.00)
0.00 (0.00)
100.00
20.72 {l4.651
3.67 (3.67)
0.00 (0.00)
21.87 (19.23)
0.00 (0.00)
0.35 (0.29)
0.00 (0.00)
0.00 (0.00)
100.00
Gambusia affinis
February, 1985 [12]
0.02 (0.01)
0.02 (0.02)
0.10 (0.06)
0.00 (0.00)
0.00 (0.00)
0.00 (0.00)
0.00 (0.00)
0.00 (0.00)
4.76 (4.76)
0.00 (0.00)
0.00 (0.00)
0.00 (0.00)
94.25 (55.05)
0.00 (0.00)
0.84 (0.57)
0.00 (0.00)
0.00 (0.00)
100.00
August, 1984 [23]
0.29 (0.11)
0.20 (0.08)
1.51 (0.63)
0.05 (0.02)
0.00 (0.00)
0.76 (0.27)
0.00 (0.00)
0.00 (0.00)
9.73 (4.96)
13.59 (7.80)
3.44 (1.30)
15.50 (12.00)
35.44 (14.13)
15.91 (7.72)
0.61 (0.28)
0.02 (0.01)
2.94 (2.94)
100.00 1.0 o

r Table 2. Evacuation rates and food consumption. Food in mg, fish in g dry weight.
Species Season Sampling dates 'Foregut Daily food Fish biomass Area-based
evacuation consumption, (g m- 2 ) consumption
rate, r Let (mg m- 2 d- 1 )
(h- 1 ) (mg g-l d- 1 )
L. ommata Winter February 11, 1983 0.0292
March 7-8, 1984 0.143 24.2 0.71
Summer August 29, 1983 0.2468
August 19-20, 1984 0.279 93.1 22.99
G. affinis Winter January 4-5, February 11, 1983* 0.0103
February 16-17, 1985 0.157 32.1 0.33
Summer August 29, 1983 0.0224
August 19-20, 1984 0.262 148.3 3.32
* No G. affinis were captured in February 1983, so biomass is averaged over January and February.

92
Figure 1. Foregut content and food consumption of ~ affinis
in summer. In upper panel, filled circles and solid
lines show diel content trends in field fish; open
squares and dashed lines show changes in content of fish
held in food-free tanks. In lower panel, filled circles
and solid lines show trends in consumption during each
time period; open circle and dotted lines show presumed
trend based on difference between the final (4:30 PM)
and initial (8:50 PM) consumption values.

~50 en LL <!)
~40 0 0 LL
~30 -.... Z I.LI .... 20 z 0 (.)
I-:::::> 10 <!) I.LI a::: 0 I.L
0 NOON
IIOO (J)
I.L <!)
~ 80 0 0 LL.
~ 60 -z 0
h: 40 :!: :::::> (J)
z 020 u
Gambusia affinis
AUGUST
"'\. , ,
"c
93
4PM 8PM MIDNT 4AM 8AM NOON 4PM 8PM
o . . . . . . . . . . . . . . . . . . . . .
. . . . . . . . . .

94
Figure 2. Foregut content and food consumption of L. ommata.
(See Fig. 1 legend for details).

-::x: 50 CJ)
u.. (!)
;; 40 0 0 u..
~30 I-z W I- 20 z 0 U
I-::::l 10 (!) W 0:: 0 u..
0
-:r100 CJ)
La.. (!)
;; 80 0 0 u..
~ 60
z 0
b: 40 ~ ::::l en z 020 u
NOON
Leptolucania ommata AUGUST
4PM 8PM MIDNT 4AM
o • ......
95
NOON 4PM 8PM

CHAPTER 5
OKEFENOKEE MARSHLAl~D BEFORE, DURING AND AFTER
NUTRIENT &~RICHMENT BY A BIRD ROOKERy1
1J . Douglas Oliver and Tarzan Legovic. Accepted by Ecologi
cal Modelling, 10/19/87.
96

97
Introduction
Nutrient enrichment can increase the biomass of various
trophic levels of an aquatic system. A well known example
is addition of sewage to freshwater which results in in
creased phytoplankton and therefore increased production of
zooplankton (Wetzel 1975). In some instances, nutrients are
added deliberately, e.g., to southern farm ponds to increase
the biomass of plankton and thus increase the biomass of
centrarchid fishes (Swingle 1956). In an abandoned bird
rookery of Okefenokee Swamp, Oliver and Schoenberg (Chapter
3) found indications that long-term nutrient release from
bird guano also increased biomass of various trophic levels.
We constructed a model of the marsh ecosystem to investigate
the effect of such a natural influx of nutrients on
plankton, fish, insects and macrophytes, and to estimate the
unmeasured increase in fish during the active rookery_
Various workers have used models to examine the effects
of nutrient enrichment on freshwater wetlands. Patten
(1975) modeled an Oklahoma reservoir cove, then simulated a
ten-fold increase in phosphorus (P) from land. According to
the model, this increased phytoplankton to 1.35 times
nominal levels, submerged macrophytes to 1.24, dead plants
to 1.27, particulate organic matter to 1.12, zooplankton to
1.14, deposit-feeding and carnivorous insects to 1.01 and
fishes to 1.001 times unenriched levels. Bayley and Odum
(1976) estimated model coefficients for an Everglades marsh,

b
98
then showed that resulting levels of sawgrass resembled
those in the field. Simulated P inputs resulted in buildup
of the sawgrass. Mitsch (1976) simulated diversion of
sewage inflow from a shallow Florida lake, which resulted in
reduction of water hyacinths to 0.5 and benthic detritus to
0.3 times eutrophied levels. Dixon and Kadlec (1975, in
Howard-Williams 1985) modeled effects of wastewater on a
wetland and indicated that, according to the model, most
detrital components increased for at least 10 years. Mitsch
(1983) simulated effects of application of treated was
tewater to a north Florida cypress dome, which resulted in
simulated understory plants increasing to 1.5-4.0 and peat
increasing to 1.2-2.8 times nominal levels. See Costanza
and Sklar (1985) for a recent review of models of freshwater
wetlands. Although such models cover a wide range of
situations, we know of no previously published marsh simula
tion models that included a fish compartment.
In this paper, our goal is to obtain a deeper under
standing of the effects of birds on Okefenokee marshland.
Specifically, we are interested in projecting the effects 6f
increased nutrient inputs (principally P) from guano on
dynamics of levels of benthic detritus P, phytoplankton,
zooplankton, insects, fish and aquatic macrophytes. In the
first step we construct the model, simulate the dynamics of
model components for a marsh that lacked birds (control
site, Fig. 1) and compare model dynamics with existing data.
We then apply the model to an active rookery site,

b
99
characterized by increased nutrient input, and compare model
macrophyte results with field data from the active rookery.
Finally, we use the model to project a transition phase from
active rookery back to control (i.e., the rookery site after
abandonment by birds) and compare model results to existing
data collected there. Since density of fish was not
measured when the rookery was active, we use the model to
estimate the increase in density of fish due to nutrient in
crease (evidence of which had been seen as increased fish
biomass in the abandoned rookery, Chapter 3).
Area of Study
Okefenokee Swamp, the largest entirely freshwater wet
land in the United States (1800 km2 ), should be highly af
fected by added guano. Because it lies in a sandy
watershed, its blackwater is low in minerals (Auble 1982),
and its nutrient inputs come mainly via rain (Blood 1981).
Thus, Okefenokee has unusually low nutrient inputs (Table 2)
unless birds are nesting. Furthermore it is shallow (0.5 m
depth at our sites), and many of its organisms feed partly
on a benthic layer of peaty detritus. Since most guano P is
not soluble (Stinner 1983), most should become detritus to
help feed these detritivores. For these reasons, effects of
added nutrients from a rookery should be important.
The sites we model are subtropical, vegetated marshes
within the Okefenokee National Wildlife Refuge (Fig. 1).

100
Floating and submerged macrophytes (Nuphar luteum,
Utricularia spp., Cabomba pulcherrima) dominate the rookery
site (30 0 47' N, 82 0 25' W). For at least 11 consecutive
spring-summer periods, 2000-30000 wading birds, predominant
ly white ibis (Eudocimus albus), had nested in shrubs and
trees adjacent to this site. In 1979-1980, Stinner (1983)
found significant increases in macronutrients in aquatic
macrophytes during nesting. She estimated that the total
amount of phosphorus addition by the birds, 4.6 g m- 2 yr- 1 ,
was comparable to crop field fertilization. In 1981, fol
lowing a drought in much of the southern United States, the
birds did not return, at least not for several years.
We chose a control site similar to the rookery site but
not affected by nesting wading birds. This site (Fig. 1) is
located 1.6 km from the rookery. It has similar depth and
floating and submersed vegetation (e.g., Nuphar luteum,
Utricularia spp.) but has lacked rookeries for at least 15
years.
Methods
Phosphorus is most often the limiting nutrient in
freshwater systems (Wetzel 1975) and is a major nutrient in
guano (e.g., Manny et ale 1975). In Okefenokee marshes,
Flebbe (1982) observed very low levels of dissolved inor
ganic P, and peat N:P ratios of 64:1. Furthermore, Auble
(1982) noted ratios of C:P = 900:1 during litter
b
101
decomposition, which suggests that P was in especially low
concentration. Therefore, we used phosphorus as the measure
of all components and flows.
Model components (Fig. 2) were chosen on the basis of
their relevance to fish. Almost all fish were small ( <60
mm standard length) and ate similar foods, so we lumped all
fish species into one compartment (X6). The most numerous
Okefenokee marsh fishes (Leptolucania ommata and Gambusia
affinis) predominantly eat carnivorous insects (e.g.,
odonates and tanypode chironomids), detritivorous insects
(e.g., non-tanypode chironomids) and zooplankton (e.g.,
cladocerans, Chapter 4). Thus, we included carnivorous in
sects (X4), detritivorous insects (X5), and zooplankton (X3)
in the model. The latter component eats phytoplankton (X2)
and benthic detritus (X7). Aquatic macrophytes (X8, e.g.,
Nuphar advena) are mostly rooted and thus also receive
nutrients (P) from benthic detritus. We used soluble reac
tive phosphorus (SRP, Xl) as a measure of P in water, be
cause it represents the most important form for phytoplank
ton (Wetzel 1975). These eight components constitute the
system of interest.
This system has several sources and sinks for P (Table
1). Wading birds (IB) are a large source of P when present
(Stinner 1983). Precipitation (ID) is the largest source
when the bird rookery is not present (Blood 1981), and it is
taken to be constant throughout the year (Fig. 3a, data from
Schlesinger 1978). Cypress trees (IC' Taxodium ascendens)

102
in nearby swamp forests provide a small amount of P in the
form of needles and this is modeled as constant. Adult in
sects (I A) provide a very small source as eggs every May
June and a small sink when adults flyaway during April
September. Annual buildup of peat is negligible {see
CONTROL SITE (WITHOUT BIRDS)), thus outflowing water (O) is
the major sink for nutrients from Okefenokee Swamp (Rykiel
1977). Outflow P comes basically from benthic detritus
since the peaty detritus is flocculent, easily disturbed and
is the largest component in the system (Table 2). Flows to
sinks were modeled by linear, donor-dependent formulations.
~n years when nesting birds are present, field data
show that they input P during warm months (Fig. 3b, from
Stinner 1983). Because field data were from a particular
year's nesting with that year's minor details of timing of P
input, and because we preferred a generalized input for
simulation of many years, we used a step function as an ap
proximation of this variable seasonality. This allowed some
simplicity, standardization and generality in the model.
We modeled most flows between system components non
linearly (i.e., levels of both donor and recipient com
ponents determine such flows). Michaelis-Menten functions
control some flows. For instance, phytoplankton take up
soluble reactive P (SRP) based on a half-saturation level of
SRP (Bowie et ale 1985). Growth of aquatic macrophytes is
logistic because of competition for space (Table 3). A sine

hr
103
function of day of year represents temperature and modifies
most within-system flows (Table 4).
Food threshold and satiation values constrain predation
flows. Because predators (e.g., odonates) could drive their
prey to extinction in a single day in southern systems that
lacked refuges (Benke 1972), threshold levels were essential
and were incorporated into the model. Food satiation levels
were also added as a natural constraint on feeding (Wiegert
et al. 1981).
Other major flows included herbivorous and detritivor-
ous ingestion, and absorption by macrophytes from benthic
detritus. Egestion went to benthic detritus (and to SRP
from zooplankton, Le Borgne 1973). Uningested dead or-
ganisms passed to benthic detritus. All modeled flows are
shown in Fig. 2, and all parameters used are given in Tables
1, 3 and 4.
OVERVIEW:
Flow
Loss of benthic detritus from system
Phytoplankton uptake of SRP
Macrophyte uptake of benthic detritus P
Linear, donor-dependent
Michaelis-Menten
Michaelis-Menten and logistic
Reference
Rykiel 1977
Bowie et ale 1985
Greening and Gerritsen pers. comm., Wetzel 1975, Twilley et ale 1985

bz
Feeding by zooplankton and detritivorous insects
Natural mortalities
Decomposition of detritus P to SRP
Michaelis-Menten
Linear, donor-dependent
Linear, donor-dependent
104
Bowie et ale 1985
Jorgensen 1979
Auble 1982
All carnivory Threshold/satiation Benke 1972, Wiegert et al. 1981
Timing of simulations is based on field information.
We simulated 11 years of bird effects because birds nested
for at least this long (Stinner 1983). The eleventh year
was chosen as the active rookery benchmark. For the control
(without birds), the eleventh year of simulation was also
chosen as benchmark. Because we examined residual nutrient
effects in the field 1.1-2.1 years after abandonment, we ran
abandoned rookery simulations by resetting birds to zero,
component values to those after 11 years of rookery
simulation, and simulating for a further 2.1 years. We
modeled in FORTRAN (Appendix) on an IBM microcomputer.
Results and Discussion
CONTROL SITE (WITHOUT BIRDS)
First we simulated the control site, with low constant
P inputs due only to precipitation, cypress litter, and in-
sect eggs. Since without birds, buildup of system com-
ponents is negligible (e.g., 1 cm of peat / 20 years at

105
other Okefenokee marsh sites = 10 mg P m- 2 yr- 1 = 1.8% of
total inputs, Cohen et al. 1984), the initial output was set
equal to the inputs above:
Under this steady state condition with regard to nutrient
exchange between the system and its environment (Table 1),
and starting with initial values as in Table 2, all com
ponents came into nominal state within one simulated year.
(By nominal state we mean an unperturbed, reference state
for the control site. It is not an equilibrium state but a
periodic state with a period of one year). Since initial
states were our best estimates and were close to the modeled
nominal states, it is not surprising that any small internal
adjustments in states and flows were complete within one
year. After 11 years, all components were within 60% of
their field- and literature-derived initial states (Table
5) •
Modeled nominal states of macrophytes had about the
same values as field data (data from Stinner 1983, assuming
40% of biomass is aboveground; Fig. 4a). Low seasonality of
modeled macrophytes was a result of the low temperature
coefficient derived from the literature (THET78, Table 3).
Simulated values of SRP overlapped field data (Fig.
4b). Data were quite variable, due mainly to a considerable
error in measuring such low values of SRP. In simulations,

b
106
the low concentrations of SRP during the warmer part of the
year (April-October) were not unreasonable, because of ac
celerated phytoplankton growth. During the cold season,
simulated SRP values were up to 6.0 times as great.
The modeled nominal states of phytoplankton were
similar to field data. Although nominal levels were greater
than data from October 1982-August 1983, high field values
in October 1983 caused average data to be 1.19 times as
great as average simulated states (Fig. 4c). Simulated
levels did not show as much variability as field data from
season to season or from year to year.
Zooplankton nominal states showed some overlap with
levels of zooplankton seen in enclosures at the control site
(Fig. Sa, data from Oliver 1985). Although no data from
cold seasons are available for comparison, available data
indicate that simulated levels of zooplankton are generally
low. This suggests that, as with the previously discussed
biota, effects of seasonality are minimized in the model.
Part of this low seasonality is a result of high predation
on zooplankton levels that began to rise above threshold
level (see OVERVIEW).
Nominal simulations of insects showed some seasonal
effects. Temperature-dependent rates of ingestion resulted
in high levels of carnivorous and especially detritivorous
insects in spring and summer (Fig. 5b). A temperature
dependent release from predation by carnivorous insects and
fish may have caused the increasing levels seen in winter.

107
No field data on insect dynamics are available for com
parison with simulations, but levels are reasonably close to
the field-based initial states of Table 2.
The nominal simulation of fish showed low seasonality
(Fig. 5c). This was at least partly a result of low
seasonality of the zooplankton resource. The slight in
creases in fish biomass from June-October were expected be
cause of accelerated growth of food organisms (zooplankton
and insects) during this warmer period. The fish simulation
overlapped field data. The observed variability in fish
data lacked seasonal trends and was at least partly due to
high variability in the marsh.
The nominal simulation of benthic detritus was notably
constant throughout a year (634-644 mg P m- 2 ). Seasonal
changes in benthic detritus are not known, but are thought
to be low because of large mass and probable low rate of
turnover of this compartment. Thus, relative constancy of
the simulated nominal state may be generally reasonable.
ACTIVE ROOKERY
Simulation of the active rookery started with the same
initial conditions as the control except that contributions
of 8000 birds increased P input to the system (Fig. 3b).
This resulted in elevated levels of a number of components.
Simulated levels of rookery macrophytes averaged 4.5
times as great as simulated control levels (Fig. 6a).

ben
108
Simulated rookery levels were generally greater than field
data (1.35 times as great). Although field data showed
variability, they did not show seasonality. The rookery
macrophyte simulation was consistent with this lack of
seasonality.
Field data for other components during the active
rookery period are lacking, so we contrast simulated rookery
components with simulated control components. Simulated
guano input greatly increased benthic detritus P (Fig. 6b)
because most guano went to the bottom of the shallow marsh
(based on Stinner's BRDSRP data, Table 4). Simulated levels
of benthic detritus P in the rookery increased during the
nesting season (May-August), then gradually declined during
the rest of the year as linear donor-dependent outflow
continued. Over the entire eleventh year, rookery levels
were 8.9 times nominal levels, on average. Thus simulation
showed benthic detritus to be the largest storage for added
P in our system. Field results have tended to confirm high
increases (Richardson and Marshall 1986, Heliotis and DeWitt
1983, Howard-Williams 1985) and to suggest that the peat
sediment is "the critical unit in removing and storing
nutrients" (Ewel and Odwn 1984).
Simulated addition of guano caused a slight decrease in
SRP, contrary to expectation (to 0.87 times control level).
This decrease was a result of increased phytoplankton, and
thus increased SRP uptake, during enrichment (Fig. 6c).
Simulated SRP in the rookery decreased during the warm

b
109
season, consistent with the control simulation (Fig. 4b) and
with seasonal decreases in nature (Wetzel 1975). As men
tioned above, simulation of enrichment by birds resulted in
increased phytoplankton (to 9.4 times nominal levels, Fig.
6c). Seasonal phytoplankton dynamics also became more
pronounced because of simulated guano P input from May
August.
Simulated enrichment caused an insignificant zooplank
ton increase (to 1.03 times nominal levels, Fig. 7a). This
smallness of effect was due to strong limitations on preda
tion on zooplankton by threshold and satiation values (see
OVERVIEW). Such limitations are biologically reasonable
(Wiegert et ale 1981) and necessary to prevent extinction of
simulated zooplankton.
Similarly, threshold and satiation levels were neces
sary to prevent extinction of simulated insects (in agree
ment with experimental observations of Benke 1972), but also
tended to decrease effects of added nutrients (Fig. 7b).
Simulation of addition of P from birds (4600 mg P m- 2 yr- 1 )
thus had little effect on detritivorous or carnivorous
insects. This result is consistent with Moss (1976) who
found that fertilization of macrophyte dominated ponds
(.09 g P m- 2 week- 1 x 12 fertilization weeks yr-1 = 1100
mg P m- 2 yr- 1 , plus nitrogen) had little effect on total
benthic invertebrate biomass. Simulated rookery insects
showed spring peaks, as expected for such emergents.

110
Because the fish component feeds on zooplankton and in
sect components, rookery-caused elevations in the latter
were passed on to fish (Fig. 7c). In nature, increased food
availability can result in an increase in fish (e.g., in
fertilized ponds, Swingle 1956); we simUlate this by donor
dependent feeding (OVERVIEW and Appendix). Over all simu
lated seasons, fish increased to 1.42 times nominal levels.
The fact that most simulated components increased when
bird P was added to the system was consistent with the
literature. For instance, Dolan et al. (1981) found that
secondarily treated effluent caused aquatic macrophytes in a
central Florida marsh to have higher biomass and higher P
concentration. They also found that of 38030 mg P m- 2 added
to the marsh during its first year of treatment, 74% ended
up in peaty soil and litter. Similarly, when Richardson and
Marshall (1986) added 2200 mg P m- 2 yr- 1 plus nitrogen to a
Michigan aquatic peatland, they found increases in net
primary productivity and P storage by Carex spp. These
aquatic macrophytes removed 61% of P addition in the first
year, while the litter-microorganism compartment sorbed 22%.
Richardson and Marshall concluded that algae quickly ab
sorbed significant amounts of P added to the system, but
long-term storage was controlled by soil adsorption and peat
accumulation. Our model is consistent with these findings
because it incorporates donor-dependent fluxes and data on
low guano solubility (BRDSRP, Table 4).

....
111
ABANDONED ROOKERY
After the eleventh year of rookery simulation, inflow
of guano P was stopped and the components changed back
toward nominal conditions. P input to the system declined
while linear donor control of losses from components brought
them down toward a new lower steady state. This resulted in
a simulation of residual nutrient effects.
Simulated aquatic macrophytes were almost as high as
those found when the birds were present. Average states
after 1.1-2.1 years were 0.91 times those in the active
rookery simulation (Fig. 8a, cf. Fig. 6a). However, levels
were declining because of a decline in simulated benthic
detritus P after birds left (Fig. 9a).
We compared simulated levels of abandoned rookery mac
rophytes with field data. Field data were based on aban
doned rookery macrophyte densities (Greening and Gerritsen
1987 and pers. comm.), times: I) concentration of P in
active rookery macrophytes (Stinner 1983); and II) con
centration of P in control macrophytes (Fig. 8a). The
average simulated levels were 2.04 times these field levels.
Simulated levels would have been lower (i.e., closer to
field data) if simulated mortality rate (MU87) had been
higher. The relatively low rate was maintained because it
was based on our best field information on macrophytes
(Table 4) .

112
Abandoned rookery simulation did not alter soluble
reactive phosphorus greatly (values close to control levels,
Fig. 8b cf. 4b). The simulated values overlapped field data
marginally but were somewhat lower. As with other SRP field
data, the high observed temporal variability lacks seasonal
trends and can be considered a result of error in measure
ment of low values.
Dierberg and Brezonik (1983) found that secondarily
treated sewage added to cypress domes caused increased
nutrients in surface water and that 1.7 years after the ces
sation of sewage pumping, total P in water still had not
returned to natural levels. They concluded that sediments
and vegetation on the swamp floor released P to overlying
water long after the addition of nutrients. These results
contrast with our lack of increased SRP in active and aban
doned rookery simulations. In our model, increased guano
causes a higher release of SRP, thus higher levels of
phytoplankton, which then results in phytoplankton driving
down levels of SRP.
Simulated phytoplankton in the abandoned rookery
gradually decreased to levels between rookery and control
simulations (3.7 times nominal levels, i.e. 0.39 times
rookery levels, Fig. 8c cf. 6c). As P in the modeled aban
doned rookery decreased, very high rookery levels of
phytoplankton could no longer be supported. Simulated
levels of abandoned rookery phytoplankton were greater than
corresponding field data by a factor of 1.26. Simulated

113
phytoplankton followed generally expected seasonal trends of
greater levels in warmer seasons.
Simulation of zooplankton in the abandoned rookery was
virtually the same as simulations for the rookery and con
trol (average of .212 cf .. 213 and .206 mg P m- 2 , respect
ively). As in the latter simulations, nonlinear limits on
predation by carnivorous insects and fish, although neces
sary (for reasons discussed above), strongly damped
zooplankton behavior, both seasonally and with respect to
enrichment. In experimental systems, Oliver (1985) and
others have shown significant increases in levels of
zooplankton as a result of P and N enrichment. Thus, the
degree of increase during active and abandoned rookery
simulations was less than expected.
Residual P in the rookery also had relatively little
effect on insects (Fig. 9b cf. 7b). Simulated states were
close to simulated control and rookery states, which dif
fered little from each other because of the nonlinear limits
on predation.
Simulated levels of abandoned rookery fish were almost
as high as simulated levels of rookery fish (0.95 times as
high). However, simulated levels were not as high as field
data (0.54 times as high) and were especially lower in the
first two months of the year-long comparison (Fig. 9c).
Nevertheless, simulated levels of abandoned rookery fish
were not significantly different from corresponding field
data.

114
Simulated levels of benthic detritus were still
elevated 1.1-2.1 years after abandonment (Fig. 9a). Average
levels were 3.7 times nominal (cf. Fig. 6b). Field results
are consistent with these data: The equilibrium phosphate
concentration of benthic detritus was 3.7 times as great in
the abandoned rookery as in the control, 1.4-2.0 years after
abandonment (Chapter 3). Benthic detritus continued to
decrease as phosphorus loss to outflow brought this
compartment, the major storage for P in the system, back
toward normal unenriched levels. Long term simulation of
abandonment projected levels of benthic detritus that were
1.1 times simulated levels in the control, 9 years after
abandonment.
Our simulation indicated that the biggest sink for
guano P in the system was benthic detritus. Reviews of
Heliotis and DeWitt (1983) and Howard-Williams (1985) agreed
with this conclusion by indicating that sediment accumula
tion was the major long-term sink for P added to wetlands.
Conclusions
The model simulated major components of Okefenokee
Swamp marshes reasonably well. Because it incorporated
known initial conditions and constants without birds, it
simulated this situation best. Simulation of P input from
an active wading bird rookery (to 8.9 times nominal input)
resulted in mean increases in benthic detritus to 8.9 times

115
nominal levels, aquatic macrophytes to 4.5, phytoplankton to
9.4, zooplankton to 1.03, detritivorous insects to 1.04, and
fish to 1.42, while soluble reactive P decreased to 0.87 and
carnivorous insects to 0.97 times nominal levels. As
expected, increases in benthic detritus and phytoplankton
were highest because these components were proximal to the
nutrient input (Fig. 2). Increase in macrophytes was next
highest, in agreement with field observations (e.g., Dolan
et ale 1981). The fish increase of 42% should be regarded
as a minimum estimate of unknown increase in the active
rookery.
Simulation of the marsh after birds abandoned it
resulted in gradual declines of most components toward
nominal levels. After 1.1-2.1 years, mean levels of benthic
detritus decreased to 3.7 times nominal levels, macrophytes
to 4.1, phytoplankton to 3.7, detritivorous insects to 1.01,
and fish to 1.35, while SRP increased to 0.95, zooplankton
remained at 1.03 and carnivorous insects at 0.97 times
nominal levels. Because the simulated increase in fish in
the abandoned rookery appeared less than its increase in the
field, simulated fish increases should be considered minimum
estimates of nutrient effects.
The results of simulations in this study and of obser
vations in the field (Chapter 3) indicate that nesting
wading birds can have considerable nutrient effects on an
aquatic ecosystem. Birds can increase components of the
system that are not normally associated with them, such as

116
benthic detritus and fish. The analysis of the system has
shown significant nutrient links between aerial biota and
such aquatic components.

References
Allen, S.E., Grimshaw, H.M., Parkinson, J.A. and Quarmby,
C., 1974. Chemical Analysis of Ecological Materials.
Wiley, New York.
Auble, G.T., 1982. Biogeochemistry of Okefenokee Swamp:
litterfall, litter decomposition, and surface water
dissolved cation concentrations. Ph.D. Thesis, Univ.
Georgia, Athens, GA.
117
Bayley, S. and Odum, H.T., 1976. Simulation of interrela
tions of the Everglades' marsh, peat, fire, water and
phosphorus. Ecol. Modelling, 2: 169-188.
Benke, A.C., 1972. An experimental field study on the ecol
ogy of coexisting larval odonates. Ph.D. Thesis, Univ.
Georgia, Athens, GA.
Blood, E.R., 1981. Surface water hydrology and biogeochem
istry of the Okefenokee Swamp watershed. Ph.D. Thesis,
Univ. Georgia, Athens, GA.
Bowie, G.L., Mills, W.B., Porcella, D.B., Campbell, C.L.,
Pagenkopf, J.R., Rupp, G.L., Johnson, K.M., Chan,
P.W.H. and Gherini, S.A., 1985. Rates, constants, and
kinetics formulations in surface water quality modeling
(Second ed.) U. S. Ecological Research Series.
EPA/600/3-85/040, Cincinnati, OH.
Christiansen, R., Friis, N.J.S. and Sondergaard, M., 1985.
Leaf production and nitrogen and phosphorus tissue con
tent of Littorella uniflora (L.) Aschers. in relation

118
to nitrogen and phosphorus enrichment of the sediment
in oligotrophic Lake Hampen, Denmark. Aquat. Bot., 23:
1-11.
Cohen, A.D., Andrejko, M.J., Spackman, W. and Corvinus, D.,
1984. Peat deposits of the Okefenokee Swamp. In: A.D.
Cohen, D.J. Casagrande, M.J. Andrejko, and G.R. Best
(Editors), The Okefenokee Swamp: Its Natural History,
Geology, and Geochemistry. Wetland Surveys, Los Alamos,
NM, pp. 493-553.
Costanza, R. and Sklar, F.H., 1985. Articulation, accuracy
and effectiveness of mathematical models: a review of
freshwater wetland applications. Ecol. Modelling, 27:
45-68.
Dierberg, F.E. and Brezonik, P.L. 1983. Tertiary treatment
of municipal wasterwater by cypress domes. Water Res.,
17: 1027-1040.
DiToro, D.M. and Matystik, W.F., Jr., 1980. Mathematical
models of water quality in large lakes. Part I: Lake
Huron and Saginaw Bay. U. S. Ecological Research
Series. EPA/600/3-80-056, Cincinatti, OH.
Dixon, K.R. and Kadlec, J.A., 1975. A model for predicting
the effects of sewage effluent on wetland ecosystems.
Publ. 3, Wetlands Ecosys. Res. Group, Univ. Michigan,
Ann Arbor, MI.
Dolan, T.D., Bayley, S.E., Zoltek, J., Jr. and Hermann,
A.J., 1981. Phosphorus dynamics of a Florida freshwater

".,
119
marsh receiving treated wastewater. J. Appl. Ecol., 18:
205-219.
Ewel, K.C. and Odum, H.T., 1984. Cypress Swamps. University
Presses of Florida, Gainesville, FL.
Flebbe, P.A., 1982. Biogeochemistry of carbon, nitrogen, and
phosphorus in the aquatic subsystem of selected
Okefenokee Swamp sites. Ph.D. Diss., Univ. Georgia,
Athens, GA.
Greening, H.S. and J. Gerritsen., 1987. Changes in macro
phyte community structure following drought in the
Okefenokee Swamp, Georgia, U.S.A. Aquat. Bot., 28: 113-
128.
Heliotis, F.D. and DeWitt, C.B., 1983. A conceptual model of
nutrient cycling in wetlands used for wastewater
treatment: a literature analysis. Wetlands, 3: 134-152.
Hillbricht-Ilkowska, A., 1977. Trophic relations and energy
flow in pelagic plankton. Pol. Ecol. Stud., 3: 3-98.
Howard-Williams, C., 1985. Cycling and retention of nitrogen
and phosphorus in wetlands: a theoretical and applied
perspective. Freshw. BioI., 15: 391-431.
Jorgensen, S.E. (Editor), 1979. Handbook of Environmental
Data and Ecological Parameters. ISEM, Copenhagen.
Khan, J.A. and Siddiqui, Q., 1971. Water, nitrogen and phos
phorus in freshwater plankton. Hydrobiologia, 37: 531-
536.

....
120
Klekowski, R.Z., Fischer, E., Fischer, Z., Ivanova, M.B.,
Prus, T., Shushkina, E.A., Stachurska, T., Stepien, Z.
and Zyromska-Rudzka, H., 1970. Energy budgets and
energy transformation efficiencies of several animal
species of different feeding types. In: Z. Kajak and A.
Hillbricht-Ilkowska, (Editors), Productivity Problems
of Freshwaters. PWN Publ., Warsaw, Poland, pp. 749-763.
Le Borgne, R.P., 1973. Etude de la respiration et de
l'excretion d'azote et de phosphore des populations
zooplanctoniques de l'upwelling mauritanien (mars
avril, 1972). Mar. Biol., 19: 249-257.
Leidy, G.R. and Ploskey, G.R., 1980. Simulation modeling of
zooplankton and benthos in reservoirs: documentation
and development of model constructs. Tech. Rep. E-80-4,
U.S. Army Engineer Waterways EXp. Sta., Vicksburg, MS.
Manny, B.H., Wetzel, R.G. and Johnson, W.C., 1975. Annual
contribution of carbon, nitrogen and phosphorus by
migrant Canada geese to a hardwater lake. Verh.
Internat. Verein. Limnol., 19: 949-951.
Mitsch, W.J., 1976. Ecosystem modeling of waterhyacinth
management in Lake Alice, Florida. Ecol. Modelling, 2:
69-89.
Mitsch, W.J., 1983. Ecological models for management of
freshwater wetlands. In: S.E. Jorgensen and W.J. Mitsch
(Editors), Application of Ecological Modelling in En
vironmental Management, Part B, Elsevier, Amsterdam,
pp. 283-310 .

121
Moss, B., 1976. The effects of fertilization and fish on
community structure and biomass of aquatic macrophytes
and epiphytic algal populations: an ecosystem
experiment. J. Ecol., 64: 313-342.
Nakashima, B.S. and Leggett, W.C., 1980. Natural sources and
requirements of phosphorus for fishes. Can. J. Fish.
Aquat. Sci., 37: 679-686.
Oliver, J.D., 1985. A system for examining the response of
aquatic ecosystems to gradual chemical inputs, and
field application in Okefenokee Swamp, Georgia. Arch.
Hydrobiol., 102: 415-423.
Oliver, J.D., Consumption, evacuation rates and diets of
pygmy killifish (Leptolucania ommata) and mosquitofish
(Gambusia affinis) in a marsh of Okefenokee Swamp.
Chapter 4.
Oliver, J.D. and Schoenberg, S.A., Residual influence of
macronutrient enrichment on the aquatic food web of an
Okefenokee Swamp abandoned bird rookery. Chapter 3.
Patten, B.C., 1975. A reservoir cove ecosystem model. Trans.
Am. Fish. Soc., 104: 596-619.
Richardson, C.J. and Marshall, P.E., 1986. Processes con
trolling movement, storage, and export of phosphorus in
a fen peatland. Ecol. Monogr., 56: 279-302.
Robinson, W.R., Peters, R.H. and Zimmermann, J., 1983. The
effects of body size and temperature on metabolic rate
of organisms. Can. J. Zool., 61: 281-288.

122
Rykiel, E.J., Jr., 1977. The Okefenokee Swamp watershed:
water balance and nutrient budgets. Ph.D. Thesis, Univ.
Georgia, Athens, GA.
Schlesinger, W.H., 1978. Community structure, dynamics and
nutrient cycling in the Okefenokee cypress swamp
forest. Ecol. Monog., 48: 43-65.
Smock, L.A., 1980. Relationships between body size and
biomass of aquatic insects. Freshw. Ecol., 10: 375-383.
Smock, L.A. and Gilinsky, E., 1985. Macroinvertebrate
production in a southeastern United States blackwater
stream. Ecology, 66: 1491-1503.
Stinner, D.H., 1983. Colonial wading birds and nutrient cy
cling in the Okefenokee Swamp ecosystem. Ph.D. Thesis,
Univ. Georgia, Athens, GA.
Strayer, D. and Likens, G.E., 1986. An energy budget for the
zoobenthos of Mirror Lake, New Hampshire. Ecology, 67:
303-313.
Swingle, H.S., 1956. Determination of balance in farm fish
ponds. Trans. N. Am. Wildl. Conf., 21: 298-322.
Twilley, R.R., Brinson, M.M. and Davis, G.J., 1977. Phos
phorus absorption, translocation, and secretion in
Nuphar luteum. Limnol. Oceanog., 22: 1022-1032.
Waters, T.F., 1969. The turnover ratio in production ecology
of' freshwater invertebrates. Am. Nat., 103: 173-185.
Wetzel, R.G., 1975. Limnology. Saunders, Philadelphia.
Wiegert, R.G., Christian, R.R. and Wetzel, R.L., 1981. A
model view of the marsh. In: L.R. Pomeroy and R.G.

....
123
Wiegert (Editors), The Ecology of a Salt Marsh, Ecol.
Stud. Vol. 38, pp. 183-218 .

,.""
TABLE 1. Sources and sinks 0f phosphorus.
Name [\leaning
i\dul t insects
Wading birds
Cypress litter
Precipitation
o Outflow
Value
X4 egg deposition =-X4 x 2% yr- 1 x yr(61 depos. d)-l = .0031 mg P m- 2 d- 1
X4 emergence =-.450 9 dry m- 2 emerg. (1.5 9 dry wt m- 2 )-1 x(.4 m2 emerg. area) m- 2 (154 emerg. d)-l = .00078 d- 1 (X5 egg depos. and emerg. are yr-round & unquantifiedi depos. and emerg. are considered to balance)
2000-30000 bird, typically 8000i 4600 mg P m- 2yr- 1 (8000 bird)-l x yr(105 nesting d)-l =.0055 mg P m- 2d- 1bird- 1
133 mg P m- 2 yr- 1
x 10% forest to marsh transfer x yr(365 d)-l =.036 mg P m- 2 d- 1
570 mg P m- 2 yr- 1 x yr(365 d)-l =1.56 mg P m- 2 d- 1
Outflow balances above flows (when no birds) =I D + IC + IA =(570+.036x365+.0031x61 mg P m- 2yr- 1 -9.4 mg P m- 2x.00078 d- 1 x 154 emerg. d yr- 1 ) = 1.6 mg P m- 2 d- 1
Source
Waters 1969 Benke 1972
"
" " " "
Stinner 1983
n 11
124
Schlesinger 1978
Blood 1981

125
TABLE 2. Initial states based on initial simulation day (August 29).
Name Meaning Value Source
X 4
Soluble reactive P 5 ~g P L- 1 x 1000 L m- 3
Phytoplankton
Zooplankton
Carnivorous insects
Detritivorous insec1:s
Fish
Benthic detritus
Aquatic macrophytes (> 1 cm diam)
x .48 m depth_ 2.4 mg P m- L
17.6 mg chI a m- 2 x .6 mg TP(mg chI ~)-1 = 10.6 mg P m- 2
28 mg dry W1: m- 2
x 1% TP w1:(d:¥ wt)-l = .28. mg P m
(2700 total chiron. m- 2 x 10% tanyp. (total chiron.)-l x .402 mg dry wt ind- l + 830 mg dry odon. m- 2 ) x 1.0% TP wt(dry wt)-l = 9.4 mg P m- 2
2700 total chiron. m- 2
x 90% non-tanyp. (total chiron.)-l x.402 mg dry wt ind- 1
x 1.0% TP wt~dry wt)-l =9.8 mg P m-'"
6.54 9 wet wt m- 2 x 5.9 mg P(g wet wt)-l
38.6 mg P m- 2
3 cm depth x 10 4 cm 2 m- 2
x 1 9 wet wt cm- 3
x .058 9 dry(g wet)-l x .36 mg P(g qry)-l
630 mg P m-.c
108 mg P m- 2 aboveground x total plant biomass (40% aboveground)-l -, = 270 mg P m-<'
pers. obs. 1982-3
"
Bowie et al. 1985
pers. obs. Khan and Siddiqui 1971
H.S. Greening pers. comrn. 1986
Smock 1980 Benke 1972 and pers. obs.; Allen et al. 1974
Greening pers. comrn.; pers. obs.
Smock 1980 Allen et al. 1974
Chapter 3
c10rgensen 1979
pers. obs.
" "
J.Gerritsen & Greening pers. comrn. 1986
pers. obs.
Wetzel 1975

126
TABLE 3. Literature-based values for nonlinearities.
Name Meaning Value Source
F10N2 Limit on X1/(KN12+Xll this table phyto. by SRP
F20N3 Limit on zoop. by phyto.
F30NP Limit on predation on zoop. by their density (parenthetic expression followed by "+" subscript means set to zero if negative)
F40NP Limit on predation on carn. insects by their density
F50NP Control on predation of detritiv. insects by their density
F70N35 Limit on zoop. and detritiv. insects by their benthic detritus food
F70N8 Control on macrophytes by benthic detritus
F80N8 Limit on macrophytes by their density
K8 l'ojax. density of macrophytes
EDIFRC*X7/(KMT035+ EDIFRC*X7)
EXTRCP*X7/(KM78+ EXTRCP*X7)
(K8-:\8) /K8
130 g dry aboveground m- 2 x total plant biomass (40% aboveground)-l
" "
\Viegert et al. 1981 our estimate
Table 1
Wiegert et al. 1981
Table 1
wiegert et al. 1981
Table 1
Table 3 and this table
11 11
this table
Control, Greening and Gerritsen pers.comm., wetzel
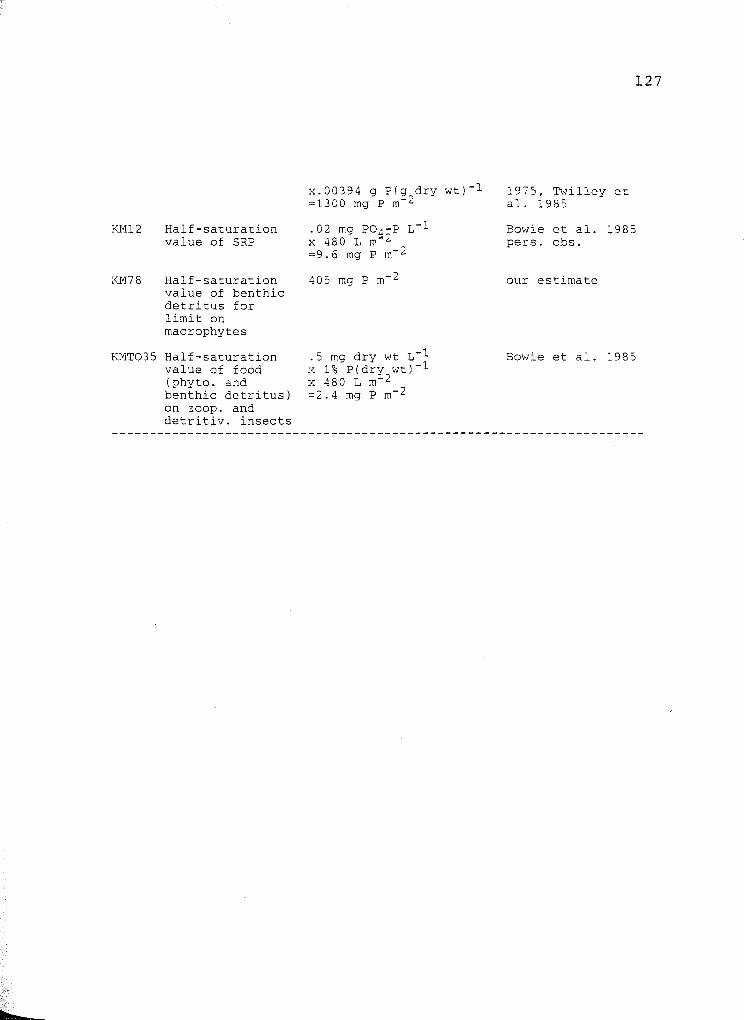
KM12 Half-saturation value of SRP
KM78 Half-saturation value of benthic detritus for limit on macrophytes
KMT035 Half-saturation value of food (phyto. and benthic detritus) on zoop. and detritiv. insects
x.00394 g P(g dry wt)-l =1300 mg P m- 2
.02 mg P04-P L- 1 x 480 L m~2 =9.6 mg P m- 2
405 mg P m- 2
.5 mg dry wt L- l x 1% P(drv wt)-l x 480 L m:' 2 =2.4 mg P m- 2
1975, Twilley et al. 1985
127
Bowie et al. 1985 pers. obs.
our estimate
Bowie et al. 1985

128
TABLE 4. Literature-based constants.
Name Meaning Value Source
AMTSRP Fraction of rain P which is SRP
AVT04 Average transfer (feeding) rate to earn. insects
BRDBEG Day of yr on which birds begin to nest (and to add P); based on o d = January 1
.072
production{BiomassX4 (1-EPS47)-=5 yr- 1 (1-.55)-1 =11.1 yr- 1 x yr(365 d)-l =.030 d-2.
135d
BRDFIN Day of yr on 239 d which birds finish nesting (and adding P)
BRDSRP Fraction of bird guano P which is SRP
DEPBEG Day of yr on which earn. insects begin to deposit eggs
2.6 mg SRP L- 1 x.75 L x(9000 mg guano x8.3%TP)-1 =.0026
120 d
DEPFIN Day on which earn. 180 d insects finish depositing eggs
EDIFRC Fraction of benthic detritus which is edible by zoop. & detritiv. insects
EPS3 Fraction of ingestion by zoop. which is egested or excreted
EPS47 Fraction of ingestion by earn. insects
.01
.6
1 - growth/ingestion = 1 - 45% =.55
Rykiel 2.977
this table Benke :'972 this cable
Stinner 1983
" "
" "
Benke 1972
"
S.A.Schoenberg pers. comm. 1986
Leidy and Ploskey 1980
Benke 1972

which is egested or excreted
129
EPS57 Fraction of .8 Strayer and Likens 1986 ingestion by
detritiv. insects which is egested or excreted
EPS67 Fraction of .642 Klekowski et al. 1970 ingestion by fish
which is egested or excreted
EXTRCP Fraction of benthic detritus P which is extractable by macrophytes
FRAC44 Fraction of food of earn. insects which is earn. insects
INTOFS Invertebrate to fish P ratio (for calculating trophic transfer to fish)
K17 Transfer from SRP to benthic detritus
K71 Decomposition of detritus P (to SRP)
K70 Outflow constant from benthic detritus
LVBEG Day of yr on which earn. insects begin to leave marsh
2.62~g extractable P cm- 3 Christiansen et (136 ~g TP cm- 3 )-1 al. 1985 =.0193
high, .25
1% TP(dry wt)-l in invertebrates (3% TP(dry wt)-l)-l in fish =.33
At equilibrium without biota, F17 - F71, K17 x Xl - K71 x X7' K17 - .0022 d- 1 x 630 mg P m- 2/x1 but 630 mg P m- 2 >X1 >0 Xl - 300 mg P m- 2 so K17 = .005 d- 1
.82 yr- 1
x yr(365 d)-l =.0022 d- 1
1. 6 mg P m - 2 d- 1 (630 mg P m- 2 )-1 =.0025 d- 1
90 d
Benke 1972
Khan and Siddiqui 1971, Allen et al. 1974, Nakashima and Leggett 1980
this table Table 1
Auble 1982
Table 2 Table 1
Benke 1972

LVFIN
MU27
MU37
MU47
MU57
MU67
MU87
Day on which insects finish leaving
Natural mortality rate of phyto.
Natural mortality rate of zoop.
Natural mortality rate of earn. insects
Natural mortality rate of detritiv. insects
Natural mortality rate of fish
Natural mortality rate of macrophytes
243 d
.12 d- 1
.02 d- 1
.002 d- 1
.002 d- 1
.005 d- 1
(aboveground turnover time x fraction aboveground + belowground turnover time x fraction belowground)-l =(88.49 d x.4 + 4 yr(365 d yr-1 )x.6)-1 =.0011 d- 1
TAU12 Max. transfer rate .5 d- 1 from SRP to phyto.
TAU23
TAU34
TAU36
Max. transfer rate from phyto. to zoop.
Max. transfer rate from zoop. to earn. insects
Max. transfer rate from zoop. to fish
Max. total transfer rate to zoop. x (phyto. dry wt/ total dry wt eaten) x 1% P/phyto. dry wt (total P eaten)-=.8 d- 1 x(100%-(40% detritus dry wt)) x 1% P (40% x .036%P + 60% zoop. dry wt x l%P)-l =.78 d- 1
AVT04 x (1-FRAC44)/2 x(1/F30NPinit) =.034 d- 1
'NNCONS x INTOFS x(ccrrection of observed con",umption rate to max. rate) (conversion of
130
Benke 1972
Bowie et al. 1985
" " " "
Jorgensen 1979
" "
" "
Greening and Gerritsen pers. comm., M.E.Cochran pers. comm. 1986
Bowie et al. 1985
Khan and Siddiqui 1971 Bowie et al. 1985 this table
this table Table 4
this table

TAU44 Max. transfer rate from earn. insects to earn. insects
TAU46
TAU54
TAU56
TAU73
Max. transfer rate from earn. insects to fish
Max. transfer rate from detritiv. insects to earn. insects
Max. transfer rate from detritiv. insects to fish
Max. transfer rate from benthic detritus to zoop.
winter rate to standard rate) x 7.6% zoop. wt (total food wt)-l =.0282 d- 1 x .33 x(1/F30NPinit) x (THET06**(20.0oC-12.3 0 C)) x .076 =.0039 d- 1
AVT04 x FRAC44 x(1/F40NPinit) =.023 d- 1
WNCONS x INTOFS x(correction of observed consumption rate to max. rate) (conversion of winter rate to standard rate) x 44.6% earn. insect wt (total food wt)-l =.0282 d- 1 x .33 x(1/F40NPinit) x (THET06**(20.0oC-12.3 0 C) ) x .446 =.0227 d- 1
AVT04 x(1-FRAC44)/2 x(1/F50NPinit) =.034 d- 1
WNCONS x INTOFS x(correction of observed consumption rate to max. rate) (conversion of winter rate to standard rate) x 47.8% detritiv. insect wt(tota1 food wt)-l =.0282 d- 1 x .33 x(1/F50NPinit) x (THET06**(20.0oC-12.3 0 C)) x .478 =.0242 d- 1
Max. total transfer rate to zoop. x detritus dry wt/total dry wt eaten x.36 mg Pig dry detritus (total P eaten)-l =.8 d- 1
Chapter 4
Table 4 this table
Table 4
this table
Chapter 4
Table 4
"
Chapter 4
Table 3
Table 1
131
Bowie et al. 1977

TAU7S
TAU78
TEMP
THET12
THET71
THET78
Max. transfer rate from benthic detritus to detritiv. insects
Max. transfer rate from benthic detritus to macrophytes
Water temp.
Temp. adjustment coefficient for transfer from SRP to phyto.
Temp. adjustment coefficient for transfer from detritus to SRP
Temp. adjustment coefficient for transfer from detritus to macrophytes
THET06 Temp. adjustment coefficient for transfer to fish
x 40% of total dry x.036% P (40% x.036%P +60% phyto. dry wt x l%P)-l =.019 d- l
Production/BiomassX5 (1-EPS57)-1 x(1/F70N35init) =7-30 yr- l say 15 rr- i (1-.8) -x (1/.724) x yr(365 d)-l =.28 d- l
.047 d- l
Avg. temp. - amplitude x sin(2 pi(d of yr)yr/365d +phase shift) =18.7o C - 9.5 x SIN(2(3.142)T/365+.599)OC
1. 068
1. 05
(Uptake rate in summer (Uptake rate in winter)-l) **(l/(summer temp.-winter temp.))=(287%P x 10- 3 d- l (lS7%P x 10- 3 d- l )-l) **(1/(30oC-4.5 0 C)) =1. 024
132
Hilbricht-Ilkowska 1977
this table
chironomids, Smock and Gilinsky 1985
our estimate
calibration
DiToro and Matystik 1980
Bowie et al. 1985
Twilley et al. 1977
" ""
((Summer consumption (winter consumption)-l) **(l/(summer temp.-winter temp.) ) =(.1207 d- 1 (.0282 d- l )-l) Chapter 4 **(1/(30.90 C-12.30C)) =1. 081

THTINV Temp. adjustment coefficient for transfer to invertebrates
WNCONS Winter average consumption by most numerous fish (Leptolucania ommata and Gambusia affinis)
ZPSRP Fraction of P egestion+excretion which is SRP
1. 052
(.0242 d- 1+.0321 d- 1 )/2 =.0282 d- 1
.48
133
Robinson et al. 1983
Chapter 4
Le Borgne 1973

TABLE 5. Comparison of initial states to states after 11 simulated years without birds (in mg P m- 2 ).
Component Initial state (from Table 1)
SRP 2.40
Phytoplankton 10.60
Zooplankton 0.28
Carn. insects 9.40
Detritiv. insects 9.80
Fish 38.60
Benthic detritus 630.00
Aquatic macroph. 270.00
State after Percent change 11 yr from initial
1.77 -26.3
16.92 +59.6
0.21 -26.1
5.12 -45.5
9.62 -1.8
35.15 -8.9
635.77 +0.9
257.76 -4.5
134

Fig. 1. Map of the marsh sites mentioned in the text. Solid
lines on the enlarged map delineate the Okefenokee
watershed, its enclosed islands and watercourses.

136
Okefenokee Swamp
----
Florida - -- - -- .s:J!-r---, "-~-
~
o 8 16 I I I
Km

Fig. 2. An Okefenokee marsh system and its interacting
environment. Rectangles are major system components
and "clouds" are sources and sinks of phosphorus.
137

PRECIP.
~ ID -
BIRDS SRP
~ IB Xl ~ PHYTO. ~
Xz -
~ AQUATIC
~ Ie MACROPH. Xa
OU;FJ~' [-
"
ZOOP. X3 ~
BENTHIC DETRITUS ,
X7
...--.
ADULT INSECTS
IA ~
CARN. INSECTS
FISH ~ X4 X6
1 DETRITIV. INSECTS
XS
I-' w 00

139
Fig. 3. P inputs to Okefenokee Swamp via rain and birds.
Although wading bird data represent input from a normal
nesting of 8000 birds, the step function is similar
(but lower or higher) when smaller or larger numbers of
birds are simulated.

,... • "C
C\I I
E c.. 0')
:2
P Inputs 3.0...------------------------.
a. PRECIPITATION 2.5
2.0
1.5 ~ Input to Model ~ Field Data
1.0
0.5
,0 OCT DECI FEB APR JUN AUG OCT
1974
80
b.
60
40
20
1975
WADING BIRDS Rookery
Input to Model
o OCT DECI 1978
FEB APR JUN 1979
AUG OCT
140

141
Fig. 4. Primary producer and SRP dynamics when no birds are
present. Bars show ±S.E. for macrophytes and range of
duplicate values for phytoplankton.

142
Control Site 1600~------------------------------~
a. AQUATIC MACROPHYTES
1200
800
--
Fig. 5. Animal dynamics when no birds are present. Bars
show +S.E.
143

Control Site 3.-------------------------------~
a. ZOOPLANKTON
2
Field Data
1
Simulation
o+-~~--~~~--~~~--~~~--~ FEB APR JUN
1983 AUG OCT DECI
1982 OCT
25.-------------------------------~
20
15
10
5 ....
o OCT
b. INSECTS Simulations
Carn. Insects ... ... AI ill .. .. .. .. ... .. .. ............--.. .. ---... ... _ .. _&
FEB APR JUN AUG OCT
300.---------------------------------n FISH
c.
200
100
o+-~-,--.-~-.~~~-.--~~-.--~ OCT DECI FEB APR JUN AUG OCT
1982 1983
144

145
Fig. 6. Primary producer and benthic detritus dynamics in
the active rookery compared with dynamics without
birds. (In Fig. a and c, controls correspond to simu
lated cases in 4a and 4c).

146
1600~---------------------------------,
a. AQUATIC MACROPHYTES

147
Fig. 7. Animal dynamics in the active rookery compared with
dynamics without birds.

N I
E
0')
3~----------------------------------~
2
0
25
20
15
a.
Rookery
ZOOPLANKTON Simulations
Control 1111111111_ II 1111 II 11m IImIIII
OCT DECI FEB APR JUN AUG OCT
b. INSECTS Simulations
:E 10 Rook. Cam. Ins. .....:1: 1 ~Carn. Ins.
5 .. ' ............ • ~:!::lA6
300~--------------------------------~
C.
200
100
Rookery III : =-----m--III .. ..
Control 0
OCT DECI FEB
I! ..
FISH Simulations
• III ~ II ~
III .. APR JUN AUG
III II
OCT
148
149
Fig. 8. Primary producer and SRP dynamics in the abandoned
rookery. In a, field data are based on abandoned
rookery macrophyte densities times P concentrations in
macrophytes of I) active rookery and II) control sites.
(Nesting birds left the site in August 1981, thus
graphs represent dynamics 1.1-2.1 years after
abandonment).

150
Abandoned Rookery 1600~------------------------------~
AQUATIC MACROPHYTES a. 1200
Simulation
800
400
0 OCT DE9 FEB APR JUN AUG OCT
1982 1983 40
b. Soluble Reactive P
('II 30 I
E 0.. 20 I:» :5
10
0 OCT DECI FEB APR JUN AUG OCT
1982 1983 200
PHYTOPLANKTON C.
150
100
50
0 OCT DECI FEB APR JUN AUG OCT
1982 1983

Fig. 9. Detritus and animal dynamics in the abandoned
rookery.
151

('II I
E Il. C')
::!:
Abandoned Rookery 8000.-----------------------------------,
a. BENTHIC DETRITUS
6000
4000
2000
Simulation -----I I
....... I • • • • • • I • . . . ..
25~--------------------------------~
20
15
10
b. INSECTS
Detritiv. Ins. Simulation
Carn. Ins. Simulation 5 ,. .... M III DI II III II A Id M ,L... u II M .. " IC
300.----r------------------------------,
C. FISH
200
Field Data
100
O+-~--~~~--~~--~~~--~~--~
OCT DECI FEB APR JUN AUG 1982 1983
OCT
152

CHAPTER 6
CONCLUSIONS
The preceding chapters support a hypothesis of biogenic
and simulated nutrient enrichment causing increased levels
of various ecological components of an Okefenokee Swamp
marsh. Enrichment by wading birds and an artificial ex
perimental source caused increased stores of phosphorus in
diverse links of the food web. Simulation modeling of such
eutrophication produced similar increases in components,
lending increased support to a hypothesis that an aerial
component, wading birds, caused broad-scale changes to the
aquatic ecosystem that persisted for some years after the
birds abandoned the site.
To chemically simulate nutrient enrichment from birds,
I developed a convenient standardized system for testing ef
fects of chemical inputs on ecosystems in remote regions.
Clay flower pots filled with chemically-enriched agar
(Fairchild et ala 1984) inside 2-m2 clear plastic enclosures
provided sturdy, easily constructed and easily maintained
experimental mesocosms in an Okefenokee Swamp macrophytic
marsh. One-L pots filled with 0.2 M (NH4)2HP04-enriched
agar released an average of 45 mg NH4-N d- 1 and
153

154
11 mg P04-P d- 1 into deionized water in the laboratory, with
higher release into Okefenokee Swamp blackwater. Marsh
mesocosms containing pots had higher stocks of zooplankton
(primarily Diaphanosoma brachyurum) than controls. These
results demonstrate that simulation of enrichment levels
remaining after birds had left can cause significant effects
on zooplankton primary consumers in the marshes.
Evidence was presented for residual nutrient enrichment
of diverse components of a blackwater marsh, by a biotic
component of the ecosystem itself. Thousands of nesting
white ibis (Eudocimus albus) that foraged over a 20-km
radius imported macronutrients to a rookery within
Okefenokee Swamp. One to two years after the birds aban
doned it, this marsh showed continued nutrient effects.
Elevated available phosphorus in sediments, as measured by
equilibrium phosphate concentration, contributed to enhanced
biomass of phytoplankton in the overlying water column.
Planktivorous fish were greater in biomass than at reference
sites. These results and the zooplankton data demonstrate
that this blackwater ecosystem was macronutrient limited,
and manifested residual enrichment effects of wading birds
on sediments, and a positive effect of sediments on
phytoplankton. Results also suggest further indirect posi
tive effects of birds on higher trophic levels (zooplankton
and fish), via macronutrient transfers.

155
To calculate the trophic transfer to fish, for a
simulation model of the Okefenokee marshes, I measured feed-
ing dynamics of Leptolucania ommata and Gambusia affinis,
in situ. Both fishes ate mainly insect larvae (such as
Chironomidae) and Cladocera. Evacuation rates ranged from
0.143 (~ ommata in winter) to 0.279 h- 1 (~ ommata in
summer). Daily food consumption ranged from 24.2 (~ ornmata
in winter) to 148.3 mg g-l d- 1 (~ affinis in summer; dry
weight). Maximum consumption by both species was estimated
at 26.31 mg m- 2 d-1 in summer. such values support a
hypothesis that invertebrate prey production must be sub-
stantial in such blackwater wetlands.
Field measurements and data from the literature were
used to construct a trophic model of Okefenokee Swamp
marshland. Seasonal data were used to check dynamics of the
model before, during and after simulated nutrient input from
wading bird guano. The model gives reasonable est~uates of
the effects of enrichment on benthic detritus, aquatic mac-
rophytes and phytoplankton, and conservative estimates of
the increase of zooplankton and fish stocks. Simulated
levels of the above components decreased toward nominal
states after simulated abandonment by birds, and the rates
of decrease generally followed field trends that were
measured. The model indicates that nesting wading birds can
have considerable effects on aspects of an aquatic ecosystem

156
that are not normally associated with them (such as benthic
detritus and fish).
In the model, zooplankton were not sensitive to enrich
ment or its withdrawal, and this at first seemed
inconsistent with the zooplankton sensitivity (elevation)
observed in enriched mesocosms. However, zooplanktivorous
fish were present in the model and not in mesocosms, and
they contributed to the lower levels of zooplankton in the
simulations. Thus the observed lower enrichment effects in
the model were not unreasonable.
The above conclusions help to address some topics from
the Introduction. First, wading birds can recycle and im
port substantial quantities of nutrients to an aquatic
ecosystem, and these nutrients can enhance higher trophic
levels, even after the birds have left. Second, by enhanc
ing higher trophic levels, such birds might increase their
own food supplies, thereby having a positive indirect in
fluence on themselves, via the ecosystem. This considera
tion remains speculative but intriguing, and could make
worthwhile future research on indirect effects in food webs.
Third, results support the general importance of indirect
effects in aquatic ecosystems. For instance, indirect ef
fects of birds on phytoplankton (via sediments) were
substantial, and supported the notion that time-delayed in
direct effects can be significant in themselves and impor
tant to other components of an ecosystem.

157
Another interesting finding is that, contrary to a com
mon belief, biotic production in blackwaters is substantial,
and that enrichment can readily increase it. Rather than
demonstrating low production as a result of low light
penetration or low pH (Janzen 1974, Fittkau et ale 1975,
Araujo-Lima et ale 1986), the unenriched blackwater system
evidenced substantial invertebrate production, as determined
from levels of predation by fishes (Chapter 4).
Furthermore, residual enrichment from wading birds ap
parently stimulated primary producers, invertebrates and
fish to even greater levels of productivity. Such results
help to bolster the hypothesis of Freeman and Freeman
(1985), that such blackwaters have substantial secondary
productivity.
The marsh. ecosystem took up much of the biogenic fer
tilization from birds, and released it only gradually.
Sediment available P and simulated benthic P were elevated
for years (Chapters 3 and 5). These results support the
conclusions of others (e.g., Ewel and Odum 1984, Dolan et
ale 1981, Richardson and r~rshall 1986, Howard-Williams
1985) that wetlands can indeed absorb wastes, primarily via
sediments. On the applied side, wetlands have been sug
gested for natural treatment of sewage. The results
described here indicate a sizeable capacity to buffer pulses
of sewage nutrients, by time-delayed release to downstream
ecosystems.
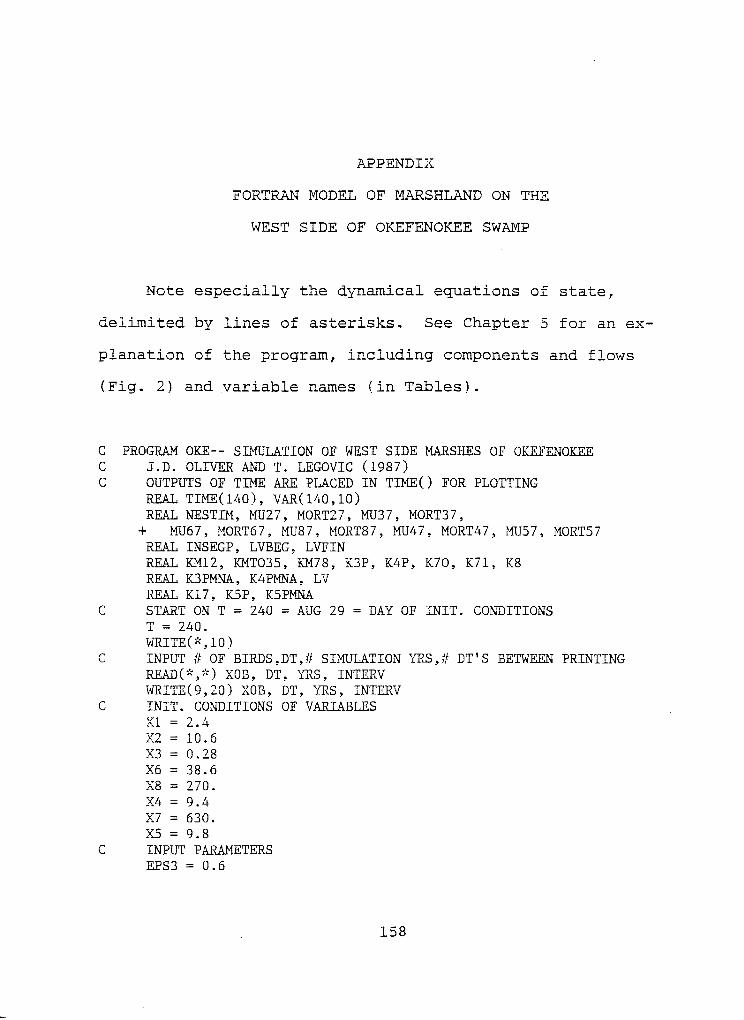
APPENDIX
FORTRAN MODEL OF ~JlliSHLAND ON THE
WEST SIDE OF OKEFENOKEE SWAMP
Note especially the dyp~cal equations of state,
delimited by lines of asterisks. See Chapter 5 for an ex-
planation of the program, including components and flows
(Fig. 2) and variable names (in Tables).
C PROGRAM OKE-- SIMULATION OF WEST SIDE MARSHES OF OKEFENOKEE C J.D. OLIVER AND T. LEGOVIC (19S7) C OUTPUTS OF TIME ARE PLACED IN TIME () FOR PLOTTING
REAL TIME(140), VAR(140,10) REAL NESTIM, MU27, MORT27, MU37, MORT37,
+ MU67, MORT67, MUS7, MORTS 7 , MU47. MORT47, MUS 7 , MORTS7 REAL INSEGP, LVBEG. LVFIN REAL KM12, KMT03S, KM7S, K3P, K4P, K70, K71, KS REAL K3PMNA, K4PMNA, LV REAL K17, KSP, KSPMNA
C START ON T = 240 = AUG 29 = DAY OF INIT. CONDITIONS T = 240. WRITE(*,10)
C INPUT II OF BIRDS ,DT, II SIMULATION YRS, iF DT I S BETWEEN PRINTING READ(*,*) XOB, DT, YRS, INTERV WRITE(9,20) XOB. DT, YRS. INTERV
C INIT. CONDITIONS OF VARIABLES Xl = 2.4 X2 = 10.6 X3 = 0.28 X6 = 3S.6 XS = 270. X4 = 9.4 X7 = 630. XS = 9.S
C INPUT PARAMETERS EPS3 = 0.6
158

EPS67 = 0.642 EPS47 = 0.55 EPS57 = 0.8 K17 = 0.005 K8 = 1300. K70 = 0.0025 K71 = 0.0022 KM12 = 9.6 KM78 = 405. KMT035 = 2.4 MU27 = 0.12 MU37 = 0.02 MU67 = 0.005 MU87 = 0.0011 HU47 = 0.002 MU57 = 0.002 TAUl2 = 0.5 TAU23 = 0.78 TAU36 = 0.0039 TAU34 = 0.034 TAU4IA = 0.00078 TAU46 = 0.0227 TAU44 = 0.023 TAU73 = 0.019 TAU78 = 0.047 TAU7S = 0.28 TAU56 = 0.0242 TAU54 = 0.034 WET12 = 1.068 THET71 = 1.05 THET78 = 1.024 THET06 = 1. 081
C THTL~= METAB. TEMP. COEF. USED AS FOOD-TO-INVERT. TEMP. COEF. THTL~ = 1.052
C TOTAL P FROM RAIN = 570 HG M*~~-2 YR*~~-l RAINP :::: 570.
C FIDSYS = FLOW FROM ID (PRECIP.) TO THE SYSTEM FIDSYS :::: RAINP/365.
C FRACTION OF RAIN P wtllCH IS SRP AMTSRP :::: 0.072 FID1 = A11TSRP~':FIDSYS
C REMAL~L~G P GOES TO DETRITUS. X7 FID 7 :::: (1. 0 - AMTSRP) ~':FIDSYS
C EXTRCP = ESTIMATED PLANT-EXTRACTABLE P / DETRITUS P EXTRCP = 0.0193 EDIFRC = 0.01
C P IN DEPOSITED CARN. INSECT EGGS:::: 9.4 MG W'd:-2 * 2% /YR INSEGP :::: 0.19
C CARN. INSECTS DEPOSIT EGGS FROM T = DAY DEPBEG TO DEPFL~ DEPBEG :::: 120. DEPFL~ :::: 180.
159

DEPDAY = DEPFIN - DEPBEG + 1. FIASYS = INSEGP!DEPDAY
C INSECTS LEAVE FROM LVBEG TO LVFIN LVBEG = 90. LVFIN = 243. BRDBEG = 135. BRDFIN = 239.
C P PER BIRD = 0.0055 MG M**-2 D~b':-1
PPERB = 0.0055 BRDSRP = 0.0026 CYPRSP = 13. FIC7 = CYPRSP!365.
C ALPH3P= REFUGE LEVEL BELOW WHICH X3 FREE FROM PRED. = .5*X3 ALPRJP = 0.14
C K3P= LEVEL OF X3 THAT SATIATES ITS PREDATORS I FEED RATES=2*X3 K3P = 0.56 K3PMNA = K3P - ALPH3P ALPH4P = 4.7 K4P = 18.8 K4PMNA = K4P - ALPH4P ALPHSP = 4.9 KSP = 19.6 KSPMNA = KSP - ALPHSP ZPSRP = 0.48 PI = 3.1416
C INITIALIZE COUNTER FOR PRODUCTION OF X6 TO 0 PROD6 = O.
C CALCULATE if OF ITERATIONS OF FORMULA TO RUN TMAX = YRS*365. ITERAT = IFIX(TMAX/DT) + 1
C INITIALIZE COUNTERS IPRINT, N, & NY, USED IN PLOTTING IPRINT = 0 N = 0 NY = 9 WRITE(9,60)
C RUN ITERATIONS OF FORMULA DO 2 1=1. ITERAT
C CHECK WHETHER IT IS BIRD NESTING TIME OR NOT NESTD1 = O. IF(T .GE. BRDBEG .AND. T .LE. BRDFIN) NESTll1 = 1. DEP = O. IF (T .GE. DEPBEG .&~. T .LE. DEPFIN) DEP = 1. LV = O. IF (T .GE. LVBEG .&~. T .LE. LVFIN) LV = 1.
C CALCULATE AVERAGE DAILY TEY~. & T~~.- 20 C T~~ = 18.7 - 9. 50 i:SIN(2. *PP':T!365. + 0.599) TEMN20 = TEMP - 20. EDIBL7 = EDIFRC:~X7 EXTRC7 = EXTRCP*X7 F10N2 = X1!(fu~12 + Xl) F20N3 = X2!(KMT035 + X2) F30NP = DIM(I.0, DL~(K3P,X3)!K3PMNA)
160

F80N8 = (K8 - X8) /K8 F40NP = DIH(1.0, DIH(K4P,X4)/K4PMNA) F70N35 = EDIBL7 /(KMT035 + EDIBL7) F70N8 = EXTRC7 /(~178 + ~XTRC7) F50NP = DIH( 1. 0, DIH(K.5P ,X5) /K.5PMNA) FIB1 = PPERB*XOB*NESTIH *BRDSRP FIB7 = PPERB*XOB*NESTIH *(1.0 - BRDSRP)
C FLOW FROM IA TO X4 = EGGS TO MARSH SYS. DURING DEPOSITION FIA4 = FIASYS:':DEP Fl2 = TAU12*X2*THETI2~':~':TEMN20 *F10N2 Fl7 = K17~':X1
F23 = TAU23~':X3*THTINV~b':TEMN20 *F20N3 F36 = TAU36*X6*THET06*~':TEMN20 ~':F30NP
F34 = TAU34*X4*THTINV~':*TEMN20 ~':F30NP F4IA = TAU4IA~':X4:':LV
F46 = TAU46*X6*THET06**TEMN20 *F40NP F44 = TAU44*X4*THTINV**TEMN20 *F40NP
C F70 = LOSS FROM BENTHIC DETRITUS TO OUTFLOW F?O = K70*X7 F71 = K71*X7*THET71**TEMN20 F73 = TAU73*X3*THTINV**TEMN20 *F70N35 F78 = TAU78*X8*THET78**TEMN20 *F80N8 *F70N8 F75 = TAU75~':X5*THTIN'.,r**TEMN20 *F70N35 FS6 = TAUS6*X6*THET06**TEMN20 *FSONP FS4 = TAU54*X4*THTL~**TEMN20 *F50NP EGES3 = (F23 + F73):':EPS3 EGES31 = ZPSRP~':EGES3
EGES37 = (1.0 - ZPSRP)*EGES3 EGES67 = (F36 + F46 + F56)*EPS67 EGES47 = (F34 + F44 + F54):':EPS47 EGES57 = F7S*EPS57 MORT27 = HU27*X2 HORT37 = HU37:':X3 MORT67 = MD67*X6 MORT87 = HU87~~X8 MORT47 = ~fJ47:':X4
MORT57 = ~1U5 7~':X5 IF(I .EQ. 1) GO TO 1
C EULER FORHULA FOR CALCULATL\lG CHANGES IN X I S C****************************************************************
DX1 = DT*(FIDl + FIBI + EGES31 + F71 - Fl2 - F17) DX2 = DT~~(FI2 - F23 - MORT2?) DX3 = DT*«F23 + F73)*(1.0 - EPS3) - F36 - F34 - MORT37) DX6 = DT)':«F36 + F46 + F56)*(1.0 - EPS6?) - MORT6?) DX8 = DT*(F78 - MORT87) DX4 = DT*(FIA4 + (F34 + F44 + F54)*(1.0 - EPS47) - F4IA - F46
+ - F44 - MORT47) DX? = DT~':(FID7 + FIB7 + FIC7 + Fl7 + EGES37 + EGES67 + EGES47
+ + EGESS7 + MORT27 + MORT37 + MORT67 + MORT87 + HORT47 + + MORT57 - F70 - F7I - F73 - F78 - F75)
DX5 = DT~':(F7S*(1.0 - EPS5?) - FS6 - FS4 - MORT5?) C****************************************************************
161

DPROD6 = DT*(F36 + F46 + FS6)*(1.0 - EPS67) Xl = Xl + DX1 X2 = X2 + DX2 X3 ::; X3 + DX3 X6 ::; X6 + DX6 X8 = X8 + DX8 X4 ::; X4 + DX4 X7 ::; X7 + DX7 XS ::; X5 + DXS PROD6 ::; PROD6 + DPROD6 T = T + DT
C AFTER END OF YEAR, DAY ::; 0 + DT IF(T .GT. 365.) T ::; DT IPRINT = IPRINT + 1 IF(IPRINT .LT. INTERV) GO TO 2
1 WRITE(9,lOO) T, TEMP~ F75, F56, F73~ F54, + F34
C INFO. FOR "PLOTER" SUBROUTINE N = N + 1 TIME(N) = T VAR(N,l) = Xl VAR(N,2) = X2 VAR(N,3) = X3 VAR(N,4) = X4 VAR(N,S) = X5 VAR(N,6) = X6 VAR(N,7) = X7 VAR(N,8) = X8
C PLOT ANNUAL PRODUCTION OF X6 AS X9 VAR(N,9) = PROD6 INTEGT = IFIX(T) IF(INTEGT .EQ. 240) PROD6 = O. IPRINT = 0
2 CONTINUE 10 FORMAT(27H ENTER XOB, DT, YRS, INTERV. I, I) 20 FORMAT(1H, I. 3SH THIS RUN I S SIMULATED If OF BIRDS IS , F8. 0,
+ 1H;, 24H THE VALUE OF DELTA T IS , F8.3, I. + 29H THE FINAL VALUE OF TIME IS , F8. 3, 4H YRS ,I, + 28H PRINTING INTERVAL IS EVERY ,IS, 10HTH DELTA T , + /)
60 FO~MAT(lH ,I, 39H DAY TEMP F75 F56 + 34H F73 FS4 F34) /)
100 FORMAT(F7.1, F7.1, SF12.S) CALL PLOTER(VAR,NV,N,TIME) STOP END SUBROUTL~E PLOTER(VAR,NV,N,TIME)
C PLOTTING SUBPROGRAM C INPUT NUMBER OF VARIABLES, NUMBER OF OUTPUT VALUES, & TIME
REAL MIN, HAX DIMENSION PICT(60),MIN(10),MAX(10),VAR(140,10),TIME(140)
162
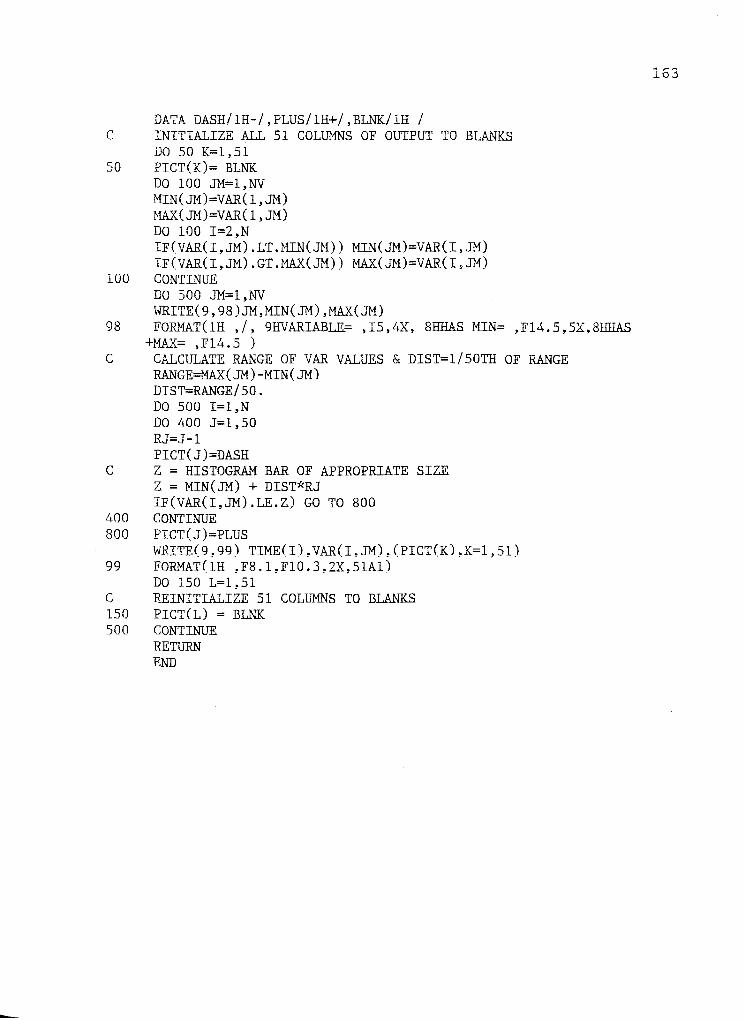
DATA DASH/1H-/,PLUS/1H+/,BLNKj1H / C INITIALIZE ALL 51 COL~rnS OF OUTPUT TO BLANKS
DO 50 K:1,51 50 PICT(K): BLNK
DO 100 111:1,NV MIN(J11):VAR(l,J11) MAX(J11):VAR(l,J11) DO 100 I:2,N IF(VAR(I,J11).LT.MIN(J11)) MIN(J11)=VAR(I,J11) IF(VAR(I,J11) .GT .MAX(J11)) MAX(J11):VAR(I, J11)
100 CONTINUE DO 500 J11:1,NV WRITE(9,98)J11,MIN(J11),MAX(JM)
98 FORMAT(lH ,/, 9HVARIABLR: ,I5,4X, 8HHAS MIN= ,F14.5,5X,8HHAS +MAX: ,F14.5 )
C CALCULATE RANGE OF VAR VALUES & DIST:1/S0TH OF RANGE RANGE=MAX(J11)-MIN(JM) DIST:RANGE/50. DO 500 I:1,N DO 400 J:1,50 RJ:J-1 PICT(J):DASH
C Z : HISTOGRAM BAR OF APPROPRIATE SIZE Z : MIN(J11) + DIST*RJ IF(VAR(I,J11).LE.Z) GO TO 800
400 CONTINUE 800 PICT(J):PLUS
WRITE(9,99) TIME(I),VAR(I,J11),(PICT(K),K:1,51) 99 FORMAT(lH ,F8.1,F10.3,2X,51A1)
DO 150 L:l,51 C REINITIALlZE 51 COLUMNS TO BLANKS 150 PICT(L): BLNK 500 CONTllWE
RETURN END
163