EFFECT OF CROP GEOMETRY ON
GROWTH AND YIELD UNDER DIRECT
SEEDED HYBRID RICE (Oryza sativa L.)
CULTIVARS
THESIS SUBMITTED IN PARTIAL FULFILMENT OF THE REQUIREMENTS FOR THE DEGREE OF
Master of Science (Agriculture)
in
Agronomy
DEPARTMENT OF AGRONOMY INSTITUTE OF AGRICULTURAL SCIENCES
BANARAS HINDU UNIVERSITY
VARANASI-221 005
INDIA
I.D. No. A-14005 2016 Enrolment No. 367668
Supervisor Prof. M. K. Singh
Submitted by
Ajoy Das

Dedicated to My Beloved Parents

[Title]
Ref. No. ……... Date: …................
To,
The Registrar (Academic),
Banaras Hindu University, Varanasi- 221 005 (India)
Through:
The Head,
Department of Agronomy, Institute of Agricultural Sciences,
Banaras Hindu University, Varanasi - 221005.
Dear Sir,
I have great pleasure in forwarding the thesis entitled “Effect of crop
geometry on growth and yield under direct seeded hybrid rice (Oryza sativa L.)
cultivars” submitted by Mr. Ajoy Das (I.D. No. A-14005) in partial
fulfillment of the requirements for the degree of Master of Science (Agriculture) in Agronomy.
I certify that the work has been carried out under my guidance and the
data forming the basis of this thesis, to the best of our knowledge are
original and genuine and no part of the work has been submitted for any
other degree or dissertation.
Thanking you.
FORWARDED Yours faithfully,
(M. K. Singh)
Head (Supervisor)
Dr. M. K. Singh
Professor Phone: + 91-542-6702417 (O)
Mobile: + 91-9452301027
Fax: + 91-542-2368381
E-mail: [email protected]
Department of Agronomy
Institute of Agricultural Sciences
Banaras Hindu University
Varanasi (U.P.)-221 005, INDIA

Effect of crop geometry on growth and
yield under direct seeded HYBRID rice
(Oryza sativa L.) cultivars
By
Ajoy Das
Thesis submitted in partial fulfilment of the requirements for the degree of
MASTER OF SCIENCE (AGRICULTURE) IN
AGRONOMY
DEPARTMENT OF AGRONOMY
INSTITUTE OF AGRICULTURAL SCIENCES
BANARAS HINDU UNIVERSITY
VARANASI – 221 005
I.D. No. A-14005 2016 Enrolment No. 367668
APPROVED BY ADVISORY COMMITTEE
CHAIRMAN: Dr. M. K. Singh Professor
Department of Agronomy
MEMBERS : Dr. M. K. Singh Assistant Professor
Department of Agronomy
Dr. Vijai. P.
Assistant Professor
Department of Plant Physiology
EXTERNAL EXAMINER:

With the deep sense of devotion I bow and pray to the feet of Lord Viswanath Ji, Lord Hanuman Ji and my guru Sri Sri Thakur Anukul Chandra, who provided me choicest, everlasting blessing to get an opportunity to study in Banaras Hindu University, the dream of Bharat Ratna Mahamana Pandit Madan Mohan Malviya Ji, a great patriot, nobleman and patriarch of this university.
At the outset I would like to express my profound sense of reverence and indebtness to my Supervisor, Dr. Manoj Kumar Singh, Professor, Department of Agronomy, Institute of Agricultural Sciences, Banaras Hindu University for his meticulous guidance, compassionate initiation, congenial discussion, constructive criticism and soothing affection during the course of this investigation and preparation of this manuscript. It was a matter of sheer luck and opportunity to work under his guidance.
I offer my heartfelt gratitude to members of the advisory committee Dr. M. K. Singh, Assistant Professor, Department of Agronomy and Dr. Vijai. P, Assistant Professor, Department of Plant Physiology, Institute of Agricultural Sciences, Banaras Hindu University for their critical suggestion, impeccable and benevolent guidance.
My profound gratefulness and thanks are to Dr. Ravi P. Singh (Director), and all the respected teachers of the Department of Agronomy, for their valuable suggestions and criticism during the course of this study.
I express my sincere thanks to Dr. Avijit Sen, Professor and Head, Department of Agronomy, Institute of Agricultural Sciences, Banaras Hindu University, for providing all facilities needed for completion of the research work.
I express my sincere thanks to Mr. Nandu Ram Yadav, Mr. Manoj kumar Yadav, Mr. Vijay Pratap Singh, Mr. J.C.N. Tripathi and Mr Shyam Sundar of Department of Agronomy Institute of Agricultural Sciences, Banaras Hindu University and research scholars, of the Department of Agronomy, for their helping hands, encouragement and cooperation during the tenure of my studies and research work.
Words with me are insufficient to express my fillings of my heart to acknowledge and gratitude to my bellowed Father Shri Anup Kumar Das, mother Smt. Jayasree Das and other family members who are providing all kind of help of need.
My friends Suman Mondal, Arghya Chattopadhyay, Shoumik Saha, Aloke kumar Sonkar, Sandeep Chahar, Swant Sandeep Narayan, Ritesh Parihar, Deshraj Yadav, Jyoti prakash Mishra, Abhishek Singh, Abhishek Sori, Awadesh Singh, Ankesh Kumar, Swati
Acknowledgement

Swamprabha Pradhan, Twinkle Jena, Anwesha Dalbehera, Puja, Puja Kumari and other deserves my appreciation for their cooperation and help at various stages of the investigations.
I express my deep and warm feelings of gratitude to my seniors, Mr. Pratik Sanodia, Mrs. Mona Nagargade, Mr. Gaurav, Mr. Hemraj Meena and Vishal Tagyi for their vital support and sparing their valuable time to complete this manuscript.
I also obliged to Mr. Rahul Sadhukhan, Snehashis Karmakar, Anurag Singh and all my juniors. Last but not the least, I record my sincere thanks to all beloved and respected people who helped and could not find separate mentions. I still solicit their benediction to proceed at very step of respected destined life.
Before pen down, I once again confess that I do not know how to acknowledge the help and co-operation of my Supervisor, members of advisory committee, family members and relatives, seniors, juniors, colleagues but above feeling are followed from the core of my heart in the shape of words and as gospel of truth.
It’s like drop in the ocean by my all regards to lord Hanuman and Shyam Ji, Goddess Maa Saraswati and Maa Laxmi for providing me energy and patience without which I would have been none.
Date:
(Ajoy Das)
Department of Agronomy Institute of Agricultural Sciences
Banaras Hindu University Varanasi-221 005, India
CONTENTS
Chapter No.
Particulars Page No.(s)
Chapter I Introduction 1-3
Chapter II Review of Literature 4-23
Chapter III Materials and Methods 24-41
Chapter IV Experimental Findings 42-57
Chapter V Discussion 58-64
Chapter VI Summary and Conclusion 65-67
Bibliography i-xii
Appendix

Abbreviations and
Symbols Used
% Per cent
/ Per
@ At the rate
B: C Benefit cost ratio
C.D. Critical difference
cm Centimeter
d.f. Degree of freedom
DAS Days after sowing
dSm-1 Deci siemen per meter
e.g. For example
EC Electrical conductivity
et al. And others
Fig. Figure
FYM Farm yard manure
g Gram
ha Hectare
hrs Hours
i.e. Id est (that is)
K Potassium
kg Kilogram
m ha Million hectare
m Meter
Max. Maximum
Min. Minimum
mm Millimeter
mt Million tones
N Nitrogen
No. Number
NS Non significant oC Degree centigrade
P2O5 Phosphorus
pH Puissance de hydrogen
q Quintal
SEm± Standard error of mean
t Tonnes
viz. Namely

LIST OF TABLES AND FIGURES
List of Tables
Table. No. Particular Page No.
3.1 Meteorological data June, 2015 – November, 2015……… 25
3.2a Soil mechanical properties ……………………………………. 28
3.2b Soil chemical properties………………………………………… 28
3.2c Soil physical properties………………………………………….. 29
3.3 Cropping history of experimental field………………………… 29
3.4 Treatment details…………………………………………………… 30
3.5 Details of layout plan……………………………………………… 31
3.6 Details of field operations………………………………………… 35-36
3.7 Standard error of mean difference and t values for each of
the four types of pair comparison in Split- plot design…….
41
4.1 Effect of cultivars and spacing on plant height (cm) in
direct seeded rice……………………………………………………
46
4.2 Effect of cultivars and spacing on dry matter
accumulation (g) in direct seeded rice
46
4.3 Effect of cultivars and spacing on number of tillers m-2 in
direct seeded rice…………………………………………………… 47
4.4 Effect of cultivars and spacing on number of leaves m-2 in direct seeded rice……………………………………………………
47
4.5 Effect of cultivars and spacing on Leaf area index (LAI) in
direct seeded rice……………………………………………………
48
4.6 Effect of cultivars and spacing on chlorophyll content and
days to 50% maturity in direct seeded rice…………………...
48
4.7 Effect of cultivars and spacing on yield attributing characters in direct seeded rice………………………………….
53
4.7a Interaction effect of cultivars and spacing on panicle
length in direct seeded rice……………………………………….
53
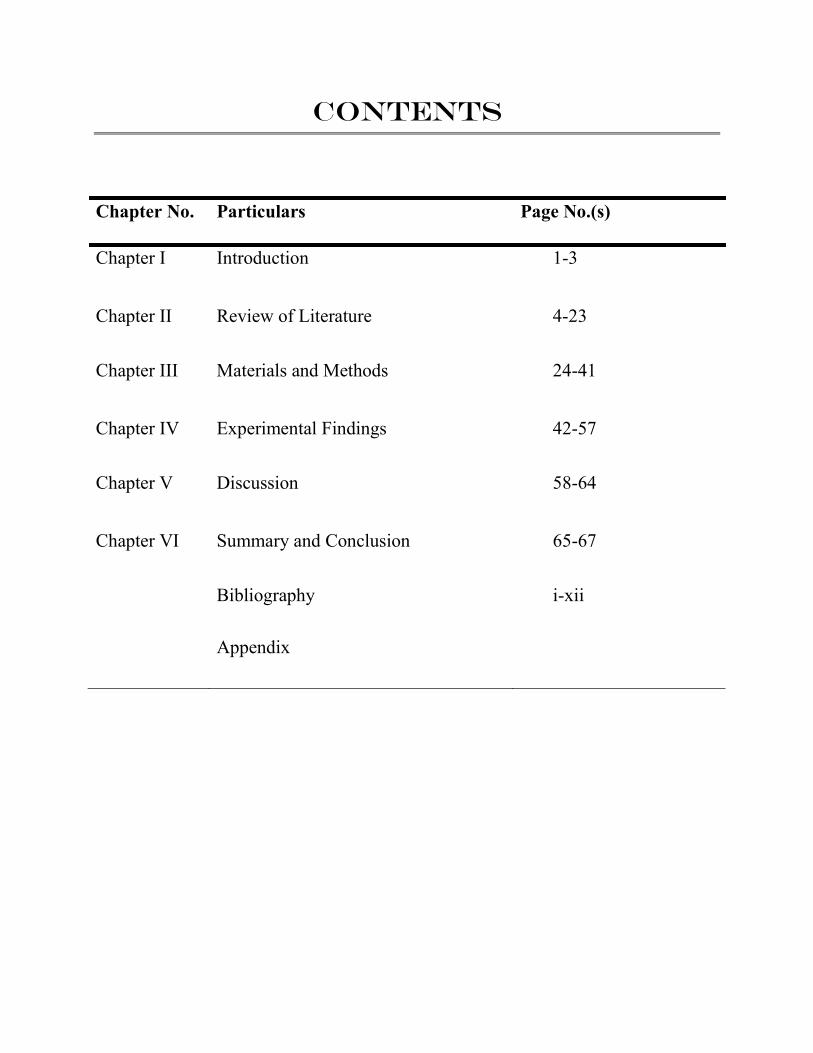
4.8 Effects of cultivars and spacing on grain yield, straw yield
and harvest index in direct seeded rice………………………..
54
4.9 Effect of cultivars and spacing on cost of cultivation, gross
return, net return, B: C ratio and production efficiency of direct seeded rice……………………………………………………
57
List of Figures
Fig. No. Particular Page No.
3.1 Meteorological data June, 2015 – November, 2015………… 26
3.2 Layout…………………………………………………………………. 32
4.8 Effect of cultivar and spacing on grain yield of direct
seeded rice……………………………………………………………
55
5.4 Effect of cultivar and spacing on production efficiency of
direct seeded rice……………………………………………………
64
Chapter I
Introduction
Rice (Oryza sativa L.) is the foremost staple food for more than 60% of the world’s
population providing major source of the food energy. It is grown in 114 countries across the
world on an area about 160 million hectares with annual production of 494.3 million tonnes, and
total supply of 711.5 million tonnes (Anonymous, 2016). Globally, total rice consumption was
recorded 491.5 million metric tonnes in 2014-15 (Anonymous, 2016). More than 90% of the
world’s rice is produced and consumed in Asia. Rice is the important crop in the country’s food
security accounting about 44% of the total food grain production and holds about 20% share in
national agricultural GDP (Anonymous, 2010) and provides 43% calorie requirement for more
than 70% of Indians. In India rice covers highest area by a single crop and it is also maximum
area among all rice growing countries. It is an important crop in India which occupied 43.9
million hectare with the annual production of 103.6 million tonnes (Ministry of Agriculture,
Directorate of Economics and Statistics, 2015). It is estimated that by the year 2025, the world’s
farmers should produce about 60% more rice than at present to meet the food demands of the
expected world population at that time and by 2035, 114 million tones additional milled rice
need to produce (Virender and Ladha, 2011).
In India, more than 70% rice is grown under rainfed condition, 9% under upland and 21%
under partially or fully irrigated conditions. Agriculture worldwide faces two major challenges,
first, it needs to enhance food production sustainably to feed a growing world population; at the
same time, this increase needs to be accomplished under conditions of increasing scarcity of
water resources (Bouman, 2009). Irrigated rice production is the largest consumer of water in
agricultural sector, and its sustainability is threatened by increasing water shortages. Such water
scarcity necessitates the development of alternative system of irrigation in (irrigated) rice
cultivation (systems) that require less water than traditional flooded rice (Bouman et al., 2005).
Rice is commonly grown by transplanting seedlings into puddled soil in Asia. This
production system is labor, water and energy intensive and is becoming less profitable as these
resources are becoming increasingly scarce (Tripathi et al., 2004). It also deteriorates the
Introduction
2
physical properties of soil, adversely affects the performance of succeeding crops and contributes
the methane emission. Also, the drudgery involved in transplanting, a job largely done by
women is of serious concern. All these factors have posed a threat to the productivity and
sustainability of rice based systems and demands a major shift from the current system of
transplanted rice production (Pandey and Velasco, 2005). In recent years, due to sever water and
labor scarcity, farmers are changing their rice establishment methods from transplanting to direct
seeding. Direct seeding offers such advantages as faster and easier planting, reduced labor and
less drudgery, earlier crop maturity, less methane emission and often higher profitability
(Thiyagarajan et al., 2002; Uphoff, 2007; and Krishna et al., 2008). The additional benefit of
DSR would be water conservation, soil temperature moderation and built up of sol organic
carbon status due to residue retention at the soil surface.
Appropriate agronomic management is a pre-requisite to make use of the full potential of
rice cultivar. Among the available technology selection of appropriate high yielding cultivar
according to specific location and region at suitable plant spacing play a crucial role in boosting
production of direct seeded rice (DSR). Selection of appropriate cultivar is the most important
factor that influences the yield of the crop. Hybrid vigor in rice is profitably used to increase its
productivity by 14-28 per cent over the available best varieties in India (Siddiqui, 1993).
Crop geometry plays a significant role for optimization of rice yield due to efficient
utilization of solar radiation as well as nutrients in direct seeded rice (Siddiqui et al., 1999).
Closer spacing hampers intercultural operations and as such more competition arises among the
plants for nutrients, air and light as a result, plant becomes weaker and thinner producing lower
yield. The crop geometry and spatial configuration exploit the initial vigor of the genotypes with
enhanced soil aeration creating congenial condition for better establishment (Shukla et al., 2014).
A planting density that can bring down the seed requirement without sacrificing productivity
would go a long way in popularizing the direct seeded rice cultivation. Since seed of hybrid
cultivar is expensive so selection of ideal plant spacing has also to be adopted for getting
optimum plant stand in the field which results in higher yield.
Cultivar and plant spacing are the imperative phenomena on which yield attributes and
yield potential of direct seeded rice crop depends. Sowing in defined row spacing produces

Introduction
3
higher yield due to better utilization of natural resources as compared to broadcasting. However,
at present, the information of appropriate spacing is not well known in direct seeded rice. Among
the various experiment conducted in country it is found that at 25× 25 cm2 spacing, number of
effective tillers and panicle weight were enhanced significantly (Anonymous, 2012).
In direct seeded rice number of panicles, grains per panicle, harvest index and test
weight significantly depends on plant spacing. It is observed that with increase in plant
population, above optimum, may decrease crop yield while on other side yield may also reduced
due to lesser plant population below optimum due to inability to intercept maximum available
light by poor plant stand (Mahajan et al., 2010). Plant spacing determines the rice stand per unit
area. The row to row spacing is one of the important agronomic practices that affect both grain
quality and quantity in the entire rice ecosystem. It is also observed that plant to plant and row to
row spacing had a significant effect on yield and yield attributing characters of direct seeded rice
(Sultana et al., 2012). Yield potential of a cultivar varies with effective utilization of solar
radiation, soil moisture and nutritional uptake from the soil and all these depends on selection of
appropriate plant spacing. At higher plant population these factors may be deficient while at
lower plant population these factors are not well utilized. Increasing plant spacing between and
within row increases light penetration in to the crop canopy, which enhance weed growth.
By considering the above facts, the present investigation entitled “Effect of crop
geometry on growth and yield under direct seeded hybrid rice (Oryza sativa L.) cultivars”
was conducted on sandy-clay-loam soil at Agricultural Research Farm, Institute of Agricultural
Sciences, Banaras Hindu University during the kharif (rainy) season of 2015 with the following
objectives:
1. To find out the effect of crop geometry on growth and yield under direct seeded hybrid rice
cultivars.
2. To work out economics of treatments under study.

Chapter II
Review of Literature
Predominantly rice remains a staple food for the two third of the world’s
population especially for south-eastern Asia, where 90 % of world population of rice is
grown and consumed as an important item of commerce since the last two decades It has
been studied by researchers in different parts of India and worldwide. Field trial was laid
out to work out the effect of crop geometry on growth and yield under direct seeded
hybrid rice cultivars under agro-ecological condition of Varanasi, Uttar Pradesh. This
chapter shows the review which has been carried in different part of country as well as
world on the context stated above.
2.1 Effect of cultivar
2.1.1 Growth attributes
Gautam et al. (2008) found that inbred aromatic rice Pusa Basmati-1 registered
significantly higher plant height than PRH-10 and Pusa Sugandh-3 at panicle initiation
and harvest stage in both the year of experimentation. It was found that rice hybrid PRH-
10 had in general higher LAI than Pusa Sugandh-3 and Pusa Basmati-1 during both the
years. They also reported significant difference due to cultivar PRH-10, Pusa Sugandh-3
and Pusa Basmati-1 at all the stages of growth with each other in accumulating total dry
matter during both the years of experimentation. PRH-10 produced the highest total dry
matter compared to the other two cultivars. They also reported that hybrid rice PRH-10
registered significantly more tillers as compared to inbred rice varieties Pusa Sugandh-3
and Pusa Basmati-1.
The field experiment was carried out by Dass and Chandra (2012) at G. B. Pant
University of Agriculture and Technology, Pantnagar found that Arize 6444 had
significantly higher plant hight than Pant Dhan 4.

Review of Literature
5
Singh et al. (2013) conducted an experiment with six rice cultivars and resulted
that out of six cultivars Pusa Sugandh 2 was found significantly superior in growth and
yield attributes over all other cultivars except Pusa Sugandh 5 which was at par in plant
height and tillers m-2 and MTU 7029 which had significantly higher yield attributes.
These results are in conformity with the findings of Singh et al. (2003). The rice cultivars
that took significantly more days to 50% flowering were MTU 7029 (91.30) as compared
to Pusa Sugandh -2 (69.30).
According to Joshi et al. (2013), the rice cultivar MTU 7029 is suitable for Eastern
Uttar Pradesh while the cultivar PRH 10 for Haryana, Punjab and Western Uttar Pradesh
under direct seeded rice.
Singh et al. (2013) found that plant height of cultivar HUR 105 was higher at 30
and 60 DAT, both in SRI and conventional rice cultivation than the MTU 7029.
Ram et al. (2014) conducted experiment during the rainy (kharif) season of 2008
and 2009 at Varanasi, found that at 60 DAT PHB 71 produce significantly higher LAI
than NDR 359.
Singh et al. (2015) found that a field experiment was conducted during kharif
2011 and 2012 at the research farm of College of Post Graduate Studies, Central
Agriculture University, Umiam, Meghalaya found that Arize 6444 and Mynri produced
significantly higher dry matter hill-1 than Sahsarang1 at all the stages of observations.
Sihag et al. (2015) found that hybrid rice cultivar PRH 10 recorded significantly
higher growth attributes viz. plant height, number of tillers m-2 and dry matter
accumulation m-1 running row at 30, 60 and 90 days after sowing. However, number of
tillers m-2 at 90 days recorded significantly higher in cultivar MTU 7209 than the other
cultivars.

Review of Literature
6
Ahamed et al. (2015) was conducted field experiment at Research Farm of the
Krishi Vigyan Kendra, Assam, Silchar in Rabi season , found that number of tillers per
hill was found to be the highest for PAC 837 at both maximum tillering and flowering
stages in all the three practices and it is at par with Arize 6444.
A field experiment was carried out by Jat et al. (2015) during the rainy (kharif)
and winter (rabi) seasons of 2012–13 and 2013–14 at Agricultural Research Farm,
Institute of Agricultural Sciences, Banaras Hindu University, Varanasi, found that
amongst rice hybrids, tillers hill-1, LAI and dry-matter accumulation hill-1 significantly
increased in ‘Arize 6444’ over ‘PHB 71’ on pooled basis, respectively. However,
significantly tallest plants were recorded with ‘PHB 71’ in comparison to ‘Arize 6444’.
2.1.2 Yield attributes
A field experiment was carried out by Gautam et al. (2008) at the Indian
Agricultural Research Institute’s Research Farm during the Kharif seasons of 2002 and
2003 and concluded that rice hybrid PRH-10 produced significantly more number of
panicles, filled grain panicle-1 than the other two inbred rice cultivars Pusa Sugandh-3
and Pusa Basmati-1 during both the years of investigations. Furthermore, the difference
in number of grains panicle-1 between Pusa Sugandh-3 and Pusa Basmati-1 was also
significant. They also reported significantly higher grain yield with rice hybrid PRH-10
than the cultivars Pusa Sugandh-3 and Pusa Basmati-1. The increase in the grain yield of
PRH-10 was 6.6 and 5.2% higher than that of produced by Pusa Sugandh-3. PRH-10 and
Pusa Sugandh-3 being statistically at par recorded significantly more straw yield than
Pusa Basmati-1 during both years of experimentation.
HUR 105 was also tested in farmer’s fields during wet-season of 2009 (a severe
drought year in UP) in frontline demonstrations. This variety showed high drought

Review of Literature
7
tolerance and had a yield advantage of 13–25% over check variety HUBR 2-1 (AICRIP,
2009). Besides having high grain yield and good cooking quality, it also tolerates
drought, bacterial leaf blight, leaf and neck blast, brown spot, and stem borers in the field.
Singh et al. (2012) conducted an experiment on impact of direct seeded rice (DSR)
over traditional method of transplanting For Resource Conservation during 2008-10 by
introducing short duration rice cultivars (Krishna Hansa, NDR-97 and PRH-10) at the
farmers’ fields of Kushinagar, U.P. Results revealed that hybrid cultivar, PRH-10 was the
most successful among all demonstrated varieties (62.35 q ha-1). The increase in yield in
demonstrated rice (62.35 q ha-1) was 48.56% as compared to local check (41.57 q ha-1).
Singh and Sen (2012) reported that the highly scented HUR105 is an erect, semi
dwarf (105–115 cm in height) variety with 130−135 days to maturity and a sturdy plant
stature, which makes it tolerant of lodging. The mean yield of three years of cultivar
HUR 105 (4.13 t ha-1) was found significantly higher than the rest of the cultivars. The
increase in yield was to the tune of 24.6% and 83.5% of Pusa Basmati 1 and Basmati 370,
respectively.
According to Dass and Chandra (2012) plants of ‘Arize 6444’ grew significantly
taller and gave higher straw yield than ‘Pant Dhan 4’. However, grain yield was similar
between two varieties. Both the varieties produced more than 6.0 t ha-1 grain under SRI
method. Under conventional method also, a non-significant difference was found.
It was found that during wet seasons, HUR 105 out yielded check variety Pusa
Basmati 1 by 24.6% over 3 years (mean basis) and showed 48.3% (Eastern region),
12.6% (Western region), 8.7% (Central region), and 10.7% (Bundlekhand region) higher
grain yield than Pusa Basmati 1. Cultivar HUR 105 out yielded check variety Basmati
370 at all locations, with an average increase of 83.6% within 3 years. The results showed
comparable performance of HUR 105 in terms of grain quality, kernel length of 6.68 mm
and kernel breadth of 2.01 mm, kernel elongation ratio of 1.51, good aroma, and very
sweet taste (Singh and Sen, 2012).
Review of Literature
8
Singh et al. (2013) reported the number of filled grains panicle-1, panicle length,
grain and straw yields as well as harvest index significantly with cultivar MTU 7029 as
compared to cultivar HUR 105.
Kumar et al. (2013) found that the grain yield of rice cultivar PRH- 10 (5.93 t ha-1)
was significantly higher than the cultivar Pusa-1460 (3.67 t ha-1) under SRI method. The
cultivar ‘PRH 10’ (aromatic hybrid variety) produced 50% higher grain yield over ‘Pusa
1460’ (basmati variety). The water productivity was significantly higher in ‘PRH 10’
(4.22 kg ha-1 mm) than ‘Pusa 1460’ (2.66 kg ha-1 mm) cultivar.
Meena et al. (2014) reported that rice cultivar HUR 105 had number of tillers hill-1
(10.22), panicle length (22.79 cm), number of panicles m-2 (280.56), number of grains
panicle-1 (125.58), test weight (23.08 g), grain yield (50.97 q ha-1) and straw yield (62.93
q ha-1).
Ram et al. (2014) conducted experiment during the rainy (kharif) season of 2008
and 2009 at Varanasi and found that PHB 71 recorded significantly higher number of
tillers hill-1 at harvest(22.7), Panicles hill-1(21.9), Grains panicle-1(168.1), 1,000-grain
weight (21.26g) than NDR 359 and also recorded significantly higher grain yield (12.6%)
and harvest index (8.0%) over ‘NDR 359’.
Sihag et al. (2015) found that cultivar PRH-10 produced significantly higher grain
yield than other cultivars However, MTU 7029 and HUR 105 were statistically at par.
According to Ahamed et al. (2015) among the varieties tested PAC 837 produced
the boldest grains with the maximum number of panicles m-2 and number of grains
panicle-1. Highest grain yield was recorded with PAC 837 (7.83 t/ha), followed by Arize
6444 (6.05 t/ha), IR-64 (5.07 t/ha), which could be attributed to their better performance
in terms of yield attributing traits as well as growth and physiological parameters.
Review of Literature
9
Jat et al. (2015) found that rice hybrid ‘Arize 6444’ gave significantly higher grain
and straw yields and showed greater potential to exploit hybrid vigor over ‘PHB 71’.
2.1.3 Economics
According to Singh et al. (2010) the net returns from the cultivation of PRH 10
was Rs. 40,090 i.e. 71% higher than those of the inbred varieties (Sarbati, PR 113, HKR
120, and NDR 359). The benefit cost ratios of both types of cultivars were quite
satisfactory, but PRH 10 was more attractive due to a higher ratio of 3:20.
Singh et al. (2012) during an experiment found that the average cost of cultivation
of demonstrated rice (PRH 10) was 16842.6 Rs ha-1 compared to 13842.67 Rs ha-1 in
local check while the net profit in demonstrated rice was 38444.90 Rs ha-1 and of local
check it was 21874.3 Rs ha-1 with a profit ratio of 1.76.
According to Dass and Chandra (2012) growing ‘Arize 6444’ involved higher cost
of cultivation mainly due to 9-fold higher cost of seed than ‘Pant Dhan 4’. This was
particularly true for raising ‘Arize 6444’ under conventional method which required
higher quantity of seed. Under conventional method, ‘Arize 6444’ due to higher
production cost largely owing to costly hybrid seed produced lower net returns than ‘Pant
Dhan 4’ by 5 × 10³ /ha.
Kumar et al. (2014) carried out a field experiment to study the economics of rice
cultivation through appropriate management of zinc at Agricultural Research Farm,
Institute of Agricultural Sciences, Banaras Hindu University during the two consecutive
kharif (rainy) seasons of 2010 and 2011. The experiment was laid out in randomized
block design with three rice varieties (HUR-105, HUBR 2-1 and PHB-71) and seven zinc
treatments. The hybrid PHB 71 showed the highest gross return of Rs. 78007 ha-1 and
79570 ha-1, however HUR 105 recorded the maximum net return of Rs. 46886 ha-1 and
Rs. 48180 ha-1 and B: C ratio 2.58 and 2.63 in year 2010 and 2011, respectively.

Review of Literature
10
Ram et al. (2014) conducted experiment during the rainy (kharif) season of 2008
and 2009 at Varanasi, found that the hybrid ‘PHB 71’ resulted in 6.5 × 10³/ha additional
net returns and significantly higher benefit: cost ratio (1.56) over inbred cultivar ‘NDR
359’.
Singh et al. (2015) was conducted a field experiment during kharif season of
2011 and 2012 at the Research Farm of College of Post Graduate Studies, Central
Agriculture University, Umiam, Meghalaya and reported that from the economic point of
view, cultivar Arize 6444 produced B:C ratio (1.68) which was significantly higher than
Sahsarang1(1.41) and Mynri (1.32).
Jat et al. (2015) found that hybrid ‘Arize 6444’ showed significantly more net
monetary advantage of over ‘PHB 71’ with high output: input ratio (2.66)
2.2 Effect of crop geometry
2.2.1 Growth attributes
Reddy and Reddy (1986) observed higher plant height under closer spacing of 10
× 10 cm2 as compared to wider spacing.
Shah et al. (1991) reported that the maximum plant height (90.2 cm) in rice
cultivar ‘K 39’ observed in closer spacing (10 × 10 cm2), whereas the plant height (83.9
cm) was in wider row spacing (20 × 20 cm2).
Maximum plant height at closer plant spacing 15 × 15 cm2 (154.9 cm) was also
reported than the wider spacing 22.5 × 15 cm2 (152.7 cm) and 30 × 15 cm2 (150.8 cm)
with an experiment conducted by Om et al. (1993) on rice cultivar ‘Basmati 370’ at Rice
Research Station, Kaul.
An experiment conducted on hybrid rice cultivar reported that at plant spacing 20
× 10 cm2 significantly higher plant height was observed than at plant spacing 15 × 10 cm2
(Geethadevi et al., 2000).

Review of Literature
11
Zhang et al. (2004) worked on transplanting density of hybrid rice at China and
found that transplanting density did not influenced plant height significantly.
As a trial carried out with rice cultivar ‘K 39’ at plant spacing of 10 × 10, 15 × 15
and 20 × 20 cm2 the result recorded that with closer spacing of 10 × 10 cm2 plant height
(90.2 cm) was found significantly higher than that of plant height (83.9 cm) with wider
spacing of 20 × 20 cm2. More number of tillers m-2 also found significantly higher with
closer spacing of 10 × 10 cm2 than with wider spacing of 15 × 15 cm2 (Kanungo and
Roul, 1994).
Budhar et al. (1989) observed that leaf area index increased with increase in plant
density. The same results also observed by Ikarashi et al. (1990) in Japan. Budhar et al.
(1989) also found that 500 plants m-2 recorded LAI of 7.4 at flowering stage whereas 200
plants m-2 recorded LAI of 3.6 at that stage.
Balasubramaniyan and Palaniappan (1991a) also found higher LAI at higher plant
population because of increased number of leaves production per unit area.
Cai et al. (1991) also concluded that closer spacing of 13.3 × 13.3 cm2 resulted in
higher leaf area index at booting stage than wider spacing of 26.6 × 13.3 cm2.
Raju et al. (1984) reported that closer plant spacing 10 × 10 cm2 produces 87.2 g
dry matter per clump lower than that of at wider spacing of 20 × 15 cm2 98.2 g dry matter
production clump-1.
Kabayashi et al. (1989) observed that dry matter production increased with higher
plant population per unit area.
Dry matter production was observed higher at closer plant spacing (10 × 10 cm2)
as compared to wider plant spacing (20 × 10 cm2 and 20 × 20 cm2) (Dhal and Mishra,
1994).
Review of Literature
12
Padmaja and Reddy (1998) conducted an experiment at Hyderabad on rice hybrid
cultivar ‘APHR 2’ and observed that closer plant spacing 15 × 15 cm2 produced
significantly higher dry matter as compared to that of wider plant spacing 20 × 15 cm2 at
all the physiological crop growth stages.
Miller (1991) observed that with increased in plant population enhanced total dry
matter production and number of tillers per unit area.
Shah et al. (1991) reported that number of tillers m-2 were more at closer plant
spacing of 10 × 10 cm2 as compared to wider spacing of 15 × 15 cm2. The same results
were also reported by Kanungo and Roul (1994).
An experiment conducted at Directorate of Rice Research (DRR), Hyderabad
revealed that rice crop at closer spacing of 15 × 15 cm2 produced higher number of tillers
m-2 and leaf area index as against wider spacing (DRR, 1991). A report of Central Rice
Research Institute (CRRI), Cuttack also supports this (CRRI, 1998).
An experiment conducted by Obulamma and Reddeppa (2002) at Southern agro
climatic zone of Andhra Pradesh on rice hybrids cultivar ‘DRRH 1’ and ‘APHR 2’
revealed that dry matter production, number of tillers m-2 and leaf area index were
highest with plant spacing 15 × 10 cm2 as compared to that of plant spacing 20 × 10, 15 ×
15 and 20 × 15 cm2.
Results of an experiment conducted at Bhubaneswar on rice hybrid ‘PA 6201’ by
Nayak et al. (2003) revealed that wider spacing of 20 × 15 cm2 recorded the maximum
total and effective tillers hill-1 and dry matter accumulation per clump as compared to
closer spacing of 20 × 10 cm2 and 15 × 15 cm2.
According to Dass and Chandra (2012) wider spacing (25 cm × 25 cm) recorded
significantly taller plants than the closer spacing (20 cm ×20 cm), due to the fact that
under wider spacing, the plants get sufficient space above the ground (shoots) and below

Review of Literature
13
the ground (roots) to grow and the increased light transmission in the canopy, leading to
greater plant height.
Sihag et al. (2015) found that plant spacing of 20 × 10 cm2 recorded higher plant
height, number of tillers m-2 and dry matter accumulation at all the growth stages
whereas, number of tillers m-2 at 90 DAS was recorded significantly higher in spacing
(25 × 25 cm2) compared to plant spacing (20 × 10 cm2 and 20 × 20 cm2).
2.2.2 Yield attributes
Srinivasan (1990) conducted an experiment at Madurai on rice cultivar ‘Bhavani’
and found that closer plant spacing of 15 × 10 cm2 produced significantly higher number
of effective tillers m-2 and dry matter production clump-1 as against the wider plant
spacing of 20 × 10 cm2 and 25 × 10 cm2. Verma et al. (2002) reported that with wider
plant spacing 20 × 20 cm2 and 20 × 15 cm2 number of effective tillers m-2 were
significantly higher than that of closer plant spacing of 20 × 10 cm2 as an experiment
conducted on rice hybrid ‘PA 6201’.
Padmaja and Reddy (1998) reported that at plant spacing 15 × 15 cm2 number of
panicles per m2 also significantly higher than that of plant spacing 20 × 15 cm2.
It was also observed that with wider plant spacing 20 × 10 cm2 number of
effective tillers hill-1 (8.95) were significantly higher than that of closer plant spacing
with 15 × 10 cm2 (7.41) and 10 × 10 cm2 (6.15) at Orissa (Patra and Nayak, 2001).
Kewat et al. (2002) observed that number of effective tillers hill-1 with wider plant
spacing 20 × 20 cm2 (9.5) were higher as compared to closer plant spacing with 20 × 15
cm2 (9.0), 20 × 10 cm2 (7.7) and 15 × 15 cm2 (8.7) in hybrid rice ‘PA 6201’ at Jabalpur.
Padmavati et al. (1998) also reported similar findings.

Review of Literature
14
Zeng (2003) revealed that higher number of panicles hill-1 and grain yield was
recorded with denser planting of 3, 30,000 holes as against 2, 50,000 holes hectare-1 in
China.
Chopra and Chopra (2004) conducted an experiment on rice at Karnal, Haryana
and found that with plant spacing of 20 × 15, 30 × 15 and paired row 20: 40: 20 cm2
recorded significantly higher number of panicles hill-1 as compared to that of closer plant
spacing of 15 × 15 cm2. However, enhanced number of panicles hill-1 was unable to reach
the level of significance in grain yield.
Pol et al. (2005) reported on ‘Sahyadri’ rice hybrid at Dapoli number of panicles
hill-1 (12.25) and panicle weight hill-1 (34.13 g) with wider plant spacing 20 × 20 cm2 was
significantly higher as compared to that with 15 × 10, 20 × 15 and 20 × 10 cm2 plant
spacing. They also reported higher grain yield with wider plant spacing of 20 × 20 cm2
significantly higher to the tune of 11.86, 7.96, and 3.40% over the spacing 15 × 10, 20 ×
10 and 20 × 15 cm2, respectively. This finding supports the finding of Dongarwar et al.
(2002).
Shukla et al. (1984) and Verma et al. (1998) observed the higher number of fertile
grains panicle-1 as well as panicle length with wider plant spacing 30 × 10 cm2 as
compared to that with closer plant spacing.
According to Srivastav and Tripathi (1998), an experiment carried out on rice
hybrid ‘PA 6201’ number of fertile grain panicle-1 was higher with closer spacing of 15 ×
10 cm2 as compared to wider spacing of 20 × 15 cm2.
Padmaja and Reddy (1998) observed that higher number of fertile spikelet panicle-
1 with wider spacing of 20 × 15 cm2 than with closer spacing of 15 × 15 cm2. Same
findings were also reported from CRRI, Cuttack with hybrid rice ‘PA 6201’ (CRRI,
1998).

Review of Literature
15
Wagh and Thorat (1987) reported significantly higher test weight with closer plant
spacing 15 × 10 cm2 than wider plant spacing 20 × 15 cm2. But on the other hand Reddy
and Reddy (1994) showed that with lower plant density test weight was significantly
higher (23.39g) than with closer plant spacing. Kanungo and Roul (1994), Trivedi and
Kwatra (1983) and Raju et al. (1984) also supported the results of Reddy and Reddy
(1994).
It was observed that more panicle length was found with wider spacing (Trivedi
and Kwatra, 1983). Krishnan et al. (1994) also found increased panicle length in wider
plant spacing of 20 × 10 cm2 than the closer plant spacing of 15 × 10cm2.
A study initiated at Central Rice Research Institute, Cuttack Orissa resulted that
the crop obtained significantly maximum plant height (70.9), effective tillers hill-1 (8.13),
LAI (5.13), leaf are duration (252.9 days), dry matter production hill-1 (34.41 g), root
volume hill-1 (26.1 cc), root weight hill-1 (3.83 g), crop growth rate (26.07 g m-2), relative
growth rate (64.79 mg g-1 day-1), net assimilation rate (7.37 g m-2 leaf area day-1) (Jena et
al., 2010).
According to Uddin et al. (2010) the plant height, total tillers hill-1 and effective
tiilers hill-1 were significantly higher with plant spacing 15 × 15 cm2 over the others.
Murthy (2011) laid out an experiment on study growth parameters, seed yield and
quality parameters of rice as influenced by promising varieties and spacing under aerobic
rice condition during Kharif 2005 and summer 2006 at ZARS, V. C. Farm, Mandya
district of Karnataka. The result shown that with a spacing of 30 × 40 cm2 plant height
(90.9 cm), number of tillers hill-1 (26.5), panicle length (19.6 cm), number of seeds
panicle-1 (200.4) and seed index (2.2 g) were significantly higher as compared to other
spacing whereas rice grown with other spacing of 30 × 15 cm2 recorded significantly
higher grain yield (47.2 q ha-1) as compared to other spacing.
Review of Literature
16
According to a trial conducted on hybrid rice at Karnataka by Geethadevi et al.
(2000), the maximum grain yield (1536 kg ha-1) was obtained with 20 × 10 cm2 spacing
as against 15 × 10 cm2 plant spacing.
A study carried out on rice hybrid ‘PRH 10’ and ‘PRH 6’ by Kumar et al. (2002)
at IARI, New Delhi revealed that thinner plant density of 25 plants m-2 had 7.6 and
17.5% higher grain yield over the 33 and 50 plants m-2, respectively.
Rajesh and Thanunathan (2003) observed that crop planted with wider spacing of
20 × 15 cm2 had significantly higher grain yield as compared to that of crop planted with
closer spicing of 20 × 10 and 15 × 15 cm2.
According to an experiment carried out by Shinde et al. (2005) on ‘Sahayadri’
hybrid rice on different plant spacing, wider row spacing of 30 cm produced significantly
higher grain (9.53 t ha-1) and straw yield (12.79 t ha-1) because of significantly higher
number of panicles m-2 (292), panicle length (25.78 cm) and test weight (26.94 g) over
the closer row spacing of 25 cm2.
According to Shah et al. (1987), closer spacing with 10 × 10 cm2 produced
significantly higher grain and straw yields as against wider spacing of 15 × 15 cm2.
Gupta and Sharma (1991) observed that plant spacing of 10 × 10 and 15 × 15 cm2
produced higher grain yield (2.86 and 2.82 t ha-1, respectively) over the plant spacing of
15 × 10 and 20 × 10 cm2 (2.67 and 2.59 t ha-1, respectively) at Jabalpur.
Balasubramaniyan and Palaniappan (1991b) reported higher grain and straw yields
with closer spacing of 15 × 10 cm2 as compared to the wider spacing of 20 × 15 cm2.
Pandey and Tripathi (2001) reported that closer plant spacing of 15 × 10 cm2 had
significantly higher grain yield over the wider plant spacing of 20 × 10 cm2.

Review of Literature
17
An experiment carried out at Hyderabad on hybrid rice ‘APHR 2’ by Padmaja and
Reddy (1998) and reported that closer plant spacing 15 × 15 cm2 obtained significantly
higher grain yield (4.57 t ha-1) than wider plant spacing 20 × 15 cm2.
Powar and Deshpande (2001) worked on hybrid rice ‘Sahyadri’ and found that
closer spacing of 20 × 10 cm2 had significantly more grain (63q ha-1) and straw yield
(162 q ha-1) than the wider spacing 20 × 20 cm2 and 20 × 15 cm2, but was at par with 15
× 15 cm2.
Kewat et al. (2002) conducted an experiment at Jabalpur on rice hybrid ‘PA 6201’
and reported that closer spacing of 20 × 10 cm2 and 15 × 15 cm2 obtained significantly
higher grain yield 63 and 60 q ha-1, respectively as against wider spacing of 20 × 20 cm-2
(47 q ha-1) and 20 ×15 cm2 (53 q ha-1).
Obulamma and Reddeppa (2002) investigated that rice hybrids ‘DRRH 1’ and
‘APHR 2’ recorded significantly higher grain yield with closer plant spacing 20 × 10
cm2 over the wider plant spacing 15 × 15 cm2 and 20 × 15 cm2.
Rao and Moorthy (2003) studied that closer spacing (15 × 15 cm2) had
significantly higher grain yield as compared to that of wider spacing (20 × 20 cm2).
Sultana et al. (2012) reported that the row to row spacing significantly influences
the yield contributing characters of rice. Number of effective tillers hill-1 and number of
sterile spikelet hill-1 were significantly influenced by row to row spacing, grain yield was
highest with 25 cm row spacing because of the improved number of effective tillers hill-1
(13.11). However, straw yield (5.56 t ha-1) and biological yield (9.89 t ha-1) were obtained
significantly higher in 20 cm row spacing.
Rautaray (2007) initiated a study at Gerua and Kamrup, Assam to evaluate the
effect of spacing and fertilizer dose on grain yield of rice (Oryza sativa L.) in rice - rice
cropping sequence. His study revealed that the effect of optimum row spacing and
fertilizer dose on grain yield of rice proved effective by skipping one row after every

Review of Literature
18
three rows at 15 × 15 cm2 spacing and resulted in highest grain yield (4.51 t ha-1) during
the wet season and 5.27 t ha-1 during the dry season.
Mahajan et al. (2010) recorded that increased plant density, beyond the optimal,
might lead to high dilution effect resulting in lower yield. On the other hand lower yield
at less than optimal densities is probably due to the inability to intercept maximum
available light due to poor stand establishment. In fact intra specific competition due to
different seeding densities may vary in their intensity and compensatory growth of
individual plant, when grown at lower densities and it resulted in similar grain yield over
a broad range of densities.
An experiment conducted by Banarjee and Pal (2011) at Regional Research Sub
Station of Bidhan Chandra Krishi Viswavidyalaya, West Bengal to assess the response of
hybrid rice cultivar ‘Pro Agro 6201’ to planting geometry. The study concluded that
different plant spacing had an outstanding influence on more or less all the yield
attributing characters and crop yield. Panicle length, filled grains panicle-1 and test weight
increased significantly with the closer spacing of 15 × 15 cm2 and produced significantly
higher yield (6.00 t ha-1).
A study carried out at Agronomy Field Unit, University of Agricultural Sciences,
G.K.V.K., Bangalore on the effect of spacing and genotypes on growth and yield of
aerobic rice. The results revealed that plant spacing of 45 cm recorded panicle length (22.
cm), number of grains panicle-1 (195.8) and grain yield (57.3 q ha-1) significantly higher
compared to other spacing (Basavaraja et al., 2010).
According to Bozorgi et al. (2011) for experiment at Lahijan on the effect of plant
geometry on yield and yield attributes of rice. The rice cultivar ‘Hashemi’ tested with
three levels of viz. 15 × 15, 20 × 20 and 25 × 25 cm2 with three levels of number of
seedlings hill-1 viz. 1, 3 and 5 seedling hill-1. The maximum grain yield (3415 kg ha-1)
among plant spacing levels was found with 15 × 15 cm2.

Review of Literature
19
Jalil (2008) affirmed that the rice cultivar BRRI Dhan 29 recorded the highest
grain yield (5.87 t ha-1) with 25 cm row to row spacing as against grain yield (4.3 t ha-1)
with 20 cm row to row spacing under aerobic cultivation. However, lower straw yield
(5.45 t ha-1) and biological yield (9.82 t ha-1) were obtained from 25 cm row spacing.
Jena et al. (2010) conducted a research at CRRI, Cuttack Orissa, India and found
significantly higher panicle length (26.1 cm), fertile spikelet panicle-1 (106.7), test weight
(23.07g) and grain yield (5.87 t ha-1) at plant spacing of 15 × 15 cm2.
Kandil et al. (2010), carried out a study at Dakahlia governorate, Egypt during
2000 and 2001to assess the effect of three plant spacing viz. 10 × 15, 20 × 15, 30 × 15
cm2 and five nitrogen levels viz. 0, 48, 96, 144 and 192 kg ha-1 and three harvest dates
viz. 30, 35 and 40 days after heading on productivity and quality of rice cultivar ‘Giza
177’. The result revealed that plant spacing of 20 × 15 cm2 recorded the highest panicle
length, test weight, grain yield and harvest index as well as milling, head rice percentage
and protein content.
Mondal et al. (2013) studied under sub tropical condition during the period of
December 2011 to May 2012 to evaluate the effect of spacing on assimilate availability,
yield attributes and yield of modern rice varieties. Four modern rice cultivar BINA dhan
5, BINA dhan 6, Iratom and BRRI dhan 29 were sown with three spacing 20 × 20, 20 ×
15 and 20 × 10 cm2. The results showed that wider spacing (20 × 20 cm2) had stupendous
performance in all morpho - physiological and yield attributing characters, which resulted
in highest grain yield (8.53 t ha-1).
As an experiment carried out by Sultana et al. (2012) at Bangladesh Agricultural
University, Mymensingh during November 2008 to April 2009 to study the effect of row
and hill spacing on the yield of rice cultivar BRRI dhan 45 under aerobic system of
cultivation in boro rice revealed that the crop sowing at spacing 25 × 15 cm2 obtained the
maximum grain yield (5.69 t ha-1) over the grain yield (2.11 t ha-1) obtained with spacing
20 × 25 cm2.

Review of Literature
20
Singh (1992) conducted an experiment at DRR, Hyderabad and concluded that
rice hybrid ‘TNH 1’ and ‘TNH 2’ & conventional cultivar ‘Rasi’ and ‘Jaya’ did not
significantly differ in productivity when planted at plant density of 3.3 lakh and 5.0 lakh
hills hectare-1.
Verma et al. (1988) reported that wider plant spacing (25 × 15 cm2) had
significantly higher harvest index (37.22) than with closer plant spacing (15 × 15 cm2).
Siddiqui et al. (1999) from a 2-year field study recorded significantly higher grain
and straw yields with closer spacing of 10 × 10 cm2 over the wider spacing of 20 × 10
cm2.
Patra and Nayak (2001) reported from an experiment carried out on effect of plant
spacing on rice concluded that number of panicles m-2 (615), grain yield (5734 kg ha-1)
and straw yield (6528 kg ha-1) were found significantly higher with closer plant spacing
(20 × 10 cm2) compared to wider plant spacing (15 × 10 cm2 and 20 × 10 cm2).
Verma et al. (2002) studied the effect of plant spacing (20 × 20, 20 × 15 and 20 ×
10 cm2) on rice hybrid ‘PA 6201’ at Raipur and found that spacing 20 × 15 cm2 produced
higher grain yield and harvest index over the 20 × 20 cm2 and 20 × 10 cm2 spacing.
A study conducted by Nayak et al. (2003) at Bhubaneswar with hybrid rice ‘PA
6201’ found that closer plant spacing of 20 × 10 cm2 produced significantly higher grain
yield (42.83 q ha-1) over the wider plant spacing of 20 × 15 cm2 (42.23 q ha-1) during
2000.
Gunri et al. (2004) found that closer plant spacing (15 × 15 cm2) resulted in
significantly higher panicle length, number of panicle m-2, number of fertile grains
panicle-1 and grain yield over the wider spacing (20 × 15 cm2).
According to Dass and Chandra (2012) wider spacing gave the yield advantage of
4.2% over closer spacing (5.97 t ha-1). Thakur et al. (2010) reported that during the

Review of Literature
21
ripening stage, hills with wider spacing had larger root dry weights and produced greater
xylem exudates, and transport these towards shoot at faster rates. These features
contribute to the maintenance of higher chlorophyll levels, enhanced fluorescence and
photosynthetic rates of leaves and supports important yield attributes and grain yield of
individual hill than in closely spaced plants. Straw yield was higher under wider spacing
due to higher growth.
A field experiment conducted by Mondal et al. (2013) during kharif 2010 and
2011 at the Institute of Agriculture, Visva Bharati, Sriniketan, West Bengal, India
showed that The highest grain yield (6267 kg ha-1 of PHB 71 in 2010 and 6281 kg ha-1 of
25P25 in 2011) was recorded in crop grown at high density (P3) and was closely
followed by the crop raised at medium (P2) density (6171 kg ha-1 of PHB 71 in 2010 and
6085 kg ha-1 in 2011) Both high and medium density crop produced significantly higher
grain yield than that obtained (5676 and 5637 kg ha-1 in respective years at low density
(P1). The straw yield increased steadily and significantly up to the highest plant density
(7393 and 6983 kg ha-1 in 2010 and 2011 respectively) which was significantly superior
to that obtained at other plant densities (P1 and P2).(P1, P2, P3 = Plant density m-2 25,
33, 50 accordingly)
According to Ram et al. (2014) closer spacing resulted significantly higher grain
and straw yields than wider spacing. The percentage increase in the grain yield of rice
owing to closer spacing (25 cm × 25 cm) was 12.3% over wider spacing (30 cm × 30
cm). At the closer spacing of 25cm × 25 cm, straw yield increased 7.0% over wider
spacing of 30 cm × 30 cm.
Singh et al. (2015) found that maximum effective tillers hill-1 was recorded with
planting geometry of 20 cm x 25 cm which was at par with 20 cm x 20 cm but
significantly superior over 20 cm x 15 cm and 20 cm x 10 cm. Arize 6444 recorded 71%
and 10.18% more panicle length than Shahsarang1 and Mynri. Planting geometry 20 cm
x 25 cm recorded 10.89%, 20.82% and22.86% more filled grain than 20 cm x 20 cm, 20

Review of Literature
22
cm x 15 cm and 20 cm x 25 cm. The moderate wider planting geometry of 20 cm x 20 cm
gave the highest grain yield (5.07 t ha-1) which was being at par with 20 cm x 15 cm
(4.75 t ha-1) but significantly superior over the grain yield produced at planting
geometry20 cm x 10 cm (4.50 t ha-1) and 20 cm x 25 cm (3.98 t ha-1). Planting geometry
of 20 cm x 25 cm recorded 1.6%, 12.78% and 26.26% more harvest index than 20 cm x
20 cm, 20 cm x 15 cm and 20 cm x 10 cm, respectively.
According to Sihag et al. (2015) the maximum grain yield was observed at spacing
25 × 25 cm2 and it was statistically at par with 20 × 10 cm2.
2.2.3 Economics
Power and Deshpande (2001) carried out an experiment on hybrid rice cultivar
‘Sahyadri’ and found that wider plant spacing (20 × 20 cm2) recorded the maximum net
monetary return (Rs. 23,895 ha-1) as compared to that of closer plant spacing (20 × 10
cm2 and 20 × 15 cm2) while on the other hand Kewat et al. (2002) revealed that at 20 ×
10 cm2 spacing had the maximum gross return (Rs. 42,750 ha-1) and net monetary return
(Rs. 27,665 ha-1) as well as benefit cost ratio (2.8) was recorded over the 15 × 15, 20 × 15
and 20 × 20 cm2 plant spacing with rice cultivar ‘PA 6201’ at Jabalpur.
Avsthe et al. (2009) conducted an experiment at Tandong, Sikkim and found the
highest grain yield (6.73 t ha-1), N uptake (84.3 kg ha-1), WUE (2.879 kg ha-1mm), K
uptake (84.3 kg ha-1), net return (Rs. 72,750), and benefit cost ratio (2.09) in 20 × 20 cm2
spacing in rice. The optimum spacing for cultivar ‘RCLP1-87-8’, ‘RC Maniphou-7’ and
local cultivar ‘Thulo Attey’ was 20 × 20 cm2.
Jena et al. (2010) found that the highest net monetary return (Rs. 14432 ha-1) and
B: C ratio (1.63) was obtained irrespective with plant spacing of 15 × 15 cm2.
Mondle et al. (2013) found that the hybrid rice responded well to plant density in
respect of its economics. High plant density (P3) paid the highest gross (Rs 69458 ha-1 in
2010 and Rs 68049 ha-1 in 2011) and net return (Rs 41961 ha-1 in 2010 and Rs 38605 ha-1

Review of Literature
23
in 2011) from hybrid rice and were closely followed by the crop at medium plant density
(P2). Both P2 and P3 recorded significantly greater gross and net returns than those at
low plant density (P1). The low plant density registered the lowest gross (Rs 61025 ha-1
in 2010 and Rs 61110 ha-1 in 2011) and net returns (Rs 35168 ha-1 in 2010 and Rs 32816
ha-1 in 2011). Return rupee-1 invested, however, did not vary much among the plant
densities during both the years. The results suggest the need of planting hybrid rice at a
relatively higher plant density. ). (P1, P2, P3 = Plant density m-2 25, 33, 50 accordingly)
According to Singh et al. (2015) found that among the different planting geometry
20cm x 20 cm recorded significantly higher B:C ratio over the wider spacing 25 cm x 25
cm. There was interaction effect between the cultivar and plant geometry. It shows that
the essentiality of maintaining optimum plant population for each cultivar in order to get
maximum benefit.
Sihag et al (2015) found that hybrid cultivar PRH 10 obtained higher gross return
at 20 × 10 cm2 plant spacing followed by cultivar PRH 10 at 20 × 20 cm2 and 25 × 25
cm2 and MTU 7029 at 25 × 25 cm2, respectively. PRH 10 at 20 × 10 cm2 obtained higher
net return as compared to other cultivars and plant spacing combinations followed by
cultivar MTU 7029 at 25 × 25 cm2, MTU 7029 at 20 × 20 cm2 and PRH 10 at 20 × 20
cm2, respectively and also PRH 10 at closer plant spacing 20 × 10 cm2 obtained the
maximum production efficiency over rest of the cultivars and plant spacing combinations.

Chapter III
Materials and Methods
The present experiment entitled “Effect of crop geometry on growth and yield under
direct seeded hybrid rice (Oryza sativa L.) cultivars” was initiated during Kharif season 2015
at Agricultural Research Farm of Institute of Agricultural Sciences, Banaras Hindu University,
situated under north eastern plain zone of the country. The detail account of materials used
experimental procedure employed during the course of investigation has been described in this
chapter.
3.1 Experimental site
Agricultural Research Farm of Institute of Agricultural Sciences, Banaras Hindu
University is situated at a distance of about 10 Km from the Varanasi Railway Station in the
South-east direction and lies in the north Gangetic Alluvial plain, on the left side of river Ganga.
It is located at 25°18' N latitude, 83°03' E longitude and at an altitude of 75.7 meters above the
mean sea level. It have characteristics of sub-tropical climate. In totality the selected field for
experiment represented the ideal spatial unit corresponding to textural make up and fertility
status and was well leveled with good irrigation and drainage facilities.
3.2 Climate and weather conditions
Climatologically Varanasi district enjoys is in sub tropical climate and is subjected to
extremes of weather condition i.e. extremely hot summer and cold winter. Temperature of this
region start to rises from middle of February and reaches to maximum by May to middle June.
Thus May and June are considered as hottest months of the year where maximum temperature
ranges 39oC to 43oC. The coldest month of the year is considered as January where minimum
temperature ranges 8.3oC to 13oC.
Mean annual rainfall of this region is about 1100 mm most of (85-90%) which is received
between July to end of September. While the potential evaporation rate is 1500 mm annually
thus creating a deficit of around 400 mm with 20-40% moisture deficit index.
Material and Methods
25
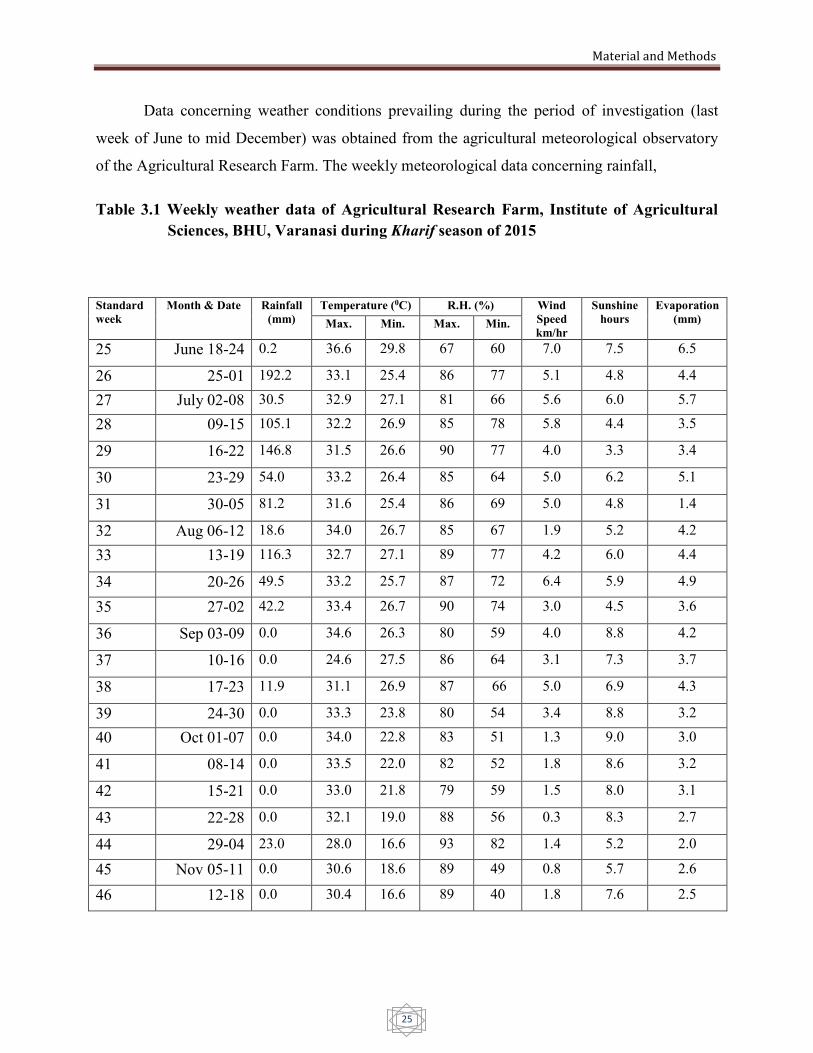
Data concerning weather conditions prevailing during the period of investigation (last
week of June to mid December) was obtained from the agricultural meteorological observatory
of the Agricultural Research Farm. The weekly meteorological data concerning rainfall,
Table 3.1 Weekly weather data of Agricultural Research Farm, Institute of Agricultural
Sciences, BHU, Varanasi during Kharif season of 2015
Standard
week
Month & Date Rainfall
(mm)
Temperature (0C) R.H. (%) Wind
Speed
km/hr
Sunshine
hours
Evaporation
(mm) Max. Min. Max. Min.
25 June 18-24 0.2 36.6 29.8 67 60 7.0 7.5 6.5
26 25-01 192.2 33.1 25.4 86 77 5.1 4.8 4.4
27 July 02-08 30.5 32.9 27.1 81 66 5.6 6.0 5.7
28 09-15 105.1 32.2 26.9 85 78 5.8 4.4 3.5
29 16-22 146.8 31.5 26.6 90 77 4.0 3.3 3.4
30 23-29 54.0 33.2 26.4 85 64 5.0 6.2 5.1
31 30-05 81.2 31.6 25.4 86 69 5.0 4.8 1.4
32 Aug 06-12 18.6 34.0 26.7 85 67 1.9 5.2 4.2
33 13-19 116.3 32.7 27.1 89 77 4.2 6.0 4.4
34 20-26 49.5 33.2 25.7 87 72 6.4 5.9 4.9
35 27-02 42.2 33.4 26.7 90 74 3.0 4.5 3.6
36 Sep 03-09 0.0 34.6 26.3 80 59 4.0 8.8 4.2
37 10-16 0.0 24.6 27.5 86 64 3.1 7.3 3.7
38 17-23 11.9 31.1 26.9 87 66 5.0 6.9 4.3
39 24-30 0.0 33.3 23.8 80 54 3.4 8.8 3.2
40 Oct 01-07 0.0 34.0 22.8 83 51 1.3 9.0 3.0
41 08-14 0.0 33.5 22.0 82 52 1.8 8.6 3.2
42 15-21 0.0 33.0 21.8 79 59 1.5 8.0 3.1
43 22-28 0.0 32.1 19.0 88 56 0.3 8.3 2.7
44 29-04 23.0 28.0 16.6 93 82 1.4 5.2 2.0
45 Nov 05-11 0.0 30.6 18.6 89 49 0.8 5.7 2.6
46 12-18 0.0 30.4 16.6 89 40 1.8 7.6 2.5
Material and Methods
26
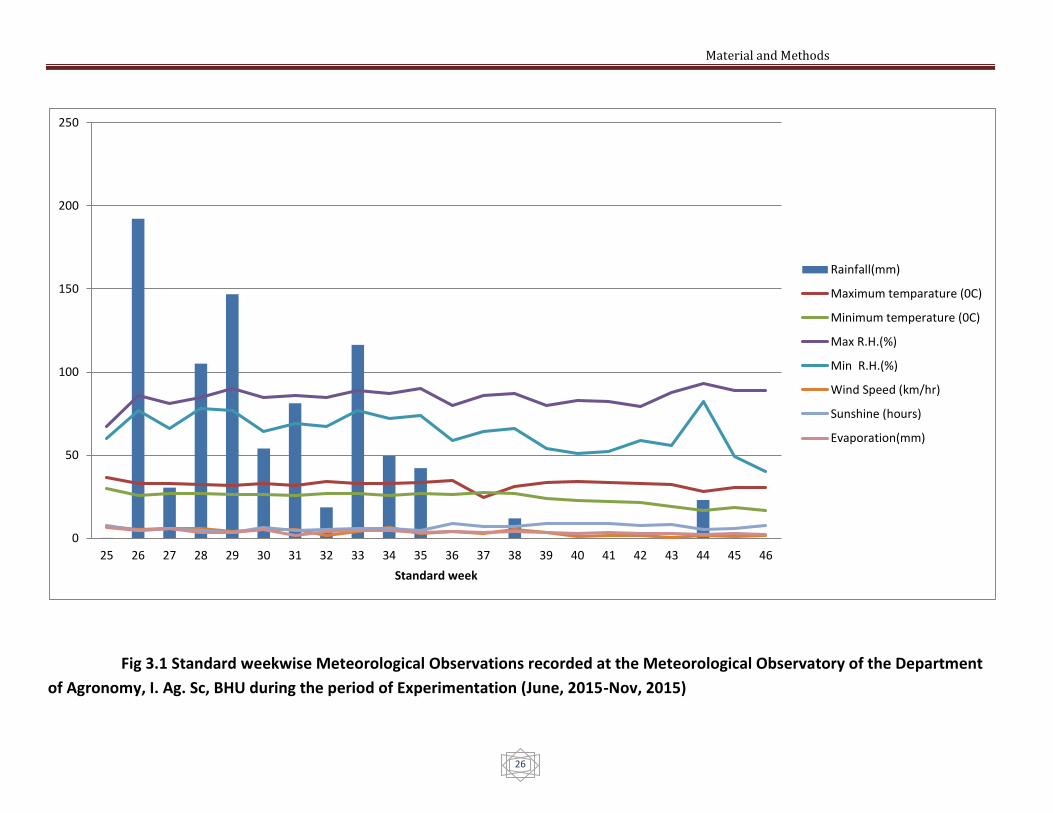
Fig 3.1 Standard weekwise Meteorological Observations recorded at the Meteorological Observatory of the Department
of Agronomy, I. Ag. Sc, BHU during the period of Experimentation (June, 2015-Nov, 2015)
0
50
100
150
200
250
25 26 27 28 29 30 31 32 33 34 35 36 37 38 39 40 41 42 43 44 45 46
Standard week
Rainfall(mm)
Maximum temparature (0C)
Minimum temperature (0C)
Max R.H.(%)
Min R.H.(%)
Wind Speed (km/hr)
Sunshine (hours)
Evaporation(mm)

Material and Methods
27
maximum and minimum temperature, relative humidity, wind speed, sunshine hours and evaporation
are presented in Table 3.1 and Fig 3.1.
3.2.1 Rainfall (mm)
Total rainfall received during kharif season 2015 during which crop was raised was recorded as
871.5 mm. The maximum rainfall recorded was 192.2 mm during the standard week 26 (25-01 June)
while minimum rainfall was recorded 0.2 mm during the standard week 25 (18-24 June).
3.2.2 Temperature (oC)
The mean temperature at the time of sowing was 33.2oC. The mean maximum temperature
begins to rise up to 34.6oC in standard week 36 (03-09 September). After that it started declining up to
46th standard week. The minimum and maximum temperature was 24.24 and 32.360C respectively.
3.2.3 Relative Humidity (%)
The maximum relative humidity during most of the time of experiment was 80-90%. The
highest maximum relative humidity recorded was 90% in standard week 29 (16-22 July) while the
lowest recorded was 67% in 25th standard week (18-25June). The highest minimum relative humidity
recorded was 82% in 44th standard week (29-04 October) while the lowest minimum was 40 in 46th
standard week (12-18 November).
3.2.4 Wind speed (km ha-1)
During the course of investigation the maximum wind velocity was 7.2 km ha-1 observed in
standard week 35 (27-02 August) while the minimum wind velocity recorded was 0.3 km hr-1 in
standard week 43 (22-28 October). The mean wind velocity recorded during the entire crop cycle was
3.6 km hr-1.
3.2.5 Sunshine hours (hrs day-1)
Length of sunshine hours at sowing time recorded was 7.5 hours day-1. The maximum sunshine
hours day-1 recorded during the investigation was 9.0 hours day-1 in standard week 40 (01-07 October)
while the minimum sunshine hours day-1 recorded was 3.3 hours day-1 during the standard week 29
(16-22 July).

Material and Methods
28
3.2.6 Evaporation rate (mm day-1)
During the period of investigation the daily evaporation rate remained minimum (1.7 mm) in
standard week 42 (15-21 October), 47 (19-25 November) and 49 (30-09 December) while the
maximum (6.9 mm) evaporation recorded in standard week 26 (25-01 June). The mean evaporation
during the crop growth cycle was recorded 3.8 mm day-1.
3.3 Soil characteristics
The soil samples were collected randomly up to 0-15 cm depth with the help of soil auger from
various plots of experiments to make a composite soil sample. The collected sample was brought in
the laboratory to analyze mechanical and physiochemical properties of soil. Soil was air dried, crushed
and passed through 2 mm sieve. The result of analyzed soil sample is shown in below presented table.
Table 3.2a Soil mechanical properties
Clay separates (%) Value Method to be employed
Sand 50.87 Hydrometer method (Bouyoucos, 1962)
Silt 24.75
Clay 24.38
Texture Sandy loam Triangular method (Lyon et al., 1952)
Table 3.2b Soil chemical properties
Particular Value Method to be employed
Soil pH (1:2 soil water suspension) 7.2 Glass electrod pH meter
Electrical conductivity (dSm-1 at 250 C) 0.21 EC meter (Jackson, 1973)
Organic carbon (%) 0.44 Walkley and Black method (Black, 1965)
Available nitrogen (kg ha-1) 206.0 Alkaline permanganate method (A.O.A.C.,
1967)
Available phosphorus (kg ha-1) 24.4 0.5 N NaHCO3 extractable Olsen’s method
(Olsen et al., 1954)
Available potassium (kg ha-1) 220.5 Flame photometer method (Jackson, 1967)

Material and Methods
29
Table 3.2c Soil physical properties
Particular Value Method to be employed
Bulk density (g cc-1) 1.43 Core sample method (Piper, 1966)
Particle density (g cc-1) 2.69 Core sample method (Piper, 1966)
Pore space (%) 46.85 Black, 1965
The above result revealed that the soil chosen for experiment falls under the category of sandy
loam texture having nearly neutral pH. Soil is low in available nitrogen and medium in available
phosphorus and potassium.
3.4 Cropping history of the experimental field
Productive capability of the soil depends on its cropping history. The detail of cropping history
of experimental field prior to the present experiment has been given in Table 3.3.
Table 3.3 Cropping history of the experimental field
Year Kharif Rabi
2015-16
2014-15
Present experimental work
Direct seeded rice
-------
Lentil
2013-14 Direct seeded rice Wheat
2012-13 Transplanted rice Wheat
2011-12 Direct seeded rice Lentil
3.5 Experimental details
3.5.1 Experimental design and treatments
The experiment was laid out in split-plot design with three replications. Five rice cultivars
(Arize 6444, PHB 71, PRH 10, MTU 7029 and HUR 105) as assigned to main plots. Each main plot
was further divided into two sub-plots to accommodate three plant spacing treatments i.e. 20 × 10 cm2
and 25×25 cm2. Random allocation of treatment was done in main plot as well as in sub plot. The
details of treatments are given in Table 3.4.

Material and Methods
30
Table 3.4 Treatment details
Treatment Symbol
A. Main plot (Cultivar)
Arize 6444 V1
PHB 71 V2
PRH 10 V3
MTU 7029 V4
HUR 105 V5
B. Sub plot (Spacing)
20×10 cm2 S1
25×25 cm2 S2
C. Combinations (Cultivar × Spacing)
ARIZE 6444× 20×10 cm2 V1S1
ARIZE 6444× 25×25 cm2 V1S2
PHB 71× 20×10 cm2 V2S1
PHB 71× 25×25 cm2 V2S2
PRH 10× 20×10 cm2 V3S1
PRH 10× 25×25 cm2 V3S2
MTU 7029 × 20×10 cm2 V4S1
MTU 7029 × 25×25 cm2 V4S2
HUR 105× 20×10 cm2 V5S1
HUR 105× 25×25 cm2 V5S2

Material and Methods
31
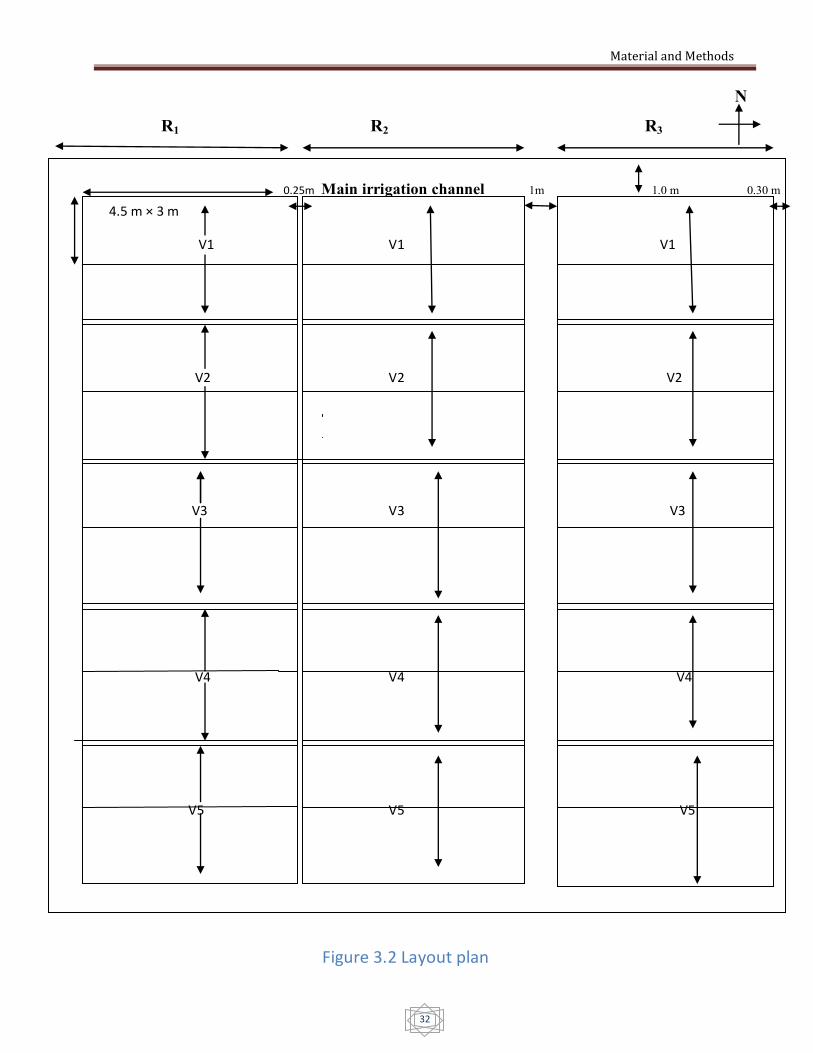
3.5.2 Particular of experiment and layout
The details of the layout are given in Table 3.5 and Fig 3.2.
Table 3.5 Details of layout plan
Experimental design Split plot design
Main plot treatments 5
Sub plot treatments 2
Treatment combinations 5×2 = 10
Number of replications 3
Total number of plots 10×3 = 30
Field border 0.5 m
Block border 0.3 m
Width of plot border 0.25 m
Width of irrigation channels 1.0 m
Gross plot size
Net plot size
5 × 3.2 m2
4.5 × 3 m2
Season Kharif
Year 2015
Material and Methods
32
N
0.25m Main irrigation channel 1m 1.0 m 0.30 m
R1 R2 R3
4.5 m × 3 m
V1
V2
V3
V4
V5
V1
V2
V3
V4
V5
V1
V2
V3
V4
V5
Figure 3.2 Layout plan
Material and Methods
33
3.6 Cultivar study
Arize 6444
Forty two rice hybrids have been released for commercial cultivation in India (Baig
2009). This includes 28 hybrids from the public sector and 14 from the private sector;
including two particularly popular hybrids (Arize 6444 from Bayer and PHB 71 from Pioneer
/DuPont, both of which are more than 10 years old).Arize 6444 was launched in 2001.
Consistently 25-30% higher yield has been reported as compared to medium duration inbred
varieties. Some important characteristics of this hybrid are medium duration (135-140 days),
medium slender grain, high productive tillers per plant (13-15), more grains per panicle (250-
300 grains panicle-1), wider adaptability, more than 70% milling.
PHB 71
It was developed by Pioneer Overseas corporation, Hyderabad in 1997.Some important
characteristics of this hybrid are medium duration (130-135 days), tall (130 cm) non-
Shattering, long slender grains with intermediate amylase (23%), low Alkali spreading value
(2.4), high milling (71%) & Head rice recovery (59%). Tolerant to Bacterial blight, Blast,
Brown plant hopper, and gall midge.
PRH 10
Pusa Rice Hybrid-10 (PRH-10) is a superfine aromatic rice Hybrid with basmati quality
developed at IARI, New Delhi, in 1998 from the cross of Pusa 6A × PRR-78. The grains are medium
long and fine with a 1000-grain weight of 20–22 g. It possesses an attractive aroma. This hybrid was
released in July 2001 for commercial cultivation in Uttaranchal, western U.P., Delhi and Haryana.
MTU 7029
It is a cross of Vasista × Mahsuri released in 1982 from Acharya N G Ranga Agricultural
University, Andhra Pradesh, India. It is a dwarf cultivar having medium slender grain, which matures
in 140 days. It is resistant to Bacterial leaf blight and tolerant to many diseases. The yield potential of
this cultivar is 55-60 q ha-1.

Material and Methods
34
HUR 105
It is a mutant variety of MPR 7-2 released in 2009 from Banaras Hindu University, Varanasi,
Uttar Pradesh, India. It is a semi dwarf variety having plant height of 100-102 cm. It matures in 130-
135 days having long slender grain. It is tolerant to leaf and neck blast. The yield potential of this
cultivar is 58-60 q ha-1.
3.7 Cultural operations
Details of all the cultural operations carried out during the investigation are described below
and the list of all the operations along with date is given in Table 3.6.
3.7.1 Field preparation
Proper field preparation is essential for healthy rice crop. The experimental field was ploughed
in the 3rd week of June after pre sowing irrigation by tractor drawn cultivator to expose the weed
rhizomes, wheat crop stubbles and harmful insect pest hidden in soil. Before sowing of direct seeded
rice a cross ploughing by the disc harrow was done after giving pre sowing irrigation. After cross
ploughing field was well leveled by the planking. The field was further divided in to experimental
plots as per layout.
3.7.2 Method of sowing
Rice cultivars were sown as per the spacing treatments with ‘kudal’ by dropping 1-2 seeds as
par spacing treatments.
3.7.3 Fertilizer application
A uniform dose of 120 kg N Ha-1, 80 Kg P2O5 and 80 Kg K2O were applied in all plots in the
form of Urea, DAP and muriate of potash (MOP). Half dose of nitrogen and full dose of phosphorus
and potassium were applied as basal application, just before sowing in rows. Remaining dose of
nitrogen was applied in to two split doses first at tillering after complete weed removal from the field
and second at panicle initiation stages. Zinc was also applied as foliar spray through zinc sulphate 5.0
kg ZnSO4 + 2.5 kg CaCO3 at 35 DAS to protect the crop from Khaira disease.
3.7.4: Irrigation

Material and Methods
35
Irrigation was given to the crop as and when needed according to crop requirement and rainfall
pattern. A pre sowing irrigation was given to facilitate proper ploughing and to maintain proper soil
moisture condition for seed germination. A light irrigation was given 2 DAS to ensure proper
germination. In direct seeded rice system water logging is not desired thus only optimum soil moisture
was maintained.
3.7.5 Weed management
(a) Hand weeding
In order to keep the experimental plot free of weeds, one hand weeding was done. Manual
weeding was done at 24 DAS when the soil moisture was suitable for easy weed removal from the soil
before the nitrogen top dressing to accelerate the better N uptake by the crop plants and avoid losses
due to weed uptake.
Table 3.6 Details of field operations
S. No. Particulars of operations Date
• First ploughing with soil turning plough for field preparation 17.06.2015
• Final field Preparation and layout 19.06.2015
20.06.2015
• Sowing 21.06.2015
22.06.2015
• Thinning and gap filling 07.07.2015
• Weed management
• Bispyribac @ 25 g ha-1 and Azimsulphuron @ 30 g ha-1 10.07.2015
• Manual weeding at 24 DAS 16.07.2015
• Fertilizer application
• Primary application (Half N + Full P2O5 + Full K2O) 17.07.2015
• First top dressing of 1/4th N 08.08.2015
• Foliar application of @ 5.0 kg ZnSO4 + 2.5 kg CaCO3 ha-1 10.08.2015
• Second top dressing of 1/4th N 10.09.2015
• Harvesting

Material and Methods
36
• PRH 10 26.10.2015
• HUR 105 04.11.2015
• PHB 71 05.11.2015
• ARIZE 6444 10.11.2015
• MTU 7029 21.11.2015
• Threshing and winnowing 09.12.2015
• Drying 12.12.2015
(b) Herbicidal application
It is well known that in direct seeded rice weeds are the major limiting factor. For management
of weeds flora Bispyribac @ 25 g ha-1 and Azimsulphuron @ 30 g ha-1 was applied 18 DAS to
control of grass, sedges and broad leaf weeds. Proper care was taken while spraying herbicide in
each plot.
3.7.6 Harvesting
Each cultivar was harvested at harvestable maturity by judging visually when above grains
became golden color and dried. Cultivar PRH 10, HUR 105, PRH 10, ARIZE 6444 and MTU 7029
was harvested at 124, 134, 135,140 and 150 DAS respectably with the help of sickle manually. First,
the border rows were harvested around all sides of individual plot leaving net plot area. The remaining
net plot area was harvested separately to record the yield separately of each plot. After harvesting it
was left in the field for 4-5 days for proper sun drying followed by bundling and tagging. Then it was
carried to threshing floor and left for sun drying to attain optimum moisture for threshing.
3.7.7 Threshing
After sun drying, bundle weight was taken to record biological yield. The weighted bundle was
threshed manually with the help of sticks and the grains of each plot were collected separately.
Collected grain was cleaned and weighed to record yield of each plot in kg ha-1.

Material and Methods
37
3.8 Observations recorded
3.8.1 Growth attributes studies
All the growth attributes characters were studied during the growth period of crop before
maturity.
3.8.1.1 Plant height (cm)
For height measurement five plants was selected randomly and tagged. Plants height was
recorded in cm with the help of meter scale at various physiological plant growth stages viz. 30, 60 and
90 DAS in each plot separately. The plant height was measured from the soil surface up to the tip of
last leaf and after panicle emergence up to tip of panicle.
3.8.1.2 Number of tillers m-2
Total number of tillers per m2 was counted by using the 1 meter quadrate at 30, 60 and 90 DAS
from each plot separately.
3.8.1.3 Number of leaves m-2
Number of functioning green leaves was counted from one m2 area with the help of one meter
quadrate at 30, 60 and 90 days after sowing of the crop.
3.8.1.4 Dry matter per meter running row (g)
For dry matter determination plants from randomly selected one meter running row was taken
by cutting from collar region of plant with the help of sickle from ground level at 30, 60 and 90 DAS.
Samples were taken from second row leaving border rows. The collected samples were completely
sun dried for 2-3 days followed by oven dried at 70oC for 48 hours to attain constant weight.
3.8.1.5 Leaf area index
Leaf area index (LAI) was measured with the help of crop leaf area meter at 30 DAS. First the
total area of leaves was measured in 50 cm running rows randomly and then it was converted into leaf
area of 1 m2 and then divided with ground area. Thus, output of LAI reading was obtained. From a
plot LAI reading was taken from five randomly places and their average of then was worked out. At

Material and Methods
38
60 and 90 DAS leaf area was measured with the help of leaf area meter. For this leaves from three hills
pulled out from each plot and area of them were measured by leaf area meter. The average of three
leaves was multiplied with total number of hills per m2. The LAI was calculated by using the
following formula.
Leaf area index (LAI) = Total leaf area (cm2)
Ground area (cm2)
3.8.1.6 Chlorophyll content
Chlorophyll content was determined with the help of SPAD meter at 60 and 90 DAS. For this
15 green healthy leaves was selected from different plants from each plot randomly and average of
them was worked out.
3.8.1.7 Days to 50% maturity
Days to 50% maturity was recorded before harvesting of the crops when color of the 50%
plants changed from green to golden yellow and panicles dried. It crop seems to 50% mature by visual
appearance.
3.8.2 Yield and yield attributes
Observations on yield attributing characters, namely number of effective tillers m-2, panicle
weight, number of grains panicle-1, panicle length and test weight were studied at maturity of crop.
3.8.2.1 Number of effective tillers m-2
Number of tillers bearing panicle was counted in a meter square with the help of 1 m × 1m
quadrate in each plot separately.
3.8.2.2 Panicle weight (g)
To work out the panicle weight 10 panicle samples was randomly selected from tagged plant
from each plot. Average panicle weight of them was worked out with the help of electronic weighing
balance in grams.

Material and Methods
39
3.8.2.3 Number of grains panicle-1
Grains of 10 randomly selected panicles were counted separately and there mean value
expressed as average number grains per panicle.
3.8.2.4 Panicle length (cm)
Length of panicle were recorded by measuring all sampled panicle from base of panicle up to
the end of terminal rachillae and average was calculated to get the mean length of panicle.
3.8.2.5 Test weight (g)
Weight of 1000 grains from each plot was taken with the help of electronic balance in grams.
3.8.2.6 Biological yield (kg ha-1)
Total produce of net plot area of each plot tied in bundles was weighed with spring balance
after complete sun drying. The result obtained in kg per net plot area was converted in kg ha-1
3.8.2.7 Grain yield (kg ha-1)
After threshing, grain yields from each plot were cleaned by winnowing and their weight was
recorded with the help of electronic balance and then converted in Kg ha-1 at 14% moisture content.
3.8.2.8 Straw yield (kg ha-1)
Straw yield was worked out by subtracting the grain yield from biological yield in kg per plot
and finally converted in kg ha-1.
3.8.2.9 Harvest Index (%)
Harvest index is the ratio of economic yield to that of biological yield and expressed in
percentage. It was calculated by using the following formula.
Harvest Index (HI) = Economical yield (grain yield) per plot
Biological yield (grain+straw)per plot × 100

Material and Methods
40
3.9 Economic studies
3.10.1 Cost of cultivation
Treatment wise cost of cultivation of each crop was worked out separately, on the basis of
inputs actually used in the field and their prevailing local market price.
3.9.2 Gross returns
The yield from experiment was converted in to gross returns in rupees based on prevailing
local market price of grain and straw.
3.9.3 Net returns
Net returns = Gross returns- cost of cultivation
3.9.4 Benefit: cost ratio
It was worked out separately for each treatment by dividing the gross return (Rs. ha-1) with the
cost of cultivation (Rs. ha-1).
3.10 Production efficiency
Production efficiency in terms of Rs. ha-1 day-1 was determined by dividing the net return to the
number of 50% days to maturity of each treatment separately.
3.11 Statistical analysis
Entire biometric data recorded during the course of investigation were compiled in proper
tables and statistically analyzed by using the standard procedures of statistical analysis for split plot
design (Gomez and Gomez, 1984) to draw a valid conclusion. Analysis of variance (ANOVA) was
used to determine the effect of each treatment. When F ratio was significant; a multiple mean
comparison was performed using Fisher’s Least Significance Difference Test (0.05 probability level)
by the use of following formula.

Material and Methods
41
Table 3.7 Standard error of mean difference and t values for each of the four types of pair
comparison in Split- plot design:
Type of pair comparison SEM t- value
1. Two main plot means (average over all √(𝐸𝑎/𝑟𝑏) ta Subplot treatments)
2. Two subplot means (average over all √(𝐸𝑏/𝑟𝑏) tb
Main-plot treatments)
3. Two subplot means at the same main- √(𝐸𝑏/𝑟) tb
plot treatments
4. Two main plot means at the same or √[{( 𝑏−1)𝐸𝑏+𝐸𝑎}
𝑟𝑏] t weighted =
( 𝑏−1)𝐸𝑏 tb+Ea ta
(𝑏−1)𝐸𝑏+𝐸𝑎
different main-plot treatments
Ea = error (a) MS, Eb =error (b) MS, r = number of replications, a = number of main-plot treatments
and b = number of subplot treatments
CD = √2 × 𝑆𝐸𝑀 × t
CD = Critical difference
t = t test values
42
Chapter IV
Experimental findings
The present investigation entitled “Effect of crop geometry on growth and yield
under direct seeded hybrid rice (Oryza sativa L.) cultivars” was conducted during kharif
(rainy) season of 2015 at Agricultural Research Farm , Institute of Agricultural Science, Banaras
Hindu University , Varanasi (U.P).In this chapter an attempt has been made to ascertain the
degree of variation exhibited by various cultivars (viz. Arize-6444, PHB-71, PRH-10, MTU-
7029, HUR-105) and crop geometry (20×10 and 25×25). The data collected during the course of
investigation has been statistically analyzed and presented in tables.
4.1 Growth attributes
Data recorded on crop growth attributes was recorded at different physiological stages of
crop viz. 30, 60 and 90 DAS. Effect of different treatments on crop growth and development are
described here.
4.1.1 Plant height (cm)
Data on plant height recorded at 30, 60 and 90 DAS and harvest due to cultivars and
spacing treatments are presented in table 4.1.
Data in the table revealed that plant height increased with advancement of crop growth.
The maximum plant height was recorded in Arize 6444 at 30, 60, 90 DAS and at harvest. Plant
height of Arize 6444 was statistically at par with PHB 71 at all the stage. At 30, 60 and 90 DAS
PHB 71 and PRH 10 were statistically at par whereas at harvest, PHB 71, PRH 10, MTU 7029
and HUR 105 were also statistically at par. Cultivar PHB 71, PRH 10 and HUR 105 had
significantly higher plant height as compared to cultivar MTU 7029 at 30, 60 and 90 DAS. But at
harvest stage MTU 7029 there were no significant differences between plant height as compared
to Arize 6444, PHB 71 and PRH 10.
Variations in plant height due to spacing treatment was non significant at all the growth
stages viz. 30, 60, 90 DAS and harvest.

Experimental Findings
43
4.1.2 Dry matter accumulation running row m-1 (g)
Data on dry matter accumulation m-1 running row recorded at 30, 60 and 90 DAS under
different cultivars and spacing treatments are presented in table 4.2.
It was clear from the data in the table that dry matter accumulation was significantly
influenced by cultivars at all the stages of observations. Significantly higher dry matter
accumulation was observed in cultivar Arize 6444 at 60 and 90 DAS. However, dry matter
accumulation m-1 running row in Arize 6444 at 30 DAS was observed statistically comparable
with PHB 71 and PRH 10. PRH 10 was statistically at par with MTU 7029 and HUR 105 at 30
DAS whereas at 90 DAS cultivar MTU 7029 and PRH 10 were statistically at par.
It was indicated from the data in the table that the total dry matter accumulation
decreased significantly at all the stags of observations with increase in crop geometry. The crop
planted with closer spacing of 20 × 10 cm2 recorded significantly more dry matter as compared
to wider spacing of 25 × 25 cm2, respectively at all the stages of observations.
4.1.3 Number of tillers m-2
Data on number of tillers m-2 was recorded at 30, 60 and 90 DAS. Data obtained on
number of tillers m-2 as influenced by different cultivars and spacing treatments are given in
table 4.3.
It was very imperative to note from the data that amongst cultivars, hybrid rice cultivar
Arize 6444 recorded maximum number of tillers m-2 at 30, 60 and 90 DAS in comparison to all
the cultivars. At 30 DAS PHB 71, PRH 10 were statistically at par whereas at 60 DAS PHB 71,
PRH 10, MTU 7029 and HUR 105 had comparable number of tillers m-2. At 90 DAS Arize
6444, PHB 71, and MTU 7029 were statistically at par. However, at 90 DAS, number of tillers
m-2 was significantly higher in cultivar MTU 7029 than PRH 10 and HUR 105 both the latter
cultivars were statistically at par.
Experimental Findings
44
At 30 and 60 DAS plant spacing (20 × 10 cm2) recorded significantly higher number of
tillers m-2 as compared to 25 × 25 cm2, whereas, at 90 DAS wider plant spacing (25 × 25 cm2)
had significantly higher number of tillers m-2 as compared to plant spacing 20 × 10 cm2.
4.1.4 Number of leaves m-1 running row
Data pertaining on number of leaves m-1 running row was recorded at 30, 60 and 90
DAS under different cultivars and spacing treatments as presented in table 4.4.
A perusal of the data in table showed that at 30 DAS cultivar MTU 7029 recorded
significantly lowest number of leaves m-1 running row. PRH 10 reached at maximum number of
leaves m-1 running row at 60 DAS and however at 90 DAS it declined. The number of
functioning leaves m-1 running row significantly varied amongst cultivars at all the stages of
observations. At 30 DAS, the maximum leaves m-2 was in Arize 6444 which was statistically at
par with PRH 10 however PHB 71 had statistically comparable number of leaves m-1 running
row as compared to HUR 105. At 60 DAS cultivar PRH 10 was statistically at par with Arize
6444 whereas PHB 71 became statistically at par with MTU 7029. At 90 DAS, cultivar Arize
6444 recorded the maximum number of leaves m-1 running row which was statistically
comparable with MTU 7029. At 30 DAS cultivar MTU 7029 recorded significantly lowest
number of leaves m-1 running row.
It was clear from the data that crop planted with 20 × 10 cm2 spacing had significantly
more number of leaves m-2 than the plant spacing of 25 × 25 cm2 at 30 and 60 DAS. However, at
90 DAS wider plant spacing recorded significantly maximum number of leaves m-1 running row
than 20 × 10 cm2.
4.1.5 Leaf area index
Data related to leaf area index at successive stages of observations influenced by different
cultivars and spacing treatments are given in table 4.5.
In general, the assimilation area over the ground area was lowest at 30 DAS which
attained the maximum value at 90 DAS under all the treatments. Significantly higher leaf area
index was obtained in cultivar Arize 6444 as compared to other cultivars at 30 and 90 DAS
however at 60 DAS it was statistically comparable with PRH 10. At 60 DAS, cultivars PHB 71

Experimental Findings
45
and HUR 105 were statistically at par whereas MTU 7029 and HUR 105 had statistically
comparable leaf area index. At 90 DAS, cultivar MTU 7029 recorded significantly higher leaf
area index than cultivar HUR 105 and PHB 71.
Narrow 20 × 10 cm2spacing obtained significantly higher leaf area index at all the stages
of observation as compared to than 25 × 25 cm2 spacing.
4.1.6 Chlorophyll content
Data on chlorophyll content in leaves recorded at 60 and 90 DAS under different
cultivars and spacing treatments are presented in table 4.6.
Data in the table indicated that rice cultivars MTU 7029 recorded significantly more
chlorophyll content in leaves as compared to other cultivars at 60 and 90 DAS. Arize 6444 was
statistically at par with PHB 71 and HUR 105 at 60 DAS, and PHB 71 was also statistically at
par with PRH 10 at 60 DAS. At 90 DAS Arize 6444, PHB 71, PRH 10 were statistically similar.
Spacing treatment failed to reach the level of significance with each other at 60 and 90
DAS.
4.1.7 Days to 50% maturity
Data portioning to days to 50% maturity as influenced by different treatments are
presented in table 4.6. It was well established fact that no. of days taken by cultivars to mature is
a genetic characteristics of genotypes. All cultivars mature almost differently and took about 112
to 141 days to mature 50 %.
Data on days to maturity was not significantly influenced by plant spacing.
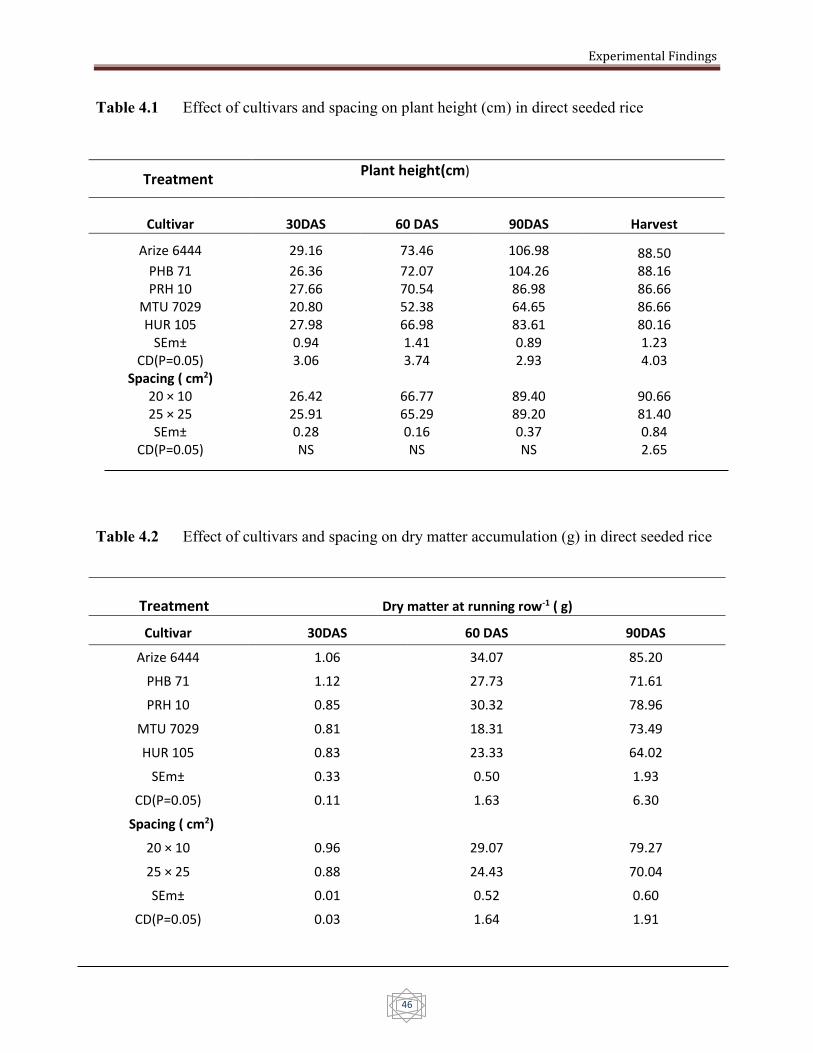
Experimental Findings
46
Table 4.1 Effect of cultivars and spacing on plant height (cm) in direct seeded rice
Treatment Plant height(cm)
Cultivar 30DAS 60 DAS 90DAS Harvest
Arize 6444 29.16 73.46 106.98 88.50 PHB 71 26.36 72.07 104.26 88.16 PRH 10 27.66 70.54 86.98 86.66
MTU 7029 20.80 52.38 64.65 86.66 HUR 105 27.98 66.98 83.61 80.16
SEm± 0.94 1.41 0.89 1.23 CD(P=0.05) 3.06 3.74 2.93 4.03
Spacing ( cm2)
20 × 10 26.42 66.77 89.40 90.66 25 × 25 25.91 65.29 89.20 81.40 SEm± 0.28 0.16 0.37 0.84
CD(P=0.05) NS NS NS 2.65
Table 4.2 Effect of cultivars and spacing on dry matter accumulation (g) in direct seeded rice
Treatment Dry matter at running row-1 ( g)
Cultivar 30DAS 60 DAS 90DAS
Arize 6444 1.06 34.07 85.20
PHB 71 1.12 27.73 71.61
PRH 10 0.85 30.32 78.96
MTU 7029 0.81 18.31 73.49
HUR 105 0.83 23.33 64.02
SEm± 0.33 0.50 1.93
CD(P=0.05) 0.11 1.63 6.30
Spacing ( cm2)
20 × 10 0.96 29.07 79.27
25 × 25 0.88 24.43 70.04
SEm± 0.01 0.52 0.60
CD(P=0.05) 0.03 1.64 1.91

Experimental Findings
47
Table 4.3 Effect of cultivars and spacing on number of tillers m-2 in direct seeded rice
Table 4.4 Effect of cultivars and spacing on number of leaves m-2 in direct seeded rice
Treatment Number of leaves m-2
Cultivar 30DAS 60 DAS 90DAS
Arize 6444 202.33 1507.80 1845.00
PHB 71 185.33 1282.30 1470.00
PRH 10 199.00 1595.30 1336.70
MTU 7029 168.83 1243.30 1838.30
HUR 105 183.16 1103.30 1553.30
SEm± 1.60 32.26 38.03
CD(P=0.05) 5.23 105.22 124.03
Spacing ( cm2)
20 × 10 213.40 1466.80 1586.66
25 × 25 162.06 1226.06 1630.66
SEm± 1.91 25.30 8.78
CD(P=0.05) 6.04 79.72 27.66
Treatment Number of tillers m-2
Cultivar 30DAS 60 DAS 90DAS
Arize 6444 97.83 452.83 492.16
PHB 71 90.00 410.50 477.33
PRH 10 86.83 430.50 461.50
MTU 7029 69.66 418.83 486.83
HUR 105 76.33 429.50 456.16
SEm± 1.03 6.56 5.90
CD(P=0.05) 3.37 21.39 19.25
Spacing ( cm2)
20 × 10 99.33 455.2 465.46
25 × 25 68.93 401.66 484.13
SEm± 0.72 2.98 19.25
CD(P=0.05) 0.72 9.40 18.33

Experimental Findings
48
Table 4.5 Effect of cultivars and spacing on Leaf area index (LAI) in direct seeded rice
Table 4.6 Effect of cultivars and spacing on chlorophyll content and days to 50% maturity in
direct seeded rice
Treatment Chlorophyll content Phenology
Cultivar 60 DAS 90DAS Days to 50%
physiological maturity
Arize 6444 37.96 37.05 134.17
PHB 71 39.25 38.76 130.83
PRH 10 40.10 37.95 112.00
MTU 7029 42.96 42.96 141.00
HUR 105 37.83 34.71 126.83
SEm± 0.69 0.68 0.63
CD(P=0.05) 2.26 2.21 2.08
Spacing ( cm2)
20 × 10 39.57 38.18 128.86
25 × 25 39.67 38.39 129.06
SEm± 0.27 0.3 0.33
CD(P=0.05) NS NS NS
Treatment Leaf area index (LAI)
Cultivar 30DAS 60 DAS 90DAS
Arize 6444 0.31 3.69 4.07
PHB 71 0.25 3.16 3.69
PRH 10 0.28 3.33 3.38
MTU 7029 0.18 2.76 3.75
HUR 105 0.21 2.94 3.40
SEm± 0.01 0.11 0.07
CD(P=0.05) 0.03 0.38 0.22
Spacing ( cm2)
20 × 10 0.28 3.50 3.92
25 × 25 0.22 2.85 3.39
SEm± 0.01 0.05 0.04
CD(P=0.05) 0.03 0.16 0.14
Experimental Findings
49
4.2 Yield attributes
Data pertaining to different yield attributing characters viz., test weight (g), number of
effective tillers m-2, number of grains panicle-1, panicle length (cm) and panicle weight (g) in
direct seeded rice (DSR) are given in table 4.7.
4.2.1 Panicle length (cm)
Data pertaining to panicle length as influenced by different cultivars and spacing
treatments are given in table 4.7.
It was obvious from the data in the table that panicle length varied significantly due to
cultivars. Amongst all the cultivars, the shortest panicle was observed in cultivar HUR 105.
However, the largest panicle was recorded in cultivar PRH 10 followed by PHB 71, Arize 6444,
MTU 7029. The panicle length of cultivar PRH 10 was significantly higher than the cultivar
PHB 71, Arize 6444, MTU 7029 and HUR 105. All cultivars are significantly different among
themselves.
Significant variations in panicle length due to plant spacing was observed significantly
longer panicle was recorded at plant spacing 25 × 25 cm2, as compared to 20 × 10 cm2.
Interaction effect of cultivars and crop geometry (Table 4.7a) on panicle length was also
significant. Crop geometry 25 × 25 cm2 recorded significantly higher panicle length as compared
to 20 × 10 cm2 in cultivar PHB 71. The wider crop geometry 25 × 25 cm2 was statistically at par
with 20 × 10 cm2 in cultivar Arize 6444, PRH 10 MTU 7029 and HUR 105.
Cultivar HUR 105 at wider row spacing (25 × 25 cm2) recorded significantly longer
panicle as compared to all combinations of cultivars and crop geometry except HUR 105 at
narrow spacing.
4.2.2 Panicle weight (g)
Data pertaining to panicle weight as influenced by different cultivar and spacing
treatments are given in table 4.7.
Experimental Findings
50
It was evident from the data that panicle weight significantly differed due to different
treatments. Amongst all the cultivars, the maximum panicle weight was recorded in cultivar
Arize 6444 which was significantly more than rest of the cultivars. Panicle weight of cultivar
PHB 71, PRH 10, MRU 7029, HUR 105 was statistically at par with each other.
Spacing treatments also caused significant variations in panicle weight. Panicle weight at
wider plant spacing 25 × 25 cm2 was significantly higher than narrow plant spacing 20 × 10 cm2.
4.2.3 Number of effective tillers m-2
Data pertaining to number of effective tillers as influenced by different cultivars and
spacing treatments are given in table 4.7.
It was noticeable from the table that number of effective tillers m-2 differed significantly
due to different cultivars which was in series of Arize 6444 > MTU 7029 > PHB 71 > PRH 10
> HUR 105. Amongst all the cultivars the maximum number of effective tillers was observed in
cultivar Arize 6444 which was significantly higher than PHB 71 and MTU 7029 and they were
significantly higher number of effective tillers m-2.
Wider plant spacing 25 × 25 cm2 hold significantly higher number of effective tillers m-2
as compared to 20 × 10 cm2.
4.2.4 Number of grains panicle-1
Data recorded on number of grains panicle-1 as influenced by cultivars and spacing are
given in table 4.7.
It was obvious from the data in the table that number of grains panicle-1 significantly
varied due to cultivars. Amongst all the cultivars, the significantly higher number of grains
panicle-1 was recorded under cultivar Arize 6444 as compared to PRH 10, PHB 71, MTU 7029
and HUR 105. However, MTU 7029, HUR 105 had statistically similar number of grains
panicle-1.
Variations in number of grains panicle-1 due to plant spacing was significant, where in
square planting 25 × 25 cm2 number of grains panicle-1 was significantly higher than 20 × 10
cm2.

Experimental Findings
51
4.2.5 Test weight (g)
Data recorded on test weight of rice under different treatments are given in table 4.8.
It was obvious from the data in the table that test weight of rice varied significantly due
to cultivars. Amongst all the cultivars significantly higher test weight was recorded under
cultivar Arize 6444 followed by PRH 10, PHB 71, and HUR 105 and MTU 7029. However, test
weight of PRH 10 was significantly higher than PHB 71, HUR 105 and MTU 7029. Test weight
of cultivar HUR 105 was found significantly higher than cultivar MTU 7029.
Variations in test weight due to plant spacing was significant, where in square planting of
(25 × 25 cm2 ) had significantly higher test weight than 20 × 10 cm2.
4.2.6 Biological Yield
The data pertaining to grain and straw yields (kg ha-1), production efficiency (kg ha-1 day-
1) and harvest index (%) in dry direct seeded rice (DSR) are given in table 4.9.
Grain yield (kg ha-1)
It was evident from the data given in table 4.8 that rice cultivar Arize 6444 recorded
significantly higher grain yield followed by PHB 71, MTU 7029, PRH 10 and HUR 105,
respectively. In comparison to HUR 105, Arize 6444 recorded 24 %, PHB 71 recorded 20.4%,
PRH 10 recorded 16.4% and MTU 7029 recorded 16.7% more grain yield. Grain yield of
cultivar PHB 71 significantly higher than cultivar PRH 10 and MTU 7029. Cultivar HUR 105
obtained significantly less grain yield in comparison to rest of the cultivars.
It was clear from the results in the table that rice cultivars planted with wider plant
spacing of 25 × 25 cm2 recorded significantly higher grain yield over the plant spacing of 20 ×
10 cm2.
Straw yield (kg ha-1)
The summarized result pertaining to straw yield due to rice cultivars and plant spacing
has been given in table 4.8.

Experimental Findings
52
It was indicated from the data in the table 4.8 that the straw yield was in decreasing order
of cultivar Arize 6444, MTU 7029, PHB 71, PRH 10 and HUR 105. Straw yield of ARIZE 6444
was significantly higher than other cultivars. There were non significant differences obtained
amongst cultivar PHB 71 and MTU 7029. PHB 71 and HUR 105 also had statistically
comparable straw yield.
The difference in straw yield due to plant spacing due to plant spacing failed to reach the
level of significance.
Harvest index (%)
The data pertaining to harvest index have been summarized in table 4.8. It was clear from
the data that cultivar PRH 10 recorded significantly higher harvest index over rest of the
cultivars. The difference in harvest index was found statistically comparable against Arize 6444
and MTU 7029.Also PHB 71 and HUR 105 were statistically at par.
The difference in harvest index due to plant spacing failed to reach the level of
significance.

53
Table 4.7 Effect of cultivars and spacing on yield attributing characters in direct seeded rice
Treatment Panicle length (cm)
Panicle weight (g)
Effective tillers m-2 No of grains panicle-1 Test weight
(g) Cultivar
Arize 6444 25.66 7.34 337.98 189.33 25.21
PHB 71 27.66 6.18 280.27 176.5 23.6
PRH 10 30 6.28 260.14 181.83 24.57
MTU 7029 22.16 6.03 288.13 154.17 18.38
HUR 105 20.83 5.61 238.24 145.83 20.96
SEm± 0.47 0.25 2.96 2.96 0.21
CD(P=0.05) 1.55 0.82 9.67 9.68 0.7
Spacing ( cm2)
20 × 10 24.8 6.54 275.99 156.86 22.08
25 × 25 25.73 6.00 285.91 173.20 23
SEm± 0.11 0.16 2.65 1.66 0.18
CD(P=0.05) 0.36 0.53 8.37 5.24 0.57
Table 4.7a Interaction effect of cultivars and spacing on panicle length in Direct Seeded rice
Treatment Cultivar
Spacing Arize 6444 PHB 71 PRH 10 MTU 7029 HUR 105
20 × 10 cm2 21.72 21.55 22.13 24.98 27.75
25 × 25 cm2 22.13 23.67 22.35 24.92 28.35
SEm± CD (P=0.05)
Two crop geometry at the same cultivar 0.258 0.813
Two cultivar means at the same or different crop geometry 0.509 1.654
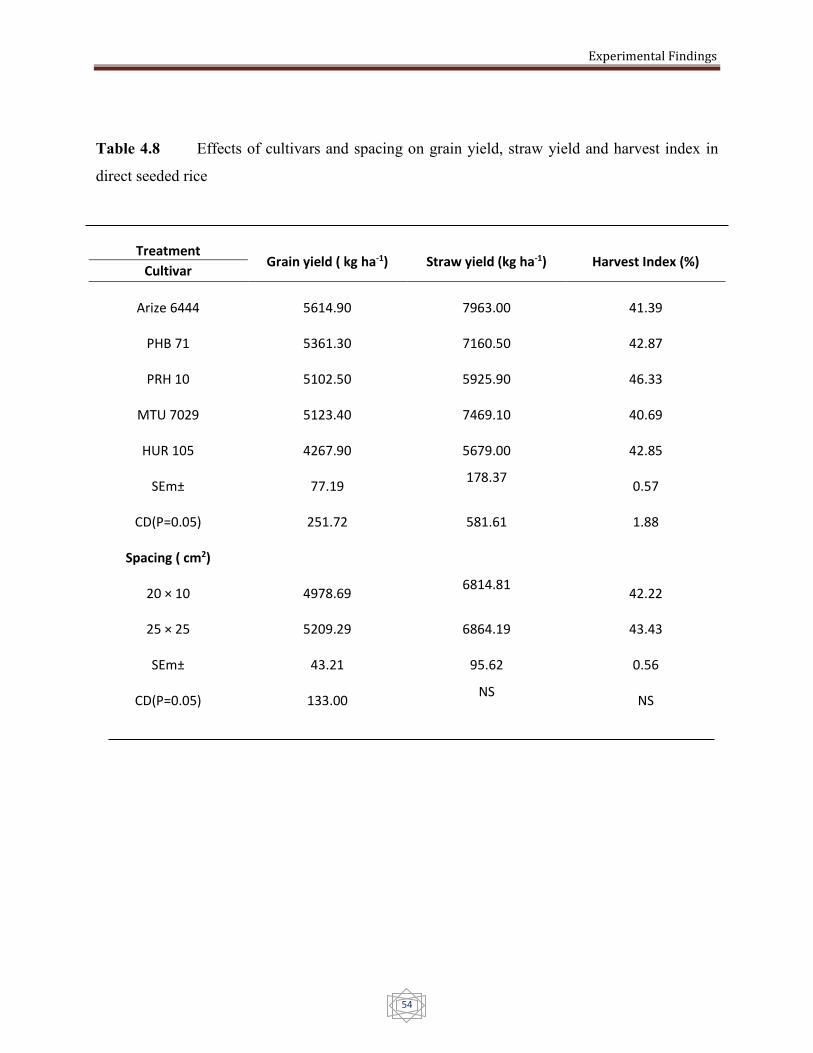
Experimental Findings
54
Table 4.8 Effects of cultivars and spacing on grain yield, straw yield and harvest index in
direct seeded rice
Treatment Grain yield ( kg ha-1) Straw yield (kg ha-1) Harvest Index (%)
Cultivar
Arize 6444 5614.90 7963.00 41.39
PHB 71 5361.30 7160.50 42.87
PRH 10 5102.50 5925.90 46.33
MTU 7029 5123.40 7469.10 40.69
HUR 105 4267.90 5679.00 42.85
SEm± 77.19 178.37
0.57
CD(P=0.05) 251.72 581.61 1.88
Spacing ( cm2)
20 × 10 4978.69 6814.81
42.22
25 × 25 5209.29 6864.19 43.43
SEm± 43.21 95.62 0.56
CD(P=0.05) 133.00 NS
NS
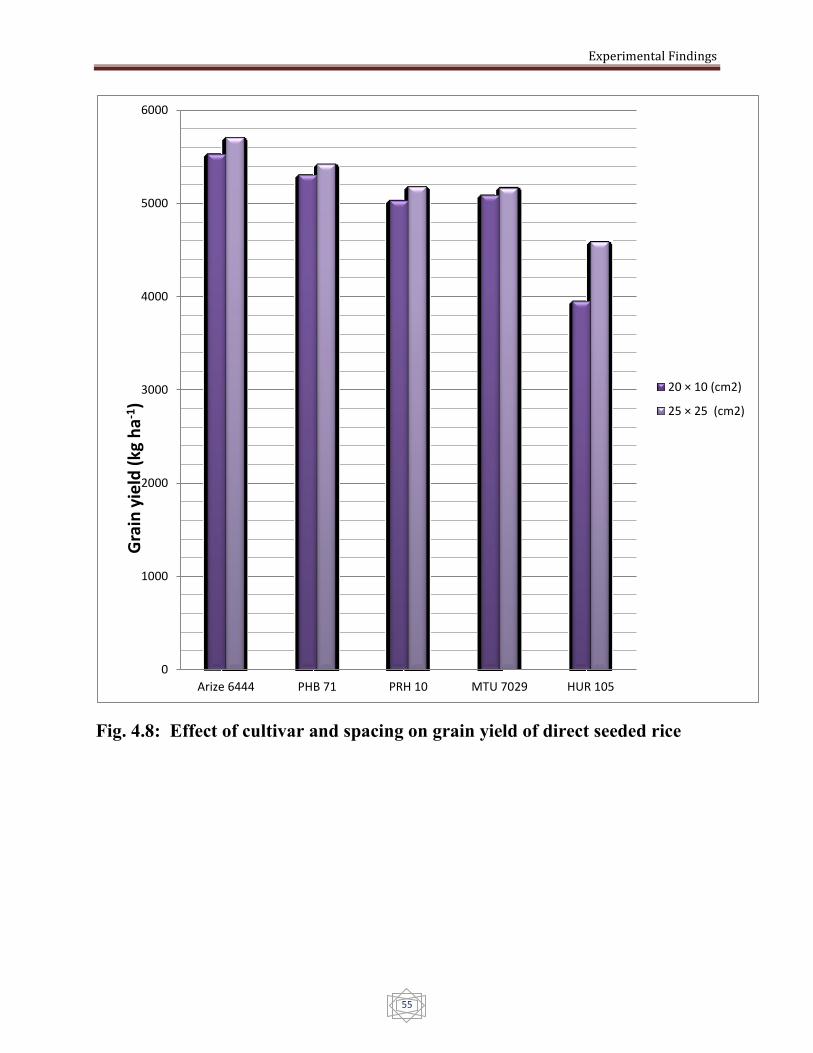
Experimental Findings
55
Fig. 4.8: Effect of cultivar and spacing on grain yield of direct seeded rice
0
1000
2000
3000
4000
5000
6000
Arize 6444 PHB 71 PRH 10 MTU 7029 HUR 105
Gra
in y
ield
(kg
ha
-1)
20 × 10 (cm2)
25 × 25 (cm2)
Experimental Findings
56
4.3 Economics
4.3.1 Gross income (Rs ha-1)
The summarized data pertaining to total gross income have been presented in table 4.9.
Hybrid cultivar Arize 6444 obtained maximum gross return at 25 × 25 cm2 plant spacing
followed by cultivar Arize 6444 at 20 × 10 cm2 and PHB 71 at 25 × 25 cm2, respectively.
4.3.2 Net returns (Rs ha-1)
The summarized data pertaining to net return have been presented in table 4.9 and it
revealed that rice hybrid Arize 6444 at 25 × 25 cm2 obtained maximum net return as compared to
other cultivars and plant spacing combinations followed by cultivar Arize 6444 at 20 × 10 cm2
and PHB 71 at 25 × 25 cm2, respectively.
4.3.3 Benefit cost ratio
The summarized data pertaining to benefit cost ratio are presented in table 4.9 and it
revealed that the cultivar Arize 6444 at plant spacing 25 × 25 cm2 recorded maximum benefit
cost ratio as compared to other cultivar and plant spacing combinations followed by PHB 71 at
25 × 25 cm2 and Arize 6444 at 20 × 10 cm2 as compared to rest of the treatment combinations,
respectively.
4.4 Production efficiency (Rs. ha-1 day-1)
It was obvious from the data presented in the table 4.9 that variations in production
efficiency were influenced by the cultivars and plant spacing combinations. Cultivar Arize 6444
recorded the maximum production efficiency at plat spacing 25 × 25 cm2 than PRH 10 at 25 × 25
cm2, Arize 6444 at 20 × 10 cm2, PHB 71 at 25 × 25 cm2, MTU 7029 at 25 × 25 cm2 and HUR
105 at 25 × 25 cm2 respectively. Production efficiency decrease towards decreasing plant
spacing.
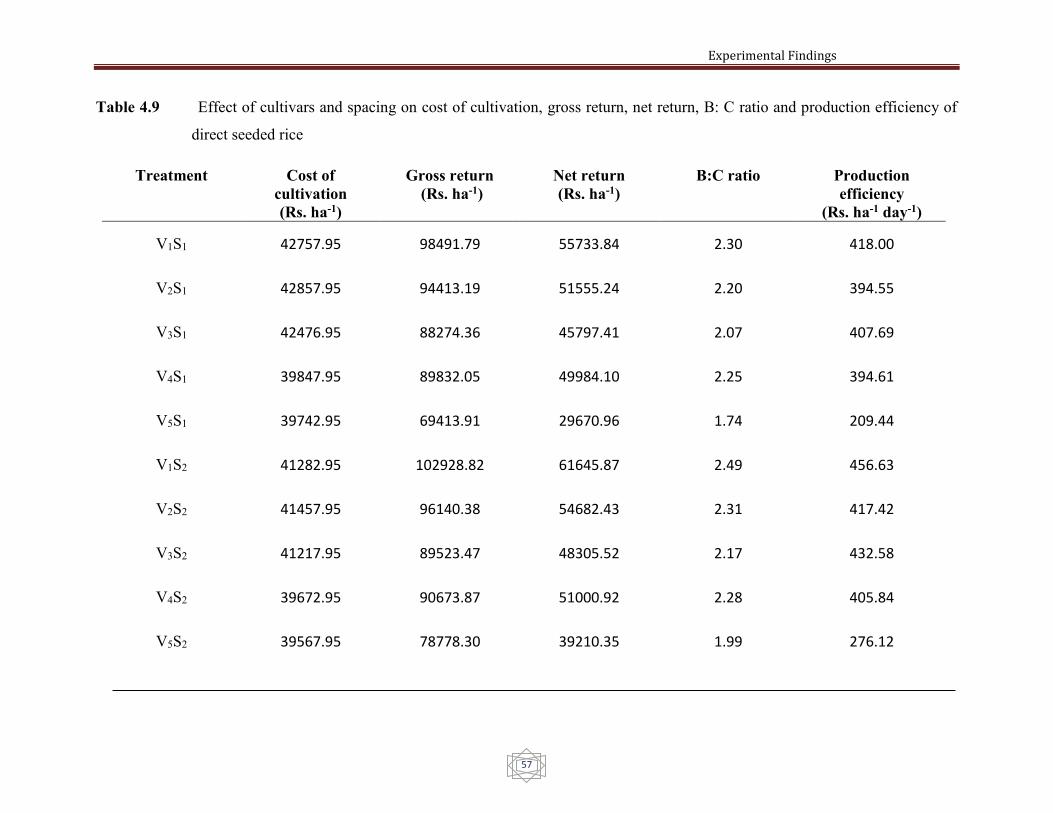
Experimental Findings
57
Table 4.9 Effect of cultivars and spacing on cost of cultivation, gross return, net return, B: C ratio and production efficiency of
direct seeded rice
Treatment Cost of
cultivation
(Rs. ha-1)
Gross return
(Rs. ha-1) Net return
(Rs. ha-1) B:C ratio Production
efficiency
(Rs. ha-1 day-1)
V1S1 42757.95 98491.79 55733.84 2.30 418.00
V2S1 42857.95 94413.19 51555.24 2.20 394.55
V3S1 42476.95 88274.36 45797.41 2.07 407.69
V4S1 39847.95 89832.05 49984.10 2.25 394.61
V5S1 39742.95 69413.91 29670.96 1.74 209.44
V1S2 41282.95 102928.82 61645.87 2.49 456.63
V2S2 41457.95 96140.38 54682.43 2.31 417.42
V3S2 41217.95 89523.47 48305.52 2.17 432.58
V4S2 39672.95 90673.87 51000.92 2.28 405.84
V5S2 39567.95 78778.30 39210.35 1.99 276.12

Chapter V
Discussion
The present investigation entitled “Effect of crop geometry on growth and yield under
direct seeded hybrid rice (Oryza sativa L.) cultivars” was conducted at Agricultural Research
Farm of Institute of Agricultural Sciences, Banaras Hindu University, Varanasi during the Kharif
season of 2015.
The results of the experiment presented in the preceding chapter has been discussed and
elucidated in this chapter with the help of suitable reasons and evidences based on the principle
of agronomy, related branches and literature available on the topic of investigation. In order to
make the findings more illustrative, the factors and possible reasons of variation obtained due to
treatment differences have been discussed in this chapter according to the objectives of the
present investigation.
5.1 Effect of Weather Conditions on Crop
The effect of weather conditions during the crop season is one of the important factors
which determine the extent of crop growth, development and its overall performance. The
weather conditions have greater significance on rice crop under direct seeded system. Rice crop
requires high temperature, high humidity and precipitation during the vegetative phase and more
sunshine duration and respectively low temperature during the reproductive phase for higher
yield of the crop. Even slight deviation from the optimum range may adversely affect the crop
growth and yield. It is, therefore, essential to make into account the weather conditions while
evaluating the crop response to experimental variables.
The detail of rainfall, temperature and relative humidity during the course of
investigation are presented in Table 3.1. The variations in weather parameters have pronounced
effect on growth and development of the crop. For achieving the yield potential every crop has
its own cardinal point of air temperature, relative humidity, and vapor pressure and sunshine
hours. If the fluctuation becomes too wide from optimum, the plants suffer leading to poor
growth, development and yield. This effect is more pronounced in crops which are grown in
Discussion
59
diverse climate and edaphic conditions. Rice is basically a crop of warm regions of the tropics
and sub tropics. The overall performance of crop was good; due to optimum range of all
parameters for favorable weather condition during the monsoon season of 2015. The mean
maximum and minimum temperature during the whole crop growth period was 32.36 and 24.24
oC while the mean maximum and minimum relative humidity was 88.04 and 67.47%,
respectively.
5.2 Effect of Cultivars
There is vital role of selection of cultivar in paddy crop because of the fact that variation
in the duration, photo-sensitiveness, thermo-sensitiveness and vegetative lag period of the
variety. A variety of short duration completes their life cycle with in short period with less effect
of photoperiod and low temperature. Longer duration varieties and photo and thermo insensitive
varieties may perform better under favorable conditions. In case of rice hybrids, they are mostly
photo and thermo sensitive which are mainly affected by photo and thermo period and their
growth (tillers production, plant height, number of functioning leaves, leaves size and
reproductive phases of the crop) are influenced adversely, resulting in reduction in yield.
The plant height recorded at all the stages of observations of crop was significantly
higher in hybrid rice cultivar Arize 6444 than the remaining cultivars (Table 4.1). The taller plant
in cultivar Arize 6444 might be due to better utilization of available growth resources like light
and temperature which may result in more nitrogen absorption for the synthesis of protoplasm
responsible for rapid cell division consequently increasing the plant in shape and size or may be
due to hybrid vigour of the cultivar (Dass and Chandra (2012). Similar findings have also been
reported by Sowmyalatha et al and Pankaj et al. (2015).
The dry matter accumulation m-1 running row recorded at all the stages of observations of
crop was significantly higher in cultivar Arize 6444 than the rest of the cultivars (at 30 DAS it is
at par with PHB 71) (Table 4.2).The higher dry matter accumulation m-1 running row in cultivar
Arize 6444 might be due significantly higher dry matter production m-1 running row at all the
stages of observations.
The higher number of total tillers m-2 in cultivar Arize 6444 (Table 4.3) might be due to
ability of effective utilization of plant growth resources viz. photoperiod, dry matter production

Discussion
60
and increase in tillers with advancement of life cycle. The findings have also been supported by
Pankaj et al. (2015)
The number of leaves m-2 recorded at all the stages of observations of crop was also
significantly higher in cultivar Arize 6444 than the other cultivars except MTU 7029 which had
comparable number of leaves m-2 only at 90 DAS (Table 4.4). The higher number of functioning
leaves m2 in Arize 6444 was probably due to higher dry matter accumulation. At 90 DAS, higher
number of functioning leaves m-2 in MTU 7029 was probably due to the fact of rapid more
growth in the later part of the varietal life cycle being a long duration variety. As a short duration
crop (124 days) PRH 10 recorded less number of number of leaves m-2 at 90 DAS as compared
to 60 DAS.
The hybrid rice cultivar Arize 6444 recorded significantly higher LAI at all the stages of
observations than the rest of the cultivars (Table 4.5). The higher LAI recorded in cultivar Arize
6444 might be due to more number of leaves m-2. The findings have also been supported by
Sowmyalatha et al. (2012) and Jat et al. (2015). At 90 DAS leaf area index of PRH 10 was not
increased as high as other cultivars as it was a short duration crop and number of leaves m-2 were
decreased at 90 DAS but leaf size increased. Thus leaf area index slightly increased.
Amongst all the cultivars, cultivar MTU 7029 had significantly higher chlorophyll
content in leaves as compared to other cultivars at all the stages of observations (Table 4.6). The
higher chlorophyll content in cultivar MTU 7029 was due to the genetic character of the cultivar.
Also higher chlorophyll content in hybrid cultivar PRH 10 may be due to the fact that cultivar
PRH 10 accumulates higher nitrogen from the soil than the other cultivars and chlorophyll
content in leaves is directly associated with nitrogen uptake.
Cultivar MTU 7029 took significantly higher days to 50% maturity as compared to other
cultivar (Table 4.6). All these observations were due to the fact that number of days taken by
cultivars for various phenological stages is a genetic characteristic of genotypes.

Discussion
61
The higher number of effective tillers m-2 in cultivar Arize 6444 and MTU 7029 (Table
4.7) might be due to better development of early initiation of tillers before start of reproductive
growth. Number of filled spikelets per panicle, panicle weight, and 1000-grain weight were
significantly higher in cultivar Arize 6444 than the remaining cultivars (Table 4.7) which might
be due to ability of hybrid rice cultivar of better growth which may result in the better
development of yield attributing characters. The higher values of growth and yield attributes
recorded by Arize 6444 over inbred and hybrid varieties might be due to higher plant height,
number of leaves, leaf area, total tillers. Also Significantly higher grain and straw yield was
recorded in Arize 6444 rice hybrid which might be due to synchronization of tillers that help in
early emergence of productive panicles and panicle weight possibly due to better utilization
capacity of available nutrients which helped in determining the relatively more yield.
Sowmyalatha et al. (2012). Similar results have also been reported by Dass and Chandra
(2012); and Jat et al. (2015).
The grain yield was significantly higher in cultivar PHB 71 compared to cultivar HUR
105 and statistically comparable with cultivar MTU 7029 (Table 4.9). In comparison to PRH 10,
PHB 71 which might have increased in panicle bearing shoots m-2 as well as number of grains
per panicle and 1000-grain weight. The statistically comparable grain yield in MTU 7029 and
PRH 10 was due to higher number of effective tillers m-2 in cultivar MTU 7209 and higher
values of yield attributing characters in cultivar PRH 10.
Variations in straw yield due to cultivars were in decreasing order of ARIZE 6444, MTU
7029, PHB 71, PRH 10 and HUR 105. There were also non significant differences obtained
amongst cultivar PHB 71 and MTU 7029; amongst HUR 105 and PRH 10 (Table 4.9). Cultivar
HUR 105 recorded significantly less straw yield as compared to remaining cultivars. The
significantly less straw yield in cultivar HUR 105 might be due to lesser dry matter
accumulation.
The harvest index was significantly higher in cultivar PRH 10 than the rest of the tested
cultivars (Table 4.9) which might be due to less straw yield obtained and higher grain yield
demonstrating better dry matter. But in case of Arize 6444 as a medium duration crop (140 days)
its straw yield was more, thus harvest index of Arize 6444 is significantly less than PRH 10.
Discussion
62
5.3 Effect of Crop Geometry
Crop Geometry is one of the important factors to obtain higher grain yield in direct
seeded rice cultivars. Optimum plant spacing depends on several factors such as the plant type,
season, fertility level and date of seeding. The plant geometry ought to be wider in wet season
than in dry season, wider in high fertility level than poor fertility conditions, wider for high
tillering cultivars than low tillering varieties and wider for lodging susceptible cultivars than
lodging tolerant cultivars. In case of rice hybrids, the growth habits of hybrid plant are distinct
from those of inbred varieties particularly during early growth stage owing to hybrid vigor
(Siddiq, 1993). So there are chances that the available information on appropriate plant spacing
for inbred cultivars may or may not be suitable for hybrids. Plant density required for maximum
grain yield need to be optimized, as the seed of hybrid rice is very costly. A planting density that
can bring down the seed requirement without sacrificing productivity would go a long way in
popularizing the hybrid rice cultivation. Abundant tillering of the hybrid rice may reimburse the
yield due to reduction in plant population as compared to inbred varieties.
Plant height at all the stages of observations was not influenced significantly due to
different plant spacing but closer plant spacing of 20 × 10 cm2 recorded higher plant height than
wider spacing of 25 × 25 cm2 (Table 4.1). It might be due to stiff competition for space, sunlight
and other inputs as compared to wider spacing. Kumar (2002) reported that higher plant densities
tended to produce taller plants than lower plant densities. The results are in agreement with those
of Reddy and Reddy (1986); Shah et al. (1991); and Om et al. (1993).
The dry matter accumulation m-1 running row recorded at all the stages of observations of
the crop was significantly higher in closer plant spacing of 20 × 10 cm2 as compared to wider
spacing of 25 × 25 cm2 (Table 4.2), this might be due to the fact of higher initial plant population
in closer plant spacing. The results are in agreement with those of Raju et al. (1984); Kabayashi
et al. (1989); Dhal and Mishra (1994); Padmaja and Reddy (1998) and Miller (1991).
At 30 and 60 DAS, the total tillers m-2 was significantly higher in closer plant spacing of
20 × 10 cm2 than 25 × 25 cm2, respectively (Table 4.3). The result was in accordance of Shah et
al. (1991), Kanungo and Roul (1994), (DRR, 1991), (CRRI, 1998) and Obulamma and Reddeppa
(2002). At 90 DAS, number of tillers m-2 increased in spacing of 25 × 25 cm2 a very little drop
was observed due to the fact of less inter and intra plant competition associated with lower plant
density. At 90 DAS, plant spacing of 25 × 25 cm2 had significantly higher number of tillers m-2
Discussion
63
as compared to 20 × 10 cm2 (Nayak et al., 2003). The drop of increment of total tillers m-2 after
60 DAS in closer spacing might be due to the higher mortality of tillers m-2. The mortality of
tillers at higher plant population might be due to more below and above ground competition for
space, nutrient, water, air and light for performing normal physiological activities of the plant. At
30 and 60 DAS, the number of leaves m-2 was also significantly higher in 20 × 10 cm2 as
compared to the wider spacing of 25 × 25 cm2 (Table 4.4). However, at 90 DAS wider plant
spacing 25 × 25 cm2 recorded significantly higher number of leaves m-2.
At all the stages of observations, leaf area index was significantly higher in closer plant
spacing of 20 × 10 cm2 than the wider plant spacing of 25 × 25 cm2 (Table 4.5). The higher leaf
area index in closer planting geometry might be due to more number of leaves produced per unit
area. The results are in agreement with those of Budhar et al. (1991); Cai et al. (1991) and Nayak
et al. (2003).
Chlorophyll content at 60 and 90 DAS were non significant due to both spacing viz. 25 ×
25 cm2 and 20 × 10 cm2.
None of the cultivar recorded marked variations on days to 50% maturity with plant
spacing (Table 4.6).
The panicle bearing tillers m-2 were significantly higher at plant spacing of 25 × 25 cm2
than plant spacing of 20 × 10 cm2 due to reduction in initial plant population (Table 4.7). Thus,
the wider spacing of 25 × 25 cm2 proved to be significantly superior in production of effective
tillers m-2. The same results had also been reported by Shah et al. (1991); Padmaja and Reddy
(1998); (CRRI, 1998) Nayak et al. (2003) and Parashiva Murthy (2011).
The productive tillers were higher in wider spacing due to the fact that better
development of early tillers up to reproductive phase of the crop while in case of closer seeding
the production of tillers may take place but due to unavailability of sufficient amount of
photosynthates due to higher plant density might have resulted lesser number of productive
tillers.
The results also revealed that the yield attributes varied significantly due to planting
geometry. Number of effective tillers m-2 number of filled grains panicle-1, panicle length and
test weight were significantly higher in wider spacing of 25 × 25 cm2 than the closer spacing of
20 × 10 cm2. Similar results have also been reported by Trivedi and Kwatra, (1983); Krishnan et
al. (1994) and Parashiva Murthy (2011).

Discussion
64
The higher yield attributes in wider spacing of 25 × 25 cm2 might be due to fact that
wider spacing recorded higher tillers m-2 as result of better utilization of available growth
resources in better development of yield attributes.
The grain yield was higher at wider spacing of 25 × 25 cm2 than the spacing of 20 × 10
cm2. (Table 4.9). The higher yield in wider plant spacing might be due to higher number of
effective tillers m-2 and number of filled grains panicle-1. The result was in accordance of
Geethadevi et al. (2000); Rajesh and Thanunathan (2003) and Shinde et al. (2005).
Variations in straw yield and harvest index due to plant spacing were non significant
(Table 4.8).
5.4 Effects on economics and production efficiency
The rice hybrid Arize 6444 recorded the maximum gross return as compared to other
cultivars with all the tested plant spacing and the maximum gross return was recorded at higher
plant spacing 25 × 25 cm2. The maximum net return was recorded in cultivar Arize 6444 at
higher plant spacing of 25 × 25 cm2 followed by followed by cultivar Arize 6444 at closer plant
spacing 20 × 10 cm2 as compared to other treatments. The maximum B: C ratio was also
obtained in cultivar Arize 6444 at wider plant spacing 25 × 25 cm2 followed by Arize 6444 at 20
× 10 cm2. Rice hybrid Arize 6444 at plant spacing 25 × 25 cm2 recorded maximum production
efficiency in terms of net return ha-1 day-1 as compared to other cultivars (Table 4.9).
Fig 5.4: Effect of cultivar and spacing on production efficiency of direct seeded rice
0
10000
20000
30000
40000
50000
60000
70000
V1S1 V2S1 V3S1 V4S1 V5S1 V1S2 V2S2 V3S2 V4S2 V5S2
Net return (Rs. ha-1 day-1)
Chapter VI
Summary and Conclusion
The present investigation was carried out to study the “Effect of crop geometry on
growth and yield under direct seeded hybrid rice (Oryza sativa L.) cultivars” in Kharif
season of 2015 at Agricultural Research Farm, Institute of Agricultural Sciences, Banaras Hindu
University. Five cultivars (Arize 6444, PHB 71, PRH 10, MTU 7029 and HUR 105) and two
crop geometry (20 × 10 and 25 × 25 cm2) were tested in three replicated split plot design
assigning cultivars in main plots and plant spacing in sub plots. The soil of experimental field
was sandy loam in texture, low in available nitrogen (206.0 kg ha-1), medium in available
phosphorus (24.4 kg ha-1) and medium in available potassium (220.5 kg ha-1) having soil pH of
7.2. The experimental crop experienced favorable weather conditions during the period of
experimentation. The crop cultivars were fertilized with a dose of 120 kg N, 80 kg P2O5, 80 kg
K2O and 25 kg ZnSO4 ha-1. The crop was irrigated as per the need of crop during the period of
experimentation. All other agronomic practices were adapted as per standard package of
practices.
The observations on important growth characters, yield attributes and yield were recorded
during the period of experimentation and thus the data collected so for, were averaged and
tabulated for statistical analysis. The results based on statistical analysis have been described and
discussed in previous two chapters. The salient results of present investigation on different
growth characters, yield attributes and yield are summarized here as under:
6.1 Effect of cultivar
Significantly higher plant height was obtained with hybrid rice cultivar Arize 6444 as
compared to cultivar PRH 10, MTU 7029 and HUR 105 and statistically at par with PHB 71
based on the observations recorded up to harvest. Significantly higher dry matter accumulation
m-1 running row was obtained with cultivar Arize 6444 at 60 and 90 DAS as compared to the rest
of the cultivars. However, dry matter accumulation m-1 running row in Arize 6444 at 30 DAS
with cultivar PHB 71 was statistically at par. At 30 and 90 DAS PRH 10 had statistically
comparable with MTU 7029. Significantly higher number of leaves m-2 in rice hybrid PRH 10

Summary and Conclusion
66
was obtained at 60 DAS as compared to other cultivars except Arize 6444. However, at 90 DAS
higher number of leaves m-2 was recorded with cultivar Arize 6444. Rice hybrid Arize 6444
recorded significantly higher LAI at 30 DAS except PRH 10 and 90 DAS than rest of the
cultivars. Whereas at 60 DAS it was statistically at par with PRH 10. The significantly higher
chlorophyll content in leaves was found with cultivar MTU 7029 as compared to rest of the
cultivars. Cultivar MTU 7029 took significantly higher days to 50% physiological maturity as
compared to cultivar Arize 6444, PHB 71, HUR 105 and PRH 10 respectively.
Effective tillers m-2, number of filled grains per panicle, weight per panicle and 1000-
grain weight were significantly higher in cultivar Arize 6444 than the remaining cultivars.
Significantly higher panicle length was obtained with cultivar PRH 10 as compared to other
cultivars viz. PHB 71, Arize 6444, MTU 7029 and HUR 105 respectively. The grain yield was
significantly higher in cultivar Arize 6444 compared to other cultivars. Straw yield was in
decreasing order of Arize 6444, MTU 7029, PHB 71, PRH 10 and HUR 105. There were also
non significant differences in straw yield was obtained amongst cultivar Arize 6444 and MTU
7029. Cultivar HUR 105 recorded significantly less straw yield as compared to remaining
cultivars. The harvest index was significantly increased in cultivar PRH 10 in comparison to the
rest of the cultivars.
6.2 Effect of crop geometry
The plant height of rice cultivars have not been influenced significantly due to
different crop geometry upto 90m DAS. The crop planted at plant spacing 20 × 10 cm2
recorded higher number of total tillers m-2 at 30 and 60 DAS whereas at 90 DAS wider
plant spacing (25 × 25 cm2) had significantly higher number of tillers m-2 as compared to plant
spacing 20 × 10 cm2. The dry matter accumulation m-1 running row was significantly higher in
closer plant spacing of 20 × 10 cm2 as compared to wider plant spacing. The number of leaves m-
2 was significantly higher in closer plant spacing 20 × 10 cm2 at 60 and 90 DAS. However, at 90
DAS, plant spacing 25 × 25 cm2 recorded significantly higher number of leaves m-2.
Significantly higher LAI was recorded at closer plant spacing of 20 × 10 cm2 than the wider
plant spacing of 25 × 25 cm2 at all stages of obsevation. Chlorophyll content in leaves increased

Summary and Conclusion
67
with increase in plant spacing. The wider plant spacing of 25 × 25 cm2 recorded significantly
more chlorophyll content than closer spacing of 20 × 10 cm2 at all the stages of observations.
The panicle length, number of effective tillers m-2, number of grains panicle-1 and test
weight were found significantly higher in wider spacing of 25 × 25 cm2 than 20 × 10 cm2 .The
grain yield was significantly higher at wider spacing of 25 × 25 cm2 than narrow spacing of 20 ×
10 cm2. Variations in straw yield due to plant spacing were statistically comparable with each
other. None of the cultivar recorded marked variations in days to 50% physiological maturity due
to plant spacing. Higher harvest index was obtained with wider plant spacing 25 × 25 cm2.
However, the differences in harvest index were statistically at par with 20 × 10 cm2.
6.3 Economics
The rice hybrid Arize 6444 recorded maximum gross return as compared to other
cultivars at wider plant spacing 25 × 25 cm2. The maximum net return was recorded in cultivar
Arize 6444 at wider plant spacing of 25 × 25 cm2 followed by Arize 6444 at closer plant spacing
20 × 10 cm2 as compared to other treatment combinations. The maximum B: C ratio was also
obtained in cultivar Arize 6444 at wider plant spacing 25 × 25 cm2. Amongst all the spacing
wider spacing of 25 × 25 cm2 recorded maximum production efficiency with cultivar Arize 6444
in term of net return day-1ha-1.
CONCLUSION
On the basis of experimental findings and discussion of present investigation following
conclusions may be drawn:
1. Grain yield in cultivar Arize 6444 at 25 × 25 cm2 and PHB 71 at 25 × 25 cm2 was found
superior than rest of the cultivars. Rice hybrid Arize 6444 recorded significantly higher
grain yield (56.14 q ha-1) compared to cultivar PHB 71 (53.16 q ha-1), MTU 7029 (51.23
q ha-1), PRH 10 (51.02 q ha-1) and HUR 105 (42.67 q ha-1).
2. The plant spacing 25 × 25 cm2 obtained better growth and yield attributing characters and
yield as compared to 20 × 10 cm2.
Summary and Conclusion
68
3. On the basis of economic analysis, hybrid rice Arize 6444 planted at 25 × 25 cm2 crop
geometry recorded the maximum net return of Rs. 61645.87 ha-1, B: C ratio (2.49) and
production efficiency (Rs 456.43 ha-1day-1).
The experiment was conducted for only one year; therefore the experiment
may be repeated to validate the result.
BIBLIOGRAPHY
A. O. A. C. Association of Official Agricultural Chemists, methods of analysis, 11th edn.
Washington, D.C., 2004, 18-19. 1970.
Anonymous, Agricultural statistics at a glance, Department of Agriculture Economics and
Statistics, Ministry of Agriculture, New Delhi, 2010.
Anonymous, Agricultural statistics at a glance, Department of Agriculture Economics and
Statistics, Ministry of Agriculture, New Delhi, 2016.
Anonymous, Annual progress report. All India Coordinated Rice Improvement Programme.
Directorate of Rice Research (ICAR), Hyderabad, 3: 4.134-4.139. 2009.
Anonymous. Annual Progress Report. All India Coordinated Rice Improvement Programme.
Directorate of Rice Research (ICAR), Hyderabad, 3: 4.134-4.139. 2015.
Anonymous. Ministry of Agriculture, Directorate of Economics and Statistics, Government of
India. 2013.
Balasubramaniyan, P. and Palaniappan, S.P. Effect of high density population and fertilizer rate
on growth and yield of low land rice. Indian Journal Agronomy, 36 (1): 10-13. 1991b.
Balasubramaniyan, P. and Palaniappan, S.P. Effect of population density, fertilizer levels and
time of application on rice. Indian Journal Agronomy, 36(2): 218-221. 1991a.
Banerjee, H. and Pal, S. Effect of planting geometry and different levels of nitrogen on hybrid
rice. Oryza, 48(3): 274-275. 2011.
Basavaraja, M.K., Siddaram, K., Ramesha, Y.M., Yogeeshappa, H. and Prakash, H. Effect of
spacing and genotypes on yield and genotypes on growth and yield of aerobic rice.
International Journal of Agricultural Sciences, 6(2): 485-487. 2010.
Bibliography
ii
Black, C. A. Methods of soil analysis Part II: American society of Agronomy, Madison,
Wisconsin, U.S.A., 1372-1376. 1965.
Bouman, B. A. M. (2009). How much water does rice use? Rice Today 8, 28–29.
Bouman, B. A. M., Peng, S., Castaneda, A. R., and Visperas, R. M. Yield and water use of
irrigated tropical aerobic rice systems. Agricultural. Water Manage. 74, 87–105. 2005.
Bouyoucos, G. J., Hydrometer method for making particle size analysis of soil. Agronomy
Journal, 54: 464-465. 1962.
Bozorgi, H.R., Faraji, A., Danesh, R.K., Keshavarz, A., Azarpour, E. and Tarighi, F. Effect of
planting density on yield and yield components of rice. World Applied Sciences
Journal, 12(11): 2053-2057. 2011.
Budhar, M.N., Palaniappan, S.P. and Rangaswamy, A. Effect of plant population on productivity
of early duration rice ‘CR 666-18’. Oryza, 26(3): 310. 1989.
Cai, Y.Z., Cheng, G.F., Wu, H.M. and Xue, Y.S. Investigation of target for yield components
and the establishment of relative population for the high yielding Japonica rice hybrid
‘Han You 102’. Acta Agriculturae Shanghai, 7(3): 41-45. 1991.
Chopra, N.K. and Chopra, N. Seed yield and quality of ‘Pusa44’ rice as influenced by nitrogen
fertilizer and row spacing. Indian Journal of Agricultural Sciences, 74(3): 144-146.
2004.
Choudhary, R. L., Kumar, D., Shivay, Y. S., Anand, A., & Nain, L. Yield and quality of rice
(Oryza sativa) hybrids grown by SRI method with and without plant growth promoting
rhizobacteria. Indian Journal of Agronomy, 58(3), 430-433. 2013.
CRRI. Effect of method of planting, spacing and seedling densities on the performance of hybrid
rice. Annual Report 1997-98. Central Rice Research Institute, Cuttack, pp. 83-84. 1998.
Bibliography
iii
Dass, A., and Chandra, S. Effect of different components of SRI on yield, quality, nutrient
accumulation and economics of rice (Oryza sativa) in tarai belt of northern
India. Indian Journal of Agronomy, 57(3): 250-254. 2012.
Dhal, P.K. and Mishra, G. Interaction of spacing and nitrogen in rice. Oryza, 31: 149-150. 1994.
Dhiman, S.D., Om, H. Singh, B. and Singh, B. Yield stabilization of scented dwarf rice under
late planting through spacing and seedling age. Haryana Agriculture University Journal
Research, 25(3): 95-99. 1995.
Dongarwar, U.R. Patankar, M.N. and Pawar, W.S. Response of hybrid rice to spacing and
number of seedlings per hill and their effects on growth and yield. Journal of Soils and
Crops, 12(2): 248-249. 2002.
DRR. Annual Progress Report, 1990-91. Directorate of Rice Research, Rajendranager,
Hyderabad, 34-39. 1991.
Gangwar, B. and Ahamedi, R. Effect of planting time on growth, yield and incidence of insect
pests in rice. Oryza, 27: 497-500. 1990.
Gautam, A.K., Kumar, D., Shivay, Y.S. and Mishra, B.N. Influence of nitrogen levels and plant
spacing on growth, productivity and quality of two inbred varieties and a hybrid of
aromatic rice. Archives of Agronomy and Soil Science, 54(5): 515 — 532. 2008.
Geethadevi, T., Andani, G., Krishnappa, M. and Babu, B.T.R. Effect of nitrogen and spacing on
growth and yield of hybrid rice. Current. Research, University of Agricultural Sciences
Bangalore, 29(516): 73-75. 2000.
Ghadekar, S.R. Marey; D.K. and Zilpe, Y.P. Effect of transplanting date on dry matter, yield and
photohtermal unit in rice at Nagpur. Indian Journal of Agricultural Sciences, 58(5):
339-341. 1988.
Bibliography
iv
Gunri, S.K., Pal, S.K. and Chaudhury, A. Effect of integrated nitrogen application on yield of
rice in foot hill soil of West Bengal. Indian Journal of Agronomy, 49(4): 248-250.
2004.
Gupta, A.K. and Sharma, R.S. Effect of plant spacing and fertility level on grain yield of early
medium Indica rice. Indian Journal of Agronomy, 36(2): 223-225. 1991.
Ikarashi, H., Ito, T. and Kambayashi, M. Rice cultivation with low levels of agricultural
chemicals and a high level of organic manure. Report of the Tohuke Branch Crop
Science Society, Japan, 33: 11-12. 1990.
Jackson, M. L. Soil chemical analysis. Prentice Hall of Ind., Pvt. Ltd., New Delhi, pp 183. 1973.
Jalil, M.A. Effect of spacing and seed rate of fertilizer application oon yield performance of Boro
rice (cv. BRRI Dhan 29) under aerobic system of cultivation. M.Sc. Thesis, Department
of Agronomy, Bangladesh Agricultural University, Mymemsingh. 48-49. 2008.
Jat, A. L., Srivastava, V. K., and Singh, R. K. Effect of crop-establishment methods and
integrated nitrogen management on productivity of hybrid rice (Oryza sativa)-wheat
(Triticum aestivum) cropping system. Indian Journal of Agronomy, 60(3), 341-346.
2015.
Jena, S., Annie, P. and Nayak, B.C. Response of hybrid rice to time of planting and planting
density. Oryza, 47(1): 48-52. 2010.
Joshi, E., Kumar, D., Lal, B., Nepalia, V., Gautam, P. and Vyas, A.K. Management of direct
seeded rice for enhanced resource - use efficiency. Plant Knowledge Journal, 2(3):119-
134. 2013.
Kabayashi, Y., Abe, S. and Matumato, K. Growth and yield of paddy under natural condition.
Report of the Tahuke Branch Group Science Society, Japan, 32: 12-13. 1989.
Kandil, A.A., El-Kalla, S.E., Badawi, A.T. and Omnia, M. Effect of hill spacing, nitrogen levels
and harvest date on rice productivity and grain quality. Crop and Environment, 1(1):
22-26. 2010.
Bibliography
v
Kanungo, A.P. and Roul, P.K. Response of transplanted summer rice genotypes to varying levels
of fertility and plant density. Indian Journal of Agronomy, 39(2): 216-219. 1994.
Kewat, M.L., Agrawal, S.B., Agrawal, K.K. and Sharma R.S. Effect of divergent plant spacing
and age of seedlings on yield and economics of hybrid rice. Indian Journal of
Agronomy, 47(3): 367-371. 2002.
Krishna A, Biradarpatil, N.K. and Channappagoudar, B. B. 2008. Influence of system of rice
intensification (SRI) cultivation on seed yield and quality. Karnataka Journal of
Agricultural Science 21(3): 369–72.
Krishnan, R., Natarajan, S. and Palaniswamy, C. Effect of spacing, azola and level of nitrogen on
rice. Madras Agriculture Journal, 81(9): 514-515. 1994.
Kumar, A., Mishra, B.N. and Mishra, P.K. Effect of age of seedlings and plant density on growth
and yield of hybrid rice. Annals of Agricultural Research, 23(3): 381-386. 2002.
Kumar, D., Sarangi, A., Bandyopadhyaya, K.K., Singh, D.K., Kumar, L. and Singh, N.
Performance Evaluation of Rice Cultivation Methods under Different Varieties and
Irrigation Regimes on Water Productivity. International Journal of Agriculture and
Food Science Technology, 4(7): 659-660. 2013.
Kumar, V. and Ladha, J. K. 6 Direct Seeding of Rice: Recent Developments and Future Research
Needs. Advances in Agronomy, 111, 297. 2011.
Kumar, P., Zaidi, S. F. A., & Singh, A. Effect of scheduling of potassium on growth and yield of
hybrid rice. Annals of Agricultural Bio Research, 20(1), 19-21. 2015.
Mahajan, G., Gill, M.S. and Singh, K. Optimizing seed rate to suppress weeds and to increase
yield in aerobic direct seeded rice in North-Western Indo Gangatic plains. Journal of
New Seeds, 11: 225-238. 2010.
Mazid, A. and Ahmad, S. Effect of transplanting date on paddy yield and other plant characters
in deferent rice varieties. Journal of Agricultural Research, 13(2): 447-454. 1975.
Bibliography
vi
Meena, R.K., Neupane, M.P. and Singh, S.P. Effect of Phosphorus Levels and Bio-Organic
Sources on Growth and Yield of Rice (Oryza sativa L.) Indian Journal of Nutrition,
1(1). 2014.
Miller, B.C. Study of rice growth and development designed to scheduling management action
and evaluating management strategies under California’s direct seeded continuously
flooded culture. Field Crop Abstract, 44(2): 113. 1991.
Mondal, M., Monjurul, A., Adam, B., Ismail, M., Raffii, R. and Yusop. Optimizing plant spacing
for modern rice varieties. International Journal for agriculture and biology, 15(1): 175-
178. 2013.
Nayak, B.C., Dalei, B.B. and Chodhury, B.K. Response of hybrid rice to date of planting,
spacing and seedling rate during wet season. Indian Journal of Agronomy, 48(3): 172-
174. 2003.
Obulamma, U. and Reddeppa, R. Effect of spacing and seedling number on growth and yield of
hybrid rice. J. Res ANGRAU, 30(1): 76-78. 2002.
Olsen, S. R., Cok, C. V., Watanable, P. S. and Dean, L. A. Estimation of available phosphorus in
soil by extraction with sodium carbonate. U.S.D.A. Circular, 34: 939. 1954.
Om, H., Singh, O.P. and Joon, R.K. Effect of time of transplanting and spacing on Basmati rice.
Haryana Journal of Agronomy, 9(1): 87. 1993.
Padmaja, K. and Reddy, B.B. Effect of seedling density in nursery, age of seedling and crop
geometry on growth and yield of hybrid rice during wet season. Oryza, 35(4): 380-381.
1998.
Padmavati, P., Singh, S. and Prasad, R. Effect of planting patterns and level of nitrogen on
performance of conventional and hybrid rice variety. (In) Extended Summary of First
International Agronomy Congress, held during 23-27, November at New Delhi. pp.
105. 1998.

Bibliography
vii
Paliwal, A.K., Khandalker, V.S., Paraye, P.M. and Tomar, N.S. Effect of transplanting time on
grain yield and its attributes in dwarf scented rice. Indian Journal of Agricultural
Sciences, 66(1): 48-50.1996.
Pandey, N., Verma, A.K. and Tripathi, R.S. Effect of planting time and nitrogen on tillering
pattern, dry matter accumulation and grain yield of hybrid rice. Indian Journal of
Agricultural Sciences, 71(5) : 337-338. 2001.
Pandey, S., and Velasco, L. (2005). Trends in crop establishment methods in Asia and research
issues. In “Rice Is Life: Scientific Perspectives for the 21st Century” (K. Toriyama, K.
L. Heong, and B. Hardy, Eds.), pp. 178–181. International Rice Research Institute, Los
Banos, Philippines and Japan International Research Center for Agricultural Sciences,
Tsukuba, Japan.
Patel, J.R. Response of rice to time of transplanting, spacing and age of seedlings. Indian Journal
of Agronomy, 44(2): 344-346. 1999.
Patra, A.K. and Nayak, B.C. Effect of spacing on rice varieties of various durations under
irrigated condition. Indian Journal of Agronomy, 46(3): 449-452. 2001.
Piper, C. S. Soil and plant analysis, Hans Publication, Bombay, India. pp. 64-69. 1966.
Pol, P.P., Dixit, A.J. and Thorat, S.T. Effect of integrated nutrient management and plant
densities on yield attributes and yield of Sahayadri hybrid rice. Journal of Maharashtra
Agriculture University, 30(3): 357- 359. 2005.
Powar, S.L. and Deshpande, V.N. Effect of integrated agro-technology on Sahyadri hybrid rice
in medium black sail in high rainfall area. Journal of Maharashtra Agriculture
University, 26(3): 272-276. 2001.
Rai, M. Rice the cereal that feeds billions. Indian Farming, 56(7): 4-9. 2006.
Rajesh, V. and Thanunathan, K. Effect of seedling age, number and spacing on yield and nutrient
uptake of traditional Kambanchamba rice. Madras Agriculture Journal, 90(1-3): 47-49.
2003.

Bibliography
viii
Raju, R.A., Reddy, G.V. and Reddy, M.N. Studies on response of long duration rice to spacing
and age of seedling. Indian Journal of Agronomy, 34(4): 506-507. 1984.
Rao, K.S. and Moorthy, B.T.S. Hybrid rice technology for achieved higher yield during dry
season in coastal Orissa. Indian Farming, 53(3): 4-5. 2003.
Rautaray, S.K. Effect of spacing and fertilizer dose on grain yield of rice (Oryza sativa L.) in
rice-rice cropping sequence. Oryza, 44(3): 285-287. 2007.
Reddy, B.B. and Ghosh, B.C. Effect of seedling and hill density on the performance of rice under
intermediate deep water conditions. Oryza, 21(4): 233-337. 1989.
Reddy, G.V. and Reddy, P.S. Effect of time of planting and spacing on IET-2508 in puddled soil
during dry season. Oryza, 23(1): 53-55. 1986.
Reddy, K.S. and Reddy, B.B. Effect of planting time, population density and seedling age on
yield and yield parameters of rice. Indian Journal of Agricultural Research, 28(3): 171-
176. 1994.
Sahu, D.K. Effect of date of transplanting and potassium on growth and yield of lowland rice.
Oryza, 31(1): 38-39. 1994.
Shah, M.H., Khushu, M.K., Khandey, B.A. and Bali, A.S. Effect of spacing and seedling per hill
on transplanted rice under late sown conditions. Indian Journal of Agronomy, 36(2):
274-275. 1991.
Shah, M.H., Khusu, M.K. and Bali, A.S. Effect of spacing and number of seedlings per hill on
transplanted rice. Oryza, 24(1): 67-69. 1987.
Shinde, D.R, Dixit, A.J. and Thorat, S.T. Response of Sahyadri hybrid rice to different spacing,
seed rates and fertilizer levels under drilled condition in Konkan Region of
Maharashtra. Journal of Maharashtra Agricultural University, 30(3): 357-359. 2005.
Shukla, U.N., Srivastava, V.K., Singh, S., Sen, A. And Kumar, V. Growth, yield and economic
potential of rice (Oryza sativa) as influenced by different age of seedlings, cultivars and
Bibliography
ix
weed management under system of rice intensification. Indian Journal of Agricultural
Sciences, 84(5): 628–36, 2014.
Shukla, V.K., Sharma, R.S. and Kewat, B. Effect of spacing and fertilizer levels on growth and
yield of rice under late planting condition. Indian Journal of Agricultural Research, 18
(3): 165-167. 1984.
Siddiq, E.A. Rice production strategy for the 21st Century. Oryza, 30: 186-196. 1993.
Siddiqui, M.R.H. Lakpale, R. and Tripathi, R.S. Effect of spacing and fertilizer on medium
duration rice varieties. Indian Journal of Agronomy, 44(2): 310-312. 1999.
Singh, A.K., Singh, A., Singh, A.K., Shamim, Md., Vikram, P., Singh, S. and Chaturvedi, G.
Application of potassium iodide as a new agent for screening of drought tolerance
upland rice genotypes at flowering stage. Plant Knowledge Journal, Southern Cross
Publishing Group. 1(1):25-32. 2012.
Singh, C.B. Aujla, T.S. Sandhu, B.S. and Khera, K.L. Effect of transplanting date and irrigation
regime on growth, yield and water use efficiency in rice in northern India. Indian
Journal of Agricultural Sciences, 66(3): 137-141. 1996
Singh, G., Kumar, R., Upadhyay, V.B. and Kewat, K.T. Effect of spacing and seedling age in
yield of hybrid rice. Oryza, 40: 46-47. 2003.
Singh, H.N., Singh, U.S. and Mohanty, S. Economic assessment of Pusa Rice Hybrid 10: a
policy approach to enhancing and stabilizing income of rice farmers in Uttarakhand,
India. Presented at the 28th International Rice Research Conference, 8-12 November
2010, Hanoi, Vietnam OP13: Policy, Market, and Supply Chain. Social Sciences
Division, International Rice Research Institute, DAPO Box 7777, Metro Manila,
Philippines. 2010.
Singh, K., Singh, S.R., Singh, J.K., Rathore, R.S., Pal, S., Singh, S.P. and Roy, R.. Effect of age
of seedling and spacing on yield, economics, soil health and digestibility of rice (Oryza
sativa L.) genotypes under system of rice intensification. Indian Journal of Agricultural
Sciences, 83(5): 479–483. 2013.

Bibliography
x
Singh, K.M., Pal, S.K., Verma, U.N. and Thakur, R. Effect of time and method of planting on
performance of rice cultivar under medium land of Bihar plateau. Indian Journal of
Agronomy, 42(3): 443-445. 1997.
Singh, N., Singh, B., Rai, A.B., Dubey. A.K. and Rai, A. Impact of Direct Seeded Rice (DSR)
For Resource Conservation. Indian Research Journal of Extension Education, Special
Issue (2). 2012.
Singh, R.K., Singh, A.N., Ram, H., Prasad, S.R. and Chauhan, R.K. Response of basmati (Oryza
sativa L.) rice varieties to system of rice intensification (SRI) and conventional
methods of rice cultivation. Annals of Agricultural Research, New Series, 34(1): 50-56.
2013.
Singh, R.P. and Sen, C. HUR 105 (Malviya Sugandhit Dhan 105), a new, high-yielding, scented,
drought-tolerant rice variety for cultivation in eastern India. Genetic Research,
International Rice Research Notes. 2012.
Singh, T., Shivay, Y.S. and Singh, S. Effect of date of transplanting and nitrogen on productivity
and nitrogen use indices in hybrid and non-hybrid aromatic rice. Acta Agronomica
Hungarica, 52(3): 245-252. 2004.
Singh, T.N. Spacing and plant population for transplanted alkali soil of eastern U.P.
International Rice Research Note, 17(1): 19-20. 1992.
Singh, K. L., Devi, K. N., Athokpam, H., singh, N. B., Sagolshem, K., Meetei, W. H., and
Mangang, C. A. Effect of cultivars and planting geometry on weed infestation, growth
and yield in transplanted rice. The Ecoscan, 9(1&2): 285-288. 2015.
Sowmyalatha, B. S., Ramachandra, C., and Shivakumar, N. Response to methods of cultivation
and fertility levels on growth and yield of hybrid rice. Madras Agricultural
Journal, 99(10/12), 736-738. 2012.
Sowmyalatha, B., ramachandra, C., sivakumar, N., and krishnamurthy, N. Studies on nutrient
uptake of rice hybrids as influenced by methods of cultivation and fertility levels in
Cauvery command area.
Bibliography
xi
Srinivasan, K. Effect of plant spacing on ratoon rice performance. IRRN, 15(4): 21. 1990.
Srivastav, G.K. and Tripathi, R.S. Response of hybrid and composite rice to number of seedling
and planting geometry. Annals of Agricultural Research, 19(2): 235-236. 1998.
Sultana, M.R., Rahman, M.M., Rahman, M.H. Effect of row and hill spacing on the yield
performance of boro rice (cv. BRRI dhan45) under aerobic system of cultivation.
Journal of the Bangladesh Agricultural University, 10(1): 39-42, 2012.
Thiyagarajan, T.M., Senthilkumar, K., Bindraban, P.S., Hengsdijk, H. and Ramaswamy, S. Crop
management options for increasing water productivity in rice. Journal of Agricultural
Resource Management, 1: 169–81. 2002.
Tripathi J., Bhatta, M.R. Justice, S. Neupane, R.B. Shakya, N.R. Ghimire B.R. and Chhetri T.B.
On Farm and On Station Evaluation of Systems of Rice Intensification (SRI) For
Increased Production of Rice. In: A.K. Gautam, T. Akhtar, B. Chaudhary, J. Gaire, and
K.R. Bhatta (eds.). Rice Reserch in Nepal. Proceedings of the 24th national summer
crops research workshop, June 28-30, 2004.
Trivedi, K.K. and Kwatra, K.L. Effect of dates of transplanting and hill spacing on growth and
yield of rice. JNKVV Research Journal, 3: 227-229. 1983.
Uddin, M.J., Ahmad, S. and Hasan, M.M. Effect of spacing on morphology and yield response of
different aman rice cultivars under coastal high land ecosystem. Indian Journal of
Agricultural Sciences, 44(4): 251-258. 2010.
Uphoff, N. The system of rice intensification: using alternative cultural practices to increase rice
production and profitability from existing yield potentials. International Rice
Commission Newsletter, Number 55, UN. Food and Agriculture Organization, Rome.
2007.
Verma, A.K., Pandey, N. and Tripathi, S. Effect of transplanting spacing and number of
seedlings on productive tillers, spikelet sterility, grain yield and harvest index of hybrid
rice. IRRN, 27(1): 51. 2002.

Bibliography
xii
Verma, O.P.S., Katyal, S.K. and Sharma, H.C. Effect of planting density, fertilizer and weed
control on transplanted rice. Indian Journal of Agronomy, 33(4): 372-375. 1988.
Wagh, R.G. and Thorat, S.T. Effect of split application of nitrogen and plant densities on yield
and yield attributes of rice. Oryza, 24(1): 169-171. 1987.
Zeng, Y.J., Shi, Q.H., Li, M. Y. and Tan, X.M. Effect of fertilization and transplanting density
on mass quality and yield of rice. Acta Agricultural University Jiangxiensis, 25(3): 225-
330. 2003.
Zhang, P.J., Zhan, X.C., Zhang, M., Jiang, F.J. and Li, A. Effect of transplanting densities and
seedling number per hill on yield of medium Japonica hybrid rice ‘III You 98’. Hybrid
Rice, 19(1): 43-44. 2004.

Appendix I Common cost of rice production through direct seeding (DSR) method in Rs. ha-1
from June 2015 to November 2015.
S. No. Operations Input Rate (Rs.) Total cost
(Rs. ha-1)
1. Field preparation
a. Ploughing by MB
plough
1 deep ploughing 1800 ha-1 1800.00
b. Harrowing 2 harrowing 750 harrowing-1 1500.00
2. Layout 4 labor ha-1 294 /manday-1 1028.00
3. Planking 1 planking 200 ha-1 200.00
4. Seeding 15 labor ha-1 294 /manday-1 4410.00
5. Thinning and gap filling 5 labor ha-1 294 /manday-1 1470.00
6. Charge of irrigation water
a. Irrigation application 2 labor ha-1 294 /manday-1 588.00
b. Tube well charge For 10 hrs 40 hr-1 400.00
7. Fertilizer application
(3 applications)
2 labor ha-1 application-1 294 /manday-1 1764.00
8. Weeding
a. Chemical
Bispyribac @ 25 ml ha-1
Azimsulphuron@30 g ha-1 12.50 ml-1
35 g-1
312.50
1050.00
b. Herbicide
application
1 labor
294 /manday-1 294.00
c. Manual 12 labor ha-1 294 /manday-1 3528.00
9. Harvesting 12 labor ha-1 294 /manday-1 3528.00
10. Transportation 8 labor ha-1 294 /manday-1 2352.00
11. Threshing and Winnowing
(a) Threshing by tractor One tractor (35HP) for 4
hours ha-1
600 hr-1 2400.00
(b) Labor charge 4 labor ha-1 294 /manday-1 1176.00
12. Rental value to land 6 months 3000 annum-1 1500.00
13. Interest on working capital 6 month 14% annum-1 1946.00
14. Land revenue for 6 months 6 month 120 annum-1 60.00
Total 31360.00

Appendix II Variable cost of fertilizer in rice production through direct seeding (DSR) method
in Rs. ha-1 from June 2015 to November 2015.
S. No. Operations Input Rate (Rs.) Total cost (Rs.
ha-1)
1. Fertilizer dose of cultivars
Urea 192.82 kg ha-1 6.4 kg-1 1234.05
DAP 173.91 kg ha-1 24.8 kg-1 4312.96
MOP 133.33 kg ha-1 16.8 kg-1 2239.94
ZnSO4 5.0 kg ha-1 25 kg-1 125
Total 7911.95
Appendix III Variable cost of seed in rice production through direct seeding (DSR) method in
Rs. ha-1 from June 2015 to November 2015.
Treatment Seed rate (kg ha-1) Seed cost ( Rs. kg-1) Total cost of seed
(Rs. ha-1)
ARIZE 6444
20 × 10 cm2 12 295 3540
25 × 25 cm2 7 295 2065
PHB 71
20 × 10 cm2 13 280 3640
25 × 25 cm2 8 280 2240
PRH 10
20 × 10 cm2 13 250 3250
25 × 25 cm2 08 200 2000
MTU 7029
20 × 10 cm2 18 35 630
25 × 25 cm2 13 35 455
HUR 105
20 × 10 cm2 15 35 525
25 × 25 cm2 10 35 350