ECR Performance Analysis tools
J.-T. Acquaviva (CEA / ECR), T. Moseley (Google), S. Koliai (Univ
Delaware), A. Charif-Rubial (UVSQ/ECR), E. Oseret (ECR), Z.
Bendifallah (ECR), M. Tribalat (ECR), C. Valensi (ECR), W. Jalby
(UVSQ/ECR)

2
Our focus in the Exascale World
• DEFINITION: a node is a shared memory multicore coupled with accelerators
• STATEMENT: optimizing single node performance is essential to reach Exascale level: 10 000 x 0 = 0 although you can get nice speedups ☺
• Single node architecture is becoming more and more complex� More and more cores� Increased importance of vector hardware� More complex memory systems (NUMA)
� Accelerators

3
How to deal with performance issues
• Detect performance issues, analyze/evaluate them� Use performance hardware counters to locate bottlenecks
• After performance problem analysis, fix performance issues� The main “performance knob” at our disposal are instructions
� Change the source code or assembly to remove performance issues
• First (well known) technique: profiling� Down to a few hot routines � Then analyze loop behavior� Four key issues: source code, compiler, OS, hardware

4
An overlooked issue: ROI
• Once you know the performance issues, analyze/evaluate them� CLASSIC: In general, work is done on the most time consuming
loops/routines� BETTER: Sort them out by performance impact importance (ROI)� Trade off between cost and potential performance gains
• Importance of ROI (Return On Investment)� Routine A consumes 40% of execution time and performance gains are
estimated on routine A at 10%: overall gain 4%� Routine B consumes 20% of execution time and performance gains are
estimated on routine B at 50%: overall gain 10%
5
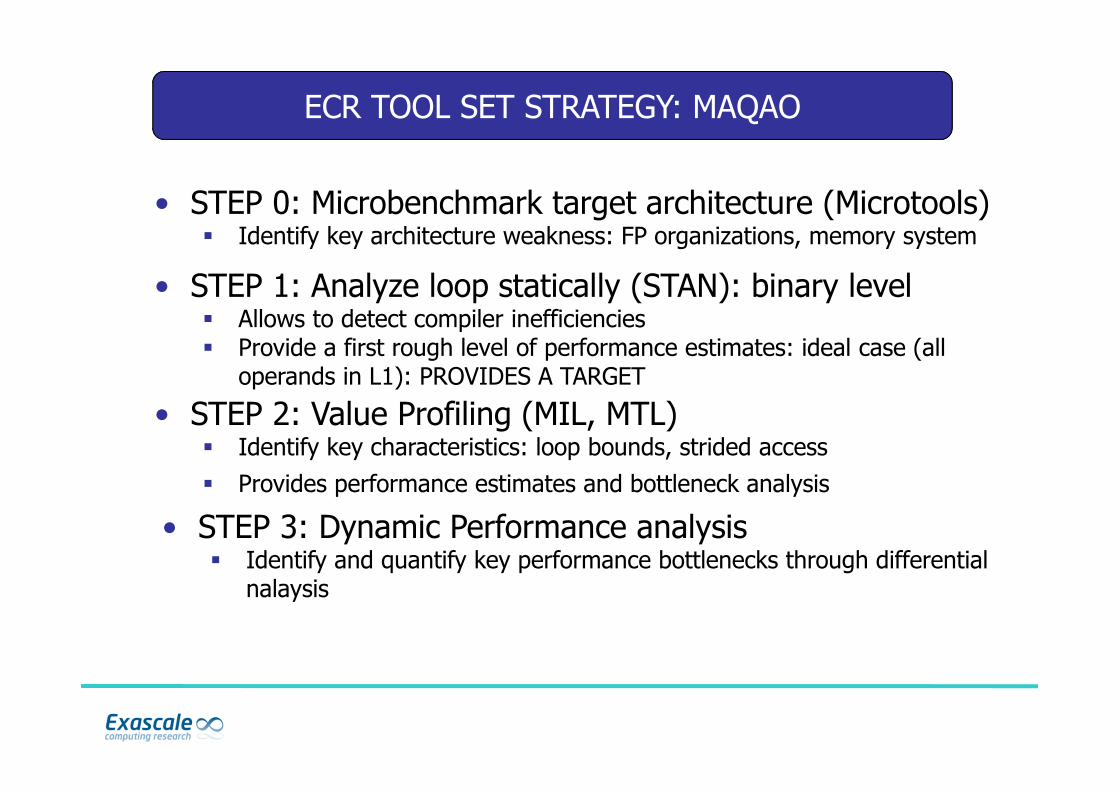
ECR TOOL SET STRATEGY: MAQAO
• STEP 2: Value Profiling (MIL, MTL)� Identify key characteristics: loop bounds, strided access
� Provides performance estimates and bottleneck analysis
• STEP 3: Dynamic Performance analysis� Identify and quantify key performance bottlenecks through differential
nalaysis
• STEP 0: Microbenchmark target architecture (Microtools) � Identify key architecture weakness: FP organizations, memory system
• STEP 1: Analyze loop statically (STAN): binary level � Allows to detect compiler inefficiencies� Provide a first rough level of performance estimates: ideal case (all
operands in L1): PROVIDES A TARGET

6
Hardware performance counters/events
In general, performance events give an aggregate view of the routine/loop behavior:
� Number of cache misses� All of the instructions are “lumped” together: no individual
view/report of an instruction� REMEMBER: our main knob is at instruction level

7
Conflict on address disambiguation
Consider the C kernel :
If we have addresses such as :
With offset = 1, there is a conflict between :The store a[ (i) ] from iteration iThe load b[ (i+1) - 1 ] from iteration i+1
THIS IS KNOWN AS THE 4 KB ALIASING PROBLEM
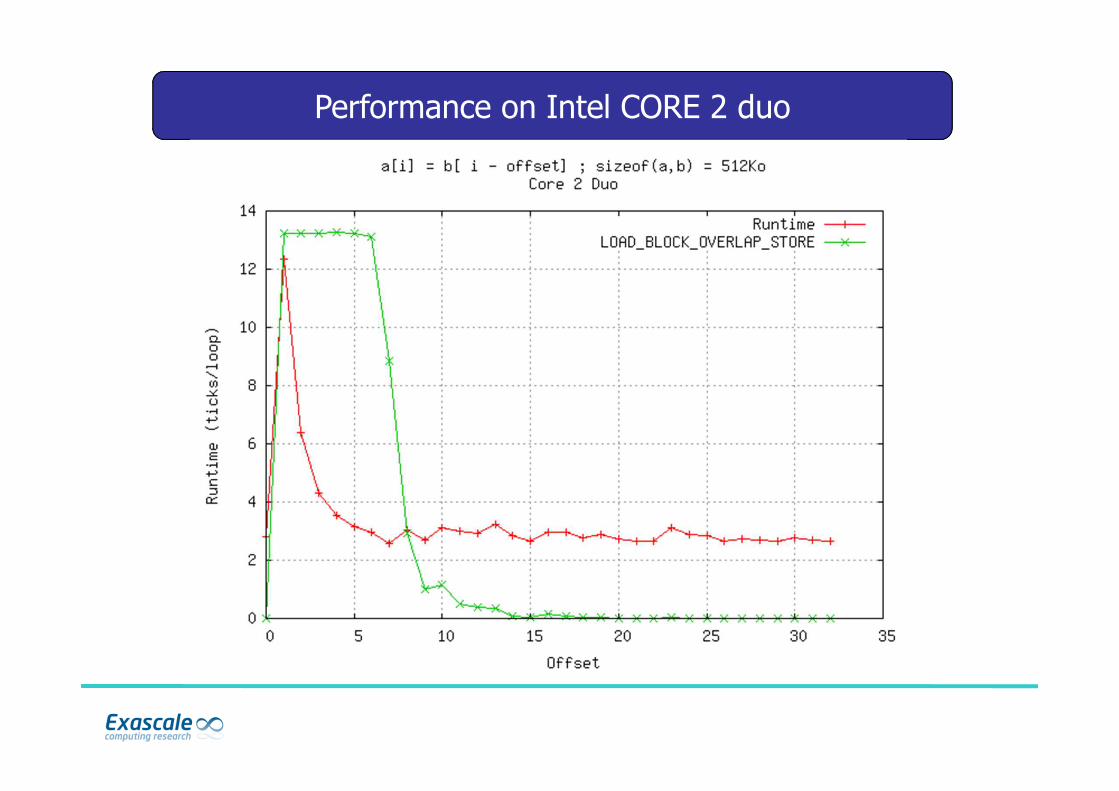
This can be detected with hardware counter :LOAD_BLOCK.OVERLAP_STORE
for (int i = 0 ; i < SIZE ; ++i )a[ i ] = b[ i – offset ]
a % 4kB = b % 4kB (same low order 12 bits)
8
Performance on Intel CORE 2 duo
9
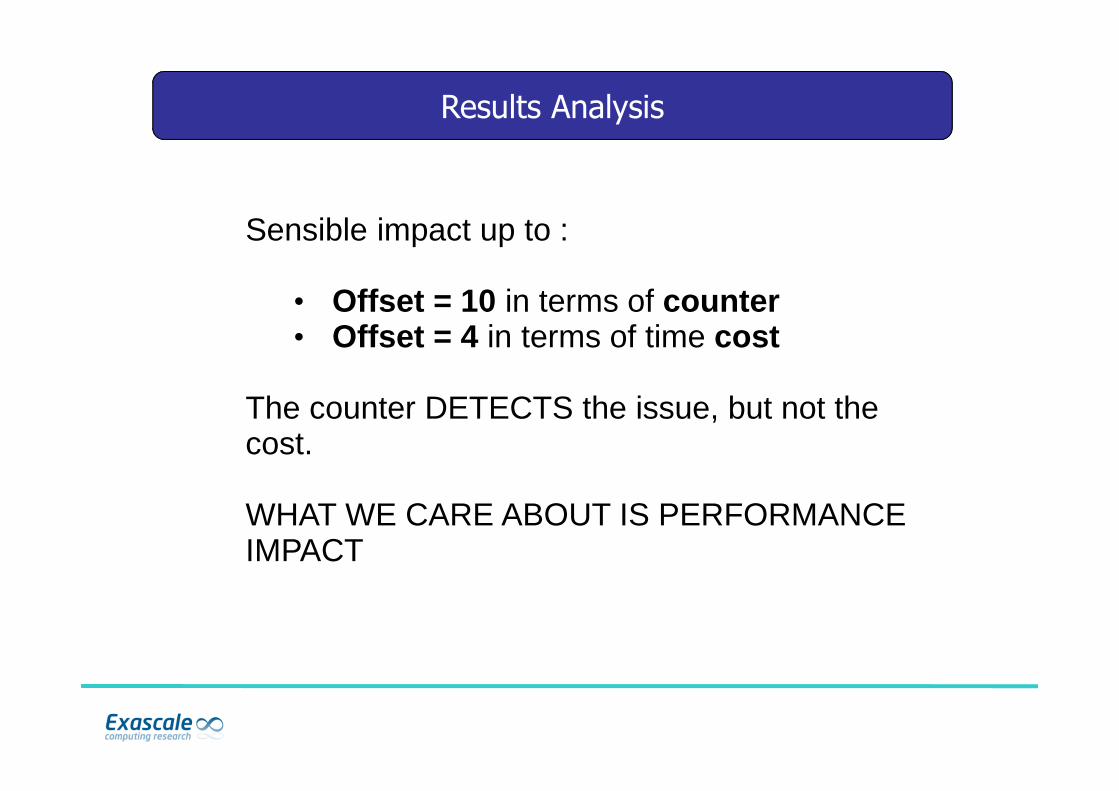
Results Analysis
Sensible impact up to :
• Offset = 10 in terms of counter• Offset = 4 in terms of time cost
The counter DETECTS the issue, but not the cost.
WHAT WE CARE ABOUT IS PERFORMANCE IMPACT
10
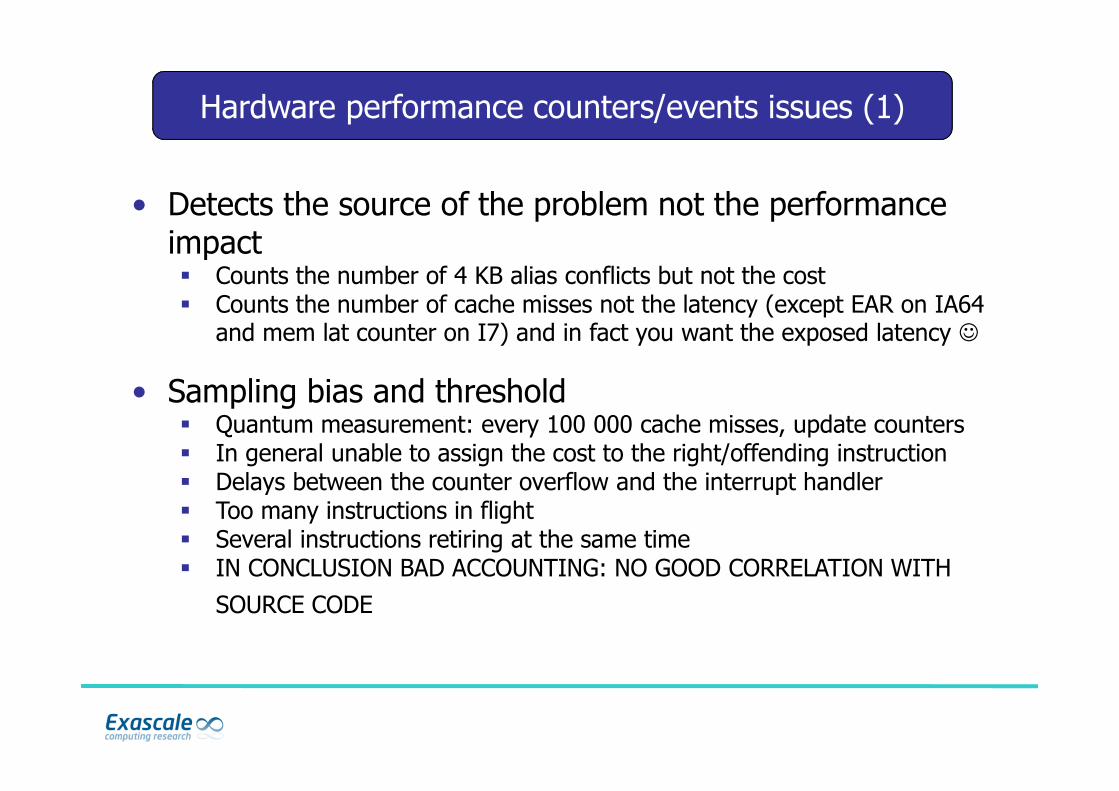
Hardware performance counters/events issues (1)
• Detects the source of the problem not the performance impact� Counts the number of 4 KB alias conflicts but not the cost� Counts the number of cache misses not the latency (except EAR on IA64
and mem lat counter on I7) and in fact you want the exposed latency ☺
• Sampling bias and threshold� Quantum measurement: every 100 000 cache misses, update counters� In general unable to assign the cost to the right/offending instruction� Delays between the counter overflow and the interrupt handler� Too many instructions in flight� Several instructions retiring at the same time� IN CONCLUSION BAD ACCOUNTING: NO GOOD CORRELATION WITH
SOURCE CODE
11
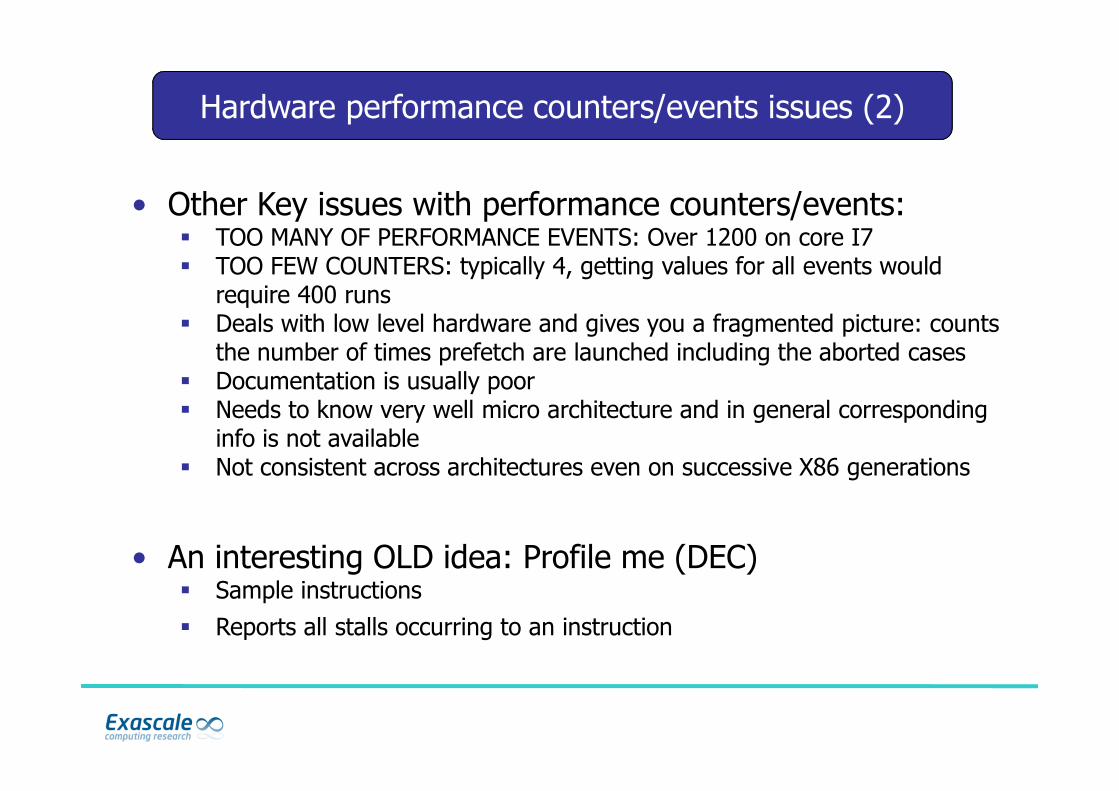
Hardware performance counters/events issues (2)
• Other Key issues with performance counters/events: � TOO MANY OF PERFORMANCE EVENTS: Over 1200 on core I7� TOO FEW COUNTERS: typically 4, getting values for all events would
require 400 runs� Deals with low level hardware and gives you a fragmented picture: counts
the number of times prefetch are launched including the aborted cases� Documentation is usually poor� Needs to know very well micro architecture and in general corresponding
info is not available� Not consistent across architectures even on successive X86 generations
• An interesting OLD idea: Profile me (DEC)� Sample instructions
� Reports all stalls occurring to an instruction

12
Introduction to DECAN (1)
• Be a physicist:� Consider the machine as a black box� Send signals in: code fragments� Observe/measure signals out: time and maybe other metrics
• Signals in/Signals out� Slightly modify incoming signals and observe difference/variations in
signals out
� Tight control on incoming signal
• In coming signal: code� Modify source code: easy but dangerous: the compiler is in the
way� Modify assembly/binary: much finer control but cautious about
correlation with source code

13
Introduction to DECAN (2)
• GOAL 1: detect the offending/delinquent operations
• GOAL 2: get an idea of potential performance gain

14
DECAN: General Concept (1)
• DECAN’s concept is simple:
� Measure the original binary
� Patch the target instruction(s) in the original binary
� New binary is generated for each patch
� Measure new binaries
� Compare measurements and evaluate instruction cost differentially
� CLEAR NEED: manipulate/transform/patch binaries
15
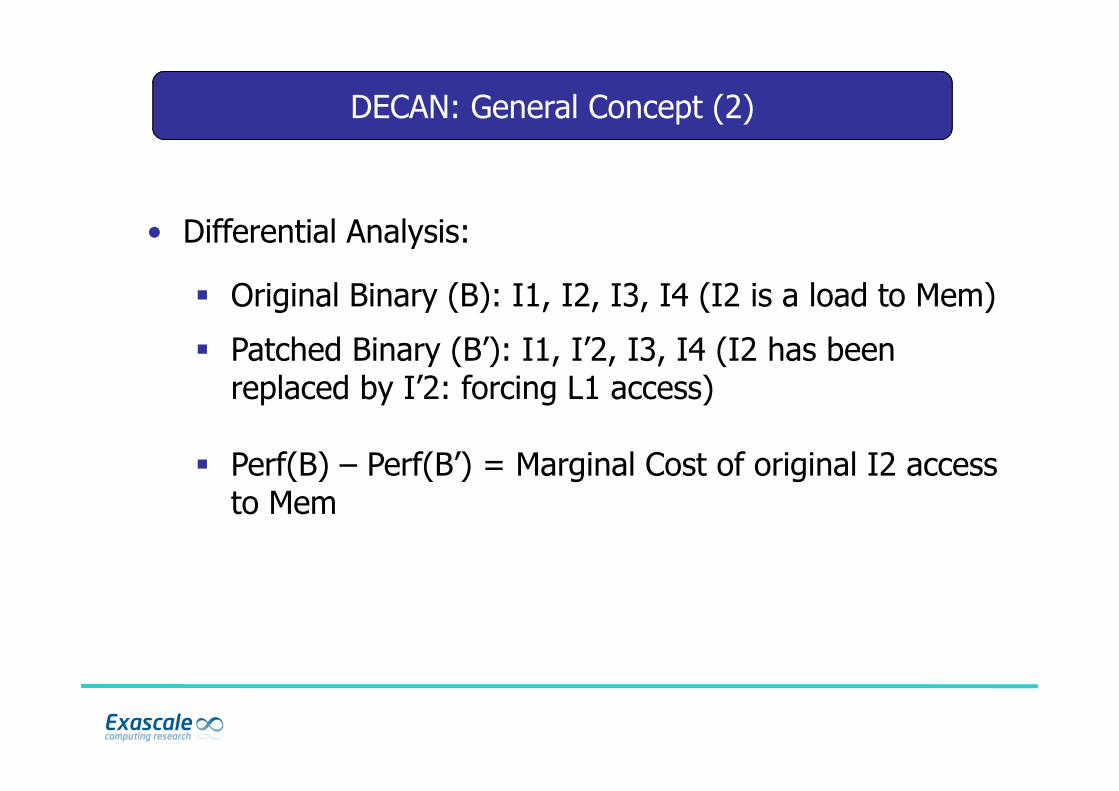
DECAN: General Concept (2)
• Differential Analysis:
� Original Binary (B): I1, I2, I3, I4 (I2 is a load to Mem)
� Patched Binary (B’): I1, I’2, I3, I4 (I2 has been replaced by I’2: forcing L1 access)
� Perf(B) – Perf(B’) = Marginal Cost of original I2 access to Mem

Stride1, perfect load balance
Only two problems: Divide and Recurrence
Target: 4 core SNB
16
Motivating example (1)

17
- Step 1: A time Profiling is performed on the
original code for different Data sets.
1- Original version
Motivating example (2)

- Step 2: All the vector arithmetic operations have been deleted from the loop. The new version performs only memory operations (Loads & Stores).
18
2- LSIS_AS version
Motivating example (3)

Step 3: Another version is generated where all the memory operations are deleted from the loop. Only arithmetic operations (FP SSE/AVX) are performed.
19
3- FPIS version
Motivating example (4)

20
Compute bound Memory bound
Observation : Within small datasets the program is highly memory bound (Big gap between fpis and lsis_AS.Question : What operation makes it highly compute bound ?
Motivating example (5)

2121
A new version of the loop is tested where the reduction is deleted.The new curve is equivalent to the original one => The reduction is notthe source of the bottleneck
4- NORED version
Motivating example (6)

2222
- A new version of the loop is tested where the division is deleted.The new curve is almost equivalent to the LSIS_AS => The division is the key performance bottleneck.
5- NODIV version
Motivating example (7)

23
Coherency cost analysis (1)
• RTM (Reverse Time Migration code):� OpenMP version� Same array written by all cores and then read by all cores� Due to stencil operator, some data are produced by a core and
then read by another one� Potential false sharing and then coherency traffic
• Use of Decan to study false sharing/coherency impact� Stores are the problem source.� First idea: suppress stores (NO_STORE variant). Issue: cache usage
can be altered� Better idea: S2L: Stores are replaced by Lodas (operand
swapping): same cache footprint� Measure Original whole code and then compare with the Decanned
variant (a single loop is treated at a time): no speedup means
coherency cost negligible.
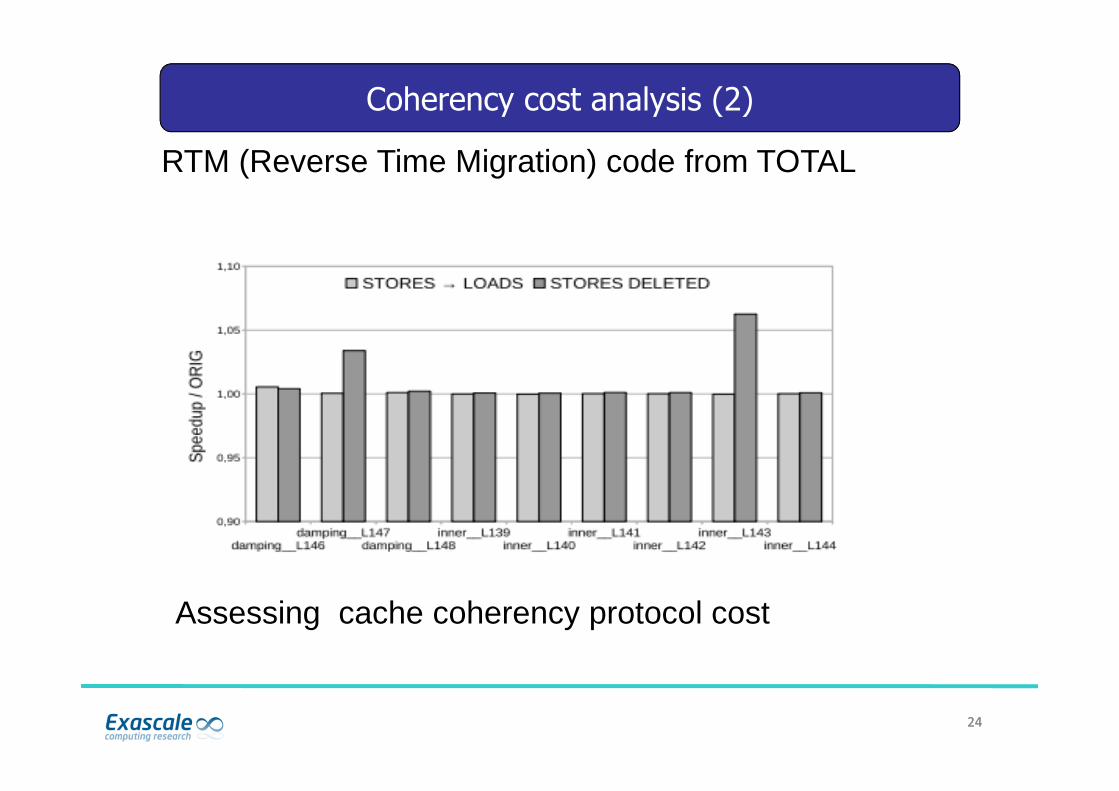
RTM (Reverse Time Migration) code from TOTAL
Assessing cache coherency protocol cost
2424
Coherency cost analysis (2)

25
DECAN limitations (1)
• Dealing with side effects:� “Suppressing” instructions is not exactly neutral: it modifies
front end behavior� Large set of experiments allows to “recoup”
• Dealing with If within loop bodies� Typical case: if (A(I)) > 0) THEN …. ELSE� Suppressing access to A(I) is equivalent to Nopping the
branch
� DECAN provides info but care has to be taken
• SEMANTICS is lost� From a performance point of view, limited importance
but pay attention to some corner cases� Some experiments in a DECAN series can crash: for
example suppress the access to indirection vectors: that
can be identified by DDG analysis

26
DECAN limitations (2)
• DECAN is a microscope: applicable to loops only� Needs to be coupled with good profiling
• Measurement accuracy� Let us think of a loop with 100 groups (each of them
accessing a different arrays): suppressing one group might be equivalent to suppress 1% work, hard to detect.
� Some experiments in the DECAN series can crash: for
example NOP the access to indirection vectors
27
Conclusion & Future Work
• DECAN: a tool for automatic differential performance analysis.
• DECAN identifies delinquent operations
• DECAN gets an estimate of potential performance gain
• Fully integrate DECAN in the tool chain
• Improve user feedback: synthesis of DECAN results
• Extend DECAN to address branch instructions to detect miss-prediction