ECONOMICS DEPARTMENT
WORKING PAPER
2008
Department of Economics Tufts University
Medford, MA 02155 (617) 627-3560
http://ase.tufts.edu/econ

1
ALL IN THE EXTENDED FAMILY: GRANDPARENTS AND COLLEGE ATTENDANCE*
Abstract
Previous work on social interactions has analyzed the effects of nuclear family,
peer, school, and neighborhood characteristics. None has previously demonstrated that
grandparents also alter grandchildren’s schooling independently of parents. This paper
shows that higher years of schooling of grandmothers and grandfathers increase
respectively college attendance rates for granddaughters and grandsons. These effects do
not simply result from correlation with unobserved parent’s characteristics. The paper
has methodological implications for measuring the size of background effects and for
policies that change outcomes by altering social interactions. (EconLit: I200)
©2007 by Linda Datcher Loury. All rights reserved. Short sections of text, not to exceed two paragraphs, may be quoted without explicit permission provided that full credit, including © notice, is given to the source. Linda Datcher Loury Associate Professor of Economics Department of Economics Tufts University 617-627-3348 email: [email protected]
* The author would like to acknowledge helpful comments from Nehemiah Loury, Roberto Fernandez, and Yannis Ioannides.

2
I. Introduction
Sociologists and economists have long recognized that parent’s characteristics
affect children’s schooling. However, none have previously demonstrated that
grandparents alter grandchildren’s schooling independently of parents. Grandparents
could influence schooling by serving as role models, by sanctioning or encouraging
particular behaviors, and by introducing individuals to information not available
elsewhere.
This paper shows that grandmothers affect their granddaughter’s schooling and
that grandfathers influence their grandson’s schooling. Correlation between grandparent
characteristics and unobserved parent variables does not account for these results. This
means that the web of social interactions is even more complex than implied by nuclear
family, peer, school, and neighborhood relationships.
II. Literature Review
Becker (1986) shows that, even without a direct connection, higher grandparent’s
schooling is associated with higher grandchildren’s educational attainment. According to
his model, parents maximize utility which is a function of their own consumption and the
utility of their children. Adult earnings are determined by human capital (e.g. schooling)
and market luck, schooling depends on parent’s investments and children’s endowments
(Et), and children’s endowments, in turn, depend only on parent’s endowment (Et-l) and
random error (vt)
(1) Et = αt+h1Et-l + vt.
If capital markets are imperfect and parents invest optimally, children’s schooling is
given by:

3
(2) Ht= θ*( Et, Ht-1 + ηt-1) or its linear approximation
(3) Ht=βEEt+ βH (Ht-1 + ηt-1)
where Ht-1 is parent’s education1, ηt-1 consists of parent’s market luck and other
determinants of parent’s income, and Ht-1 + ηt-1 equals parent’s income,.
Substituting for Et (using equation (1)) and then for Et-1 using the version of
equation (3) for the parent’s generation, equation (3) can be rewritten as:
(4) Ht =ct + (βH+h1)Ht-1 – βHh1 Ht-2 + βHηt-1 + ωt.
The coefficient of parent’s education is biased upwards by h1, the relationship between
endowments across generations of parents and children. On the other hand, holding
parent’s education constant, higher grandparent’s schooling implies lower parent’s
endowments. Lower parent’s endowments, in turn, reduce grandchildren’s schooling.
The negative effect of grandparent’s schooling (-βh1), therefore, results solely from its
correlation with parent’s endowment.
Even if this model is accurate, analysts (e.g. Behrman and Taubman, 1985) may
not actually estimate negative coefficients for grandparent’s schooling. Grandparent’s
schooling may be correlated with left-out determinants of parent’s income (ηt-1). In this
case, grandparent’s schooling appears to raise grandchildren’s education only because
grandparent’s schooling is associated with higher parent’s financial or other resources.
This paper determines whether grandparent’s schooling increases grandchildren’s
schooling independent of parent’s endowments, income, or other characteristics. Such an
effect would follow if children’s endowments depend both on parent’s endowment (Et-l)
and grandparent’s endowments (Et-2):
(5) Et = αt+h1Et-l +h2Et-2 + vt.

4
Children’s schooling can then be linearly approximated by:
(6) Ht =ct + (βH+h1)Ht-1 – βHh1 Ht-2 + βEh2 Et-2 + βHηt-1 + ω*t
When Et-2 is not included in the analysis, higher grandparent’s education may result in
higher grandchildren’s schooling because it is correlated with grandparent’s endowments
(Et-2)2.
It is difficult to identify the exact components of grandparent’s endowments that
would generate these effects (βEh2) since they could come from many sources3. For
example, Manski (2004) shows that, if the schooling/earnings relationship changes little
over time, knowledge from previous generations narrows the range of possibilities that
later generations regard as plausible. Reducing uncertainty then increases the willingness
to invest in schooling. Other work (Hitchcock, 1990) indicates that, while occupational
earnings have changed over time, the relative rankings of jobs have, in fact, remained
fairly constant.
The labor market knowledge transmitted between generations depends on gender.
The index of occupational segregation continues to be high (for example, from 58.6 in
1980 to 53.1 in 1997 according to Wells, 1998) even though those composing the
working population have changed. Jobs held by grandfathers would, therefore, inform
grandsons about schooling and the labor market better than granddaughters and the jobs
held by grandmothers would inform granddaughters better than grandsons.
Besides lowering uncertainty, higher grandparent’s education increases
grandchildren’s schooling because individuals conform to the behavior or expectations of
significant others (Akerlof, 1997; Cheng and Starks, 2002). While some previous
research analyzes peer effects, other work emphasizes the role of adults, especially family

5
members. Case studies from Ianni (1989) found “considerable evidence of turning to
adults for information, validation, and guidance for the future” (p. 86) from early to
middle adolescence. According to Beam, Chen, and Greenberger (2002), 52 percent of a
sample of 11th graders cited older relatives as very important non-parental adults in their
lives (see also Scales and Gibbons, 1996; Cherlin and Furstenberg, 1986; and Denham
and Smith, 1989.)
As in the case of peer effects (Hoxby, 2000), conformity to the behavior or
expectations of non-parental significant others may differ by gender. In Blyth and
Foster-Clark (1987), adolescent boys and girls mentioned extended family adult males as
intimates equally as often (58 percent) 4. However, girls were more likely to include
extended family adult females (75 versus 57 percent). In Blythe, Hill, and Thiel (1982)
seventy percent of male and 79 percent of female seventh through tenth graders listed at
least one adult extended family member as an important person in their lives5. Girls
included more female adult extended family members as important others (1.63) than
boys (1.04). Boys reported about same number of male adult extended family members
(1.08) as girls (1.06). Boys, however, cited significant adult male influences more often
in Hirsch, Mickus, and Boerger (2002) and Coates (1987).
III. Data and Empirical Results
This paper uses two data sources to estimate the effects of grandparent’s
schooling on college attendance for grandchildren. The first combines National
Longitudinal Survey of Youth (NLSY) and the Children of the National Longitudinal
Survey of Youth (CNLSY). The NLSY is a nationally representative panel of 12,686
individuals ages 14-22 in 1979 who were interviewed annually to gather information

6
about schooling, work, and other experiences. Beginning in 1986, the CNLSY collected
information annually or biennially on children of the original female NLSY respondents.
The second data source is the National Longitudinal Study of Youth, 1997
(NLSY97). The survey includes a wide range of information about employment,
education, background and other characteristics for a nationally representative sample of
individuals aged 12 to 17 in 1997. The sample was re-interviewed annually between
1997 and 2003. In addition, their parents were interviewed in 1997 and provided
information about their own characteristics.
This paper measures college attendance for CNLSY sample members ages 19-26
as of 2002. Older sample members (ages 27-32) were excluded to reduce
overrepresentation from children born to younger women. The sample children were age
3 at most in 1979 when NLSY members were ages 14-246. Information about
grandparents and many background characteristics came from the mother’s NLSY
interviews. No information was available about grandparents on the father’s side.
College attendance for the main NLSY97 sample members was measured as of
the 2003 interview when individuals were ages 18 to 23. Data about the number of other
household members and whether the individual lived in a two parent household at age 12
came from the original 1997 main sample interviews. Information about maternal and
paternal grandparents’ schooling and information about parent’s income, schooling, and
AFDC participation was taken from the 1997 parent’s interview7.
Separate probit analyses by gender were estimated using the form:
(7) Y = βGM’ XGM + βGP’XGP + βO’ XO + ZU + ε

7
where Y is a dummy variable for whether the individual attended college, XGM equals
schooling of grandmothers, XGP equals schooling of grandfathers, and XO equals other
observed background variables. The ZU are unobserved background and other
characteristics. According to the uncertainty and conformity literatures discussed above,
βGM should be larger for granddaughters and βGP should be larger for grandsons.
Table 1 lists means and standard deviations of education attainment and selected
family variables for both the CNLSY and NLSY97 samples. In each case, women
attended college more often than men. However, some variable means differ between
samples because the CNLSY disproportionately includes children born to younger
mothers. NLSY and NLSY97 mothers averaged about 12 and 13 years of schooling
respectively. CNLSY members were only about two-thirds as likely to attend college as
NLSY97 respondents. Roughly 40-45 percent of CNLSY maternal grandmothers and
grandfathers reported at least 12 years of schooling8. Counting both maternal and
paternal grandparents, NLSY97 grandmothers and grandfathers were about 10 percentage
points more likely to have at least 12 years of schooling.
Columns (1) and (2) of Table 2 list CNLSY probit college attendance results
using a basic set of nuclear family and demographic characteristics. Each additional year
of mother’s schooling increased college attendance rates by roughly 2-3 percentage
points for both sons and daughters. Each additional year that the family received AFDC
had a somewhat smaller impact. While the effect of father’s schooling on college
attendance was higher for sons, the effect of living in two-parent families was larger for
daughters.

8
Columns (3) and (4) of Table 2 show the results from adding grandparent’s
schooling, mother’s Air Forces Qualifying Test scores (AFQT) and HOME Inventory
scores to the analyses9. AFQT scores significantly raised college attendance only for
females, but HOME scores had large and significant effects on college attendance for
both sons and daughters.
The effects of grandparent’s education were not uniform. Neither grandfather’s
nor grandmother’s schooling had a significant effect on granddaughters in column (4),
and, according to column (3), grandfathers had small, insignificant effects on
granddaughters. In contrast, column (3) shows that college attendance rates were roughly
13 percentage points higher for grandsons with grandfathers who had at least 12 years of
schooling compared to those with less well-educated grandfathers10. In analysis not
shown here, the grandson coefficient for grandfather with 12 or more years of schooling
is significantly larger than the granddaughter coefficient11. As indicated earlier,
conformity effects and the information older generations convey about the schooling and
careers may explain the grandfather’s influences.
The gender-specific effects for grandsons are consistent with related research.
According Benin and Johnson (1984), educational attainment is more highly correlated
between older and younger brothers than between older and younger sisters. Loury
(2006) showed that young men who found their jobs through older male relatives had
higher earnings than those using other sources.
More detailed analysis indicates that omitted parent’s or other variables do not
account for the estimated effects of grandfather’s education. For example, according to
basic Becker model (1981), holding parent’s schooling constant, grandparent’s and

9
parent’s endowments (and therefore grandchildren’s endowments) are negatively
correlated (see equation 4). However, more grandfather’s schooling significantly raised
college attendance for grandsons in Table 2. This finding does not by itself establish
independent effects of grandparent education. The positive coefficients could result from
omitted parent’s characteristics.
A second confirmation of independent grandfather’s influences follows if the
omitted variables are correlated with parents’ schooling and AFDC receipt. Adding
mother’s Armed Forces Qualifying Test (AFQT) and HOME Inventory scores changed
the coefficients of parents’ education and AFDC receipt from large positive and
significant in column (1) to much smaller and insignificant in column (3)12. This implies
that any initial upward bias in the effects of parents’ schooling and AFDC receipt on
grandsons due to omitted parent’s characteristics declined substantially between columns
(1) and (3).
The coefficients fell partly because parents’ schooling and AFDC receipt proxy
for many family characteristics that the HOME Inventory measures directly. The HOME
Inventory gauges the amount and quality of the stimulation and support in the child’s
family environment (Bradley et al, 2000). These includes indicators of the physical
environment, learning materials, modeling, instructional activities, regulatory activities,
variety of experience, acceptance and responsivity in the child’s home.
Unlike the coefficients of parents’ schooling and AFDC receipt, the coefficients
of grandfather’s schooling are virtually identical to those in column 3 if HOME scores
are left out of the analysis13. This means that the influence of unobserved parent’s
10
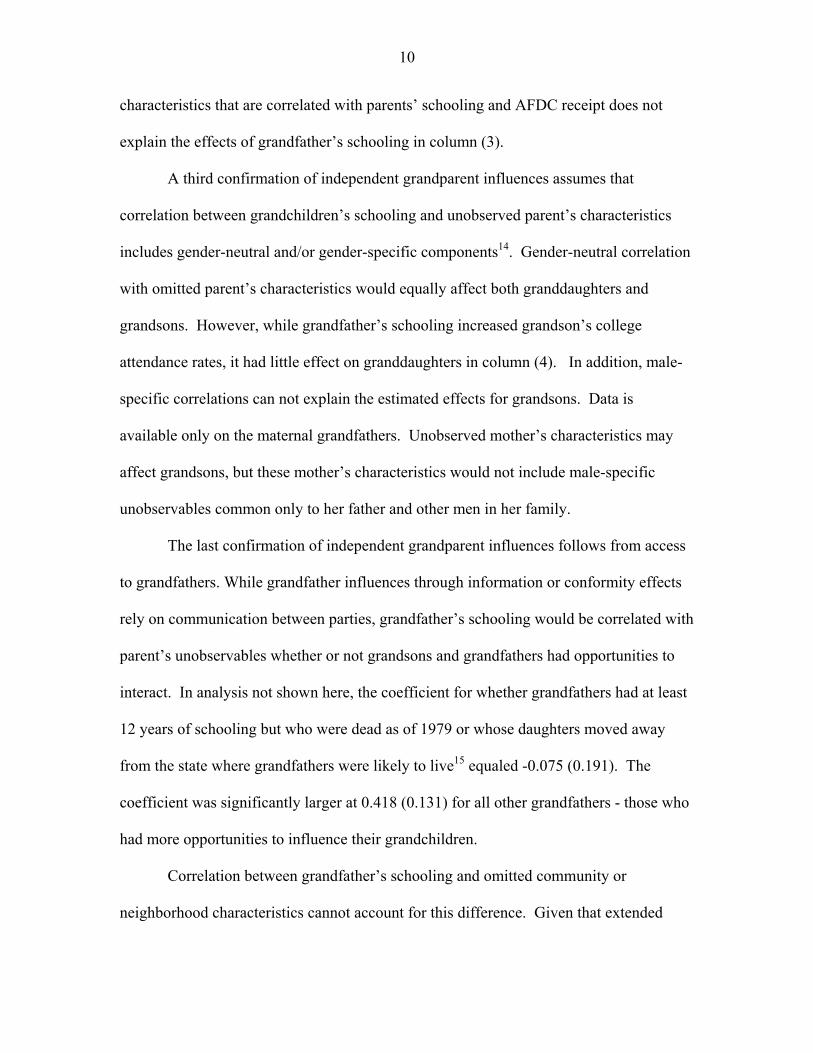
characteristics that are correlated with parents’ schooling and AFDC receipt does not
explain the effects of grandfather’s schooling in column (3).
A third confirmation of independent grandparent influences assumes that
correlation between grandchildren’s schooling and unobserved parent’s characteristics
includes gender-neutral and/or gender-specific components14. Gender-neutral correlation
with omitted parent’s characteristics would equally affect both granddaughters and
grandsons. However, while grandfather’s schooling increased grandson’s college
attendance rates, it had little effect on granddaughters in column (4). In addition, male-
specific correlations can not explain the estimated effects for grandsons. Data is
available only on the maternal grandfathers. Unobserved mother’s characteristics may
affect grandsons, but these mother’s characteristics would not include male-specific
unobservables common only to her father and other men in her family.
The last confirmation of independent grandparent influences follows from access
to grandfathers. While grandfather influences through information or conformity effects
rely on communication between parties, grandfather’s schooling would be correlated with
parent’s unobservables whether or not grandsons and grandfathers had opportunities to
interact. In analysis not shown here, the coefficient for whether grandfathers had at least
12 years of schooling but who were dead as of 1979 or whose daughters moved away
from the state where grandfathers were likely to live15 equaled -0.075 (0.191). The
coefficient was significantly larger at 0.418 (0.131) for all other grandfathers - those who
had more opportunities to influence their grandchildren.
Correlation between grandfather’s schooling and omitted community or
neighborhood characteristics cannot account for this difference. Given that extended
11
family members generally do not live in the same neighborhoods (see Logan and Spitze,
1994), the correspondence between grandfather’s schooling and neighborhood
unobservables is likely to be small. Furthermore, if county-wide poverty rates and
percentages of individuals with four or more years of schooling or four or more years of
college are added to the analysis, their coefficients are insignificant and the effect of
grandfather’s schooling does not change.
The 13 percentage-points effect of grandfather’s schooling on whether CNLSY
grandsons attended college is unexpectedly large. Overrepresentation of relatively young
and, therefore, less well-educated mothers in the NLSY sample may account for this
large influence. Grandfathers with more schooling could provide novel information
about the labor market not available elsewhere or act as models of behavior markedly
different from other family members.
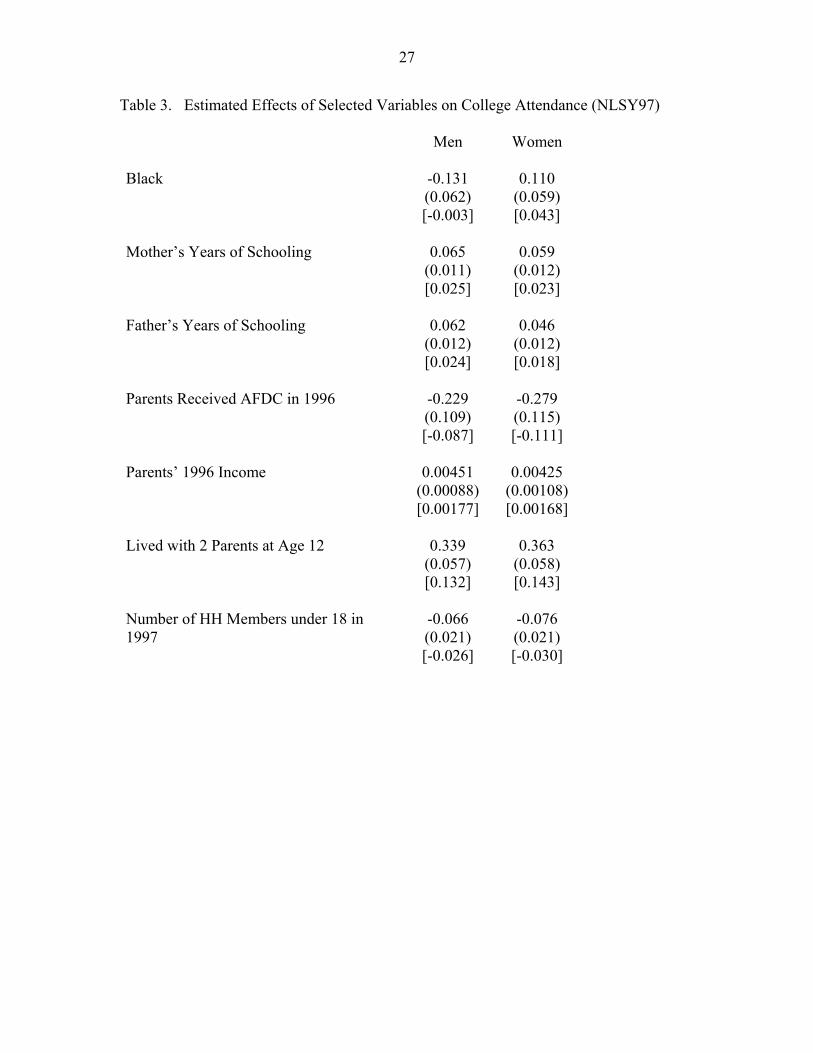
Table 3 lists the college attendance probit results for the more representative
NLSY97 sample. It shows that black men were less likely and black women were more
likely to attend college than their white counterparts holding background constant16. The
sizes of most of the background effects were, however, similar across genders. Each
additional year of mother’s or father’s schooling raised the probability of attending
college by 2 to 2-1/2 percentage points. Each additional sibling reduced that likelihood
by a similar 2-1/2 to 3 percentage points. Those in families receiving AFDC payments in
1996 had lower rates, and those in households with higher 1996 incomes attended college
more frequently.
In contrast, the coefficients of grandparent’s schooling vary by gender. Although
grandmother’s schooling had no significant effect on grandsons, males with at least one

12
grandfather who had 12 or more years of schooling were 6 or 8 percentage points more
like to attend college17. Similarly, while grandfather schooling coefficients were
insignificant for granddaughters, those with at least one grandmother with more than 12
years of education were 10 percentage points more like to attend college than those
whose grandmothers had less than a high school diploma.18 The difference between the
male and female coefficients (0.010 (0.077) and 0.266 (0.084) respectively) for any
grandmothers with more than 12 years of schooling is significant at the 5 percent level.
As in the case of the CNLSY sample, gender-neutral correlation with unobserved
parent’s characteristics cannot account for the results. Gender-neutral correlation
implies that grandfather’s and grandmother’s influences would apply equally to
grandsons and granddaughters. However, the significant effects in Table 2 are gender-
matched.
Furthermore, gender-specific correlation with unobserved parent’s characteristics
also cannot explain the results. Gender-specific correlation implies that maternal
grandmothers would influence granddaughters more than paternal grandmothers.
Maternal grandmother’s schooling affects mother’s unobservables which, in turn,
influence granddaughters. Paternal grandmothers would not alter mother’s unobservables
in the same way. Using the same reasoning, paternal grandfathers would influence
grandsons more than maternal grandfathers.
In results not shown here, the point estimate for paternal grandmother’s college
attendance on granddaughter’s schooling (0.268 (0.149)) is, in fact, slightly larger than
the point estimate for maternal grandmothers (0.196 (0.090))19. Similarly, the point

13
estimate for maternal grandfather’s college attendance on grandson’s schooling is greater
(0.192 (0.072)) than that of paternal grandfather’s college attendance (0.101 (0.133)).
The effects of grandparents differ between the NLSY97 and CNLSY samples. As
indicated earlier, differences in the socioeconomic status of the nuclear families between
samples may explain the larger grandfather effect for the CNLSY sample. Educated
grandfathers may affect grandsons more in disadvantaged nuclear families. On the other
hand, differences in grandmother’s education may account for its larger effects for the
NLSY97 sample. Role model and other conformity influence may be higher because
NLSY97 maternal grandmothers who attended college graduated (8.3 out of 19.3
percent) more often than CNLSY grandmothers (3.6 out of 12.1 percent). In addition,
these grandmothers may provide more information about the relationship between the
labor market and schooling. Labor force participation rates for female college graduates
have historically been substantially higher than for those with 13- 15 years of schooling
(Smith and Welch, Table 6, 1984).
IV. Summary
Although other research concludes that family history matters, this paper shows
that intergenerational effects are more pervasive than previously demonstrated. The
gender-matched effects of grandparent’s education on whether grandchildren attended
college indicate that differences in schooling two generations away directly affect
educational choices. Historical consequences of inequality would, therefore, tend to
linger on much longer.
Alone each component of the more detailed analysis would not be sufficient to
rule out spurious correlation with parent’s unobservables. However, jointly they imply

14
that such an interpretation is unlikely to explain the results. The effects are large,
positive, and significant unlike the negative effect predicted by the basic Becker model.
The NLSY effects of grandfathers on grandsons do not change substantially after
controlling for family characteristics (i.e. HOME scores) that account for most of the
effects of parents’ schooling and AFDC receipt on children’s college attendance.
Gender-neutral correlation with parents’ unobservables cannot explain the pattern of
effects since grandfathers affect only grandsons and grandmothers affect only
granddaughters. Gender-specific correlation with parents’ unobservables cannot explain
the pattern since paternal grandmothers have roughly the same effect as maternal
grandmothers and paternal grandfathers have roughly the same effect as maternal
grandfathers. While the effects from correlation with parent’s unobservables would not
require communication between generations, the NLSY grandfather effects are large and
positive only if grandsons and grandfathers are able to interact. Finally, five out of the
eight possible gender-matched grandparent coefficients (including all four for men) are
positive and significant.
The paper has methodological implications. Some analysts have used
grandparent’s characteristics as instruments for parent’s variables in intergenerational
analyses of earnings and schooling (Lillard and Willis, 1994). Given the results here, this
approach does not appear to be appropriate for U.S. samples. Furthermore, since
grandparents affect grandchildren’s schooling independent of parent’s characteristics,
previous estimates of the overall effects of background on schooling based on nuclear
family, peer, and neighborhood characteristics would understate the total effect of social
interactions. The gender-specific character of grandparent effects means that sibling

15
correlations in college attendance would be valid only if brothers and sisters are analyzed
separately20.
The paper points to the potential importance of non-spatial aspects of networks in
making public policy. For example, participants in the Moving To Opportunity
experiment were relocated to neighborhoods with lower poverty rates to improve
socioeconomic outcomes for adults and children. Social interactions with extended
family members, not based on immediate proximity, may drag down potential gains from
improved neighborhoods. These continuing connections may partly account for
insignificant increases in educational achievement for experiment participants
(Sanbonmatsu, Kling, Duncan, Brooks-Gunn, 2006).

16
References
Akerlof, George. 1997. “Social Distance and Social Decisions.” Econometrica 65 (5):
1005-1027.
Benin, Mary and David Johnson. 1984. “Sibling Similarities in Educational Attainment:
A Comparison of Like-Sex and Cross-Sex Sibling Pairs.” Sociology of Education
57 (January): 11-21.
Benson, P. L. 1993. The Troubled Journey: A Portrait of 6th-12th Grade Youth.
Minneapolis, MN: Search Institute.
Black, Sandra; Paul Devereux, and Kjell Salvanes. 2005. “Why the Apple Does Not Fall
Far: Understanding Intergenerational Transmission of Human Capital.”
American Economic Review 95 (1): 437-49.
Black, Sandra and Amir Sufi. 2002. “Who Goes to College? Differential Enrollment by
Race and Family Background.” National Bureau of Economic Research Working
Paper 9310.
Blyth, Dale; John Hill, and Karen Thiel. 1982. “Early Adolescent’s Significant Others:
Grade and Gender Differences in Perceived Relationships with Familial and
Nonfamilial Adults and Young People.” Journal of Youth and Adolescence 11 (6):
425-450.
Blyth, Dale and Frederick Foster-Clark. 1987. “Gender Differences in Perceived
Intimacy with Different Members of Adolescent’s Social Networks.” Sex Roles
17 (11/12): 689-718.

17
Bradley, R. H., Corwyn, R. F., Caldwell, B. M., Whiteside-Mansell, L., Wasserman, G.
A., Walker, T. B., & Mink, I. T. 2000. “Measuring the home environments of
children in early adolescence”. Journal of Research on Adolescence (10): 247-
289.
Cherlin, Andrew and Frank Furstenberg. 1986. The New American Grandparent: A Place
in the Family, A Life Apart. New York: Basic Books.
Cheng, Simon and Brian Starks. 2002. “Racial Differences in the Effects of Significant
Others on Students’ Educational Expectations.” Sociology of Education 75
(October): 306-327.
Cochran, Moncrieff and Jane Brassard. 1979. “Child Development and Personal Social
Networks.” Child Development 50:601-611.
Currie, Janet and Thomas, Duncan. 1999. “The Intergenerational Transmission of
Intelligence: Down the Slippery Slope of The Bell Curve.” Industrial Relations 38
(3): 297-330.
Denham, Thomas and Craig Smith. 1989. “The Influence of Grandparents on
Grandchildren: A Review of the Literature and Resources.” Family Relations 38
(3): 345-350.
Heckman, James. 1995. “Lessons from the Bell Curve.” Journal of Political Economy
103 (5): 1091-1120.
Hoxby, Caroline. 2000. “Peer Effects in the Classroom: Learning from Gender and Race
Variation.” National Bureau of Economic Research Working Paper 7867.

18
Hirsch, Barton; Maureen Mickus, and Rebecca Boerger. 2002. “Ties to Influential Adults
Among Black and Whites Adolescents: Culture, Social Class, and Family
Networks.” American Journal of Community Psychology 30 (2): 289-303
Hitchcock, Steven. 1990. Occupational Outlook Quarterly. Fall
http://findarticles.com/p/articles/mi_m1155/is_n3_v34/ai_9325766
Ianni, Francis. 1989. The Search for Structure: A Report on American Youth Today. New
York: The Free Press.
Lillard, Lee and Robert Willis. 1994. Intergenerational Educational Mobility: Effects of
Family and State in Malaysia. The Journal of Human Resources 29 (Special Issue
4): 1126-1166.
Logan, John and Glenna Spitze. 1994. “Family Neighbors.” American Journal of
Sociology 100 (2): 453-476.
Loury, Linda Datcher. 2006. “Some Contacts Are More Equal Than Others: Informal
Networks, Job Tenure, and Wages.” Journal of Labor Economics 24 (2):
Manski, Charles. 2004. “Social Learning from Private Experiences: The Dynamics of the
Selection Problem.” Review of Economic Studies 71: 443-458.
Sanbonmatsu, Lisa; Jeffrey Kling; Greg Duncan, and Jeanne Brooks-Gunn. 2006.
“Neighborhoods and Academic Achievement: Results from the Moving To
Opportunity Experiment.” Journal of Human Resources 41 (4): 649-91.
Scales, Peter and Judith Gibbons. 1996. “Extended Family Members and Unrelated
Adults in the Lives on Young Adolescents.” Journal of Early Adolescence 16 (4):
365-389.

19
Smith, James and Finis Welch. 1984. Women’s Wages and Work in the Twentieth
Century. Santa Monica, CA: The Rand Corporation.
Solon, Gary; Marianne Page, and Greg Duncan. 2000. “Correlations between
Neighboring Children in Their Subsequent Educational Attainment.” Review of
Economics and Statistics 82 (3): 383-392.
U.S. Bureau of the Census. U.S. Census of Population: 1960. Subject Reports,
Employment Status and Work Experience. Table 1. U.S. Bureau of the Census.
U.S. Census of Population: 1960. Subject Reports, Occupational Characteristics.
Wells, Thomas. 1998. “Changes in Occupational Segregation during the 1980s and
1990s. Center for Demography and Ecology University of Wisconsin-Madison
Working Paper No. 98-14.
Youniss, James and Jacqueline Smollar. 1985. Adolescent Relations with Mothers,
Fathers, and Friends. Chicago: University of Chicago Press.
http://www.ilo.org/public/english/bureau/integration/download/publicat/4_3_173_16-
gender-based_occupational_segregation_in_the_1990s.pdf

20
Footnotes
1 The units of parent’s human capital are chosen so that the return for one unit
equals one.
2 The actual coefficient for Ht-2 would equal δβh2 –βh1 where δ is the coefficient
in the auxiliary regression of grandparent’s endowments on grandparent’s schooling.
This coefficient is a downward biased estimate of βh2 for δ<1.
3 Other studies (e.g. Black, Devereux, and Salvanes, 2003 and Lillard and Willis,
1994) discuss similar issues in interpreting the coefficients of parent’s schooling in
intergenerational analyses.
4 Intimacy between adolescents and older extended family members was
measured by “how much do you go to this person for advice”, “how much does this
person accept you no matter what you do”, “how much does the person understand what
you’re really like”, and “how much do you share your inner feelings with this person”.
5 Important people included “people you spend time with or do things with”,
“people you like a lot or who like you a lot or both”, “people who make important
decisions about things in your life”, “people who you go to for advice”, or “people you
would like to be like”.
6 The mean age of the mothers at birth was 20 years. The results reported later are
not sensitive to sample characteristics. The results are similar if the sample is restricted
to younger sons and daughters. The total number of CNLSY sample members who are
ages 18-26 was 2402. Of these, 175 were excluded from the analysis because their own

21
schooling data was missing and 34 were excluded because their mother’s schooling data
was missing.
7 Out of the original 8984 main respondents, 1241 were dropped due to invalid or
missing 2003 schooling information and 837 were excluded due to invalid or missing
data for mother’s schooling.
8 For the CNLSY sample, the number of years of schooling was unknown for 7
percent of grandmothers and 15 percent of grandfathers. For the NLSY97 sample, the
number of years of schooling was unknown for 13 percent of grandmothers and 18
percent of grandfathers. Those with missing data are included in the left-out category.
Means and standard deviations of variables not included in Table 1 are available from the
author.
9 Adding HOME and mother’s AFQT scores to the analysis increased by
numerical values of the coefficient for the dummy variable whether black for both men
and women.
10 Black and white men are included together in these analyses since racial
differences in the effects of grandparents were small. For example, the coefficient of the
interaction between grandfather: schooling 12 or more years and whether black was
-0.008 (0.215). In addition, results do not change when grandfathers with missing
schooling data are excluded from the analysis. The coefficient for grandfather: exactly
12 years of schooling was 0.333 (0.133) and the coefficient for grandfather: more than 12
years of schooling was 0.384 (0.197).

22
11 If grandsons and granddaughters are included in the same analysis (with
dummy variables for race and gender groups), the coefficient for the interaction of
whether grandfathers had 12 or more years of schooling and whether male was 0.344
(0.149).
12 For men the change in the coefficients for parents’ schooling and AFDC receipt
were due to adding HOME scores. If AFQT scores are omitted, the coefficients for these
variables are similar to those in column 3 of Table 2. Even though AFQT scores are not
significant for men, they are included in this analysis. Other analysts (e.g. Currie and
Thomas, 1999 and Heckman, 1995) have commonly interpreted them as controlling for
unobserved family characteristics.
13 The coefficients (standard errors) were 0.376 (0.127) and 0.411 (0.190) for
grandfather: 12 years of schooling and grandfather: more than 12 years of schooling
respectively.
14 Lillard and Willis (1994) make similar assumptions about gender-neutral and
gender-matched unobservables.
15 These include daughters who raised their own children in a different state than
the state where the daughters lived at age 14.
16 This finding is consistent with greater fraction of black women attending
college relative to black men and the decline in the higher college attendance rates for
blacks compared to whites holding family background constant (Black and Sufi, 2002).
17 The left-out group is individuals whose grandfathers had less than12 years of
schooling and individuals whose grandfathers’ schooling was unknown. The results are

23
similar when individuals with missing grandfather data are excluded from the sample.
The coefficient for any grandfather: exactly 12 years of schooling is 0.136 (0.065). The
coefficient for any grandfather with more than 12 years of schooling is 0.195 (0.078).
18 The 10 percentage points are equivalent to over four additional years of
mother’s schooling. Results are similar if other measures of grandparents schooling (for
example, the number of grandparents with exactly 12 years of schooling and the number
with more than 12 years of schooling) are used. The results are also similar if individuals
with missing grandmother data are excluded from the sample. The coefficient for any
grandmother with more than 12 years of schooling is 0.268 (0.088).
19 Many of the detailed CNLSY analyses cannot be duplicated here. HOME
scores, mother’s AFQT scores, and data about whether grandparents are living were not
available for the NLSY97 sample.
20 Solon, Page, and Duncan (2000) combine females and males to compute sibling
correlations for total years of schooling.

24
Table 1. Means and Standard Deviations of Selected Variables Men Women Men Women Whether Attended College 0.2805 0.3436 0.4326 0.5448 (0.4495) (0.4751) (0.4955) (0.4981) Mother’s Years of Schooling 12.142 11.964 13.040 12.977 (1.947) (1.888) (2.828) (2.773) Maternal Grandfather with exactly 12 0.3261 0.2856 Years of Schooling (0.4690) (0.4519) Maternal Grandfather with >12 0.1185 0.1226 Years of Schooling (0.3234) (0.3281) Maternal Grandmother with exactly 12 0.3821 0.3554 Years of Schooling (0.4861) (0.4788) Maternal Grandmother with >12 0.0764 0.1003 Years of Schooling (0.2658) (0.3006) Any Grandfather with exactly 12 Years 0.2977 0.3014 of Schooling (0.4573) (0.4589) Any Grandfather with >12 Years 0.2192 0.2090 of Schooling (0.4138) (0.4067) Any Grandmother with exactly 12 0.3770 0.3859 Years of Schooling (0.4847) (0.4869) Any Grandmother with >12 Years 0.1997 0.1863 of Schooling (0.3998) (0.3894) N 1042 1115 3496 3410

25
Table 2. Estimated Effects of Selected Variables on College Attendance (CNLSY) Men Women Men Women Black -0.233 0.024 -0.038 0.242 (0.116) (0.102) (0.129) (0.114) [-0.059] [0.012] [-0.012] [0.090] Mother’s Years of Schooling 0.084 0.102 0.034 0.060 (0.031) (0.029) (0.035) (0.031) [0.022] [0.034] [0.011] [0.022] Father’s Years of Schooling 0.056 -0.004 0.029 -0.031 (0.026) (0.025) (0.027) (0.025) [0.013] [-0.003] [0.010] [-0.0112 Years in Lived with Two-Parent 0.003 0.028 -0.007 0.013 Family (0.014) (0.013) (0.014) (0.014) [-0.000] [0.010] [-0.002] [0.005] Number of Siblings -0.037 -0.016 -0.057 -0.016 (0.044) (0.040) (0.045) (0.041) [-0.015] [-0.005] [-0.018] [-0.006] Years Parents Received AFDC -0.058 -0.086 -0.033 -0.060 (0.028) (0.026) (0.029) (0.027) [-0.018] [-0.031] [-0.011] [-0.022] Mother’s Armed Forces Qualifying 0.004 0.007 Test Score (0.003) (0.003) [0.001] [0.002] HOME Score 0.007 0.008 (0.002) (0.002) [0.002] [0.003]

26
Table 2. Estimated Effects of Selected Variables on College Attendance (CNLSY) cont. Men Women Men Women Maternal Grandfather with Exactly 0.373 -0.113 12 Years of Schooling (0.128) (0.124) [0.126] [-0.040] Maternal Grandfather with >12 0.408 0.062 Years of Schooling (0.194) (0.177) [0.144] [0.023] Maternal Grandmother with Exactly -0.133 -0.027 12 Years of Schooling (0.125) (0.118) [-0.043] [-0.010] Maternal Grandmother with >12 -0.024 0.113 Years of Schooling (0.225) (0.195) [-0.008] [0.041] Constant -2.160 -1.651 -1.796 -1.469 (0.424) (0.401) (0.446) (0.407) Χ 2 39.32 50.58 63.26 84.34 N 1042 1115 1042 1115
Robust standard errors are in parentheses. Estimates are weighted using 2002 NLSY child sampling weights. The terms in the brackets [ ] reports the effect of a one-unit change in the explanatory variable on the probability of college attendance. Other variables included in these analyses were dummy variables for don’t know father’s years of schooling, don’t know mother’s AFQT score, and don’t know HOME score.
27
Table 3. Estimated Effects of Selected Variables on College Attendance (NLSY97)
Men Women
Black -0.131 0.110 (0.062) (0.059) [-0.003] [0.043] Mother’s Years of Schooling 0.065 0.059 (0.011) (0.012) [0.025] [0.023] Father’s Years of Schooling 0.062 0.046 (0.012) (0.012) [0.024] [0.018] Parents Received AFDC in 1996 -0.229 -0.279 (0.109) (0.115) [-0.087] [-0.111] Parents’ 1996 Income 0.00451 0.00425 (0.00088) (0.00108) [0.00177] [0.00168] Lived with 2 Parents at Age 12 0.339 0.363 (0.057) (0.058) [0.132] [0.143] Number of HH Members under 18 in -0.066 -0.076 1997 (0.021) (0.021) [-0.026] [-0.030]

28
Table 3. Estimated Effects of Selected Variables on College Attendance (NLSY97) cont. Men Women Any Grandfathers with Exactly 0.159 0.054 12 Years of Schooling (0.063) (0.066) [0.063] [0.021] Any Grandfathers with >12 Years of 0.209 0.120 Schooling (0.075) (0.081) [0.083] [0.047] Any Grandmothers with Exactly -0.097 0.077 12 Years of Schooling (0.061) (0.062) [-0.038] [0.030] Any Grandmothers with >12 Years of 0.010 0.266 Schooling (0.077) (0.084) [0.040] [0.103] Constant -2.209 -1.640 (0.166) (0.170) χ 2 477.15 375.90 N 3496 3410
Robust standard errors are in parentheses. Other variables included in the analysis were dummy variables for don’t know father’s schooling and don’t know parents’ income. Estimates are weighted to reflect non-random sampling. The terms in the brackets [ ] report the effect of a one-unit change in the explanatory variable on the probability of college attendance.