Economic OutlookNovember 2010

Recession Impact
Fewer Moving
Delay in Marriage
One Car
Office at Home
More Education
Why is the U.S.economic growth
so lackluster?
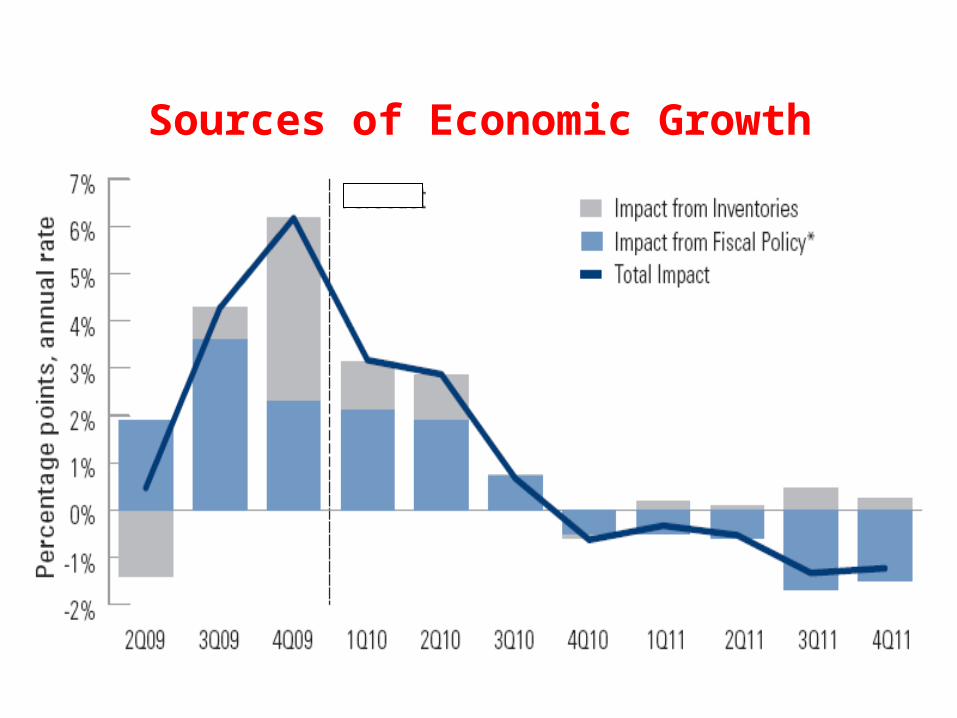
Sources of Economic Growth

Inventory Buildup
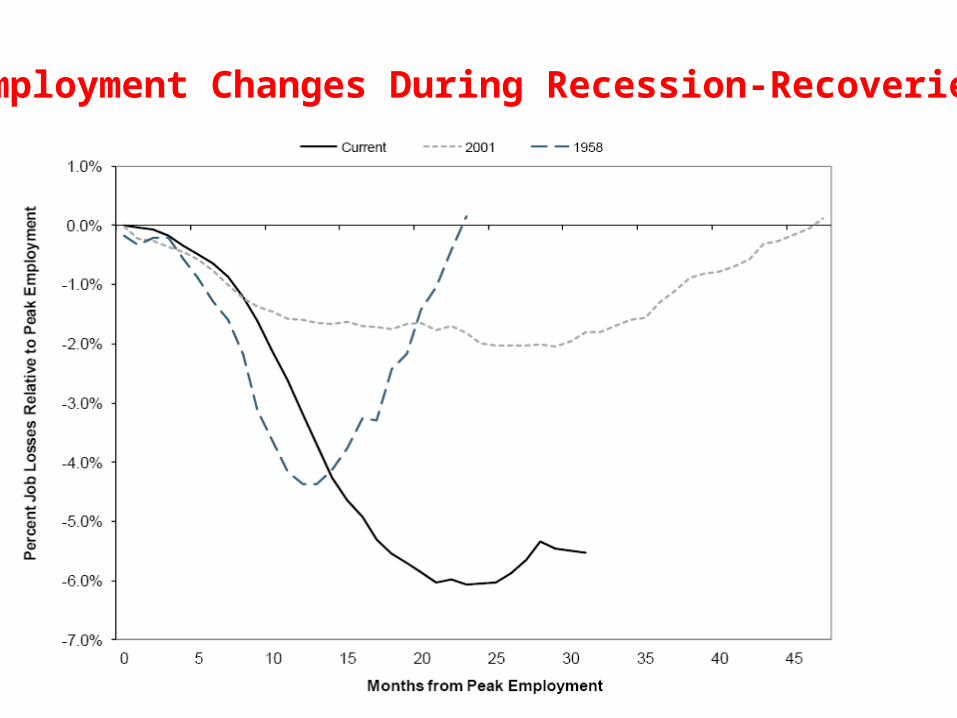
Employment Changes During Recession-Recoveries


Percent of Long-term Unemployed

Household Debt Is Still High

Housing

History of Home Prices

Housing Affordability Index

Home Prices

Mortgage Rate

Double-dip in Housing?


Seriously Delinquent Mortgages

DistressDistressed Home Sales
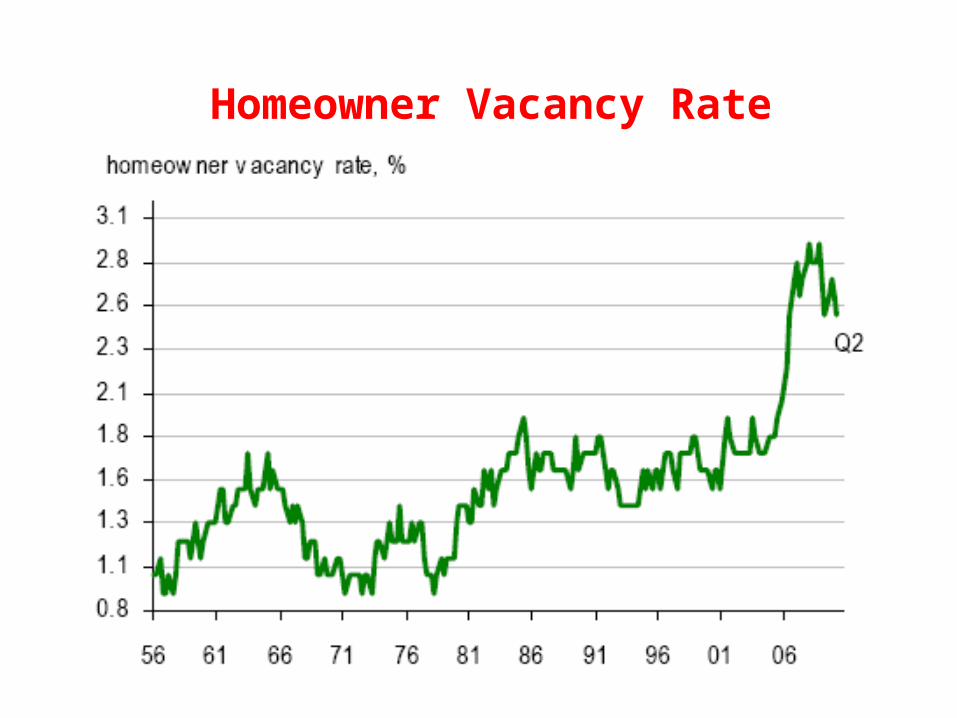
Homeowner Vacancy Rate

State & LocalGovernments
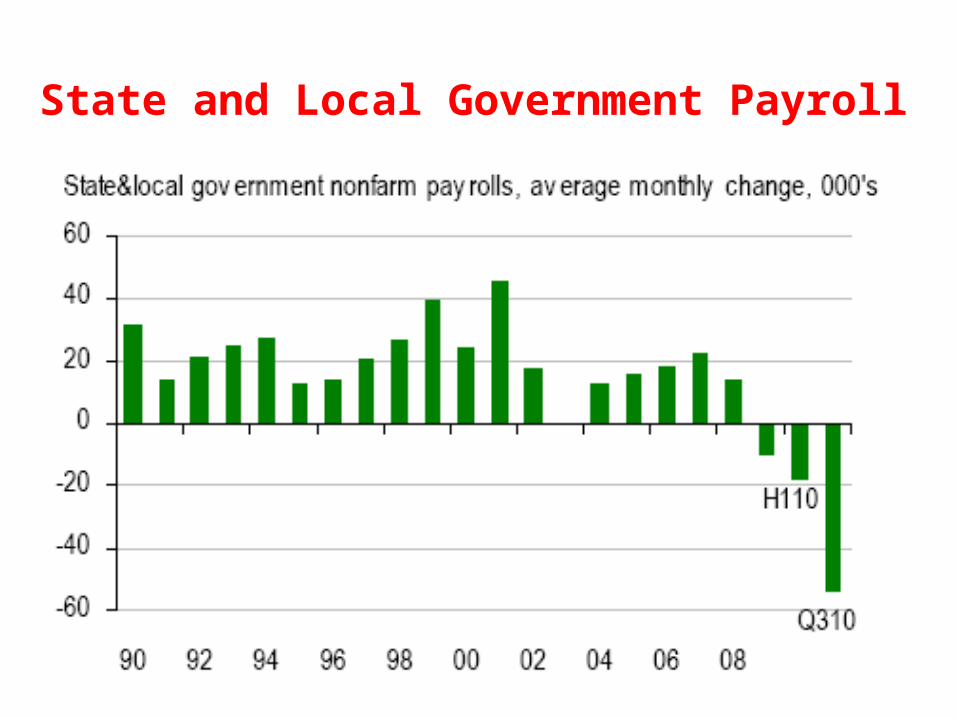
State and Local Government Payroll

State and Local Government Drag
Fiscal Stimulus
No Ammunition

Budget Deficits % of GDP
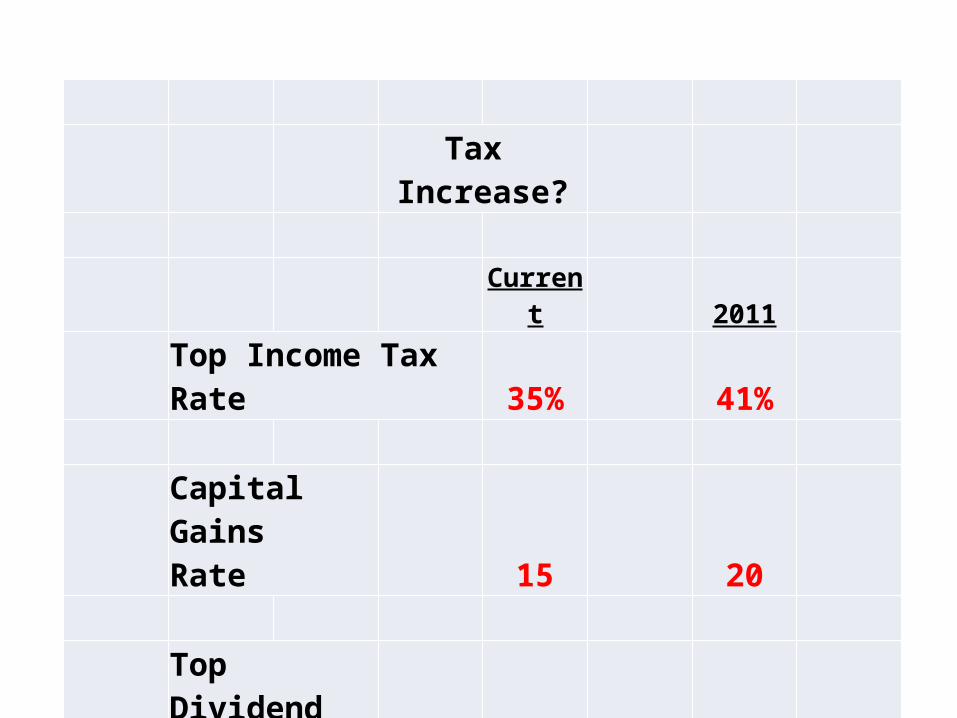
Tax Increase?
Current 2011
Top Income Tax Rate 35% 41%
Capital Gains Rate 15 20
Top Dividend Rate 15 39.6
Estate Tax 0 55

Employment Changes During Recession-Recoveries

OOOOOOoooutpOutput Gap

Why QE?•Short Rate Zero
•Lower Bond Yields
•Weaker Dollar
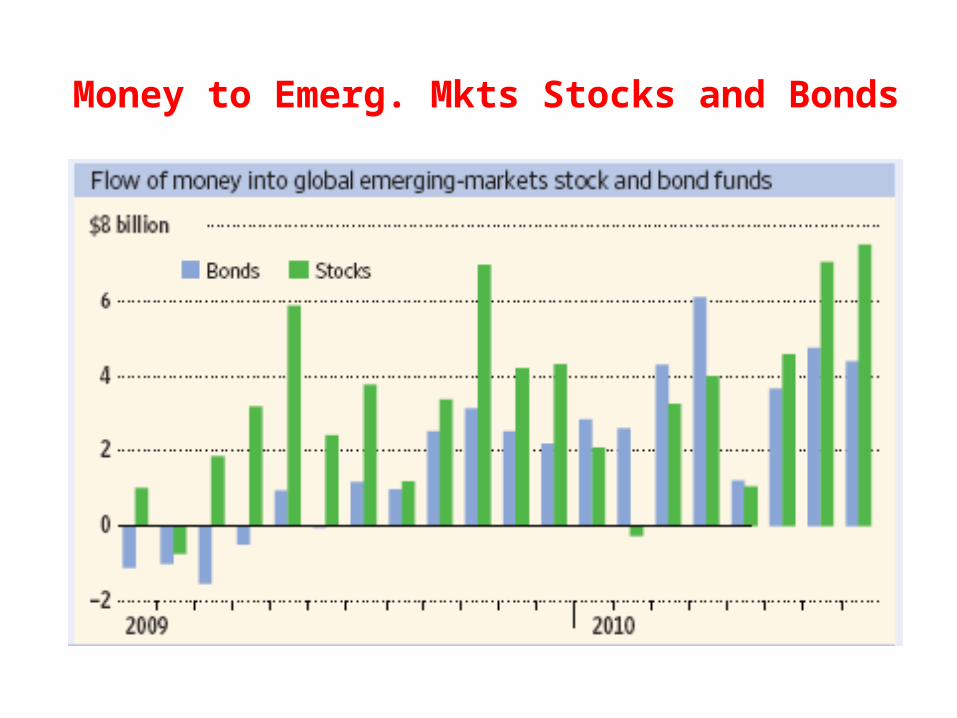
Money to Emerg. Mkts Stocks and Bonds

Currency War?
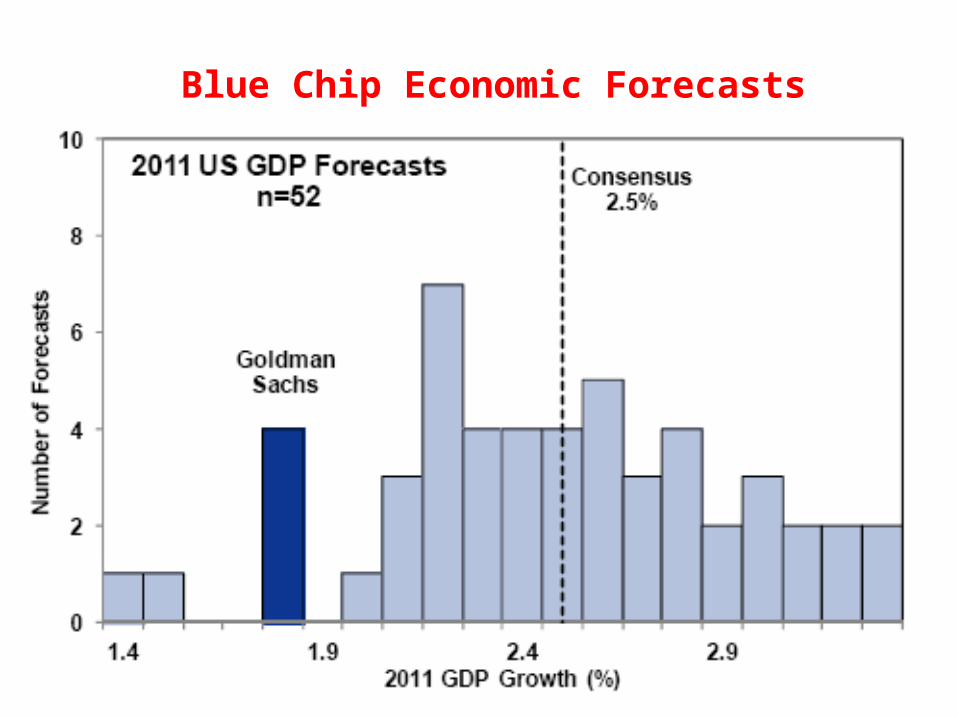
Blue Chip Economic Forecasts

Double-dipYes/No ?

No Double-dip?•Tax Cuts
•QE2
•Low Base

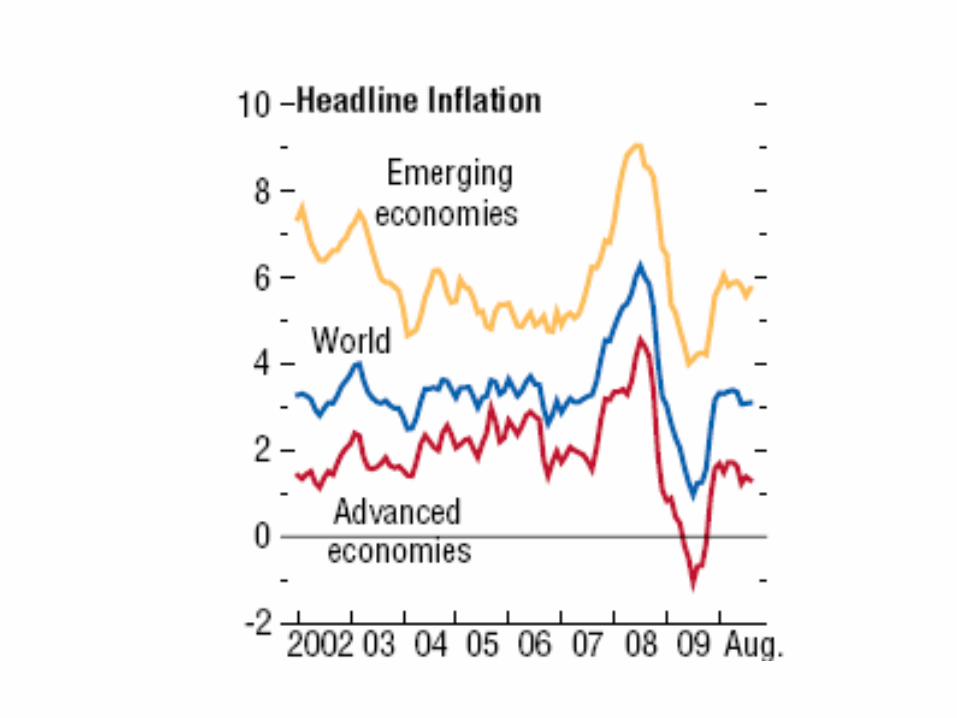
Inflationor
Deflation
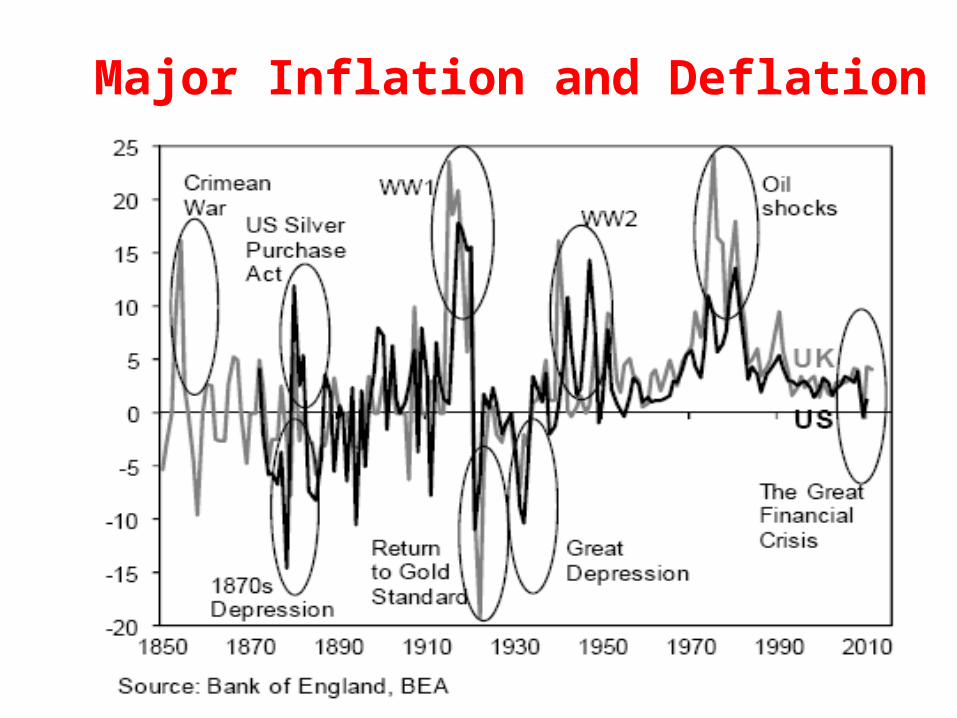
Major Inflation and Deflation
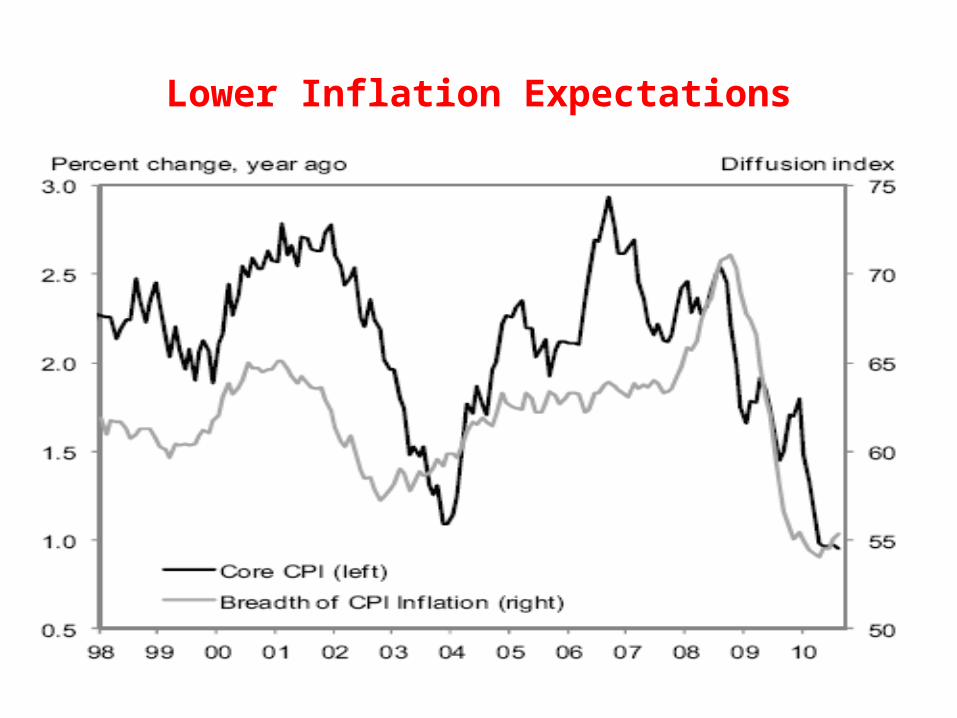
Lower Inflation Expectations

Why No DeflationInflation Expectations
Wage RigiditiesImport Prices
Monetary Policy

No DeflationInflation Eventually
Cost Push Excess Cap. Diminishes
TaxesFees

Election
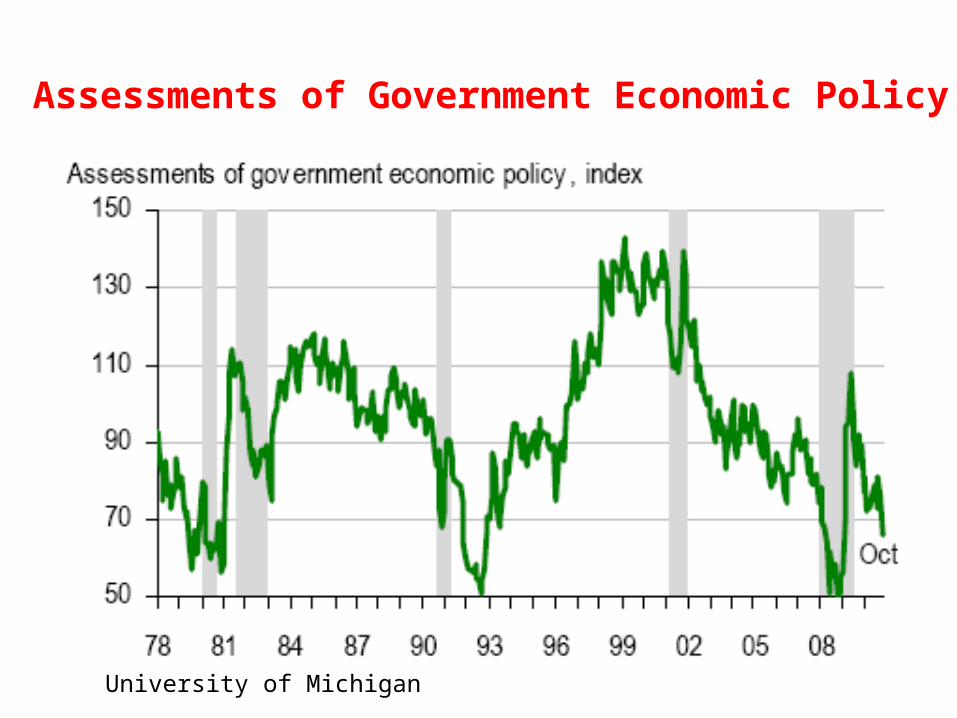
Assessments of Government Economic Policy
University of Michigan

90 Days after Mid-term
(1922-2006)
8.5 percent
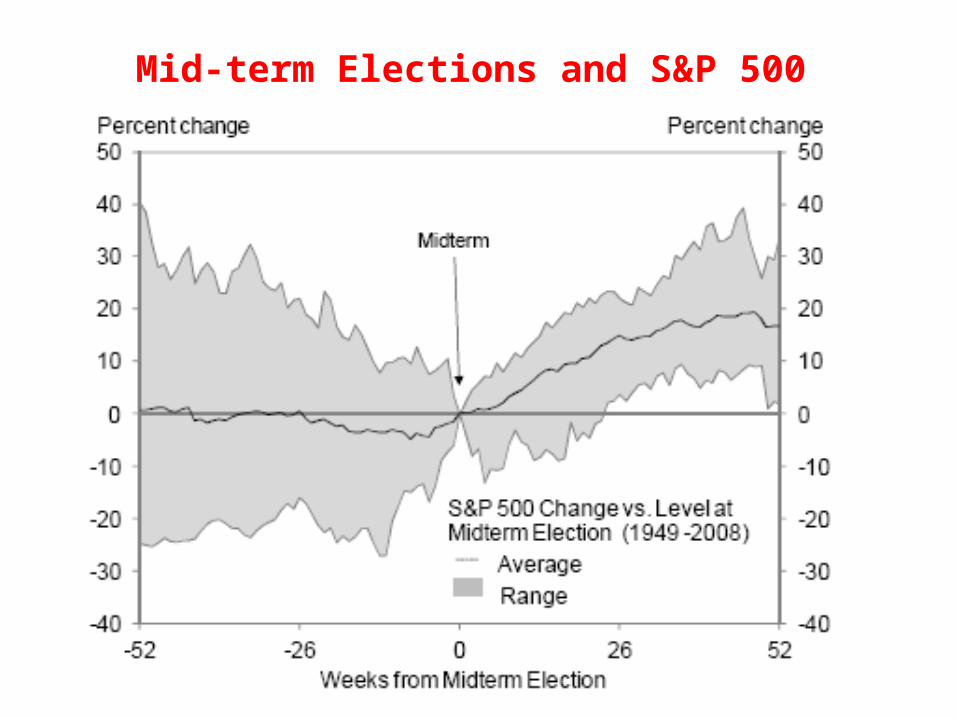
Mid-term Elections and S&P 500

Stocks and Election Cycle
(1871-2005)
First Second Third Fourth
3.0% -2.7% 10.1% 7.5%
Key IssuesTax & Budget
EnergyTrade
China CurrencyFinancial ReformHousing Finance
Health careImmigration

Compromise or Not?

Video Clip

Global Economy
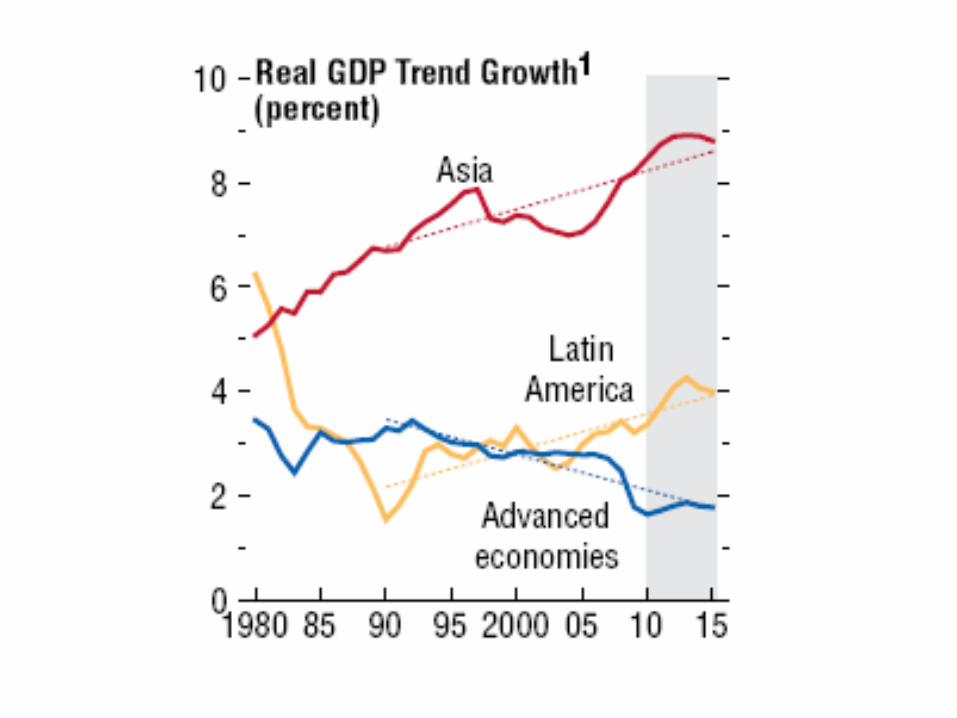

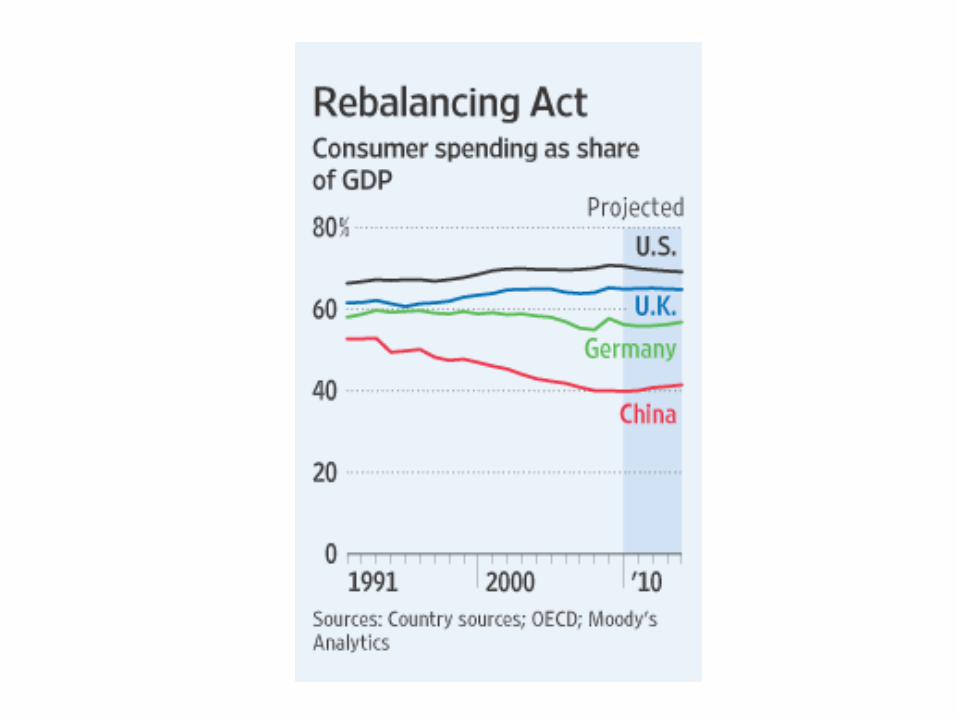
Rebalancing Global Trade

Internal Rebalancing
•Domestic Demand
•Budgets
•Finance/Credit

External Rebalancing
•Deficit CountriesIncrease Exports
•Surplus CountriesIncrease Consumption

Government Debt % of GDP

Debt to GDPOver 90%: 1.7%
Vs.Below 30%: 3.5%

Over 100%
Stunt Growth
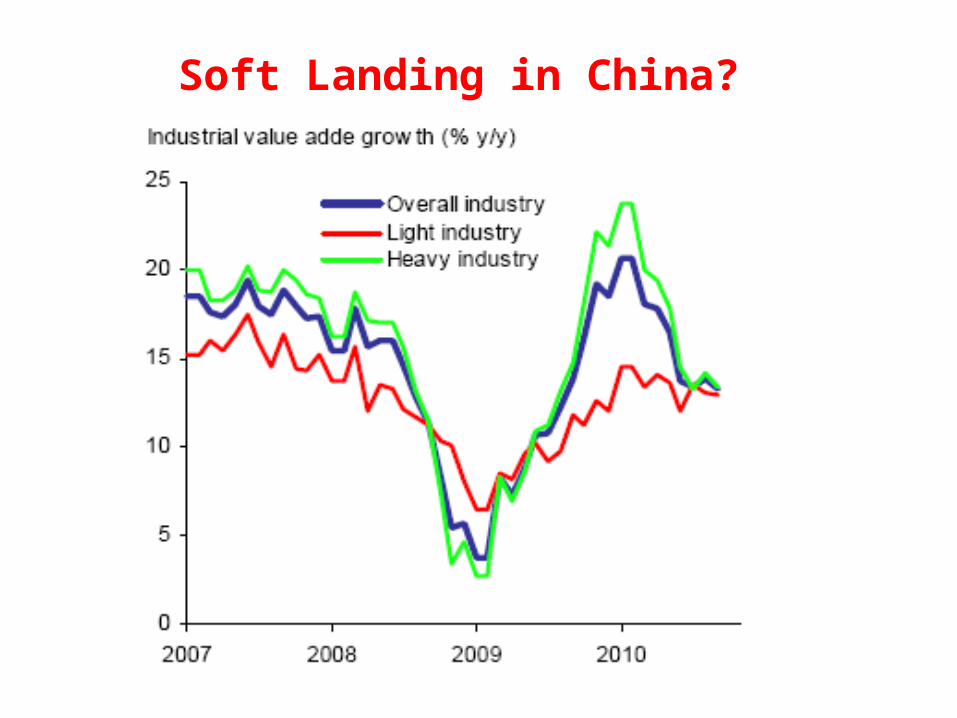
Soft Landing in China?


8
8.5
9
9.5
10
10.5
11
2008 2009 2010 2011
China’s Economic Growth (% Change Year over Year)
Forecast

ChineseChinese Currency Undervalued

Ventura County

260,000
270,000
280,000
290,000
300,000
310,000
320,000
330,000
Jan-07 Jul-07 Jan-08 Jul-08 Jan-09 Jul-09 Jan-10 Jul-10
Ventura County
Total, All Industries (jobs)
VC Employment
0.0%
2.0%
4.0%
6.0%
8.0%
10.0%
12.0%
14.0%
Jan-07 Jul-07 Jan-08 Jul-08 Jan-09 Jul-09 Jan-10 Jul-10
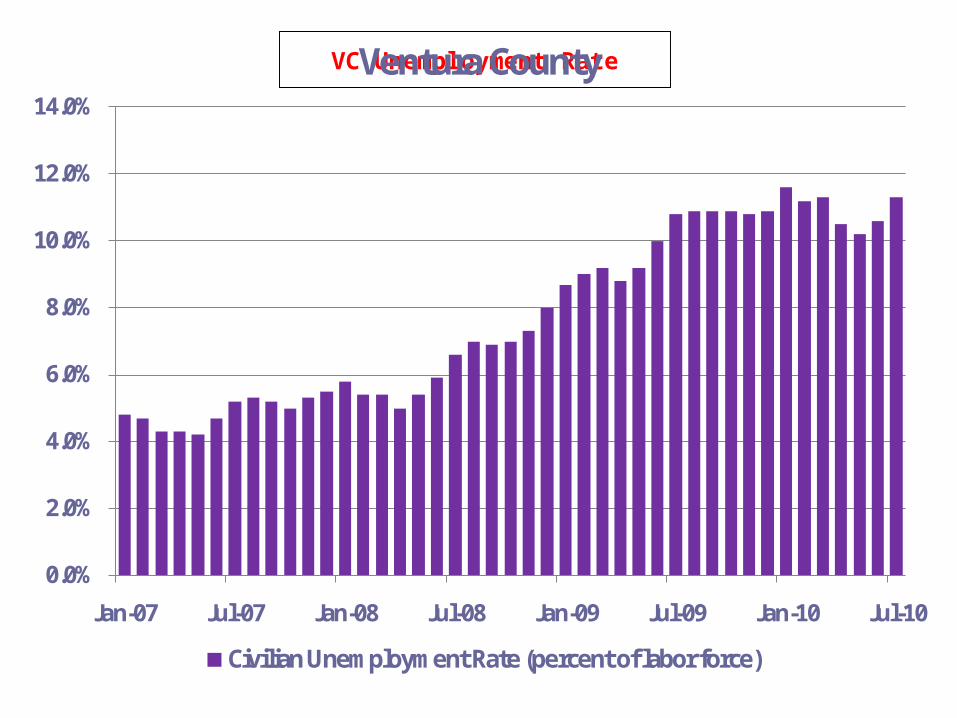
Ventura County
Civilian Unemployment Rate (percent of labor force)
VC Unemployment Rate
-1
0
1
2
3
4
5
6
7
8
Jan-07 Jul-07 Jan-08 Jul-08 Jan-09 Jul-09 Jan-10 Jul-10
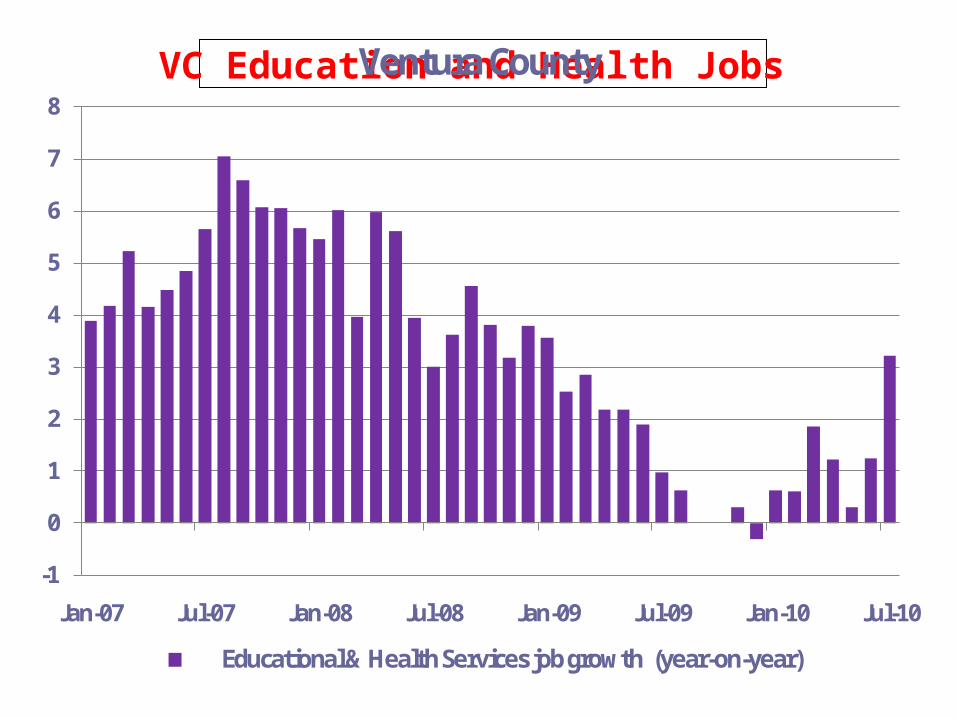
Ventura County
Educational & Health Services job growth (year-on-year)
VC Education and Health Jobs

-10
-8
-6
-4
-2
0
2
4
6
Jan-07 Jul-07 Jan-08 Jul-08 Jan-09 Jul-09 Jan-10 Jul-10
Ventura County
Other Services job growth (year-on-year)
VC Other Service Jobs

-10
-8
-6
-4
-2
0
2
4
Jan-07 Jul-07 Jan-08 Jul-08 Jan-09 Jul-09 Jan-10 Jul-10
Ventura County
Retail Trade job growth (year-on-year)
VC Retail Trade jobs
-10
-8
-6
-4
-2
0
2
4
Jan-07 Jul-07 Jan-08 Jul-08 Jan-09 Jul-09 Jan-10 Jul-10
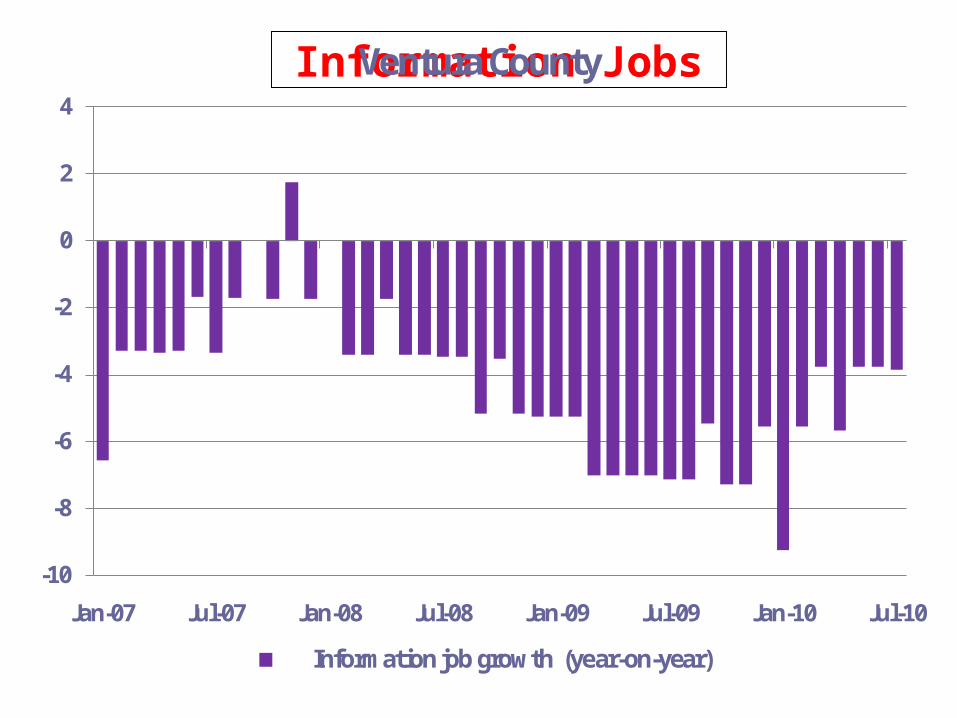
Ventura County
Information job growth (year-on-year)
Information Jobs
-10
-9
-8
-7
-6
-5
-4
-3
-2
-1
0
Jan-07 Jul-07 Jan-08 Jul-08 Jan-09 Jul-09 Jan-10 Jul-10
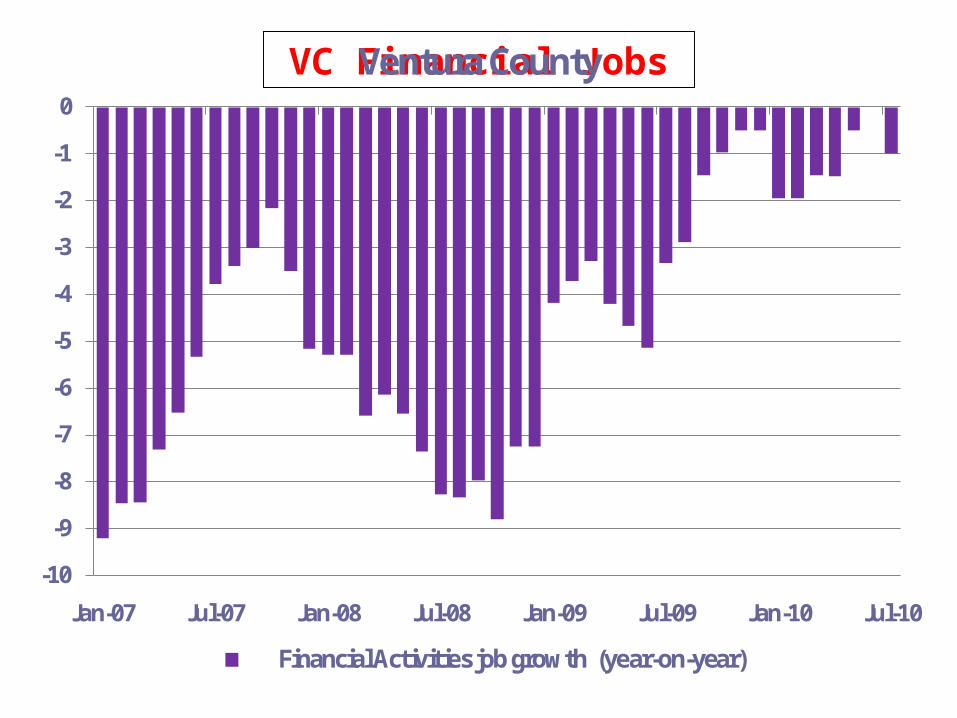
Ventura County
Financial Activities job growth (year-on-year)
VC Financial Jobs
-10
-8
-6
-4
-2
0
2
4
6
8
Jan-07 Jul-07 Jan-08 Jul-08 Jan-09 Jul-09 Jan-10 Jul-10
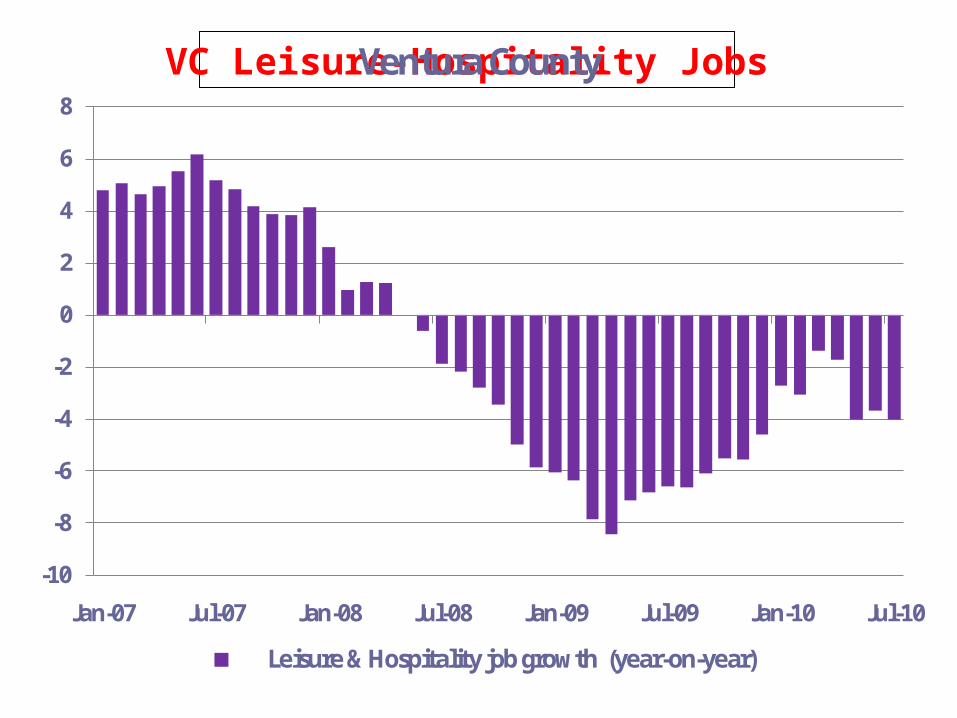
Ventura County
Leisure & Hospitality job growth (year-on-year)
VC Leisure-Hospitality Jobs

Demographics
0.0
0.5
1.0
1.5
2.0
2.5
3.0
3.5
4.0
4.5
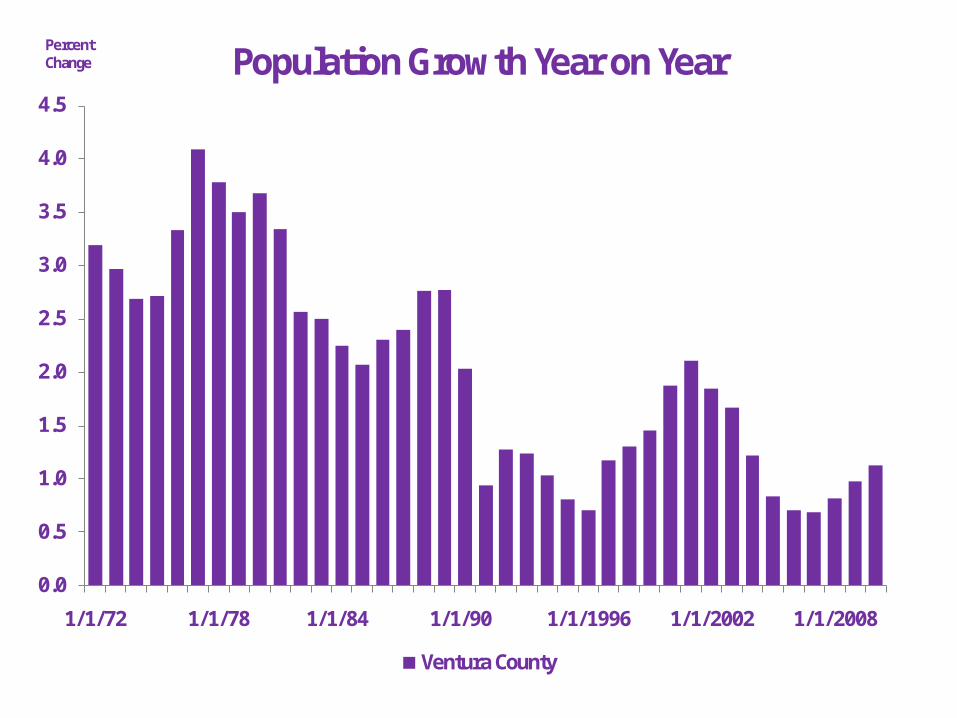
1/1/72 1/1/78 1/1/84 1/1/90 1/1/1996 1/1/2002 1/1/2008
Population Growth Year on Year
Ventura County
Percent Change

Lost Decade?

DrSohn.com
(not Dr.Sohn.com)


TIPS and 10-yr Treasury Yield Curves