ECE 571 – AdvancedMicroprocessor-Based Design
Lecture 3
Vince Weaver
http://www.eece.maine.edu/∼[email protected]
9 September 2014

Announcements
• HW#1 will be posted today (or tomorrow)
• Hand out Haswell accounts
• For Thursday, read the paper Producing Wrong
Data Without Doing Anything Obviously Wrong!
by Mytkowicz, Diwan, Hauswirth and Sweeney,
ASPLOS’09.
1

Hardware Performance Counters – SoftwareTools
2
PAPI (Performance API)
• Low-level Performance Measurement Interface
• Cross-platform
• Self-monitoring or Sampling
• C, C++, Fortran (or attach to running process)
• Basis for more advanced visualization tools. Vampir,
Tau, PerfExpert, etc.
3

• Provides high-level access to timers
• Provides high and low-level access to performance
counters
• Provides profiling support
• Provides system information
• Components
• Fine-grained instrumentation
4

PAPI Limitations
• In general have to modify source code
• Overhead included in program run
5

PAPI Platforms
• Linux perf event
• Linux perfmon2/perfctr (mostly deprecated except Cray)
• IBM BlueGene P/Q
• Solaris
• FreeBSD
• IBM AIX
6
PAPI CPUs
• x86, MIC
• ARM
• Power
• SPARC
• Itanium
• MIPS
7
PAPI Components
• Appio – I/O bandwidth
• BGPM – IBM Bluegene extra
• Coretemp – chip temp sensors, etc.
• CUDA – NVidia GPU
• Infiniband – high-speed network
• lmsensors – chip sensors
8

• lustre – parallel filesystem
• micpower – power on Intel MIC (Xeon PHI)
• MX – myrinet, high-speed network
• net – generic Linux network
• NVML – Nvidia power
• RAPL – Intel Sandybridge/Ivybridge Power
• Stealtime – Virtual Machine stealtime
9

• VMware – VMware stats
10

PAPI Tools
Note, unlike perf PAPI is rarely installed by default.
• papi component avail – list all components on system
• papi avail – list all predefined events
• papi native avail – list all native events
11
PAPI Instrumentation
Code has to be instrumented and linked against PAPI
library.
Usually this is done manually, but some tools can do
this automatically via binary instrumentation.
12
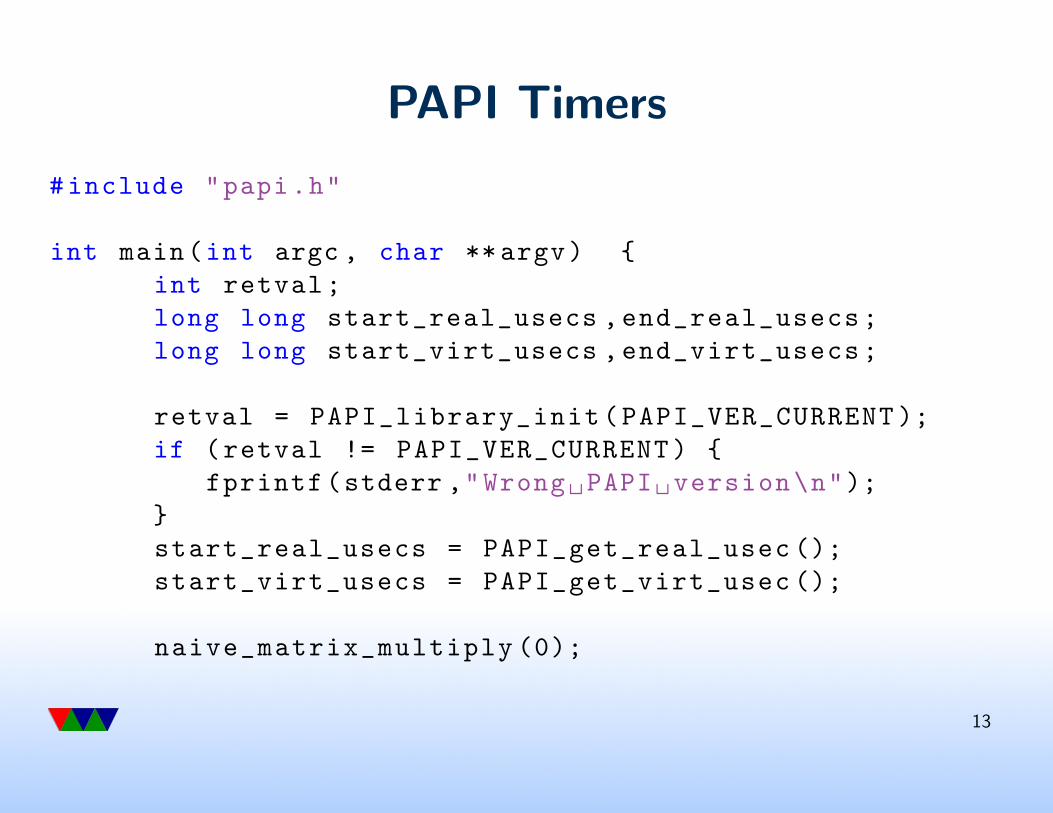
PAPI Timers
#include "papi.h"
int main(int argc , char **argv) {
int retval;
long long start_real_usecs ,end_real_usecs;
long long start_virt_usecs ,end_virt_usecs;
retval = PAPI_library_init(PAPI_VER_CURRENT );
if (retval != PAPI_VER_CURRENT) {
fprintf(stderr ,"Wrong PAPI version\n");
}
start_real_usecs = PAPI_get_real_usec ();
start_virt_usecs = PAPI_get_virt_usec ();
naive_matrix_multiply (0);
13

end_real_usecs = PAPI_get_real_usec ();
end_virt_usecs = PAPI_get_virt_usec ();
printf("Elapsed real: %lld\n",
end_real_usecs -start_real_usecs );
printf("Elapsed virt: %lld\n",
end_virt_usecs -start_virt_usecs );
return 0;
}
14

PAPI get real usec() vsPAPI get virt usec()
• PAPI get real usec()
wall-clock time
maps to clock gettime(CLOCK REALTIME)
• PAPI get virt usec()
only time process is actually running
maps to clock gettime(CLOCK THREAD CPUTIME ID)
15

Measuring Predefined Event
• We’ll use the PAPI TOT INS pre-defined counter
• On Sandybridge this maps to INSTRUCTION RETIRED
• Currently PAPI can have more elaborate pre-defined
events than perf (can do linear combinations, etc).
16
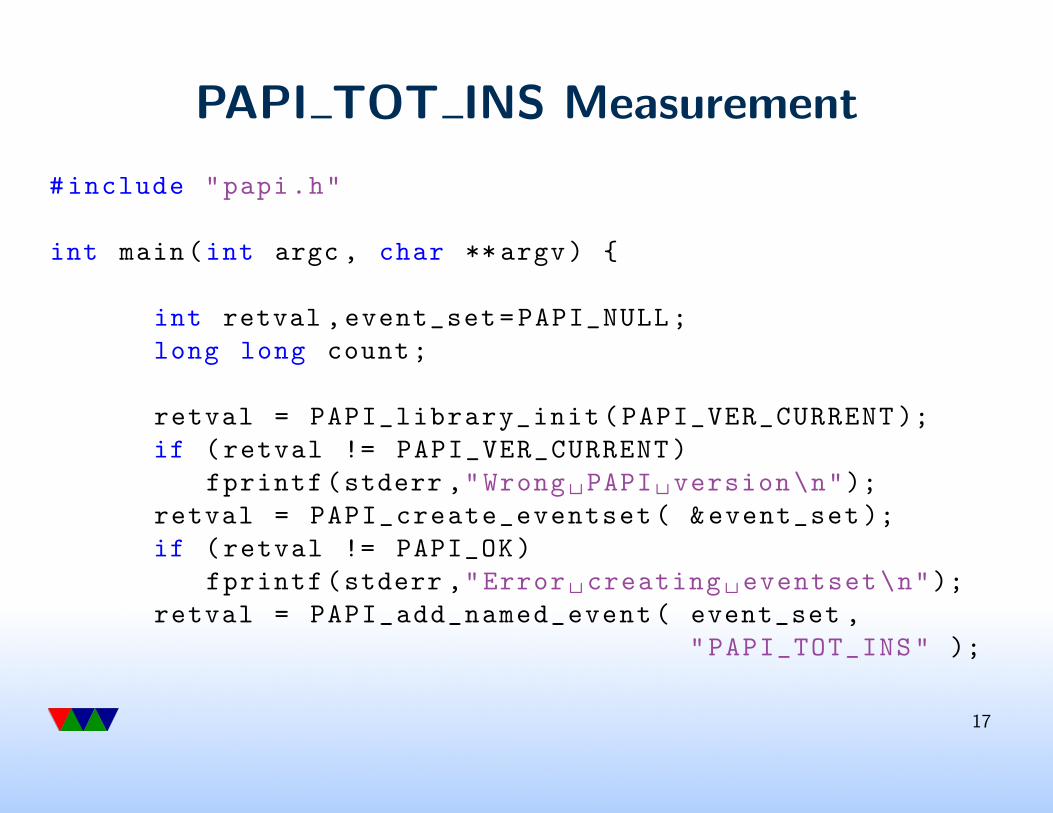
PAPI TOT INS Measurement
#include "papi.h"
int main(int argc , char **argv) {
int retval ,event_set=PAPI_NULL;
long long count;
retval = PAPI_library_init(PAPI_VER_CURRENT );
if (retval != PAPI_VER_CURRENT)
fprintf(stderr ,"Wrong PAPI version\n");
retval = PAPI_create_eventset( &event_set );
if (retval != PAPI_OK)
fprintf(stderr ,"Error creating eventset\n");
retval = PAPI_add_named_event( event_set ,
"PAPI_TOT_INS" );
17

if (retval != PAPI_OK)
fprintf(stderr ,"Error adding event\n");
retval = PAPI_start(event_set );
naive_matrix_multiply (0);
retval = PAPI_stop(event_set ,& count);
printf("Total instructions: %lld\n",count);
return 0;
}
18

Results
vince@vincent-weaver-1:~/class$ ./matrix_multiply.papi
Matrix multiply sum: s=27665734022509.746094
Total instructions: 945573824
19

PAPI Overflow
• PAPI Can do overflow, but only provides RAW Program
Counter
• Need external tool if want more detailed info
20

PAPI Challenges
• perf is good enough
• Only as good as underlying interface
• Frustrated users move to other tools (likwid?)
• Lack of Developers
• Code Quality
21

Hardware Tools for Measuring Performance
22

What are Hardware Performance Counters?
• Registers on CPU that measure low-level system
performance
• Available on most modern CPUs; increasingly found on
GPUs, network devices, etc.
• Low overhead to read
23

Hardware Implementation of Counters
• Not much documentation available
• Jim Callister/Intel: “Confessions of a Performance
Monitor Hardware Designer” 2005, Workshop on
Hardware Performance Monitor Design
– Transistors free, wires not. Also design time,
validation, documentation, time to market. PMU has
tentacles “everywhere” bringing data back to center.
– Architect too much, lower performance, events don’t
24

map well to hardware. Architect too little.. software
design harder.
– Which events are important? Are cache misses
important if don’t hurt performance? (no stalls)
– Mapping events to signal difficult. On critical path.
Not enough wires. Combining signals hard if distance
between wires.
– Use logging. May miss events in “shadow” of another
event being logged. Use random behavior?
25
Learning About the Counters
• Number of counters varies from machine to machine
• Available events different for every vendor and every
generation
• Available documentation not very complete (Intel Vol3b,
AMD BKDG, ARM ARM/TRM)
26

Low-level interface
• on x86: MSRs
• ARM: CP15 system control register
27
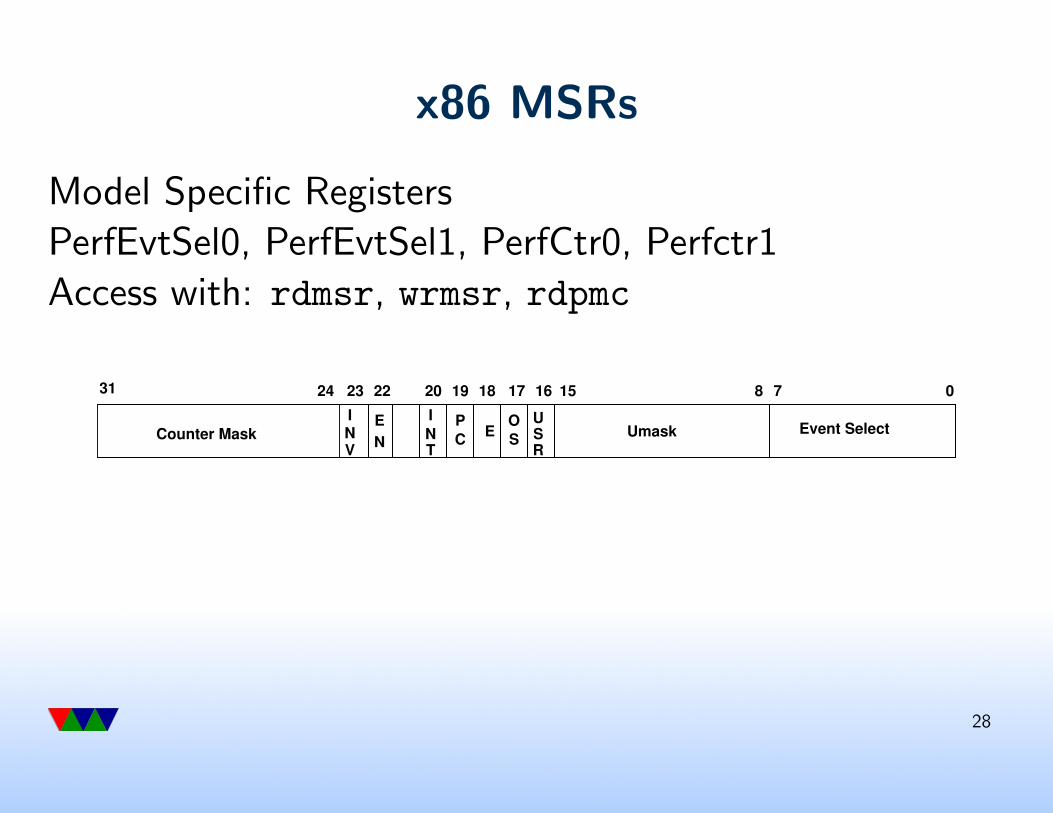
x86 MSRs
Model Specific Registers
PerfEvtSel0, PerfEvtSel1, PerfCtr0, Perfctr1
Access with: rdmsr, wrmsr, rdpmc
Counter Mask Umask Event SelectNS
OE
C
P
N
EI
V
N
I
T R
S
U
07815161718192022232431
28

ARM: CP15 registers on Cortex A9
• 6 counters available
• 58 events, 17 architectural, 41 A9 Specific, split between
Approximate, Precise
• No way to specify kernel vs user (Cortex A15 does?)
• Cortex A9 has bug where PMU interrupts may be lost
29

CP15 Interface
• use mcr, mrc to move values in/out
MRC p15,0,Rt,c9,c12,0
MCR p15,0,Rt,c9,c12,0
• Six EVNTCNT registers
• Cycle Counter register
• Six Event Config registers
• Count enable set/clear, count interrupt enable/clear,
30

overflow, software increment
• PMU management registers
• in general only privileged access (why) but can be
configured to let users access.
31

Registers
• PMCR – IMP/IDCODE (about implementer), N
(number of counters, up to 32), Disable when prohibited
(avoid counting in sensitive zones), X (export results to
external debug hardware), D clock divider (optionally
only count every 64th clock), Reset clock, reset all
events, enable all events
• ENSET – bitfield enabling events, also on read tells if all
enabled
32

• ENCLR – bitfield clearing events, disables the counters
• PMOVSR – overflow flags for all events
• SWINC – increment software counter
• PMSELR – selects “current” counter
• PMCCNTR – set/read cycle counter value
• EVTYPER – sets which event is used for counter
• EVCNTR – set/read event counter value
33

• USERENR – allow user access to counters
• INTENSET – enable bits for overflow interrupts
• INTENCLR – clear bits for overflow interrupts
34

Overflow
• overflows after reaching 2**32
• If want to overflow earlier, init to a high value. So
0xc0000000 to overflow at 1 billion
35

Performance Counters and Java
This was asked about at the end of the last class.
Here are the results of a quick literature search, not very
thorough.
36
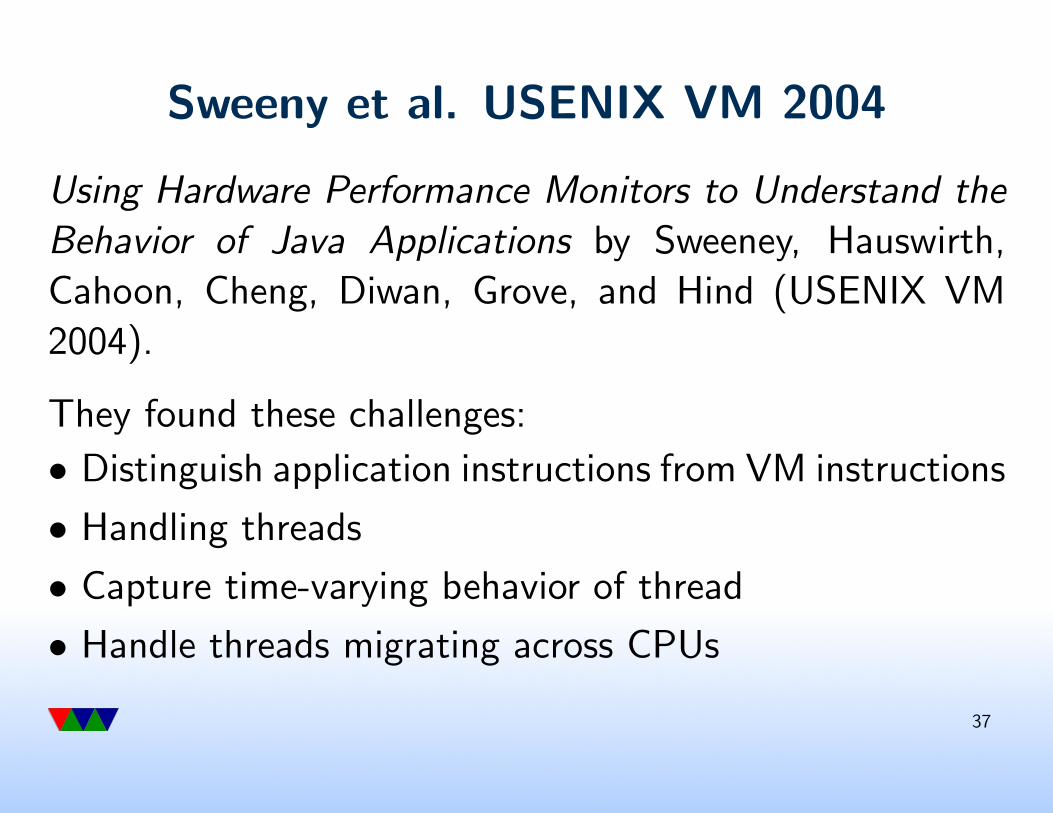
Sweeny et al. USENIX VM 2004
Using Hardware Performance Monitors to Understand the
Behavior of Java Applications by Sweeney, Hauswirth,
Cahoon, Cheng, Diwan, Grove, and Hind (USENIX VM
2004).
They found these challenges:
• Distinguish application instructions from VM instructions
• Handling threads
• Capture time-varying behavior of thread
• Handle threads migrating across CPUs
37

Sweeny et al. – continued
• They Modify the Jikes VM to generate thread traces on
AIX.
• They gather per results with Pmapi and the
SPECjbb2000 Benchmarks
• They add native methods to access counters and add
code to save/restore counters on thread switch.
• This has an Overhead of 2%
38
Sweeny et al. – continued
Their results:
• Found IPC improvement over time as optimizer worked
• IPC got worse after garbage collection. Turns out
compacting memory destroys cache.
39

Forst, Eclipsecon 2008
Analyzing Java Performance Using Hardware
Performance Counters by Gary Frost (Eclipsecon 2008).
• hprof takes you to the method but not into the method.
• AMD CodeAnalyst. Uses HW perf counters, integrates
with Eclipse. Allows mapping up with actual lines in
Java code. Unclear exactly how this works (just a slide
deck, not a paper).
40

Schneider and Gross – LCPC2005
Using Platform-Specific Performance Counters for
Dynamic Compilation Schneider and Gross, LCPC2005.
• VM/JIT. Plan to use counters to help optimize JIT.
• Use custom kernel module, Pentium 4
• Table of methods, list of where each byte code starts.
Once get address have to do binary search to find which
byte code it matches.
41
Georges et al. – OOPSLA 2007
Statistically Rigorous Java Performance Evaluation by
Georges, Buytaert, Eeckhout (Oopsla07).
Sources of non-determinism in Java Programs:
• JIT compilation (timer-based sampling might lead to
different JIT invocation times)
• Thread scheduling
• Garbage collection
• System interrupts
42
Georges et al. – continued
• Problem reporting “best” run versus 95% confidence
interval
• They found it changes conclusions.
• Methodology is important
43
Counter Determinism
44
Uses of Counter Determinism
• Validating simulators
• Generating Basic Block Vectors
• Performing Feedback-Directed Optimization
• Hardware Checkpointing/Rollback
• Intrusion Analysis
• Parallel Deterministic Execution (Deterministic Locking)
45
Determinism vs Overcount
• Determinism – same count every time you run
• Overcount – an event counts more than the expected
amount
46

HW Sources of Non-Determinism
• Operating-System interaction
• Program Layout
• Measurement Overhead
• Multi-processor variation
• Hardware Issues
47

SW Sources of Non-Determinism
• Accessing changing values, such as time
• Pointer-value dependencies
48

Problems fount on x86 64
• Hardware Interrupt Interference – extra counts due to
HW interrupts. This includes page faults.
• Instruction Overcounts – some counters are buggy and
count extra
• FP exception/Lazy FP Handling
• Instructions that count uops rather than instructions
49

x86 Deterministic Counters
• Core2: Retired Stores
• Westmere, SNB, IVB: Conditional Branches
50
Mytkowicz et al. ASPLOS 2009
Producing Wrong Data Without Doing Anything Obviously
Wrong. Mytkowicz, Diwan, Hauswirth, Sweeney: ASPLOS
2009.
• Measurement bias
• Simple experiment, seeing if -O3 compiler optimization
is better not straightforward
• Changing environment variable size affects cycle count.
51
• Changing link order can change performance more than
compiler optimization
• It varies by machine and by compiler
52

Counter Accuracy Conclusion
Results are not meant to scare you or say to not use
counters.
Just remember they are not perfect and keep in mind
their limitations as you use them.
53