www.redseerconsulting.com [email protected] 2011 RedSeer Consulting Confidential `and Proprietary Information © | www.redseerconsulting.com [email protected] 2011 RedSeer Consulting Confidential `and Proprietary Information ©
Flexible in Approach, Firm on Results
E-Tailing Market in India Funded by large global investors, the e-tailing market in India is growing exponentially. Going
forward, what are the megatrends likely to emerge in this market?
March 2015
1
| 2
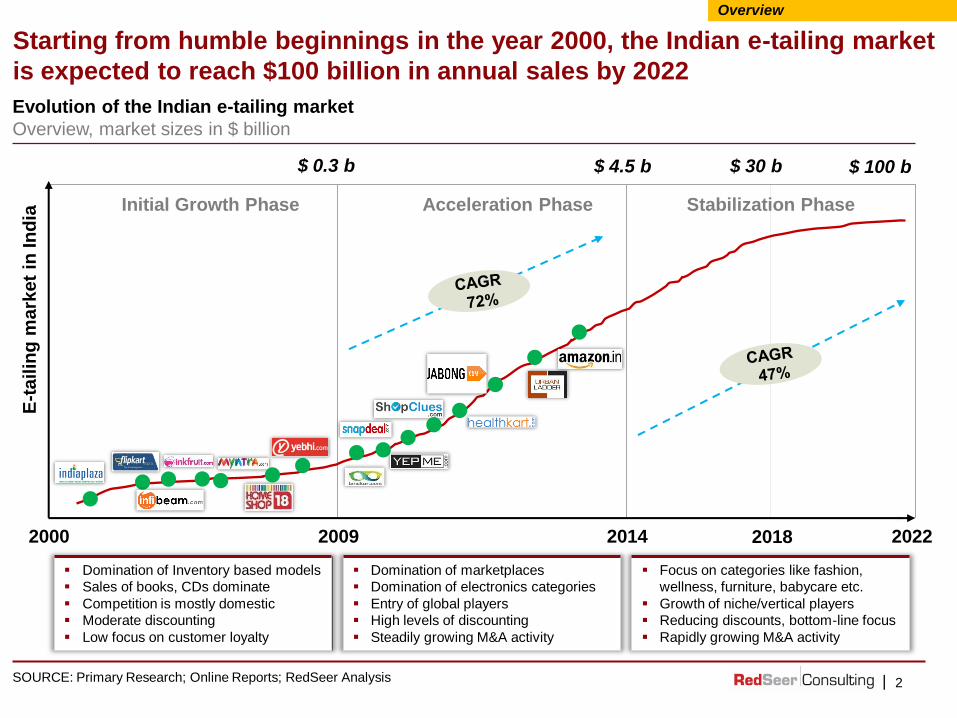
Evolution of the Indian e-tailing market
Overview, market sizes in $ billion
SOURCE: Primary Research; Online Reports; RedSeer Analysis
Overview
E-t
ailin
g m
ark
et
in In
dia
Domination of Inventory based models
Sales of books, CDs dominate
Competition is mostly domestic
Moderate discounting
Low focus on customer loyalty
Domination of marketplaces
Domination of electronics categories
Entry of global players
High levels of discounting
Steadily growing M&A activity
Focus on categories like fashion,
wellness, furniture, babycare etc.
Growth of niche/vertical players
Reducing discounts, bottom-line focus
Rapidly growing M&A activity
Initial Growth Phase Acceleration Phase
2009 2014 2022 2000
$ 0.3 b $ 4.5 b $ 100 b $ 30 b
2018
Stabilization Phase
Starting from humble beginnings in the year 2000, the Indian e-tailing market
is expected to reach $100 billion in annual sales by 2022

|
The $4.5 billion e-tailing market in India is split into horizontal and vertical
players; horizontal players have captured ~80% share of the market
Source: Primary Research, RedSeer Analysis
Split of e-tailing market by nature of player
2014 sales figures
Market segmentation
Horizontal Players Vertical Players
Indian e-tailing
market
$ 4.5 billion
$ 3.6 billion $ 0.9 billion
Horizontal players i.e. players
selling products across verticals,
dominate the e-tailing market
The major horizontal players
Amazon, Snapdeal and Flipkart
contribute ~75-80% of sales to
the e-tailing market
Major verticals which vertical
players operate in includes
fashion, furniture and home
furnishings, eye care products,
healthcare products etc.
These niche players constitute a
small share of the market
currently, but are growing
rapidly
Key insights
3

|
38%
80%
62%
20%
Snapdeal
Amazon
Company Fulfilled Seller Fulfilled
4
Inventory/Marketplace split of vertical players
Total Market
USD 4.5 Billion
USD 0.8
Billion
USD 3.7
Billion
Inventory
Seller Fulfilled
Seller Customer
Company Warehouse Customer
Company Fulfilled
Seller Company
Warehouse Customer
40%
70%
60%
30%
Pepperpfry
Jabong
% Inventory % Marketplace
Marketplace
The marketplace model contributes ~80-85% share of Indian e-tailing market;
company fulfilled marketplace models are popular with horizontal players
Split of e-tailing market by business model
Market Size based on 2014 sales figures
Market segmentation
Marketplace model split of horizontal players
SOURCE: Online Reports; RedSeer Analysis
|
CAGR
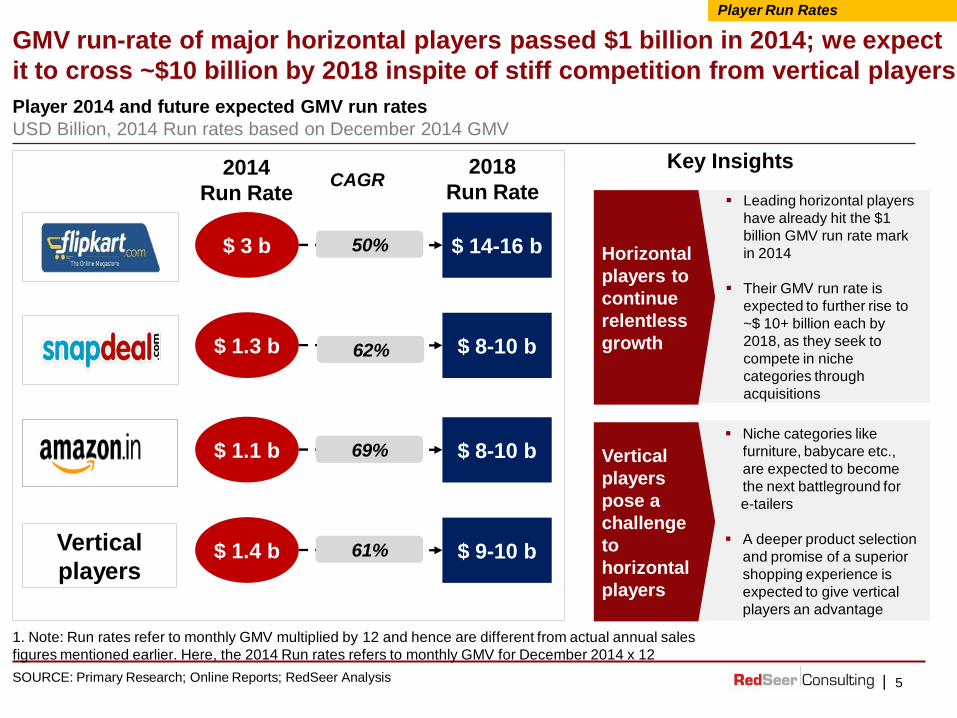
Leading horizontal players
have already hit the $1
billion GMV run rate mark
in 2014
Their GMV run rate is
expected to further rise to
~$ 10+ billion each by
2018, as they seek to
compete in niche
categories through
acquisitions
GMV run-rate of major horizontal players passed $1 billion in 2014; we expect
it to cross ~$10 billion by 2018 inspite of stiff competition from vertical players
5
Player 2014 and future expected GMV run rates
USD Billion, 2014 Run rates based on December 2014 GMV
Horizontal
players to
continue
relentless
growth
SOURCE: Primary Research; Online Reports; RedSeer Analysis
Key Insights
Player Run Rates
$ 3 b
$ 14-16 b
50%
$ 1.3 b
$ 8-10 b
$ 1.1 b
$ 8-10 b
$ 1.4 b
$ 9-10 b
Vertical
players
2014
Run Rate
1. Note: Run rates refer to monthly GMV multiplied by 12 and hence are different from actual annual sales
figures mentioned earlier. Here, the 2014 Run rates refers to monthly GMV for December 2014 x 12
Niche categories like
furniture, babycare etc.,
are expected to become
the next battleground for
e-tailers
A deeper product selection
and promise of a superior
shopping experience is
expected to give vertical
players an advantage
Vertical
players
pose a
challenge
to
horizontal
players
62%
69%
61%
2018
Run Rate

|
Drivers and challenges Description
Growing mobile internet
penetration
Mobile internet users in India are expected to jump from ~800 million in 2013 to 1.1
billion by 2020
As mobile apps get more optimized, this is expected to be a strong driver of online
sales
Growing smartphone
penetration
Smartphone users in India are expected to nearly quadruple from the ~120 million in
2014 to 450 million by 2020
Increased urbanization
leading to less leisure
time
It is estimated that around 60-70% of time of an individual in urban India is taken up by
sleep, time spent at work, and commuting to work
Paucity of time for shopping at regular stores and convenience of online shopping is
expected to continue driving sales, especially as urbanization increases
Growing purchasing
power and product
variety needs of small
town customers
Growing purchasing power is driving strong demand from smaller cities
The convenience of obtaining products online, which are unavailable in physical stores
in smaller towns, is further fuelling demand
This has led players like Jabong to generate 60+% sales from smaller towns
Continued (but gradually
reducing) discounting
The growth of e-tailing has been fuelled by heavy average discounts in the range of 30-
40%
Even as players pare down discounts, average discounts are expected to still remain
over the 15-20% mark and thus remain a key driver of sales
Regulatory issues
Leading players in the Indian e-tailing space including Amazon and Flipkart have been
bogged down by issues related to tax compliances and FEMA rules
Slow evolution of the framework for managing e-tailers is expected to continue to bog
down players and investors alike, thus posing a challenge to the growth of the sector
1
2
3
4
5
6
6 Source: Industry Interviews ; RedSeer Estimate
The e-tailing market growth is expected to be driven by greater internet and
smartphone penetration and continued discounting
Drivers and challenges to e-tailing growth
Key points
Future market trends
Drivers Challenges
|
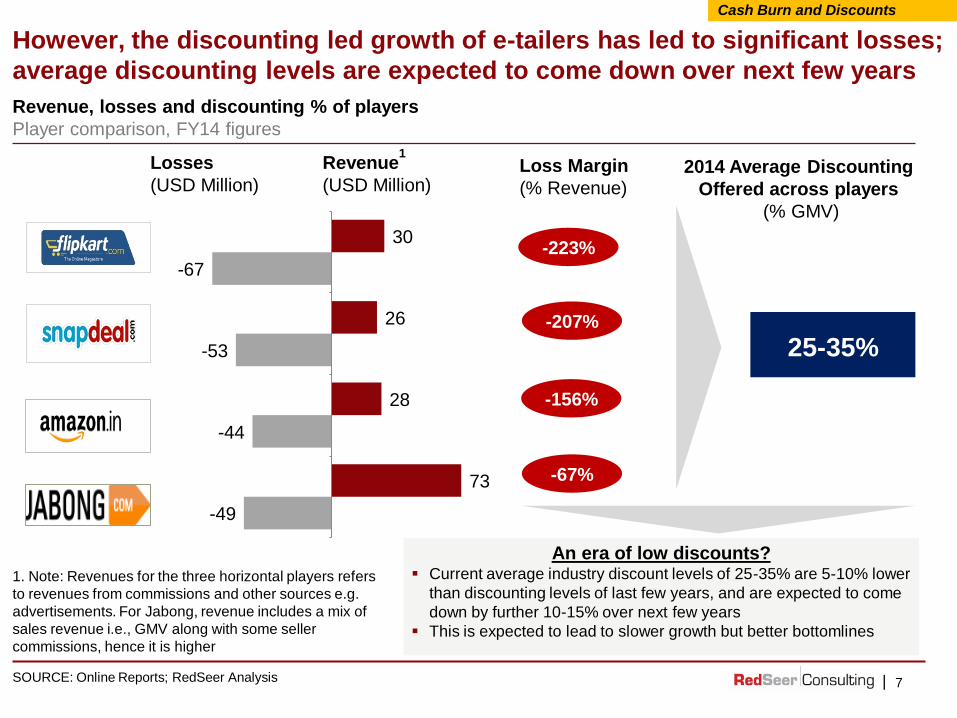
However, the discounting led growth of e-tailers has led to significant losses;
average discounting levels are expected to come down over next few years
7
-49
-44
-53
-67
73
28
26
30
Jabong
Amazon
Snapdeal
Flipkart
Losses
(USD Million)
Revenue1
(USD Million) 2014 Average Discounting
Offered across players
(% GMV)
An era of low discounts? Current average industry discount levels of 25-35% are 5-10% lower
than discounting levels of last few years, and are expected to come
down by further 10-15% over next few years
This is expected to lead to slower growth but better bottomlines
SOURCE: Online Reports; RedSeer Analysis
Revenue, losses and discounting % of players
Player comparison, FY14 figures
Cash Burn and Discounts
30%
25-30%
1. Note: Revenues for the three horizontal players refers
to revenues from commissions and other sources e.g.
advertisements. For Jabong, revenue includes a mix of
sales revenue i.e., GMV along with some seller
commissions, hence it is higher
Loss Margin
(% Revenue)
-207%
-156%
-67%
-223%
25-35%

| 8
Investments trends in e-tailing
Key Investments made in $ and key investors
SOURCE: Primary Research; Online Reports; RedSeer Analysis
Investment trends
2011/12 2013 2014
Other leading
players
$ 2 billion1
$ 0.9 billion
$ 1.9 billion
$ 50
mn
$ 320
million
$ 57
mn
$ 20
mn
~$ 0.6
billion
$ 2.5
billion
$ 1.2
billion
$ 2
billion
The discount led model of growth is being funded by foreign investors;
Indian e-tailers have raised ~$ 6.5 billion over last few years
$57
mn
$10
mn2
$ 0.2
billion
Cumulative funds raised till date Year-wise split of funds raised
1. Amazon’s is an internal fund raising, with $2 billion being committed by Amazon Global for Amazon India
2. The Funds have been raised by the combined Zovi Inkfruit entity, which was formed from the merger of the two companies in 2013
|
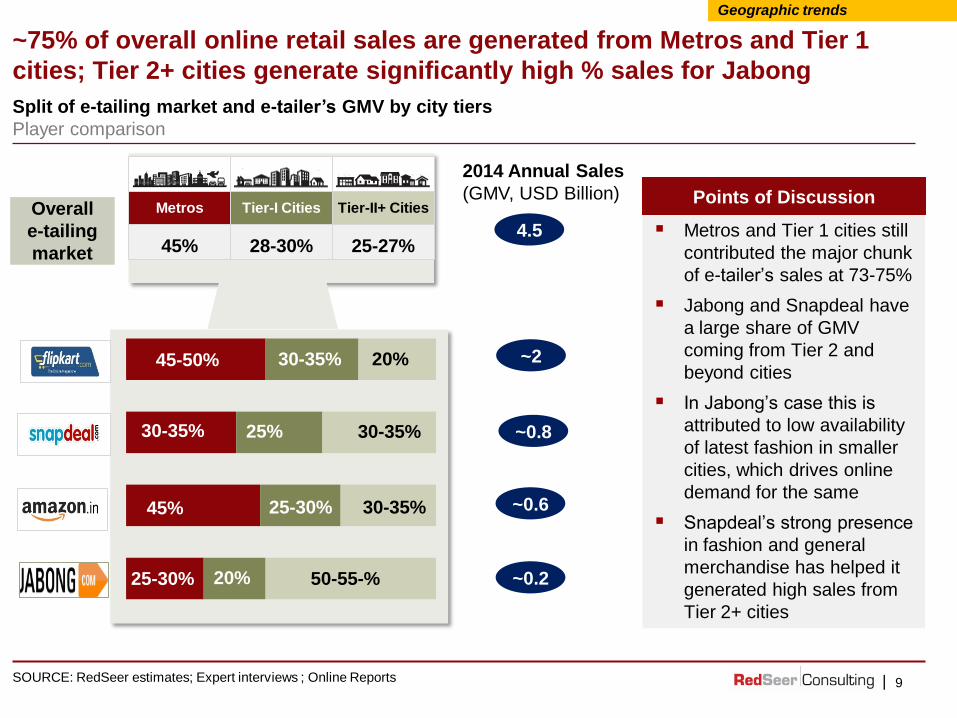
Split of e-tailing market and e-tailer’s GMV by city tiers
Player comparison
~75% of overall online retail sales are generated from Metros and Tier 1
cities; Tier 2+ cities generate significantly high % sales for Jabong
9
Metros Tier-I Cities Tier-II+ Cities
45% 28-30% 25-27% Metros and Tier 1 cities still
contributed the major chunk
of e-tailer’s sales at 73-75%
Jabong and Snapdeal have
a large share of GMV
coming from Tier 2 and
beyond cities
In Jabong’s case this is
attributed to low availability
of latest fashion in smaller
cities, which drives online
demand for the same
Snapdeal’s strong presence
in fashion and general
merchandise has helped it
generated high sales from
Tier 2+ cities
Points of Discussion
4.5
2014 Annual Sales
(GMV, USD Billion) Overall
e-tailing
market
Geographic trends
SOURCE: RedSeer estimates; Expert interviews ; Online Reports
45-50% 30-35% 20%
30-35% 25% 30-35%
45% 25-30% 30-35%
25-30% 20% 50-55-%
~2
~0.8
~0.6
~0.2

|
Electronics constitutes the largest share of GMV in the Indian e-tailing
market; fashion and home décor are other large categories
10
Electronics
Fashion
Home décor
and lifestyle
Books,
Music, Video
Others
Electronics
Fashion
Home décor and lifestyle
Books/Music/ Video
Others
Electronics, including large and small
appliances, are the major constituents of
Indian e-tailing market
Other includes niche categories like grocery,
furniture and automobile accessories
Clear
dominance
of
electronics
<10% GMV share
10-30% GMV share
>30% GMV share
Product category-wise analysis
Player and market comparison
Category wise split of online retail market
USD 4.5
Billion
Total e-tailing market
sales (GMV)
High share of other products in Snapdeal
Niche categories like furniture,
kitchenware, automotive and luggage are
doing well for Snapdeal
Category-wise trends
SOURCE: Primary Research; Online Reports; RedSeer Analysis
NA
NA
NA
Player’s category wise GMV share
~45-50%
~18-20%
~15%
~10%
~8%

|
Rapid growth of relatively smaller categories like fashion has led to
horizontal players acquiring niche vertical players to increase selection
11 SOURCE: Online Reports; RedSeer Analysis
Acquisitions by horizontal players
Key acquisitions
Category-wise trends
2010/2011 2012/13 2014
Sports Fashion
Electronics Fashion Books
Couponing
Going forward, acquisitions across niche categories like fashion, sports
and toys, luggage, furniture etc. are likely to increase as players seek to
differentiate themselves on basis on range and variety of products offered
Snapdeal’s
acquisitions reflect its
transition from a
couponing portal to a
highly diversified
e-tailer, having a high
share of sales from
fashion
Flipkart’s evolution
from a books e-tailer
to an online
electronics and
fashion giant is
reflected in its
acquisitions
Acquired Company
Category
Acquired Company
Category
|
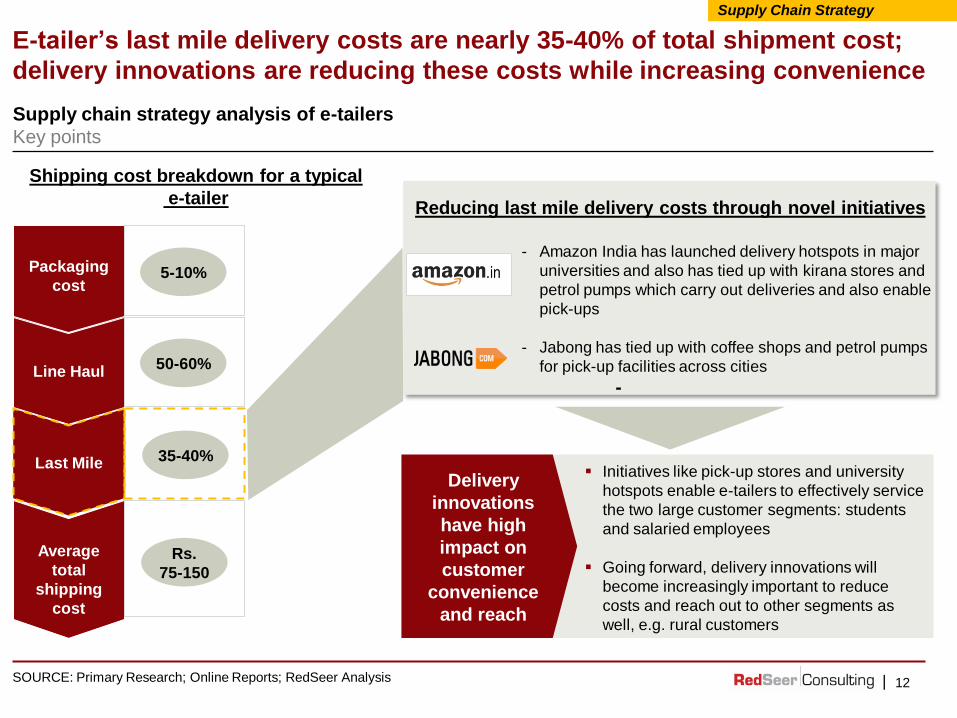
- Amazon India has launched delivery hotspots in major
universities and also has tied up with kirana stores and
petrol pumps which carry out deliveries and also enable
pick-ups
- Jabong has tied up with coffee shops and petrol pumps
for pick-up facilities across cities
-
Initiatives like pick-up stores and university
hotspots enable e-tailers to effectively service
the two large customer segments: students
and salaried employees
Going forward, delivery innovations will
become increasingly important to reduce
costs and reach out to other segments as
well, e.g. rural customers
Delivery
innovations
have high
impact on
customer
convenience
and reach
E-tailer’s last mile delivery costs are nearly 35-40% of total shipment cost;
delivery innovations are reducing these costs while increasing convenience
12
Packaging
cost
Line Haul
Last Mile
Average
total
shipping
cost
50-60%
Supply chain strategy analysis of e-tailers
Key points
35-40%
Rs.
75-150
5-10%
Shipping cost breakdown for a typical
e-tailer Reducing last mile delivery costs through novel initiatives
Supply Chain Strategy
SOURCE: Primary Research; Online Reports; RedSeer Analysis
|
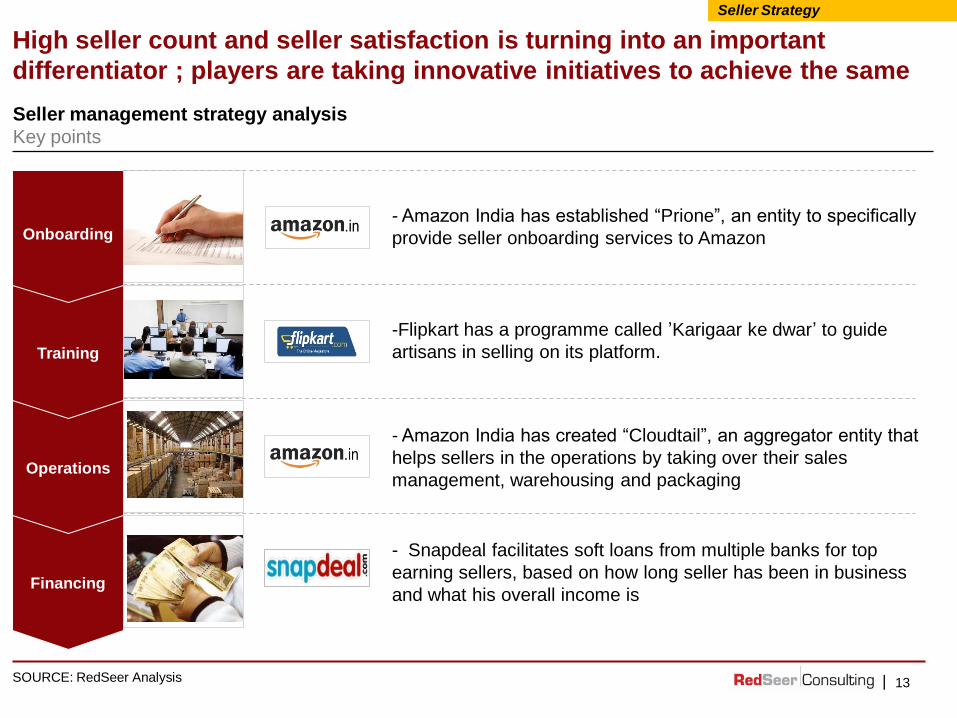
High seller count and seller satisfaction is turning into an important
differentiator ; players are taking innovative initiatives to achieve the same
13 SOURCE: RedSeer Analysis
Seller management strategy analysis
Key points
Seller Strategy
Onboarding
Training
Operations
Financing
- Amazon India has established “Prione”, an entity to specifically
provide seller onboarding services to Amazon
- Amazon India has created “Cloudtail”, an aggregator entity that
helps sellers in the operations by taking over their sales
management, warehousing and packaging
- Snapdeal facilitates soft loans from multiple banks for top
earning sellers, based on how long seller has been in business
and what his overall income is
-Flipkart has a programme called ’Karigaar ke dwar’ to guide
artisans in selling on its platform.
|
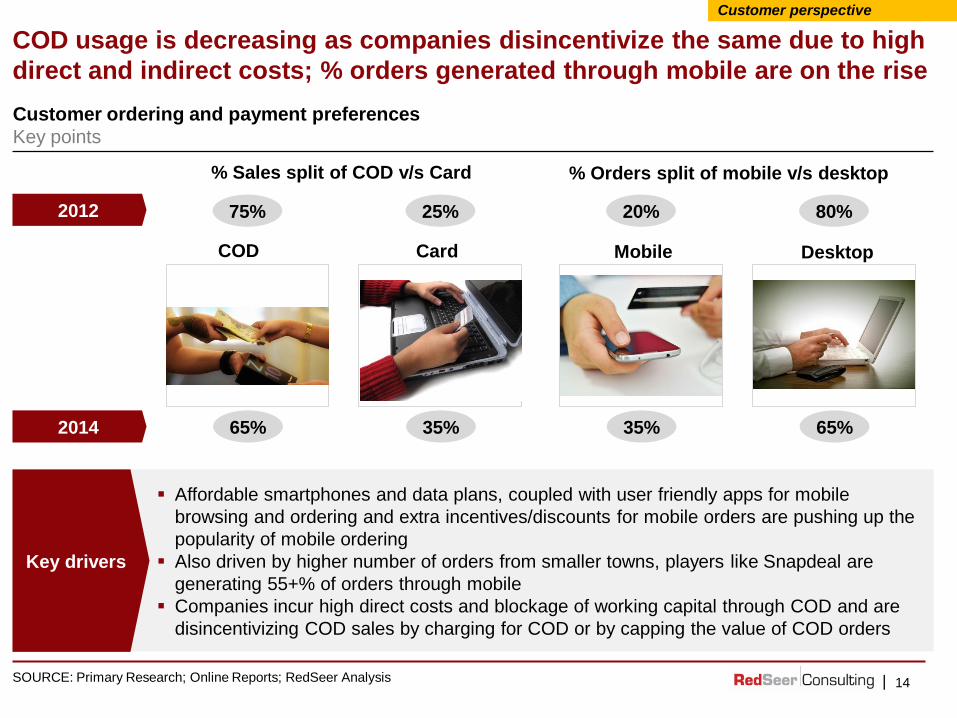
Affordable smartphones and data plans, coupled with user friendly apps for mobile
browsing and ordering and extra incentives/discounts for mobile orders are pushing up the
popularity of mobile ordering
Also driven by higher number of orders from smaller towns, players like Snapdeal are
generating 55+% of orders through mobile
Companies incur high direct costs and blockage of working capital through COD and are
disincentivizing COD sales by charging for COD or by capping the value of COD orders
COD usage is decreasing as companies disincentivize the same due to high
direct and indirect costs; % orders generated through mobile are on the rise
14
2012
2014
Key drivers
65% 35% 35% 65%
75% 25% 20% 80%
Customer ordering and payment preferences
Key points
% Sales split of COD v/s Card % Orders split of mobile v/s desktop
Customer perspective
SOURCE: Primary Research; Online Reports; RedSeer Analysis
COD Card Mobile Desktop

|
Customers perceive Flipkart and Jabong highly; Snapdeal’s service
performance is perceived poorly
15
Customer perception rating of players on key parameters
Rating on a scale of 5, N=50 responses
Customer perspective
1. Survey conducted across 50 respondents across cities. 45% of respondents were based in metros, 30% in Tier 1
cities and 25% in Tier 2 cities and beyond.
“ We received the product
10 days after ordering, Also
the payment interface is
complicated to
use”-Snapdeal Customer,
Kolkata
“ We ordered speakers and
dinner plates. The speakers
turned out to be broken
while the plates were of
wrong size
”-Snapdeal Customer,
Bangalore
“ The Jabong personnel
said he would reverse pick
up in 3-4 days but he did in
1-2 days. Jabong’s service
levels are excellent”
-Jabong Customer, Kolkata
SOURCE: Primary Research; RedSeer Analysis
Ease of
Payment
On Time
Delivery
Ease of
returns
Product
condition/quality
Poor
Neutral
Good

|
Gradual ‘verticalization’ of the market and sharp growth in size and importance of
vertical players across grocery, furniture, babycare, jewellery etc.
The Indian e-tailing industry is still in its initial stages; going forward,
players who stay ahead of the curve are likely to emerge as winners
16
Expected long term megatrends
Key points
Future megatrends
1
SOURCE: Primary Research; Online Reports; RedSeer Analysis
Mobile platform to be the next battleground with 80+% of orders placed over mobile
over the next few years, thus driving innovation in mobile apps and advertising 2
Reduced discounting and increase in bottom-line growth initiatives like 1) Exclusive
launches 2) Private Labels and 3) Subscription based services (e.g. Flipkart first) 3
Increase in delivery innovations like hyper-local delivery, customer pick up facilities,
instant returns and same day delivery to provide a superior customer experience 4
Increased focused on seller satisfaction for marketplace players and growth in range
of services offered to sellers including warehousing, training and financing 5

| www.redseerconsulting.com [email protected] 2011 RedSeer Consulting Confidential `and Proprietary Information ©
Thank You!
Bangalore I Delhi I Mumbai I Philadelphia
RedSeer Management Consulting Private Limited