National Library ($1 of Canada BPiiiatMque nationale du Cana&
Acquisitions and Acquisitions et Bibliographie Services senrices bibliographiques 395 Wellington Street 395, rue W6llingîcm Ottawa ON Kt A ON4 -ON K 1 A W Canada Canada
The author has granted a non- exclusive licence dowing the National Library of Canada to reproduce, loan, distri'bute or seiî copies of this thesis in microform, paper or electronic formats.
The author retains ownership of the copyright in this thesis. Neither the thesis nor substantial extracts fiom it may be p ~ t e d or olherwise reproduced without the author's permission.
L'auteur a accordé une licence non exclusive permettant à la Bibliothèque nationale du Canada de reproduire, prêter, distribuer ou vendre des copies de cette thèse sous la forme de microfichelfilm, de reproduction sur papier ou sur format électronique.
L'auteur conserve la propriété du droit d'auteur qui protège cette thèse. Ni la thése ni des extraits substantiels de celle-ci ne doivent être imprimés ou autrement reproduits sans son autorisation.
PREVALENCE OF CARDIOVASCULAR DISEASE RlSK FACTORS IN YOUNG NEWFOUNDLAND AND LABRADOR ADULTS LIVING IN RURAL AND
by
SUSAN M. KElTLE
A thesis subrnitted to the
School of Graduate Studies
in partial fulfillment of the
requirements for the degree of
Master of Science
Division of Community Health Faculty of Medicine
Mernorial University of Newfoundland
St. John's Newfoundland
ABSTRACT
Newfoundland and Labrador has a higher rate of cardiovascular disease (CVD)
than any other province in Canada. Many factors have been identified as being
associated with a risk of developing CVD yet their presence has not been well
studied in young adults and in urban versus rural residents. A group of 540
males and females 18-34 yean residing in either rural or urban Newfoundland
and Labrador were studied for education level, household income, cigarette
smoking, physical activity and body site. Both education and household income
were found to be significantly higher in urban as compared to rural residents. No
difference was noted between the number of regular smokers in the two
community groups. In regards to body site, no difference was noted between
BMI levels of the two groups, however more female rural residents had a waist
circumference above the accepted cut-off (32.5% vs. 17.0%). A differenœ was
noted in physical activity at work with more rural residents than urban residents
engaged in heavy labour (24.5% vs. 6.6%) and more urban residents than rural
residents at sedentary jobs (22.7% vs. 9.9%). Young adults in both rural and
urban centers experience modifiable risk factors. Prevention prograrns should be
focused on young adults, especially those residing in rural areas.
TABLE OF CONTENTS
ACKNOWLEDGEMENTS
LlST OF FIGURES
LlST OF TABLES
1 .O. CHAPTER 1 - LITERATURE REVIEW
1.1. Cardiovascular Disease in Canada
1.2. Factors which Influence the Risk of Developing Cardiovascular Disease 1.2.1. Age 1.2.2. Gender 1.2.3. Family History 1.2.4. Excess Body Fat 1.2.5. Distribution of Body Fat 1.2.6. Physical Activity 1.2.7. Cigarette Smoking 1.2.8. Others
1 .2.8.l. Socioeconomic Status 1.2.8.1 .l .€ducation 1.2.8.2.2.lncome
1.2.8.2. Area of Residence
1.3. Nutrition Newfoundland and Labrador
2.0. CHAPTER II - AIM OF STUDY
2 1 Rationale
2.2. Purpose
2.3. Goal and Objectives
3.0. CHAPTER Ill - METHODOOGY
iii
3.1 . Study Population
3.2. Sample Design
3.3. Setting
3.4. Source of Oata
3.5. Ethical Approval
3.6. Variables 3.6.1 . Non-modifiable Risk Factors 3.6.2. Modifiable Risk Factors
3.6.2.1. Body Fat 3.6.2.1.1. Body Mass lndex 3.6.2.1 -2. Abdominal Adipose Tissue
3.6.2.2. Physical Activity 3.6.2.2.1. Physical Activity at Work 3.6.2.2.2. Physical Activity during Leisure
Time 3.6.2.3. Cigarette Smoking
3.6.3. Others 3.6.3.1. Education 3.6.3.2. Household lncome
3.7. Data Analysis
4. CHAPTER IV - RESULTS
Introduction of Results
Response Rate
Sociodemographic and Socioeconomic Characteristics of the Overall Study Sample
Prevalenœ of Factors that are Associated with the Development of CVD in the Study Sample 4.4.1. Body Fat
4.4.1.1. Body Mass lndex 4.4.1.2. Abdominal Adipose Tissue
4.4.2. Physical Activity 4.4.2.1. Physical Activity at Work 4.4.2.2. Physical Activity during Leisure Time
4.4.2.2.1. Lower lntensity 4.4.2.2.2. Higher lntensity
4.4.3. Smoking Habits
4.5. Relationship between Cardiovascular Disease Risk Factors and Area of Residence 4.5.1 . Body Fat and Area of Residence
4.5.1.1 BodyMasslndex 4.5.1.2 Waist Circumference
4.5.2. Physical Activity and Area of Residence 4.5.2.1. Physical Activity at Work 4.5.2.2. Physical Activity during Leisure Time
4.5.2.2.1. Lower lntensity 4.5.2.2.2. Higher lntensity
4.5.3. Smoking Habits and Area of Residence
4.6. Effect of Socioeconomic Factors and Risk of Development of Cardiovascular Disease 4.6.1 . Body Fat 4.6.2. Physical Activity
4.6.2.1. Physical Activity at Work 4.6.2.2. Physical Activity dunng Leisure Time
4.6.2.2.1. Lower lntensity 4.6.2.2.2. Higher lntensity
4.6.3. Smoking Habits
5. CHAPTER V - DISCUSSSION
5.1 . Introduction of Discussion 5.1.1. Nova Scotia Nutrition Survey 5.1.2. Canadian Heart Health Survey
5.2. Response Rate
5.3. Characteristics of Study Sample
5.4. Prevalence of Cardiovascular Disease Risk Factors of Sample Study 5.4.1. Body Size 5.4.2. Physical Activity 5.4.3. Cigarette Smoking
5.5. Prevalence of CVD risk factors of Urban and Rural Residents 5.5.1 . Body Size 5.5.2. Physical Activity 5.5.3. Cigarette Smoking

5.6. Influence of Age, Gender. Area of Residenœ and Education and Household lncome on the Presence of CVD Risk Factors 137
5.7. Limitations of the Study 139
6. CHAPTER VI - CONCLUSION 141
REFERENCES 144
APPENDICES 155

ACKNOWLEDGEMENTS
I would like to thank my supervisor Dr. Barbara Roebothan for her continued
guidance, support and encouragement throughout my Masters program. I would
also like ta thank my supervisor, Dr. Roy West for his wisdom and generosity. I
would not have been able to complete this endeavor without them.
I would like to acknowledge the help given to me by Dr. V.Gadag in order to
complete the statistical analysis. As well as the knowledge and support of Alison
Edwards during the completion of adjusted weighting analysis and of Dr. Roy
Bartlett during the calculation of logistic regression analysis.
I would also like to thank my parents and sisters for their encouragement and
understanding throughout my years as a graduate student. As well. I would like
to thank my close friends who made rny time at Mernorial University of
Newfoundland mernorable.
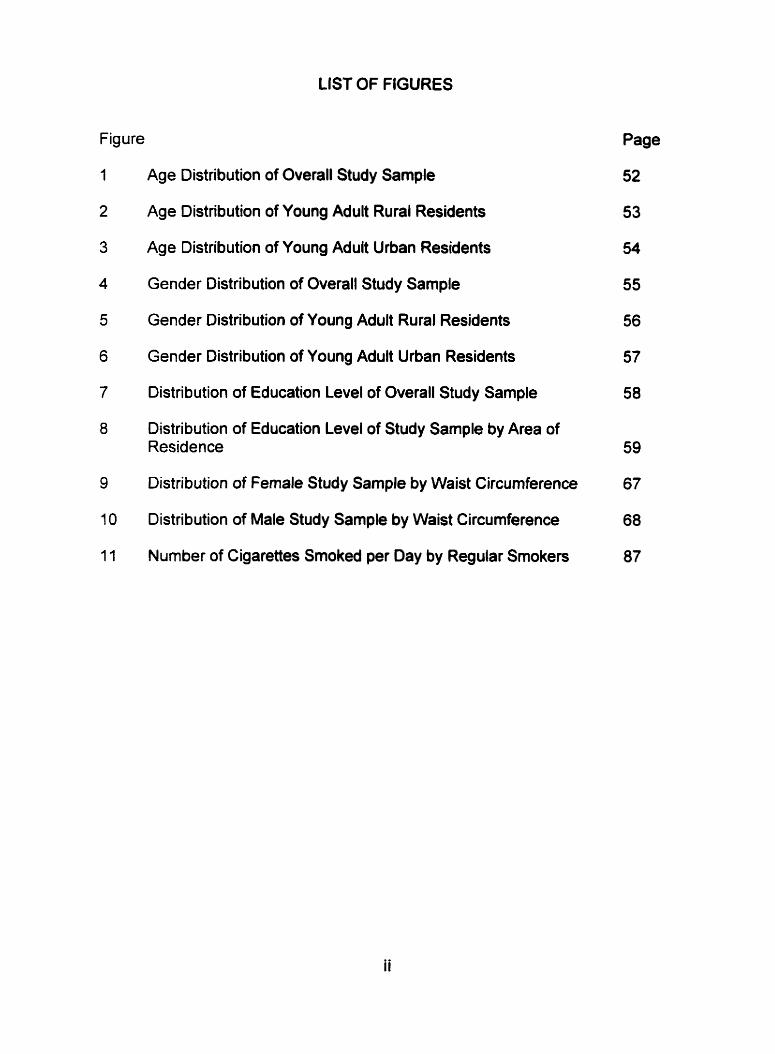
LIST OF FIGURES
Figure
Age Distribution of Overall Study Sample
Age Distribution of Young Adult Rural Residents
Age Distribution of Young Adult Urban Residents
Gender Distribution of Overall Study Sample
Gender Distribution of Young Adult Rural Residents
Gender Distribution of Young Adult Urban Residents
Distribution of Education Level of Overall Study Sample
Distribution of Education Level of Study Sample by Area of Residence
Distribution of Female Study Sample by Waist Circumferenœ
Distribution of Male Study Sample by Waist Circumference
Number of Cigarettes Smoked per Day by Regular Smokers
Page
52
53
54
55
56
57
58
59
67
68
87

Table
LIST OF TABLES
Page
Number and Percent of Deaths due to Cardiovascular Diseases of Males in Canada
Number and Percent of Deaths due to Cardiovascular Diseases of Fernales in Canada
Age-Specific Mortality Rates per 100,000 All Cardiovascular Diseases, Males and Fernales, in Canada, 1995
Selection Factors for Sample Selection in Nutrition Newfoundland and Labrador Survey
Response Rates of Study Sarnple by Age and Gender from Total Sample Drawn
Number and Percentage of Study Sample by Household lncome Level and Area of Residence
Number and Percentage of Study Sample by Age Groups and Body Mass lndex Categories
Number and Percentage of Study Sample by Gender and Body Mass lndex Categories
Number and Percentage of Fernale Study Sample by Age and Waist Circumference Cut-Offs
Number and Percentage of Mate Study Sample by Age and Waist Circumference Cut-Offs
Number and Percentage of Study Sample by Age and Physical Activity at Work
Number and Percentage of Study Sample by Gender and Physical Activity at Work
Number and Percentage of Study Sample by Age and Frequency of Lower lntensity Leisure Time Physical Activities
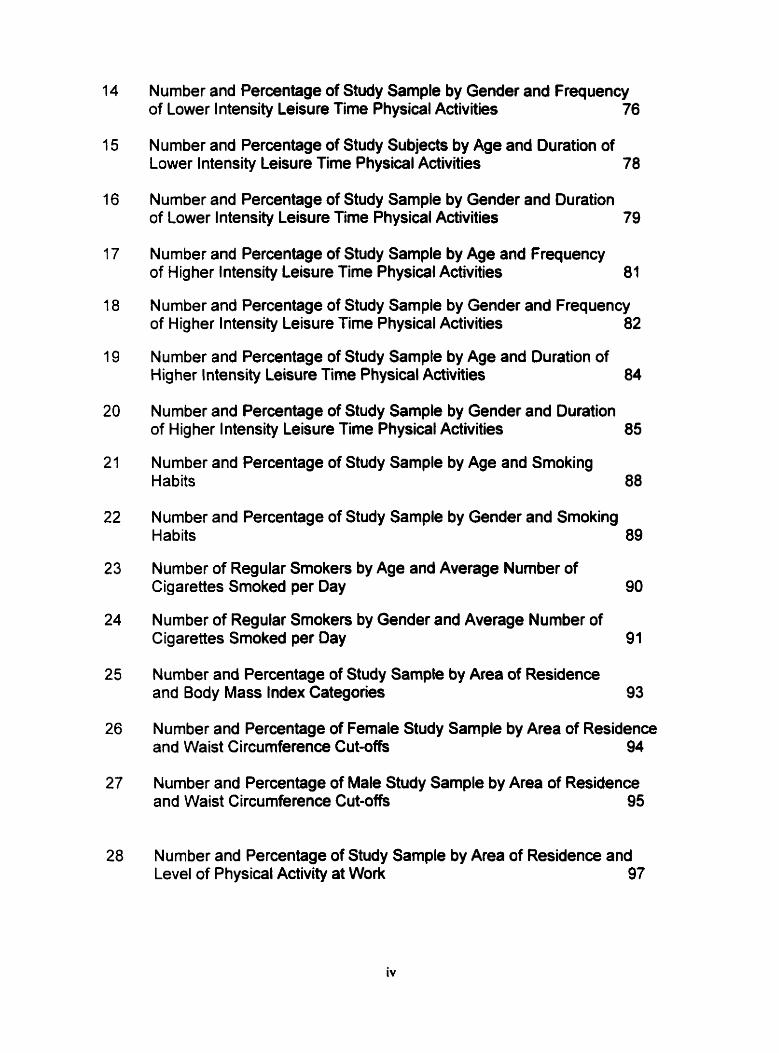
Number and Percentage of Study Sample by Gender and Frequency of Lower lntensity Leisure Time Physical Activities 76
Nurnber and Percentage of Study Subjects by Age and Duration of Lower lntensity Leisure Time Physical Activities 78
Nurnber and Percentage of Study Sample by Gender and Duration of Lower lntensity Leisure Time Physical Activities 79
Number and Percentage of Study Sample by Age and Frequency of H ig her lntensity Leisure Time Physical Activities 81
Number and Percentage of Study Sample by Gender and Frequency of H ig her l ntensity Leisure Time P hysical Activities 82
Number and Percentage of Study Sample by Age and Duration of Hig her l ntensity Leisure Tirne P hysical Activities 84
Number and Percentage of Study Sample by Gender and Duration of Higher lntensity Leisure Time Physical Activities 85
Number and Percentage of Study Sample by Age and Smoking Habits 88
Number and Percentage of Study Sample by Gender and Smoking Habits 89
Nurnber of Regular Smokers by Age and Average Number of Cigarettes Smoked per Day 90
Number of Regular Smoken by Gender and Average Number of Cigarettes Srnoked per Day 91
Number and Percentage of Study Sarnple by Area of Residence and Body Mass Index Categories 93
Number and Percentage of Female Study Sample by Area of Residence and Waist Circumference Cut-offs 94
Number and Percentage of Male Study Sample by Area of Residence and Waist Circumference Cut-offs 95
Number and Percentage of Study Sample by Area of Residence and Level of Physical Activity at Work 97
Number and Percentage of Study Sample by Area of Residence and Frequency of Lower lntensity Leisure Time Physical Activities
Number and Percentage of Study Sample by Area of Residence and Duration of Lower lntensity Leisure Time Physical Activities
Number and Percentage of Study Sample by Area of Residence and Freq uency of Hig her I ntensity Leisure Time Physical Activities
Number and Percentage of Study Sample by Area of Residence and Duration of Higher lntensity Leisute Time Physical Activities
Number and Percentage of Study Sample by Area of Residence and Smoking Habits
Number and Percentage of Study Sarnple by Area of Residence and Average Number of Cigarettes Smoked pet Day
Ordinal Logistic Regression of Study Sample by Body Mass Index and Demographic Variables
Ordinal Logistic Regression of Study Sample by Physical Activity at Work and Demographic Variables
Ordinal Logistic Regression of Study Sample by Ftequency of Lower l ntensity Leisure Time Physical Activities with Demographic Variables
Ordinal Logistic Regression of Study Sample by Duration of Lower lntensity Leisure Time Physical Activities with Demographic Variables
Ordinal Logistic Regression of Study Sample by Frequency of Higher lntensity Leisure Time Physical Activities with Demographic Variables 113
Ordinal Logistic Regression of Study Sample by Duration of Higher lntensity Leisure Tirne Physical Activities with Demographic Variables 114
Binary Logistic Regression of Study Sample by Smoking Habits with Demographic Variables 116
CHAPTER 1
LITERATURE REVIEHI
1 .lm Cardiovascular Disease in Canada
Cardiovascular disease (CVD) refen to al1 diseases of the heart and blood
vessels (American Dietetic Association, 1990). This includes cerebrovascular
disease, congestive heart disease, angina pectoris, artherosclerosis, arrthymia,
and myocardial infarction (Health Canada, 1995). Cerebrovascular disease
refers to any disorder of the blood vessels of the brain. Congestive heart
disease, another form of CVD, results when there is insufiicient biood flow,
leading to an accumulation of blood within an organ and heart failure. In the
early stages of congestive heart failure, many people experience short episodes
of inadequate blood fiow. This often leads to chest pains and is known as
angina pectoris (Vander, Sherman, 8 Luciano, 1994). Artherosclerosis is a
disease characterized by thickening of the walls of the small arteries (Ridker,
1996). Arrthyrnia is a disorder characterized by a deviation from the normal
rhythm of the heart (Vlay, 1996). Myocardial infarction results when there is
death of a segment of the heart muscle due to insufficient blood flow. This
causes an interruption of blood supply to the brain (Manson, Gaziano, Ridker, &
Hennekens, 1996).
Cardiovascular disease (CVD) is the teading cause of rnortality and a major
cause of morbidity in Canadians (Maclean et al., 1992). As a result, a large
amount of research and health promotion has been directed in recent years at
decreasing the prevalence of CVD in Canada. In the 1 9 8 0 ' ~ ~ the federal and
provincial governments organized a working group to address the issues
surrounding CVD prevention in Canada. This lead to the development of a
report entitled Promoting Heafi Health in Canada (Federal-Provincial Working
Group on the Prevention and Control of Cardiovascular Disease, 1992). In
1985, a number of surveys centered on the prevalence of CVD and its risk
factors were carried out in many provinces throughout Canada. From here,
provinces implemented theit own heart health programs to decrease CVD
(Health Canada, 1995). These initiatives contributed to the continuing decline of
rates of CVD incidence. For instance, in 1992, 38% of al1 deaths in Canada
were due to CVD (Health Canada, 1995). In 1995, 37% of deaths in Canada
were due to CVD (Tables 1 and 2), (Heart and Stroke Foundation of Canada,
1997). Within Canada, Newfoundland and Labrador is the province with the
highest level of CVD incidence for men and women, 317 and 294 per 100,000
population respectively (Heart and Stroke Foundation of Canada, 1997).
Cardiovascular disease is a major factor in the utilization of Canada's health
services. In 1994i95, the total number of days patients stayed in the hospital in
Canada due to cardiovascular disease events was 6,522,117. The National
Hospital Mobidity data file from 1992 revealed that patients with CVD stayed an
average of 12 days in the hospital compared to the average 10.8 days for al1
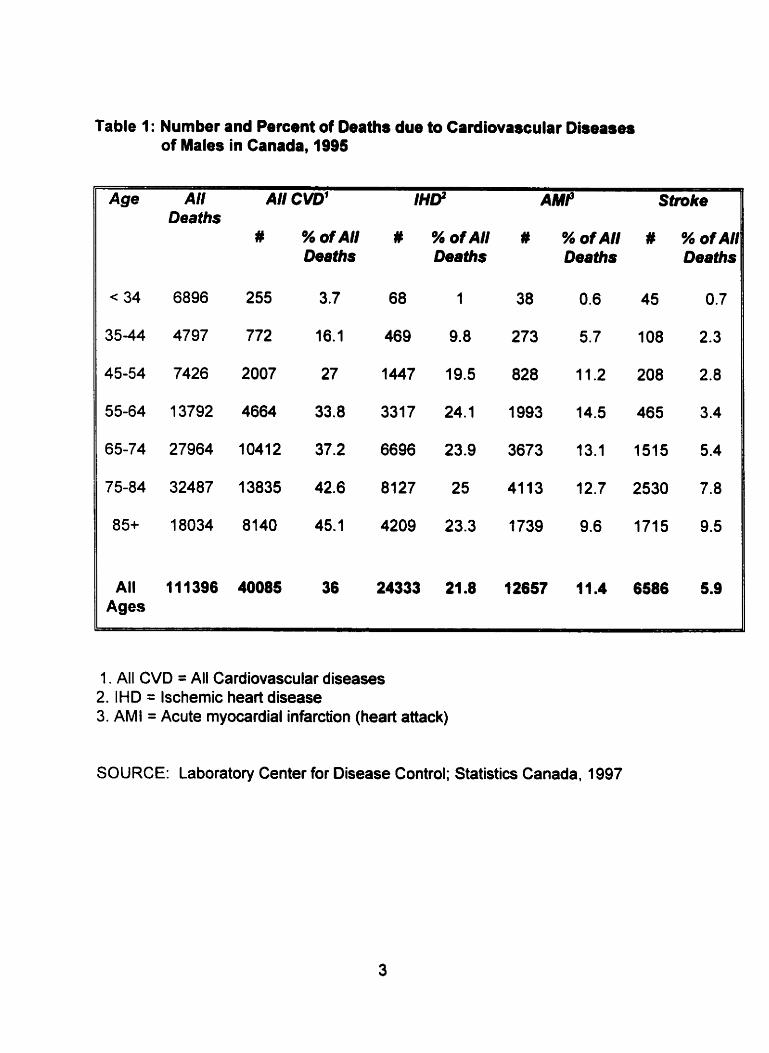
Table 1: Number and Percent of Deaths due to Cardiovascular Diseases of Males in Canada. 1995
Age Al1 f Al1 CVD' Stmke Deaths
#
All 111396 40085 Ages
% ofAl/ # Oeaths
% ofAl1 # % ofAl1 # % ofAIl Deaths Deaths Deaths
1 . All CVD = All Cardiovascular diseases 2. IHD = lschemic heart disease 3. AMI = Acute myocardial infarction (heart attack)
SOURCE: Labotatory Center for Disease Control; Statistics Canada. 1997
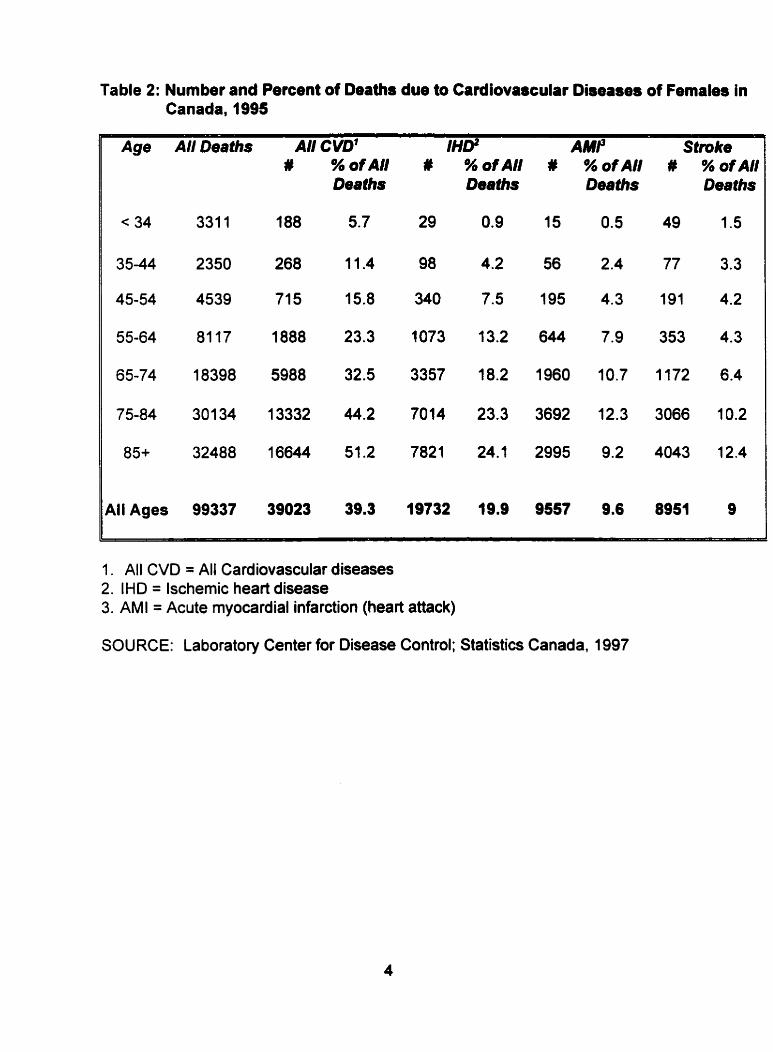
Table 2: Number and Percent of Deaths due to Cardiovascular Diseases of Females in Canada, 1995
Age AllDeeths AI1 CVD1 IHD' AMP Stmke # % ofAl/ # % of AI1 # % ofAl/ # % ofAl1
Deaths Deaths
< 34 331 1 188 5.7 29 0.9 15
All Ages 99337 39023 39.3 19732 19.9 9557
Deaths
O. 5
2.4
4.3
7.9
10.7
12.3
9.2
Deaths
49 1.5
77 3.3
191 4.2
353 4.3
1172 6.4
3066 10.2
4043 12.4
1. All CVD = All Cardiovascular diseases 2. IHD = lschemic heart disease 3. AMI = Acute myocardial infarction (heart attack)
SOURCE: Laboratory Center for Disease Control; Statistics Canada, 1997

diseases (Heart and Stroke Foundation of Canada, 1997). CVD was responsible
for a higher rate of dispensed prescriptions (12.8%) than any other disease in
Canada in 1 993194 (Statistics Canada, Health Statistics Division, 1 996).
Furthermore, in 1994, 9.9% of visits made to physicians were due to CVD (Heart
and Stroke Foundation of Canada, 1997).
Cardiovascular disease has a large economic impact in Canada. In 1995, CVD
accounted for $7.3 billion or 17% of the total direct cost of illness (Heart and
Stroke Foundation of Canada, 1997). That was the highest recorded for any
disease. Direct costs include hospital expenditures, medical care, drugs and
research. Indirect costs such as the loss of productivity due to illness or
disability or the loss of earnings due to premature death also play a role in the
economic burden of cardiovascular disease (Rice, Hodgson & Kopstein, 1985).
This is greater than indirect cost due to injuries, cancer or respiratory diseases
individually (Heart and Stroke Foundation of Canada, 1997).
1.2. Factors which Influence the Risk of Developing Cardiovascular Disease
A number of studies using various scientific approaches such as animal models,
cli nical trials, epidemiological and observational studies have identified va rious
factors as being associated with the risk of developing cardiovascular disease
(American Dietetic Association. 1990). Risk factors are characteristics that have
been primarily identified throug h prospective studies and are associated with an

increased probability of developing some fomi of a disease (Thomas & Kannel,
1983).
Some studies have documented the synergistic effect of the presence of multiple
risk factors on the development of CVD (Kannel8 Gordon, 1973; Sharper et al.,
1985; MacDonald et al., 1992). For instance, obesity can substantially increase
the risk of heart disease when a person is already experiencing one other risk
factor for cardiovascular disease (Wlhelmsen, 1 990).
Risk factors of CVD have been categorized as non-modifiable and modifiable.
Non-modifiable risk factors are personal characteristics that nonally cannot be
changed. These include age (Strong 8 Kelder, 1996), gender (Hanes, Weir &
Sowers, 1996), family history (Thomas 8 Kannel, 1983). and hormonal factors
(Wenger. 1 996).
Modifiable risk factors are those which can be changed through individual
behaviour or treatment. These include circulating levels of plasma lipids such as
cholesterol and trig lycerides (Reeder, et al.. 1 997), hypertension (National Health
and Research Development Program, 1989), excess body weight (Hubert,
Feinleib, McNamara & Castelli, 1 983), physical inactivity (Powell, Thompson,
Caspersen & Kendrick, l987), cigarette smoking (Hoeymans, Smit, Verkieij &
Kromhout, 1996), diabetes mellitus (Thomas & Kannel 1983). and stress
(American Dietetic Association, 1 990).

1.2.1. Age
Cardiovascular disease incidence increases with age (Heart and Stroke
Foundation of Canada. 1997). Table 3 shows the relationship between death
due to CVD and age-sex specific groups in Canada in 1995. Approximately
thirty males and eleven females per 100,000 population between 35-44 yean
died due to CVD as compared to 3000 males and 2000 females per 100,000
population between 75-84 years.
In 191 5, researchers proposed that atherosclerosis, a form of CVD, starts
developing in childhood. This was due to the discovery of atheroscelerotic
lesions in young autopsied patients. Atherosclerosis development was later
identified in studies that discovered fatty streaks in autopsies of young adults
from the Korean and Vietnam war (Strong & Kelder, 1996). These streaks lead
to vascular atherosclerosis, which can eventually lead to CVD and mortality
(Wattig ney, Webber, Srinivasan & Berenson, 1 995).
Similar studies have been conducted since then and have confirmed the
relations hi p between atherosclerosis and child hood (Strong & Kelder. 1 996).
Newman et al. (1986) analyzed the relationship between risk facton of CVD and
the presence of early atherosclerotic lesions in autopsies of persons from
Bogalusa, Louisiana. This was a cross-sectional study conducted between
1973-1 983 on 35 subjects between 2 to 24 yean of age at the time of death.
The risk facton considered were total blood cholesterol levels, serum triglyceride
levels. low-density lipoprotein (LDL) chalesterol levels, high-density lipoprotein

Table 3: Age-Specific Mortality Rate, per 100,000, All Cardiovawular Diseases, Males and Fernales, in Canada, 1995
Gender Age 35-44 45-54 5564 65-74 75-84 85+
M 19 78 267 702 1825 4020 IHD'
F 4 19 85 296 1029 3163
M 4 1 i 37 159 568 1639 Stroke F 3 10 28 1 03 450 1688
M 8 19 71 231 714 2122 OtherCVD 4 10 36 129 477 2099
M 31 109 376 1092 31 07 7781 II All CVD3
1. I HD = lschemic heart disease 2. AMI = Acute myocardial infarction (heart attack) 3. All CVD = AH cardiovascular diseases
Source: Laboratory Center for Disease Control; Statistics Canada, 1997

(HOL) cholesterol levels, very-low density lipoprotein (VLDL) cholesterol, blood
pressure, obesity and cigarette smoking. Risk factor information was obtained
from exploration studies in Louisiana. Newman's group revealed a positive
correlation between VLDL cholesterol levels. mean systolic blood pressure and
coronary artery fatty streaks. It was suggested that the prevention of CVD
should begin in early life to prevent the progression of fatty streaks to fibrous
plaq ues and eventually artherosclerosis.
1.2.2. Gender
In the past. CVD was looked upon as being more of a concern for men than for
women (Wenger, 1996). This is mainly due to the lower risk of premature
morbidity and mortality due to CVD in women (Kannel8 Abbott, 1987).
Considering al1 ages, CVD mortality rates in men and women are equal
(Johansen. Nargundkar. Nair, Neutel & Wielgosz, 1991). In Canada in 1995,
40,091 men and 39,026 women died from CVD (Heart and Stroke Foundation of
Canada, 1997).
Lower premature morbidity and mortality due to CVD in women is partly a result
of women having a longer life expectancy as compared to men. Furthemiore.
there is a higher incidence of cardiovascular disease in women at an older age
(Heart and Stroke Foundation of Canada, 1997). Research reveals that men. up
to the age of 74, experience a two to five-times greater mortality rate from acute
myocardial infarction (AMI) and ischemic heart disease (IHD) than women (Heart

and Stroke Foundation of Canada, 1997). This may be explained by the effect of
a woman's hormones on lipoprotein levels. It has been reported that women
between the ages of 20 and 59 years have higher highdensity lipoprotein (HDL)
cholesterol levels than men of the same age group (Kannel, 1983). A number of
studies have demonstrated an inverse relationship of HDL-cholesterol to CVD
(Frick et al, 1987; Gordon & Rifkind, 1989). Women were also shown to have
lower low-density lipoprotein (LDL) cholesterol levels, which is associated with a
decreased risk of CVD (Heiss, Tamir & Davis, 1980). In both cases the opposite
was true for men. However, after menopause, the LDL cholesterol levels of
women were higher than those of men (Stevenson, Crook 8 Godslsland. 1993)
and CVD rates increased dramatically in women after menopause (American
Dietetic Association, 1 990).
Even though the prevalence of CVD is similar for women and men. variations
exist in the time trends of CVD incidence and mortality. Sytkowski, DIAgostino,
Belanger and Kannel(1996) co~npared trends of cardiovascular disease
incidence and mortality over a twenty-year period among men and women who
were participants of the Framingham Heart Study and were between 50-59 yean
of age in 1950, 1960 and I W O . CVD incidence declined by twenty-one percent
in women (p < 0.01) and six percent in men (pc0.05) from 1950 to 1970. This
study also revealed differences of CVD risic factor time trends in males and
females. Obesity, hypercholesterolemia and high blood pressure were
significantly lower for fernales in 1970 as compared to fernales in 1950
(p < 0.001). Furtherrnore. smoking and high blood pressure were significantly
lower for males in 1970 as compared to males in 1950 (p < 0.001). It was
concluded that declines in CVD incidence in the past twenty yean in males and
fernales could be due to declines in different CVD risk factors of males and
fernales.
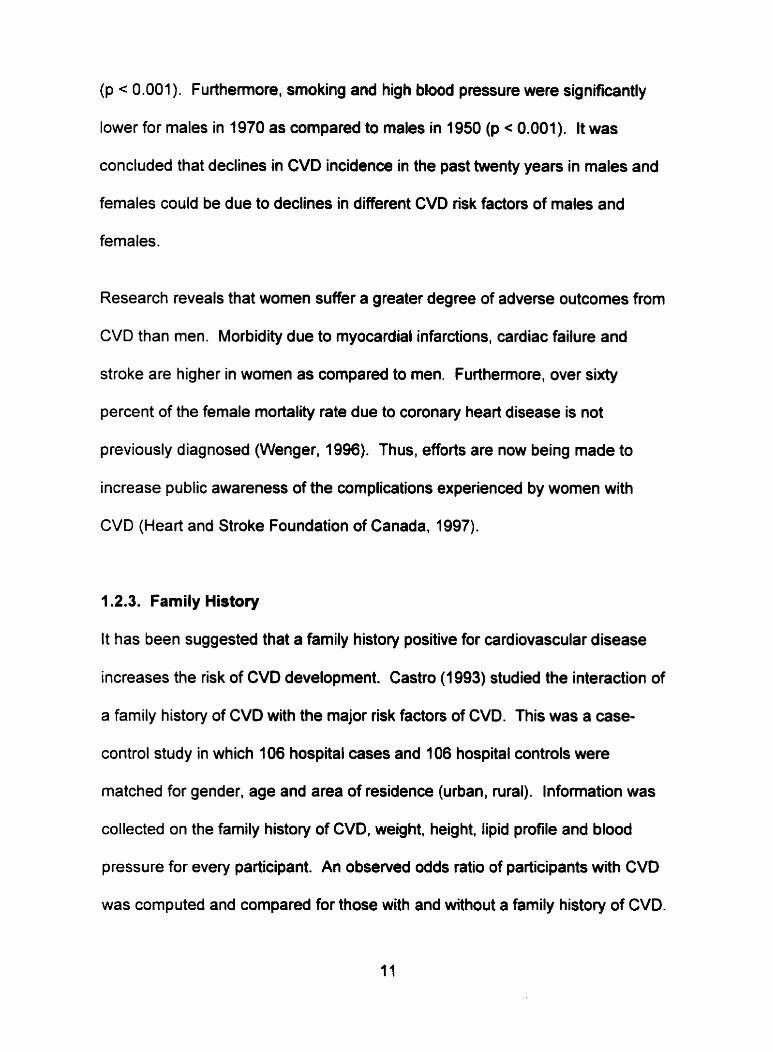
Research reveals that women suffer a greater degree of adverse outcomes from
CVD than men. Morbidity due to myocardial infarctions, cardiac failure and
stroke are higher in women as compared to men. Furthenore, over sixty
percent of the female mortality rate due to coronary heart disease is not
previously diagnosed (Wenger, 1996). Thus, efforts are now being made to
increase public awareness of the complications experienced by women with
CVD (Heart and Stroke Foundation of Canada, 1997).
1.2.3. Family History
It has been suggested that a family history positive for cardiovascular disease
increases the risk of CVD development. Castro (1993) studied the interaction of
a family history of CVD with the major risk factors of CVD. This was a case-
control study in which 106 hospital cases and 106 hospital controls were
matched for gender. age and area of residence (urban, rural). Information was
collected on the family history of CVD. weight, height, lipid profile and blood
pressure for every participant. An observed odds ratio of participants with CVD
was computed and compared for those with and without a family history of CVD.
The odds ratio was 4.95. It was concluded that a family history of CVD is a risk
factor for CVD.
Research also reveals that a family history of CVD may be predictive of blood
lipid levels in young children. Moll et al (1983) studied the blood lipid profiles of
98 families in Rochester, Minnesota. A total of 850 first and second-degree
relatives of 98 school children were involved in the study. The families were
divided into three groups based on the children's total serurn cholesterol levels;
low, middle and high cholesterol levels. It was discovered that grandfathers of
children in the high total serum cholesterol level group were at an increased risk
of rnortality by 2.5 times of those grandfathen of children in the low cholesterol
group.
1.2.4. Excess Body Fat
There are a number of anthropometric measurements available to assess body
weig ht. These include fat fold measurements, mid arrn circumference, waist to
hip ratio, and waist circumference (Whitney & Rolfes, 1996). Body mass index
(BMI), a measure of general adiposity, is most often used to define overweight
and obesity (Rabkin, et al., 1997). Body mass index is defined as weight in
kilograms divided by height in meters squared (VWHP). A BMI less than 20 may
be associated with health problems in some people. A BMI between 20 and 25
is usually associated with low rnortality and is considered to be appropriate for
most people. A BMI between 25-27 may lead to health problems in some people
while a value above 27 is associated with an increased risk of developing health
problems in most people (Health and Welfare Canada, 1988). A BMI greater
than 27 is often considered an indication of being overweight (Rabkin, et al,
1997).
Having excess body fat or being overweight has been frequently associated with
a signifîcant impairment of health (Burton 8 Foster, 1985). Many studies reveal
an association between excess body fat and cardiovascular disease, diabetes
rnellitus, hypertension and some cancers (Macdonald, Reeder, Chen, &
Despres, 1997). This may be due to the role that body fat plays in the
development of hypertension and altered lipid profiles (Pi-Sunger, 1993).
Results from the Framingham Study suggested that the degree of overweight
was proportional to the rate of the development of cardiovascular disease. This
longitudinal study revealed that for each standard deviation in relative weight
gain, there was an increase in cardiovascular disease of 15 and 22 percent in
men and women respectively (Kannel, D'Agostino & Cobb, 7996).
Excess body fat also affects the development of CVD risk factors in children,
adolescents and young adults (Dietz, 1998). Research reveals that obese
children and adolescents often have increased blood lipids in the form of LDL-
cholesterol and triglycerides and lowered HDL-cholesterol (Caprio et al., 1 996).
Many CVD consequences that develop during adulthood due to obesity are offen
preceded by health abnormalities that develop dunng child hood (Dietz, 1998).
Weight reduction has been demonstrated as being a benefit to obese children
and adolescents in the lowering of high blood lipid values. Wabitsch et al (1994)
examined the effect of weight loss during a weight loss program on the blood
lipid levels of obese adolescent girls (n=116). The program lasted for 6 weeks
and at the end of the program the participants lost an average of 8.5 kg. This
weig ht loss was associated with a significant reduction in total cholesteroi, LDL
cholesterol and systolic and diastolic blood pressure.
Early research suggested that the younger the age of onset of excess body fat,
the greater the likelihood of the development of manifestations of atherosclerosis
(Rabkin, Mathewson & Hsu, 1977). However, more recent studies are unclear
as to whether obesity during childhood is associated with the prevalence of adult
obesity (Dietz, 1998). Guo, Roche, Churnlea, Gardner and Siervogel (1 994)
studied the effect of overweight children on overweight adults (BMI > 28 for men
and BMI > 26 for women) at the age of 35 years. This study analyzed 555
children. It detected that the ability to predict overweight at 35 years increased
from approximately 2% for children who were overweight at 1-6 years, to 5-1 0%
for children who were obese at 10-14 years, to 8-57% for males and 6.35% for
fernales at 18 years.
More studies are needed that concentrate on the long-term effects of childhood
and adolescent obesity. More research is also needed on the likelihood that
obesity will persist from childhood to adulthood and the effects of childhood
obesity on the development of CVD in later life (Dietz, 1998).

lt is well known that females have a higher percentage of body fat than males,
even a i the same body mass index levels (Krotkiewski, Bjorntorp, Sjostrom 8
Smith, 1983). Larger amounts of body fat in fernales are due to a higher
percentage of adipose tissue in certain areas. Krotkiewski. Bjorntorp, Sjostrom
and Smith (1983) studied the effect of obesity on metabolism in 930 obese
males and fernales (BMI > 27). It was revealed that males with similar degrees
of obesity had higher fasting glucose, insulin and triglyceride levels as cornpared
to females. The study also revealed that males had higher systolic and diastolic
blood pressures as compared to females with similar percentages of body fat.
The prevalence of obesity is high in Canada. The Canadian Heart Health Study
conducted between 1986 -1992 revealed that 31% of Canadians were obese.
Within Canada, Newfoundland has the highest level of obesity at 41 % (Heart
and Stroke Foundation of Canada, 1997).
1.2.5. Distribution of Body Fat
Recent studies suggest that body fat distribution as well as total body fat should
be considered a risk factor for CVD development (Macdonald, Reeder, Chen, 8
Despres, 1 997). Excess accumulation of adipose tissue in the abdominal reg ion
has been shown in some adults to be associated with an increased risk of CVD.
This may be due to the disturbances in lipoprotein metabolism and plasma
insu lin-g lucose homeostasis seen with excessive abdominal fat (Fujioka,
Matsuzawa, Tokunaga & Tarui, 1987).
Central fat distribution also appears to be more of a concem for children and
adolescents than total body fat. Freedman, Srinivasan, Harsha, Webber &
Berenson (1 989) examined body-fat distribution and lipid profiles in 361 children
aged 6-1 8 years who were living in Bogalusa, Louisiana. It was revealed that
children with increased abdominal adipose tissue had an increased prevalence
of high triglycerides and VLDL-cholesterol than those children without increased
abdominal tissue. It was concluded that high levels of abdominal adipose tissue
may aid to identify those at risk of hyperlipidemia development in later life.
A measurement of waist and hip circumferences is the most frequently used
rnethod at present to estimate abdominal adipose tissue (Pouliot et al.. 1994).
However, recent studies have revealed that the waist to hip circumference is
imprecise and may confound relationships sought between abdominal adiposity
and disease development (Dietz, 1998). Waist and hip circumferences cannot
disting uis h between visceral and subcutaneous adipose tissue in the abdominal
region. Research has suggested that visceral adipose tissue is related to
metabolic and homeostatic abnomalities more so than subcutaneous adipose
tissue (Lemieux, Prud'homme, Bouchard, Tremblay 8 Despres, 4996). Thus, the
amount and distribution of visceral adipose tissue may be more strongly
correlated to cardiovascular disease than other types of adipose tissue (Pouliot
et al., 1994).
Recent studies suggest that waist circumference alone may be an accurate
measure of visceral adipose tissue (Seidell et al., 1987). Waist circumference
has been shown to be well correlated with plasma lipoprotein levels, glucose
tolerance, plasma insulin concentration and both systolic and diastolic blood
pressure (Reeder et ai., 1992).
It has been difficult to determine a cut off point for a waist circumference above
which one has an increased risk of developing CVD. However. Lean, Han and
Seidel (1998) conducted a cross-sectional study of 5887 men and 7081 women
in Maastricht, Amsterdam and Doetinchem. The purpose of this study was to
determine the relationship between waist circumference and health status
(diabetes meliitus, CVD risk factors, low back pain, physical ability and
respiratory insuffciency). Results from this study revealed that men who had a
waist circumference greater than 102 centimeters had an increased risk of
shortness of breath by an odds ratio of 3.1 (95% confidence interval (C.I.), 2.5-
3.7). diabetes mellitus by 4.5 (95% Ci, 3.6-5.0) and one major CVD risk factor by
4.2 (95% CI, 3.6-5.0). Women who had a waist circumference greater than 88
centimeters had an increased risk of shortness of breath by 2.7 times (95% CI.
2.3-3.1 ), diabetes mellitus by 3.8 times (95% CI, 1.9-7.3) and one major
cardiovascular disease risk factor by 2.8 times (95% CI, 2.4-3.2). Thus. it was
suggested that men with a waist circumference greater than 102cm and women
wit h a waist circumference greater than 88cm have an increased risk of
developing health problems.

1.2.6. Physical Activity
The preventive role that physical activity plays in cardiovascular disease is well
known (Bernadet, 1995). This may be due to a causal relationship between
being active and the development of plasma lipids, lipoproteins, apolipoproteins,
and athersclerosis (Paffenbarger, Hyde, Wing & Steinmetz, 1 984). Active
individuals exhibit higher levels of HDL cholesterol and lower levels of plasma
triglycerides and very low density lipoprotein (VLDL) cholesterol as compared to
inactive individuals (Kannel & Sorlie, 1979). High levels of VLDL have been
shown to be associated with the development of cardiovascular disease (Moll et
al., 1983).
Early studies on physical activity were mainly concerned with occupational
activity (Wilhelmsen, Tibblin. Aurrell, Bjure, Ekstrom-Jodal & Grimby, 1976). For
instance, Paffenbarger and Hale (1975) investigated CVD mortality rates of 6351
longshoremen. These men were observed over a twenty-ho year span.
Physical activity levels were compared in accordance to work-years and
categories of high, medium and low energy output. Coronary death rates in
workers of a hig h level of physical activity were 26.9 per 10,000 work years while
those workers of a medium and low level of physical activity were 46.3 and 49.0
per 10,000 work years respectively. It was concluded that high levels of physical
activity performed on the job were of greater benefit for preventing coronary
heart disease development than low levels of physical activity on the job.

As in most developed countries, Canada's society is moving towards more
automation of job tasks. This requires people to work fewer hours and for more
people to become involved in more sedentary occupations. Consequently, many
recent studies of physical activity focus on cardiovascu lar disease and physical
activity during leisure time. A study conducted by Haapanen's group in 1996
analyzed the level of cardiovascular disease mortality in 1.072 Finnish men aged
35-63 years. These subjects were followed for eleven years. After comparing
mortality risk to specific leisure activities, it was shown that a sedentary man had
an increased risk of CVD mortality more than three times that of a matched
p hysically active man (Haapanen, Miilunpalo, Vuori, Oja 8 Pasanen, 1996). The
study concluded that a low level of leisure physical activity was a risk factor for
CVD mortality.
Physical activity associated with both occupation and leisure time has been
found to have an effect on cardiovascular disease mortality. Salonen, Puska
and Tuomilehto in 1982 conducted a longitudinal study (seven years) on over
7000 men and women in eastern Finland. The purpose of this study was to
determine the effect of physical activity at work and during leisure time on risk of
coronary heart disease. The variables considered were cigarette smoking,
serum cholesterol, diastolic blood pressure. height, weight and age. Low
physical activity at work was associated with an increased risk of acute
myocardial infarction of 1 5% in men and 2.4% in women. Low physical activity
during leisure time was significantly associated with an increased risk of death in
men and women. It was concluded that both low levels physical activity at work
and during leisure time affects the development of CVD.
Many studies have concluded that low levels of physical activity constitute a
primary risk factor of cardiovascular disease (Blair et al., 1989; Paffenbarger,
Hyde, Wing & Steinmetz, 1984). However, it has been difficult to conclude
whether high levels of activity produce an added benefit to heart disease over
moderate levels of activity. A recent report based on data collected from the
Framingham Study revealed that high levels of physical activity did not produce
an added benefit against cardiovascular disease risk over rnoderate levels of
physical activity performed for the same period of time (Kiely, Wolf, Cupples,
Beiser 8 Kannel. 1994).
In recent years, more and more Canadians of al1 ages are leading a more active
lifestyle. Results from the 1995 Physical Activity Monitor revealed that 37% of
Canadians over the age of eighteen are active compared to 21 % in 1981. This
study also revealed that in 1995, two in five Canadian adults were active enough
to benefit cardiovascular health. Furtherrnore, one quarter were moderately
active and another quarter of Canadians was somewhat active (Canadian
Fitness and Lifestyle Research Institute, 1996). This study also showed trends
in age, sex, socioeconornic status and cornmunity size. Generally, physical
activity levels decreased with age. Less than half of the Canadian adults aged
> 65 years were active as compared to Canadian adults aged 18-24 yean. It
was revealed that one in four Canadians above the age of 65 were active as
compared to one in two Canadians between the agas of 18-24. Furthemore,
overall. a higher percentage of men were active as compared to women.
Physical activity was shown to increase with education and incorne levels. It was
suggested that households who were receiving an income of over $60,000 a
year had a higher education level and had the highest reported level of physical
activity. In regards to community size, Canadians living in centers containing
more than 75,000 people were more active than those Canadians residing in
srnaller community centen (Canadian Fitness and Lifestyle Research Institute,
1 996).
A National Population Health Survey that took place in 1994195 and again in
1996197 also analyzed the level of leisure activity of Canadians. This study
involved the participation of 20, 725 households that were randomly selected
throughout Canada to be involved in an interview regarding their health status
and sociodemographic information. These participants were 12 years of age and
over. The results from this survey were different from those obtained from the
1995 Physicai Activity Monitor. The NPHS reported that in 1996197, 95% of the
Canadian population aged 12 and older were involved in only light physical
activity throughout the day. The level of leisure activity was based on energy
expenditure by the participants in kcallkglday. It was also concluded that people
with sedentary daily activities were more likely to be physically inactive in their
leisure time (Statistics Canada, 1998).
Recommendations on the level of physical activity that is needed to benefit
health are changing as more research findings become available. The U.S.
Surgeon General's Report on Physical Activity in 1996 suggested that even
moderate levels of physical activity on a regular basis can decrease the risk of
cardiovascular disease (United States Department of Health and Human
Services, 1996). It has been recommended that individuals who perform
physical activity of moderate intensity or greater, every other day, are at a
decreased risk of developing cardiovascular disease (Stephens & Craig, 1990).
One practical way to measure physical activity levels is through a questionnaire.
An interviewer records the frequency of physical activity and later converts this
into energy expenditure. This instrument is limited by the fact that it may be
susceptible to subject bias, inaccuracy and deliberate falsification. Yet self-
reporting of exercise behaviour has been reported to be a valid approach for
determining the level of physical activity perfomed by study subjects (Godin,
Jobin & Bouillon, 1986).
1.2.7. Cigarette Smoking
Research reveals a strong and consistent association between smoking and risk
of cardiovascular disease (Hays, Hurt & Dale, 1996). Cigarette smoking has
been known to have an association with increased heart rate, reduced estrogen
levels in women (Hansen. Anderson 8 Von Eyben, 1993), low HDL cholesterol
and high LDL cholesterol (Stamford et al., 1984).

Neaton and Wentworth in 1992 analyzed the association between risk factors
and death from coronary heart disease and cigarette smoking in a cohort of over
300,000 men. After 12 years of follow-up, they discovered that smokers had a
hig her prevalence of elevated blood pressure (diastolic and systolic) and
elevated serum cholesterol levels. They also had 20 times the CHD mortality
rates of non-smoking men (Neaton & Wentworth, 1992).
The quantity of cigarette smoke that a person consumes also plays a role in the
developrnent of cardiovascular disease (Hays, Hurt 8 Dale, 1996). Kaufman,
Helmrich & Rosenberg (1983) revealed that a person who smokes twenty-five or
less cigarettes per day had a relative risk of 2.1 for developing nonfatal
myocardial infarction. A smoker of forty-five cigarettes or more daily was shown
to have a relative risk of 4.0.
In the 1986-92 Canadian Heart Health Surveys, smoking was reported as being
the leading cause of heart disease in both men and women. Furtherrnore, this
study revealed that Newfoundland and Labrador was the province with the
highest prevalence of smoking at 36% (Health Canada, 1995).
1.2.8. Others
A number of factors outside of the major risks of cardiovascular disease may
influence an individual's likelihood of developing CVD. These include
socioeconomic status, environmental factors and area of residence.
1.2.8.1. Socioeconornic Status
Social class is a difficult concept to define yet attempts have been made to
stratify societies into subgroups. Social class has become important to many
epidemiological studies because of its identified association with health status
(Inclen Multicentre Collaborative Group, 1994). Luoto, Pekkanen, Uutela and
Tuomilehto (1 994) conducted a cross sectional survey on over 4000 men and
wornen to determine the effect of socioeconomic status on the risk of developing
CVD. The risk factors considered included total blood cholesterol, HDL
cholesterol, physical activity, blood pressure, body mass index and cigarette
smoking. Socioeconomic status was determined by considering the education,
income and occupation of the respondents. It was shown that those persons
from lower levels of education, occupation and income had an increased risk of
developing CVD. This may be explained by the fact that groups of low
socioeconomic status have limited access to health services and the use of
preventive health programs. It has also been reported that groups of low
socioeconornic status differ frorn higher socioeconomic groups in regards to their
level of health knowledge (Millar & Wigle, 1986). A Canadian health promotion
survey conducted in 1985 on the socially and economically disadvantaged
reported that persons of higher socioeconomic status have a greater degree of
health knowledge and are more attentive towards smoking, hypertension and
nutrition (Wilkins, 1988).

In most epidemiological studies, socioeconomic status is used as a confounding
variable rather than a risk factor and it is often used to describe the sample
population. The way social class is used in regards to the role 1 plays, and how
it is statistically controlled can have an important consequence on the
interpretation of study results (Liberatos, Link & Kelsey, 1988).
Socioeconomic status can be detennined through the evaluation of any
corn bi nation of factors such as education level, income. andior occupation
(Winkleby, Fortmann 8 Banett. 1990). Occupation, as an indicator of social
class, is difficult to interpret, largely due to its association with male oriented
classifications (Luoto et al., 1994).
1.2.8.1 .l . Education
Formal education has often been used as a single indicator of socioeconomic
status. This is mainly due to its relationship with many lifestyle characteristics
and the simplicity in obtaining pertinent information. Fairly accurate information
is available on the attainment of fonnal education. As well, education is available
to every member of society, regardless of income status (Liberatos et al., 1988).
A number of CVD studies have revealed that low education is associated with
hypertension, cigarette smoking, hypercholesterolemia and CVD morbidity and
mortality (Winkleby, Jatulis, Frank & Fortmann, 1992). Hoeymans, Smit, Verkleij
and Kromhout (1996) studied the relationship between CVD risk factors and
education levels of 36 000 men and women in the Netherlands. The risk factors

considered were smoking, physical inactivity, hypertension, alcohol consumption,
obesity and hypercholesterolemia. Except for alcohol consumption, a significant
association was noted between al1 of the risk factors considered and education
level. CVD risk factors were more prevalent in lower educated groups than in
the higher educated groups.
In addition, it has been noted that persons with higher levels of education level
often develop effective coping skills (Luoto et al., 1994). This often leads to an
increased knowledge, willingness and compliance to lead healthy lifestyles
(Millar & Wigle, 1986).
1 L8. l .2 . lncome
lncome is often used as a measure of socioeconomic status for determining its
relationship with overall health. For instance, Lynch's group in 1996 measured
the association between acute myocardial infarction, CVD mortality and income
in over 2,000 Finnish men. The lower income categories as compared to higher
incorne categories had age-adjusted relative risk of 2.66 (95% C.I. 1.25-5.66)
and 4.34 (95% C.I. 1.95-9.66) for CVD mortality and myocardial infarction,
respectively (Lynch, Kaplan, Cohen, Tuomilehto & Salonen, 1996).
lncorne has been shown to affect the nutritional quality of individual diets.
Results from Statistics Canada's Farnily Expenditure Surveys revealed that
individuals receiving low incomes have decreased dietary quality and quantity,
thus affecting their overall health status (Travers, 1996). Furthemore, results

from the 1990 Nova Scotia Nutrition Survey revealed that individuals residing in
households with low incomes were more often underweight or ovennreight as
compared to individuals residing in households with middle to high incomes
(Nova Scotia Heart Health Program, 1993).
lncome levels are age dependent. lncome levels tend to increase with age. It
has been reported that up to the age of 65 years, someone who is older is likely
to earn more. Thus, one must analyze income levels within age groups for most
accuracy (Liberatos et al., 1988).
When one is analyzing family income, it is vital that family size be considered.
Furthemore, it has been recommended that one should consider using poverty
index levels that are developed for the specific community in question, which
consider family size and cost of living. This allows for a comparison in later
years and for a comparison to other families of different sizes (Liberatos et al.,
1988).
1.2.8.2. Area of Residence
It has been reported that in Canada, the geographic area in which one resides
influences health status. Rural communities are often characterized by having
residents with lower incomes, higher unemployment rates. lower educational
levels and poorer housing as compared to matched urban residents (Bavington,
1994). Furthermore, studies have shown that rural residents have a shorter life
expectancy, higher prevalence of long terrn disability, and shorter quality

adjusted life expectancy than urban residents of the same country (Johnson,
Ratner 8 Bottorff, 1995). There is also speculation that urban and rural centers
differ in access to health sewices, adequate food supply and health knowledge
(Millar & Wigle, 1986).
Verheij (1 996) discussed two hypotheses ta explain urban-rural variations in
health. The first is the drift hypothesis that suggests a selection process to
explaining il1 health in certain areas. The selection process can be either direct
or indirect. Direct selection results when a higher concentration of healthy
people stay in certain areas and il1 people leave (or ill people stay and healthy
people leave). Indirect selection results when people with certain illnesses move
to or from certain areas. This hypothesis suggests that urban-rural variations in
health would not exist if past and present illnesses were considered in the
analysis. The second hypothesis, the breeder hypothesis, suggests that people
may be directly exposed to certain environmental factors, due to the area where
they live. The breeder hypothesis also suggests that individual health
be haviours may be influenced by the health-related activities of others that are
residing in their area such as cigarette smoking.
Verheij (1 996) reports that in order to fully understand the relationship between
atea of residence and health status, one must realize that al1 environments have
positive and negative qualities and not everyone living in these areas are
exposed to these positive and negative quatities equally. Individual variations
exist and confounding variables should be considered.
Some studies have been performed on the regional health status of Canadians
residing in general regions. For instance, reports from the Heart and Stroke
Foundation in 1997 revealed that Newfoundland and Labrador had a higher rate
of CVD than any other province in Canada. However, limited research has been
performed on the health status of Canadians within each province and
information on the health status of urban and rural communities is alrnost non-
existent.
Segovia, Edwards and Bartlett are presently conducting an adult health survey
that is concerned with medical care utilization and the health status of citizens in
the province of Newfoundland and Labrador (Segovia, Edwards & Bartlett.
1996). The study sample represents five district community health boards: St.
John's, Eastern, Central, Western and Northern. Initial findings suggested that
residents of the Northern Community Health Board region, but no other board,
was experiencing barrien in receiving health care. These barriers included the
long distance between the average Northern resident and hislher physician but
also the waiting time required to see a physician. This region also had the
hig hest prevalence of not seeking medical attention when necessary. The
Northern region of Newfoundland is truly rural and the only one of the Sve
studied with no urban centers.

1.3. Nutrition Newfoundland and Labrador
In the fall and spring of 1996, a nutrition survey was conducted throughout
Newfoundland and Labrador. This survey was planned and conducted by
representatives from the province of Newfoundland and Labrador. Memorial
Unive-sity of Newfoundland, the Newfoundland and Labrador Heart Health
Initiative and Health Canada. The goal of this survey was to collect nutritional
data relevant to the health status of the residents of Newfoundland and
Labrador. Interviewers recotded the dietary practices, the nutrient intakes and
the nutritional knowiedge and attitudes of Newfoundlanders and Labradorians. It
is hoped that data frorn this survey will aid in the development of needed health
related public education programs to help decrease the prevalence of chronic
disease (Nutrition Newfoundland and Labrador. 1996).
The need for a provincial nutrition survey was identified by the Newfoundland
Heart Health Survey of 1989. This study revealed that Newfoundland and
Labrador had a high prevalence of nutrition related health problems such as
hypertension and elevated blood cholesterol (Newfoundland Department of
Health and National Health and Welfare, I W O ) . It was tecommended that in
order to deal with this problem that more information was needed on the dietary
practices of residents of the province. This lead to the development of the
Nutrition Newfoundland and Labrador study.
A stratified random sample of approximately two thousand non-institutionalized
men and wornen, aged 18-74 years inclusive were visited in the study. One-third
of the respondents were re-interviewed. In-home intewiews were conducted in
which twenty-four hour recall and food frequency, sociodemographic, nutritional
knowledge and attitude questionnaires were administered. Height, weight, waist
and hip circumference measurements were also taken.
The data obtained from this survey on young adults was used in the current
study. This included those participants between the ages of 18-34 years, who
agreed to be involved in the study and were living throughout Newfoundland and
Labrador.
CHAPTER II
A M OF STUDY
2.1. Rationate
Manifestations of CVD are not usually obsenred until the fourth decade of life or
later (Wattigney, Webber, Srinivasan & Berenson. 1995). However. studies have
suggested that risk factors of CVD disease may begin to develop in childhood
and lead to adverse consequences in adulthood. Fatty streaks have been seen
in the aortas of three-year-olds and in the coronary arteries of individuals in their
second decade of life (Holman, McGill, Strong & Geer, 1958; Strong & McGill,
1962). Abnormalities that are developed in the early stages of life may lead to
cardiovascular consequences related to adult obesity such as hypertension, and
high LDL-cholesterol (Dietz, 1998). Furthermore, many lifestyle habits, such as
physical inactivity, develop in early years and progress into adulthood. Thus, it is
suspected that early identification of adverse levels of cardiovascular disease
risk factors and altering lifestyle habits through education should aid in the
prevention of CVD morbidity and mortality in the future (Wattigney, Webber,
Srinivasan 8 Berenson, 1 995).
The rationale for obtaining information on CVD risk factor status of young
Newfoundland and Labrador adults is to also aid in enhancing the overall heaRh
and well being of young adults in Newfoundland and Labrador. For instance, if
results from this survey reveal that a high percentage of young Newfoundland

and Labrador residents are regular srnokers, efforts can be made to provide
these individuais with more information on the health consequences of smoking.
This could aid in the prevention of cancers and chronic lung disease in the
future.
In order to gain insight into the health status of young adults living in
Newfoundland and Labrador, individual and environmental characteristics should
be considered. Health is not only influenced by lifestyle habits and behaviours
but also by the geographic area in which one lives. Rural residents differ from
their urban counterparts in regards to their ability to access health services,
adequate food supplies and health knowledge (Millar & Wigle, 1986). Thus, it is
expected that there is a difference in the health status of urban versus rural
residents. Most research that has considered geographic area, used it as a
framework to organize the study sarnple and overlooked its effect on health-
related behaviours (Duncan, Jones 8 Moon, 1993). There has been limited
investigation into the health status of residents living in urban venus rural
communities in Newfoundland and Labrador. The Newfoundland Heart Health
Study investigated the health status of particular regions throughout the
province. A more recent study, the Adut Health Survey, is an on-going
investigation into health care utilization and heath status of the different
community health boards throughout the province (Segovia. Edwards & Bartlett,
1996). Considering the high prevalence of CVD in Newfoundland and Labrador
and the fact that this disease has such a negative effect on our health care
system, as well as on our economy (Heart and Stroke Foundation of Canada,
1997) it is vital that more investigation be conducted in this area.
It is anticipated that this study will identify a high-risk group of C M incidence
within the province, thus creating the need for some fom of intervention. It is
hoped that the acquisition of this information will aid in improving the overall
health of Newfoundlanden and Labradorians. It will provide support for a public
health approach that should be developed throughout the province to prevent
and control CVD. It will also provide a basis for future studies focused on
specific groups concerned with risk factors of CVD.
2.2. Purpose
The purpose of this study was to identify and characterize specific cardiovascular
disease risk facton in young Newfoundland and Labrador adults aged 18 - 24
years and 25-34 years. This study also determined the prevalence of these risk
factors in urban and rural communities.
2.3. Goal and Objectives
The goal of this research was three fold - to study data collected on 18-34 year
olds (1 8-24 years and 25-34 years) who participated in the Nutrition
Newfoundland and Labrador survey to describe the prevalence of specific
cardiovascular disease risk factors in young adults living in Newfoundland and
Labrador. A cornparison was made to determine if these risk factors were more
prevalent in those young adults in rural Newfoundland and Labrador versus
those residing in urban centers throughout the province. Finally, a comparison
was made to determirie of an association existed between socioeconomic status
and risk factors of CVD development. This was accomplished by meeting the
following objectives:
- ldentify the prevalence of specific CVD risk factors in young adults residing in the province of Newfoundland and Labrador.
- Compare indicaton of body fat (body mass index and waist circumference) of young adults living in rural venus urban areas.
- Compare self-reported physical activity levels of young adults living in rural versus urban areas.
- Compare cigarette-smoking habits of young adults living in rural versus urban areas.
- Compare educational attainment levels of young adults living in rural versus urban areas.
- Compare household income levels of young adults living in rural versus urban areas.
- Study the associations of education and household income with specific risk factors of cardiovascular disease.
CHAPTER III
METHODOLOGY
3.1. Study Population
All residents of the province of Newfoundland and Labrador between the ages of
18-24 years inclusive and 25-34 years inclusive, excluding those living on lndian
Reservations, military camps and in institutions and were interviewed for the
Nutrition Newfoundland and Labrador Survey were selected for this study. This
sample population was actually two subgroups of the 1928 subjects questioned
in the larger survey, Nutrition Newfoundland and Labrador, with subjects aged
18-74 years inclusive.
3.2. Sample Design
Subjects for the Nutrition Newfoundland and Labrador Survey were selected by a
stratified, probability sample design developed by Statistics Canada. This
sampling design selected independent samples for two seasons. The sample
was representative of al1 urban and rural areas throughout the province. Data
collection was conducted on weekdays and weekends (Nargundkar, 1996).
The Newfoundland and Labrador Health lnsurance Register File (NLHIRF or
MCP files) was used to select samples for the survey. The NLHIRF contains the
narnes, addresses, age and gender of al1 Newfoundland and Labrador residents.
3.3. Setting
The survey was conducted in eleven selected areas throughout Newfoundland
and Labrador. These population centers were onginally designated as large
populations of 10,000 or more, medium populations between 4,000 and 10.000
and rural populations of less than 4,000. There was a small number of
respondents in the medium sized and rural population centers. Therefore these
were grouped together for the purposes of this project. As a result, the sample
was divided into urban and rural centers (original medium plus original rural).
Urban centers included St. John's, Mount Pearl, Corner Brook, Gander, Grand
FallsNVindsor and Labrador City. Rural centers included Stephenville,
Carbonear, Bonavista, Census District - 1, and Census District - 4 (Appendix A).
3.4. Source of Data
Data analyzed in this study was taken from that collected for the Nutrition
Newfoundland and Labrador Survey. The data from two questionnaire foms,
Nutrition and Health Questionnaire and Demographic Profile, were used for this
study (Appendices B and C). These foms were selected since they contained
information pertaining to risk factors of cardiovascular disease. The Nutrition
and Health Questionnaire enabled the researcher to collect information on
smoking and physical activity levels of the subjects. The Demographic Profile
contained information on the income, education, weight, height, and waist
circumference of the study sample. Data was collected in 1996 throughout al1

seaçons (springJsummer and falllwinter). The data was collected in person by
trained interviewers.
3.5. Ethical Approval
The Nutrition Newfoundland and Labrador Survey obtained approval from the
Memorial University Faculty of Science Human Investigation Committee prior
to subject selection and interviewing. The researcher obtained ethical
approval from the Memorial University Faculty of Medicine Human
Investigation Committee to review this survey (Appendix D). The researcher,
prior to review of the Nutrition Newfoundland and Labrador Survey. also
completed a confidentiality form in the presence of a notary (Appendix E).
3.6. Variables
Both nonmodifiable and modifiable factors associated with an increased risk
of developing cardiovascular disease were analyzed in this study.
3.6.1. Non-modifiable Risk Factors
The non-modifiable risk factors that were analyzed included age and gender.
Subjects, male and female, aged 18-24 years inclusive and 25-34 years inclusive
who were studied in the Nutrition Newfoundland and Labrador survey were
selected for this study.
3.6.2. Modifiable Risk Factors
The modifiable risk factors of CVD that were investigated included indicaton of
body fat (body mass index and abdominal adipose tissue), physical activity and
cigarette smoking.
3.6.2.1. Body Fat - A person's body fat can be suggested by a number of
anthropornetric measurements andlor indices such as the body mass index
(BMI) and the waist circumference.
3.6.2.1.1. Body Mass Index - The BMI is an index that is based on a person's
weight in relation to their height. During interviews conducted as part of Nutrition
Newfoundland and Labrador, a trained interviewer in a room with a nonçarpeted
floor measured respondents' weights. A regularly calibrated spring scale was
used. The participants were asked to remove their footwear. heavy clothing and
items in their pockets such as change and wallets. Measurements were taken to
the nearest 0.1 kilogram and were recorded on the demographic profile fom,
(Appendix C, question 6).
Respondents' heights were measured with a flexible, locking measuring tape. a
stainless steel foot-plate, and a right-angled square headboard made specifically
for this study. The participants were asked to remove their shoes and stand
erect, with their amis crossed in front of their chest. their feet together and their
heels and the back of their heads against the wall. The longer a m of the set
square headboard was placed on the participant's head, while depressing the
hair. The participant was asked to look straight ahead, to stand as tall as
possible and to take small breaths while the measurement was taken. The
measurement was rounded to the nearest one centimeter and was recorded in
the demographic profile form (Appendix C, question 7).
Body Mass Index (BMI) levels were calculated by dividing weight (kg) by height
(meters) squared. A body mass index less than 20 is considered to be
associated with health problems in some people, a BMI greater than 20 and less
than 25 is associated with low rnortality and is considered a good weight for most
people. A BMI greater than 25 and less than 27 may be associated with health
problems in some people. A BMI greater than 27 is associated with an
increased risk of developing health problems (Health and Welfare Canada,
1 988).
3.6.2.1.2. Abdominal Adipose Tissue - The researcher analyzed the waist
circurnferences of subjects questioned in the survey in order to estimate the
degree of abdominal adiposity.
During in person interviews, subjects were asked to remove belts and heavy
clothing andlor lift-up their T-shirts. Subjects were asked to stand erect in a
relaxed manner and to cross their amis in front of their chest. Interviewers
placed a Lufkin executive diarneter measuring tape horizontally at the point of
noticeable narrowing of the subject's waist as the penon inhaled. The tape was
then placed in the recording position and a measurement was made at the end
of the subject's normal expiration. In some instances, a waist circumference was
not able to be determined. The intewiewer would then take a measurement
between the person's ribs and iliac crest. This measurement was recorded to
the nearest one centimeter in the demographic profile form (Appendix Cl
question 8).
A waist circumference greater or equal to 102 centimeten (cm) in men and a
waist circumference greater or equal to 88 cm in women has been shown to be
negatively associated with health status (Lean, Han 8 Seidell, 1998).
3.6.2.2. Physical Activity - The level of physical activity that was perfonned by
the study subjects was detenined by considering both the exercise that they
performed during work and leisure tirne.
3.6.2.2.1. Physical Activity al Work - The subjects that were interviewed were
asked how much movernent they perfomed at work. Examples of occupations
with varying amounts and types of movement were provided to the interviewee to
aid himlher in making an estimation (Appendix B, question 9). The researcher
grouped the responses into four levels of physical activity in accordance to
categories suggested by the Framingham Study (Kannel & Sorlie, 1979).
Sedentary - Work is mainly sitting. e.0.: secretary. Slight - Walklmove a lot. no lifting. e.g.: light housework.
r Moderate - Walk and carry a lot. e-g.: carpentiy. Heavy - Heavy physical labor. e.g.: forestry.
3.6.2.2.2. Physical Activity during Leisure T ime - Physical activity during
leisure time was addressed by the survey in two ways. The subjects were asked
the number of times (frequency) and the length of time (duration) they spent at
performing leisure physical activities that did not require their heart to beat
rapidly (lower intensity) (Appendix 6, questions 10, 11 and 12). The participants
were also asked the number of times (frequency) and the length of time
(duration) they spent at perfomiing leisure time physical activities that required
their heart to beat rapidly (higher intensity) (Appendix 8, questions 13, 14 and
15). From these questions, the researcher grouped the responses into
frequency and du ration of lower and hig her intensity physical activities performed
during leisure time.
a Frequency - none, three times weekly, more than three times weekly. a Duration - O minutes, less than 20 minutes, 20-29 minutes,
30 minutes or more.
Due to the wording of the questions, the researcher was unable to determine if
subjects performed sedentary, slight, moderate or heavy forms of leisure
physical activity. Hawever, the researcher was able to categorize them as two
levels of intensity. As a result, the researcher considered the responses to
frequency and duration of physical activity performed in questions 10 through 15
as lower and higher levels of intensity.
3.6.2.3. Cigarette Smoking - Subjects of the Nutrition Newfoundland and
Labrador Suwey were asked if they presently smoked cigarettes (Appendix B,
question 17). If participants answered yes to question 17 they were asked if they
srnoked cigarettes everyday and the number of cigarettes they smoked everyday
(Appendix B, questions 18 and 19). From these questions, the researcher
analyzed the smoking habits of subjects in two ways. The researcher computed
number of subjects who were regular smokers and the actual number of
cigarettes that were smoked by each subject per day. A regular smoker was
considered sorneone who smoked at least one cigarette a day. The information
from the nutrition survey related to smoking was self-reported. Research reveals
that the validity of self-reported cigarette smoking is high if the information is
obtained by in-person interviews (Bowlin, Morrill, Nafriger, Lewis 8 Pearson,
1996).
3.6.3. Othets
Other factors that may affect the development of CVD that were analyzed
included ed ucation and household income.
3.6.3.1. Education - Survey respondents were asked to confirm the highest
level of education that they had attained (Appendix C, question 3). The
education levels used were defined as follows:
Elementary- no schooling , elementary schooling or some high school.
O High School - high school diplorna. Community College - some community college or comrnunity
college completion. University - some university or university completion.
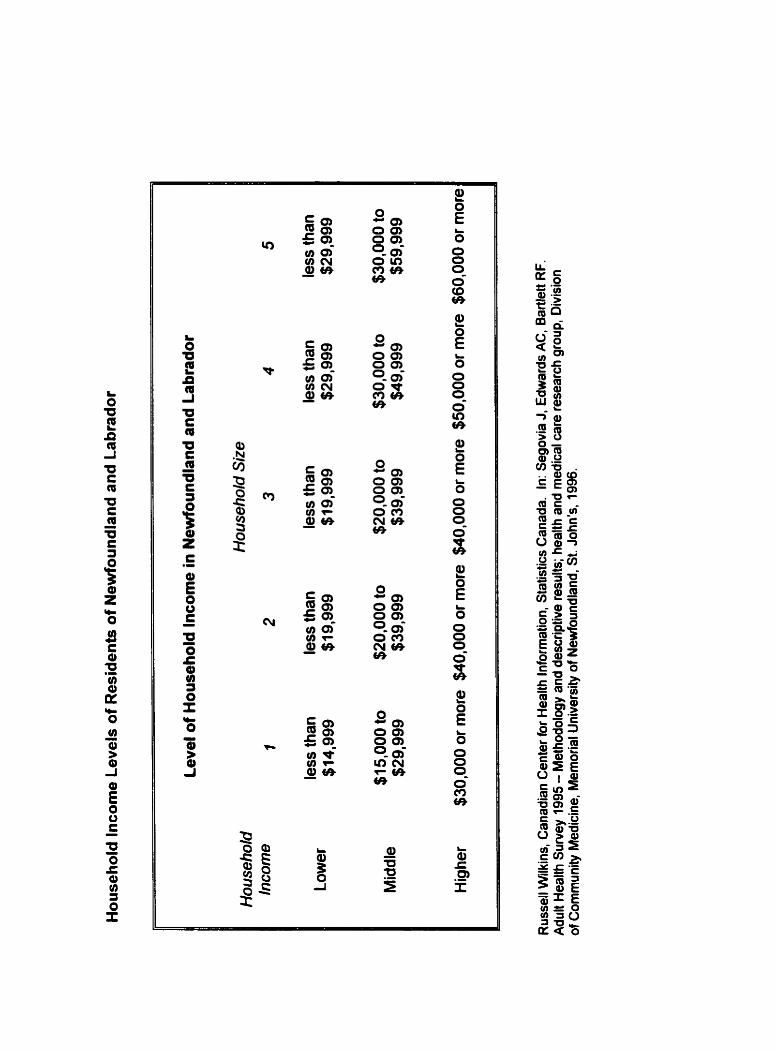
3.6.3.2. Household lncome - During in-person interviews, participants of the
Nutrition Newfoundland and Labrador Suwey were shown a table of household
income categories by the interviewers. They were asked to point to the incorne
level that they fell into. The household income levels used were as follows:
A = less than $5,000, B = $5,000-10,000, C = $10,001-$20,000, 0 = $20,001-
$30,000, E= $30,001-$40,000, F = $40,001 -$50,000, G = $50,001 -$6O,OOO,
H = $60,001 or more, and 1- do not know (Appendix C, question 5).
The researcher grouped these household income levels into categories defined
by Wilkins (1995) and modified by Alison Edwards (personal communication,
September, 1997). These household income categories were defined in relation
to reported household income, household size and low income cutoffs of
residents of Newfoundland and Labrador (Appendix Ç for further details).
3.7. Data Analysis
This study was a secondary analysis of data collected the Nutrition
Newfoundland and Labrador Survey. The researcher used the following
software packages for data entry and analysis: SPSS 9.0, and Minitab 12.
The researcher calculated sampling weights (adjusted and unadjusted) prior to
data analysis. These sampling weights were adjusted for age, sex and area
distribution of the province of Newfoundland and Labrador. This weighting was
necessary in order to prevent over-representation of particular geographical

areas, seasons, ages and genders. The following fomulae were used to
calculate sampling weights.
Unadjusted Sarnpling Weightr: W*; = sa (NSa/mai)
w, - unadjusted sampling weight for person who responded in season "s", to the survey component 'Y, from area "a", and age-sex group "in .
oc,. selection factor for area "a" (Table 4).
N,- total number of persons on NHlRF in season "sn, area "an and age-sex group "in.
m,,- nurnber of persons who responded in season "s", survey component "f, from area "a", and age-sex group "in to survey.
s - season where s = 1 or 2 (1 = spring, 2 = fall).
f - component: f = 1 for first interview, f = 2 for second interview (a second interview was conducted for 113 first interview responses only).
a - selected area, a = 1 to 11 for eleven areas selected for the sampling frame (Table 4).
i - age-sex group, i = 1 to 12 (1 = 18-24 yr. male, 2 = 25-34 yr. male, 3 = 35-44 yr. male, 4 = 45-54 yr. male, 5 = 55-64 yr. male, 6 = 65-74 yr. male, 7 = 18- 24 yr. female, 8 = 25-34 yr. female, 9 = 35-44 yr. female, 10 = 45-54 yr female, 1 1 = 55-64 yr. female, 12 = 65-74 yr. female).
The results of the unadjusted sampling weights were used to cornpute adjusted
sampling weig hts.
Adjusted Sampling Weights: W, = (PJN,,) V\P,
Pa - total number of persons in area "an and age-sex group "in according to the 1996 Census of Population.

Table 4: Selection Factors for Sample Selection in Nutrition NeMoundland and Labrador Suwey
Large Population Centen
St. John's
Ama (a) Selection Factors OC,
1
1 Mount Pearl
i Carbonear 1 8 1 4.1 5
1
2
1 Corner Brook
Gander
Grand Falls-Windsor
Labrador City-Wabush
Medium Size Towns
Stephenville - Stephenville Crossing
3
4
5
6
7
Bonavista
Rural Areas
Census Division 1
Census Division 4
1
t
1
Selection Factors
2.23
9
10
11
4.98
Selection Factors
1.49
10.07
Data was analyzed to suggest the frequency of specified risk factors of CVD of
the entire study population. This was accomplished by computing frequencies,
medians and standard deviations.
Statistical analysis was carried out to measure the degree of association
between the presence of CVD risk factors in different age groups (18-24 year
olds versus 25-34 year olds), in different genders (males versus fernales) and in
different areas of residence (rural venus urban). This was accomplished by
conducting chi-square analyses and t-tests for independent means. Chi square
analysis is a nonparametric test that is used to measure the degree of
association between two variables that are categorical. Chi-square analysis can
be used with more than one group and compares the actual number in each
group with the expected number. The t-test for independent means measures
the difference between the means of two groups of interval or ratio data (Munro
& Page, 1993).
The researcher also deterrnined whether associations existed between
socioeconomic variables and risk factor variables of CVD. This was
accomplis hed by logistic regression. Logistic regression investigates the
relationship between a response variable and one or more predictor variables to
find the best fit of the rnodel. Logistic regression uses categorical variables.
Within the logistic regression analysis the researcher is given the option to
perform the G-test and Goodness-&Fit tests. The G test tests the nuIl
hypothesis that al1 coefficients associated with the predictor equals zero or the

predictors are not signifiant. The Goodness-of-Fit tests and in this case
Pearson and Deviance suggests the ability of the model to fit the data
adequately. An insignificant resuk suggests the model is a good fit (Minitab.
1996).
If a statistical test was used in the analysis of tabulated data, that test is
indicated on the appropriate table. When weighted analysis was used it is also
indicated on the table. The level of significance used for al1 tests was p (0.05
(Daniel, 1 995).
CHAPTER IV
RESULTS
4.1. Introduction of Results
The findings obtained from this study will be presented hete in detail. Some
questions in the survey were not answered by the entire sample. The results of
this analysis are presented as the actual number of participants that responded to
the survey (n) as well as a percentage (%) out of the total that did respond to the
study. The results of the study are presented in four ways. First an overview is
given of the sociodemographic and socioeconomic characteristics of the study
sarnple. The prevalence of risk factors of cardiovascular disease experienced by
the study sample is then detemined and a comparison is made by age and
gender. A comparison of the risk factors of cardiovascular disease and area of
residence is evaluated. Finally, the effect of education and household income on
risk factors of cardiovascular disease is analyzed.
4.2. Response Rate
During sample selection, 4,233 names were drawn from Newfoundland Medical
Insurance files (MCP). These names were drawn in accordance with selection
factors that were designated for each age, gender, region and season. From the
names that were drawn from the insurance files, 2,241 were between the ages of
18 and 34, 1524 were located, 476 were ineligible and 540 interviews were
obtained. Of those who were contacted and were eligible to participate, 48%
refused (42% of females and 55% of males) (Table 5).
A person was considered ineligible and unable to participate if he or she lived in
an institution, worked for the military, was not presently residing in the province or
was deceased. A person was also ineligible if she was pregnant at the time of the
survey.
A response rate of 52% was obtained for the entire study sample of 18-34 year
olds (Newfoundland Department of Healh and National Health and Welfare, 1990;
Nova Scotia Heart Health Program, 1993). A higher percentage of young adult
females (57%) responded to the survey as compared to young adult males (43%).
4.3. Sociodemographic and Socioeconomic Chancteristics of the Ovenll Study Sample
The age, gender, education and household income of the total study sample as
well as by area of residence are presented in Figures 1-8 and Table 6. Figure 1
portrays the age distribution of the overall study sample. Of the 540 participants,
261 were 18-24 years old and 279 were 25-34 years old. Figure 2 illustrates the
age distribution of study sarnple by rural area of residenœ. Of the 235
participants from rural areas, 96 were 18-24 years old and 139 were 25-34 years
old. Figure 3 illustrates the aga distribution of urban residents. Of the 305
participants from urban areas, 1 33 were 1 8-24 years old and 1 72 were 25-34
years old.
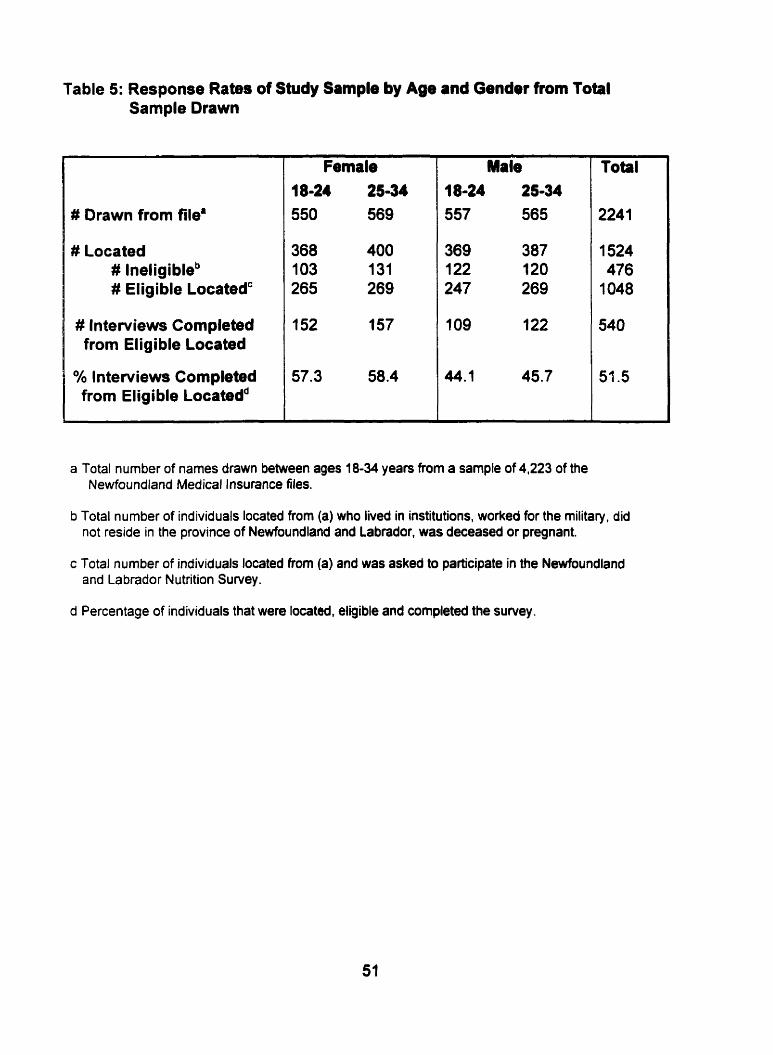
Table 5: Response Rates of Study Sample by Age and Gendet from Total Sample Drawn
# Drawn from file8
# Located # lneligibleb # Eligible Locatedc
# Interviews Completed from Eligible Located
Oh Interviews Completed from Eligible Locatedd
Female 18-24 25-34 550 569
Total
2241
1524 476
1048
540
51.5
a Total number of names drawn between ages j8-34 years from a sample of 4,223 of the Newfoundland Medical Insurance files.
b Total number of individuals located from (a) who lived in institutions, worked for the rnilitary, did not reside in the province of Newfoundland and Labrador, was deceased or pregnant.
c Total number of individuals located from (a) and was asked to participate in the Newfoundland and Labrador Nutrition Suf~ey.
d Percentage of individuals that were located, eligible and completed the survey.
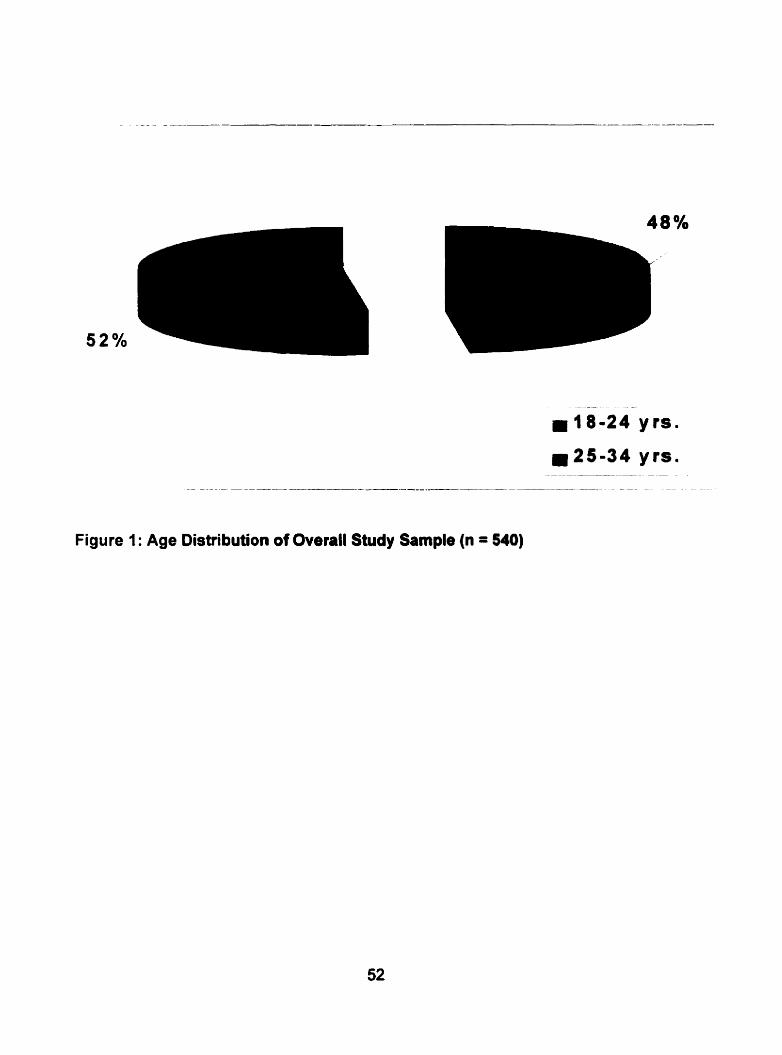
Figure 1: Age Distribution of Ovenll Study Sample (n = 540)
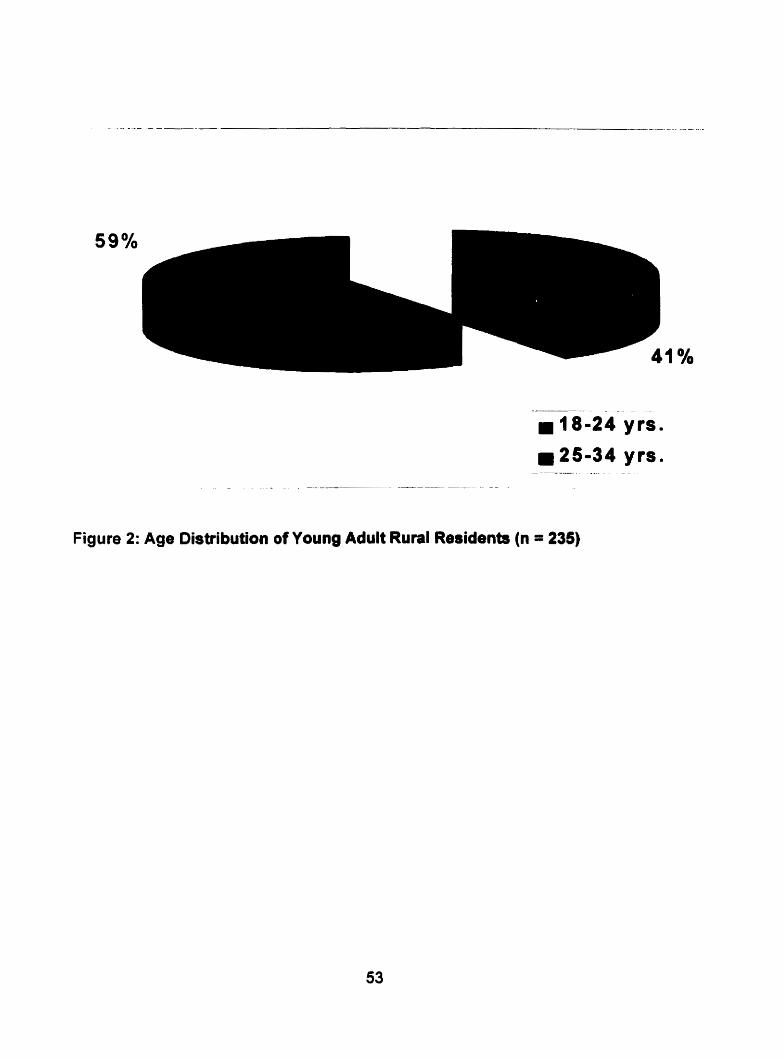
Figure 2: Age Distribution of Young Adult Rural Residenb (n = 235)
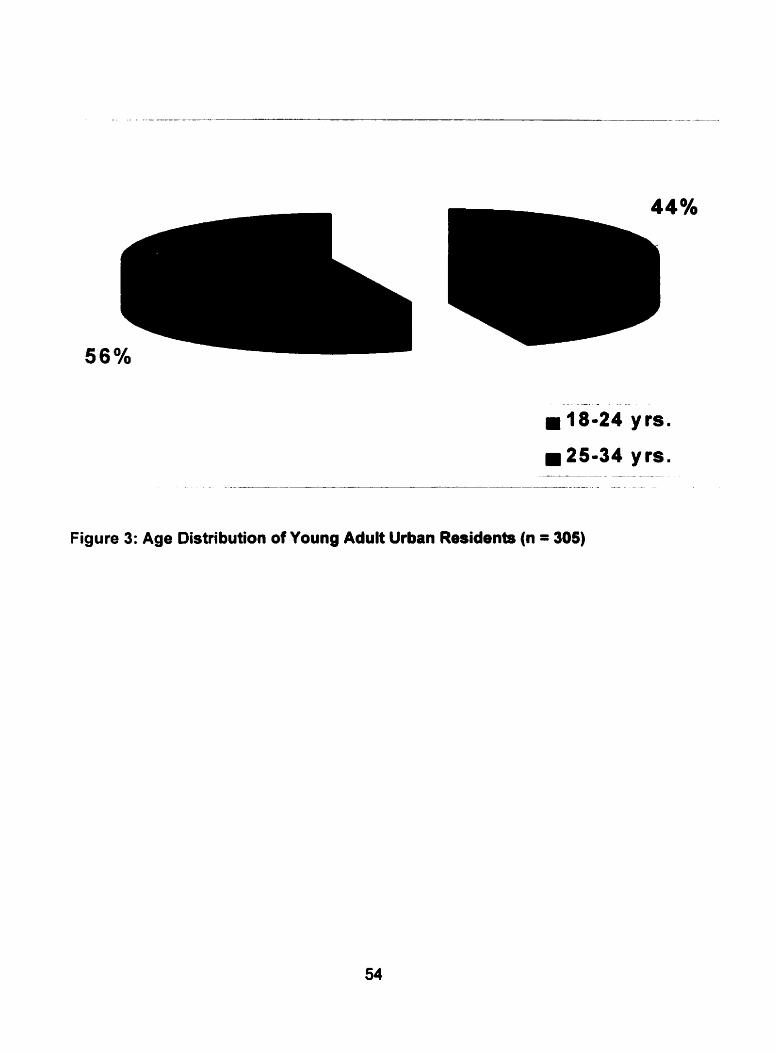
Figure 3: Age Distribution of Young Adult Urban Residents (n = 305)
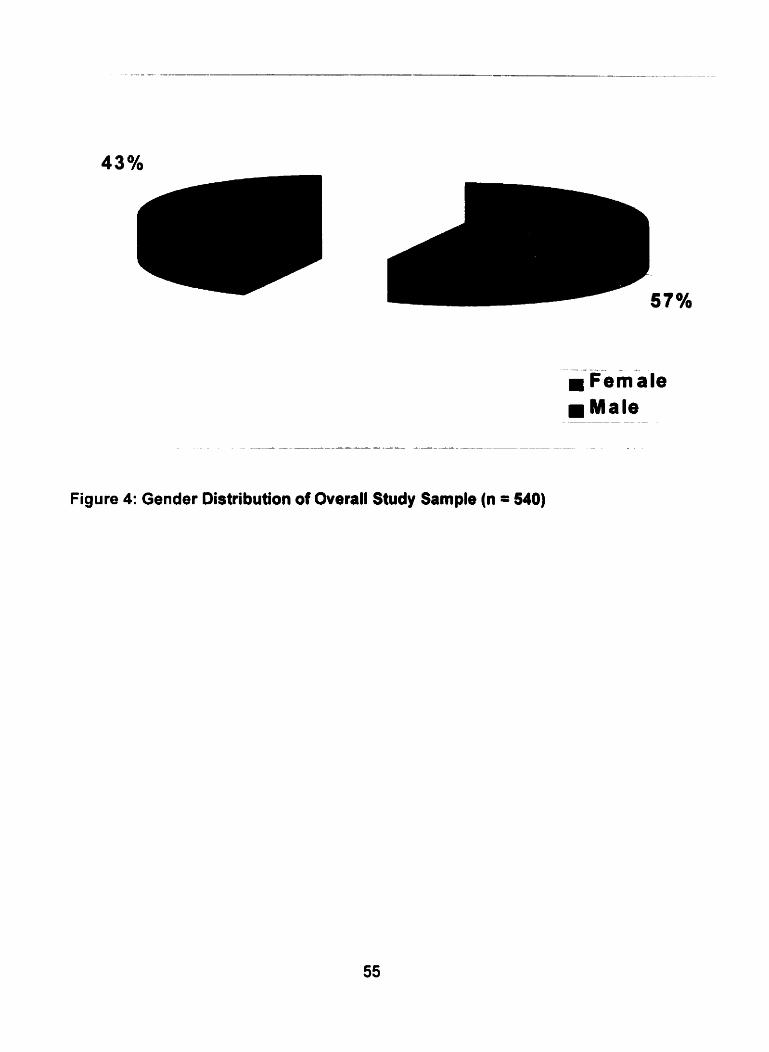
Figure 4: Gender Distribution of Overall Study Sample (n = 540)

Figure 5: Gender Distribution of Young Adult Rural Residents (n = 235)

- - -- -
Fem ale
Figure 6: Gender Distribution of Young Adult Urban Residents (n = 305)

Elementary Completed High Community University School College
Figure 7: Distribution of Education Level of Overall Study Sample (n = 540)

Elementary Compteted High Community U niversity r Rural School College U rban
Figure 8: Distribution of Education Level of Study Sample by Area of Residence (n=540)
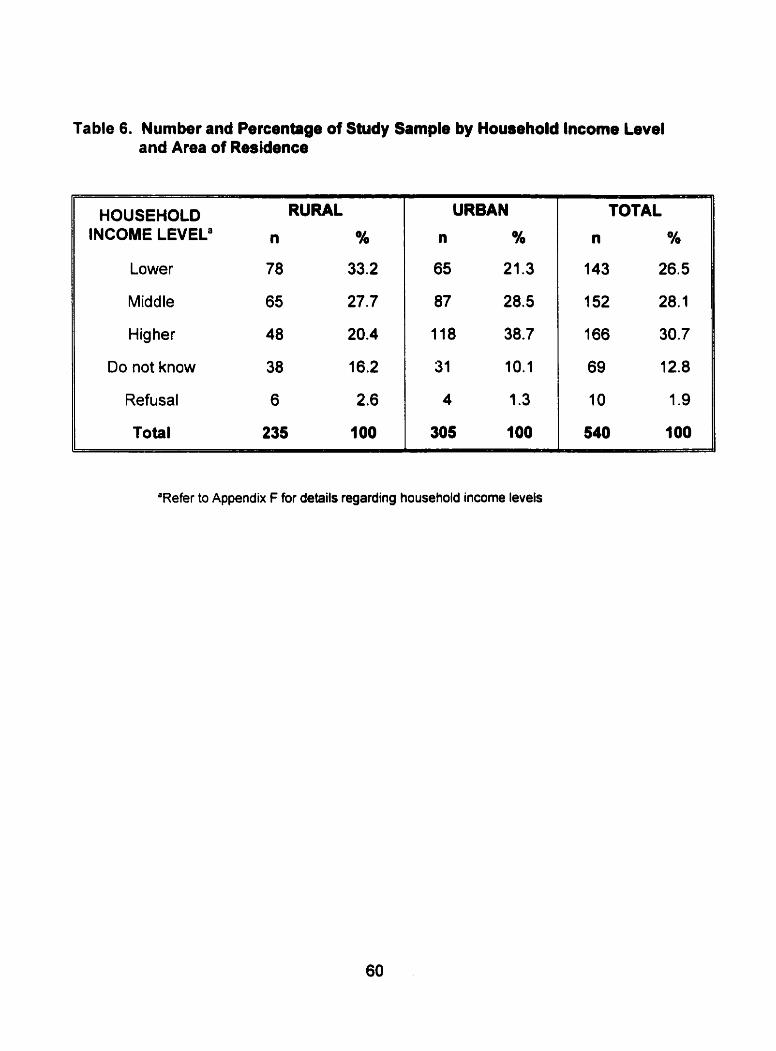
Table 6. Number and Percentage of Study Sample by Household lncorne Level and Area of esi id en ce
HOUSEHOLD INCOME LEVELa
Lower
Middle
Higher
Do not know
Refusal
Total
RURAL
n %
78 33.2
65 27.7
48 20.4
38 16.2
6 2.6
235 100
TOTAL
n %
143 26.5
152 28.1
166 30.7
69 12.8
10 1.9
540 7 00
'Refer to Appendix Ç for details regarding household income levels
Figure 4 illustrates the gender distribution of the overall study sample. A larger
number of fernales (309 of 540) responded to the survey than males (231 of 540).
Figure 5 shows gender distribution by rural area of residence. A larger number of
young adult females (125 of 235) responded to the survey than young adult males
(1 10 of 235) in the rural areas. Figure 6 reveals the gender distribution of the
study sample by urban area of residence. A larger number of young adult females
(1 66 of 305) also responded to the survey than young adult males (1 39 of 305) in
urban areas.
Figure 7 illustrates the educational attainment of the overall study sample.
Respondents having a university level of education comprised the largest
percentage of the sample. Out of the total 540 subjects, 194 stated that they had
acquired at least a university education. One hundred and sixty-six of the
respondents claimed to have completed community college and a further 123
received a high school diploma but achieved no further formal education.
Respondents having an elernentary level of education comprised the smallest
subgroup of the study sample (57 of 540). Figure 8 reveals educational
attainrnent by area of residence. Of the 235 rural residents, 36 attained an
elementary education and of the 305 young adult urban residents, 16 attained an
elementary level of education. Less than 20% of the rural residents attained at
least a university education venus 43% of the young urban adults.
Household incomes of the total study sample are presented in Table 6. Although
10 subjects refused to answer the question and 69 were unable to do so (unaware
of their household income), 461 subjects did make an estimate of their household
income. More of the respondents received a higher level of household income as
cornpared to the middle and lower levels. Household income of the study sample
by area of residence is also presented in Table 6. More of the rural residents
received a lower level of household income as compared to the middle and higher
levels. More urban received middle to higher levels of household income as
compared ta lower levels.
4.4. Prevalence of Factors that are Associated with the Development of Cardiovascular Disease in the Study Sample
Results pertaining to body fat, physical activity levels and smoking habits of the study
sample will be presented here in detail. Each of these factors were presented by age
and gender of the study sample. Sarnpling weights were utilized to obtain the
statistical testing results for each of the cornparisons perfomed as well as the
percentages. Subjects that did not answer particular questions of the Nutrition
Newfoundland and Labrador survey were excluded from the analysis.
4.4.1. Body Fat
Both BMI and waist circurnference were taken as indicaton of body fat.
4.4.1 -1. Body Mars Index
BMI. an indicator of body fat, is presented for al1 subjects (Table 7), for the h o age
groups (Table 7) and for males versus females (Table 8). The chi-square statistic
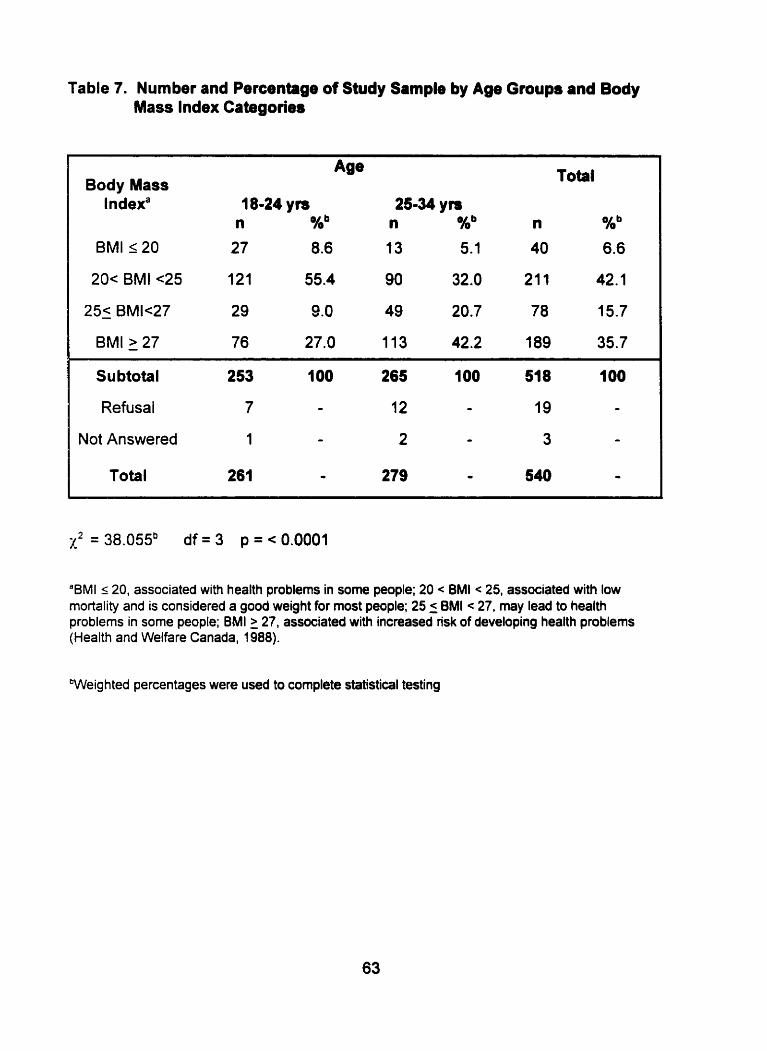
Table 7. Number and Percentage of Study Sample by Age Groups and Body Mass Index Cabgories
Body Mass t ndexa 18-24 ym 25-34 ym
n %b n %b n %b
BMI 120 27 8.6 13 5.1 40 6.6
2 0 ~ BMI ~ 2 5 121 55.4 90 32.0 21 1 42.1
Subtotal 253 100 265 100 51 8 100
Refusai 7 - 12 - 19 -
Not Answered 1 - 2 - 3 -
Total 261 O 279 - 540 O
'BMI s 20, associated with health problems in some people; 20 < BMI c 25, associated with low rnortality and is considered a good weight for rnost people; 25 5 BMI < 27, may lead to health problems in some people; BMI 2 27, associated with increased nsk of developing health problems (Health and Welfare Canada, 1988).
bWeig hted percentages were used to cornplete statistical testing
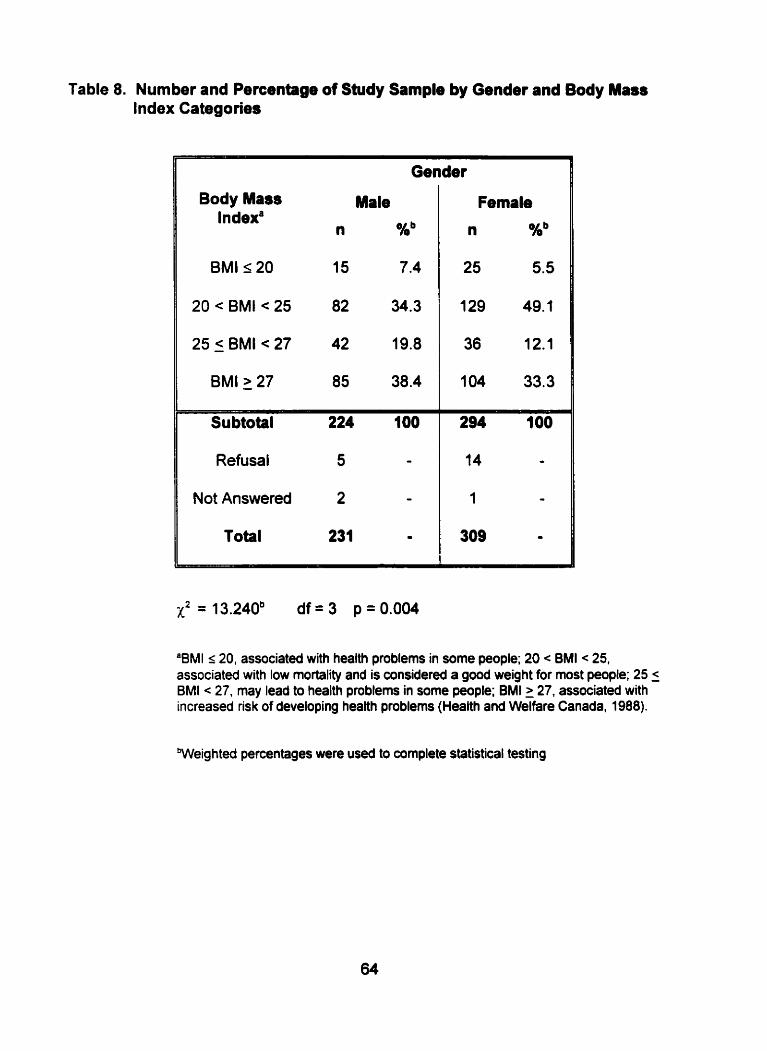
Table 8. Number and Percentage of Study Sample by Gender and Body Masr Index Categories
Body Mass Male
Gender
20 < BMI < 25 82 34.3
25 5 BMI < 27 42 19.8
BMI 27 85 38.4
Refusal 5 -
Not Answered 2 -
Total 231 œ
Female
n Kb
"BMI 120, associateâ with health problems in some people; 20 c BMI < 25, associated with low rnortality and is considered a good weight for most people; 25 5 BMI < 27, may lead to health problems in some people; BMI 2 27, associated with increased risk of developing health problems (Health and Welfare Canada, 1988).
Weighted percentages were used to complete statistical testing
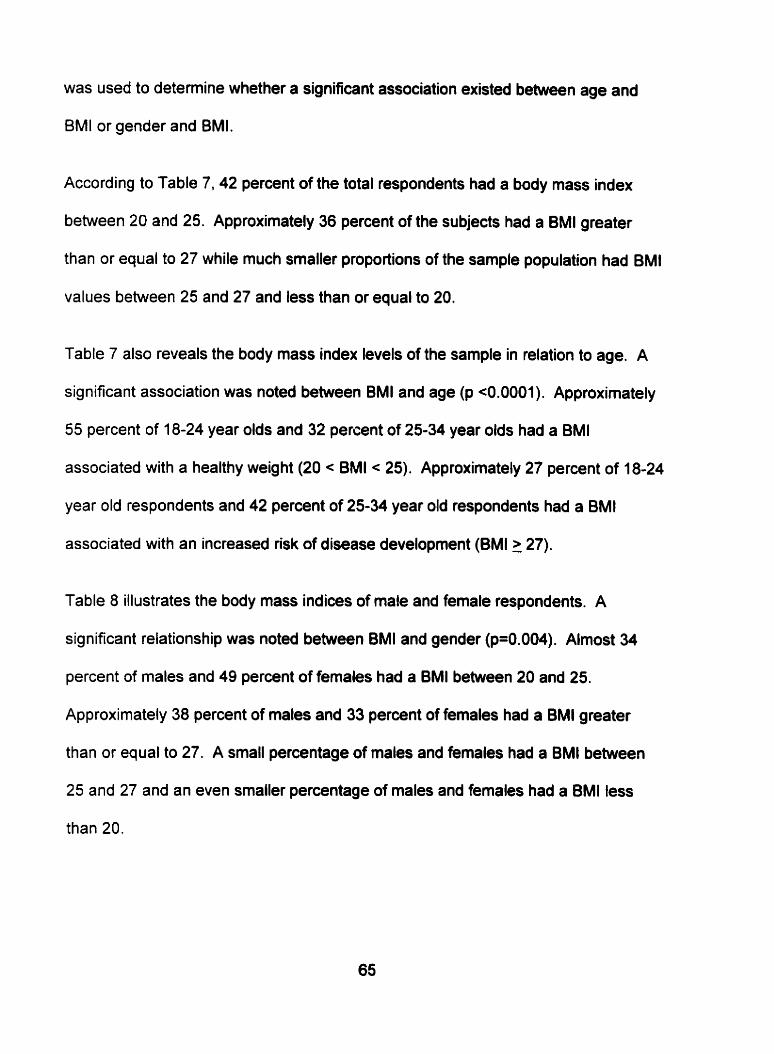
was used to determine whether a significant association existed between age and
BMI or gender and BMI.
According to Table 7, 42 percent of the total respondents had a body mass index
between 20 and 25. Approximately 36 percent of the subjects had a BMI greater
than or equal to 27 while much srnaller proportions of the sample population had BMI
values between 25 and 27 and less than or equal to 20.
Table 7 also reveals the body mass index levels of the sample in relation to age. A
significant association was noted between BMI and age (p <0.0001). Approximately
55 percent of 18-24 year olds and 32 percent of 25-34 year olds had a BMI
associated with a healthy weight (20 < BMI < 25). Approximately 27 percent of 18-24
year old respondents and 42 percent of 25-34 year old respondents had a BMI
associated with an increased risk of disease development (BMI > 27).
Table 8 illustrates the body mass indices of male and femak respondents. A
sig nificant relationship was noted between BMI and gender (p=0.004). Almost 34
percent of males and 49 percent of females had a BMI between 20 and 25.
Approximately 38 percent of males and 33 percent of females had a BMI greater
than or equal to 27. A small percentage of males and females had a BMI between
25 and 27 and an even smaller percentage of males and females had a BMI less

4.4.1.2. Abdominal Adipose Tissue
The waist circumference distribution of female and male respondents is presented
in Figures 9 and 10. The mean waist circumference of the female study sample
was 80.1 centimeters (cm) with a range of 55 cm - 135 cm and a standard
deviation of 13.5. The mean waist circumference of the male study sample was
89.5 cm with a range of 40 cm - 135 cm and a standard deviation of 12.5.
The total percentage of females and males whose waist circumferences were
above and below the recommended cut-offs is presented in Tables 9 and 10.
F emales are considered ta have an increased risk of metabolic disturbances if
they have a waist circumference greater or equal to 88 cm. Males are considered
to have an increased risk of metabolic disturbances if they have a waist
circumference greater or equal to 103 cm (Lean, Han & Seidell, 1998). A small
percentage of young adult female and male respondents had a waist
circumference that was more than the recommended cut-offs.
The chi square statistic was used to measure if age was associated with being less
than or greater than the waist circumference cut-off within the same sex group
(Tables 9 & 10). A significant association was present between age and waist
circumference cut-offs for females (p = 0.004). A higher percentage of 25-34 year
old (30%) females had a waist circumference greater than the recommended cut-off
as compared ta 1 8-24 year old females (1 5%) (Table 9). However, a significant
association was not noted between age in males and being above the recommended
waist circumference cut-offs (~~0.407) (Table 10)

55 65 75 85 95 105 115 125 135
Waist Circumference (cm)
Figure 9: Distribution of Fernale Study Sample by Waist Circumference (n = 309)
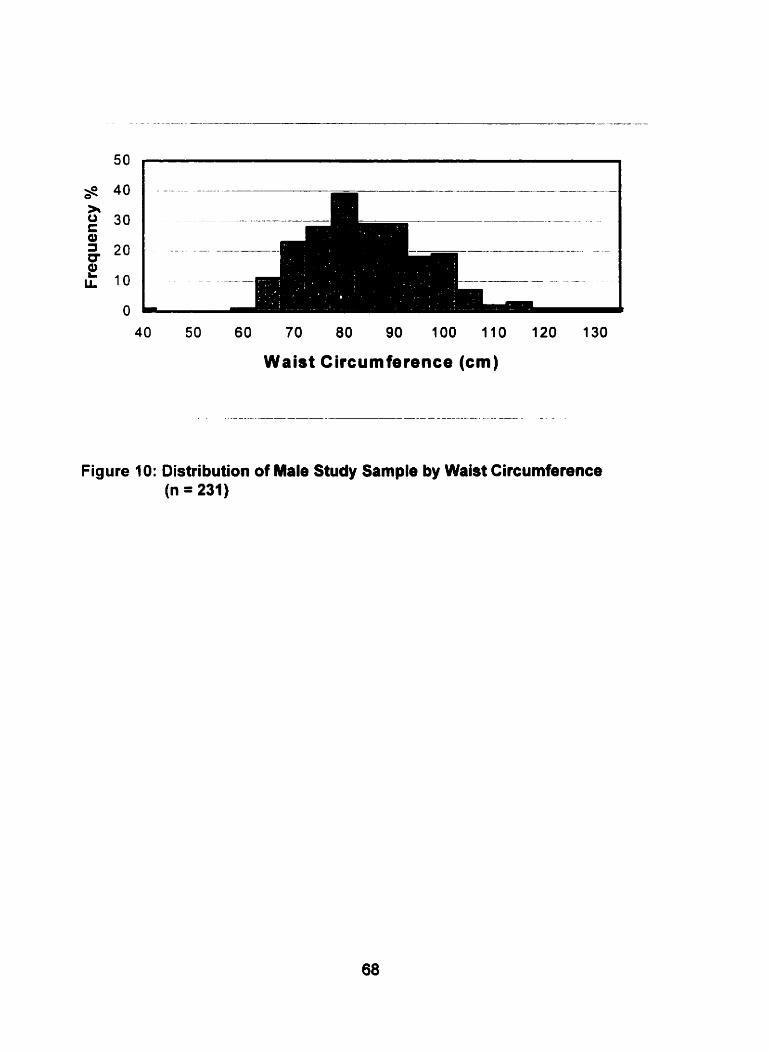
Figure 10: Distribution of Male Study Sample by Waist Circumference (n = 231)
Waist Circumference (cm)
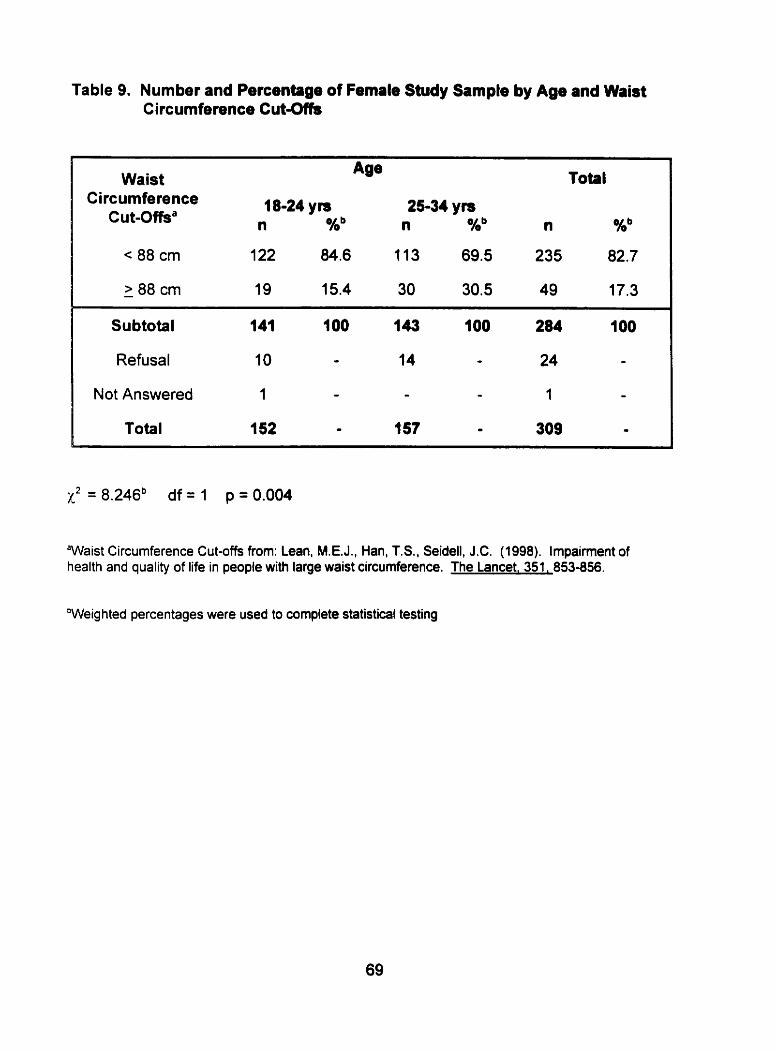
Table 9. Number and Percentage of Fernale Study Sample by Age and Waist Circurnference Cut-ûfk
Waist Circumference
Cut-offsa
Total
-
Subtotal 141 11 O0 143 100 284 IO0
Refusal 10 - 14 - 24 -
Not Answered 1 - - - 1 -
Total 152 - t 57 - 309 -
"Waist Circumference Cut-ofis from: Lean, M.E.J., Han, T.S., Seidell, J-C. (1998). Impairment of health and quality of life in people with large waist circumference. The Lancet, 351, 853-856.
'Weig hted percentages were used to complete statisticâl testing

Table 10. Number and Percentage of Male Study Sample by Age and Waist Circurnference Cut-ûfk
Waist Circumference
Cut-offsa
Total
Su btotal 102 1 O0 111 100 213 t O0
Refusal 7 - 9 - 16 -
Not Answered - - 2 - 2 - Total 1 09 - 122 O 231 -
"aist Circumference Cut-offs from: Lean, M.E.J., Han, T.S., Seidell, J.C. (1998). Impairment of health and quality of life in people with large waist circumference. The Lancet, 351, 853-856.
'Weighted percentages were used to complete statistical testing
4.4.2. Physical Activity
The level of physical activity performed by the research subjects was determined by
analyzing the type of physical activity they perfomed at work as well as the
frequency and duration of lower and higher intensity leisure time physical activities.
4.4.2.1. Physical Activity at Work
According to Table 11, most respondents performed a slight or moderate level of
physical activity at work. Approximately 36% of subjects perfomed slight
levels and 33% of subjects performed rnoderate levels of physical activity at work.
Smaller percentages of al1 young adults (18-24 yrs. and 25-34 yrs.) from the study
performed sedentary and heavy physical activity at work.
Chi square analysis was perfomed to detennine the relationship between physical
activity at work with age and gender. No significant relationship existed between
physical activity at work and age (p-0.831) (Table 11). However. a significant
relationship existed between gender and physical activity at work (p < 0.0001). Table
12 reveals that a higher percentage of males performed moderate to heavy levels of
physical activity at work as compared to females (35.8% + 26% = 61.8% versus
30.7% + 4.5% = 35.2%). A higher percentage of females performed slight and
sedentary levels of physical activity at work as compared to males (45.9% + 19.0% =
64.9% versus 23.2% + 15.0% = 38.2%).
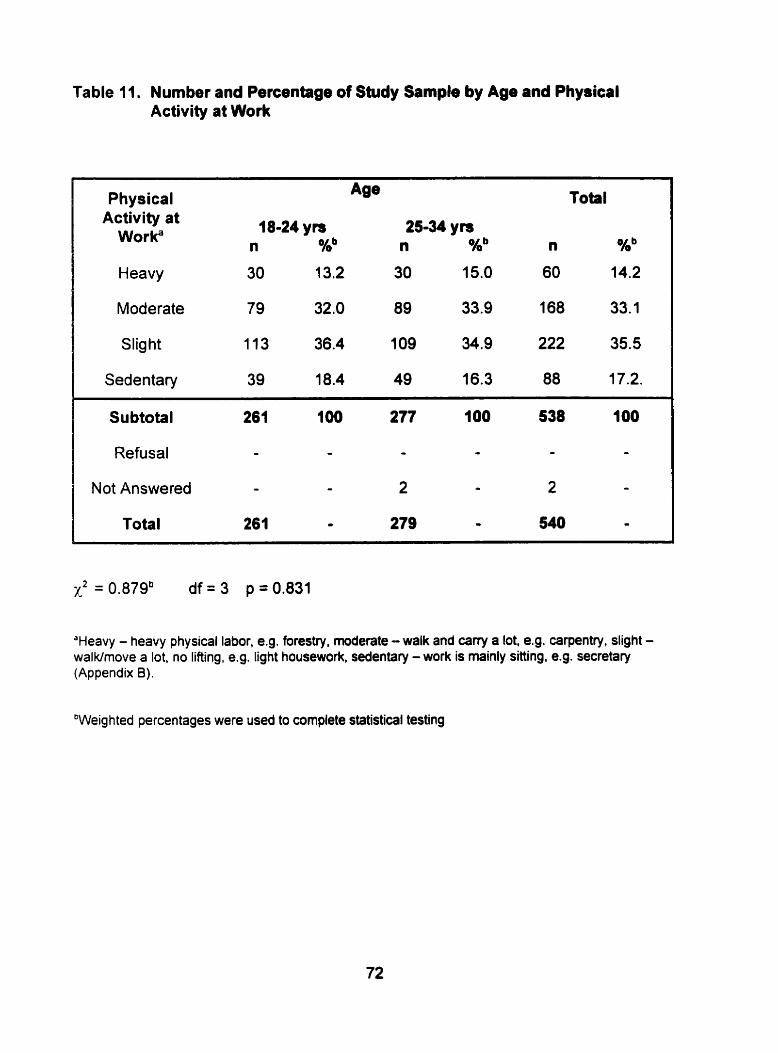
Table Il. Number and Percentage of Study Sarnple by Age and Physical Activity at Work
Activity at Worka
Total
Heavy 30 13.2 30 15.0 60 14.2
Moderate 79 32.0 89 33.9 168 33.1
Slig ht 113 36.4 1 09 34.9 222 35.5
Sedentary 39 18.4 49 16.3 88 17.2.
Subtotal 261 100 277 100 538 100
Refusal - - - - - -
Not Answered - - 2 - 2 -
Total 261 O 279 - 540 -
'Heavy - heavy physical labor, e.g. forestry, moderate - walk and cary a lot, e.g. Ca~Pentf'Y, slight - walkhove a lot, no lifting, e.g. Iight housework, sedentary - work is mainly sitting, e.g. secretary (Appendix B).
'Weighted percentages were used to cornplete statistical testing
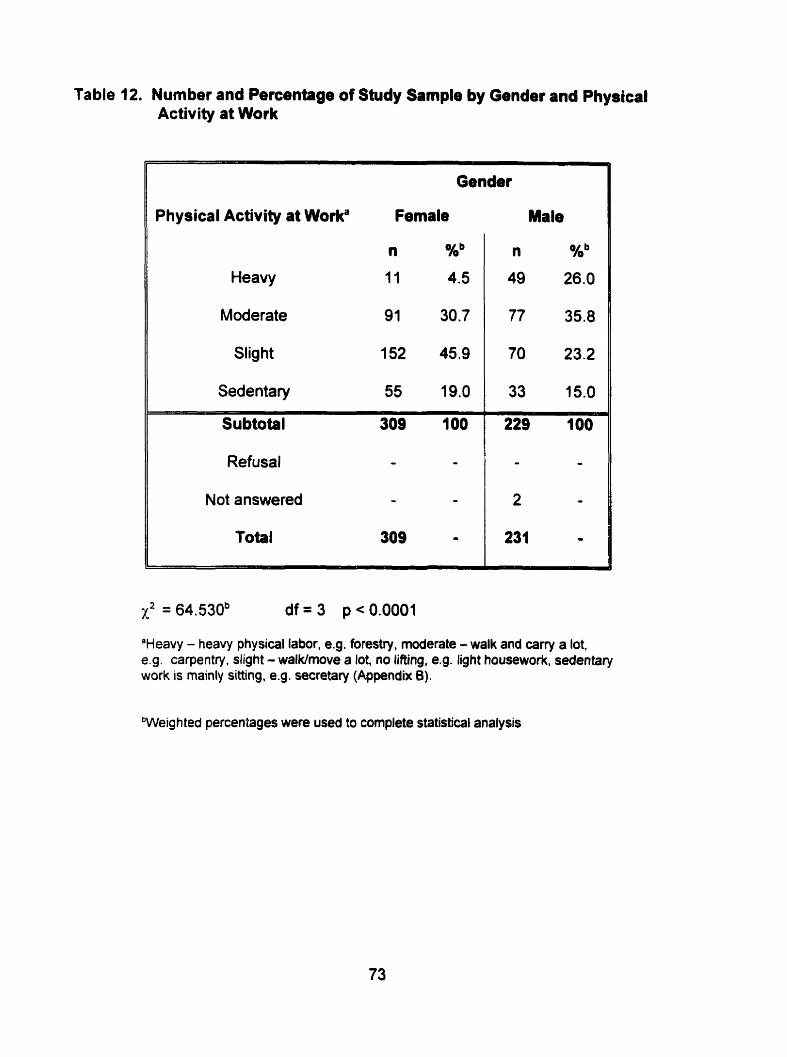
Table 12. Number and Percentage of Shdy Sample by Gender and Physical Activity at Work
Physical Activity a1 Worka Fernale
n Xb
Heavy 11 4.5
Moderate 91 30.7
Slight 152 45.9
Sedentary 55 19.0
Subtotal 309 IO0
Refusal - -
Not answered - -
Total 309 -
Male
'Heavy - heavy physical labor, e.g. forestry, moderate - walk and carry a lot, es. carpentry. slight - walklrnove a lot, no lifting. e.g. light housework; sedentary work is mainly sitting, e.g. secretary (Appendix 6).
bWeig h ted percenîages were used to complete statistical analysis
4.4.2.2. Physical Activity duiing Lebure Time
Both the duration and frequency of lower and higher intensity leisure time physical
activities were analyzed in this study.
4.4.2.2.1. Lower lntensity
Approxirnately 13% of the total respondents reported that they spent no time
participating in lower intensity physical activity during leisure time - activity that did
not require their heart to beat rapidly (Table 13). Fifty-nine percent of subjects
reported that they participated in lower intensity leisute time physical activities more
than three times per week. The effect of age of study sample on frequency of lower
intensity leisure time physical activities was also examined and presented in Table
13. Chi-square analysis was used to detenine if a relationship existed between
frequency of leisure physical activity and age. A significant difference was not noted
(p=0.089).
The relationship between gender of study sample and frequency of lower intensity
leisure time physical activities was also examined and is presented in Table 14. Chi-
square analysis was used to determine if a relationship existed between frequency of
lower intensity leisure time physical activities and gender. A significant relationship
was noted (p < 0.0001). Approximately seven percent of female respondents
reported that they spent no time participating in lower intensity leisure time physical
activities versus 21 percent of male respondents (Table 14). Approxirnately 67
percent of female subjects and 50 percent of male subjects reported that they spent
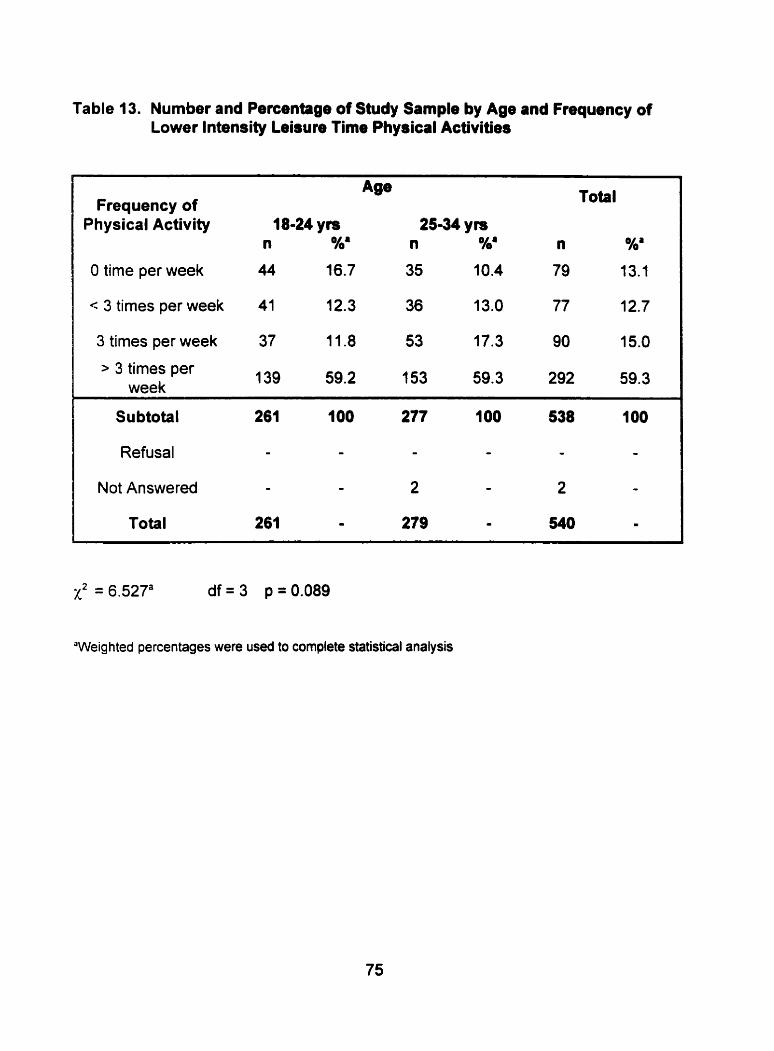
Table 13. Number and Percentage of Study Sampk by Age and Frequency of Lower lntensity Leisure Time Physical Activities
Frequency of Physical Activity 18-24 ym
n %a
O time per week 44 16.7
< 3 times per week 41 12.3
3 tirnes per week 37 11.8
> 3 times per week
Total
25-34 YB n %' n %'
35 10.4 79 13.1
36 13.0 77 12.7
53 17.3 90 15.0
153 59.3 292 59.3
Subtotal 261 100 277 IO0 538 100
Refusai - - - - - -
Not Answered - - 2 - 2 -
Total 261 - 279 - 540 -
X2 = 6.527= df = 3 p = 0.089
'Weighted percentages were used to complete statistical analysis
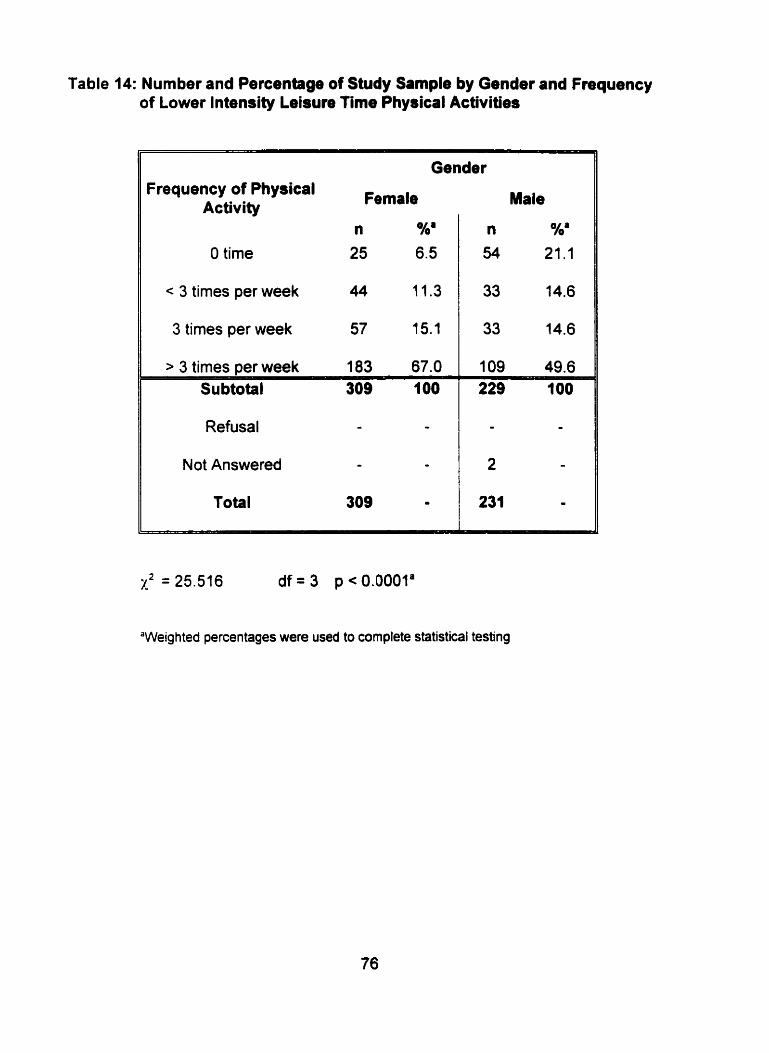
Table 14: Number and Percentage of Study Sample by Gender and Frequency of Lowet lntensity Leisure fime Physical Activities
O time 25 6.5
c 3 times per week 44 11.3
3 times per week 57 15.1
s 3 times per week 183 67.0 Su btotal 309 100
Refusal - -
Not Answered - -
Total 309 -
Male
n *ha 54 21.1
33 14.6
33 14.6
1 09 49.6
"Weighted percentages were used to complete statistical testing
more than three times par week participating in lower intensity leisure tirne physical
activities (Table 14).
In regards to duration of leisure time physical activity, approximately 13% of total
respondents reported that they spent no time at performing lower intensity leisure
time physical activities (Table 15). Seventy-seven percent of total respondents
reported that they spent at least 30 minutes performing lower intensity leisure time
physical activities (Table 15). The relationship between age and duration of lower
intensity leisure time physical activities is also presented in Table 15. A significant
relationship was noted (p = 0.006). Approximately 16% of 18-24 year olds and 10%
of 25-34 year olds spent no time at lower intensity leisure time physical activities.
While 10% of 18-24 year olds and 4.8% of 25-34 year olds spent 20 - 29 minutes at
lower intensity leisure time physical activities.
The relationship between gender of study sample and duration of lower intensity
leisure time physical activities was presented in Table 16. According to chi-square
analysis, a sig nificant relationship was present (p <0.000 1 ). Approximately 50% of
females and 21 % of males spent no time at perfoming lower intensity leisure time
p hysical activities. Furthemore, 43% of female and 72% of male respondents
reported that they spent at least 30 minute intervals when they were performing
lower intensity leisure time physical activities.

Table 15: Number and Peicentage of Study Sample by Age and Duration of Lower lntensity Leisure Time Physical Activities
Duration of Physical Activity 18-24 yis
n %'
O time 44 16.7
< 20 minutes 9 2.6
20-29 minutes 18 10.5
30 minutes - 189 70.2
Total
25-34 n %' n %a
35 10.3 79 13.1
11 3.5 20 3.1
16 4.8 34 7.2
216 81.4 405 76.6
Subtotal 260 100 278 IO0 538 1 O0
Refusal - - - - - -
Not Answered 1 - 1 - 2 -
Total 261 = 279 - 540 -
x2 = 12.51ga df = 3 p = 0.006
"Weighted percentages were used to complete statistical testing
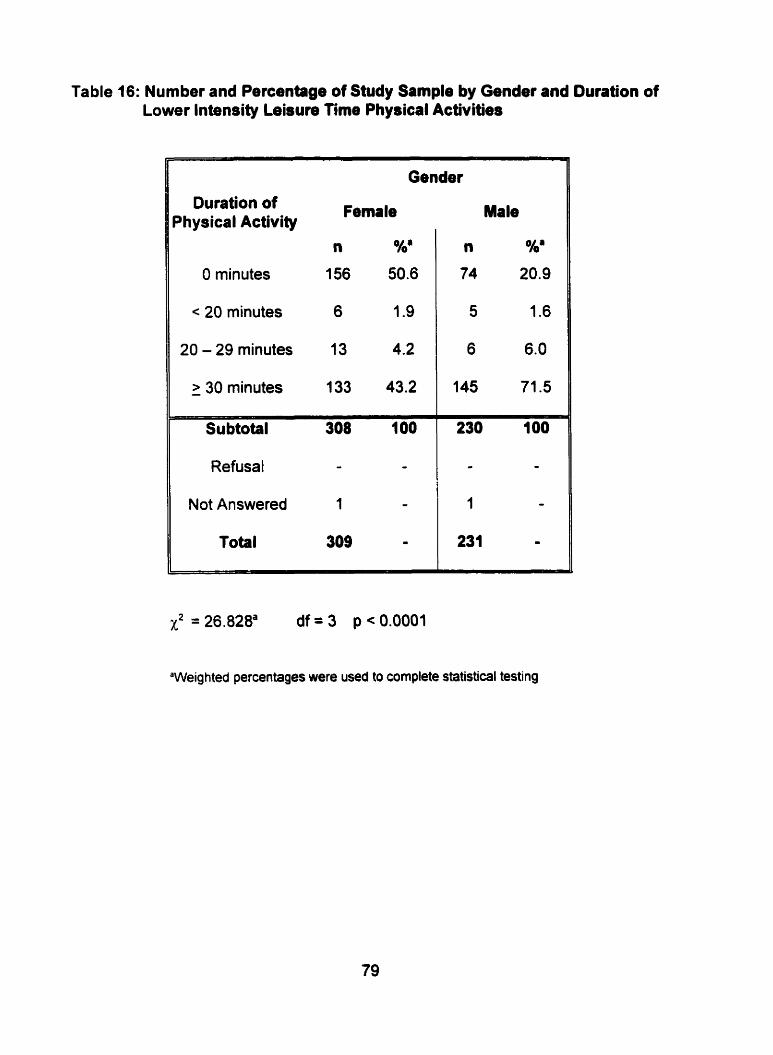
Table 16: Number and Percentage of Study Sample by Gender and Duration of Lower Intensity Lebure Time Phydcal Activities
Duration of Dhysical Activity
O minutes
c 20 minutes
20 - 29 minutes
> 30 minutes -
Gender
Subtotal 308 100
Refusal - - Not Answered 1 -
Total 309 rn
Male
n %'
74 20.9
5 1.6
6 6.0
145 71.5
X2 = 26.828= d f = 3 p<0.0001
'Weighted percentages were used to cornpiete statistical testing

4.4.2.2.2. Higher lntensity
In regards to frequency, approximately 45% of total respondents reported spending
no time performing leisure physical activities that required their heart to beat rapidly.
However, 27% of total respondents reported that they spent more than 3 times a
week performing higher intensity leisure physical activities (Table 17).
Chi-square analysis was performed to determine the relationship between frequency
of leisure time physical activity and age (Table 17). A significant relationship existed
between frequency of higher intensity leisure time physical activities and age
(p=0.001). Approximately 36% of 18-24 year olds and 53% of 25-34 year olds spent
no tirne at performing higher intensity leisure time physical activities. Furthemore,
31 % of 18-24 year olds and 25% of 25-34 year olds spent more than three times per
week at hig her intensity physical activities.
Table 18 presents the frequency of higher intensity physical activities during leisure
time by gender. A significant relationship was also present between frequency of
leisure time p hysical activities that required the heart to beat rapidly and gender
(p<0.0001). Approximately 55% of female respondents and 34% of male
respondents reported spending no time at perfoming higher intensity leisure physical
activities. Furthermore, 20% of females and 36% of males reported performing
hig her intensity leisure physical activities more than three times per week.
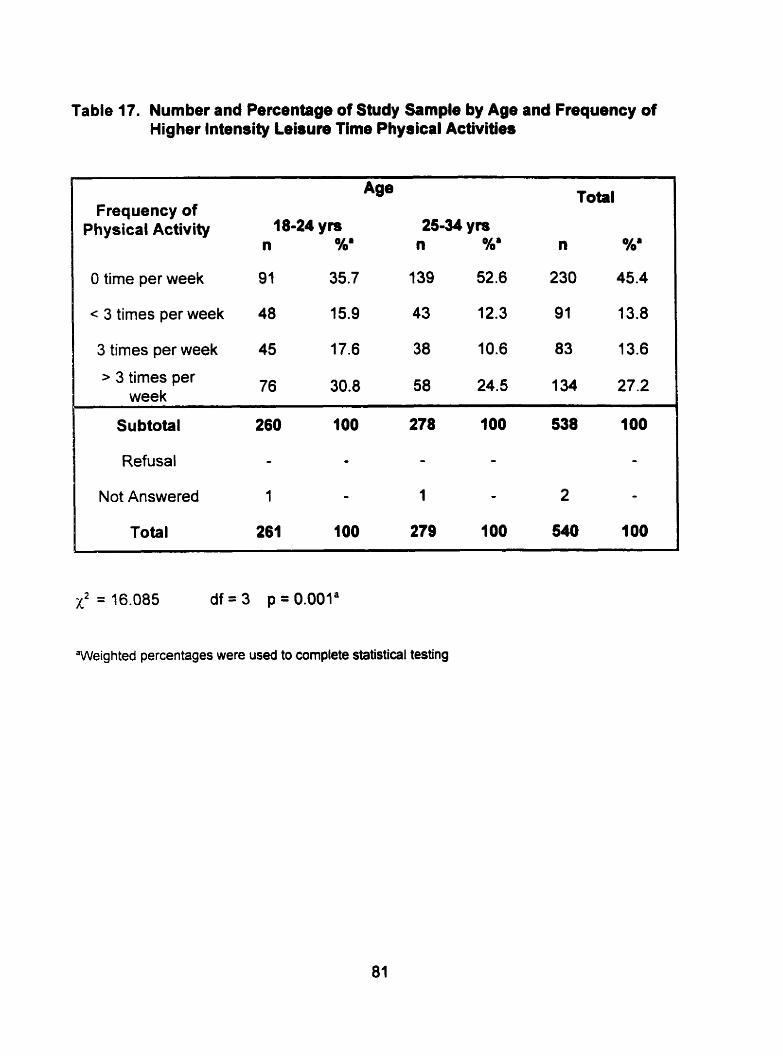
Table 17. Number and Percentage of Study Sample by Age and Frequency of Hig her lntensity Leisure Time Physical Activities
Frequency of Physical Activity
Total
O time per week 91 35.7 1 39 52.6 230 45.4
< 3 times per week 48 15.9 43 12.3 91 13.8
3 times per week 45 17.6 38 10.6 83 13.6
> 3 times per week
76 30.8 58 24.5 1 34 27.2
Not Answered 1 - 1 - 2 -
Total 261 100 279 100 540 1 O0
x2 = 16.085 d f = 3 p = O . O O l a
"Weighted percentages were used to complete statistical testing
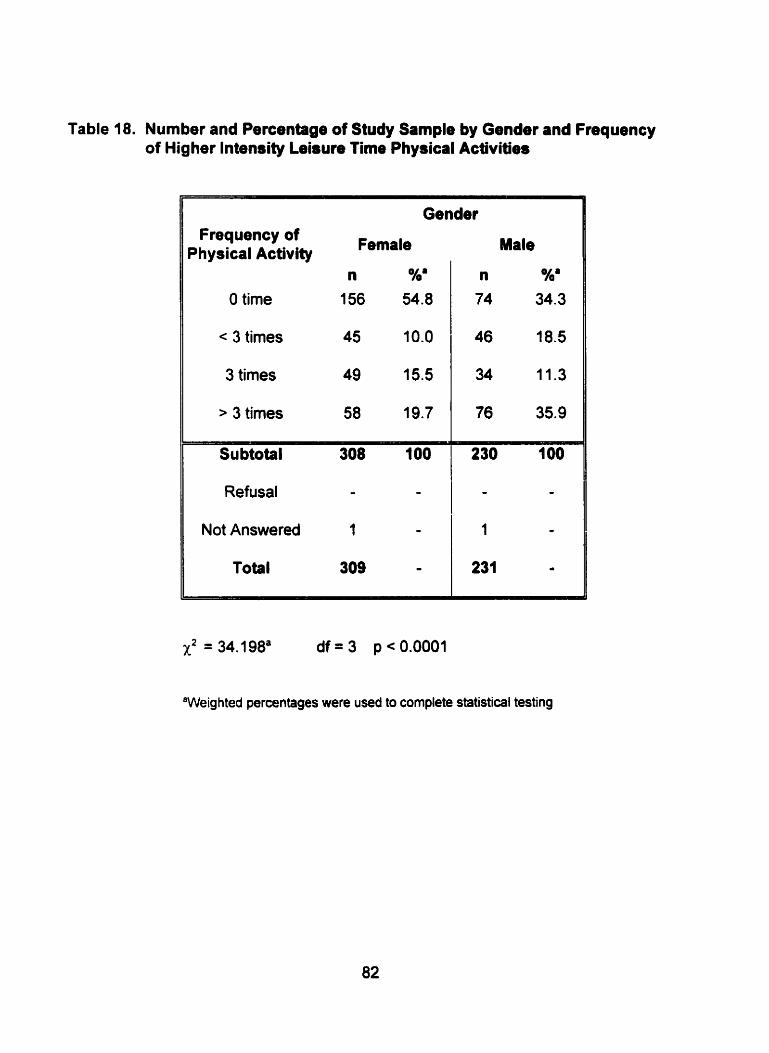
Table 18. Number and Percentage of Study Sample by Gender and Frequency of Higher lntensity Leisun Time Phydcal Activities
Gender Frequency of
Physical Activity Female
n %' O time 156 54.8
< 3 times 45 10.0
3 times 49 15.5
> 3 times 58 19.7
Refusal - -
Not Answered 1 -
Total 309 -
Male
n %' 74 34.3
"Weig hted percentages were used to complete statistical testing

The length of time that respondents spent perfomiing higher intensity leisure time
physical activities is shown in Table 19. About 45 percent spent O minutes
performing physical activity during leisure time. Approxirnately 49% of respondents
spent at least thirty-minute intervals while performing higher intensity leisure tirne
physical activities.
Chi-square analysis was used to determine whether a relationship existed between
age of respondents and duration of higher intensity physical activities performed
during leisure time. A significant relationship exits between duration of higher
intensity leisure time physical activitieéand age (Table 19). Table 19 illustrates that
36 percent of 18-24 year olds and 53 percent of 25-34 year olds spent no time at
performing higher intensity leisure time activities. Furthemore, 60% of 18-24 year
olds and 42% of 25-34 year olds perfonned 30 minutes or more of leisure physical
activities that required their heart to beat faster.
Data on gender of subject and duration of higher intensity leisure time physical
activities are presented in Table 20. Chi-square analysis was used and a significant
association was detected (pc0.0001). Table 20 reveals that 55% of females and
34% of males spent no time performing higher intensity physical activities during
leisure time. Furthemiore, a larger percentage of males performed leisure time
physical activities that required the heart to beat rapidly for greater or equal to 30
minutes per episode as cornpared to females (62% versus 38%).

Table 19: Number and Percentage of Study Sample by Age and Duntion of Higher Intendty Leisure Tirne Physical Activities
Total Duration of
Physical Activity 18-24 ym 25-34 ym n %' n Oha n
O time 91 35.5 139 52.6 230 45.4
< 20 minutes 7 2.2 4 1.6 Il 1.9
20-29 minutes 8 2.6 11 3.9 19 3.3
> 30 minutes - 1 54 59.6 1 24 41.9 278 49.5
Subtotal 260 100 278 100 538 100
Refusal - - - - - O
Not Answered 1 - 1 - 2 O
Total 261 - 279 - 540 -
X2 = 17.604a df = 3 p = 0.001
"Weig hted percentages were used to complete statistical testing

Table 20. Number and Percentage of Study Sample by Gender and Duration of Higher lntensity Leisure Time Physical Activities
Il Gender
Duration of Physical Fernale Activity
n %'
O minutes 156 55.0
1 20 - 29 minutes 13 4.2
> 30 minutes
Su btotal
Male
'Weighted percentages were used to complete statistical testing

4.4.3. Smoking Habits
The smoking habits of the study sample were studied in two ways, the actual nurnber
of cigarettes smoked per day by regular smoken as well as the number of regular
smokers. The median number of cigarettes smoked per day by regular smokers
was 14 with a range of 1-40 (Figure 11).
Table 21 illustrates that there were a larger percentage of non-smoken in the total
study sample than there were regular smokers. A comparison between number of
regular smokers and age is also presented in Table 21 by performing chi-square
analysis. No significant relationship was observed between the number of regular
smokers and age (p=0.17).
A comparison was also made between number of regular smokers and gender
(Table 22). No significant relationship existed between the number of regular
smokers and gender (p=0.782).
The total number of cigarettes consumed per day by regular smokers was compared
by age and gender (Table 23 and Table 24). To complete this analysis the t-test of
independent means was used. A significant difference was present between
average smoking number and age (p=0.002). An average of 12 cigarettes a day
were consumed by 18-24 year old regular smoken and an average of 16 cigarettes a
day were consumed by 25-34 year old regular smoken. Young adult females
consurned an average of 13 cigarettes per day and young adult males (regular
smokers) consumed an average of 15 cigarettes per day. This difference was also
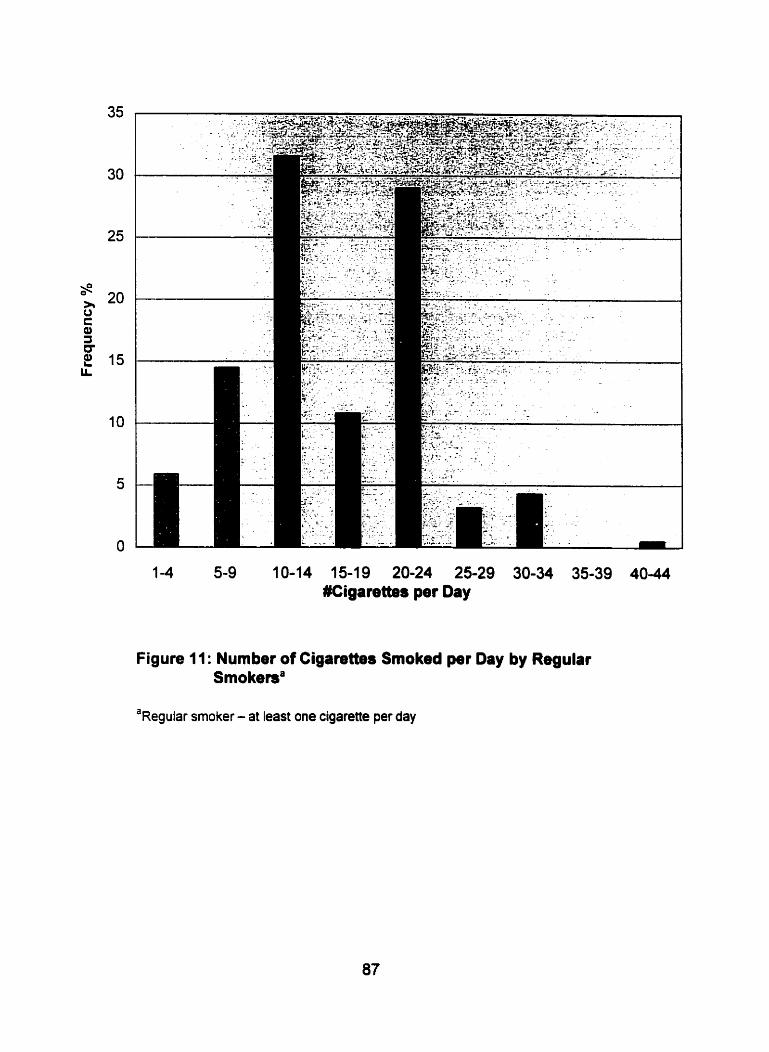
1 -4 5-9 10-14 15-19 20-24 25-29 30-34 35-39 40-44 #Cigarettes per Oay
Figure 11: Number of Cigarettes Smoked per Day by Regular Smokema
a~egular smoker - at least one cigarette per day

Table 21 : Number and Percentage of Study Sample by Age and Smoking Habits
Age Total
Regular Smokef' 18-24 ym 25-34 yn n OAb n Nb n %b
I Yes 83 36.7 1 04 42.6 187 40.1
l Not Answered 1 - 2 - 3 -
1
Total 261 - 279 - 540 100 ,
No 177 63.3 173 57.4 350 59.6 . Subtotal 260 100 277 IO0 537 100
Refusal - - - - - -
"Regular smoker - at least one cigarette per day
'Weighted percentages were used to complete statistical testing
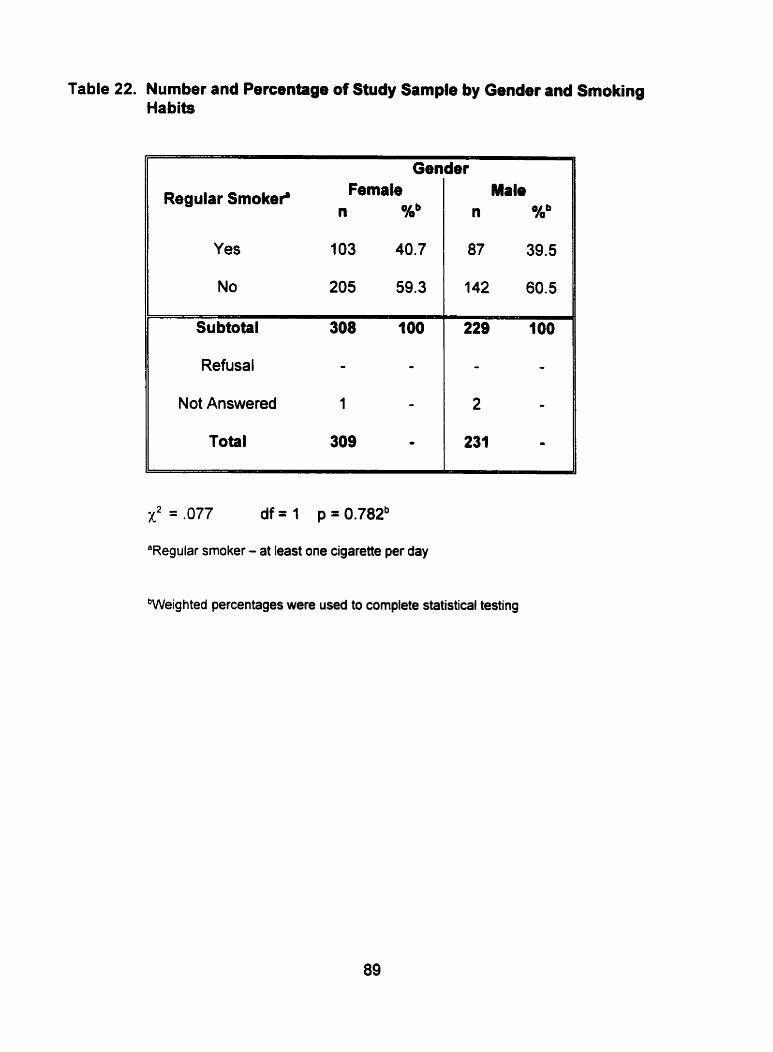
Table 22. Number and Percentage of Study Sample by Gender and Smoking Habits
Regular Smokei' Female n Kb
Male n %b
1 Gender
Yes 1 03 40.7
No 205 59.3
Subtotal 308 1 O0
Refusal - -
Not Answered 1 -
Total 309 -
x2 = ,077 df = 1 p = 0.782b
"Regular smoker - at Ieast one cigarette per day
Weighted percentages were used to complete statistical testing
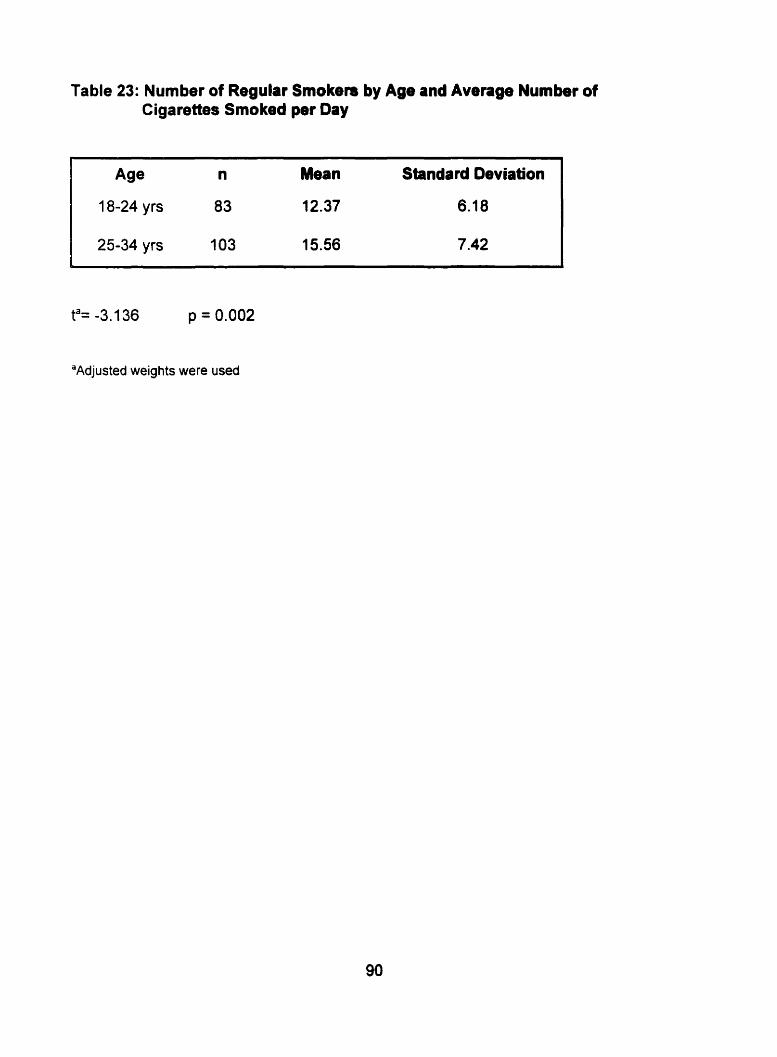
Table 23: Number of Regular Smoken by Age and Average Number of Cigarettes Smoked per Oay
Age n Mean Standard Deviation
18-24 yrs 83 12.37 6.18
25-34 yrs 1 03 15.56 7.42
ta= -3.136 p = 0.002
"Adjusted weights were used

Table 24: Number of Regular Smokers by Gender and Average Number of Cigarettes ~moked per Day
Gender
Female
Male
Standard Deviation
"djusted weights were used

statistically significant (Table 24).
4.5. Relationship between Cardiovascular Dbsase Risk Factors and Area of Residence
The researcher determined the association between indicators of body fat, physical
activity and cigarette smoking with area of residence. This was accomplished by
performing chi-square analyses.
4.5.1. Body Fat and Area of Residence
Data relating to body fat of subjects is presented as body mass index and waist
circumference.
4.5.1 .l. Body Mass Index
Table 25 reveals that the body mass index levels of urban and rural residents were
similar. According to the chi-square test, no significant relationship was present
between area of residence and BMI levels (p=0.511). However, a slightly higher
percentage of residents with a BMI greater than 27 were living in rural areas (39%)
as compared to urban areas (33%).
4.5.1.2. Waist Circumference
The waist circumference cut-offs by gender and area of residence are presented in
Tables 26 and 27. According to chi-square analysis, a higher percentage of femate
rural respondents had a waist circumference above the standard as compared to
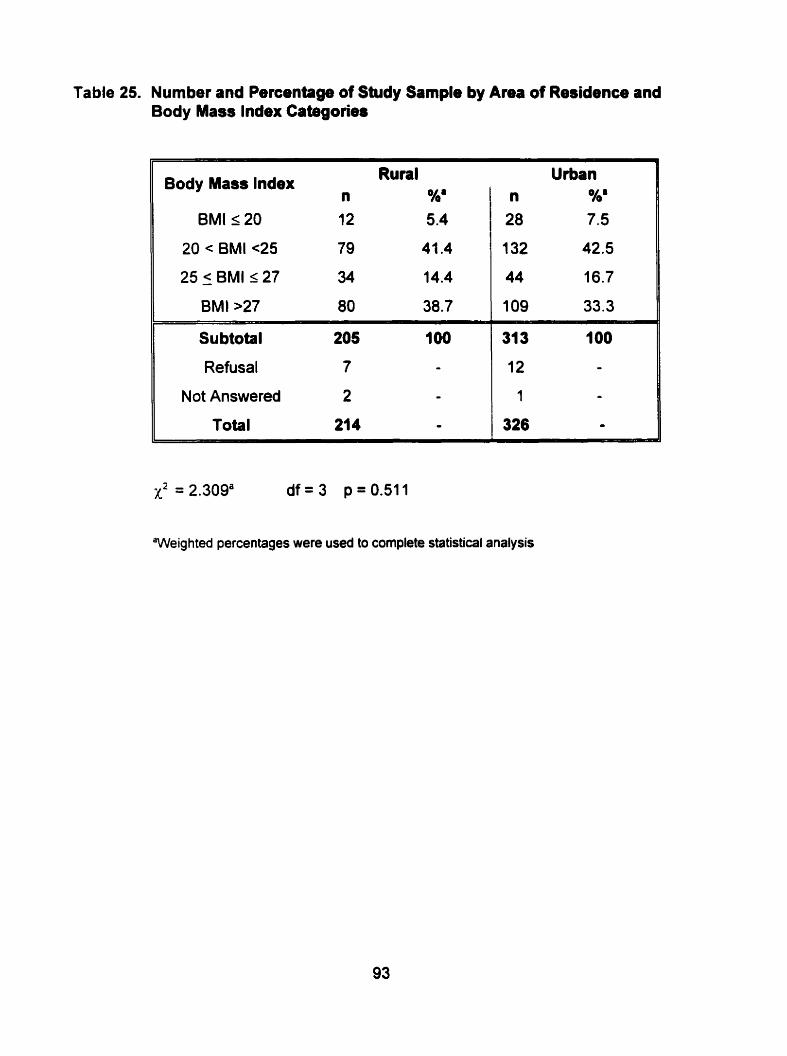
Table 25. Number and Percentage of Study Sarnple by Area of Residence and Body Mass Index Cabgories
Body Mass lndex Rural n %'
BMI r 20 12 5.4
20 < BMI ~ 2 5 79 41.4
25 5 BMI s 27 34 14.4
BMI >27 80 38.7
Su btotal 205 100
Refusal 7 - Not Answered 2 -
Total 214 -
x2 = 2.309' d f = 3 p=0.511
Weighted percentages were used to complete statistical analysis

Table 26. Number and Percenbge of Fernale Study Sample by Area of Residence and Waist Circumference Cut-offs
Waist Circurnference Rural Urban Cut-Oifs n %' n %'
Subtotal 107 100 177 100
Refusais 10 - 14 -
Not Answered 1 - - -
Total 118 100 191 100
x2 = 8.664' df= 1 p10.003
'Adjusted percentages were used to complete statistical testing
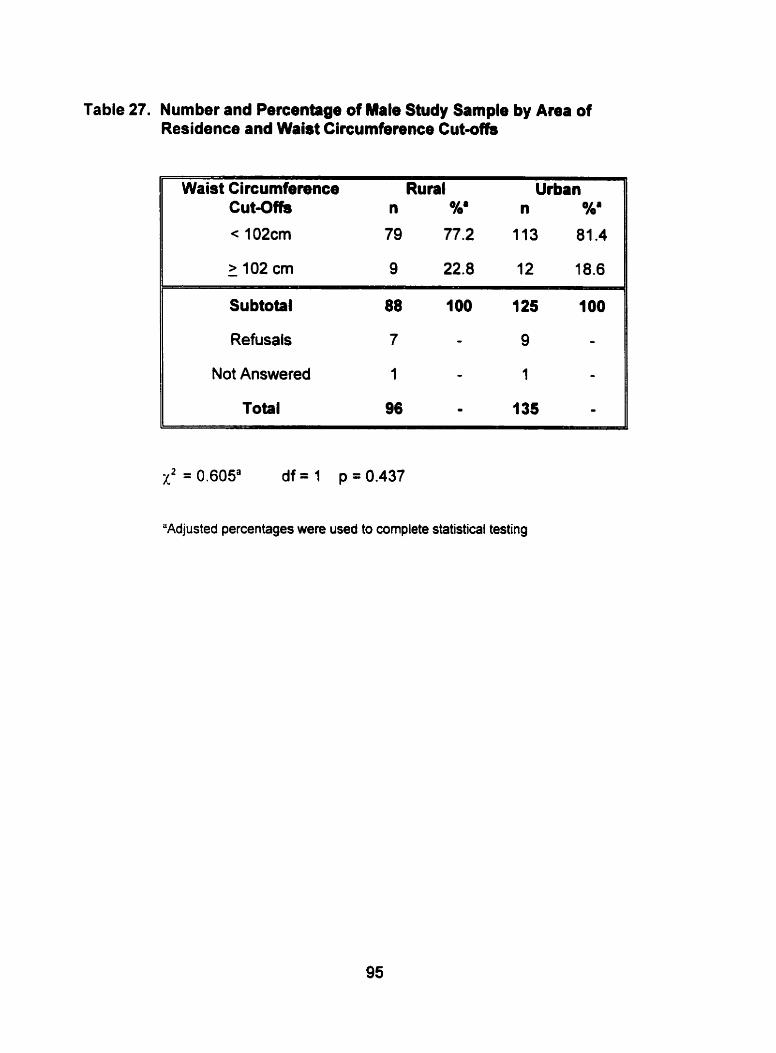
Table 27. Number and Percentage of Mate Study Sample by Amr of Residence and Waist Circumference Cut-offs
Waist Circumference Rural Urban Cut-Offs n %' n %'
< 102cm 79 77.2 113 81.4
Su btotal 88 1 O0 125 100
Refusals 7 - 9 -
Not Answered 1 - 1 -
Total 96 - 135 -
x2 = 0.605a df = 1 p = 0.437
"Adjusted percentages were used to cornplete statistical testing
female urban respondents (p= 0.003). No significant difference was found between
area of residence and waist circumference cut-off of males (p=0.437).
4.5.2. Physical Activity and Area of Reridence
The level of physical activity performed by urban and rural residents is presented as
the exercise performed at work and during leisure time. The level of physical activity
performed during leisure time is divided into frequency and duration of lower and
higher intensity leisure time physical activities.
4.5.2.1. Physical Activity at Work
A significant relationship existed between level of physical activity at work and area
of residence according to the ordinal logistic analysis of data presented in Table 28
(p c 0.0001). Rural residents performed more moderate and heavy levels of physical
activity at work in cornparison to urban residents (38.6% + 24.5% = 63.1% versus
28.9% + 6.6% = 35.5% respectively).
4.5.2.2. Physical Activity during Leisure Time
Physical activity during leisure time was analyzed twofold - by the frequency and
duration of leisure time physical activities that do not require the heart to beat fast
(lower intensity) and by the frequency and duration of leisure time physical activities
that do require the heart to beat faster (higher intensity).

Table 28. Number and Percentage of Study Sample by Area of Reaidence and Level of Physical Activity at Work
II Physicsl Activity at Work
Heavy
Rural Urban
Moderate 76 38.6 92 28.9
Slight 77 27.0 145 41.8
II Sedentary 19 9.9 69 22.7
Subtotal 21 3 100 325 100
Refusal O O O -
Not answered 1 O 1 -
Total 214 - 326 -
X2 = 53.915a df = 3 p<0.0001
'Weighted percentages were used to complete statistical testing

4.5.2.2.f. Lower lntensity
According to chi-square analysis, area of residence had no significant association
with frequency of lower intensity leisure tirne physical activities (pr0.147) (Table 29).
However, a slightly higher percentage of rural residents (64%) reported spending
more than three times per week at lower intensity leisure physical activities versus
urban residents (55%). Area of residence also showed no association with duration
of lower intensity leisure physical activities (p=0.286) (Table 30).
4.5.2.2.2. Higher lntensity
According to chi-square analysis, area of residence had no association with
freq uency of hig her intensity leisure time physical activities (p=0.05) (Table 31 ).
However, a slightly higher percentage of respondents from rural areas (32%)
reported that they spent more than three times a week perfoming higher intensity
leisure physical activities in comparison to respondents from urban areas (24%).
Table 32 shows the relationship between area of residence and duration of higher
intensity p hysical activities during leisure üme. Chi-square analysis revealed that
there was no significant relationship between area of residence and duration of
hig her intensity leisure time physical activity (p=O. 1 10).
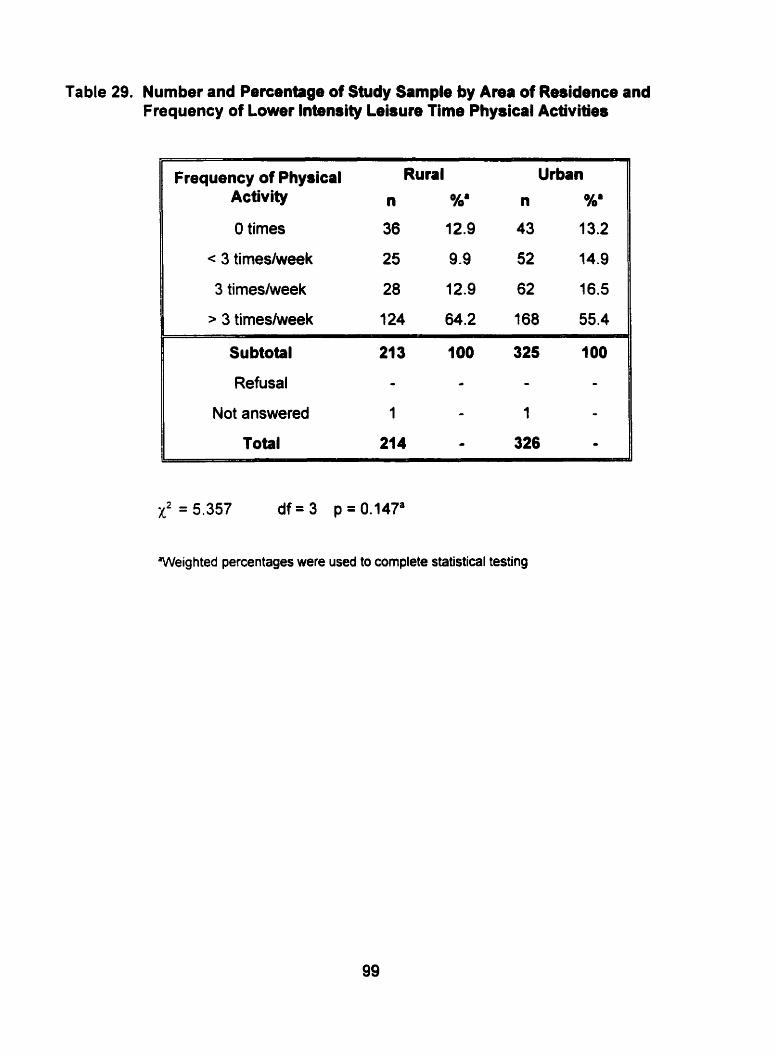
Table 29. Number and Percentage of Study Sample by Area of Residence and Frequency of Lower lntensity Leisuie Time ~hysical Activities
Frequency of Physical Rural Urban Activity n %a n %'
O times 36 12.9 43 13.2
< 3 timesheek 25 9 -9 52 14.9
3 timeslweek 28 12.9 62 16.5
> 3 timesfweek 3 24 64.2 168 55.4
Subtotal 21 3 100 325 1 O0
Refusal - - - -
Not answered 1 - 1 - Total 214 - 326 O
x2 = 5.357 d f = 3 p=0.147'
Weighted percentages were used to cornplete statistical testing
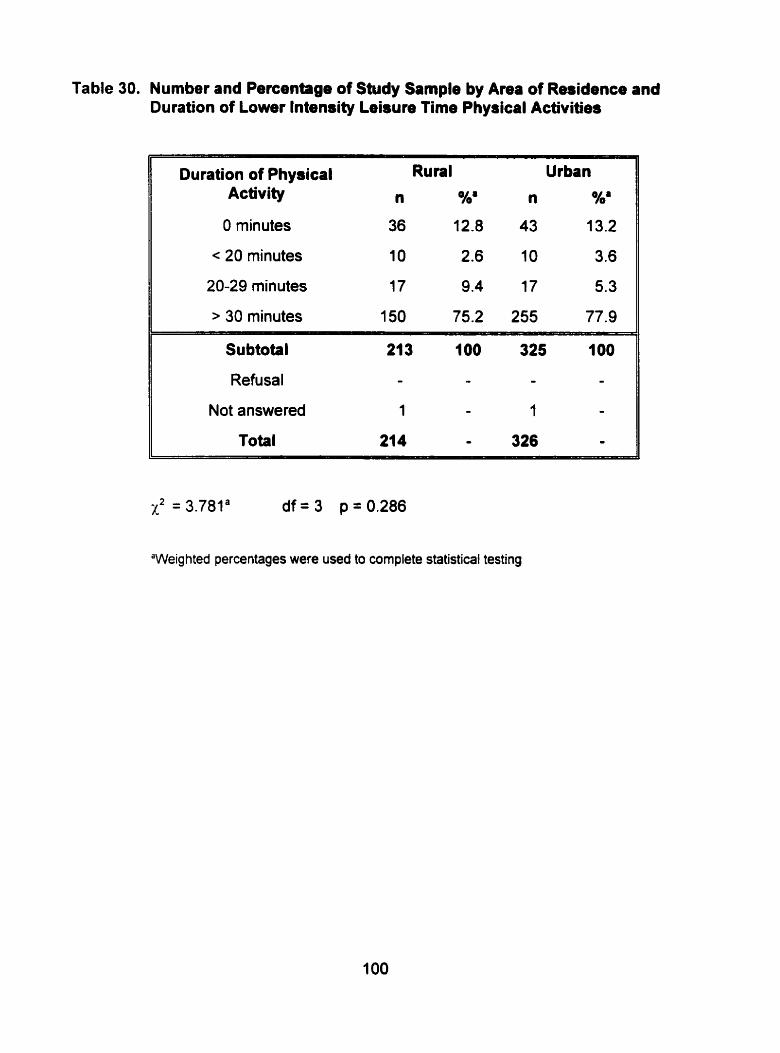
Table 30. Number and Percentage of Study Sample by Area of Residence and Duration of Lower Intendty Leisure Tirne Physical Activities
Duration of PhysicaI Rural Urban Activity n n %'
O minutes 36 12.8 43 13.2
c 20 minutes 10 2.6 10 3.6
20-29 minutes 17 9.4 17 5.3
> 30 minutes 150 75.2 255 77.9
Subtotal 213 1 O0 325 100
Refusal - - - - Not answered 1 - 1 -
Total 214 - 326 -
x2 = 3.781' d f = 3 p=0.286
'Weighted percentages were used to complete statistical testing
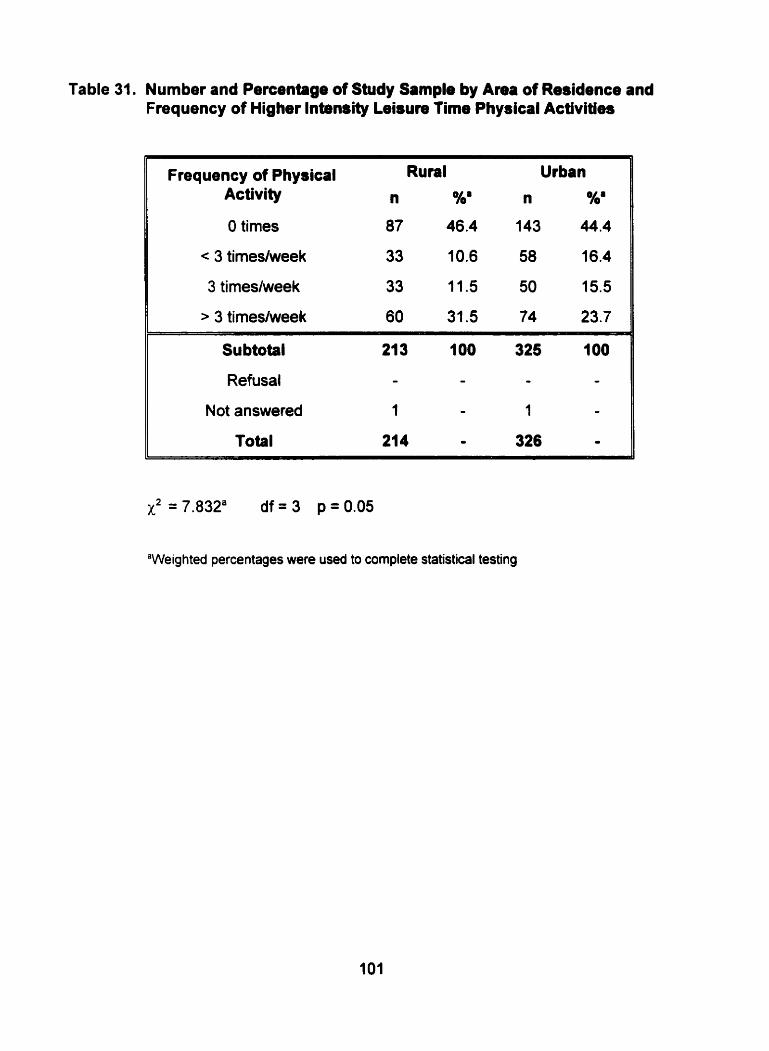
Table 31. Number and Percrntage of Study Sample by Area of Residence and Frequency of Higher lntensity Leisure Time Physical Activities
Frequency of Physical Rural Urban Activity n %' n %'
O times 87 46.4 143 44.4
< 3 timeslweek 33 10.6 58 16.4
3 timeslweek 33 11.5 50 15.5
> 3 timeshrveek 60 31.5 74 23.7
X2 = 7.832' df = 3 p = 0.05
"Weighted percentages were used to complete statistical testing
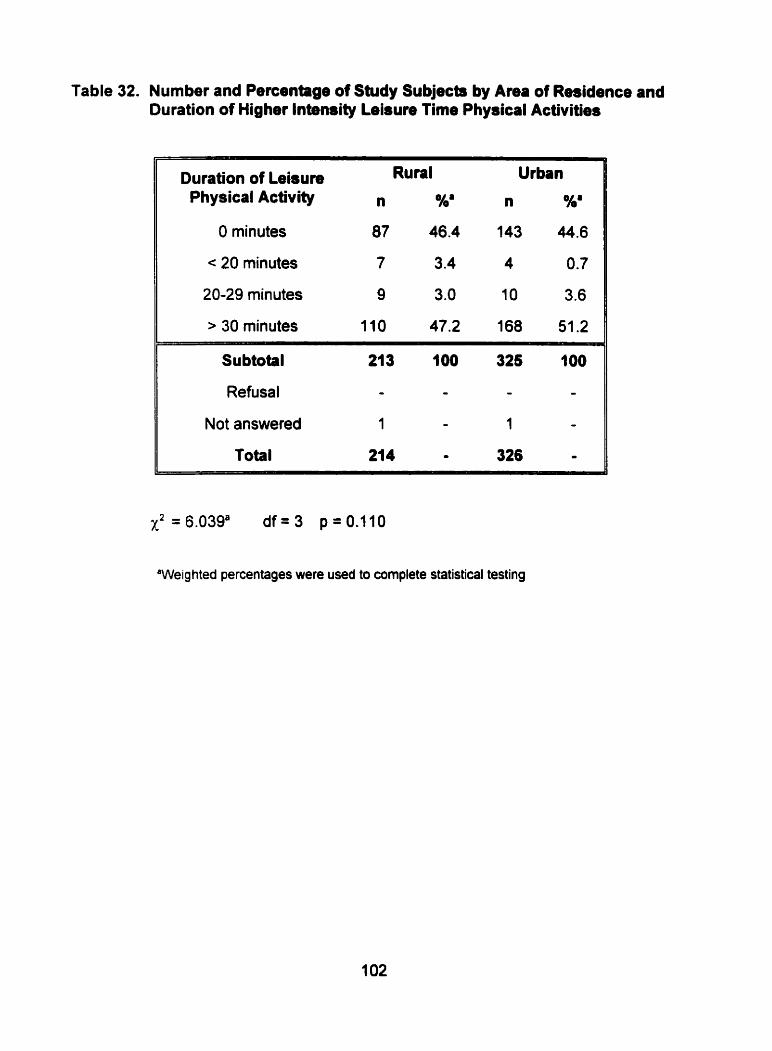
Table 32. Number and Percentage of Study Subjects by Area of Residence and Duration of Higher Intensity Leisure Time Physical Acüvities
Duration of Leisure Rural Urban Physical Activity n %' n %'
O minutes 87 46.4 143 44.6
< 20 minutes 7 3.4 4 0.7
20-29 minutes 9 3.0 10 3.6
> 30 minutes 110 47.2 168 51.2
Subtotal 21 3 100 325 100
Refusal - - - -
Not answered 1 - 1 -
Total 214 O 326 -
X2=6.039a d f = 3 p-0.110
'Weig hted percentages were used to cornplete statistical testing
4.5.3. Smoking Habits and Area of Residence
Data presented in Table 33 on the smoking habits of rural and urôan residents was
analyzed by the chi-square test. No relationship existed between being a regular
smoker and living in a rural or urban community (~~0.208).
The t-test of independent means was perfomed ta determine the relationship
between area of residence and actual smoking number (Table 34). No significant
relationship was detected between the actual number of cigarettes smoked per day
by regular smokers and area of residence (p=0.164).
4.6. Effect of Socioeconomic Factors on Risk of Development of Cardiovascular Disease
Logistic regression analysis was perfomed to determine if a relationship existed
between education and household income and the prevalence of cardiovascular risk
factors, age, gender and area of residence of the study subjects.
4.6.1. Body Fat
Ordinal logistic regression was computed to detemine the relationship between body
mass index with age, gender. education and household income. The results of this
analysis are presented in Table 35. Since the independent variables are categorical,
one category in each of the independent variables is used as a reference to create a
cornparison amongst the other categories within the same variable.

Table 33. Number and Percentage of Study Sample by Ama of Residence and Smoking Habits
Rural Urban Regular SmokeP
n %b n %b
Yes 75 43.0 112 37.6
No 139 57.0 214 62.4
Total 214 IO0 326 100
x2 = 1 .582b df = 1 p = 0.208
"Regular smoker - at least 1 cigarettelday
'Weighted percentages were used to complete statistical testing
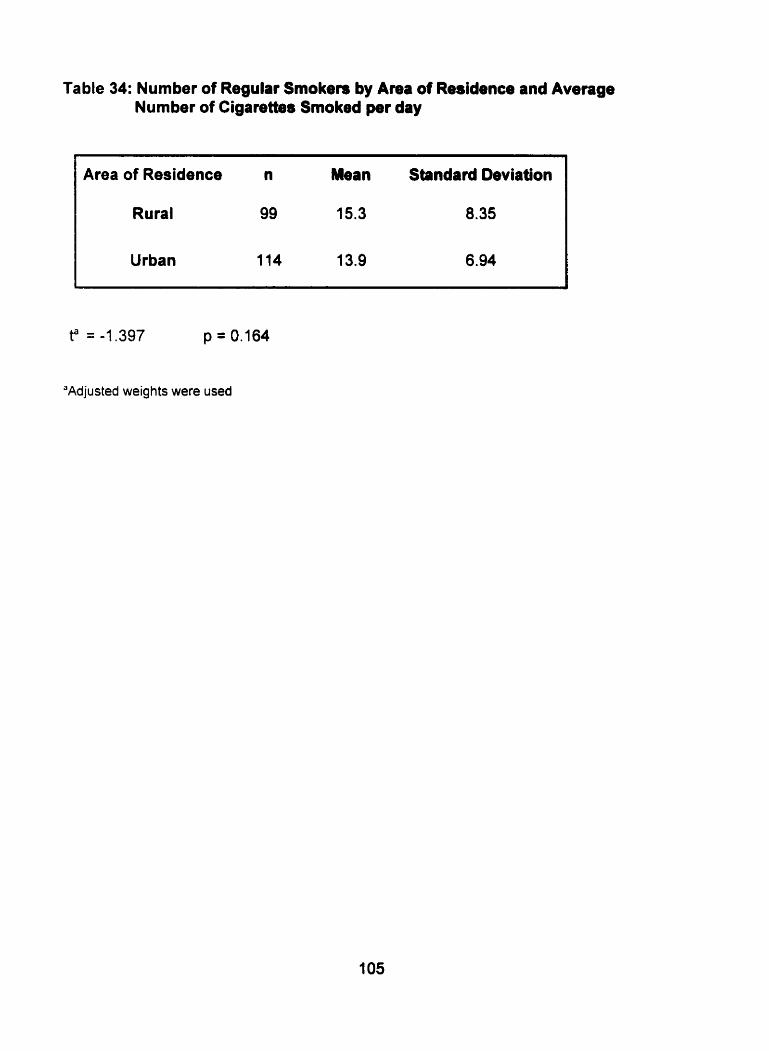
Table 34: Number of Regulai Smokers by A m of Residence and Average Number of Cigarettes Smoked per day
Area of Residence n Mean Standard Deviation
Rural 99 15.3 8.35
Urban 114 13.9 6.94
"Adjusted weights were used
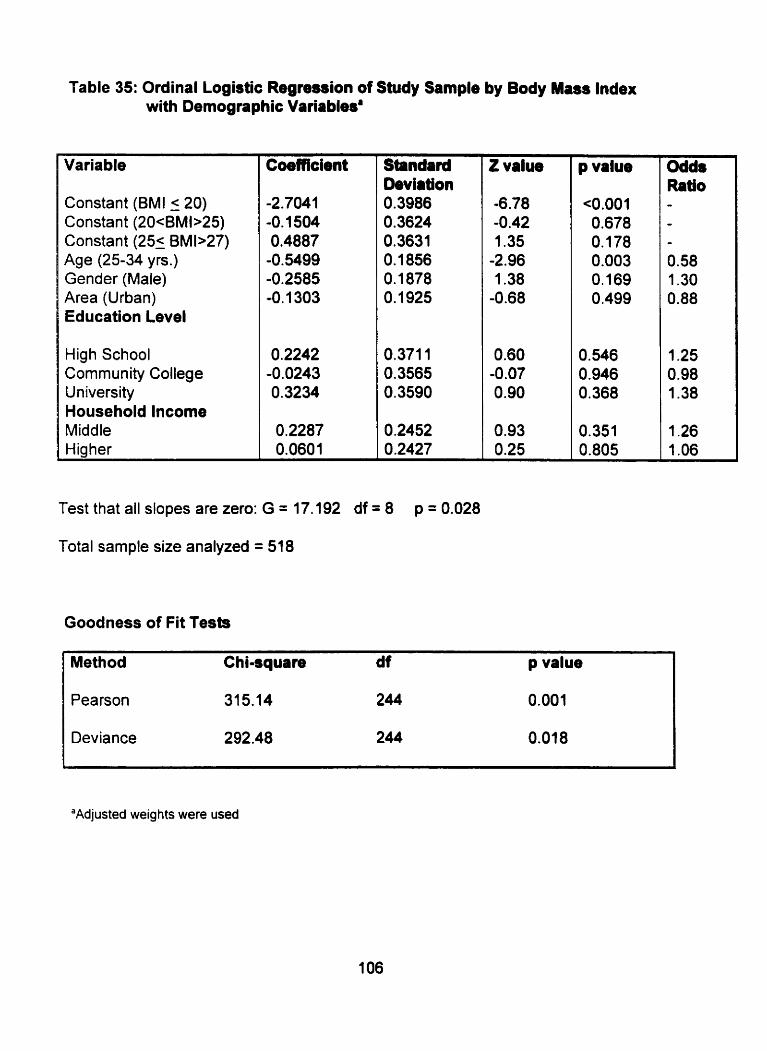
Table 35: Ordinal Logistic Regression of Study Sample by Body Mass Index with Demognphic Variablesa
Variable
Constant (BMI ( 20) Constant (20cBMb25) Constant (25- BMb27) Age (25-34 yrs.) Gender (Male) Area (Urban) Education Level
High School Community College University Household lncome Middle tiiaher
Coefficient Standard Deviation 0.3986 O. 3624 0.3631 0.1856 O. 1878 0.1925
0,371 1 0.3565 0.3590
0.2452 0.2427
Test that al1 slopes are zero: G = 17.192 df = 8 p = 0.028
Total sample size analyzed = 518
Goodness of Fit Tests
Z value
-6.78 -0.42 1.35
-2.96 1.38
-0.68
0.60 -0.07 0.90
0.93 0.25
p value
<0,001 0.678 O, 178 0.003 O. 169 0.499
0.546 0.946 0.368
0.351 0.805
Odds Ratio - - *
0.58 1.30 0.88
1.25 0.98 1.38
1.26 1 .O6
Method Chiaquare df p value
Pearson 315.14 244 0.001
Deviance 292.48 244 0.018
"Adjusted weig hts were used

Thus, the 18-24 year old subgroup, the female subgroup and the rural resident
subgroup is used as a comparison with the 25-34 year old subgroup, the male
subgroup and the urban resident subgroup respectively. Furthemiore. the
elementary level of education is used as a comparison with the other levels of
education and lower household income is used as a comparison with the other
levels of household income.
The results from the Goodness-of-Fit Tests suggests that the model does not fit
the data adequately since a p-value from the Pearson test was 0.001 and a
p-value from the Deviance test was 0.018 (Table 35). The results from the logistic
regression table also revealed a p-value of 0.028 from the G-test. This suggests
that at least one of the coefficients was significantly different from zero. It was
revealed that the aga of the study subjects was the only variable that had a
significant association with body mass index (p=0.003) (Table 35).
4.6.2. Physical Activity
Ordinal logistic regression was computed to determine the relationship between
physical activity at work with age, gender, area, education and household income.
Ordinal logistic regression was also computed to determine the relationship between
duration and frequency of leisure time physical activity.
4.6.2.1. Physical Activity at Work
The results of ordinal logistic regression can be observed in Table 36. In regards to
the overall fit of the model, the Pearson chi-square test (Goodness-of FR Test)
deterrnined a p value of 0.081 and the Deviance test revealed a p-value of 0.096.
This reveals that the model fit the data adequately. The results from the G tests
revealed a p-value of < 0.0001. This suggests that at least one of the coefficients
tested had an affect on physical activity at work or added to the fit of the model. It
appears that gender, area and education contributed to the fit of the model.
4.6.2.2. Physical Activity during Lebure Time
Ordinal Logistic Regression was calculated for both lower and higher intensity levels
of leisure tirne physical activity.
4.6.2.2.1. Lower lntensity
The relationship between frequency of lower intensity physical activity during leisure
tirne and age, gender, area of residence, education and household income can be
observed in Table 37. On the basis of the overall fit of the model, a p-value of 0.89
was obtained from the Pearson test and a p-value of 0.535 was obtained from the
Deviance test. This revealed that the data fit the model adequately. The results
from the G-test suggested that at least one of the coefficients was not equal to zero.
(p < 0.0001). This may be explained by a significant relationship between age,
gender, area of residence, education and household income and duration of lower
intensity physical activity.
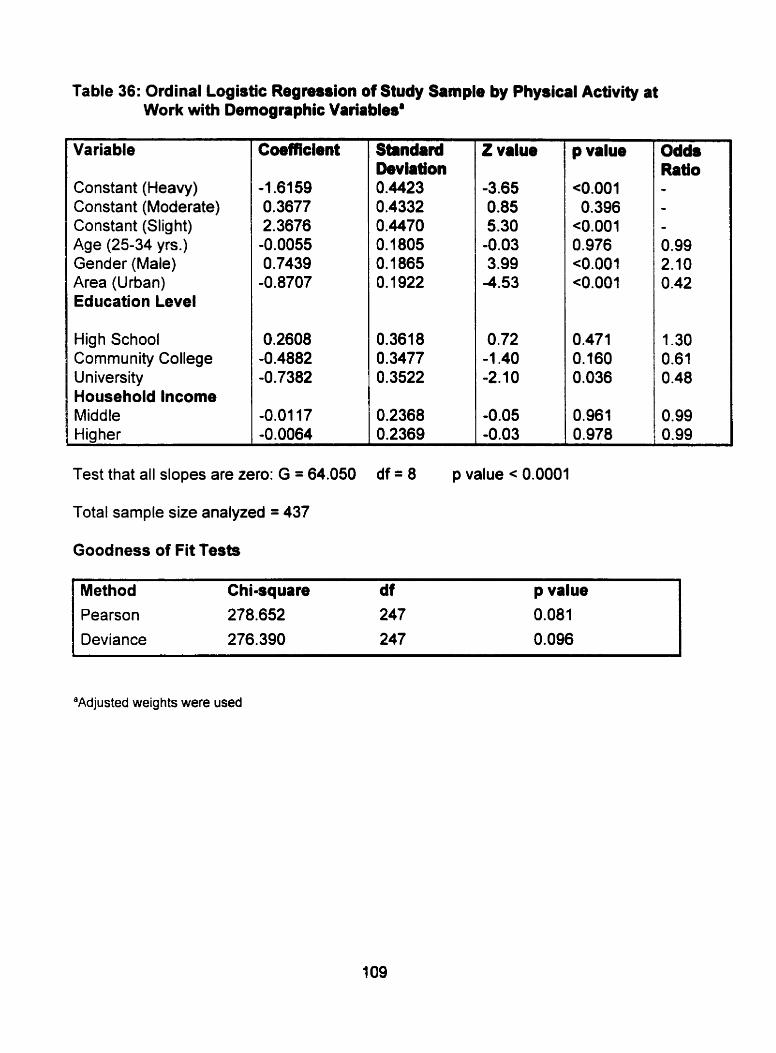
Table 36: Ordinal Logistic Regreuion of Study Sampb by Physical Activity at Work with Demographic Variablesa
Variable
Constant (Heavy) Constant (Moderate) Constant (Slig ht) Age (25-34 yrs.) Gender (Male) Area (Urban) Education Level
High School Community College University Household lncome Middle Higher
Coefficient
Test that al1 dopes are zero: G = 64.050
Total sarnple size analyzed = 437
Goodness of Fit Tests
Standard Deviation 0.4423 0.4332 0.4470 0.1805 0.1865 0.1 922
0.361 8 0.3477 0.3522
0.2368 0.2369
Z value
-3.65 0.85 5.30
-0.03 3.99
-4.53
O .72 -1.40 -2.10
-0.05 -0.03
p value
<0.001 0.396
<0.001 0.976 <0.001 <O.OOl
0.471 0.160 0.036
0.961 0.978
Odds Ratio
- O. 99 2.1 O 0.42
1.30 0.61 0 -48
0.99 0.99
Method Chi-square d f p value Pearson 278.652 247 0.081
Deviance 276.390 247 0.096
"Adjusted weights were used

Table 37: Ordinal Logistic R e g m i o n of Study Sample by Frequency of Lower lntensity Leisure Time Physical Activities with ~emogra~hic Varia bled
Variable
Constant(0 tirne) Constant(c3 timeshnrk) Constant(3 timeslwk) Age (25-34 yrs.) Gender (Male) Area (Urban Education Level
High School Community College University Household lncome Middle Hig her
Coefficient Standard Deviation 0.3814 0.374 1 0.3727 0.1884 0.1903 0.1971
O. 3776 0.3682 0.3678
0.2585 0.2586
z value -4.09 -1.88 0.20
-2.62 -3.50 -0.61
0.15 -0.93 -0.72
2.28 4.00
P value <0.001 0.06 1 0.840 0.009
<0.001 O. 542
0.879 0.352 0.471
0.023 <0.001
Odds Ratio - - - 0.61 0.51 1 . l 3
1 .O6 0.71 O. 77
1.80 2.81
Test that al1 slopes are zero: G = 40.893 df = 8 p value c 0.0001
Total sample size analyzed = 437
Goodness of Fit Tests
*
Method Chi-squrre d f p value Pearson 21 9.786 247 0.893
Deviance 244.367 247 0.535
"Adjusted weights were used
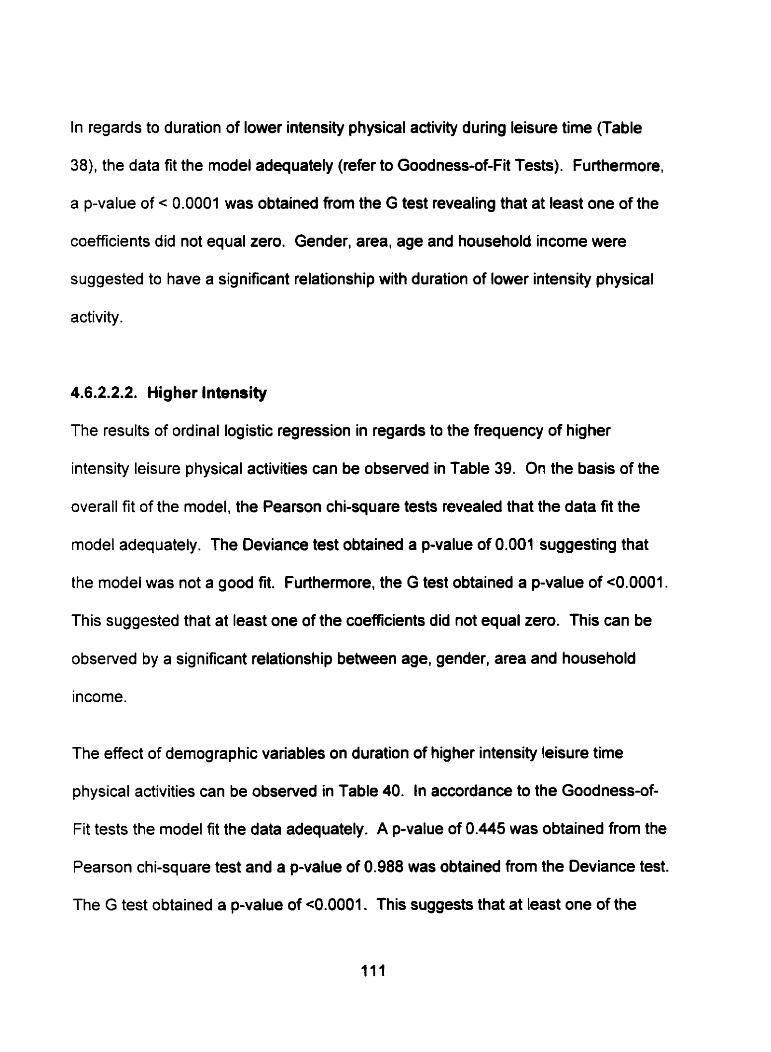
In regards to duration of lower intensity physical activity during leisure time (Table
38), the data fit the model adequately (refer to Goodness-of-Fit Tests). Furthemiore,
a p-value of < 0.0001 was obtained from the G test revealing that at least one of the
coefficients did not equal zero. Gender, area, age and household income were
suggested to have a significant relationship with duration of lower intensity physical
activity.
4.6.2.2.2. Hig her lntensity
The results of ordinal logistic regression in regards to the frequency of higher
intensity leisure physical activities can be observed in Table 39. On the basis of the
overall fit of the model, the Pearson chi-square tests revealed that the data fit the
model adequately. The Deviance test obtained a p-value of 0.001 suggesting that
the model was not a good fit. Furthemore. the G test obtained a p-value of <0.0001.
This suggested that at least one of the coefficients did not equal zero. This can be
observed by a significant relationship between age, gender, area and household
income.
The effect of demographic variables on duration of higher intensity leisure time
physical activities can be observed in Table 40. In accordance to the Goodness-of-
Fit tests the model fit the data adequately. A p-value of 0.445 was obtained from the
Pearson chi-square test and a p-value of 0.988 was obtained from the Deviance test.
The G test obtained a p-value of e0.0001. This suggests that at least one of the
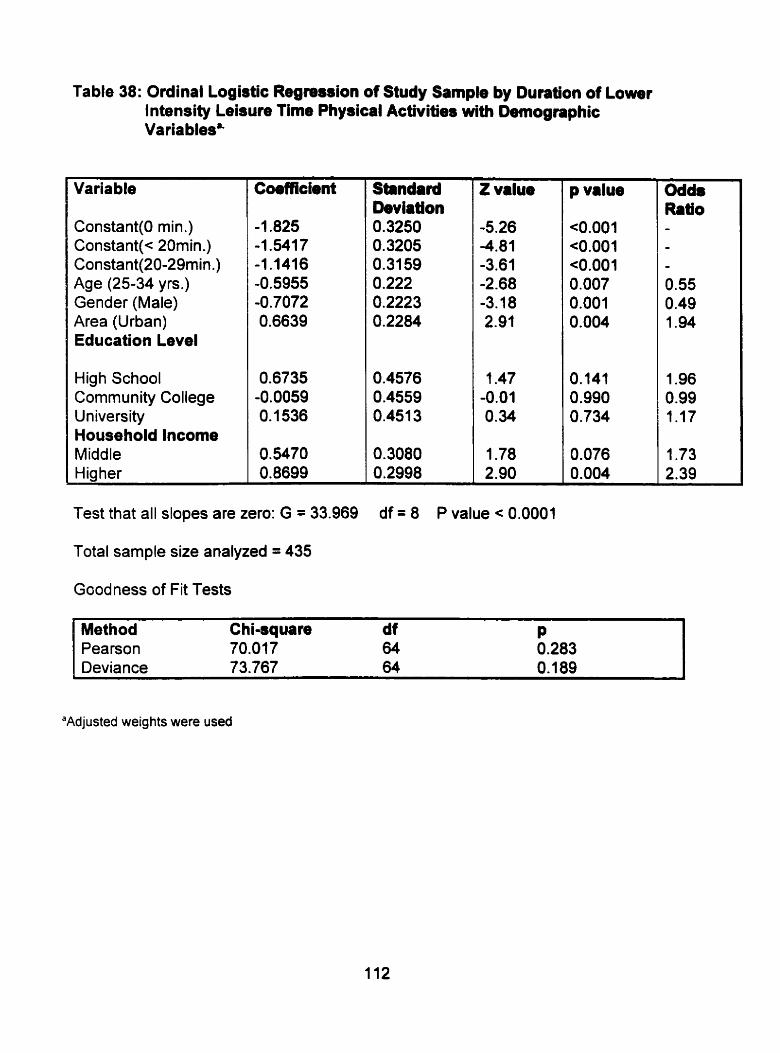
Table 38: Ordinal Logistic Regression of Study Sample by Duration of Lower Intendty Leisure Time Physical Activities with Detnographic Varia bles8-
Variable
Constant(0 min .) Constant(< 20rnin.) Constant(20-29min.) Age (25-34 yrs.) Gender (Male) Area (Urban) Education Level
High School Community College University Household lncome Middle Hig her
Test that al1 slopes are zero: G = 33.969
Total sample size analyzed = 435
Goodness of Fit Tests
Standard beviation 0.3250 0.3205 0.31 59 0.222 0.2223 0.2284
0.4576 0.4559 0.451 3
0.3080 0.2998
Z value
-5.26 -4.81 -3.61 -2.68 -3.1 8 2.91
1.47 -0.01 0.34
1.78 2.90
p value
<O.OOl <0.001 c0.001 0.007 0.001 0.004
0.141 0.990 0.734
0.076 0.004
Odds Ratio - - - 0.55 0.49 1.94
1.96 0.99 1 . l 7
1.73 2.39
I
Method Chi-square df P Pearson 70.077 64 0.283 Deviance 73.767 64 0.189
"Adjusted weights were used
Table 39: Ordinal Logistic Regremion of Study Sample by Frequency of Higher lntensity Leisure Time Physical Activities with Demographic Variables'
Variable
Constant(0 time) Constant(c3tirneslwk) Constant(3 timeslwk) Age (25-34 yrs.) Gender (Male) Area (Urban) Education Level
High School Community College University Household lncome Middle Hiciher
Coefficient Standard Deviaîion 0.3677 0.3691 0.3737 0.1 836 0.1853 0.1919
0.3750 0.3608 0.3622
O. 2446 0.2458
Z value
-0.1 7 1.88 3.85 3.63
-3.28 2.69
-0.29 -0.29 -1 2 4
-2.45 -3.86
Odds Ratio -
- t .95 0.55 1.68
0.90 0.90 0.64
0.55 0.39
Test that al1 slopes are zero: G = 58.085 df = 8 p value < 0.0001
Total sample size analyzed = 435
Goodness of Fit Test
Method Chiaquare df p value Pearson 268.983 247 0.161 Deviance 296.344 247 0.01 7
'~djusted weights were used
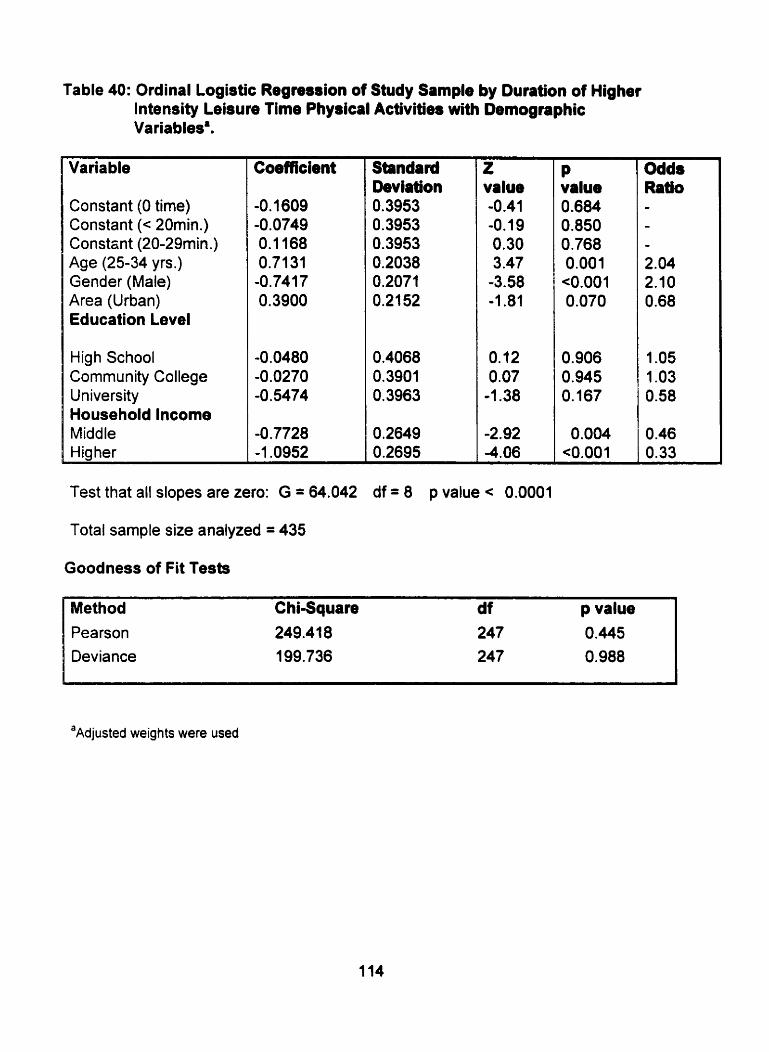
Table 40: Ordinal Logisüc Regnssion of Study Sample by Duration of Higher lntensity Leisure Time Physical Activities with ~emognphic
-
Variable
Constant (O time) Constant (< 20min.) Constont (20-29min.) Age (25-34 yrs.) Gender (Male) Area (Urban) Education Level
High School Community College University Household lncome Middle Higher
Coefficient Standard Deviation 0.3953 0.3953 0.3953 0.2038 0.2071 0.21 52
0,4068 0.3901 0.3963
0,2649 0.2695
z value -0.41 -0.19 0.30 3.47
-3.58 -1.81
0.12 0.07
-1.38
-2.92 -4.06
Test that al1 slopes are zero: G = 64.042 df = 8 p value < 0.0001
Total sample size analyzed = 435
Goodness of Fit Tests
P value 0.684 0.850 0.768 0.001 <0.001 0.070
0.906 0.945 O. 167
0.004 <0.001
Odds Ratio - - - 2.04 2.10 0.68
1 .O5 1 .O3 0.58
O .46 0.33
Method ChiSquare d f p value Pearson 249.41 8 247 0.445 Deviance 199.736 247 0.988
a~djusted weights were used
variables within the modei had a significant association with duration of higher
intensity leisure time physical activity.
4.6.3. Smoking Habits
Binary logistic regression was conducted to determine the relationship between
regular smokers and age, gender, area or residence, education and household
income (Table 41). On the basis of the overall model, the data do not fit adequately
since a p-value of 0.04 was obtained for the Pearson chi-square test and a p-value of
0.002 was obtained for the Deviance chi-square test. However, a p-value of <0.001
was obtained from the G test suggesting that at least one of the coefficients was not
equal to zero. This reveals that at least one of the variables and in this case
education had a significant association with regular smokers.
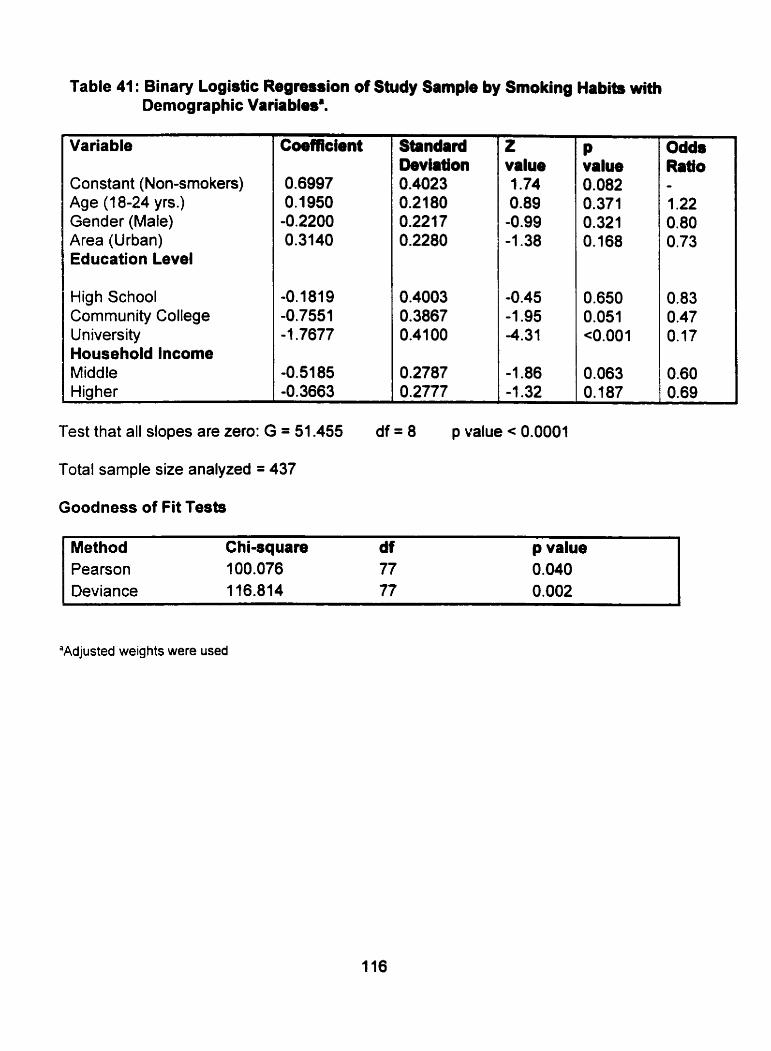
Table 41: Binary Logistic Regression of Study Sample by Smoking Habits with Demographic Variablesa.
Variable
Constant (Non-srnokers) Age (1 8-24 yrs.) Gender (Male) Area (Urban) Education Level
High School Comrnunity College University Household lncome Middle Higher
Coefficient z value 1.74 0.89 -0.99 -1.38
Test that al1 dopes are zero: G = 51.455 df = 8 p value < 0.0001
Total sample size analyzed = 437
Goodness of Fit Tests
Method Chiaquare df p value Pearson 100.076 77 0.040 Deviance 116.814 77 0.002
P value 0.082 0.371 0.321 O. 168
'Adjusted weights were used
Odds Ratio - 1.22 0.80 0.73
CHAPTER V
DISCUSSION
5.1. Introduction of Discussion
This discussion provides an evaluation of the results obtained from the research
study. This was accomplished through a comparison of the results of the
research study with those of other research papers that discuss similar studies of
interest. This discussion will also provide a comparison of the results of the
research study with those obtained from the Nova Scotia Nutrition Survey and
the Canadian Heart Health Survey.
5.1.1. Nova Scotia Nutrition Survey
The Nova Scotia Nutrition Survey was conducted in the spring and fall of 1990.
The Newfoundland and Labrador Nutrition study came about as a result of the
Nova Scotia Heart Health Survey and the Newfoundland and Labrador Heart
Health Survey. These latter surveys revealed that most Nova Scotia and
Newfoundland residents lacked an understanding of the importance of a healthy
diet. Furthermore, there was a high prevalence of risk factors of CVD that were
related to diet such as hypercholesterolemia. hypertension and obesw. The
results frorn these two surveys suggested a need for an indepth look into the
nutritional status and heaithy eating habits of Nova Scotia and Newfoundland
residents (Nova Scotia Heart Health Program, 1993; Newfoundland Department
of Health and National Health and Welfare, 1990).
The aim of the Nova Scotia Nutrition Survey was to conduct an extensive food
consumption survey to detennine the dietary habits, nutrient intakes and
nutritional attitudes and knowledge of residents of Nova Scotia. It was
anticipated that the Nova Scotia Nutrition Survey would act as a model for the
developrnent and implementation of other nutrition suweys conducted in
provinces throughout Canada. As a result, the protocol of the Nova Scotia
Nutrition Survey was utilized to design and implement the Newfoundland and
Labrador Nutrition Survey (Nova Scotia Heart Health Program, 1993).
The final report of the Nova Scotia Nutrition Survey combined findings on al1
young adults and presented the data on 18-34 year olds. Therefore, when the
results of the Nova Scotia Nutrition Survey and the Newfoundland and Labrador
Nutrition Survey are compared, the researcher will consider the results of the
entire study sample (18-24 and 25-34 year olds combined) of the Newfoundland
and Labrador study.
5.1.2. Canadian Heart Healtti Initiative
Nine Canadian provincial Heart Health Surveys were conducted between 1 986
and 1992. The purpose of these surveys was to determine the prevalenœ of
CVD risk factors and the level of CVD knowledge of Canadians. The results from
these surveys were compiled and an epidemiological and CVD risk database
was developed to altow for the dissemination of information for health promotion
programs throughout Canada (Maclean et al., 1992).
These surveys analyzed the health status of 18-74 year old non-institutionalized
male and fernale citizens of Canada. The surveys obtained information on the
attitudes, health-related knowledge and CVD risk factor prevalence of
Canadians. This information was obtained by conducting in-home interviews in
which blood pressure measures, blood sarnples and anthropometric measures
were taken.
The reçults from the Canadian Heart Health Survey were reported by individual
provinces, regions and total health status's of Canadians. As a result, a
cornparison of the health status of young adults aged 18-34 yean who
participated in the Newfoundland and Labrador Nutrition survey will be compared
with the health status of young Canadian adults aged 18-34 years and with
particular regions and provinces where it is applicable.
5.2. Response Rate
The response rate of this study was calculated as in the Nova Scotia Nutrition
Survey and the Newfoundland and Labrador Heart Health Survey (Newfoundland
Department of Health and National Health and Welfare, 1990; Nova Scotia Heart
Health Program, 1 993). Fifty-seven percent of males aged 1 8-34 years who
were located and 68% of females aged 18-34 years who were located,
participated in al1 aspects of the Newfoundland Heart Health Sunrey. A slightly
lower response rate was obtained in the Newfoundland and Labrador Nutrition

Survey. The overall response rate of the subgroup was 52%. Furthemore, 44%
of 1 8-24 year old males, 46% of 25-34 year old males, 57% of 18-24! year old
females and 58% of 25-34 year old females who were locateâ participated in the
Newfoundland and Labrador Nutrition Survey .
The Newfoundland and Labrador medical insurance register was utilized as a
sarnpling frame for the Newfoundland and Labrador Nutrition Survey. It contains
the names, addresses, and dates of births of every resident of Newfoundland
and Labrador who is covered by the provincial health care system. However, this
register has no systematic method to delete individuals from the register who
have died or moved away from the province. Thus, approximately fifty percent of
the addresses in the file are out-of-date (Nargundkar, 1996). This contributed
su bstantially to the hig h number of ineligible subjects. Interviewers of the
Nutrition Newfoundland and Labrador Survey would categorize a person as
ineligible if they contacted the subject's original place of residence and were
informed that they no longer resided there. If the addresses contained in the
medical insurance register were accurate a lower number of ineligible subjects
would have been obtained. As well, the total response rate would have been
hig her since subjects would have been selected from the files that did reside in
Newfoundland and Labrador.
Another factor contributing to the relatively low response could be the age of the
subjects. Studies have demonstrated that the probability of locating subjects is
higher for older than younger aged groups. Eastwood. Gregor, Maclean and
Wolf (1 996) assessed participation rates, response bias and CVD risk factor
est imates from two cardiovascular surveys (Nova Scotia Heart Health Survey
and the MONICA Survey). Eastwood's group revealed that the probability of
locating a subject increased with age. The study showed a probability of 0.39 for
locating individuals in the 25-35 year old category and a probability of 0.65 for
locating individuals in the 55-64 year old category. Research suggests that this
may be a result of a more transient lifestyle being exhibited by younger age
groups (Travers, 1996).
Bias rnay have been introduced as some studies reveal respondents of surveys
are usually healthier and lead healthier lifestyles than non-respondents of
surveys (Criqui, Barrett-Connor & Austin, 1978). Considering the fact that this
was a nutrition survey, it might be assumed that participants who were more
concerned or interested in their health status participated in the survey more than
others who were not as concerned about their health status.
Approximately 80% of young adults (18-34 yrs.) located for the Nova Scotia
Nutrition Survey participated in the study. This was slightly higher than the
response rate of the Newfoundland and Labrador Nutrition Survey. It was
suspected that the response rates of the Nova Scotia Nutrition Survey would be
hig her than those of the Newfoundland Survey since the Nova Scotia Medical
Services Insurance Pian file is out-of-date by only 25% (Maclean, et al., 1992).
5.3. Characteristics of the Study Sample
The study sample for the Nutrition Newfoundland and Labrador Survey included
non-institutionalized males and females between the ages of 18-24 years and
25-34 years. Figure 1 reveals that there was a higher number of respondents
who were in the 25-34 year old category as compared to the 18-24 year old
category. This was true for both rural and urban areas (Figures 2 and 3). This
population trend may be explained by the fact that there was a higher number of
25-34 year olds (85,040) living in Newfoundland in 1996 as cornpared to 18-24
year olds (6 1 ,150) (Statistics Canada, 1 998).
Figure 4 shows that there was a larger number of young female adult
respondents versus young male adult respondents. This population distribution
was also present in both rural and urban areas (Figures 5 and 6). According to
the 1996 Census, a higher number of females, aged 18 - 34 yean (74,180), was
living in Newfoundland and Labrador in 1996 as compared to males, aged 18-34
years (72,015) (Statistics Canada, 1998).
Data collection of the Newfoundland and Labrador survey allowed for seasonal
variation and interviews were conducted seven days a week. This provided an
equal opportunity for all individuals who were selected to participate in the
survey. However, there were a hig her percentage of males as compared to
females who were ernployed outside the household. Reports from the
Newfoundland and Labrador Centre for Health Information (1 998) reveals that
145.680 males and 1 12,850 females were employed in Newfoundland and

Labrador in 1991. Even though the interviewers of the Nutrition Newfoundland
and Labrador Survey conducted surveys during any time of the day and night it is
appropriate to suggest that females had a better opportunity to participate in the
survey than males since they were available more often.
This trend was also obsewed in the Nova Scotia Nutrition Survey. There were a
slig htly larger number of young female respondents as compared to young male
respondents. However, according to the 1996 Census, there were also a larger
number of 18-34 year old females (1 13, 669) living in Nova Scotia in cornparison
to 18-34 year old males (1 10,435) (Statistics Canada, 1998).
The most cornmonly reported level of education attained by the overall study
sample was university (Figure 7). A small proportion of the population attained
only an elernentary level of education. Young adults living in rural areas were
less likely to have post secondary education such as university (Figure 8). Most
young adults who are receiving post secondary education are residing in urban
areas such as St. John's, Grand Falls and Corner Brook (Figure 8) due to the
fact that mast educational institutions that provide post secondary instruction are
found in these centers.
Typically, the Newfoundland and Labrador population has lower education
attainment than the rest of Canada. In 1994i95, 35% of Newfoundlanders and
Labradorians had attained some secondary education (highest level of education
obtained) as compared to 24.2% of the Canadian population. Furthemore, 4.6%
of residents of Newfoundland and Labrador and 9.2% of residents of Canada had

a Bachelor degree (Newfoundland and Labrador Centre for Health Information,
1998). When comparing the educational attainment of Newfoundland residents
in 1994, the results of the educational attainment of participants of the
Newfoundland and Labrador Nutrition Survey were higher than expected.
Possibly higher educated residents of Newfoundland and Labrador were more
likely to respond to the Nutrition Survey.
Millar and Wigle (1986) reported that individuals with a high level of educational
attainment have a decreased risk of CVD development. Research suggests that
less educated groups have an increased prevalence of hypertension. cigarette
smoking and h ypercholesterolemia (Win kleby, Jatulis, Frank & Fortmann, 1 992).
Education level does not appear to be associated with the presence of CVD risk
factors in this study.
The education levels of young adult respondents of the Newfoundland and
Labrador Nutrition Study cannot be cornpared to young adult respondents of the
Nova Scotia Nutrition Survey and the Canadian Heart Health Surveys. This is
because only the educational attainment of the entire study population of the
Nova Scotia and Canadian Heart Health study was reported rather than the
educational attainrnent of young adults.
The most commonly reported level of household income received by young
adults of the overall study sample was medium (Table 6). This result was not
expected since Newfoundland and Labrador has a higher percentage of low-
income families than the average Canadian family (Neville, Buehler, James &
Edwards, 1994). Furthemore, there is a high unernployment rate for young
aduits living in Newfoundland and Labrador. In 1996. 29% of 15-24 year old and
20% of 25-34 year old Newfoundland and Labrador residents were unemployed.
As compared to the national average, 16.1 % of 15-24 year old and 9.9% of 25-34
year old Canadians in 1996 were unemployed (Statistics Canada, 1998).
However, the source of household incorne of participants of the Newfoundland
and Labrador Survey was not investigated, nor was it asked if the participants
were the primary source of income for the household. If an 1 byear-old living at
home was interviewed and not employed yet his/her parent(s) were receiving a
high level of income, that individual would have been categorized as having a
hig h household income.
In regards to area of residence, a higher number of urban residents were more
likely to receive a higher level of household income as compared to rural
residents living in Newfoundland and Labrador (Table 6). This may be because
many rural residents have seasonally based jobs (commercial fishery) while
urban residents are typically employed year round. Results from the Adult Health
Survey in 1995 revealed that 53% of St. John's residents were employed year
round as compared to 27.8% of Newfoundland residents living in areas oveneen
by the Northern community health board (mainly rural areas) (Segovia. Edwards
& Bartlett, 1996).
Research suggests that individuals receiving lower incomes have an increased
risk for CVD mortality as compared to their higher income counterparts (Lynch,
Kaplan, Cohen, Tuomilehto 8 Salonen, 1996). However, the researcher was
unable to investigate the incomes of each individual participant. Thus, the
income of non-participating individuals living at the participant's place of
residence may have had an effect on the household income variable.
Household income levels of respondents of the Nova Scotia Nutrition Survey
were also determined by considering total household incomes. Unfottunately,
the household income of the entire population of the Nova Scotia Nutrition
Survey was reported. Thus, the researcher was unable to compare the income
levels of young adults studied in Newfoundland and Nova Scotia. This was also
the case for the Canadian Heart Health Study.
As shown in Table 6 (total number of respondents in urban and rural areas), a
higher percentage of urban residents participated in the Newfoundland and
Labrador Nutrition Survey as compared to rural residents. This may be because
it was easier to locate individuals living in the more populated areas. In certain
rural communities interviewers were asked to interview individuals that were
residing in a different community. As a result, intenriewers may have
encountered more difficulties in conducting interviews due to location. conflicting
time schedules and travel logistics
5.4. Prevalence of Cardiovascular Disease Risk Factors of the Study Sample
Cardiovascular disease is the leading cause of morbidity and mortality in
Newfoundland and Labrador (Heart and Stroke Foundation of Canada, 1997).
There are a number of modifiable risk factors that affect the development of
card iovascular d isease. These include body size, physical inactivity and
cigarette smoking.
5.4.1. Body Sire
Analyzing body size to determine the prevalence of excess body fat is vital in
determining the risk of cardiovascular disease in a population. Research has
shown excess body weight to be associated with an increased prevalence of
hypertension, hyperlipidemia and diabetes mellitus (Reeder et al., 1992).
The researcher analyzed body mass index levels of young adults of the
Newfoundland and Labrador Nutrition Survey to determine the prevalence of
excess body fat. The results from the survey revealed that 36% of young
Newfoundland and Labrador adults had a BMI greater than 27
(Table 7). Thus, 36% of the total study population had an increased risk of
developing CVD and may have been overweight. Furthemore, a higher
percentage of 25-34 year old participants (Table 7) and young aduit male
participants (Table 8) had a BMI greater than 27.
It was expected that a higher percentage of 25-34 year old participants of the
Nutrition Newfoundland and Labrador study would have a BMI greater than 27
since research reveals that overweight increases wÎth age. Reeder et al. (1 992)
studied weight distributions among participants of the Canadian Heart Health
Study. lt was revealed that mean BMI increased with age. For instance. the
mean BMI of 18-24 year old males was 23.8 kg/m2 and the mean BMI of 55-64
year old males was 26.5 kg/m2. Reeder et al. (1997) also revealed that a higher
percentage of young adult males (18-34 years) had a BMI between 27 and 29 as
compared to young adult females (1 8-34 years). This gave support to the results
from the Nutrition Newfoundland and Labrador Survey.
Similar trends were observed in young adults of the Nova Scotia Nutrition
Survey. Thirty-eight percent of young adult participants of the Nova Scotia
Nutrition Survey had a BMI greater than 27. Furthemore, a significantly higher
percentage of males had a BMI greater than 27 as cornpared to females (Nova
Scotia Head Health Program, 1993).
Ostbye, Pomerleau, Speechley, Pederson and Speechley (1 995) determined the
prevalence of obesity (BMI 2 27) among participants aged 20-64 of the Ontario
Health Survey of 1990. This survey revealed that approximately 15% of 20-24
year olds and 20% of 25-29 year olds were obese. These rates are lower than
those observed in young Newfoundland and Labrador adults. The results from
the Ontario Health Survey did conclude that weight gain increases with age and
that there was a higher prevalence of obesity in male adults as compared to
female adults. The results of the Ontario Health Survey are similar to those
obtained from the Newfoundland and Labrador Nutrition Survey.
Another important consideration in analyzing body size is abdominal adipose
tissue. Some researchen report central adipose tissue to be a greater predictor
of metabolic disturbances than excess body fat (Reeder et al., 1 992).
The researcher measured waist circumference as an indication of abdominal
adipose tissue. A significant number of 25-34 year old fernales had a waist
circumference associated with metabolic disturbances (> 88 cm) (Table 9). This
suggests that a higher percentage of 25-34 year old females were at an
increased risk for CVD development as cornpared to their younger age
counterparts,
Results from the analysis of abdominal adipose tissue also suggested that young
male adult participants had a higher mean waist circumference as compared to
young female adult participants of the Newfoundland and Labrador Nutrition
Survey (Figures 9 and 10). Research reveals that on average males do have a
larger waist circumference than females. Macdonald, Reeder, C hen, Despres
and Canadian Heart Health Suiveys Research Group (1997) analyzed the waist
circumference distributions of participants of the Heart Health Surveys conducted
in Quebec, Manitoba, Saskatchewan, Ontario and Alberta. They also discovered
that men had a higher mean waist circumferenœ than females.
The prevalence of obesity as suggested by the high number of participants with a
BMI 2 27 and increased waist circumference suggests the need for increased
public awareness of the importance of a healthy body weight.
5.4.2. Physical Activity
P hysical insctivity is recognized as a major risk factor of cardiovascular disease.
This may be due to a causal relationship between not being active and the

development of plasma lipids, lipoproteins, apolipoprotein, and athenclerosis
(Paffenbarger et al, 1984). Scientific research reveals that physical activity has a
beneficial effect on serum cholesterol, body mass index, blood pressure and
diabetes mellitus (United States Department of Health and Human Services,
1 996).
Most young adults living in Newfoundland and Labrador perform slight to
moderate levels of physical activity white at work (Table 11). The results from
this study suggest that most young residents of the province of Newfoundland
and Labrador petform a moderate level of physical activity at work. However,
due to the wording of the question, the researcher was unable to detemine if
young adults were meeting the recommendation that individuals perform physical
activity of rnoderate intensity or greater, every other day in order to decrease
their risk of developing cardiovascular disease (Stephens & Craig , 1990).
No significant association was noted between the two age groups and physical
activity at work (Table 11). As a result, one might assume that being in the 18-
24-age category or being in the 25-34 year old category had no effect on the type
of physical activity one perfoms at work.
A significant association was present between gender and physical activity at
work (Table 12). Our results suggest that young adult males were more likely
than young adult females to perfonn moderate to heavy physical activity at work.
Females are more likely to perfonn slight to sedentary physical activity at work at
this age. Males are more involved in occupations that require heavy physical

labour such as construction, fishing and mining than wornen. For instance, in
I 9 9 l . 4,145 males but only 350 females were involved in the mining (including
milling), quariying and oil well industries in Newfoundland and Labrador
(Newfoundland and Labrador Centre for Health Information, 1998).
Due to the wording of the questions regarding leisure time physical activities in
the Newfoundland and Labrador Nutrition Survey, the researcher was unable to
estimate the percentage of the study population who participated at a moderate
intensity or greater. However, the researcher was able to detemine the
percentage of young adults that performed lower and higher intensity physical
activities during leisure time.
It was revealed that many young adults living in Newfoundland and Labrador
spent no time performing higher intensity leisure physical activity (45%) but most
of those who do exercise, exercised frequently (Table 17). Almost 27% of the
total population surveyed, perfomed physical activities at least three times per
week that required their heart to beat rapidly (Table 17). Sirnilar results were
observed for the duration of higher intensity physical activity during leisure time.
Most young Newfoundland and Labrador adult participants of the study either
spent a duration of O minutes or at least 30 minute intervals at physical activities
during leisure time (Table 19). The results from this survey suggest that a large
percentage of young Newfoundland and Labrador adult respondents of this
nutrition survey were sedentary during leisure time.
Age and gender were shown to have a significant association on the frequency
and duration of higher intensity leisure time physical activity (Tables 18 and 19).
A trend was observed such that more 18-24 year olds venus 25-34 year olds
and more young adult males venus young adult females engaged in higher
intensity leisure physical activity more often. It may be appropriate to suggest
25-34 year old females could be at an increased risk of cardiovascular disease
due to limited leisure time physical activity.
Results from this study reveal the need for continued health promotion programs
that aim at increasing physical activity levels of young adult residents of
Newfoundland and Labrador. If more exercise programs are incorporated for the
younger aged groups it may help them to continue to exercise in their later years
(Dennison, Strauss, Mellitis 8 Charney, 1988).
5.4.3. Cigarette Smoking
Cigarette smoking has been associated with an increased risk of CVD
development (Hays, Hurt 8 Dale, 1996). Cigarette smoking has also been
associated with increased heart rate, reduced estrogen levels (Hansen,
Anderson & Von Eyben, 1993), low HDL cholesterol and high LDL cholesterol
(Stamford et al., 1984).
A person was designated a regular smoker if they smoked at least one cigarette
per day. Approximately 40% of young adults aged 18-34 yean in the Nutrition
Newfoundland and Labrador Survey were regular smokers (Table 21). This rate
does not appear to change significantly with age or gender (Table 22). However,
when the actual number of cigarettes smoked per day by regular smokers was
analyzed by gender and age, it was revealed that males and 25- 34 year olds
smoked a higher number of cigarettes in comparison to females and 18-24 year
olds (Table 23 and 24).
Approximately 42% of young adults aged 18-34 years in the Nova Scotia survey
were regular smokers in 1989. This reveals that the prevalence of young adults
who are regular smoken was similar in both provinces. However, in 1994 the
national average was 29% (Newfoundland and Labrador Center for Health
Information, 1998). This reveals that young Newfoundland and Labrador adults
have a high prevalence of cigarette smoking.
Sirnilar cigarette smoking rates were observed in young adult participants of the
Newfoundland and Labrador Heart Health Survey (39% of males and 44% of
fernales aged 18-34 yean). These results suggest that presently, smoking rates
of young adults may not be declining in Newfoundland and Labrador. Young
adult regular smokers between the ages of 18-24 are consuming fewer cigarettes
per day in relation to young adult regular smokers between the ages of 25-34.
However, the number of young adult regular srnokers is staying the same. Thus,
more initiatives need to be taken to decrease the number of cigarette smokers in
this province. If more programs are not developed and these rates continue, the
incidence of CVD will not improve in Newfoundland and Labrador.
5.5. Prevalence of CVD Ridc hctois of Ulban and Rural Residents
Research reveals that geographic location; in particular, living in urban or rural
areas affects one's health status. This is supported by the fact that rural
residents are more likely to suffer long-terni disabilities and have shorter quality-
adjusted life expectancies (Johnson. Ratner & Bottorff, 1995). The researcher
attempted to determine the effect of area of residenœ by analyzing the body
size, physical activity and cigarette smoking habits of urôan and rural residents.
5.5.1. Body Size
In regards to body size, the body mass index category of a respondent showed
no association with hislher area of residence (Table 25). However, a slightly
higher percentage of rural residents (39%) had a BMI greater than 27 as
compared to urban residents (33%).
Reeder et al (1997) utilized results from the Canadian Heart Health survey to
describe the association between obesity and living in rural versus urban areas in
three regions of Canada: atlantic, central, and western. This study also revealed
no significant difference between body mass indices of males and females living
in rural and urban cornmunities in the Atlantic provinces. The results for this
study were taken from a sample of 18-74 year olds.
Living in urban and rural areas did affect abdominal adipose tissue distribution.
Females living in rural areas were more likely to have a waist circumference
greater than 88 cm versus females living in urban areas (Table 26). Thus. it
appears that females living in rural areas may be at an increased risk of CVD and
they should be infomied about the health consequences or tisks associated with
inappropriate body sizes.
Living in an urban or rural area had no apparent association with the waist
circumference of young adult males (Table 27). One might expect the waist
circumference of males to be lower in rural areas since results suggest that they
perform heavier levels of physical activity at work. Variables outside of the risk
factors that were investigated in this study may play a role. These could include
diet and stress.
5.5.2. Physical Activity
In regards to physical activity, differences were exhibited in the types of physical
activity performed by rural and urban residents at work. Rural residents of
Newfoundland and Labrador in the age range studied were more likely to perform
heavy physical labour and were less Iikely to perfonn sedentary work as
compared to urban residents (Table 28). A large percentage of people living in
rural areas have occupations such as fishing, fanning, woodcutting and mining.
For instance, in 1991, 90 residents of St. John's (urban) were involved in the
logging industry versus 1,755 in Central (mainly rural areas) Newfoundland
(Newfoundland and Labrador Center of Health Information, 1998). These
occupations often require individuals to be physically active.

A higher percentage of urban residents were more likely to have sedentary jobs
since more businesses are present in urban areas. In 1991. 10,650 residents of
St. John's had managerial positions versus 2,970 residents of central
Newfoundland (Newfoundland and Labrador Centre of Health Information, 1998).
A significant difference was not exhibited between the frequency and duration of
physical activity performed during leisure time and living in rural and urban areas
(Tables 29,30,31 and 32). Thus, living in a rural or an urban area was seen to
have no sffect on the intensity. duration and frequency of physical activity
performed during leisure tirne.
5.5.3. Cigarette Smoking
There were a similar number of young adult regular smokers detected in both
rural and urban areas throughout Newfoundland and Labrador (Table 33).
Results from this analysis also suggested that within the number of regular
smokers, the quantity of cigarettes smoked in rural and urban areas was similar
(Table 34). This suggests that both young adult, rural and urban residents of
Newfoundland and Labrador have equal opportunities to develop health
problems that are associated with cigarette smoking.

5.6. Influence of Age, Gendet, Area of Residence, Education and Household lncome on the Pmsence of CVD Risk Factors
The researcher considered education and household income to be confounding
variables. Thus, logistic regression analysis was conducted to determine if
education and household income had any effect on the prevalence of
cardiovascular disease risk factors in young adults. In order to complete this
analysis age, gender and area of residence was also considered.
In accordance to Table 35, the variables measured against body mass index did
not provide a good fit for the model. The ordinal logistic regression table also
revealed that there was no association between body mass index and
(1) education and (2) household income. The table did reveal that age impacted
body mass index, which was also revealed in earlier test of chi-square analysis.
A number of studies have suggested that a relationship does exist between
education and body weight. Winkleby, Fortmann and Barrett (1 990) studied the
effect of education on risk factors for heart disease. This study was conducted
on 3,349 individuals between the ages of 18 and 74 years. They revealed a
significant relationship between body mass index and yean of education.
lncreased education (greater than 16 years) was associated with a healthy BMI
(20-25) and low education (less than 12 years) was associated with an unhealthy
BMI (greater than 27). This situation does not exist in young adults studied in the
Nutrition Newfoundland and Labrador Survey. As a result, it is suggested that
education may not effect the prevalenœ of excess body fat of young adults living
in Newfoundland and Labrador.

Table 36 suggested that education was associated with physical activity at work.
Eariier studies (before the 1970's) have suggested an association between
socioeconomic status and level of physical activity at work (Powell, Thompson,
Caspersen & Kendrick, 1987). Table 36 also suggested that an association
existed between physical activity at work and gender and area of residence. This
was also suggested in earlier test of chi-square analysis.
In regards to leisure time physical activity, the variables under investigation
appeared to be a good fit for al1 levels of intensity (Tables 37, 38,40) except for
the frequency of higher intensity leisure time physical activity (Table 39). The
results obtained from Table 39 were conflicting. This suggests that other
confounding variables rnay need to be considered. However, in al1 cases, it was
suggested that household income had a significant association with leisure time
physical activity. This suggests that household income impacted the level of
leisure time p hysical activity.
In regards to regular cigarette smoken, the binary logistic regression test
suggested that the model used was not a good fit (Table 41). However, the G
test revealed that at least one of the variables had a significant relationship with
regular smokers. This was suggested by education level. Thus, the results from
the regression analysis (Table 41) suggest that education rnay have a significant
impact on risk factors of cardiovascular disease in Newfoundland and Labrador.
The results from this analysis wincide with other research studies. Winkleby,
Jatulis, Frank and Fortmann (1992) reported that education had a significant

effect on smoking habits. It was suggested that lower education groups had a
h ig her prevalence of cigarette smoking.
Table 41 also re-emphasized what was discovered in chi-square analysis of
smoking habits and age, gender and area of residence. Binary logistic
regression suggested that these variables had no association with smoking
habits.
5.7. Limitations of the Study
There were limitations to this study. This study was a form of secondary
analysis. As a result, the researcher was unable to develop questions that rnay
have been more appropriate for the study at hand. For instance, it is well known
that physical inactivity is a modifiable risk factor of CVD. However, the
researcher was unable to determine adequately whether a person had performed
sedentary, moderate or heavy levels of physical activity during leisure tirne.
During sample selection, community centers were randomly selected in relation
to their population site. It was difficult to acquire interviews in some of the rural
areas such as CD-1 due to transportation difFiculties. As a result, a lower number
of participants were obtained from the rural areas. This rnay have played a role
in the results that were obtained regarding the comparison of area of residenœ
and health status of the study population.
Residents living in rural areas throughout Newfoundland and Labrador often
travel to the urban centers close to their area for medical and social reasons.

This along with the possible isolation of their comrnunity rnay influence the type
of lifestyle they lead in regards to the type of food they consume, the amount of
health information they obtain and the experiences they acquire.
CONCLUSION AND RECOMMENDATIONS
The present study clearly suggests that the development of CVD is a concern for
young adults living in Newfoundland and Labrador. Results from this study
identified the prevalence of considerable modifiable risk factors of CVD. It
appears that future rates of CVD in Newfoundland and Labrador may remain
high as a result of unhealthy lifestyle habits that have been occurring for many
years.
A high percentage of young Newfoundland and Labrador adults have excess
body fat. Most young adults lead a sedentary lifestyle during leisure time and a
hig h percentage of young adults living in Newfoundland and Labrador are regular
cigarette smokers. The results from the Newfoundland and Labrador Nutrition
Survey reveal that the health status of young adults has not improved
significantly since the report of the Newfoundland Heart Health Survey. A
challenge still exists to reduce the prevalence of CVD risk factors in young
adults.
Results obtained from the cornparison of the health status of rural and urban
residents were conflicting. Area of residence was not associated with excess
body fat of males. leisure time physical activity and smoking habits. However, it
was suggested that a higher percentage of females living in rural areas had
excess abdominal adipose tissue. A larger percentage of rural residents
performed heavy physical activity while at work as compared to urban residents.
The education and household income levels of urban subjects were higher than
those subjects living in rural areas. As a result. living in rural areas may increase
the risk of developing CVD in young adult females. Residing in a rural area may
have a positive effect on young adult males who may have higher physical
activity.
Overall, it is vital that community development and community mobilization
approaches be continued or even implemented that focus on risk factors of CVD.
Many young adults in this province lead sedentary lifestyles and more health and
fitness education programs are needed to focus on the needs of young adults.
Physical activity needs to be ernphasized more in the younger aged groups in
order for it to become a part of their regular routine. Cigarette smoking continues
to be an issue in this province. Thus, specific policies and education programs
for cigarette smoking are needed that focus on young adults.
Results from this study also suggest that more extensive research needs to be
conducted on the health status of young adults living in Newfoundland and
Labrador. There may be areas that are not being investigated extensively that
will provide the public with a better understanding of why this trend in CVD is
continuing in Newfoundland and Labrador. It may be useful that individual
suweys, be devised and conducted, concentrating on the health status if young
Newfoundland and Labrador adults in specific regions and communities

throug hout the province. This study was an overview of specific cardiovascular
disease risk factors of young adults in this province. Other CVD risk factors need
to be studied as well. Other diseases and their causative factors need to be
investigated in young adults as well as in urban versus rural areas.
On the basis of these findings. it is concluded that CVD is still an issue in this
province. It suggests a need for more health promotion strategies that
concentrate on the health status of young adults. Urban residents may adopt
healthier lifestyle behavion than those living in less populated areas throughout
the province. Thus, it is vital that steps be taken to provide knowledge and
assistance to rural areas on ways to achieve a healthy lifestyle.
REFERENCES
American Dietetic Association. (1 990). Cardiovascular disease: nutrition for mevention and treatment: sport and cardiovascular nutritionists. American Dietetic Association.
Bavington, B. (1 994). Rural public health. Canadian Journal of Public Health, 8(5), 295-296.
Bernadet, P. (1995). Benefits of physical activity in the prevention of cardiovascular diseases. Cardioloav Pharrnocoloav. 52 (suppl 1 ), S3-S8.
Blair, S.N., Kohl, H.W., Paffenberger, R.S., Clark, DG., Cooper, K.H., Gibbons, L.W. (1 989). Physical fitness and all-cause mortality. Journal of the Arnerican Medical Association. 262, 2395-2401 .
Bowlin, S.J., Morrill, B.D., Nafziger, A.N., Lewis, C., Pearson, T.A. (1 996). Reliability and changes in validity of seif-reported cardiovascular disease risk factors using dual response: the behavioral risk factor survey. Journal of Clinical Epidemiology, 49, 5, 51 1-51 7.
Burton, B.T., Foster, W.R. (1 985). Health implications of obesity: a NIH consensus developrnent conference. Journal of the Arnerican Dietetic Association, 85: 1 1 17.
Canadian Fitness and Lifestyle Institute. (1996). Proaress in Prevention: how active are Canadians?(lSSN 1205-7029). Ottawa, Canada.
Caprio S., Hyman, L.D., McCarthy, Lange, R., Brosnan, M. Tamborlane, W.V. (1 996). Fat distribution and cardiovascular risk factors in obese adolescent girls: importance of the intraabdominal fat depot. American Journal of Clinical Nutrition. 64, 12-1 7.
Castro, B.A. (1 983). Family history as an independent risk factor for ischemic heart disease in a low incidence area (Galica, Spain). Euronean Heart Journal. 14(1 l ) , 1445-1450.
Criqui, M., Barrett-Connor, E., Austin, M. (1978). Differences between respondents and non-respondents in a population - based cardiovascular disease study. Ametican Journal of Eeidemioloav. 108, 367-372
Daniel, W.M. (1 995). Biostatistics: a foundation for analvsis in the health sciences. 6%d. New York: John Wiley 8 Sons Inc.

Dennison, B.A., Strauss, J.H., Mellitis, E.D., Chamey, E. (1988). Chi Id hood ph ysical fitness tests: predictor of adult physical activity levels? Pediatrics, 82, 324-330.
Dietz, W. (1998). Health consequences of obesity in youth: childhood predictors of adult disease. Pediatrics. 101(3), 518-525.
Duncan. C, Jones, K , Moon, G. (1 993). Do places matter? A rnulti-level analysis of regional variations in health-related behaviour in Britain. Social Science of Medicine. 37(6), 725-733.
Eastwood, B.J., Gregor, R.D., Maclean, DR., Wolf, H.K. (1996). Effects of recruitment strategy on response rates and risk factor profile in two cardiovascular surveys. International Journal of E~iderniolopv. pp 763-769.
Federal Provincial Working Group on the Prevention and Conttol of Cardiovascular Disease. (1992). Promotina Heart Health in Canada: a focus on cholesterol. Ottawa, Ont.
Freedman, D.S., Srinivasan, SR., Harsha, D.W., Webber, L.S., Berenson, G.S. (1 989). Relation of body fat patteming to lipid and lipoprotein concentrations in children and adolescents: the Bogalusa Heart Study. American Journal of Clinical Nutrition. 50, 930-939.
Frick, M.H., €10, O., Haapa, K., Heinonen, O.P., Heinsalmi, P., Helo, P., Huttunen, J .K., Kaitaniemi, P., Koskinen, P., Manninen, V., Maenpaa, H., Malkonen, M, Manttari, M., Norola, S., Pasternack, A., Pikkarainen, J., Romo, M., Sjoblom, T., Nikkkila, E.A. (1 987). Helsinki Heart Study: prirnary-prevention trial with Gemfibrozil in middle-aged men wRh dyslipidemia: safety of treatment, changes in risk factors and incidence of coronary heart disease. New Enaland Journal of Medicine. 317(20), 1237-1245.
Fujioka, S., Matsuzawa, Y., Tokunaga, K.. Tarui, S. (1 987). Contribution of intra-abdominal fat accumulation to the impairment of glucose and lipid rnetabolism in human obesity. Metabolism. 36, 54-59.
Godin, G., Jobin, J. Bouillon, J. (1986). Assessrnent of leisure time exercise behaviour by self-report: a concurrent validity stud y. Canadian Journal of Public Health. 77, 359-362.
Gordon, D. J., 8 Rifkind, B.M. (1 989). Highdensity lipoprotein: the clinical implications of recent studies. New Enaland Journal of Medicine. 321, 131 1.
Guo, S.S., Roche, A.F.. Chumlea, W.C., Gardner, J.D.. Siervogel, R.M. (1 994). The predictive value of childhood body mass index values for overweight at age 35 y. Amencan Journal of Clinical Nutrition. 59(4). 810-819.
Haapanen, N., Miilunpalo, S., Vuori, 1.. Oja, P., Pasanen, M. (1996). Characteristics of leisure tirne physical activity associated with decreased risk of prernature all-cause and cardiovascular disease mortality in rniddle-aged men. American Journal of E~idemiolo~v. 143(9), 870-880.
Hanes, O.S., Weir, M.R., Sowen, J.R. (1 996). Gender considerations in hypertension pathophysiology and treatment. American Jounrnal of Medicine. 101, 10s-21s. -
Hansen, E.F., Anderson, L.T., Von Eyben, E.E. (1993). Cigarette smoking and age at onset of myocardinal infarction and influence of gender and extent of smoking. American Journal of Cardioloav. 71, 1439-1442.
Hays, J.T, H~ r t . R.D., Dale, L.C. (1996). Smoking cessation: evidence for or against benefit. In: Prevention of Mvocardial Infraction. Manson, J .E., Gaziano, J .M., Ridker, P.M., Hennekens. C.H. New York: Oxford University Press.
Health Canada (1995). Canadians and Heart Health (ISBN 0-662- 234464-4). Ottawa: Minister of Supply and Sewices Canada.
Health and Welfare Canada (1988). Canadian Guidelines for Healthv Weia hts: Promoting Healthv Webhts discussion paper, Health Service and Promotion Branch, Ottawa.
Heart and Stroke Foundation of Canada, Statistics Canada, University of Saskatchewan. (1 997). Heart disease and stroke in Canada. (ISBN 1-896242- 26-X). Ottawa: Heart and Stroke Foundation of Canada.
Heiss, G., Tamir, I., Davis. C.E., et al. (1 980). Lipoprotein-cholesterol distribution in selected Norai American populations: the lipid research clinics program prevention study. Circulation. 61, (2), 302-315.
Hoeymans, N., Smit. H.A., Verkleij, H., Kromhout, O. (1996). Cardiovascular risk factors in relation to educational level in 36 000 men and wornen in the Netherlands. Euro~ean Societv of Cardiolo~v. 17, 518-525.
Holman, R.L., McGill, H.C. Jr., Strong, J.P.. Geer. J.C. (1958). The natural history of atherosclerosis: the early aortic lesions as seen in New Orleans in the 2oth century. Arnerican Journal of Patholwv. 34: 209-235.
Hubert, A.B., Feinleib, M., McNamara, P.M., Castelli, W.P. (1 983). Obesity as an independent risk factor for cardiovascular disease: a 26 year follow-up of participants in the Framingham Hean Study. Circulation. 67(5), 968- 977.
lnclen Multiœntre Collaborative Group. (1 994). Socioeconomic status and risk factors for cardiovascular disease: a muhicentre collaborative stud y in the international clinical epidemiology network (INCLEN). Journal of Clinical E~idemiologv. 47(2), 1401 -1409.
Johansen, H., Nargundar. M.. Nair, C., Neutel, I., Wielgosz, A. (1991). Women and cardiovascular disease. Chronic Diseases in Canada. 11,41-47.
Johnson, J. L., Ratner, P.A., Bottorff, J.L. (1 995). Urban-rural differences in the health promoting behavioun of Albertans. Canadian Journal of Public Health. 86(2), 103-1 08.
Kannel, W.B. 8 Abbott, R.D. (1 987). Incidence and prognosis of rnyocardial infarction in women: the Framingham study. In: Eaker E.D., Packard, B.. Wenger. NeK.. Clarkson. T.B., Tvroler, H.A. (eds.). Coronarv heart disease in women. New York: Haymarket Doyma.
Kannel, W.B., DtAgostino, R.B., Cobb, J.L. (1996). Effect of weight on cardiovascu tar disease. American Journal of Clinical Nutrition, ~ ~ ( s u R D ~ ) , 41 9s- 422s.
Kannel, WB., & Gordon, T. (1973). The Framinaham Studv: an e~idemioloaical investigation of cardiovascular disease (DHEW pub1 [NIH) 74- 599). Department of Health, Education and Welfare, Washington.
Kannel, W.B. & Sorlie, P. (1 979). Some health benefits of physical activity: the Framingham study. Archives of Interna1 Medicine, 139. 857-861.
Kannel, W. B. (1 983). High-density lipoproteins: epiderniological profile and risks of coronary artery disease. Arnerican Journal of Cardioloay, 52. 9B.
Kaufman, D.W., Helrnrich, S.?., Rosenberg, L. (1983). Nicotine and carbon monoxide content of cigarette smoke and the risk of myocardial infarction in young men. New Enaland Journal of Medicine. 309-409.
Kiely, D.K., Wolf, P.A., Cupples, L.A., Beiser, AS., Kannel, W.B. (1994). Physical activity and stroke nsk: the Framingham study. American Journal of E~idemioloav. l4O(7), 608620.
Krotkiewski, M., Bjorntorp, P.. Sjostrom, L., Smith, U. (1983). Impact of obesity on metabolism in men and women. Journal of Clinical Investiaations. 72, 1150-1 162.
Lean, M.E.J., Han, T.S., Seidell, J.C. (1998). Impairment of health and quality of life in people with large waist circumference. The Lancet. 351. 853- 856.
Lemieux, S., Prud'homme, D., Bouchard, C., Tremblay, A., Despres, J.P. (1 996). A single threshold values of waist girth and overweight subjects with excess visceral adipose tissue. American Journal of Clinical Nutrition. 64, 685- 693.
Liberatos, P., Link, BeG*, Kelsey, J.L. (1 988). The measurement of social class in epidemiology. E~idemiolwv Review. lO,8ï-l2l.
Liu, K., Cedres, L.B., Stamler, J*, Dyer, A.. Stamler, R., Nanas, S., Berkson, DM., Paul, O., Lepper, M., Lindberg, H.A., Marquardi, J., Stevens, E., Schoenberger, J.A., Shekelle, R.B., Collette, P., Shekelle, S., Garside, D. (1 982). Relationships of education with major risk factors and death from coronary heart disease, cardiovascular disease and al1 causes. Circulation. 66, (6), 1308-1314.
Luoto, R., Pekkanen. J., Uutela. A., Tuomilehto, J. (1994). Cardiovascular risks and socioeconomic status: differences between men and women in Finland. Journal of Epidemioloav and Comrnunitv Health, 48, 348-354.
Lynch, J.M., Kaplan, GA., Cohen, RD., Tuomilehto, J., Salonen, J.T. (1 996). Do cardiovascular risk facton explain the relation belween socioeconomic status, risk of all-cause mortality, cardiovascular rnortality and acute myocard ial infarction? American Journal of E~idemioloc~v, 144, (1 O), 934- 942.
Macdonald, S.M., Reeder, B.A., Chen, Y, Despres. J.P., Canadian Heart Health Surveys Research Group. (1997). Obesity in Canada: a descriptive analysis. Canadian Medical Association Journal. l57( l supplg S3-S9.
Macdonald, S., Joffres, M.R., Stachenko, S., Horlick, J., Fodor, G., Canadian Heart Health Surveys Research Group (1992). Multiple cardiovascular disease risk factors in Canadian adults. Canadian Medical Association Journal, 146, 2021 -2029. -
Maclean, DR., Petrasovits A. Nargundkar, Connelly, P.W.. Maclead, E., Edwards, A., Hessel, P., Canadian Heart Health Research Group. (1 992). Canadian Heart Health Surveys: a profile of cardiovascular risk factors, survey methods and data analysis. Canadian Medical Association Journal. 1461 1 1 ), 3-8.
Manson, J.E., Gaziano, J.M., Ridker, P.M., Hennekens, C.H. (1996). Myocardial infraction: epidemiologic overview. In: Prevention of mvocardial infraction. Manson, JE., Gaziano, J.M., Ridker, P.M., Hennekens, C.H. (eds). New York, Oxford University Press.
Millar, W. J. & Wig le, D.T. (1 986). Socioeconornic disparities in risk factors for cardiovascular disease. Canadian Medical Association Journal. 1 34, 127-1 32.
MinitabO 1996: Minitab reference manual: Release 1 1 for WindowsO, USA
Moll, P.P., Sing, CF., Weidman, W.H., Gordon, H., Ellefson, R.D., Hodgson, P.A., Kottke, B.A. (1 983). Total cholesterol and lipoproteins in school children: prediction of coronary heart disease in adult relatives. Circulation. 67(1) 127-134.
Munro, B.H 8 Page, €.B. (1 993). Statistical methods for health care research. Braitman, L., Dixon, J.K., Hickey, M.L., Jacobsen, B.S. (eds). P hiladelp hia, Pennsylvania, J.B. Lippincott Company.
Narg und kar, M.S. (1 996) S~ecial survev methods su b-division. Statistics Canada, Ottawa.
Narg undkar, M.S. (1 998). Newfoundland Nutrition Survev - 1996. Sam~le selection and estimation procedure. Statistics Canada, Ottawa.
National Health and Research Development Program (NHRDP). (1 989). Proceedinas of the worksho~ on the e~idemioloav of hiah blood pressure in Canada. Quebec Ministry of Health and Social Services, Squibb Canada Inc.
Neaton, J.D. & Wentworth, D. (1 992). Serum cholesterol, blood pressure, cigarette smoking and death from coronary heart disease. Overall findings and differences by age for 316, 099 white men: multiple risk factor intervention trial research group. Archives of Interna1 Medicine. 152(1), 56-64.
Neville, O., Buehler. S., James, B. Edwards, A. (1994). Newfoundland health for the vear 2000 ~roiect: a re~or t of the review of Newfoundland health status. Government of Newfoundland and Labrador, Department of Health.
Newfoundland and Labrador Centre for Health Information (1998). Health status survev: St. John's reaion. Newfoundland and Labrador Department of Health.
Newfoundland Department of Health and National Health and Welfare. (1 990). Report of the Newfoundland Heart Health Survev (1988-19891. St. John's, Newfoundland: Government of Newfoundland and Labrador.
Newman, W.P., Freedman, D.S., Voon, A.W., Gard, P.D., Sathanur, R., Srinivasan, S. R., Cresanta, J.L., Williamson, G.D., Webber, L.S., 8 Berenson, G.S. (1 986). Relation of serum lipoprotein levels and systolic blood pressure to early arterosclerosis: the Bogalusa Heart Study. New Enaland Joumal of Medicine, 314, 138-144.
Nova Scotia Heart Health Prograrn. Nova Scotia Department of Health and HeaQh and Welfare Canada. (1993). R e ~ o d of the Nova Scotia Nutrition Survev, Halifax, N.S.
Nutrition Newfoundland and Labrador. (1 996). Interviewers binder. Mernorial University of Newfoundland.
Ostbye, T., Pomerleau. J., Speechley, M.. Pedenon, L.L., Speechley. K.N. (1995). Correlates of body mass index in the 1990 Ontario Health Survey. Canadian Medical Association. 1 52(1 l ) , 181 1-1 81 8.
Paffenbarger, R.S. Jr., & Hale, W.€. (1975). Work activity and coronary heart mortality. New England Journal of Medicine, 1 1 (292), 545-550.
Paffenbarger, R.S. Jr., Hyde, R.T., Wing, A.L., Steinmetz, C.H. (1 984). A natural history of athleticism and cardiovascular health. Joumal of the American Medical Association. 252. 491495.
Pi-Sunger, F.X. (1 993). Medical hazards of obesity. Annals of lnternal Medicine. 1 19, 655-60.
Pouliot, M.C., Despres, J.P., Lemieux, S., Moorjani, S., Bouchard C., Trernblay, A., Nadeau, A., Lupien, P.J. (1 994). Waist circumference and abdominal saggittal diameter: best simple anthropometric indexes of abdominal viscera adipose tissue accumulation and relatad cardiovascular risk in men and women. American Journal of Cardioloay, 460-468.
Powell, K.E., Thornpson, P.D., Caspersen, C. J., Kendrick, J.S. (1 987). Physical acitivity and the incidence of coronary heart disease. Annals Review of Public Health. 8, 253-287.
Rabkin, S.W., Chen, Y., Leiter, L., Liu, L., Reeder B.A., Canadian Heart Health Suweys Research Group. (1 997). Risk factor correlates of body mass index. Canadian Medical Association Joumal, 157 (1 suppl), S26S31.
Rabkin, S.W, Mathewson, F.A.L.. Hsu, P.H. (1977). Relationship of body weight to incidence of ischemic heart disease in a cohort of North American men followed for twenty-six years. Manitoba Study. American Journal of Cardiology, 39: 452458. -
Reeder, B.A., Angel, A., Ledoux, M., Rabkin, S.W., Young, T.K., Sweet, LE., Canadian Heart Health Surveys Research Group. (1992). Obesity and its relation to cardiovascular disease risk factors in Canadian adults. Canadian Medical Association Journal. 146(11), 2009-2029.
Reeder, B.A., Senthilselvan, A., Despres, J.P., Angel, A., Liu, L., Wang, H., Rabkin, S.W. Canadian Heart Health Surveys Research Group. (1 997). The association of cardiovascular disease risk factors with abdominal obesity in Canada. Canadian Medical Association Journal. I U ( l suppl),
Rice D.P., Hodgson T.A., Kopstein A.N. (1 985). The economic costs of illness: a replication and update. Health Care Financial Review:7:6140.
Ridker, P.M. (1 996). The pathogenesis of artherosclerosis and acute thrombosis; relevance to strategies of cardiovascular disease prevention. In: Prevention of mvocardial infraction, Manson J E , Gaziano J.M.. Ridker, P.M. and Hennekens, C.H. (eds.). New York: Oxford University Press.
Salonen, J.T., Puska, P., Tuomilehto, J. (1982). Physical activity and risk of myocardinal infarction, cerebral stroke and death: a longitudinal study in Eastern Finland. American Journal of E~idemioloav. 11 5, 526-537.
Segovia, J., Edwards, A.C., Bartlett, R.F. (1 996). Newfoundland panel on health and rnedical care: adult health survev 1995: methodoloav and descri~tive results; Health and Medical Care Research Group, Division of Community Medicine, Mernorial University of Newfoundland.
Seidell, J.C., Oosterlee, A., Thijssen, M.A.O., Burema, J ., Deurenberg, P., Hautvast, J .G.A. J., Ruijs, J .H.J. (1 987). Assessrnent of intra-abdominal and su bcutaneous abdominal fat: relation between anthropometry and computed tomography. American Journal of Clinical Nutrition. 45, 7-1 3.
Sharper, AG., Pocock, J.J., Walker, M., Phillips, A.N., Whitehead, T.P., P. Macfarlane (1 985). Risk factors for ischemic heart disease: the prospective phase of the British Regional Heart Study. Journal of Epidemioloav and Cornmunity Health. 39. 197-209.
Stamford, B.A., Matter, S., Fell, RD., et al. ( 1984). Cigarette smoking, exercise and high density lipoprotein cholesterol. Atherosclerosis. 52, 73.
Statistics Canada. (1 998) Nation series: 1996 Census of Po~ulation. Ottawa, Ontario, 93F0021XBD96001.
Statistics Canada, Health Statistics Division. (1 998). National ~o~u la t ion health survev overview 1996197. Ottawa, Minister of Industry, Catalogue 82-567- XPB.
Statistics Canada, Health Statistics Division, (1 996). Hospital statistics: prelirninary annual report. 1993-94. Ottawa: Minister of Industry, Catalogue 83- 241 XMB.
Stephens, T., & Craig, C.L. (1990). The well-beina of Canadians: Hia hlig hts of the 1988 Cam~bell's Survev. Ottawa, On: Canadian Fitness and Lifestyle Research Institute.
Stevenson, J.C., Crook, D., Godslsland, I.F. (1 993). Influence of age and menopause on serum lipids and lipoproteins in healthy women. Atherosclerosis, 98, 83-90. -
Strong , W.B., & Kelder, S.H. (1 996). Pediatric preventive cardiology. In; Prevention of Mvocardinal Infraction. Manson, J E , Gazino, J.M., Ridker, P.M., and Hennekens, C.H. (eds.). New York, Oxford University Press.
Strong, J.P. CL McGill, H.C. Jr. (1 962). The natural history of coronary atherosclerosis. American Journal of Pathology~40: 37-49.
Sytkowski, P.A., DtAgostino, RB., Belanger, A., Kannel, WB. (1 996). Sex and time trends in cardiovascular disease incidence and mortality: the Framing ham heart study, 1950-1 989. American Journal of E~idernioloav. 143(4), 338-362.
Thomas, HE., & Kannel, W (1 983). Risk factors for coronary heart d isease. In: Quick reference to cardiovascular disease, 2"d ed. Chung , E. K., (Eds.), P hiladelphia: J .B. Lippincott Company.
Travers, K. (1 996). The social organization of nutritional inequities. Social Science of Medicine. 43(3), 543-553.
United States Deparbnent of Health and Human Services. (1 996). Phvsical activity and health: a report of the suraeon aeneral. Atlanta, GA: U.S. Department of Health and Human Services. Centers for Disease Control and Prevention, National Center for Chronic Disease and Prevention and Health Promotion.
Vander, A. J., Sherman, J.H., Luciano, D.S. (1 994). Human ~ h v s i o l o a ~ the mechanisrns of bodv function, 6th ed. New Caledonia: ~ c ~ r a w - ~ i l l Inc. -
Verheij R.A. (1 996). Explaining urban-rural variations in health: a review of interactions between individual and environment. Social Science of Medicine, 42, 6, 923-935. -
Vlay, S.C. (1 996). A ~ractical a ~ ~ r o a c h to cardiac arrthvmia. 2nd ed. Boston: Little Brown and Company.
Wabitsch, M., Hauner, H., Heinze, E., Muche. R., Bockmann, A., Parthon. W., Mayer, H. Tetler. W. (1 994). Body-fat distribution and changes in the atherogenic risk-factor profile in obese adolescent girls du ring weight reduction. Arnerican Journal of Clinical Nutrition, 60, 54-60.
Wattigney, W.A., Webber, L.S., Srinivasan, S.R., Berenson, G.S. (1995). The emergence of clinically abnotmal levels of cardiovascular disease risk factor variables among young adults: the Bogalusa Heart Study. Preventive Medicine, 24, 617-26.
Wenger, N.K. (1996). Gender differences in coronary risk and risk factors. In: Prevention of mvocardial infraction. Manson, J.E., Gazino, J.M., Ridker. P.M., and Hennekens, C.H. (eds.). New York, Oxford University Press.
Whitney, E.N. & Rolfes, S.R. (1996). Understandina Nutrition, 3rd ed. Minneapolis, IND: West Publishing Company.
Wilhelrnsen, L., Tibblin, G.. Aurell, M., Bjure, J e l Ekstrom-Jodal, B., Grimby, G. (1 976). Physical activity, physical fitness and risk of myocardial infarction. Advanced Cardioloav. 1 8, 21 7-230.
Wil helmsen, L. (1 990). Synergistic effects of risk factors. Clinical Experience of Hvpertension. mrt A. 12,845-863.
Wilkins, R. (1 995). Canadian Center for Health Information, Statistics Canada. In: Seaovia J. Edwards. A. 8 Bartlett. R.F. 11 9951. Adult Health Survey 1995-~ethodoloov and descriptive results: health and medical care research group. Division of Community Medicine, Mernorial Univenity of Newfoundland, St. John's.
Wilkins, R. (1988). Canadian Health Promotion Survev: s~ecial studv on the sociallv and economicallv disadvantaaed. Health and Welfare Canada.
Win kleby, M.A., Fortmann, S.P., Barrett, D.C. (1 990). Social class disparities on risk factors for disease: eight year prevalence for level of education. Preventive Medicine, 19, 1-1 2.
Winkleby, M.A., Jatulis, D E , Frank, E., Fortmann, S.P. (1992). Socioeconornic status and health: how education, income and occupation contri bute to risk factors for cardiovascular disease. American Journal of Public Health. 82161, 81 6-820.

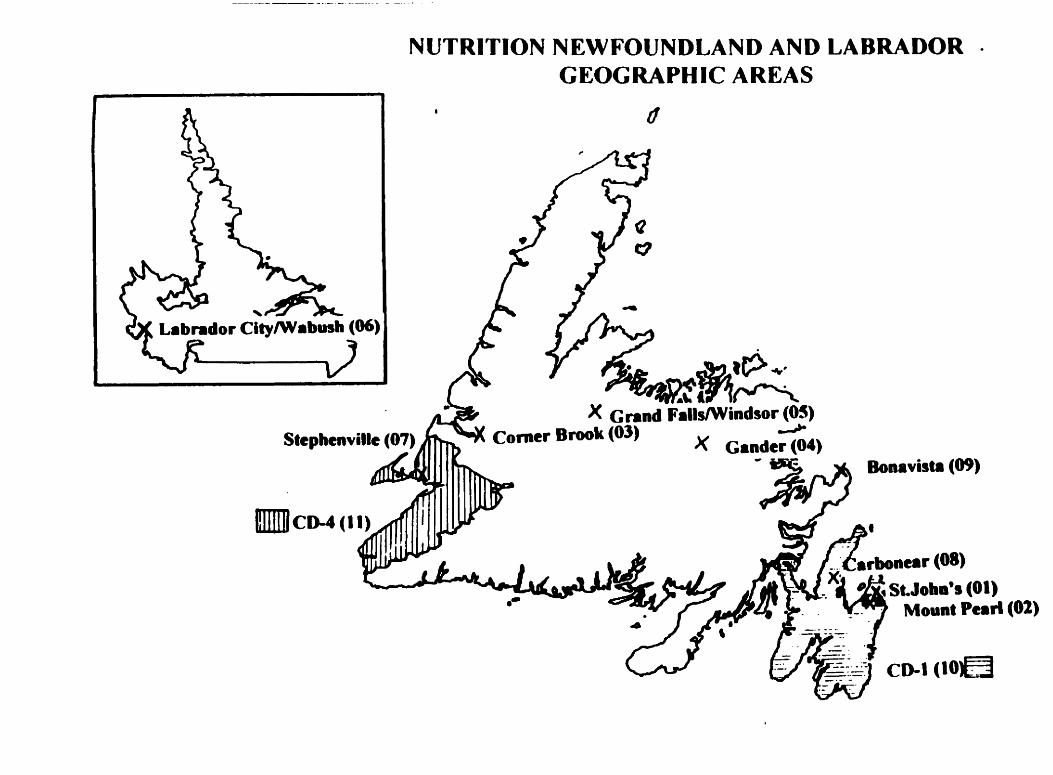
NUTRITION NEWFOUNDLAND AND LABRADOR GEOGRAPHIC AREAS

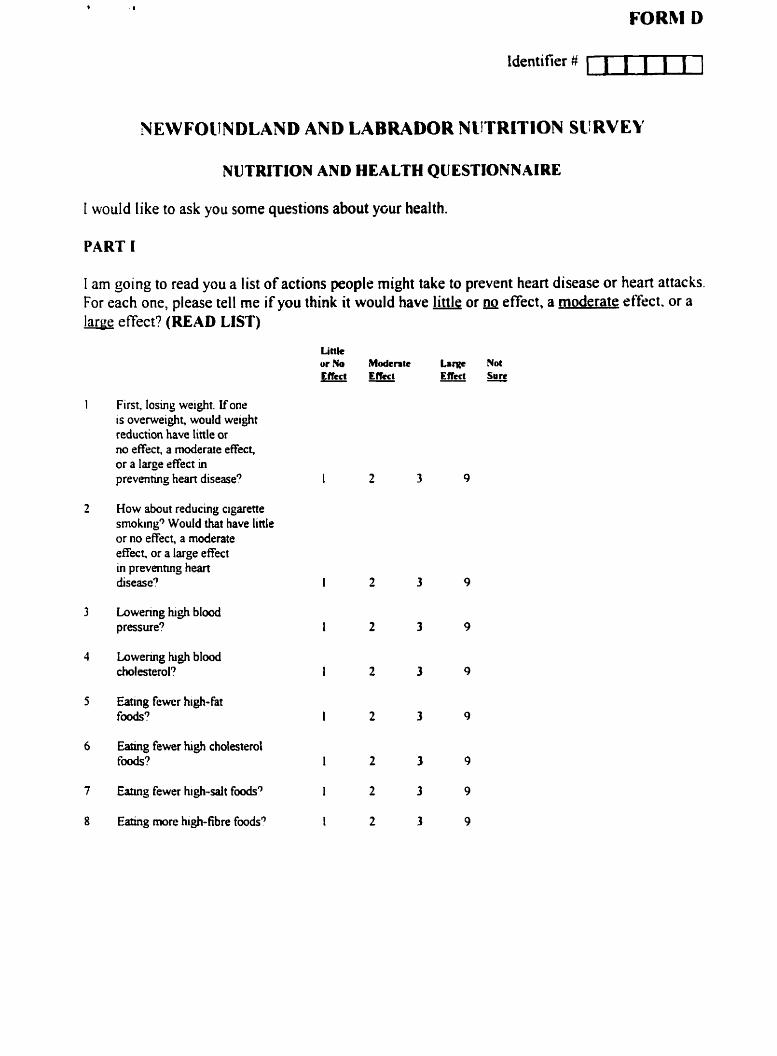
I WOU Id like to ask yc
PART 1
FORM D
identifier # uuul
NDLAND AND LABRADOR NUTRITION SURVEY
NUTRITION AND HEALTH QUESTlONNAI RE
u some questions about ycur health.
1 am going to read you a list of actions people might take to prevent heart disease or heart attaclis. For each one, please tell me if you think it would have little or a~ effect, a moderate effect. or a large effect? (READ LIST)
Littk ur No Modcrrk Large Nol E f k t E f k t Elleet Sure - -
First. losing weight. lfone is overweight, would weight reduction have little or no effect, a moderate effect, or a large effect in prevenimg hem disease?
How about reducing cigarette smoking3 Would that have linle or no effect, a moderate effect. or a large effect in preventmg hem dsease?
Lowenng hgh blood pressure?
Eatuig fewer hi$-fat foods?
Eatuig fewer hi& cholesteml f&?
h g fewer high-salt f d 3
E h g more hgh-fibre fmds?

ldcn tifier # c l n I I l
( I [Inn do y dcscribs y r wrL'? Br \wrh 1 inean paid and non-paid w r h . Wliich of-the tclllo\\.ing besi dcscrihes horb y u sprnd ~nusI ufyour twrk tiine. K'hecli one onlv 1.
M' uork is inainly sitting. I do mit walk inuch during work. e.0. tslephonc operator. s e t r e t q .
things. e y shop assistant. light houscuork.
a In rny work I hare to walk and carry a lot. climb staircases oRen or go uphill. eg. carpcntry. farm wvork. heaçy housework.
O My worA i s h m y physical labour whcre I usually have to carry. lift heary thines. - dig c. or shovel. e.g forestry work. heavy farm work. warehouse work.
I f ] ln your spare time. do you do any sport. physical activity. or work in which you are ~nobing a loi. but jour heart does not beat rapidly such as walking. house cleaning. or
Igo to 13)
I I Hnw tnany tirnes during the average week do you do such activities?
m3 u per week

Identifier #
12 For each time that you do these activities on average how many minutes do you sprnd at it (or them)?
DO NOT READ
n b e t w e e n 20 & 29 minutes
m30 minutes or more
13 In your spare time, do you do any sport, physical activity, or hard work that would make your heart beat rapidly such as hockey, soccer. swimming, jogging or aerobics?
y0 Tucl (go to 16)
1 4 How many times during the average week do you do such activities? DO NOT READ
0 3 x per week
15 For each time that you do these activities, on average how many minutes do you spend at it (or them)?
DO NOT READ
O between 20 & 29 minutes
0 3 0 minutes or more

identifier m]
The ncvt fer\ questions are about sinoking.
I 6 t la! e -ou et rr sinoled cigarettesr!
17 At the presrnt tiine do !ou sinokc cigarettes?
1 8 Do -ou usually smoke cigarettes cvcry day?
(go to 20)
a LI (go to 20)
a a (go to 20)
19 How many cigarettes do you smoke a day? CD cigarettes
20 Were -ou ever told by a doctor or other health care worker that your blood cholesterol was high? a a
(go to 23)
2 I Are y o u now doiny anything to lower your blood cholesterol? a NO (go to 23)
27 What are w u doing io loiver your blood cholesterol? (DO Nm READ LIST. Check al1 that
medications - U euercise program
oiher Idescribe

Identifier ii c I I U I I
23 Were you ever told by your doctor or other health care worker that you had high blood pressure (except during pregnancy)?
a a (go to 26)
21 Are you now doing anything for your blood pressure?
Yu NO (go to 26)
25 What are you doing for your high blood pressure? (DO NPT READ LIST. Check all that
diet $ w d i c a t i m
exercise program u o t h e r (describe)
26 Have you ever been told by your doctor or other health care worker that you have diabetes, or high blood sugar (except during pregnancy)?
a NO (go to 29)
27 Are you now doing anything for your diabetes, or high blood sugar?
a Ncl (go to 29)

identifier 8 1 1 1 1 1 1 ?
/I: Whnt arc !OU Joiriy !Or !uur diabetes. or high blood sugar? (DO VOT READ LIST. Check
U pills to lower blood sugar n
PAKT I I I hht I ~toiild l iké ro ta1 k a i itt le about foods eaten in Newfoundland and Labrador.
l u I l u r i n r ! - the past Lrear. did \*ou eat herries grown in Newfoundland and Labrador? (This i n c l t ~ d c ~ berries i n jains. presen es and pics)
a NO (go to 32)
What type or types o f herries did -ou rat?
hl usberries 0 raspberries 0
n bakeapples
par-tridgeberries n
strawbenies
others Ü I speci fy )
3 1 Last yrar. approuimately how many gallons/litres o f berries did your family eat?
Gallons Litres
32 Do y u or your family g o w your own fniits andor vegetables?
a Ncl (go to 34)

Identifier #
33 If you wanted to grow fniits/vegetables, would you have an appropriate piece of land availablr to you?
34 During an average week, how often do you eat pickled foods (including pickled vegetables and relishes, pickled meats and fishes, but excluding salt beef and salt pork)?
DO NOT READ
[71< 1 x per week
1-2 x per week
1713-4 x per week
[71> 4 x per week
35 SinceMay of 1995, have you eaten any of the following game meats?
Moose or caribou a Rabbit Yn No Wild birds dl N u Seal or whale
Bear Yu N u (If NO to al1 go to 38)
36 Did you eat more, about the same, or less game meat this year as compared to five years ago?
O ore O Sarne (go to 38) n ~ e s s

38 Did you eat more. ahout the samc. or lcss fresh watrr fish. such as trout. this year as compared in li \ c years ago?
CI More
O Same (go to JO) n
Less
3 i f !ou eai inore or less fresh nater fish. can you tell me why?
40 Did !ou eat more. about the same. or less salt water tish. such as cod. this year as compared to f ive years aga?
BE: - (go ta 42, U Less
4 I If !ou eat inore or less salt water fîsh. can p u tell me whv?

Identifier ft ml PART IV
42 During the last 30 days, which of the following statements best describes the amount of food available to be eaten by you and your family?
Always enough food to eat - (CO to Forni E) Sometirnes not enough food to eat U (Co to 43) Otlen not enough food to eat 0 (Go to 43)
43 1'0 what extent did each of the following reasons contribute to this lack of food'?
Problems with transportation. ~ o t at ail O A Little O A Lot O
Not having working appliances (such as a refrigerator or a stove) for storing or preparing foods.
A Lot O Not having enough money to buy food or beverages.
~ o t at ail A Little O A Lot O
Not having an adequate choice of foods available to you.
A Little O A Lot O
44 During the last month, did you or your family skip any meals because there waas not enough food or money to buy food?


FORM E
NEWFOUNDLAND & LABRADOR NUTRITION SURVEY
DEMOGRAPHIC PROFILE
In order to compare your amwon wlth people from rlmilar backgfwndr wa would lika to ask you a k w quertfonr about younrif.
1. How many people, including yourseif, lhre in this household?
. 2. Of that total nurnber, how many persons are under 18 yeeis old and are your
dependents? 1
3. What is the highest grade or level of edwation you have ever attendecl or ever CO rn pleted? (Mark only one)
No schooling
Some Elèmentuy
Completed Elementory
Some Secondary
Completed Seconduy
Some Community Conege, Technid Contge, or Nune's mhing Completed Community CoUege, Technical CoUege, or Numi tmMq Some University (e.8. B A M A PhD) or teacheen contge
Completed Unjversiîy (e.g. B.A. M A A.) or terchen cdlege
Other education or trainhg ( S M )

4. What is your curnnt marital status? Are pu...
O' O Singie ( N m r Maniecl)?
cn Mamed (and not sepanted), or living cornmon lm?
O Separated?
or O Divorced?
O5 O Widowed?
5 . For statistid purposes ody, we n a d to knw your best estMate of the total incarne. befon
taxes, of ali household memben last year (1995). Cdd you pkw tell me kom the ard
which letter applies to your total housebolci incbme? ,

FORM Am2
Non-response questions ampl~td OYOS 0 NO
1. During the past month, did you m a t bnrdi,
what type of bmad did you uurrliy @8t? (Check onîy m) 00 NOT READ Whok whert (10096,75%,40%)
R W h h enrd
Multig ninlCnckaâ W)Hlt M d 8 u u Rlidn Bnrd
Do Nat K n w 0 t h ~
2. Dunng the past mon#, did you use milk?
what type of milk did you usurlly uw? ( C m onîy w) 06 MOT READ Who10 milk P m u i m o k mik
2% millt EwpamM mitk
1% milk Ol)m
Skim milk Doiràkiicn
Powkreâ Skim milk
3. Durin tne p u t month, dîd you um ny v ibmi ibdnd mq@mmt? r j w

6. Welght useû for rillbntim
Welght I s C P Measured
Self-reported
Refusal
Measured
Self-reportcd
Refusal
or [ I I lb.
8. Waist mj.n cm mI.0 cm , I I
I 9. Hips [ T l . Ocm~ j .ncm , t
Alkrtr üutritfon Smmy, lm. C n d r ' r Hmtth P t a ~ t l o n Smmy, 1990. Yovr Scotfr lutrltlan Swvey, 1090. P.E.1. Wutr i th 3uiury, 1M.

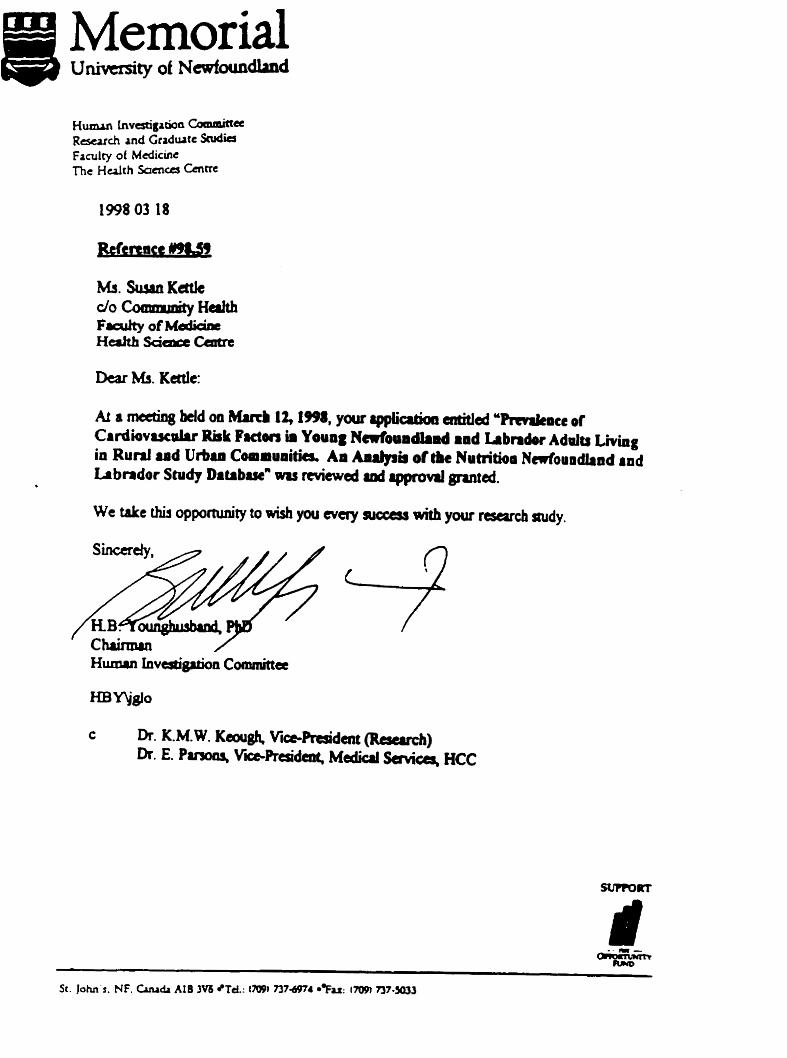
Mernorial H u m Lnvatigawa Canmirrec Rcscarch and Gradurtc W i e s Faculty of Medicine The H d t h Sama Cmnc
c Dr. K.M.W. Keaigh, V i M d c n t ( k m r c h ) h. E. P m ViResidenc, Mediul Saviceq HCC
SC. John's. NF. Cm& AIB SM Td.: i709i ?î7-4 e k : 17Wt 737-5033


Dmparbnmnt OC H d t h Haalth Promotion,
W H E W âhr information held by the Newfoundluid Medicd cw Conunhion (o whlch the W s b r of Haalth hu granbd me rccess by appmval dated Decsmbrr ~ & i Q g s , LI panonal and confidrnttal.
1, , rgms to do my utmoat to respect and pmtect
Ibo ~ m s l U v i t y and confidentiality of the fnfonnetion to whlch I have bern gmnted accear In îhe punuit of my tereuch.
1 M e r agi# (hrt I wiU e m w that eny person worHng with me or under my direction. who d l 1 hava accerr to Lhs confldantld infomi.tloa. subject of rhlr stitemint. wlll hava rlgned a statornent idsn9c.l Ln fom, to U r . befors ~aining rccerr to any of îhe infomtioa. %
I furthet i ~ m e rhit 1 1,411 e a r w that no mssmh data or miteriair will b i g i t h a d or creitd, in wble or In part, b & d on the confidentid infomtioo. whicb could Iead to îhe Idrn(ificiition of uiy individuai.