Dr Kate MackayDirector of Public
Health

QUALITY AND OUTCOMES DATA

Quality and Outcomes Framework
4 Domains:
• Clinical
• Organisational
• Patient Experience
• Additional Services
>1,200 Read codes

ROLES OF THE DIRECTOR OF PUBLIC HEALTH
To advise the PCT, the public and partner organisations on the health needs and relative priorities of the population, and how to meet those health needs and reduce inequalities.
ROLES OF THE DIRECTOR OF PUBLIC HEALTH
• DPH Annual Report
• Needs Assessment
• Equity Audit
DPH Annual Report
Description of the population
Health ProfileInequalities
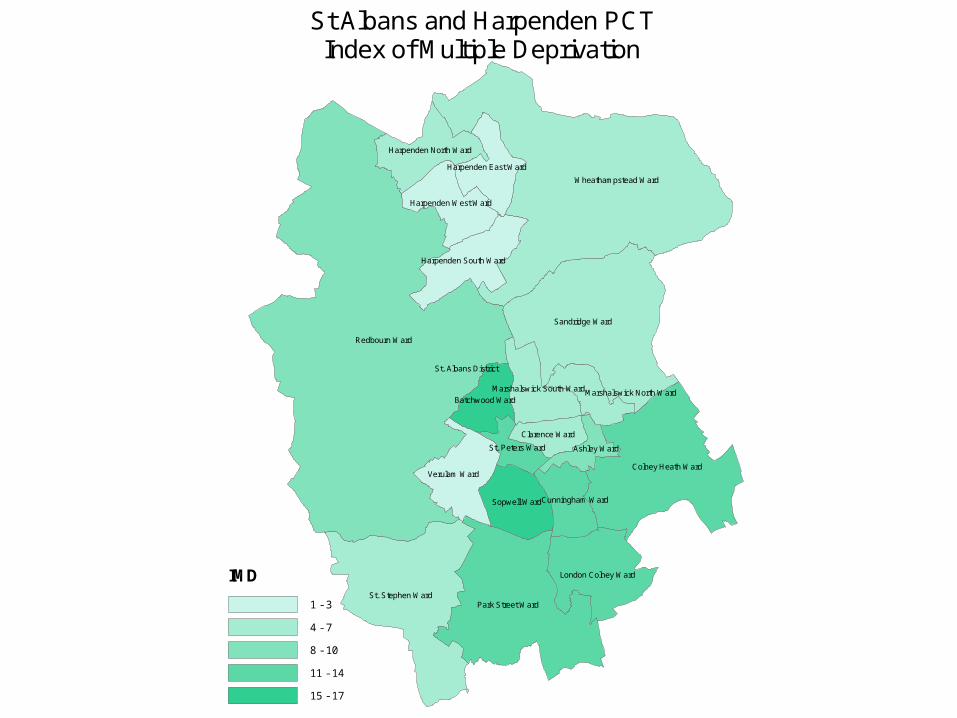
IMD
1 - 3
4 - 7
8 - 10
11 - 14
15 - 17
St Albans and Harpenden PCTIndex of Multiple Deprivation
St. Albans District
Redbourn Ward
Wheathampstead Ward
Sandridge Ward
Park Street WardSt. Stephen Ward
Colney Heath WardVerulam Ward
London Colney Ward
Sopwell Ward
Harpenden South Ward
Harpenden North Ward
Harpenden West Ward
Cunningham Ward
Batchwood Ward
Harpenden East Ward
Clarence Ward
Marshalswick South Ward
Ashley WardSt. Peters Ward
Marshalswick North Ward

Current Health
Overall health is goodbut
Prevalence of CHD lower than general population but still high
Prevalence of diabetes lower than the general population but still high and rising
Breast and colorectal cancer rates high MMR immunisation falling and rates of measles
rising . Rates of TB are significantly high
Current Health
Higher than average
rates
of
breast cancer

Mortality from Breast Cancer, DSR per 100,000, 1999 - 2001, ages 50 - 69 years 2001
0
20
40
60
80
100
120
140
160
Bedford PCT BedfordshireHeartlands PCT
Luton PCT Dacorum PCT Watford andThree Rivers PCT
St Albans and
Harpenden PCT
Hertsmere PCT NorthHertfordshire andStevenage PCT
Welwyn HatfieldPCT
South EastHertfordshire PCT
Royston,Buntingford and
Bishop's StortfordPCT
DS
R p
er 1
00,0
00
Rate for SHA Rate for England & Wales
Bars show 95% confidence intervals
Rate for SHA
Rate for England & Wales
Source:National statistics compendium of clinical Indicators

Current Health
Higher than average
rates
of
Colorectal cancer in men
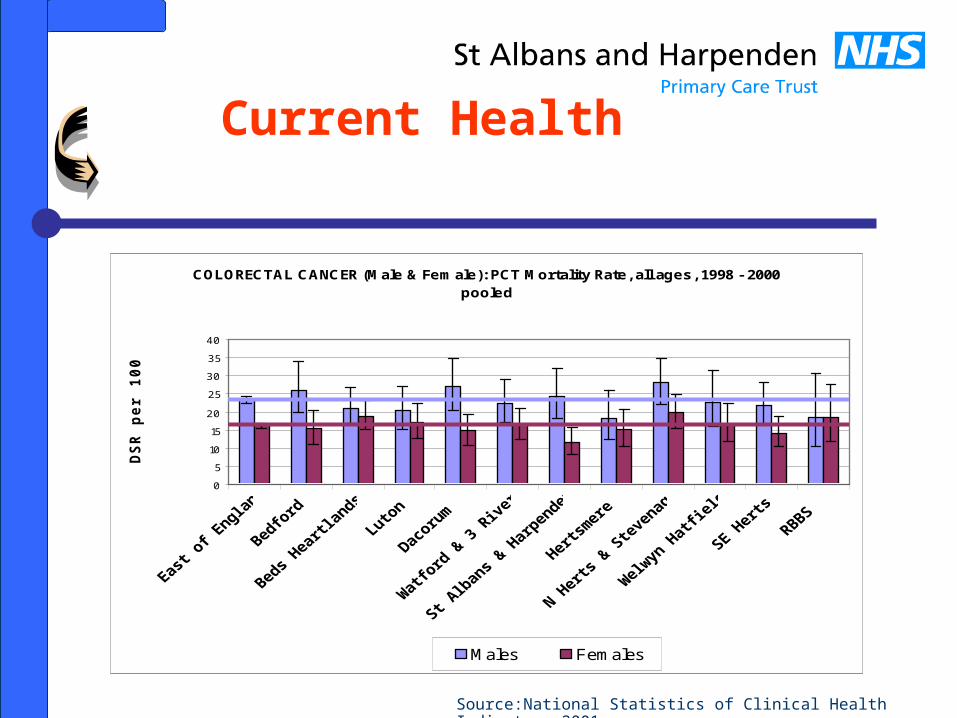
COLORECTAL CANCER (Male & Female): PCT Mortality Rate, all ages, 1998 - 2000 pooled
0
5
10
15
20
25
30
35
40
DS
R p
er
100,0
00
Males Females
Source:National Statistics of Clinical Health Indicators 2001
Current Health

Current Health
Too many people smoke Too little physical activity Despite the large number of restaurants diet is not
high enough in fruit and vegetables Dental health of 5 year olds is better than national
average it is not the best in Beds and Herts and is only marginally better than the national average

HOW CAN WE USE THE NEW DATA TO INFORM OUR KNOWLEDGE OF THE
POPULATION’S HEALTH?
QUALITY AND OUTCOME DATA

Coronary Heart Disease
CHD Prevalence in 35-74 yr olds 2002- 3
012345
1 2 3 4 5 6 7 8 9 10 11 12 13 14
Surgery
pe
rce
nta
ge
Source: Practice Audit

Diabetes
Diabetes Prevalence by Practice 2002
2.4 2.7
1.82.5
1.42.2 2.2
1.71.3
2.6 2.4
4.3
2.53.1
0
1
2
3
4
5
1 2 3 4 5 6 7 8 9 10 11 12 13 14
Practice
%
Source:Practice Audit

Diabetes
Type 2BMI >25 %
0
1020
30
4050
60
70
8090
100
Practice
%
2002
2003
Source: Practice Audit

Diabetes
Type 2BP <135/80
0
20
40
60
80
100
Practice
%
2002
2003
Source: Practice Audit
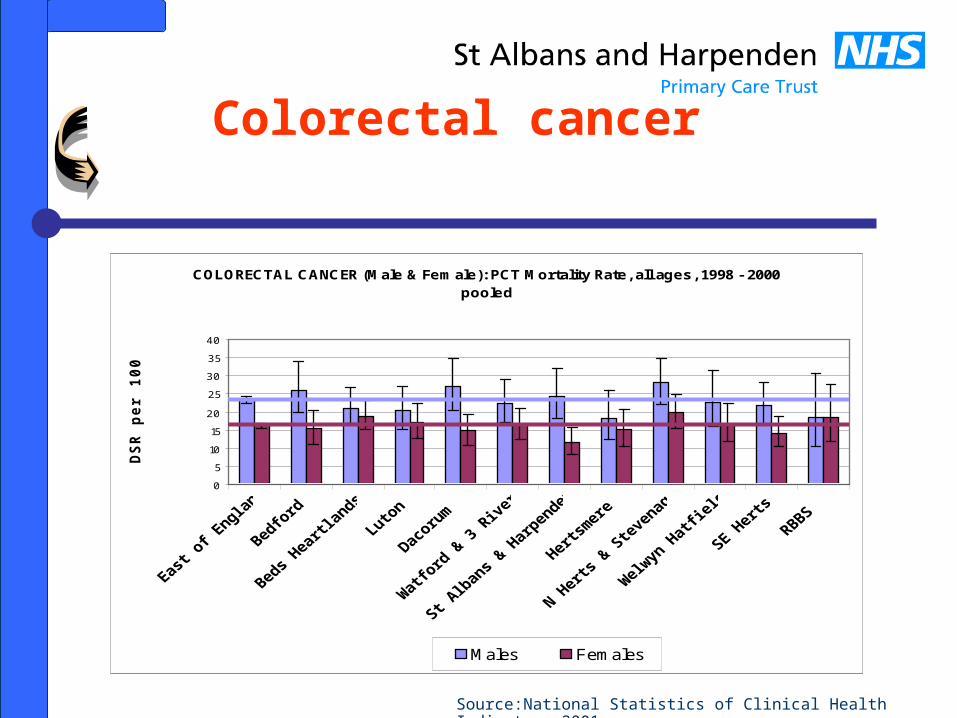
COLORECTAL CANCER (Male & Female): PCT Mortality Rate, all ages, 1998 - 2000 pooled
0
5
10
15
20
25
30
35
40
DS
R p
er
100,0
00
Males Females
Source:National Statistics of Clinical Health Indicators 2001
Colorectal cancer

Healthy Lifestyles
• Smoking
• Exercise
• BMI
• BP
• Lipids

QUALITY AND OUTCOMES DATA
• CHD• Stroke and TIA• HBP• Hypothyroidism• Diabetes• Mental Health• COPD• Asthma• Epilepsy• Cancer