Differential effects of cholesterol and phytosterols on cell
proliferation, apoptosis and expression of a prostate
specific gene in prostate cancer cell lines
Godwin O. Ifere PhDa,*, Erika Barr PhDa, Anita Equan MDa,Kereen Gordon MSca, Udai P. Singh PhDb, Jaideep Chaudhary PhDa,
Joseph U. Igietseme PhDc, Godwin A. Ananaba PhDa
a Department of Biological Sciences, and Center for Cancer Research and Therapeutic Development,
Clark Atlanta University, Atlanta, GA 30314, USAb Department of Microbiology, Biochemistry and Immunology, Morehouse School of Medicine, Atlanta, GA 30310, USA
c Molecular Pathogenesis Lab, National Center for Infectious Diseases, Centers for Disease Control & Prevention (CDC),
Atlanta, GA 30333, USA
Accepted 20 December 2008
Abstract
Background: The purpose of our study was to show the apoptotic and anti-proliferative effects of phytosterols as distinct from cholesterol
effects on prostate cancer cell lines, and also their differential expression of caveolin-1, and a prostate specific gene, PCGEM1. Methods: PC-3
and DU145 cells were treated with sterols (cholesterol and phytosterols) for 48 h, followed by trypan blue dye exclusion measurement of
cytotoxicity and MTT cell proliferation assays, respectively. Cell cycle analysis was carried out microscopically, and by propidium iodide
uptake using flow cytometry. Sterol induction of oncogenic gene expression was evaluated by RT-PCR. Apoptotic cells were identified by
immunocytochemistry using DNA fragmentation method, and by annexin V adhesion using flow cytometry. Results: Physiological doses
(16 mM) of these sterols were not cytotoxic in these cells. Cholesterol-enrichment promoted mitosis (54 and 61% by microscopy; 40.8 and
34.08% by FACS analysis in PC-3 and DU145, respectively) and cell growth (P < 0.05), while phytosterols suppressed mitosis (29 and 35%
by microscopy; 27.71 and 17.37% by FACS analysis in PC-3 and DU145, respectively), and significantly induced tumor-suppression
(P < 0.05) and apoptosis. We demonstrated for the first time that cholesterols upregulated the expression of PCGEM1 even in androgen-
insensitive prostate cancer cell lines. Phytosterols reversed this effect, while upregulating the expression of caveolin-1, a known mediator of
androgen-dependent proto-oncogene signals that presumably control growth and anti-apoptosis. Conclusions: Phytosterol inhibition of
PCGEM1 and cell growth and the overexpression of caveolin-1, suggests that poor disease prognosis anchors on the ability of caveolin-1 to
regulate downstream oncogene(s) and apoptosis genes. Sterol intake may contribute to the disparity in incidence of prostate cancer, and
elucidation of the mechanism for modulation of growth and apoptosis signaling may reveal potential targets for cancer prevention and/or
chemotherapeutic intervention. Sterol regulation of PCGEM1 expression suggests its potential as biomarker for prediction of neoplasms that
would be responsive to chemoprevention by phytosterols.
Published by Elsevier Ltd.
Keywords: Prostate cancer; Caveolin-1; Sterols; Cholesterol; Phytosterols; PCGEM1; Apoptosis; Proto-oncogene; Biomarkers; Chemoprevention
www.elsevier.com/locate/cdp
Cancer Detection and Prevention 32 (2009) 319–328
* Corresponding author at: Department of Biological Sciences, Clark
Atlanta University, 223 James P. Brawley DR. S.W., Atlanta, GA 30314,
USA. Tel.: +1 404 880 6977; fax: +1 404 880 8065.
E-mail address: [email protected] (G.O. Ifere).
0361-090X/$ – see front matter. Published by Elsevier Ltd.
doi:10.1016/j.cdp.2008.12.002
1. Introduction
High prevalence and poor prognosis of prostate cancer has
been associated with increased intake of saturated fats and
cholesterol [1,2]. To the contrary, dietary phytosterols, which
are plant cholesterol counterparts, have reportedly suppres-
G.O. Ifere et al. / Cancer Detection and Prevention 32 (2009) 319–328320
sive effects on cell growth [3,4]. The contribution of high
sterol diets to the etiology, progression or prevention/reversal
of prostate cancer may be understood from cholesterol’s
crucial role in membrane organization, dynamics, function
and sorting [5]. Associated with membrane cholesterol is the
protein caveolin-1 (cav-1), a vital component of caveolae,
which are cytomorphologically pitted vesicular membrane
invaginations organized as specialized lipid rafts [6,7].
Basically, caveolae is formed by the homo- and hetero-
oligomerization of the three currently known caveolins. Of
these caveolins, cav-1 is involved in signal transduction
largely because of the presence of a 20 amino acid micro-
domain which can bind a variety of signal proteins [6], most
often leading to downstream signaling events [8,9]. cav-1 has
been identified as a marker of aggressive prostate carcinoma
[10,11] that promotes progression to the metastatic phenotype
[12]. The significance of cav-1 in cell signaling is demo-
nstrated by its coordinating the interaction, redistribution and
co-localization of several proteins with each other during
experimental clustering of raft components [13]. Typically,
cav-1 co-localizes with androgen receptors within lipid raft
domains to mediate androgen-dependent signals [14,15],
especially downstream signals that modulate the expression
of genes implicated in unregulated cell growth [6].
Unregulated cell growth occurs mostly when cells loose
their ability to undergo apoptosis, often leading to cancer.
Various studies have confirmed the loss in cell growth
control following alteration of apoptotic pathways [16]. The
susceptibility of a cell to apoptosis is widely believed to be
mediated by the expression of a complex family of genes
that principally include p53 [16], which also mediate the
transcriptional activation of cav-1 [17]. Thus, cholesterol-
enrichment which results in oxidative stress [18], often lead
to DNA damage and increase in p53 protein expression [19],
G1 cell cycle arrest and interaction of numerous pro- and
anti-apoptosis proteins [16]. Cholesterol-mediated dysregu-
lation of cav-1 [10], and apoptotic suppressor genes [16] by
aberrant p53 highlights the significance of p53 in
cholesterol-mediated cell growth, and anti-apoptosis. In
all, it is likely that understanding the mechanism of
cholesterol-mediated transcription of apoptosis suppressors
may be significant in elucidating the contribution of sterols
in the etiology, progression or prevention/regression of
prostate cancer.
Overall, the importance of sterols in the promotion of cell
growth may therefore, depend on their orchestrating the co-
localization of cav-1 and androgen receptor at the plasma
membrane [14,15]. Androgen receptors elaborate the
biological effects of androgens in target cells, by mediating
the transcriptional regulation of androgen-regulated genes
[20]. Recent data suggest ethnic variation in the pattern of
expression of a prostate specific androgen-regulated gene
(PCGEM1) [21], which promote unregulated cell growth.
Although this proto-oncogene is irregularly expressed in high
risk and poorly progressed prostate cancer [21], its trans-
criptional regulation by sterols and cav-1 to our knowledge
has not been elucidated. Based on evidence that cav-1 is
differentially transcribed by either sterol status [13,22]
resulting in modulation of cell growth, we hypothesized that
these sterols regulate prostate cell growth by promoting or
repressing the transcription of cav-1 and its downstream
signals. To test this hypothesis, we examined the effects of
different sterol-enrichment on cav-1 expression, cell growth,
apoptosis, and on the expression of downstream proto-
oncogene PCGEM1, using PC-3 and DU145 prostate cancer
cell lines.
2. Materials and methods
2.1. Cell culture
Androgen-independent prostate cancer cell lines PC-3
and DU145 were obtained from ATCC (Manassas, VA). The
cells were cultured in MEM with 10% FBS, 1% penicillin/
streptomycin, 1% glutamine, 1% non-essential amino acids,
0.1% gentamicine and fungizone and buffered with 0.75%
HEPES at 37 8C in 5% CO2 for 24 h. The medium was then
changed to 1% FBS-MEM, and the cells incubated for 24 h
before treatment with sterols. Experimental media were
supplemented with sterols (cholesterol or phytosterols; 10%
campesterol: 75% b-sitosterol) (Acros organics, NJ) at final
concentrations of 16 mM. The phytosterol combination
chosen represent the typical percentage concentration of b-
sitosterol (78–83%) relative to phytosterols found in
peanuts; which is a reported classic phytosterol source
[23]. Optimum sterol concentration of 16 mM was chosen
after dose–response experiments produced results that were
consistent with physiological levels for phytosterols, and
with previously observed values [3,24]. For all treatments,
sterols were mixed in the media with a sterol carrier (2-
hydroxypropyl)-b-cyclodextrin (b-CD) (Sigma–Aldrich, St.
Louis, MO) and supplied to the cells as complexes. To
provide the sterols in an assimilable and nontoxic form, the
sterol to cyclodextrin molar ratio was maintained at 1:300
(16 mM sterol: 5 mM b-CD) as previously reported [24,25].
All treatments were performed in triplicates. After stimula-
tion for 48 h, the cells or total RNA were analyzed in
different experiments.
2.2. Measurement of sterol effects on cell viability
PC-3 and DU145 cells (5000 cells/cm2) were seeded in
triplicates into 6-well plates for 24 h. The medium was
replaced with 1% FBS-MEM for 24 h, then the cells were
supplemented with 16 mM sterols and vehicle for 48 h and
72 h. Viability of cells given different sterol treatment was
measured by trypan blue dye exclusion method. After 48 h,
1 � 106 ml�1 cell suspension for viability assay was
prepared by trypsinization, centrifugation and counting
with a hemocytometer. A 1:1 dilution of 200 ml of the cell
suspension was made using 0.4% trypan blue solution and
G.O. Ifere et al. / Cancer Detection and Prevention 32 (2009) 319–328 321
incubated for 3 min at room temperature. Replicate samples
of stained and unstained cells from each well were counted
with a hemocytometer on a microscope under a 10�objective. Following analysis of variance, data from all
experiments were pooled for further statistical analysis. The
calculated percentage of unstained cells represents the
percentage of viable cells. Micrographs of cells receiving
each of the treatments were taken.
2.3. Cell cycle analysis by flow cytometry
Cell cycle analysis was performed by propidium iodide
(PI) staining. Triplicates of sterol- and vehicle-treated
prostate tumor cells (1 � 10�6) seeded in 6-well cell
cultures dishes were harvested after 48 h and washed with
ice-cold PBS. The cells were then fixed in ice-cold 70%
ethanol, vortexed and stored at 4 8C for 1 h. This was
followed by centrifugation at 3000 rpm for 5 min and two
times washing in PBS. Fifty microliters of RNAse (100 mg/
ml) was added to the pelleted cells and incubated at room
temperature for 15 min. After addition of 400 ml of PI
(50 mg/ml) to the cells, staining was analyzed by flow
cytometry.
2.4. Cell proliferation assay
Cell proliferation was determined using the CellTiter 96
Non-Radioactive Cell proliferation Assay (Promega Corp.,
Madison, WI), which is based on the cellular conversion of a
tetrazolium salt into formazan product that is detectable
using a 96-well plate reader. Briefly, 100 ml of 1 � 104
prostate cells were seeded into wells of a 96-well plate and
incubated for 24 h. Then the medium was changed to one
containing 1% FBS for another 24 h and then supplemented
with vehicle (b-CD), cholesterol or phytosterols (10%
campesterol: 75% b-sitosterol) for 48 h at 37 8C in a
humidified atmosphere. After 72 h of culture, a chromogenic
dye solution (15 ml) was added to each well and the plate
incubated again at 37 8C for 4 h. After incubation, 100 ml of
solubilization solution/Stop Mix was added to each well and
within 1 h, the contents of the wells were mixed to get a
uniformly colored solution. The absorbance of the colored
reaction product was recorded at 570 nm wavelength using
Synergy 2 multi-detection microplate reader (BioTek
Instruments Inc., Winooski, VT).
2.5. RNA isolation and RT-PCR
To determine the effects of sterol treatment on the
expression of cav-1 and PCGEM1 total RNA was extracted
from cultured prostate cancer cells using RNA isolation
protocol according to manufacturer’s instructions (RNeasy
kit, Qiagen, Valencia, CA). To synthesize cDNA by reverse
transcription, 0.25 mg of total RNA and 1 ml each of oligo-dT
and dNTP mix were used as described in the enhanced avian
reverse transcriptase-PCR kit protocol (Sigma–Aldrich, St.
Louis, MO). A portion (2 ml) of each cDNA was used to
amplify the fragments of the genes in the presence of Taq
DNA polymerase (Sigma, MO). Specific primers for RT-PCR
amplification of the various genes were as follows: (a)
PCGEM1: sense 50-AAGTGAGCAGG-CTTGGTGCATTT-
G-30 and anti-sense 50-ACGTGCCTACCCTTAGGAAAG-
CAT-30; (b) cav-1: sense 50-ACCTCAACGATGACGTGGT-
CAAGA-30 and anti-sense 50-TGGAATAGACAC-ACGG-
CTGATGCACT-30; (c) GAPDH: sense 50-CCACCCATGG-
CAAATTCCATGGCA-30 and anti-sense 50-TC-TAGAGG-
GCAGGTCAGGTCCACC-30.Reaction conditions were: 1 cycle of 95 8C for 10 min,
followed by 40 cycles for PCGEM1, cav-1, and GAPDH.
This was followed by heating at 95 8C for 1 and 2 min,
respectively, for denaturation of cav-1, PCGEM1 and
GAPDH. Annealing was at 65 8C and extension at 72 8Cfor 2 min and final extension of 1 cycle of 72 8C for 5 min.
PCR products were analyzed on 1.5% agarose gel and
visualized by ethidium bromide staining method. All
reactions were normalized by GAPDH mRNA expression.
2.6. Assessment of cell apoptosis
The apoptotic and anti-apoptotic effects of phytosterols-,
cholesterol- and vehicle-treated prostate tumor cells seeded
in biological growth chambers (Lab-Tek Instruments, VT)
were assessed according to, the TDT-FragEL DNA
fragmentation method described in kit protocols (Calbio-
chem, San Diego, CA). After staining and counterstaining
with diaminobenzidine (DAB) and methyl green, respec-
tively, an accurate estimate of the overall apoptotic rate was
obtained by acquiring and processing digital images of
stained sections with microimage program (Axio Vision
digital image processing software, Carl Zeiss Microimaging,
Inc., Thornwood, NY). The number of cells staining dark-
brown (apoptosis), and blue-green (total number) were
quantitated independently in five separate fields on three
different slides for each experimental group, and the mean
percentage of apoptotic cells then calculated. Alternatively,
cells treated with vehicle control and different sterols were
washed with ice-cold PBS. To determine the level of
Annexin binding in sterol treated and untreated PC-3 and
DU145 cells, triplicates of all cell treatments were stained
with Alexa Flour 488 annexin V and propidium iodide
following procedures suggested by manufacturer, using the
Vybrant apoptosis assay kit #2 (Molecular Probes Inc.,
Eugene, OR), and then analyzed by flow cytometry using
FACScanTM flow cytometer and CellQuest software (BD
Pharmingen).
2.7. Statistical analysis
Data are given as mean values (�S.D.). Differences
between treatment groups were determined by two-way
ANOVA [26]. In all analyses, a P-value less than 0.05 was
considered statistically significant.
G.O. Ifere et al. / Cancer Detection and Prevention 32 (2009) 319–328322
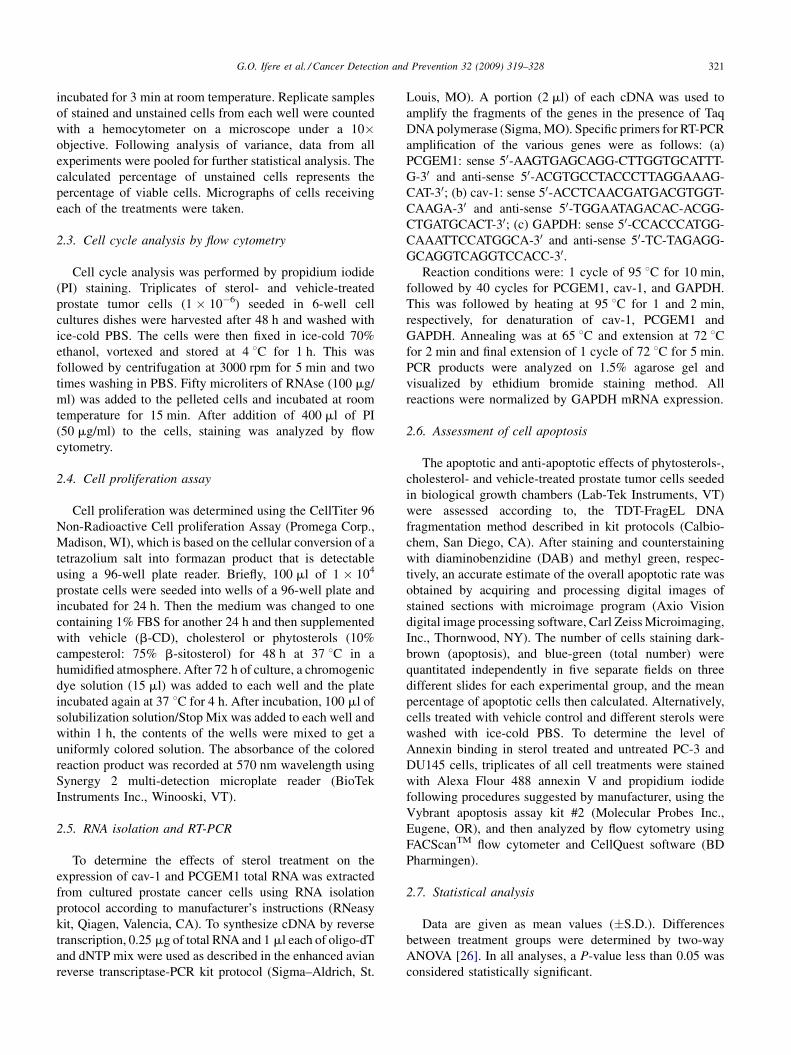
Fig. 1. Effects of sterol supplementation on viability of PC-3 and DU145
cells. Viability of cells was measured by trypan blue dye exclusion method
after 72 h and the number of cells counted with a hemocytometer on a
microscope under 10� objective. The treatments were assayed in triplicate
examinations.
3. Results
3.1. Cell viability assay
Viability assays were used to estimate the effects of
vehicle, cholesterol and phytosterol treatments on cell
survival. The results obtained did not show any significant
difference (P > 0.05) in the number of viable cells observed
for all the treatments after 48 h (Fig. 1).
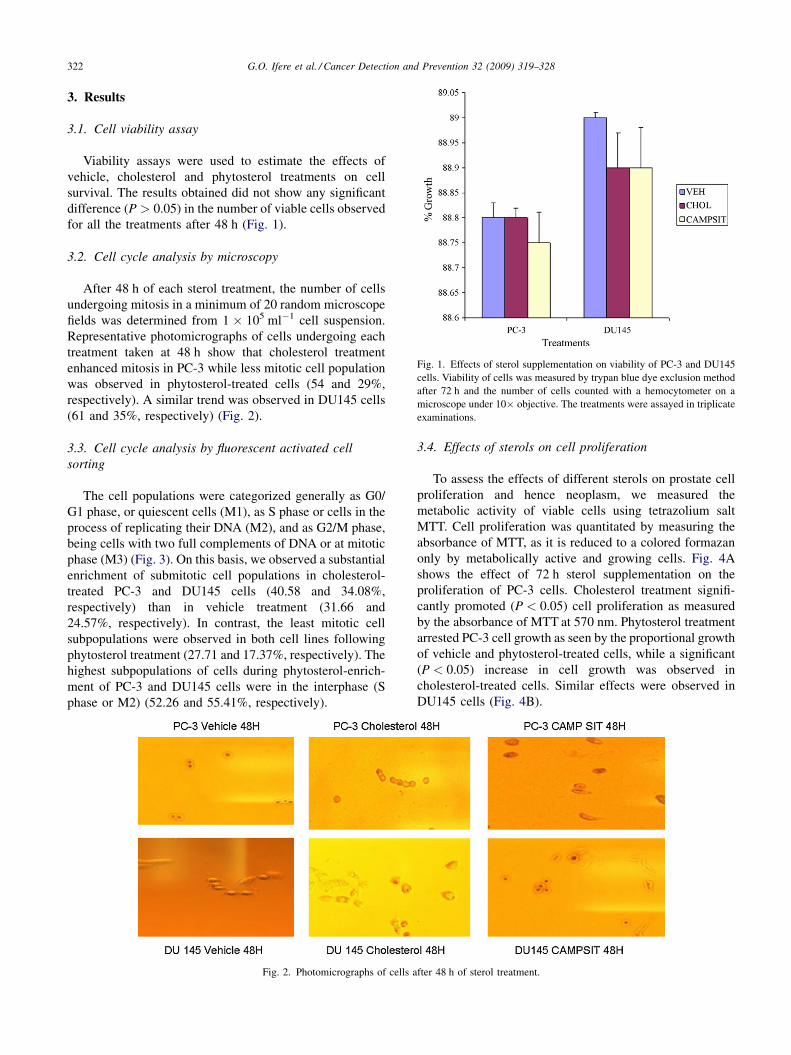
3.2. Cell cycle analysis by microscopy
After 48 h of each sterol treatment, the number of cells
undergoing mitosis in a minimum of 20 random microscope
fields was determined from 1 � 105 ml�1 cell suspension.
Representative photomicrographs of cells undergoing each
treatment taken at 48 h show that cholesterol treatment
enhanced mitosis in PC-3 while less mitotic cell population
was observed in phytosterol-treated cells (54 and 29%,
respectively). A similar trend was observed in DU145 cells
(61 and 35%, respectively) (Fig. 2).
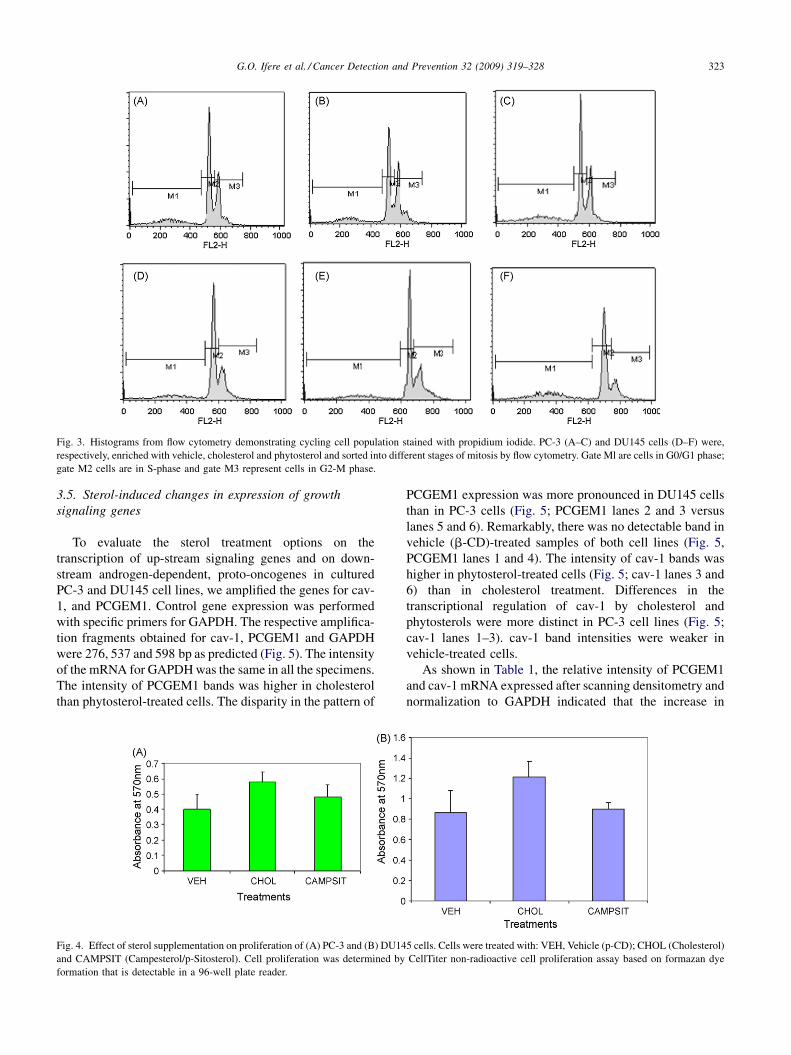
3.3. Cell cycle analysis by fluorescent activated cell
sorting
The cell populations were categorized generally as G0/
G1 phase, or quiescent cells (M1), as S phase or cells in the
process of replicating their DNA (M2), and as G2/M phase,
being cells with two full complements of DNA or at mitotic
phase (M3) (Fig. 3). On this basis, we observed a substantial
enrichment of submitotic cell populations in cholesterol-
treated PC-3 and DU145 cells (40.58 and 34.08%,
respectively) than in vehicle treatment (31.66 and
24.57%, respectively). In contrast, the least mitotic cell
subpopulations were observed in both cell lines following
phytosterol treatment (27.71 and 17.37%, respectively). The
highest subpopulations of cells during phytosterol-enrich-
ment of PC-3 and DU145 cells were in the interphase (S
phase or M2) (52.26 and 55.41%, respectively).
Fig. 2. Photomicrographs of cells a
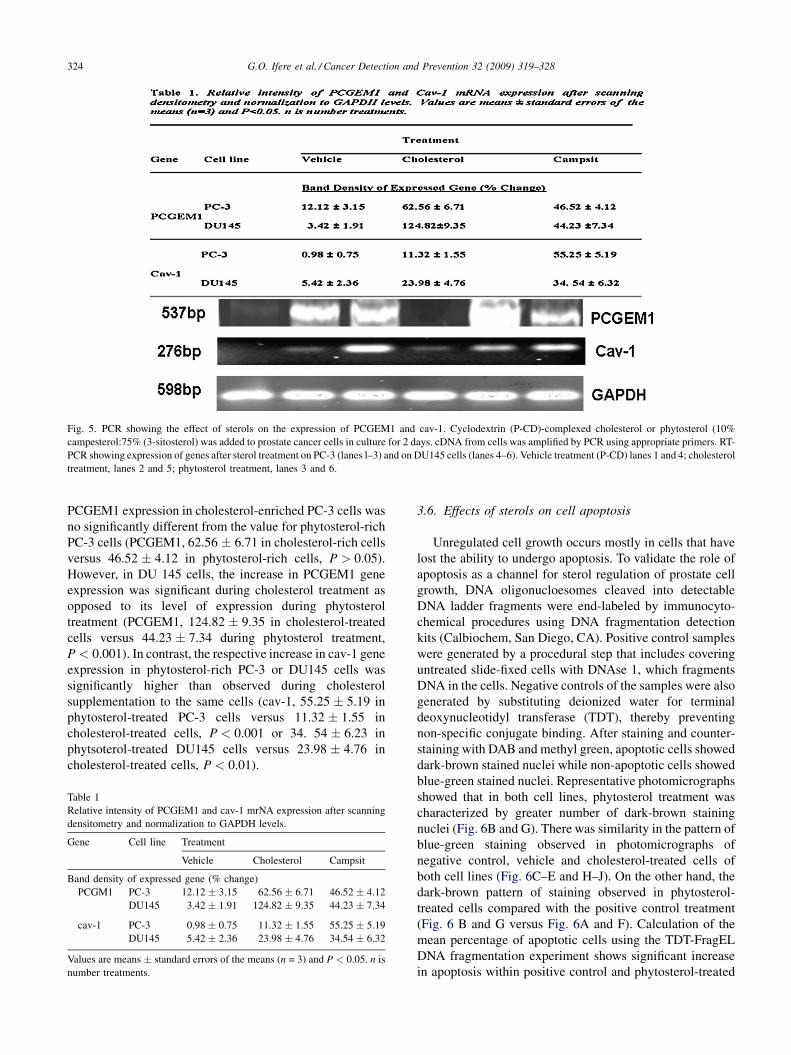
3.4. Effects of sterols on cell proliferation
To assess the effects of different sterols on prostate cell
proliferation and hence neoplasm, we measured the
metabolic activity of viable cells using tetrazolium salt
MTT. Cell proliferation was quantitated by measuring the
absorbance of MTT, as it is reduced to a colored formazan
only by metabolically active and growing cells. Fig. 4A
shows the effect of 72 h sterol supplementation on the
proliferation of PC-3 cells. Cholesterol treatment signifi-
cantly promoted (P < 0.05) cell proliferation as measured
by the absorbance of MTT at 570 nm. Phytosterol treatment
arrested PC-3 cell growth as seen by the proportional growth
of vehicle and phytosterol-treated cells, while a significant
(P < 0.05) increase in cell growth was observed in
cholesterol-treated cells. Similar effects were observed in
DU145 cells (Fig. 4B).
fter 48 h of sterol treatment.
G.O. Ifere et al. / Cancer Detection and Prevention 32 (2009) 319–328 323
Fig. 3. Histograms from flow cytometry demonstrating cycling cell population stained with propidium iodide. PC-3 (A–C) and DU145 cells (D–F) were,
respectively, enriched with vehicle, cholesterol and phytosterol and sorted into different stages of mitosis by flow cytometry. Gate Ml are cells in G0/G1 phase;
gate M2 cells are in S-phase and gate M3 represent cells in G2-M phase.
3.5. Sterol-induced changes in expression of growth
signaling genes
To evaluate the sterol treatment options on the
transcription of up-stream signaling genes and on down-
stream androgen-dependent, proto-oncogenes in cultured
PC-3 and DU145 cell lines, we amplified the genes for cav-
1, and PCGEM1. Control gene expression was performed
with specific primers for GAPDH. The respective amplifica-
tion fragments obtained for cav-1, PCGEM1 and GAPDH
were 276, 537 and 598 bp as predicted (Fig. 5). The intensity
of the mRNA for GAPDH was the same in all the specimens.
The intensity of PCGEM1 bands was higher in cholesterol
than phytosterol-treated cells. The disparity in the pattern of
Fig. 4. Effect of sterol supplementation on proliferation of (A) PC-3 and (B) DU14
and CAMPSIT (Campesterol/p-Sitosterol). Cell proliferation was determined by
formation that is detectable in a 96-well plate reader.
PCGEM1 expression was more pronounced in DU145 cells
than in PC-3 cells (Fig. 5; PCGEM1 lanes 2 and 3 versus
lanes 5 and 6). Remarkably, there was no detectable band in
vehicle (b-CD)-treated samples of both cell lines (Fig. 5,
PCGEM1 lanes 1 and 4). The intensity of cav-1 bands was
higher in phytosterol-treated cells (Fig. 5; cav-1 lanes 3 and
6) than in cholesterol treatment. Differences in the
transcriptional regulation of cav-1 by cholesterol and
phytosterols were more distinct in PC-3 cell lines (Fig. 5;
cav-1 lanes 1–3). cav-1 band intensities were weaker in
vehicle-treated cells.
As shown in Table 1, the relative intensity of PCGEM1
and cav-1 mRNA expressed after scanning densitometry and
normalization to GAPDH indicated that the increase in
5 cells. Cells were treated with: VEH, Vehicle (p-CD); CHOL (Cholesterol)
CellTiter non-radioactive cell proliferation assay based on formazan dye
G.O. Ifere et al. / Cancer Detection and Prevention 32 (2009) 319–328324
Fig. 5. PCR showing the effect of sterols on the expression of PCGEM1 and cav-1. Cyclodextrin (P-CD)-complexed cholesterol or phytosterol (10%
campesterol:75% (3-sitosterol) was added to prostate cancer cells in culture for 2 days. cDNA from cells was amplified by PCR using appropriate primers. RT-
PCR showing expression of genes after sterol treatment on PC-3 (lanes l–3) and on DU145 cells (lanes 4–6). Vehicle treatment (P-CD) lanes 1 and 4; cholesterol
treatment, lanes 2 and 5; phytosterol treatment, lanes 3 and 6.
PCGEM1 expression in cholesterol-enriched PC-3 cells was
no significantly different from the value for phytosterol-rich
PC-3 cells (PCGEM1, 62.56 � 6.71 in cholesterol-rich cells
versus 46.52 � 4.12 in phytosterol-rich cells, P > 0.05).
However, in DU 145 cells, the increase in PCGEM1 gene
expression was significant during cholesterol treatment as
opposed to its level of expression during phytosterol
treatment (PCGEM1, 124.82 � 9.35 in cholesterol-treated
cells versus 44.23 � 7.34 during phytosterol treatment,
P < 0.001). In contrast, the respective increase in cav-1 gene
expression in phytosterol-rich PC-3 or DU145 cells was
significantly higher than observed during cholesterol
supplementation to the same cells (cav-1, 55.25 � 5.19 in
phytosterol-treated PC-3 cells versus 11.32 � 1.55 in
cholesterol-treated cells, P < 0.001 or 34. 54 � 6.23 in
phytsoterol-treated DU145 cells versus 23.98 � 4.76 in
cholesterol-treated cells, P < 0.01).
Table 1
Relative intensity of PCGEM1 and cav-1 mrNA expression after scanning
densitometry and normalization to GAPDH levels.
Gene Cell line Treatment
Vehicle Cholesterol Campsit
Band density of expressed gene (% change)
PCGM1 PC-3 12.12 � 3.15 62.56 � 6.71 46.52 � 4.12
DU145 3.42 � 1.91 124.82 � 9.35 44.23 � 7.34
cav-1 PC-3 0.98 � 0.75 11.32 � 1.55 55.25 � 5.19
DU145 5.42 � 2.36 23.98 � 4.76 34.54 � 6.32
Values are means � standard errors of the means (n = 3) and P < 0.05. n is
number treatments.
3.6. Effects of sterols on cell apoptosis
Unregulated cell growth occurs mostly in cells that have
lost the ability to undergo apoptosis. To validate the role of
apoptosis as a channel for sterol regulation of prostate cell
growth, DNA oligonucloesomes cleaved into detectable
DNA ladder fragments were end-labeled by immunocyto-
chemical procedures using DNA fragmentation detection
kits (Calbiochem, San Diego, CA). Positive control samples
were generated by a procedural step that includes covering
untreated slide-fixed cells with DNAse 1, which fragments
DNA in the cells. Negative controls of the samples were also
generated by substituting deionized water for terminal
deoxynucleotidyl transferase (TDT), thereby preventing
non-specific conjugate binding. After staining and counter-
staining with DAB and methyl green, apoptotic cells showed
dark-brown stained nuclei while non-apoptotic cells showed
blue-green stained nuclei. Representative photomicrographs
showed that in both cell lines, phytosterol treatment was
characterized by greater number of dark-brown staining
nuclei (Fig. 6B and G). There was similarity in the pattern of
blue-green staining observed in photomicrographs of
negative control, vehicle and cholesterol-treated cells of
both cell lines (Fig. 6C–E and H–J). On the other hand, the
dark-brown pattern of staining observed in phytosterol-
treated cells compared with the positive control treatment
(Fig. 6 B and G versus Fig. 6A and F). Calculation of the
mean percentage of apoptotic cells using the TDT-FragEL
DNA fragmentation experiment shows significant increase
in apoptosis within positive control and phytosterol-treated
G.O. Ifere et al. / Cancer Detection and Prevention 32 (2009) 319–328 325
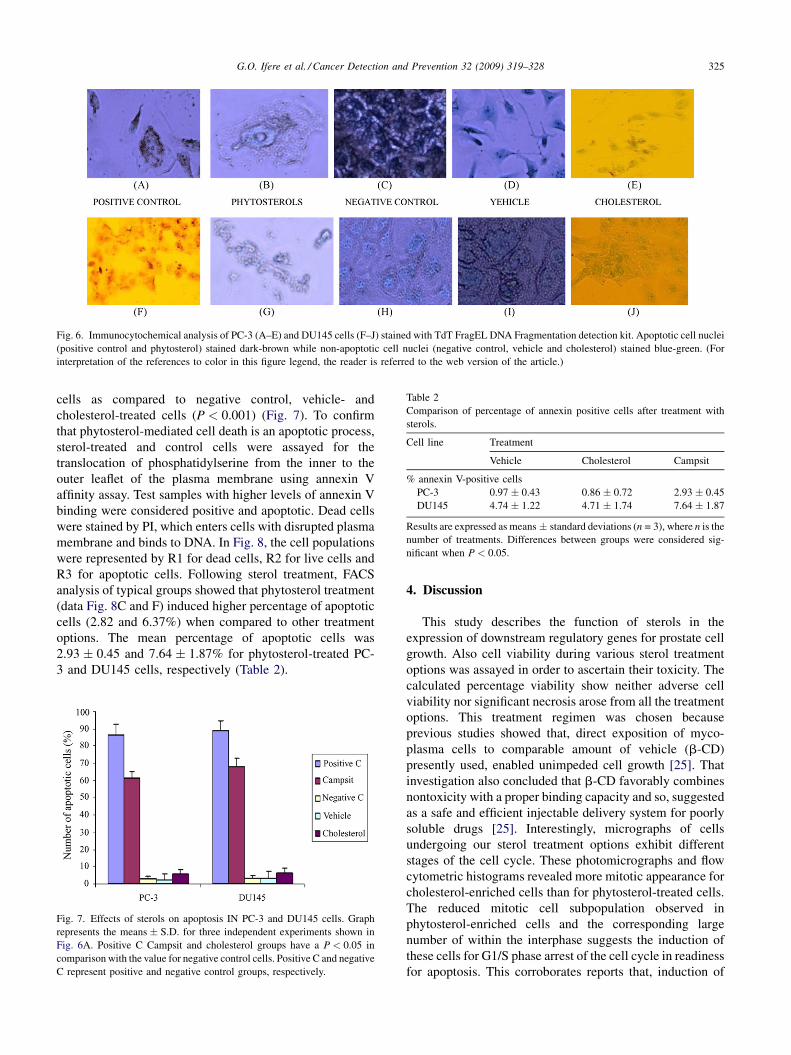
Fig. 6. Immunocytochemical analysis of PC-3 (A–E) and DU145 cells (F–J) stained with TdT FragEL DNA Fragmentation detection kit. Apoptotic cell nuclei
(positive control and phytosterol) stained dark-brown while non-apoptotic cell nuclei (negative control, vehicle and cholesterol) stained blue-green. (For
interpretation of the references to color in this figure legend, the reader is referred to the web version of the article.)
Table 2
Comparison of percentage of annexin positive cells after treatment with
sterols.
Cell line Treatment
Vehicle Cholesterol Campsit
% annexin V-positive cells
PC-3 0.97 � 0.43 0.86 � 0.72 2.93 � 0.45
DU145 4.74 � 1.22 4.71 � 1.74 7.64 � 1.87
Results are expressed as means � standard deviations (n = 3), where n is the
number of treatments. Differences between groups were considered sig-
nificant when P < 0.05.
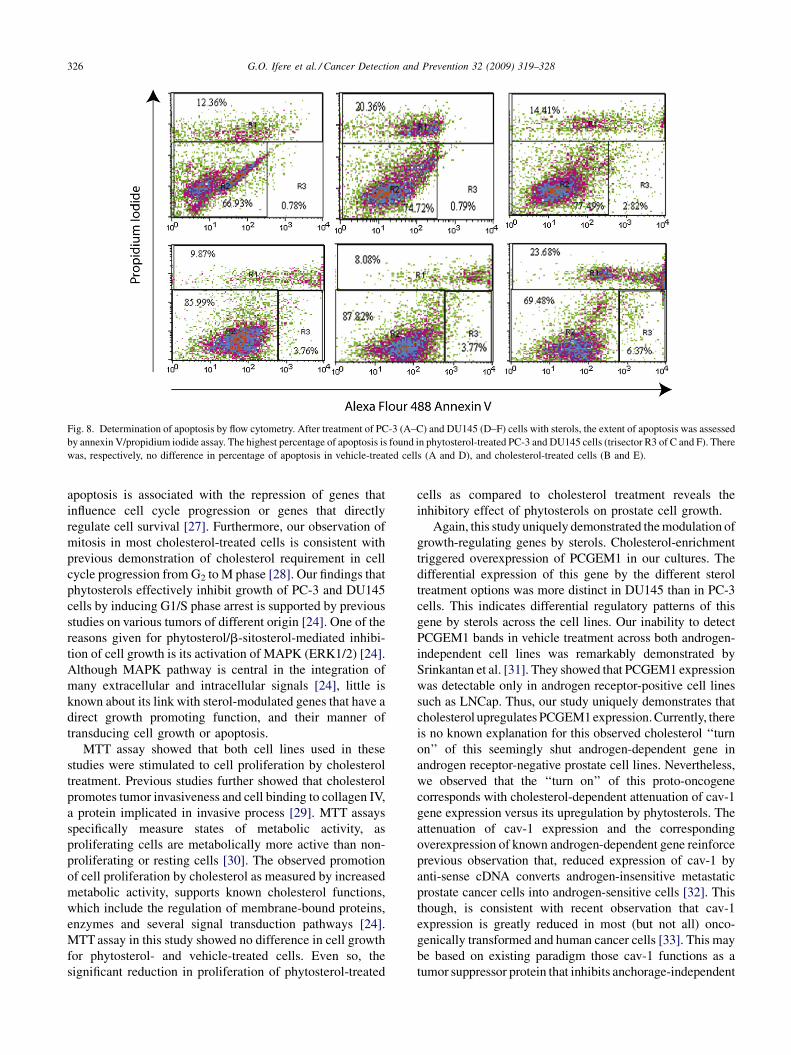
cells as compared to negative control, vehicle- and
cholesterol-treated cells (P < 0.001) (Fig. 7). To confirm
that phytosterol-mediated cell death is an apoptotic process,
sterol-treated and control cells were assayed for the
translocation of phosphatidylserine from the inner to the
outer leaflet of the plasma membrane using annexin V
affinity assay. Test samples with higher levels of annexin V
binding were considered positive and apoptotic. Dead cells
were stained by PI, which enters cells with disrupted plasma
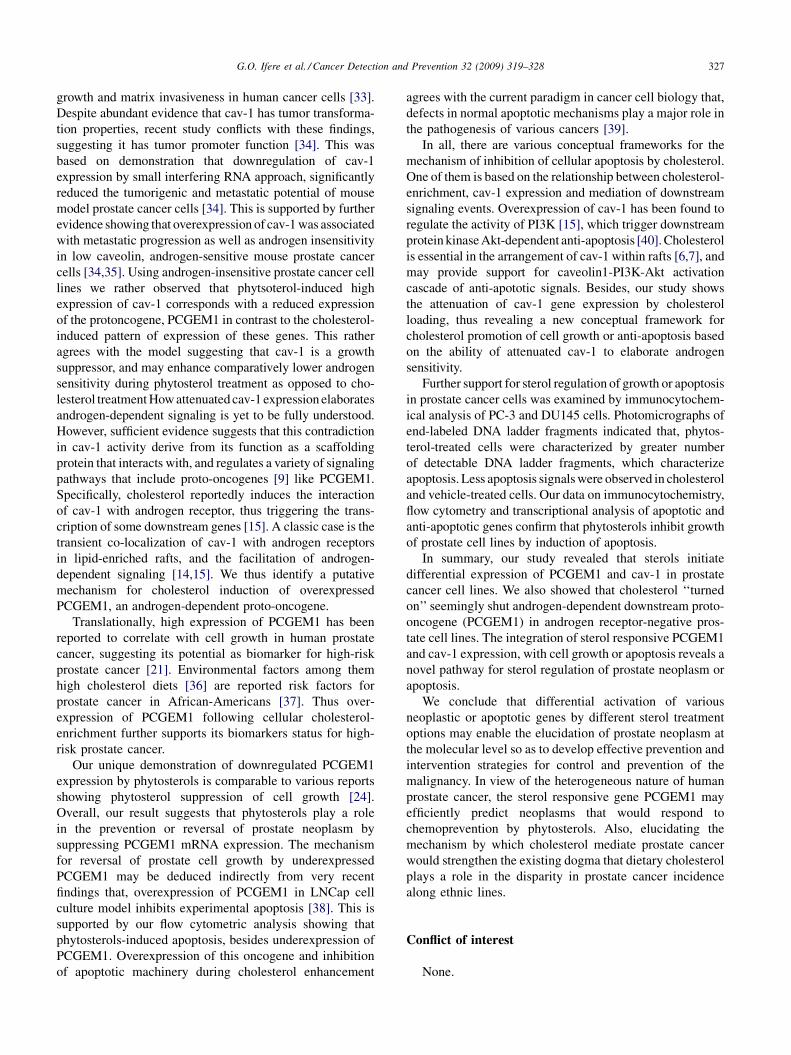
membrane and binds to DNA. In Fig. 8, the cell populations
were represented by R1 for dead cells, R2 for live cells and
R3 for apoptotic cells. Following sterol treatment, FACS
analysis of typical groups showed that phytosterol treatment
(data Fig. 8C and F) induced higher percentage of apoptotic
cells (2.82 and 6.37%) when compared to other treatment
options. The mean percentage of apoptotic cells was
2.93 � 0.45 and 7.64 � 1.87% for phytosterol-treated PC-
3 and DU145 cells, respectively (Table 2).
Fig. 7. Effects of sterols on apoptosis IN PC-3 and DU145 cells. Graph
represents the means � S.D. for three independent experiments shown in
Fig. 6A. Positive C Campsit and cholesterol groups have a P < 0.05 in
comparison with the value for negative control cells. Positive C and negative
C represent positive and negative control groups, respectively.
4. Discussion
This study describes the function of sterols in the
expression of downstream regulatory genes for prostate cell
growth. Also cell viability during various sterol treatment
options was assayed in order to ascertain their toxicity. The
calculated percentage viability show neither adverse cell
viability nor significant necrosis arose from all the treatment
options. This treatment regimen was chosen because
previous studies showed that, direct exposition of myco-
plasma cells to comparable amount of vehicle (b-CD)
presently used, enabled unimpeded cell growth [25]. That
investigation also concluded that b-CD favorably combines
nontoxicity with a proper binding capacity and so, suggested
as a safe and efficient injectable delivery system for poorly
soluble drugs [25]. Interestingly, micrographs of cells
undergoing our sterol treatment options exhibit different
stages of the cell cycle. These photomicrographs and flow
cytometric histograms revealed more mitotic appearance for
cholesterol-enriched cells than for phytosterol-treated cells.
The reduced mitotic cell subpopulation observed in
phytosterol-enriched cells and the corresponding large
number of within the interphase suggests the induction of
these cells for G1/S phase arrest of the cell cycle in readiness
for apoptosis. This corroborates reports that, induction of
G.O. Ifere et al. / Cancer Detection and Prevention 32 (2009) 319–328326
Fig. 8. Determination of apoptosis by flow cytometry. After treatment of PC-3 (A–C) and DU145 (D–F) cells with sterols, the extent of apoptosis was assessed
by annexin V/propidium iodide assay. The highest percentage of apoptosis is found in phytosterol-treated PC-3 and DU145 cells (trisector R3 of C and F). There
was, respectively, no difference in percentage of apoptosis in vehicle-treated cells (A and D), and cholesterol-treated cells (B and E).
apoptosis is associated with the repression of genes that
influence cell cycle progression or genes that directly
regulate cell survival [27]. Furthermore, our observation of
mitosis in most cholesterol-treated cells is consistent with
previous demonstration of cholesterol requirement in cell
cycle progression from G2 to M phase [28]. Our findings that
phytosterols effectively inhibit growth of PC-3 and DU145
cells by inducing G1/S phase arrest is supported by previous
studies on various tumors of different origin [24]. One of the
reasons given for phytosterol/b-sitosterol-mediated inhibi-
tion of cell growth is its activation of MAPK (ERK1/2) [24].
Although MAPK pathway is central in the integration of
many extracellular and intracellular signals [24], little is
known about its link with sterol-modulated genes that have a
direct growth promoting function, and their manner of
transducing cell growth or apoptosis.
MTT assay showed that both cell lines used in these
studies were stimulated to cell proliferation by cholesterol
treatment. Previous studies further showed that cholesterol
promotes tumor invasiveness and cell binding to collagen IV,
a protein implicated in invasive process [29]. MTT assays
specifically measure states of metabolic activity, as
proliferating cells are metabolically more active than non-
proliferating or resting cells [30]. The observed promotion
of cell proliferation by cholesterol as measured by increased
metabolic activity, supports known cholesterol functions,
which include the regulation of membrane-bound proteins,
enzymes and several signal transduction pathways [24].
MTT assay in this study showed no difference in cell growth
for phytosterol- and vehicle-treated cells. Even so, the
significant reduction in proliferation of phytosterol-treated
cells as compared to cholesterol treatment reveals the
inhibitory effect of phytosterols on prostate cell growth.
Again, this study uniquely demonstrated the modulation of
growth-regulating genes by sterols. Cholesterol-enrichment
triggered overexpression of PCGEM1 in our cultures. The
differential expression of this gene by the different sterol
treatment options was more distinct in DU145 than in PC-3
cells. This indicates differential regulatory patterns of this
gene by sterols across the cell lines. Our inability to detect
PCGEM1 bands in vehicle treatment across both androgen-
independent cell lines was remarkably demonstrated by
Srinkantan et al. [31]. They showed that PCGEM1 expression
was detectable only in androgen receptor-positive cell lines
such as LNCap. Thus, our study uniquely demonstrates that
cholesterol upregulates PCGEM1 expression. Currently, there
is no known explanation for this observed cholesterol ‘‘turn
on’’ of this seemingly shut androgen-dependent gene in
androgen receptor-negative prostate cell lines. Nevertheless,
we observed that the ‘‘turn on’’ of this proto-oncogene
corresponds with cholesterol-dependent attenuation of cav-1
gene expression versus its upregulation by phytosterols. The
attenuation of cav-1 expression and the corresponding
overexpression of known androgen-dependent gene reinforce
previous observation that, reduced expression of cav-1 by
anti-sense cDNA converts androgen-insensitive metastatic
prostate cancer cells into androgen-sensitive cells [32]. This
though, is consistent with recent observation that cav-1
expression is greatly reduced in most (but not all) onco-
genically transformed and human cancer cells [33]. This may
be based on existing paradigm those cav-1 functions as a
tumor suppressor protein that inhibits anchorage-independent
G.O. Ifere et al. / Cancer Detection and Prevention 32 (2009) 319–328 327
growth and matrix invasiveness in human cancer cells [33].
Despite abundant evidence that cav-1 has tumor transforma-
tion properties, recent study conflicts with these findings,
suggesting it has tumor promoter function [34]. This was
based on demonstration that downregulation of cav-1
expression by small interfering RNA approach, significantly
reduced the tumorigenic and metastatic potential of mouse
model prostate cancer cells [34]. This is supported by further
evidence showing that overexpression of cav-1 was associated
with metastatic progression as well as androgen insensitivity
in low caveolin, androgen-sensitive mouse prostate cancer
cells [34,35]. Using androgen-insensitive prostate cancer cell
lines we rather observed that phytsoterol-induced high
expression of cav-1 corresponds with a reduced expression
of the protoncogene, PCGEM1 in contrast to the cholesterol-
induced pattern of expression of these genes. This rather
agrees with the model suggesting that cav-1 is a growth
suppressor, and may enhance comparatively lower androgen
sensitivity during phytosterol treatment as opposed to cho-
lesterol treatment How attenuated cav-1 expression elaborates
androgen-dependent signaling is yet to be fully understood.
However, sufficient evidence suggests that this contradiction
in cav-1 activity derive from its function as a scaffolding
protein that interacts with, and regulates a variety of signaling
pathways that include proto-oncogenes [9] like PCGEM1.
Specifically, cholesterol reportedly induces the interaction
of cav-1 with androgen receptor, thus triggering the trans-
cription of some downstream genes [15]. A classic case is the
transient co-localization of cav-1 with androgen receptors
in lipid-enriched rafts, and the facilitation of androgen-
dependent signaling [14,15]. We thus identify a putative
mechanism for cholesterol induction of overexpressed
PCGEM1, an androgen-dependent proto-oncogene.
Translationally, high expression of PCGEM1 has been
reported to correlate with cell growth in human prostate
cancer, suggesting its potential as biomarker for high-risk
prostate cancer [21]. Environmental factors among them
high cholesterol diets [36] are reported risk factors for
prostate cancer in African-Americans [37]. Thus over-
expression of PCGEM1 following cellular cholesterol-
enrichment further supports its biomarkers status for high-
risk prostate cancer.
Our unique demonstration of downregulated PCGEM1
expression by phytosterols is comparable to various reports
showing phytosterol suppression of cell growth [24].
Overall, our result suggests that phytosterols play a role
in the prevention or reversal of prostate neoplasm by
suppressing PCGEM1 mRNA expression. The mechanism
for reversal of prostate cell growth by underexpressed
PCGEM1 may be deduced indirectly from very recent
findings that, overexpression of PCGEM1 in LNCap cell
culture model inhibits experimental apoptosis [38]. This is
supported by our flow cytometric analysis showing that
phytosterols-induced apoptosis, besides underexpression of
PCGEM1. Overexpression of this oncogene and inhibition
of apoptotic machinery during cholesterol enhancement
agrees with the current paradigm in cancer cell biology that,
defects in normal apoptotic mechanisms play a major role in
the pathogenesis of various cancers [39].
In all, there are various conceptual frameworks for the
mechanism of inhibition of cellular apoptosis by cholesterol.
One of them is based on the relationship between cholesterol-
enrichment, cav-1 expression and mediation of downstream
signaling events. Overexpression of cav-1 has been found to
regulate the activity of PI3K [15], which trigger downstream
protein kinase Akt-dependent anti-apoptosis [40]. Cholesterol
is essential in the arrangement of cav-1 within rafts [6,7], and
may provide support for caveolin1-PI3K-Akt activation
cascade of anti-apototic signals. Besides, our study shows
the attenuation of cav-1 gene expression by cholesterol
loading, thus revealing a new conceptual framework for
cholesterol promotion of cell growth or anti-apoptosis based
on the ability of attenuated cav-1 to elaborate androgen
sensitivity.
Further support for sterol regulation of growth or apoptosis
in prostate cancer cells was examined by immunocytochem-
ical analysis of PC-3 and DU145 cells. Photomicrographs of
end-labeled DNA ladder fragments indicated that, phytos-
terol-treated cells were characterized by greater number
of detectable DNA ladder fragments, which characterize
apoptosis. Less apoptosis signals were observed in cholesterol
and vehicle-treated cells. Our data on immunocytochemistry,
flow cytometry and transcriptional analysis of apoptotic and
anti-apoptotic genes confirm that phytosterols inhibit growth
of prostate cell lines by induction of apoptosis.
In summary, our study revealed that sterols initiate
differential expression of PCGEM1 and cav-1 in prostate
cancer cell lines. We also showed that cholesterol ‘‘turned
on’’ seemingly shut androgen-dependent downstream proto-
oncogene (PCGEM1) in androgen receptor-negative pros-
tate cell lines. The integration of sterol responsive PCGEM1
and cav-1 expression, with cell growth or apoptosis reveals a
novel pathway for sterol regulation of prostate neoplasm or
apoptosis.
We conclude that differential activation of various
neoplastic or apoptotic genes by different sterol treatment
options may enable the elucidation of prostate neoplasm at
the molecular level so as to develop effective prevention and
intervention strategies for control and prevention of the
malignancy. In view of the heterogeneous nature of human
prostate cancer, the sterol responsive gene PCGEM1 may
efficiently predict neoplasms that would respond to
chemoprevention by phytosterols. Also, elucidating the
mechanism by which cholesterol mediate prostate cancer
would strengthen the existing dogma that dietary cholesterol
plays a role in the disparity in prostate cancer incidence
along ethnic lines.
Conflict of interest
None.
G.O. Ifere et al. / Cancer Detection and Prevention 32 (2009) 319–328328
Acknowledgements
This research was supported by NIH Grants#:
5P20MD002285-02, GM08247, A141231. The authors
are grateful to Clark Atlanta University RCMI Program
and the Molecular Biology Core facility laboratory.
References
[1] Platz EA, Rimm EB, Willett WC, Kantoff PW. Racial variation in
prostate cancer incidence and in hormonal system markers among
male health professionals. J Natl Cancer Inst 2000; 92:2009–20017.7.
[2] Hayes RB. Are dietary fat vasectomy risk factors for prostate cancer? J
Natl Cancer Inst 1995; 87:629–31.
[3] Awad AB, Fink CS. Phytosterols as anticancer dietary components:
evidence and mechanism of action. J Nutr 2000; 130:2127–30.
[4] Von Holtz RL, Fink CS, Awad AB. b-Sitosterol activates the sphin-
gomyelin cycle and induces apoptosis in LNCap human prostate
cancer cells. Nutr Cancer 1998; 32:8–12.
[5] Arora A, Raghuraman H, Chattopadhay A. Influence of cholesterol
and ergosterol on membrane dynamics: a fluorescence approach.
Biochem Biophys Res Commun 2004; 318:920–6.
[6] Daniel EE, El-Yazbi A, Cho WJ. Caveolae and calcium handling, a
review and a hypothesis. J Cell Mol Med 2006; 10:529–44.
[7] Zhuang L, Kim J, Adam RM, Solomon KR, Freeman MR. Cholesterol
targeting alters lipid raft composition and cell survival in prostate
cancer cells and xenografts. J Clin Invest 2005; 115:959–68.
[8] Williams TM, Lisanti MP. The caveolin genes: from cell biology to
medicine. Ann Med 2004; 36:584–95.
[9] Cohen AW, Hnasko R, Schubert W, Lisanti MP. Role of caveolae and
caveolins in health and disease. Physiol Rev 2004; 84:1341–79.
[10] Yang G, Truong LD, Wheeler TM, Thompson TC. Caveolin-1 expres-
sion in clinically confined human prostate cancer: a novel prognostic
marker. Cancer Res 1999; 59:5719–23.
[11] Yang G, Addai J, Ittmann M, Wheeler TM, Thompson TC. Elevated
caveolin-1 levels in African-American versus white-American pros-
tate cancer. Clin Cancer Res 2000; 6:3430–3.
[12] Li L, Yang G, Ebara S, Satoh T, Nasu Y, Timmen TL, et al. Caveolin-1
mediates testosterone-stimulated survival/clonal growth and promotes
metastatic activities in prostate cancer cells. Cancer Res 2001;
61:4386–92.
[13] Brown DA, London E. Structure and function of sphingolipid- and
cholesterol-rich membrane rafts. J Biol Chem 2000; 275:17221–4.
[14] Razandi M, Alton G, Pedram A, Ghonshani S, Webb P, Levin ER.
Identification of a structural determinant necessary for the localization
and function of estrogen receptor alpha at the plasma membrane. Mol
Cell Biol 2003; 23:1633–46.
[15] Lu ML, Schneider MC, Zheng Y, Zhang X, Richie JP. Caveolin-1
interacts with androgen receptor, a positive modulator of androgen
receptor mediated transactivation. J Biol Chem 2001; 276:13442–51.
[16] Bruggers CS, Fults D, Perkins SL, Coffin CM, Carroll WL. Coex-
pression of genes involved in apoptosis in central nervous system
neoplasms. Pediatr Hematol Oncol 1999; 21:19–25.
[17] Bist A, Fielding CJ, Fielding PE. P53 regulates caveolin gene tran-
scription, cell cholesterol and growth by a novel mechanism. Bio-
chemistry 2000; 39:1966–72.
[18] Homma Y, Kondo Y, Kaneko M, Kitamura T, Nyou WT, Yanagisawa
M, et al. Promotion of carcinogenesis and oxidative stress by dietary
cholesterol in rat prostate. Carcinogenesis 2004; 25:1011–4.
[19] Chen K, Albano A, Ho A, Keaney Jr JF. Activation of p53 by oxidative
stress involves platelet-derived growth factor-b receptor-mediated
ataxia telangiectasia mutated (ATM) kinase activation. J Biol Chem
2003; 278:39527–33.
[20] Segawa T, Nau ME, Xu LL, Chilukuri RN, Makarem M, Zhang W,
et al. Androgen-induced expression of endoplasmic reticulum (ER)
stress response genes in prostate cancer cells. Oncogene 2002;
21:8749–58.
[21] Petrovics G, Zhang W, Makarem M, Street JP, Connely R, Sun L, et al.
Elevated expression of PCGEM, a prostate-specific gene with cell
growth-promoting function, is associated with high risk prostate
cancer patients. Oncogene 2004; 23:605–11.
[22] Metzler B, Hu Y, Dietrich H, Xu Q. Increased expression and activa-
tion of stress-activated protein kinase/c-Jun NH2- terminal protein
kinases in atherosclerotic lesions coincide with p53. Am J Pathol 2000;
156:1875–86.
[23] Awad AB, Chan KC, Downie AC, Fink CS. Peanuts as a source of b-
sitosterol, a sterol with anticancer properties. Nutr Cancer 2000;
36:238–41.
[24] Awad AB, Williams H, Fink CS. Effect of phytosterols on cholesterol
metabolism and MAP kinase in MDA-MB-231 human breast cancer
cells. J Nutr Biochem 2003; 14:111–9.
[25] Greenberg-Ofrath N, Terespolosky Y, Kahane I, Bar R. Cyclodextrins
as carriers of cholesterol and fatty acids in cultivation of mycoplasmas.
Appl Environ Microbiol 1993; 59:547–51.
[26] Bishop ON. Statistics for biology . Microcomputer. London: Longman
(EF) Ltd., 1985.
[27] Stromblad S, Becker JC, Yebra M, Brooks PC, Cheresh DA. Sup-
pression of p53 activity and p21-WAF1/CIP1 expression by vascular
cell integrin avb3 during angiogenesis. J Clin Invest 1996; 98:
426–33.
[28] Martinez-Botas J, Suarez Y, Ferruelo AJ, Gomez-Coronado D, Lasun-
cion MA. Cholesterol starvation decreases P34cdc2 kinase activity and
arrest the cell cycle at G2. FASEB J 1999; 13:1359–70.
[29] Awad AB, Fink CS, Williams H, Kim U. In vitro and in vivo (SCID
mice) effects of phytosterols on the growth and dissemination of
human prostate cancer PC-3 cells. Eur J Cancer Prev 2001; 10:507–13.
[30] Corban-Weilhelm H, Ehemann V, Becker G, Greulich D, Braun K,
Debus J. Comparison of different methods to assess the cytotoxic
effects of cytosine deaminase and thymidine kinase gene therapy.
Cancer Gene Ther 2004; 11:208–14.
[31] Srinkantan V, Zhiqiang Z, Petrovics G, Xu L, Augustus M, Davis L,
et al. PCGEM1, a prostate-specific gene, is overexpressed in prostate
cancer. Proc Natl Acad Sci USA 2000; 97:12216–21.
[32] Goh M, Chen F, Paulsen MT, Yeager AM, Dyer ES, Ljungman M.
Phenylbutyrate attenuates the expression of Bcl-XL, DNA-PK, Caveo-
lin-1, and VEGF in prostate cancer cells. Neoplasia 2001; 3:331–8.
[33] Fiucci G, Ravid D, Reich R, Liscovitch M. Caveolin-1 inhibits
anchorage-independent growth, anoikis and invasiveness in MCF-7
human breast cancer cells. Oncogene 2002; 21:2365–75.
[34] Williams TM, Hassan GS, Li J, Cohen AW, Medina F, Frank PG, et al.
Caveolin-1 promotes tumor progression in an autochthonous mouse
model of prostate cancer: genetic ablation of cav-1 delays advanced
prostate tumor development in tramp mice. J Biol Chem 2005;
280:25134–45.
[35] Thompson CT. Metastasis-related genes in prostate cancer: the role of
caveolin-1. Cancer Metast Rev 1999; 17:439–42.
[36] Freeman MR, Solomon KR. Cholesterol and prostate cancer. J Cell
Biochem 2004; 91:54–69.
[37] Reddy S, Shapiro M, Morton R, Brawley OW. Prostate cancer in black
and white Americans. Cancer Metast Rev 2003; 22:83–6.
[38] Fu X, Ravindranath L, Tran N, Petrovics G, Srivastava S. Regulation
of apoptosis by a prostate-specific and prostate cancer-associated
noncoding gene, PCGEM1. DNA Cell Biol 2006; 25:135–41.
[39] Banerjee P, Banerjee S, Brown TR. Bcl-2 protein expression correlates
with cell survival and androgen independence in rat prostatic lobes.
Endocrinology 2002; 143:1825–32.
[40] Rusinol AE, Thewke D, Liu J, Freeman N, Panini SR, Sinensky MS.
AKT/Protein kinase B regulation of BCL family members during
oxysterol-induced apoptosis. J Biol Chem 2004; 279:1392–9.