Development of a WebGIS-based Decision Support System for Facilitating the Adoption of Agricultural Best Management Practices
by
Kun Chen
A Thesis presented to
The University of Guelph
In partial fulfillment of requirements for the degree of
Doctor of Philosophy in
Geography, Environment and Geomatics
Guelph, Ontario, Canada © Kun Chen, May, 2019

ABSTRACT
DEVELOPMENT OF A WEBGIS-BASED DECISION SUPPORT SYSTEM FOR
FACILITATING THE ADOPTION OF AGRICULTURAL BEST MANAGEMENT PRACTICES
Kun Chen Advisor(s):
University of Guelph, 2019 Wanhong Yang
Agricultural best management practice (BMP) adoption has the benefits of controlling
and reducing agricultural non-point source pollution. To facilitate the adoption, adequate
information needs to be provided to farmers and conservation managers to improve their
understanding on BMPs and support their decision making on BMP adoption. By utilizing
information and communication technologies, this study introduces the design and
implementation of a WebGIS-based decision support system to fulfill the information needs of
farmers and conservation managers for BMP adoption.
In the first step, this study develops an information model that conceptualizes information
communications within the BMP adoption process. The information model specifies the
information content for communications as well as defines how information could be generated
and communicated to meet the information needs of farmers and conservation managers, which
are classified into public information and BMP planning information based on the accessibility
of information.

Based on the information model, this study designs a WebGIS-based decision support
system for facilitating agricultural BMP adoption which includes three subsystems: the public
subsystem for supporting communications of landscape conditions and BMP educational
information, the BMP planning subsystem for supporting communications of BMP planning
information, and the administration subsystem for supporting administrative tasks including
monitoring the use of the BMP planning subsystem by farmers and conservation managers.
Based on the system design, a prototype of the WebGIS-based decision support system is
developed for the Gully Creek watershed, which is a representative watershed in southwestern
Ontario with active agricultural BMP implementation activities. The system prototype is then
evaluated by two methods: evaluation by direct use and evaluation during demonstration. The
evaluation by direct use identifies violence to usability principles, while the evaluation during
demonstration focuses on evaluating user task and information of the system. The results from
the two evaluation methods are coded into the evaluation measures and aggregated for
conducting an assessment of the system usability. The results show that the evaluators are overall
satisfied with the system design and functionalities. Several suggestions on further improvements
to the system are also provided.

iv
ACKNOWLEGEMENTS
I would like to acknowledge the Knowledge Translation and Transfer (KTT) Funding
Program of Ontario Agri-food Innovation Alliance for providing funding to my PhD research. I
would also like to acknowledge a list of people who were instrumental in supporting my PhD
research.
First of all, I would like to express my gratitude to Dr. Wanhong Yang for his continuous
support and encouragement in my Ph.D. journey. Without his support, I cannot accomplish it. To
me, he is not merely an advisor, but also a mentor for my life that steers me through all the
difficulties and challenges in my past four years of study. His skillful guidance, innovative ideas
and patience are greatly appreciated.
I would like to thank my committee members – Dr. John Lindsay and Dr. Songnian Li
who contributed to various discussions that helped to shape this research.
I would also like to thank Mari Veliz of Ausable Bayfield Conservation Authority, Darryl
Finnigan, Kevin McKague, Ross Kelly, Dr. Oswald Zachariah, Elin Gwen, Elin Gwyn, Tieghan
Hunt of Ontario Ministry of Agriculture, Food and Rural Affairs, Dr. Pradeep Goel of Ontario
Ministry of the Environment, Conservation and Parks, Jo-Anne Rzadki of Conservation Ontario,
Rebecca Moore and Shannon Brown of Ontario Agri-food Innovation Alliance, and Dr.
Bronwynne Wilton of Wilton Consulting Group for their valuable inputs and support.
Moreover, I would like to thank my colleagues Hui Shao, Yongbo Liu, Michael Tennant,
Peter Neill, Lane Buryta, Scott Schau, Gihan Sooriyabandara, and Mostafa Ghiyasvand for

v
supporting the WebGIS-based decision support system development and testing. It is a great
pleasure working with them and I appreciate their ideas and help.
At last, but not the least, I would like to acknowledge the patience and understanding
from my family.

vi
TABLE OF CONTENTS
ABSTRACT .................................................................................................................................... ii ACKNOWLEGEMENTS ............................................................................................................... iv TABLE OF CONTENTS ............................................................................................................... vi LIST OF TABLES ...................................................................................................................... viii LIST OF FIGURES ...................................................................................................................... ix
Chapter 1 Introduction ............................................................................................................ 1 1.1 Problem statement ............................................................................................................. 1 1.2 Purpose and objectives ...................................................................................................... 5 1.3 Thesis overview ................................................................................................................ 6
Chapter 2 Literature Review ................................................................................................... 7 2.1 Watershed management and planning for agricultural BMPs .......................................... 7 2.2 Farm economic and watershed hydrologic modelling for supporting agricultural BMP adoption ................................................................................................................................. 16 2.3 WebGIS for supporting agricultural BMP adoption ....................................................... 22 2.4 Research gaps .................................................................................................................. 32
Chapter 3 An Information Model for Agricultural BMP Adoption .................................. 34 3.1 The process of agricultural BMP adoption ..................................................................... 34 3.2 Developing an information model for the agricultural BMP adoption process .............. 38 3.3 Summary ......................................................................................................................... 47
Chapter 4 System Architecture and Design of the WebGIS-based Decision Support System for Facilitating Agricultural BMP Adoption .......................................................... 49
4.1 Task-oriented design of the WebGIS-based decision support system for facilitating agricultural BMP adoption .................................................................................................... 49 4.2 Integrating WebGIS and watershed modelling tools ...................................................... 53 4.3 The subsystems of the WebGIS-based decision support system for facilitating agricultural BMP adoption .................................................................................................... 56 4.4 The modules of the three subsystems ............................................................................. 59 4.5 The components of the system modules ......................................................................... 63 4.6 Summary ......................................................................................................................... 80
Chapter 5 A Prototype of the WebGIS-based Decision Support System for the Gully Creek Watershed .................................................................................................................... 82
5.1 Study area ........................................................................................................................ 82 5.2 The prototype development for the Gully Creek watershed ........................................... 84 5.3 Summary ....................................................................................................................... 117
Chapter 6 Evaluating the WebGIS-Based Decision Support System .............................. 118 6.1 Usability evaluation ...................................................................................................... 118 6.2 Evaluating the WebGIS-based decision support system using a qualitative approach 121 6.3 The evaluation results ................................................................................................... 131 6.4 Summary ....................................................................................................................... 135

vii
Chapter 7 Conclusion ........................................................................................................... 137 7.1 Summary ....................................................................................................................... 137 7.2 Research contributions .................................................................................................. 140 7.3 Future study .................................................................................................................. 143
REFERENCES .......................................................................................................................... 146 APPENDIX A ............................................................................................................................. 172 APPENDIX B ............................................................................................................................. 176 APPENDIX C ............................................................................................................................. 178 APPENDIX D ............................................................................................................................ 182 APPENDIX E ............................................................................................................................. 186

viii
LIST OF TABLES
Table 3-1: Information needs for BMP adoption .......................................................................... 39 Table 3-2: Information communication technologies and tools ................................................... 42 Table 4-1: Tasks of system modules in the public subsystem ...................................................... 59 Table 4-2: Tasks of system modules in the BMP planning subsystem ......................................... 61 Table 4-3: Tasks of system modules in the administration subsystem ......................................... 62 Table 5-1: Software for system development ............................................................................... 88 Table 5-2: System localization checklist ...................................................................................... 89 Table 5-3: Various combinations of water quantity/quality effects and BMP costs .................. 105 Table 5-4: The parameters for producing the BMP policy/management information ................ 108 Table 6-1: Measures for evaluating the WebGIS-based decision support system ...................... 124 Table 6-2: Key user tasks for evaluation by direct use ............................................................... 128 Table 6-3: System design for evaluation during demonstration ................................................. 131

ix
LIST OF FIGURES
Figure 2-1: Understanding the roles of GIS-based decision support system in planning ............. 22 Figure 3-1: Key stakeholders and their roles in the information communication process for BMP adoption ......................................................................................................................................... 35 Figure 3-2: Key questions driving the BMP adoption .................................................................. 39 Figure 3-3: The information sub-model for field characteristics, environmental concerns, and BMP adoption ............................................................................................................................... 44 Figure 3-4: The information sub-model for agri-environmental policy and BMP related technical knowledge ..................................................................................................................................... 45 Figure 3-5: The information sub-model for BMP planning .......................................................... 46 Figure 4-1: Task-oriented design of the WebGIS-based decision support system for facilitating agricultural BMP adoption ............................................................................................................ 52 Figure 4-2: Loose coupling of WebGIS and the integrated economic-hydrologic model ............ 54 Figure 4-3: Loose coupling of the WebGIS and the optimization model ..................................... 55 Figure 4-4: Subsystems in the WebGIS-based decision support system for facilitating agricultural BMP adoption ............................................................................................................ 58 Figure 4-5: Component diagram of the “Information sharing site” module ................................. 64 Figure 4-6: Component diagram of the “Public information center” module .............................. 66 Figure 4-7: Component diagram of the “Access control” module ............................................... 67 Figure 4-8: Component diagram for BMP scenario creation ........................................................ 68 Figure 4-9: Component diagram for BMP scenario development ................................................ 69 Figure 4-10: Component diagram for BMP scenario evaluation .................................................. 70 Figure 4-11: Component diagram for BMP evaluation result exploration ................................... 71 Figure 4-12: Component diagram for BMP scenario comparison ................................................ 72 Figure 4-13: Component diagram for scenario optimization ........................................................ 73 Figure 4-14: Component diagram for optimization result exploration ......................................... 74 Figure 4-15: Component diagram of the “Discussion” module .................................................... 76 Figure 4-16: Component diagram of the “Report” module .......................................................... 77 Figure 4-17: Component diagram of the “User registration” module .......................................... 78 Figure 4-18: Component diagram of the “System monitoring” module ....................................... 79 Figure 5-1: The Gully Creek Watershed in Southern Ontario, Canada ........................................ 83 Figure 5-2: The welcome webpage of the public subsystem ........................................................ 91 Figure 5-3: The interface of the information sharing site ............................................................. 92 Figure 5-4: The form for uploading information on field characteristics and BMP adoption ...... 93 Figure 5-5: The interface of the public information center ........................................................... 94 Figure 5-6: The login webpage of the BMP planning subsystem ................................................. 95 Figure 5-7: The form for creating a “What if” BMP scenario ...................................................... 96 Figure 5-8: The WebGIS interface for developing a "What if" BMP scenario ............................ 97 Figure 5-9: BMP assignments in the Gully Creek watershed ....................................................... 98 Figure 5-10: The WebGIS interface for scenario evaluation result presentation and exploration 99 Figure 5-11: The WebGIS interface for scenario comparison .................................................... 101 Figure 5-12: Differences in net return between the “What if” and the baseline scenario .......... 102 Figure 5-13: Differences in total phosphorus between the "What if" and the baseline scenario 103 Figure 5-14: Cost-effectiveness of BMPs on total phosphorus reduction .................................. 104

x
Figure 5-15: The WebGIS interface for the “Policy/Management” module .............................. 106 Figure 5-16: The default range of BMP policy/management constraints ................................... 107 Figure 5-17: The interface for exploring environmental policy/management information ........ 109 Figure 5-18: The interface for exploring economic policy/management information ............... 110 Figure 5-19: The interface for supporting communications between farmers and conservation managers ..................................................................................................................................... 111 Figure 5-20: Scenario reports in HTML(Left) and PDF(Right) formats .................................... 112 Figure 5-21: The webpage after login to the administration subsystem ..................................... 113 Figure 5-22: Tables for displaying the usage information of the BMP planning subsystem ..... 114 Figure 5-23: Communication network for displaying communication information among farmers and conservation managers ......................................................................................................... 115 Figure 5-24: Interaction within the communication network ..................................................... 116 Figure 5-25: The user registration form ...................................................................................... 117 Figure 6-1: The updated Information System Success Model .................................................... 123 Figure 6-2: Evaluation by direct use and evaluation during demonstration ............................... 127

1
Chapter 1 Introduction
1.1 Problem statement
As the world population increases, global agriculture must address the challenge of
supplying the escalating demand for agricultural production. While the intensification of
agriculture by use of high-yielding crop varieties, fertilization, irrigation, and pesticides has
contributed to significant increases in food production over the recent decades (Mastson et al.,
1997), it has meanwhile contributed to non-point source water pollution, which is increasingly
disruptive to the freshwater system (McCoy, Chao, & Gang, 2015). For several decades, tenable
evidence has indicated that excessive input of Nitrogen (N) and Phosphorous (P) can change
water chemistry with subsequent eutrophication and food web modification (Udeigwe et al.,
2011), N and P leached from agricultural fields can contaminate the groundwater (Böhlke, 2002),
and toxic chemicals entering the food supply can cause unexpected diseases to animals and
human beings (Lu et al., 2015).
The establishment of agri-environmental programs reflects a current trend of agricultural
development towards a more sustainable approach (Garnett et al., 2013). By providing financial
incentives to farmers to implement best management practices (BMPs) such as conservation
tillage, nutrient management, cover crop, and water and sediment control basin (WASCoB),
these programs aim to meet agricultural production goals while preventing the excessive
sediment and nutrient loadings into water bodies. The adoption of BMPs is the core of these agri-
environmental programs and many scientific efforts have been made to examine the rationale for
BMP adoption. For example, several studies have conducted meta-analyses to examine the

2
relationships between farm and farmer characteristics and farmer’s BMP adoption (Prokopy et
al., 2008; Baumgart-Getz, Prokopy, & Floress, 2012), while other studies have focused on
analyzing the perception of innovations and farmer’s attitude change towards adoption (Reimer,
Weinkauf, & Prokopy, 2012; Trujillo-Barrera, Pennings, & Hofenk, 2016).
The extensive studies in agricultural BMP adoption contribute to our understanding on
agricultural BMP adoption, and one important implication from those studies is the significance
of information in driving the BMP adoption process and supporting BMP adoption decisions. As
Baumgart-Getz et al. (2012) suggested, the success of agricultural BMP adoption relies on the
provision of adequate and appropriate information to stakeholders. Feather and Amacher (1994)
also noted that information can be a primary reason for widespread adoption of BMPs. Indeed, as
key stakeholders for BMP adoption, farmers and conservation managers require information to
develop understanding on environmental and economic effects of BMPs (Prager et al., 2012).
Farmers also need information to improve their environmental awareness and technical
knowledge about BMPs (Rogers, 1995).
Given the significance of information for BMP adoption, agri-environmental programs
have widely adopted a participatory approach and various efforts have been made to promote
information communications among stakeholders. For example, the Canada-Ontario
Environmental Farm Plan organized workshops and face-to-face consultations to help
stakeholders with their BMP adoption decisions (Smithers & Furman, 2003). The European
Union’s rural development policy also required State Members to develop stakeholder
involvement and partnership programs for developing and implementing agri-environmental
policies (Prager & Freese, 2009). However, significant barriers still exist. As reported by

3
Nxumalo and Oladele (2013), some key obstacles to participation in agri-environmental
programs include lack of technical knowledge, communication, sense of stewardship, and funds.
Several key challenges must be addressed to facilitate stakeholder participation in agri-
environmental programs and improve their communications for BMP adoption. Firstly, as
adopters of BMPs, farmers need to be motivated to participate in the process of communication.
This requires them to realize their stewardship role and understand BMP characteristics.
Secondly, to improve the effectiveness of communications among stakeholders, a common
ground among stakeholders, particularly farmers and conservation managers, should be built
based on mutual understanding on the economic costs, environmental benefits and cost-
effectiveness of BMPs (Prager et al., 2012). Finally, new methods of communication need to be
developed. In addition to traditional communications such as face-to-face consultations which
require physical presence, the new communication methods should provide more flexibility and
convenience through utilizing information technologies.
Information on economic costs, environmental benefits and cost-effectiveness of BMPs is
essential for supporting effective communications among the stakeholders for BMP adoption.
Farmers can utilize the information to understand BMP characteristics and develop plans for
BMP adoption on their farms. Conservation managers can use the information to spatially target
land parcels for BMP implementation in order to minimize the economic costs and/or maximize
the environmental benefits. In recent years, efforts have been made to develop integrated
economic-hydrologic modelling systems to understand the trade-offs between costs and benefits
of BMPs (Srivastava et al., 2002; Yang et al., 2003; Turpin et al., 2005). For example, Qi and
Altinakar (2011) proposed a conceptual framework to support multi-objective decision making

4
for BMP allocation. The integrated approach coupled the hydrologic model AnnAGNPS, the
channel network model CCHE1D and an economic model to estimate both the economic costs
and environmental benefits of land use plan alternatives.
However, while very useful, these integrated modelling systems are typically complex. It
is a challenge to make the modelling information accessible and understandable by stakeholders.
Many studies have suggested that coupling geographic information system (GIS) with the
integrated modelling systems can improve the accessibility of information through spatial data
visualization techniques (Jayakrishnan et al., 2005; Olivera et al., 2006; Liu, Bralts, & Engel,
2015; Karki et al., 2017; Shao et al., 2017; Jang, Ahn, & Kim, 2017). However, those GIS
interfaces are largely confined to desktop applications and used mostly by experts.
Given both the managerial challenge to improve information communications for BMP
adoption and the technical challenge to extend GIS applications for improved information
accessibility, a WebGIS-based decision support system can be developed to overcome these
challenges. As an extension to the traditional desktop-based GIS, the WebGIS-based decision
support system empowers multi-users to address spatial decision-making tasks using GIS
functions and information and communication technologies (ICTs) (Sieber, 2006). With the
advent of the Internet, the WebGIS-based decision support system enables access to spatial
information and services without time and place constraints (Kingston et al., 2000).
Designing a WebGIS-based decision support system for facilitating BMP adoption
requires the system to satisfy the various information needs of stakeholders. The information
needs of stakeholders, particularly farmers and conservation managers, can be identified based
on their roles in the process of BMP adoption. However, how to utilize information technologies

5
and communication tools to generate, communicate and present the information to stakeholders
still remains in question. As such, an information model needs to be developed to address how
different information and communication technologies can be utilized to facilitate information
communications for BMP adoption. The information model should identify information content
for communications and also define the details of information communications in terms of
information sources, targets and channels.
1.2 Purpose and objectives
The purpose of the research is to develop a WebGIS-based decision support system for
facilitating the adoption of agricultural BMPs. Specifically, the research has four interrelated
objectives:
1) Develop an information model to conceptualize the information communication
process for agricultural BMP adoption.
2) Design a WebGIS-based decision support system to facilitate information
communications for agricultural BMP adoption. The WebGIS-based decision support system
should provide stakeholders with easy access to relevant information for BMP adoption. The
WebGIS-based decision support system should also improve communications among
stakeholders to support their consensus-building and decision-making for BMP adoption.
3) Develop a prototype of the WebGIS-based decision support system for facilitating the
adoption of agricultural BMPs.

6
4) Evaluate the system prototype to understand whether and how the system supports
user tasks and meet the information needs by stakeholders
1.3 Thesis overview
In the thesis, Chapter 2 reviews relevant literature and identifies research gaps. Chapter 3
analyzes the agricultural BMP adoption process and develops an information model for
conceptualizing information content and communication process for BMP adoption. In Chapter
4, the design of the WebGIS-based decision support system for facilitating agricultural BMP
adoption is presented. In Chapter 5, a prototype of the WebGIS-based decision support system
for a study area is developed. The system interface, user interactions, and information
presentations are illustrated. In Chapter 6, the usability evaluation of the system is presented. In
the Chapter 7, the conclusions and future research are discussed.

7
Chapter 2 Literature Review
The literature review covers three research subjects. Firstly, watershed management and
planning for agricultural BMPs is reviewed. The review focuses on understanding the agri-
environmental programs and corresponding information needs of stakeholders for BMP
adoption. Secondly, watershed modelling of agricultural BMPs is reviewed. The review
examines the applications of watershed hydrologic and farm economic models and integrated
hydrologic-economic models for providing valuable information on BMP costs, effectiveness
and cost-effectiveness. Lastly, applications of WebGIS for supporting collaborative tasks are
reviewed. The review helps to illustrate the role of the decision support system in planning and
identify the strengths and limitations of WebGIS design and implementation for supporting
agricultural BMP adoption.
2.1 Watershed management and planning for agricultural BMPs
This section reviews agri-environmental programs and discusses the related challenges.
Information needs of farmers and conservation managers for BMP adoption are also reviewed.
2.1.1 Agricultural BMPs
Agricultural best management practices (BMPs) are measures to mitigate agricultural
non-point water pollution (Logan, 1993). Two types of agricultural BMPs are structural and non-
structural BMPs. The structural BMPs involve stationary and permanent facilities to prevent or
reduce the discharge of pollutants (Ackerman & Stein, 2008). Examples of structural BMPs
include water and sediment control basins, vegetated filter strip and riparian buffers. The non-

8
structural or land management BMPs work by changing farming behaviour through government
regulations, persuasion and/or economic instruments (US EPA, 1999). Some non-structural
BMPs include cover crops, fertilizer management, and conservation tillage.
Non-structural or land management BMPs have two approaches to mitigate the non-point
water pollution. The first approach is to reduce inputs of harmful substances on agricultural
fields; the second approach is to control erosion and runoff. Nutrient management is a
representative practice that fits into the first approach. It reduces the pollution by reducing the
use of fertilizers and manure on agricultural fields (Havlin et al., 1999). Conservation tillage and
cover crop are examples of land management practices that use the second approach. They
mitigate the pollution by preventing erosion and reducing the transport of sediment and nutrients
on the fields (Dabney, 1998; Holland, 2004).
Agricultural BMPs improve water quality, but they incur economic costs. The economic
costs involve different cost categories such as construction costs, production costs and
opportunity costs. The construction costs are expenditures for building BMP structures or
facilities such as water and sediment control basins (Weiss et al., 2007). The production costs
involve, for example, the costs for purchasing fertilizers, the expenditures for using and
maintaining agricultural machinery, and the labour effort of learning and implementing the
farming technologies (Veith et al., 2003). The opportunity costs are the profit losses from
changes in farm operations (Veith et al., 2003).
Planning for BMP implementation requires an integrated evaluation from both
environmental and economic aspects. Given that the environmental benefits (i.e. pollution
reduction) and economic costs of BMPs vary for different BMP combinations and locations,

9
understanding the cost-effectiveness of BMPs is essential for BMP adoption. As indicated by
Shao et al. (2017), the cost-effectiveness information is important for conservation managers to
develop BMP implementation plan and farmers to make BMP adoption decisions.
2.1.2 Agri-environmental programs
The adverse effects of intensive agricultural activities have led to the establishment of
various agri-environmental programs. By providing financial incentives, agri-environmental
programs aim to engage farmers to adopt BMPs to meet environmental objectives. For example,
the Conservation Reserve Program (CRP) under the U.S. Department of Agricultural (USDA)
offered different types of payments, including both one-time and annual payments for land
retirement by farmers. The average federal cost for CRP could reach up to $2 billion per year
(Stubbs, 2014). As a part of the Environmental Quality Incentive Program (EQIP), the Great
Lake Restoration Initiative (GLRI) also provided approximately 300 million per year, up to
$2.56 billion from FY2010 to FY2017, to assist farmers to use scientifically proven conservation
practices to protect watershed and shorelines from non-point source pollution (“GLRI funding”,
n.d.). In Canada, the Environmental Farm Plan (EFP) offered financial assistance for farmers to
implement BMPs to reduce potential damage to water bodies from agricultural activities
(Morrison & FitzGibbon, 2014). The Rural Water Quality Program (RWQP) in the Grand River
Conservation Authority also provided grants in the Ontario regions of Waterloo, Oxford and
Wellington to compensate farmers up to 50 to 100 percent costs of the selected BMPs (Dupont,
2010).
With the significant amount of conservation investment, it is important for agri-
environmental programs to achieve cost-effectiveness. For this purpose, a strategy is to target the

10
investment to various combinations of BMPs and land parcels that yield the greatest
environmental benefit per dollar of cost (Engel et al., 2008). Successful targeting requires
information on the cost-effectiveness of agricultural BMPs to improve the investment efficiency.
In recent years, complex watershed modelling has been increasingly applied to evaluate the BMP
cost-effectiveness and generate landscape process-based results. Shao et al. (2017), for example,
developed an integrated hydrologic-economic modelling system for BMP evaluation and policy
design.
Information on the cost-effectiveness of agricultural BMPs helps conservation managers
to design the implementation of agricultural BMPs to maximize the environmental benefits.
Because farmers are agricultural BMP adopters, the information also needs to be communicated
to farmers in order to develop a mutual understanding between conservation managers and
farmers towards BMP adoption. To facilitate this communication process, agri-environmental
programs adopted a participatory approach. The Canada-Ontario Environmental Farm Plan, for
example, offered a peer-to-peer support to assist farmers to develop BMP action plans (Smithers
& Furman, 2003). Stakeholder workshops were also held to support farmers to understand the
BMP adoption process (Prager & Freese, 2009).
Despite significant efforts to facilitate BMP adoption, farmer participation can be still
hampered by various constraints. Smithers and Furman (2003) suggested that the participation is
strongly associated with several farmer, farm and program characteristics. In particular, they
noted that the education level of famers and their awareness of existing environmental issues can
impose a significant influence on their participation. This conclusion is also supported by Luzar
and Diagne (1999) who suggested that farmers’ environmental attitude is important for active

11
participation. In addition, Breetz et al. (2005) indicated that farmers’ trust on the program is an
important factor for determining their willingness to participate. Furthermore, from a
management perspective, Falconer (2000) suggested that participation can be hindered by the
transaction cost such as visiting and reporting requirements.
To facilitate farmers’ participations in agri-environmental programs, information and
communication technologies (ICTs) offer great potential. Chapman et al. (2002) suggested that
ICTs can improve the access to information and create linkages among farmers and conservation
managers for information sharing. Glendenning and Ficarelli (2012) also suggested that by
maintaining a two-way information communication among conservation managers and farmers,
ICTs could provide farmers with quick access to agricultural BMP information and also allow
conservation managers to reach out to farmers with timely and accessible support. In addition,
Richardson (2006) showed that ICTs can improve farmers’ knowledge and effectiveness of their
communications, thereby increase their chance of participation. Furthermore, Silva (2008)
revealed that ICTs, once designed and used appropriately, can vastly reduce the cost of
information communications and increase the likelihood of participation in agri-environmental
programs.
Incorporating ICTs into agri-environmental programming has become a current trend for
addressing agricultural BMP planning tasks. Improving information communications and
increasing farmers’ exposure to a variety of information such as the cost-effectiveness of BMPs,
BMP know-how knowledge and availability of financial incentives can support farmers’
engagement in agri-environmental programs and promote BMP adoption (Leach, Pelkey, &
Sabatier, 2002; Llewellyn, 2007). However, to make the best use of ICTs for agricultural BMP

12
adoption, several challenges still need to be addressed regarding social structure of
communications, information generations, and information quality.
2.1.3 Agricultural BMP adoption and related information needs
2.1.3.1 Information needs for farmers to adopt BMPs
Agricultural BMP adoption can be viewed as a process of information communications
wherein stakeholders collectively address environmental and economic concerns and finalize a
plan for implementing agricultural BMPs. To encourage BMP adoption, it is necessary to
provide relevant and adequate information to farmers to improve their knowledge and further
support their decision-making on BMP adoption. Thus, it is important to identify their
information needs for BMP adoption. In the past decades, extensive studies have been carried out
to examine the rationale for BMP adoption. Based on these studies, a variety of information
needs of farmers for adoption can be identified.
Farmers require information to understand why implementing BMPs is important and
necessary. Studies suggested that information on existing environmental problems can improve
farmers’ environmental awareness and hence adoption. From a diffusion perspective, Rogers
(1995) explained that being aware of existing environmental problems is important for famers to
realize a need for adoption. Based on the Theory of Planned Behavior (Ajzen, 1991), Kaiser et
al. (1999) also noted that an improved awareness of environmental problems is necessary for
farmers to develop an attitude towards those problems and an intention to adopt BMPs. By
conducting a survey in the tropical savannas of southern Australia to investigate farmers’
motivations to BMP adoption, Greiner and Gregg (2011) also found that being informed of
environmental issues presents an important reason for farmers’ adoption.

13
Farmers also require information to improve their knowledge on BMPs (McCown, 2002;
Reimer et al., 2012). Rogers (1995) stated that farmers should be educated with three types of
BMP knowledge including BMP concepts, functions, and implementation details. Specifically,
he explained that 1) knowledge on BMPs concepts and functions could help prevent farmers’
rejection and discontinuance of these practices and 2) understanding how to properly implement
BMPs could increase the probability of successful adoption of these practices. Many empirical
studies have shown that improving farmer’s understanding on BMP characteristics can be crucial
to support farmers’ adoption. Alonge and Martin (1995), for example, revealed that an improved
understanding on BMP characteristics such as complexity and compatibility can be an influential
factor for farmers’ decision making on adoption. Dietz et al. (2004) also suggested that educating
farmers on how BMPs contribute to mitigate non-point source pollution can be essential for
fostering the voluntary adoption of BMPs.
Moreover, farmers require information to support their decisions on BMP adoption.
Specifically, information should assist them to understand the costs and benefits of BMP
adoption. The BMP costs include installation cost, maintenance cost and the opportunity cost due
to yield loss, and the BMP benefits include financial benefits such as government compensation
and non-financial benefits such as environmental benefits (Atari et al., 2009). BMP costs and
benefits can vary due to various combinations of BMPs and the geographical locations where
they are applied.
Farmers are sensitive to BMP cost information and many studies have indicated that
BMP costs can have a substantial impact on adoption. In a survey to evaluate the efficiency of
the Environmental Farm Plan (EFP), Plummer et al. (2008) reported that nearly half of the

14
farmers identified implementation costs to be a major barrier to their undertaking of agricultural
BMPs. In examining the motivations of farmers’ participation in the Nova Scotia EFP program,
Atari et al. (2009) also found that majority of the farmers (53%) identified high BMP costs as a
dominant factor for preventing them from adoption. Moreover, by conducting a survey to
investigate farmers’ BMP adoption motivations, Greiner and Gregg (2011) reported the cost of
time and labour and the loss of productivity and/or profitability to be the main causes for non-
adoption.
While the BMP adoption introduces private costs, it also provides environmental
benefits. Studies revealed that information on environmental benefits could have a positive
influence on farmers’ adoption of BMPs. For example, Bultena and Hoiberg (1983) noted that
being aware of BMP’s environmental benefits is positively related to farmers’ conservation
behaviors. In a study to investigate farmers’ motivation for BMP adoption, Reimer et al. (2012)
also indicated that farmers identified soil conservation such as improved soil structure/fertility is
their major motivation for adoption. Moreover, Greiner and Gregg (2011) identified farmers’
awareness of improvements on environmental conditions to be a major motivation for BMP
adoption.
To evaluate alternative BMP plans and make adoption decisions, farmers require
integrated assessment of BMP costs and effectiveness. The cost-effectiveness of BMPs reflects
environmental benefits obtained per dollar of cost. Shao et al. (2017) suggested that information
on the cost-effectiveness of BMPs can provide a more efficient means for farmers to understand
the effects of BMPs on their fields. They also noted that the cost-effectiveness information is a

15
key factor for making a mutual agreement on BMP adoption between farmers and conservation
managers.
Several studies illustrated that communications among farmers can improve the
possibility of BMP adoption. Based on the diffusion theory, Rogers (1995) suggested that
information communications among farmers are important to induce farmers to adopt
agricultural practices because it improves the observability of the practices. He explained that
compared to mass media such as newspaper and magazine, opinions from other farmers can be
more effective and convincing to engage farmers to adopt. Similarly, Reimer et al. (2012)
indicated that farmers are more likely to adopt BMPs if they have observed positive economic
and environmental outcomes of adoption by others. Furthermore, Lubell and Fulton (2007), by
discussing the impact of local diffusion network on BMP adoption, noted that information
communications among farmers can improve social trust and norms and may induce cultural
change on BMP adoption.
2.1.3.2 Information needs of conservation managers for BMP implementation
Economic costs, environmental benefits and cost-effectiveness of BMPs at watershed and
regional scales are necessary for conservation managers to design BMP policy/management to
improve the efficiency of investment on BMP implementation. In the United States, several agri-
environmental programs, such as Conservation Reserve Program and Environmental Quality
Incentives Program, have noted that BMP cost-effectiveness information is essential for benefit-
cost targeting of BMPs (Claassen et al., 2008). In Canada, the OMAFRA also initiated programs
to understand cost-effectiveness of BMPs to facilitate targeting agricultural BMPs on the land
with greatest environmental benefits (Smithers & Furman, 2003). Shao et al. (2017) also noted

16
that the BMP cost-effectiveness is necessary for conservation mangers to design two types of
policies: 1) how to maximum the environmental benefits given a fixed investment and 2) how to
minimize the cost given a fixed target of environmental improvement.
2.2 Farm economic and watershed hydrologic modelling for supporting agricultural BMP adoption
In recent decades, farm economic and watershed hydrologic modelling has been
increasingly applied to support decision-making on agri-environmental programs and BMP
adoption. In particular, an integrated economic-hydrologic modelling approach has been widely
adopted to generate information on the cost-effectiveness of BMPs. This section reviews the
applications of farm economic and watershed hydrologic models as well as the integrated
hydrologic-economic systems for BMP evaluation.
2.2.1 Farm economic modelling
Various studies have developed farm economic modelling to understand the impact of
conservation practices on farming economics. Yiridoe et al. (2000), for example, used farm
economic modelling to estimate economic costs and cropping net return of tillage systems. The
production costs included both farm input cost and machinery cost. The farm input cost was
modelled as a function of several input variables such as seed and fertilizer, and the machinery
cost was estimated based on equipment usage such as oil and lubrication, repair and
maintenance. The farm gross return was calculated by multiplying the yields by the market price.
The net return was calculated by subtracting the production cost from the farm gross return. By
simulating and comparing different tillage systems at two sites in Ontario of Canada, they found
that due to higher machinery-related cost, no-till system has less production cost than

17
conventional tillage and other reduced tillage systems. They also indicated that while the reduced
tillage systems obtained similar results on the average net farm returns, the choice of preferred
tillage system should depend on the climate and soil type.
In a recent study, Yang et al. (2016) developed integrated economic-hydrologic
modelling to examine wetland restoration scenarios in the South Tobacco Creek watershed in
Manitoba, Canada. In the farm economic modelling, the costs of wetland restoration included
opportunity cost and administration and engineering cost. The opportunity cost was estimated
based on a yield function and an average historical crop price. This study compared economic
costs under four levels of wetland restoration scenarios with different subset of wetlands for
restoration. They found that to achieve the same benefits of total phosphorus (TP) reduction, full
wetland restoration was associated with the minimum average economic cost. As shown in their
modelling results, the average economic cost of full restoration was $132.4 ha/yr at a TP
reduction level of 1.9 kg/ha/yr. The second partial restoration scenario costed more at $135.9
ha/yr while resulting in a less TP reduction level at 1.7 kg/ha/yr.
Shao et al. (2017) conducted an integrated economic-hydrologic assessment of
agricultural BMPs in a study watershed in Ontario. In the farm economic model, production
variables included machinery, seed and fertilizer. The net return was calculated by subtracting
production costs from revenue (crop yields multiplied by prices). The costs of land management
BMPs including conservation tillage, cover crop and nutrient management were estimated as net
return differences under the conventional baseline scenario with no BMPs and a BMP scenario.
The cost of Water and Sediment Control Basins (WASCoBs) was estimated based on
engineering costs associated with earthwork and outlet installation.

18
2.2.2 Watershed hydrologic modelling
Watershed hydrologic modelling provides information to understand the environmental
benefits of BMPs. In recent decades, many watershed models have been applied for evaluating
environmental effects of agricultural BMPs. According to the literature (Xie et al., 2015), several
frequently used models include the Soil and Water Assessment Tool (SWAT) (Arnold et al.,
1998), Agricultural Nonpoint Source (AGNPS) (Young et al., 1989), Annualized Agricultural
Nonpoint Source (AnnAGNPS) (Bingner & Theurer, 2003) and Hydrological Simulation
Program-FORTRAN (HSPF) (Bicknell et al., 2005).
Characterizing BMPs within these watershed models is typically fulfilled by changing
model input or adjusting parameters or implementing specific modules to reflect changes of the
hydrologic process due to BMPs (Xie et al., 2015). Arabi et al. (2008) introduced
characterization of several BMPs within the SWAT model. For example, contour farming was
simulated through modifications of SCS curve number and USLE practice factor, and cover crop
was simulated by scheduling a crop rotation within a year in the model input to simulate cover
crop management. In Yang et al. (2013), a Water and Sediment Control Basin (WASCoBs)
module was developed and incorporated into the SWAT as the SWAT has no modules
specifically designed to simulate the water quality and quantity effects of WASCoBs.
The SWAT (Arnold et al., 1998) has been widely used by a large number of studies to
evaluate BMP effects in mitigating NPS pollution. Parajuli et al. (2008), for example, quantified
the effects of vegetative filter strips in the 950-km2 Wakarusa watershed in northeast Kansas. As
a result, a 63% decrease in sediment was reported. Lee et al. (2010) also evaluated the reduction
in NPS pollution by applying vegetative filter strips, riparian buffer system and fertilizing control

19
for a 1.21 km2 agricultural watershed. The modelling results indicated a 16–25% reduction in
sediment, 5–37% reduction in total nitrogen (TN), and 6–41% reduction in total phosphorus (TP)
respectively. Furthermore, Maharjan et al. (2016) evaluated the BMPs of split fertilizer
application (SF), cover crop cultivation (CC), and the combination (SFCC) at a watershed scale.
They found that the SF scenario reduced nitrate pollution and sediment compared to single
fertilizer application, the application of the CC scenario reduces both sediment and nitrate
loadings, and the SFCC showed the highest positive effect on reducing sediment and nitrate.
2.2.3 Integrated economic-hydrologic modelling
Given that both environmental benefits and economic costs of BMPs are important for
making BMP adoption decisions, a number of studies have been carried out to develop integrated
economic-hydrologic modelling systems to evaluate cost-effectiveness of multiple BMPs. Yang
and Weersink, (2004), for example, developed an integrated economic-hydrologic modelling
approach to examine cost-effective targeting of riparian buffers in the Canagagigue Creek
watershed in southern Ontario. The economic returns of crop production were calculated by
estimating the revenue, production costs and quasi-rent of the production. The sediment
abatement benefits were obtained by combining the AnnAGNPS watershed model and a field-
scale Vegetation Filter Strip (VFS) model. By simulating the economic costs at different levels
of sediment abatement, they reported crop return losses for achieving the sediment abatement
goals. Specifically, the average costs for achieving 10%, 30% and 50% sediment abatement
goals were $175, $227 and $306/ha, respectively. Moreover, they suggested that compared to
implementing the riparian with a fixed width, allowing for buffer strips of different sizes can
increase the cost-effectiveness significantly.

20
Yang et al. (2005) also developed the integrated economic-hydrologic modelling
approach for spatial targeting of conservation tillage to improve water quality and carbon
retention benefits. The cost-effectiveness of conservation tillage was obtained from integrated
results from three models. The Crop Budget model was used to estimate the revenue, production
cost, and net return of the practice, the SWAT model was used to simulate the hydrologic
process and calculate the sediment abatement benefits, and the Century solid organic model was
used to estimate the carbon retention benefits from implementing conservation tillage. A GIS
interface was developed to facilitate the modelling process by preparing modelling input and
visualizing the integrated modelling results. Based on the cost-effectiveness of conservation
tillage, the modelling system was capable of preforming BMP optimization and suggesting BMP
design policies. Based on evaluating several sediment abatement and carbon retention goals, they
concluded that using the targeting strategy for implementing conservation tillage can obtain joint
benefits of improving water quality and retaining soil organic carbon while minimizing
economic costs.
Moreover, Kelly et al. (2018) developed an integrated economic-hydrologic approach for
targeting water retention pond BMP to reduce phosphorous runoff in the Lake Winnipeg
watershed of southern Manitoba. Two components of the economic costs were estimated
including construction cost and opportunity cost. The reduction in total phosphorus was
estimated by the SWAT model. After obtaining the environmental benefits and economic costs
of each water retention pond, the study compared three targeting strategies (i.e. cost targeting,
benefit-maximum targeting and benefit-cost targeting) and revealed that under the same
phosphorus reduction objective, the benefit-cost targeting strategy prioritized the locations for

21
water retention ponds with the highest cost-effectiveness in terms of providing the greatest level
of environmental benefits.
There are also other studies on integrated economic-hydrologic modelling for BMP cost-
effective analysis. Osei et al. (2000) used a Comprehensive Economic and Environmental
Optimization Tool (CEEOT) to estimate phosphorous reduction and associated cost under
different manure management scenarios. Ghebremichael et al. (2013) developed an integrated
modelling framework by combining the SWAT model and a farm-level economic model to
evaluate changes in the cost of various BMPs. By applying the integrated Universal Soil Loss
Equation (USLE) and economic model to a 1,014 ha watershed in Rickingham County of
Virginia, Veith et al. (2004) examined optimal BMP allocation for improving BMP cost-
effectiveness with respect to sediment reduction. The modelling results showed that BMP
implementation can result in up to $49 per ka/ha sediment reduction. Gitau et al. (2004)
integrated the SWAT model and an economic model to simulate dissolved P and cost of different
BMP scenarios at a 300-ha farm within the Town Brook watershed of Delaware County in
Pennsylvania. With a target of 60% dissolved phosphorous reduction, the model identified the
most cost-effective scenario with suggested site-specific BMP combinations.
Integrated economic-hydrologic modelling has been increasingly studied in recent
decades to evaluate the impact of BMPs on environmental benefits and economic costs.
However, a long-standing challenge has been how to make such modelling systems and the
associated information accessible to stakeholders to support their decision-making. To address
the challenge, the integrated modelling system outputs needs to be communicated to meet user

22
information needs for BMP adoption. Furthermore, the system needs to be user-friendly with an
interface that is easy to learn and manipulate.
2.3 WebGIS for supporting agricultural BMP adoption
2.3.1 GIS-based decision support system (DSS)
The GIS-based decision support system (DSS) has been increasingly developed in recent
decades. Malczewski (2004) suggested to understand the role of GIS-based decision support
system in planning from two types of rationality, named instrumental rationality and
communicative rationality (Figure 2-1). The instrumental rationality emphasizes spatial
reasoning and analysis as the core of planning while the communicative rationality suggests the
importance of communication support in planning for user engagement, conflict resolution, and
ultimately, consensus making.
Figure 2-1: Understanding the roles of GIS-based decision support system in planning (Based on Malczewski 2004)
From the instrumental perspective, GIS-based spatial analysis method can be classified
into two main categories: computer-assisted overlay mapping methods and multi-criteria
decision-making (MCDM) methods. The computer-assisted overlay mapping methods, such as
GIS-based Decision Support System
Instrumental rationality Communicative rationality
23
Boolean operations and weighted linear combination (WLC), address the suitability problems
through overlay analysis. As examples, Mbilinyi et al. (2007) developed an overlay mapping
method for identifying potential sites for rainfall harvesting. The overlaying analysis was
conducted by combining six map layers, including rainfall, soil depth, slope, soil texture,
landcover and drainage layers. Similarly, Qi and Altinakar (2011) developed an overlay mapping
analysis for estimating the flood damage in the area of Milledgeville, Georgia of the United
States. The flood damage was estimated based on one layer on land feature types and the other
layer on flood depth across the region. The flood depth-damage relationships on different land
feature types were developed using the data from field surveys and expert panel opinions.
The MCDM methods advance the computer-assisted overlay mapping methods by
implementing multi-criteria decision rules with mathematical programming algorithms. The
result of the MCDM methods can be largely associated with the accuracy and precision of the
input-data to the GIS-based multi-criteria procedure (Zhou and Civco, 1996). In recent decades,
the MCDM methods have been widely used to support various spatial decision-making tasks,
such as site selection, urban planning, and environmental management. As examples, Rinner and
Malczewski (2002) developed a decision support tool based on the Order Weighted Averaging
(OWA) for resort site selection. The OWA evaluated the suitability of resort sites based on two
sets of weights (i.e. criterion important weights and order weights) and was able to support
decisions based on the attitude of decision-makers (e.g. risks and trade-off). Sugumaran et al.
(2004) developed a GIS-based decision support system for environmental planning and
watershed management. In the system, a decision-making process was implemented to calculate
the environmental sensitivity index of watersheds using 13 weighted parameters, such as portion
of watershed area with slope greater than 15% and relative abundance of endangered species.

24
Van Haaren et al. (2011) also developed a GIS-based decision support system for siting wind
farms in the New York State. They suggested that the locations with the highest wind resources
are not always feasible sites for wind farm, and introduced a site selection tool to calculate the
site priority based on multiple economic, planning, environmental and ecological parameters,
such as electronic line and land costs, noise and visual impact, slope, bird habitat, and distance to
lakes and rivers.
From the communicative perspective, the GIS-based decision support systems facilitate
planning in two ways. Firstly, the decision support system facilitates consensus building through
modelling. As examples, Boroushaki and Malczewski (2010a) developed a participatory GIS and
used the fuzzy majority approach to obtain the group solution based on individual preferences. A
consensus measuring tool was also implemented based on the calculation of consensus measure
and proximity measure. The consensus measure showed the agreement among individual
preferences to the group solution and the proximity measure calculated how close the individual
preferences are to the group solution (Boroushaki & Malczewski, 2010b). Mekonnen and
Gorsevski (2015) developed a WebGIS-based decisions support system for siting wind farms
within Lake Eire area, Ohio. A voting system was integrated to allow participants to score wind
farm alternatives based on several parameters such as population density, distance from shore
and bird habitat. Participants’ scores then were aggregated using the Borda count to promote a
consensual solution.
Secondly, the decision support system can support consensus building by improving
information accessibility and communications among individuals. With advancement in internet-
based communication technologies, several studies have been conducted to understand the use of

25
WebGIS to improve the planning process (Kingston et al., 2000; Rinner, 2001; Elwood & Ghose,
2011). A detailed review of the WebGIS-based communication technologies is given in the
Section 2.3.2.
2.3.2 Information communications with WebGIS
The WebGIS emerges out of the GIS and enables access to spatial information and
services through the Internet without time and place constraints (Kingston et al., 2000).
Consequently, the WebGIS offers greater flexibility for two or more people to address collective
decision-making tasks using GIS functions (Elwood & Ghose, 2011). Given that agricultural
BMP adoption requires frequent communications among stakeholders, particularly farmers and
conservation managers, WebGIS can be an ideal tool to support adoption of agricultural BMPs
(Zhang et al., 2011).
WebGIS has been used to support a variety of information communication tasks
(Karatzas et al., 2000; Kingston, 2007; Sidlar & Rinner, 2007; Simão et al., 2009). In its simplest
form, the WebGIS offers a one-way communication and is mainly used as a platform to deliver
information to the public. In those systems, users are in a passive mode and can only extract
geographic information from the map. Some typical examples of this form of WebGIS include a
series of interactive environmental maps published by the Government of Canada for the public
to observe the distribution of environmental variables, such as air quality, water quality and
quantity (“Open maps,” n.d.). By delivering information to the public, such WebGIS plays an
important role in educating people and improving their knowledge. However, those systems
typically lack functionalities to support public communications and complex decision-making
tasks.

26
Some studies used WebGIS as an important means for collecting information. These
studies implemented the concept of volunteered geographic information (VGI) (Coleman et al.,
2009). VGI represents a shift in how geographic information is created and shared (Elwood et
al., 2012). In the VGI applications, participants of VGI applications are information producers
(Coleman et al., 2009). Kingston et al. (2000), for example, developed a WebGIS for supporting
local environmental decision-making. The system adopted an open-ended approach and allowed
members of the community to make comments on a public map. The public map enabled the
function to collect and share local knowledge for the future environmental development. Based
on a preliminary survey, the authors found that the public response to the system was positive.
Particularly, the respondents found the ability to type in comments useful. Similarly, Kingston
(2007) introduced a WebGIS for supporting local policy decision-making. The system provided
an online mapping interface for citizens to report environmental problems. The interface also
supported policy officers to monitor problems in real time and target resources to problem
locations. As a conclusion, Kingston (2007) stated that such online interactive mapping tools
provided an effective means to improve communication efficiency and citizen participation in
the decision-making process.
Volunteered geographic information offers a low-cost mechanism for the acquisition of
geographic information; however, it prompted concerns with regard to its quality. Flanagin and
Metzger (2008) defined the quality of VGI as the extent to which the participants provide their
personal inputs honestly and accurately. To assure the quality of VGI, Goodchild and Li (2012)
introduced two main approaches, i.e. the crowd-sourcing and social approaches. The crowd-
sourcing approach relies on the ability of the crowd to validate and correct the errors that an
individual might make, while the social approach relies on a group of trusted individuals as gate-

27
keepers to validate the information. Moreover, Goodchild and Li (2012) emphasized that the
validation of VGI should rely on the broad body of geographic knowledge. As an example, they
showed that “Joe’s Café” can be mislocated to a historic area which factually contains no
business.
More complex WebGIS offers two/multiple-way communications and allows the public
to initiate and engage online discussions and disseminate information. Rinner (2001) developed
the argumentation map model to represent spatially related discussion. The model allowed geo-
referencing argumentation elements (e.g. comments) to geographic objects and vice versa. Based
on the argumentation map model, Keßler (2004) implemented a software called Argumap. Sidlar
and Rinner (2007) later evaluated an Argumap prototype for supporting participants to discuss
planning ideas and concerns in the University of Toronto. Based on participants’ feedback on the
Argumap prototype, Sidlar and Rinner (2007) found that the Argumap was useful for supporting
spatially related discussions. They also received several recommendations for the prototype
improvement. Those recommendations included map tool tips, multimedia content support, and
help menu.
After the introduction of the argumentation map model, many GIS-based online
discussion applications were developed. Tang (2006), for example, developed a GIS-based
online discussion forum (GeoDF) for campus planning. The system supported online discussions
and allowed participants to send proposed plans to other participants within a specific distance.
As an improvement to the argumentation map, the GeoDF focused on the spatial context to
support discussions. Tang (2006) defined the concept of spatial context to include spatial and
text components. The spatial component includes map extent, visible map layers, sketches, and

28
annotations. Moreover, Brent et al. (2010) developed a WebGIS called “MapChat tool” to
facilitate information communications among participants. The MapChat tool allowed
participants to draw new features on the map and add comments to the selected map features.
Because all comments were spatially referenced, the MapChat tool allowed participants to
examine comments based on locations, and spatial relevance of comments. Brent et al. (2010)
concluded that the MapChat tool supported a self-directed and sustainable participatory approach
for information collection and can benefit the process of local knowledge acquisition.
Some studies used the argumentation map in conjunction with Spatial Decision Support
System (SDSS) to support collaborative decision-making tasks. For example, Simão et al. (2009)
developed a WebGIS for wind energy planning. The system combined a Multi-Criteria Spatial
Decision Support System (MC-SDSS) and an argumentation map. The MC-SDSS evaluated
wind farms and classified them into three pre-defined categories (i.e. Recommended,
Acceptable, and Non-acceptable). The argumentation map rendered the classification result and
allowed users to make spatially referenced comments associated with the wind farm sites. To
manage the comments, the system used a discussion forum with a tree structure to maintain the
logic chain of arguments. Based on system evaluation, the authors noted that the system
improved interactions among farmers and provided a learning opportunity to facilitate users to
understand the complexity of wind-farm siting.
With the development of ICTs, many communication tools have been incorporated into
WebGIS to facilitate synchronous or asynchronous communications. As examples, Karatzas et
al. (2000) presented project APNEE (Air Pollution Network for Early warning and online
information Exchange in Europe). In the project, they used a WebGIS to promote dissemination

29
of air quality information. The system allowed citizens to access air quality information from
different information channels. Specifically, the system provided Short Message Service (SMS)
and voice mail for citizens to receive air quality information on their mobile devices. The system
also provided email function for citizens to receive newsletters and active notifications. By
offering different communication channels, the WebGIS facilitated better communication to
improve mutual understanding between citizens and city authorities. Bugs et al. (2010) also
discussed the use of email as an effective tool for asynchronous information transfer and opinion
sharing. Moreover, Butt and Li (2012) developed a web-based, collaborative GIS prototype to
support public participation. The prototype examined the use of ICTs and showed a great
potential of ICTs to improve public participation. Specifically, the prototype provided a shared
map for participants to explore geographic context of tasks and incorporated a GIS-based
discussion forum to manage geo-referenced comments posted by participants. The prototype also
prepared a virtual public meeting interface to facilitate map-based communications among
participants. The virtual public meeting interface provided an array of facilitation tools for
participants to interact with the shared map (e.g. select features, add annotations, and draw
graphics).
The various communication methods and tools have provided great potential for WebGIS
to support information communication tasks. However, current technological competency
doesn’t necessarily lead to the success of stakeholder participation and problem solving. Brown
(2012) and Brown and Kyttä (2014) reviewed the use of WebGIS for regional and environmental
planning and identified several concerns that need to be addressed for applying WebGIS to
specific information communication tasks. Firstly, it is important to identify system users and
their information needs. The users may include decision makers, implementers, affected

30
individuals, interested observers, or the general public (Schlossberg & Shuford, 2005).Secondly,
there is a need to increase the use of WebGIS. They suggested that incentives such as
sponsorship, education and better system design are some possible approaches to engage the
public for WebGIS participation. Finally, efforts need to be made to identify and control threats
to spatial data quality, particularly for WebGIS portals where users are granted with open access
to contribute and disseminate information.
2.3.3 GIS-based decision support system for facilitating agricultural BMP adoption
With the advances in GIS technologies and availability of digital spatial data, progress
has been made to develop GIS-based decision support systems for watershed management and
planning. In such decision support systems, watershed modelling tools were often employed as
MCDM components for supporting spatial analysis and reasoning. The functions of GIS in those
decision support systems have been reviewed by many researchers. As indicated by Goodchild,
Parks and Steyaert (1993), GIS has been employed to improve the accessibility of the modelling
system through facilitating the organization and visualization of spatial data and providing
spatial analysis functions to assist modelling tasks. Jayakrishnan et al. (2005) also noted that GIS
helped assemble the required spatial data from GIS coverages, create necessary model input files
efficiently, and enable water resources professionals to study large watershed systems with
significant savings in time and cost. Moreover, Olivera et al. (2006) indicated that interfacing
GIS with watershed modelling system has greatly improved the efficiency and easiness of using
the modelling systems. As one of the leading GIS companies, Environmental System Research
Institute (ESRI) published an ArcGIS-SWAT tool for watershed modelling (Olivera et al., 2006).
The GIS in the ArcGIS-SWAT tool automates multiple watershed modelling tasks, including

31
watershed delineation, classification of Hydrologic Response Unit, preparation of modelling
input files and visualization of modelling results.
Many GIS-based decision support systems have been designed and developed in recent
years for analyzing the cost-effectiveness of BMPs and supporting BMP planning. Rao (2007),
for example, integrated the SWAT into the ArcIMS to evaluate the environmental benefits of the
Conservation Reserve Program in the Beaver River watershed in Oklahoma of the United States.
Shao et al. (2017) also developed a GIS-based decision support system for BMP evaluation and
policy making. These GIS-based decision support systems were able to generate essential
information for support BMP adoption, however, they were mostly desktop-based and mainly
used by experts (Liu, Bralts, & Engel, 2015; Karki et al., 2017; Jang, Ahn, & Kim, 2017). Those
systems have the potential to be further developed to improve the accessibility of modelling
functions and facilitate information communications on modelling results among stakeholders.
The rationale behind this is that the decision support system should fulfill both instrumental and
communicative roles in the process of agricultural BMP adoption (Malczewski, 2004).
WebGIS provides a promising platform to improve information communications among
stakeholders for agricultural BMP adoption. Some WebGIS systems have been applied to
address environmental management issues. Reviewing those systems can be helpful for
designing a WebGIS-based decision support system for facilitating agricultural BMP adoption.
Luchette and Crawford (2008) developed a WebGIS to visualize and publish pollution
information for citizen-based monitoring. In the system, an online interactive map was provided
to the public for exploring water quality data by hydrologic unit. Werts et al. (2012) also
developed an online web mapping interface that enabled users to both submit pollution

32
information and explore pollution pattern. By incorporating social media, the interface allowed
pollution information sharing among communities. Moreover, Ahmed et al. (2017) built a mobile
application called “My City, My Environment”. With mobility support, the system enabled users
to access information at any time and from anywhere. A web service was built in the application
for users to report pollution incidents. As the system was open to any user, user trust and privacy
protection were a major concern (i.e. whether the data was trustworthy, and users might feel
unsafe to report incidents). It would be necessary to adopt a credential system that requires users
to register in the server before using the reporting web service.
Some of the functionalities from those WebGIS systems have the potential to be used for
supporting agricultural BMP adoption. However, new functions and modules need to be
designed based on the information communication process for BMP adoption.
2.4 Research gaps
Information communication is important for stakeholders to reach a consensus on
agricultural BMP adoption. Many studies on agricultural BMP adoption have provided insights
on information needs of stakeholders, particularly farmers and conservation managers. However,
it is necessary to improve the understanding on information communication process among
stakeholders, which include the role of stakeholders in the communication process, their
information needs, and their communication tasks. With the potential of information
technologies to fulfill the information needs of stakeholders, it is particularly necessary to
improve the knowledge about the use of various information technologies to support information
communications among stakeholders for agricultural BMP adoption.

33
Integrated economic-hydrologic modelling systems have been increasingly developed to
generate information on economic cost, environmental benefits and cost-effectiveness of
agricultural BMPs. Engaging farmers for BMP adoption requires such information to be readily
available and communicated to them. Conservation managers also need the information to
conduct spatial targeting of agri-environmental programs. However, most of the integrated
modelling systems are desktop-based and primarily used by experts. These systems have the
potential to be extended to improve user access to information in BMP adoption process.
GIS-based decision support systems have been developed for agricultural BMP adoption.
Those systems were able to provide functions for evaluating the effects of agricultural BMPs, but
they also need to fulfill the communicative role for the BMP adoption. The WebGIS has become
a promising tool to support information communication tasks. Various WebGIS-based
applications have been developed to address environmental issues and some of the functionalities
of those systems can be utilized to further develop a WebGIS-based decision support system for
facilitating agricultural BMP adoption. The WebGIS-based decision support system needs to be
developed based on understanding the information communication process for agricultural BMP
adoption.

34
Chapter 3 An Information Model for Agricultural BMP Adoption
This chapter develops an information model that will be used to design a WebGIS-based
decision support system for facilitating agricultural BMP adoption. The information model
conceptualizes information communications within the BMP adoption process and derives
information needs of farmers and conservation managers. More specifically, it defines
information contents and also how information should be generated and communicated.
Scientific researchers, farmers and conservation managers are key stakeholders within the
process. Scientific researchers are environmental modellers that generate information on BMP
cost-effectiveness, farmers are BMP adopters, and conservation mangers are BMP
policy/management designers and adoption facilitators. Within the information model,
information technologies such as GIS and ICTs are examined to address various information
needs of the stakeholders.
3.1 The process of agricultural BMP adoption
3.1.1 Stakeholders and their roles in the information communication process for BMP adoption
Figure 3-1 illustrates key stakeholders and their roles in the information communication
process for BMP adoption. The key stakeholders include scientific researchers, conservation
managers, and farmers. Scientific researchers identify agri-environmental problems. Scientific
researchers also design agricultural BMPs and develop the integrated economic-hydrologic
models for BMP evaluation (Yang & Weersink, 2004; Yang, Sheng, & Voroney; 2005; Yang et
al., 2016). The integrated economic-hydrologic models play an important role to generate the

35
information on private economic costs, public environmental benefits and cost-effectiveness of
BMPs.
Figure 3-1: Key stakeholders and their roles in the information communication process for BMP adoption
Conservation managers have the responsibility to design BMP policy/management (e.g.
set up environmental targets) and allocate investments to incentivize and facilitate BMP
adoption. To support conservation managers to fulfill their roles, scientific researchers provide
conservation managers with information to educate farmers on BMP concepts and
implementation. Scientific researchers also provide conservation managers with information on
BMP costs, benefits and cost-effectiveness to support them to design BMP policy/management.
The cost-effectiveness information helps conservation managers to determine the minimum
investment to achieve specific environmental targets and BMP locations. The information also
helps conservation managers to maximize environmental benefits under financial constraints
(Shao et al., 2017).
Scientific researchers
Conservation managers
Farmers
Integrated economic-hydrologic models for BMP
evaluation
Agricultural best management practices
(BMP)
Agri-environmental problems
Educate/Transfer information
Educate/Persuade
Develop
Design
Identify
EvaluateAddress
Adopt

36
Farmers are adopters of BMPs. According to literature (Prokopy et al, 2008; Knowler &
Bradshaw, 2007), BMP adoption is related to various factors such as farm characteristics (e.g.
slope, area and soil), farmer characteristics (e.g. education and age), and economic factors (e.g.
farmers’ income and commodity prices). A number of hypotheses have been tested regarding the
effects of those factors on farmers’ adoption of BMPs. However, due to physical, social and
economic differences across study areas, their conclusions on explaining the adoption rationale
vary (Knowler & Bradshaw, 2007). For example, Carlson et al. (1981) found no relationship
between age and adoption of conservation practices, whereas D’Souza et al. (1993) found that
younger farmers are more likely to adopt new technologies than older farmers. While
some researchers suggested a dominant role of financial considerations on adoption, Vanclay
(1992) reported that farmers do not necessarily act in economically rational ways because non-
financial factors such as stewardship attitude can also affect BMP adoption.
To promote farmers’ adoption of BMPs, conservation managers need to educate farmers
on BMP concepts and implementation. Conservation managers also need to persuade farmers to
adopt BMPs. The private economic costs, public environmental benefits, and cost-effectiveness
of BMPs are the most direct information to support farmers to make decisions on BMP adoption.
This information is essential to improve farmers’ understanding on the effects of BMPs (Rogers,
1995). This information is also important to support communications between farmers and
conservation managers to achieve a consensus on BMP adoption (Shao et al., 2017).
Furthermore, communications among farmers on their adoption experiences can be important to
improve the possibility of BMP adoption by farmers (Reimer et al., 2012).
37
3.1.2 Improving the process of BMP adoption
Agri-environmental programs support the BMP adoption process by providing
stakeholders with communication opportunities such as in-person consultations and workshops
(Smithers & Furman, 2003; Prager & Freese, 2009). This approach to communications, however,
has limitations. Firstly, planning those communication opportunities such as in-person
consultations and workshops may incur considerable costs. The high costs may affect the
efficiency of agri-environmental programs (Coggan et al., 2010). The costs such as travel costs
and time can also become a barrier for stakeholders to taking part in the process of
communications (Falconer, 2000; Smithers & Furman, 2003; Claassen et al., 2008). Secondly, as
the communication opportunities are generally planned at fixed times and locations and require
physical presence of stakeholders, those communication opportunities lack the flexibility to
sufficiently support the communication process. Considering that BMP adoption might require
frequent communications among stakeholders to develop a mutual understanding of BMPs and
address their concerns about BMP adoption (Rogers, 1995), an enhancement to the
communication system is necessary to improve stakeholders’ access to information and increase
their communications. As indicated by Ma et al. (2012), ample communication opportunities are
essential for farmers to obtain information to reduce their perceived risks of BMP adoption.
Advances in information technologies in recent decades have revolutionized the way of
communications and can provide great opportunities to overcome the limitations of current
approach to information communications for BMP adoption. On one hand, information
technologies can improve information provision to stakeholders. Information technologies allow
scientific researchers and conservation managers to publish information and modelling tools on

38
the Internet. Information technologies also allow farmers and conservation managers easily
access the information and modelling systems. Secondly, information technologies enable online
communications which offer a more flexible ways of communications among the stakeholders
for BMP adoption. The online communications can facilitate mainly two types of
communications for BMP adoption (Lubell & Fulton, 2007; Reimer et al., 2012). One type of
communications is between conservation managers and farmers. Conservation managers can
provide farmers with BMP program information and other information supports such as BMP
technical knowledge. Farmers also can request information from conservation mangers. The
other type of communications is among farmers.
3.2 Developing an information model for the agricultural BMP adoption process
This section discusses how an information model is developed to characterize
information communication process for the agricultural BMP adoption. The development of the
information model takes three steps. Firstly, the information needs by farmers and conservation
managers are analyzed. Their information needs are classified into two categories, public
information and BMP planning information, according to information characteristics. Secondly,
based on the information classification, the use of ICTs for different information needs is
analyzed. Finally, the information model is developed to characterize the information
communication process supported by information technologies.
3.2.1 Public and BMP planning information
Information is the key for stakeholders to work together to finalize a plan for
implementing BMPs. During the process of BMP adoption, farmers and conservation managers

39
need information to address several key questions including “What is the environmental
problem?”, “How to address the problem?”, “What are the environmental and economic effects
of BMPs?”, and “What is the optimal solution for BMP implementation based on cost-
effectiveness?” (Figure 3-2).
Figure 3-2: Key questions driving the BMP adoption
The information needs of farmers and conservation managers can be classified into two
categories: public information and BMP planning information (Table 3-1).
Table 3-1: Information needs for BMP adoption
Public information Field characteristics, environmental concerns, and BMP adoption
BMP related technical knowledge
Agri-environmental policies
BMP planning
information
Economic costs, environmental benefits and cost-effectiveness of BMPs
BMP policy/management subject to economic constraints or environmental targets
Communications between farmers and conservation managers
What is the environmental problem?
What is the optimal solution for BMP implementation
based on cost-effectiveness?How to address the problem?
What are the environmental and economic effects of
BMPs?
Information

40
Public information: The public information allows public access. Information contents of
the public information could include 1) farmers’ field characteristics, environmental concerns,
and BMP adoption, 2) BMP related technical knowledge, and 3) agri-environmental policies.
These information contents play different roles in facilitating BMP adoption. For example,
information on field characteristics, environmental problems, and BMP adoption can improve
farmers’ environmental awareness and motivation for landscape stewardship. Educating farmers
with BMP related technical knowledge would equip them with “know-how” of BMPs and
compatibility with the existing farming system. Information on agri-environmental policies can
help farmers to understand environmental regulation on farming operations and also economic
incentives for BMP adoption (Greiner & Gregg, 2011).
BMP planning information: The BMP planning information is field and farm specific and
can be only accessed by farmers and conservation managers. It aims to support BMP planning
activities such as BMP evaluation and implementation. Information contents of the BMP
planning information can include 1) economic costs, environmental benefits and cost-
effectiveness of BMPs, 2) BMP policy/management information such as environmental targets
for a watershed and financial constraints on BMP investment, and 3) communications between
farmers and conservation managers. Information on BMP economic costs, environmental
benefits and cost-effectiveness is necessary for farmers and conservation managers to evaluate
field-specific BMP effects for various “What if” BMP scenarios. The information on BMP
policy/management can be useful to support spatial targeting of BMPs to meet environmental
targets with minimized costs and to maximize environmental benefits under financial constraints
at a watershed scale. The communication between farmers and conservation managers is
necessary for them to achieve a mutual consensus on BMP adoption.

41
The differentiation of information into public information and BMP planning information
has implications on developing the WebGIS-based decision support system. For the BMP
planning information, authorization mechanisms need to be built to control the information
access and communications when field and farm specific confidential information is involved.
Also, the differentiation of information can help select information communication tools and
technologies for different communication tasks.
3.2.2 Technologies and tools for information communications
Supporting information communications for BMP adoption needs to specify information
sources, information targets and information channels. Information sources are where
information is sourced or generated, information targets are where information is delivered or
received, and information channels define how information should be communicated between
information sources and targets. Some of the traditional information channels include newspaper,
television, radio and interpersonal networking (Westerman, 2008). However, with the
development of ICTs, channels for information communications have been revolutionized in
terms of their timeliness and efficiency (Westerman, 2008). Complementary to traditional
communication means, these information communication technologies and tools can be
integrated into the WebGIS-based decision support system to facilitate BMP adoption.
The information communication technologies and tools can be classified into two main
categories – tools for synchronous communications and tools for asynchronous communications
(Table 3-2). The tools for synchronous communications include chats, video conferencing,
interactive whiteboard and voice over IP. Chats can be described as online text conversations
that happen in real-time (Peris et al., 2002). The chats could involve two or more persons. The

42
two main ways of conducting chats include instant massager and web-based chats. Video
conferencing is mostly used for business collaborations. It enables immediate multi-point
meetings based on various time zones (Panteli & Dawson, 2001). Voice over IP is similar to
video conferencing; but instead of meeting in person, it is purely audio-based. At last,
whiteboards are popular online communication tools in education. They allow users to write,
draw and even collaborate with the help of an interface which simulates an actual physical
whiteboard (Kershner et al, 2010).
Table 3-2: Information communication technologies and tools
Synchronous Chats Video conferencing Voice over IP Interactive whiteboards
Asynchronous Public information portal Online forum Email
The synchronous communication tools are suitable for collaborative tasks requiring real-
time communications. However, as synchronous communications between farmers and
conservation managers can be challenging, the WebGIS-based decision support system for
facilitating agricultural BMP adoption can mainly utilize the tools for asynchronous
communications. Public information portal, as a collection of information from diverse
information sources, is suitable for delivering and disseminating the public information. Online
forums can be described as places where all users are allowed to post either comments or
questions (Janssen & Kies, 2005). Other users of the forums are permitted to reply to posts so as
to create online discussions. Online forums include discussion groups, discussion boards, and
bulletin boards. In online forums, discussion posts can be properly stored to be chronologically

43
or thematically sorted to form threads. In the context of BMP adoption, it could offer an effective
tool to organize the communications among farmers and conservation managers. Moreover,
electronic mail or email can be used to deliver important messages or files such as photographs
and files (Ebert & Shapiro, 2009).
3.2.3 Information modelling for agricultural BMP adoption
Information modelling for agricultural BMP adoption can be developed based on
information classification and examination of ICTs. Information modelling for public
information communications focuses on conceptualizing how public information should be
generated, compiled and disseminated to the public; while information modelling for BMP
planning information communications explains how BMP planning information is generated and
communicated between farmers and conservation managers for supporting BMP adoption (i.e.
BMP evaluation and policy/management design).
3.2.2.1 Information modelling for public communications
Information sharing among farmers about their fields and BMP adoption
Information sharing among farmers can have a positive impact on BMP adoption. Figure
3-3 shows the process of information sharing among farmers. Farmers share information on field
characteristics, environmental concerns, and BMP adoption by submitting annotations which are
linked to their fields. An annotation can record information such as crop type, soil type, soil
quality, erosion, and land management practices in its linked field. Based on the links between
annotations and fields, a WebGIS interface can be used to present the information. The WebGIS
interface can also provide a communication platform for farmers to explore annotations
submitted by other farmers.

44
Figure 3-3: The information sub-model for field characteristics, environmental concerns, and BMP adoption
Agri-environmental policy and BMP related technical knowledge
Agri-environmental policy and BMP related technical knowledge are public information
for facilitating BMP adoption. Figure 3-4 shows the information sub-model for communicating
information on agri-environmental policy and BMP related technical knowledge. Information on
agri-environmental policies can be collected from webpages. BMP related technical knowledge
can be obtained from webpages and BMP technical documentation. Conservation managers can
collect information from these different information sources and import the information to the
public information portal. The public information portal provides easy access to the information
and has the ability to consolidate and deliver information in an organized way (Murray, 2002;
Zhang et al., 2016). It also allows farmers to explore information in a systematic manner such as
finding information by keywords and facilitates farmers’ self-learning process.
Farmers Annotations
WebGIS
share
are displayed onis explored by
Crop typeSoil type
Land management practices
Soil quality
Erosion
Fields
own are linked to

45
Figure 3-4: The information sub-model for agri-environmental policy and BMP related technical knowledge
3.2.2.2 Information modelling for BMP planning
Economic costs, environmental benefits and cost-effectiveness
Figure 3-5 shows information communications of economic costs, environmental
benefits, and cost-effectiveness of BMPs. An integrated economic-hydrologic model can be the
engine to provide the information content. A WebGIS interface can be used to support the
examination of “What if” BMP scenarios, the presentation of modelling results, and the
interaction with the modelling results by both farmers and conservation managers (Shao et al.
2017).
Web pages
(i.e. Agri-environmental policy and BMP related technical
knowledge)
BMP technical documentation
(i.e. BMP related technical knowledge)
Conservation managers
Information portal
Farmers Conservation managers
are collected by
import information into
is explored by
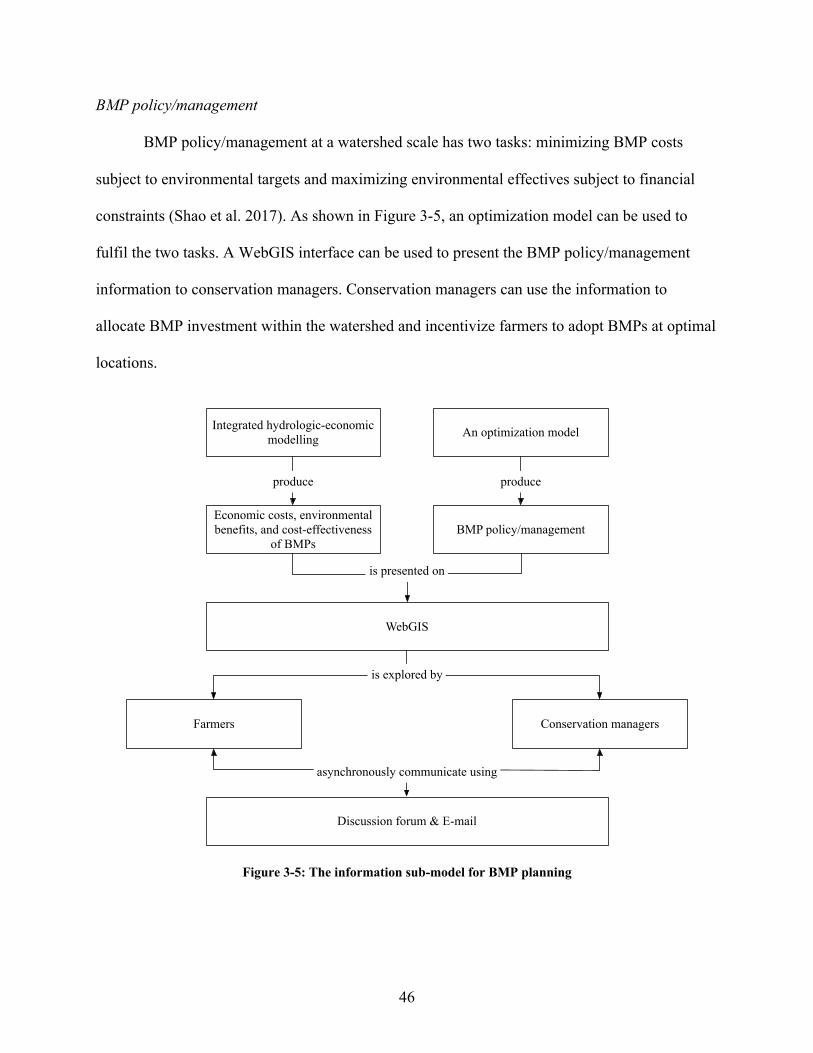
46
BMP policy/management
BMP policy/management at a watershed scale has two tasks: minimizing BMP costs
subject to environmental targets and maximizing environmental effectives subject to financial
constraints (Shao et al. 2017). As shown in Figure 3-5, an optimization model can be used to
fulfil the two tasks. A WebGIS interface can be used to present the BMP policy/management
information to conservation managers. Conservation managers can use the information to
allocate BMP investment within the watershed and incentivize farmers to adopt BMPs at optimal
locations.
Figure 3-5: The information sub-model for BMP planning
Integrated hydrologic-economic modelling An optimization model
Economic costs, environmental benefits, and cost-effectiveness
of BMPsBMP policy/management
WebGIS
Farmers Conservation managers
Discussion forum & E-mail
produce produce
asynchronously communicate using
is explored by
is presented on

47
Communications between farmers and conservation managers
The communications between farmers and conservation managers are essential for
addressing various questions on BMP costs, benefits, and cost-effectiveness and build a mutual
consensus on BMP adoption. The WebGIS allows more flexible, asynchronous communications
between farmers and conservation managers. The asynchronous communications can be
supported by email and discussion forum. When one person sends a message to another person,
the message receiver is notified and can reply to the message sender when available. Meanwhile,
the communication history can be maintained for both the sender and receiver to review and
track their communications.
3.3 Summary
Agricultural BMP adoption can be viewed as a process wherein stakeholders including
farmers and conservation managers achieve a consensus on BMP implementation through
information communications. Information needs of farmers and conservation managers can be
classified into two categories: public information and BMP planning information. Based on their
information needs, an information model is developed to characterize the information
communication process for BMP adoption, which involves information contents,
communications, and related technologies and tools. The information model includes three sub-
models. Specifically, one information sub-model is developed to characterize public information
communications on field characteristics, environmental concerns, and BMP adoption, one
information sub-model is developed to characterize public information communications on agri-
environmental policy and BMP related technical knowledge, and one information sub-model is
developed to characterize confidential information communications on BMP planning, which

48
including information on BMP costs, effectiveness, and cost-effectiveness for supporting the
examination of "What if" BMP scenarios by farmers and also BMP policy/management tasks by
conservation managers.

49
Chapter 4 System Architecture and Design of the WebGIS-based Decision Support System for Facilitating Agricultural BMP
Adoption
This chapter presents the architecture and design of the WebGIS-based decision support
system for facilitating agricultural BMP adoption. The design of the WebGIS-based decision
support system implements the information model to support the communication process of
public and BMP planning information in agricultural BMP adoption. The content of this chapter
is organized into five sections. The first section introduces a task-oriented design approach to
design the WebGIS-based decision support system. A hierarchical task analysis is used to guide
the design of the system at three design levels: the subsystem, module and component levels.
The second section introduces the loose-coupling between the WebGIS and the watershed
modelling tools, including an integrated economic-hydrologic model and an optimization model.
The third section introduces the subsystem of the WebGIS-based decision support system, which
includes the public subsystem, the BMP planning subsystem, and the administration subsystem.
In the fourth section, the modules of the three subsystems are given, and the fifth section
introduces the components of each module.
4.1 Task-oriented design of the WebGIS-based decision support system for facilitating agricultural BMP adoption
As an extension to the traditional desktop-based GIS system for BMP evaluation, the
WebGIS-based decision support system for BMP adoption needs to meet a wide range of system
requirements. In particular, considering that the WebGIS-based decision support system is
intended to support farmers and conservation managers instead of modelling experts and
researchers, the system has to be easy to use for novice users. Many literatures from Human

50
Computer Interaction (HCI) have described what features an “easy-to-use” system. For example,
Fischer, G. (1993) and Carroll, J.M. (1997) suggested that an “easy-to-use” system should be
user-centered and meet users’ task requirements. The understanding of user tasks is essential to
develop system interactions to meet the task requirements (Fischer, G., 2001).
Thus, a task-oriented design approach is used to design the WebGIS-based decision
support system for facilitating agricultural BMP adoption. Different from the traditional
“Waterfall” model of system design which focuses on system functions, the task-oriented design
approach focuses on representative user tasks, and emphasizes the design of an effective, user-
friendly interface (Lewis & Rieman, 1994). The task-oriented design facilitates the
implementation of the information model in two steps. Firstly, based on a hierarchical task
analysis, a hierarchy of user tasks is developed to understand how the information model is
implemented by user tasks or what user tasks in the information communication process are for
BMP adoption. Secondly, the hierarchy of user tasks is applied to guide the design of the
WebGIS-based decision support system at three system design levels: the subsystem, module,
and component levels.
4.1.1 A hierarchy of user tasks
The task-oriented design approach requires an in-depth understanding on the user tasks
for agricultural BMP adoption. In this regard, this research uses a hierarchical task analysis to
understand the structure of user tasks in the information communication process for BMP
adoption. According to Annett, J., (2004), the hierarchical task analysis provides an effective
framework to facilitate the structuring of user tasks as well as specifying the task-related
constraints, such as location, time, tools and conditions for completing the tasks.

51
The hierarchy of user tasks includes three levels. The task level one corresponds to the
information needs: the public and BMP planning information. It addresses general questions
such as “Bob would like to learn more about the BMP concept and implementation” and “Bob
would like to use the BMP planning information to examine BMP scenarios on his field”. The
task level two includes information tasks required to achieve the information needs. Two types
of information tasks at this level are mainly related to information provision and communication.
Sample tasks can include “Bob would like to evaluate the BMP cost-effectiveness” and “Bob
would like to discuss BMP adoption with conservation managers”. These two tasks are subtasks
to support Bob to plan BMPs on his fields which result from refining the tasks defined at level
one. Lastly, the task level three focuses on user interactions with the system. It defines how the
users interact with the system to conduct the information tasks defined at level two (i.e.
information provision and communication) and how the components are designed to support user
interactions. An example of tasks at this level can be “Bob opens an online discussion window to
initiate a discussion on BMP planning”. The tasks at this level support the specifications of the
system interface design.
To make sure the tasks are realistic, complete and representative, the development of the
task hierarchy used two methods. Firstly, the tasks were discussed and verified with
representative users from conservation authority and government. In meetings and workshops,
the workflow of tasks was demonstrated. Feedback from the representative users was collected to
refine the tasks. Secondly, the tasks were referenced and further refined based on a desktop GIS-
based system for watershed evaluation of BMPs (Shao et al., 2017). The GIS system
characterized the agricultural BMP planning process and was evaluated by both representative
users and experts.

52
4.1.2 System design levels
According to the hierarchy of user tasks, the WebGIS-based decision support system is
designed at three levels: the subsystem level, the module level, and the component level. Each of
these levels corresponds to a level of tasks (Figure 4-1). Specifically, the subsystems aim to
support the information needs (i.e. the public and BMP planning information), the module aims
to support information tasks (i.e. information provision and communication) to meet the
information needs, and the components aims to support user interactive operations to conduct
information tasks.
Figure 4-1: Task-oriented design of the WebGIS-based decision support system for facilitating agricultural BMP adoption
Subsystems
Modules
Components
System design levels Hierarchy of user tasks
Task Level 1Information needs
Task Level 2Information tasks
(Information provision and communication)
Task Level 3Interactive operations
achieve
support
decompose
decompose
achieve
support
support

53
4.2 Integrating WebGIS and watershed modelling tools
Watershed modelling tools generate agri-environmental planning information on
economic costs, environmental benefits and cost effectiveness of BMPs. Integrating WebGIS
and watershed modelling tools is necessary for farmers and conservation managers to easily
access the information and conduct BMP planning tasks. In this study, the WebGIS and the
watershed modelling tools are integrated using a loose-coupling approach. Two watershed
modelling tools include an integrated economic-hydrologic model and an optimization model
(Shao et al., 2017). In the loose-coupling approach, the GIS and watershed modelling tools
communicate through external files. To increase the efficiency of coupling, the communication
process between the GIS and watershed modelling tools are automated: program routines are
designed to automatically generate modelling input files, process modelling output files, and
present information on the WebGIS.
4.2.1 WebGIS and the integrated economic-hydrologic model
The loose coupling of WebGIS and the integrated economic-hydrologic model is shown
in Figure 4-2. The WebGIS supports the preparation of user-specific modelling inputs, including
farm fields and BMP assignments on these fields. The SWAT model uses the user-specific
modelling inputs combined with pre-defined modelling inputs such as land use data and
management data to generate information on environmental effects of “What if” BMP scenario,
such as sediment, total phosphorus, and flow. The economic model generates information on the
economic effects of BMPs, including revenue, cost and net return.

54
Figure 4-2: Loose coupling of WebGIS and the integrated economic-hydrologic model
An integrated economic-environmental analysis of BMP scenarios is based on the
combination of modelling results from both the SWAT models the economic model. Because the
SWAT model simulates the hydrologic process based on hydrologic response units (HRU), the
hydrologic modelling results are interpolated into the field scale. The combined results are stored
in spatial databases and GIS files. These data sources can then be used by WebGIS for result
presentation. The spatial databases can be used to further process information, draw charts and
generate result tables. The GIS files can be used by the WebGIS to render interactive modelling
result maps.
4.2.2 WebGIS and the optimization model
Coupling WebGIS and the optimization model is shown in Figure 4-3. The WebGIS is
used to prepare user-specific modelling input for the optimization model, including the farm
fields, BMP types, and optimization objectives.
The SWAT model The economic model
Processing
WebGIS
Spatial databases and GIS files

55
Figure 4-3: Loose coupling of the WebGIS and the optimization model
Based on user-specific inputs, the optimization model generates the BMP
policy/management information at a watershed scale. The BMP policy/management information
specifies how to plan BMPs on the targeted fields to achieve environmental or economic
objectives to achieve cost-effectiveness. An open-source Mixed Integer Linear Programming
Solver is embedded in the model to identify field-specific BMP combinations with cost
minimization objective function subject to environment targets or with maximizing
environmental benefit objective function subject to economic constraints (Oginskyy, 2014). A
field-BMP combination can be any combination of field and BMPs, such as field 1 with cover
crop + conservation tillage or field 2 with nutrient management. The solver works based on
ranking the cost-effectiveness of all the field-BMP combinations. The field-BMP combinations
with the highest cost-effectiveness are considered as the most cost-effective. To support the
optimization modelling, a database is created to store data on the economic and environmental
effects of BMP combinations on each farm field based on on-farm economic modelling and
watershed hydrologic modelling.
The optimization model
WebGIS
Spatial databases and GIS files
Optimization databases

56
4.3 The subsystems of the WebGIS-based decision support system for facilitating agricultural BMP adoption
The WebGIS-based decision support system is designed to include three subsystems: a
public subsystem, a BMP planning subsystem and an administration subsystem (Figure 4-4).
The public subsystem supports the communication process of public information. The
user groups of the public subsystem include farmers and conservation managers. It aims to
support tasks such as information sharing among farmers about their field characteristics,
environmental concerns, and BMP adoption, and dissemination of agri-environmental policies
and BMP related technical knowledge. The public subsystem also supports BMP related
communications among farmers.
The BMP planning subsystem supports the communication process of BMP planning
information, which can be used by only registered farmers and conservation managers due to
confidentiality of the BMP planning information. The subsystem supports farmers and
conservation managers to evaluate “What if” BMP scenarios and answer questions like “What
are the environmental and economic effects of BMPs if the BMPs are applied to specific farm
fields”. The subsystem also supports conservation mangers to answer two policy/management
design questions: “How to implement BMPs in targeted fields to meet an environmental target
with minimized costs” and “How to implement BMPs in targeted fields to maximize
environmental benefits under a financial constraint”. The subsystem also supports discussions
between farmers and conservation managers to address various BMP adoption questions.
Different from the public and BMP planning subsystems which support the information
communication process, the administration subsystem supports system operations. It allows the

57
administrator to register users to access the BMP planning subsystem. It also supports
administrators to monitor the use and collect usage information of BMP planning subsystem by
farmers and conservation managers. Such usage information could be used to evaluate system
activities of farmers and conservation managers and understand their progress on various BMP
assessment tasks.

58
Figure 4-4: Subsystems in the WebGIS-based decision support system for facilitating agricultural BMP adoption
WebGIS-based decision support system for facilitating agricultural BMP adoption
The public subsystem The BMP planning subsystem The administration subsystem
• Economic costs, environmental benefits and cost-effectiveness of BMPs
• BMP policy subject to environmental targets
or economic constraints
• Communications between farmers and
conservation managers
• Field characteristics, environmental
concerns, and BMP adoption
• Agri-environmental policies
• BMP related technical knowledge
• Communications among farmers
• Usage information of the BMP planning subsystem

59
4.4 The modules of the three subsystems
This section describes the modules within the three subsystems of the WebGIS-based
decision support system: the public subsystem, the BMP planning subsystem, and the
administration subsystem. The modules aim to support information tasks in the subsystems.
4.4.1 The modules of the public subsystem
The public subsystem facilitates the communication process of the public information.
The subsystem comprises of two modules: “Information sharing site” and “Public information
center” (Table 4-1).
Table 4-1: Tasks of system modules in the public subsystem
Module Tasks
Information sharing site Submit and view public annotations
Public information center Search for information and explore searching results
Information sharing site: The main objective of the “Information sharing site” module is
to support information sharing among farmers about their field characteristics (e.g. crop type,
soil type, and soil quality), environmental concerns (e.g. erosion), and BMP adoption (e.g.
conservation tillage). The module also supports farmers to develop communications on BMP
related topics. To support these objectives, the information sharing site enables farmers to submit
public annotations and view the public annotations submitted by other farmers.

60
Public information center: the “Public information center” is designed to disseminate
public information such as agri-environmental policies and BMP related technical knowledge.
The module allows farmers to search and explore the information of their interest.
4.4.2 The modules of the BMP planning subsystem
The BMP planning subsystem is designed to support the communication process of BMP
planning information. The subsystem is composed of five modules including “Access control”,
“Scenario exploration”, “Policy/Management”, “Discussion” and “Report”. These modules
support several information tasks; some complex tasks can be decomposed into several steps
(Table 4-2).
Access control: The “Access control” module defines how the system access should be
granted to farmers and conservation managers to use the BMP planning subsystem. It allows
only the authorized farmers and conservation managers to log into the BMP planning subsystem.
Scenario exploration: The “Scenario exploration” module supports farmers and
conservation managers to explore “What if” BMP scenarios to address questions like what the
BMP economic costs, environmental benefits and cost-effectiveness are if BMPs are
implemented in specific farm fields. To facilitate this task, the module handles several task steps,
including scenario creation, scenario development, scenario evaluation, and scenario
comparison.
Policy/Management: The “Policy/Management” module supports conservation managers
to design two types of BMP policies including spatial targeting of BMPs to achieve
environmental targets with minimized costs and maximizing environmental benefits subject to

61
financial constraints. To support the policy design, the module has two components including
scenario optimization and optimization result exploration.
Table 4-2: Tasks of system modules in the BMP planning subsystem
Module Task Task steps
Access control Authorize farmers and conservation
managers to use the BMP planning
subsystem
N/A
Scenario exploration Evaluate economic costs, environmental
benefits, and cost-effectiveness of BMPs
Create a BMP scenario
Develop a BMP scenario
Evaluate a BMP scenario
Compare the BMP scenario with a
baseline scenario
Policy/Management Design BMP policy/management subject to
economic and environmental constraints
Optimize a BMP scenario
Explore the optimization results
Discussion Submit discussion topics and reply N/A
Report Generate scenario reports in HTML/PDF
format
N/A
Discussion: The “Discussion” module enables farmers and conservation managers to
communicate on various BMP related topics. Farmers and conservation managers can create
discussion topics, and submit, view and reply discussion comments.
Report: The “Report” module facilitates the communication process by automatically
generating reports for the “Scenario exploration” and “Policy/Management” results. The module
can generate both HTML and PDF reports.
Table 4-2 summarizes the tasks and steps in the modules of the BMP planning
subsystems. “Scenario exploration” and “Policy/Management” modules are the key modules to
support BMP planning. The tasks of these two modules are analyzed using the scenario scripts or

62
narratives (Appendix A). The scenario scripts for eliciting tasks in the two modules are generated
based on the GIS-based system for watershed evaluation of BMPs (Shao et al., 2017) and also
inputs from conservation authority and government.
4.4.3 The modules of the administration subsystem
The administration subsystem supports user registration and system monitoring activities.
The administration subsystem includes three modules (Table 4-3).
Table 4-3: Tasks of system modules in the administration subsystem
Module Tasks
Access control Authorize the system administrator to use the administration subsystem
User registration Register users to use the BMP planning subsystem
System monitoring Analyze and display information on user activities within the BMP
planning subsystem
Access control: The “Access control” module is designed to authorize the system
administrator to use the administration subsystem.
User registration: The “User registration” module is for the system administrator to
register new users (i.e. farmers or conservation mangers) to use the BMP planning subsystem.
System monitoring: The “System monitoring” module is designed to support the
administrator to monitor the activities of farmers and conservation managers in the BMP
planning subsystem and understand the progress of their BMP assessment tasks.

63
4.5 The components of the system modules
This section discusses the design of modules in the WebGIS-based decision support
system. Each module has three tiers including client, service and data tiers. In the client-server
architecture, the client tier is on the client side and the service and data tiers are on the server
side. The client tier is designed to present information and support user interactions, the service
tier is designed to handle information requests from client and generates information required for
client presentation, and the data tier is designed to manage module-required data and files.
Components of the three tiers within each module are introduced in this section.
Specifically, the components on the client tier (i.e. user interface elements) are identified, the
components on the service tier (i.e. web services) are explained, and the components on the data
tier (i.e. database tables) are illustrated. The communication processes among these components
to address user information requests are also explained.
4.5.1 The components of the modules in the public subsystem
4.5.1.1 Module: Information sharing site
The “Information sharing site” module supports farmers to share information on their
field characteristics, environmental concerns, and BMP adoption. The component diagram of the
module is shown in Figure 4-5. To realize the module, three client components are designed: an
annotation form is designed for farmers to input information for sharing, an interactive map is
designed to present the submitted annotations, and an annotation list is designed to organize
annotations by categories and support filtering annotations by annotation contents.

64
To support farmers to submit and view annotations, several interactions are designed by
attaching user actions to the client components. Firstly, a click event is attached to the interactive
map. When a farmer clicks on the map, an annotation form will be triggered for the farmer to
input the information. Secondly, a click event is attached to the annotation form. When a farmer
submits the form, a request will be sent to the service tier for annotation submission. Thirdly, all
the three client components are interlinked with each other. When an annotation is submitted
from the annotation form, both interactive map and annotation list will be updated: an annotation
marker will be added to the interactive map, and an annotation will be inserted into the
annotation list. Fourthly, a filter is implemented on the annotation list, which can be used to filter
annotations by their information contents or categories. Finally, a “hover” map event is attached
to the interactive map. When a user hovers on the annotation marker, the annotation marker on
the map and the corresponding annotation on the annotation list will be highlighted.
Figure 4-5: Component diagram of the “Information sharing site” module
Two web services are designed in the service tier to support annotation submission and
loading/viewing. The “Write public annotation” web service writes submitted annotations to the
Interactive map
Write public annotation
Public annotation table
Annotation form Annotation list
Read public annotation
Render Render
ReadWrite
Update Update
Sent
Client
Service
Data
Trigger Filter

65
public annotation table, and the “Read public annotation” web service loads annotations from the
table and sends them to the map and annotation list for presentation. To support the annotation
management, a public annotation table is designed (see Appendix B, Figure B.1).
4.5.1.2 Module: Public information center
The “Public information center” module aims to facilitate farmers to obtain information
on agri-environmental policies and BMP related technical knowledge of their interest. The
component diagram of the module is shown in Figure 4-6. Two client components are designed
in the client tier including a searching tool and an information table. The searching tool allows
farmers to input a keyword to search for the public information. The information table is used to
display the searching results. A “click” event is registered to the searching tool; when the
keyword is submitted, a searching request will be sent to the service tier for obtaining results.
A web service called “Public information management” is designed to support
information searching. Upon receiving the searching request, the web service will read the three
public information tables (i.e. News table, Policy table and “BMP technical knowledge” table)
and fetch the matched information with the searching keyword. The three tables are created to
maintain different categories of public information (see Appendix B, Figure B.2).

66
Figure 4-6: Component diagram of the “Public information center” module
4.5.2 The components of the modules in the BMP planning subsystem
4.5.2.1 Module: Access control
The “Access control” module allows authorized farmers and conservation managers to
enter the BMP planning system. The component diagram of the module is illustrated as Figure 4-
7. In the client tier, a login form is designed to allow a user to input his/her name and password
to enter the subsystem. A “click” event is registered to the form to send a request to the service
tier for user authorization.
In the service tier, the “User authorization” web service is designed to handle the login
request. The web service is implemented in two steps. Firstly, the web service reads the user
table (see Appendix B, Figure B.3) and finds a user record that matches the user name and
password sent from the client to identify the role of the user. Secondly, based on role of the user,
the web service determines the subsystem that the user is allowed to enter. If the user is a farmer
or a conservation manager, the web service will direct him/her to the BMP planning subsystem.
Searching tool
News table
Information table
Public information management
Render
Read
Sent
Client
Service
Data Policy table “BMP technical knowledge” table
Read Read

67
If the user is an administrator, the web service directs the user to the administration subsystem.
This module is shared by both the BMP planning subsystem and the administration subsystem.
Figure 4-7: Component diagram of the “Access control” module
After authorization, the web service will send the user information and direct the user to
the BMP planning subsystem. The user information will be used to control the visibility of fields
on the interactive map within the BMP planning subsystem. In the BMP planning subsystem,
farmers can only view their own farm fields and assign BMPs on their own fields, while
conservation managers can assign BMPs on all the fields in the watershed.
4.5.2.2 Module: Scenario exploration
The “Scenario exploration” module aims to support farmers and conservation managers
to explore “What if” BMP scenarios to understand the economic costs, environmental benefits,
and cost-effectiveness of BMPs. The design of the module requires fulfillment of several task
steps, including BMP scenario creation, BMP scenario development, BMP scenario evaluation,
and BMP scenario comparison.
Login form
User Table
User authorization
Read
Sent
Client
Service
Data
The BMP planning system
Conservation manager and farmer
Administrator
The administration
system
Role

68
Task step: BMP scenario creation
Figure 4-8 shows the component diagram for BMP scenario creation. To support the task,
a scenario creation form is designed. The required information for creating a scenario includes a
scenario name and a scenario description. A “click” event is attached to the scenario creation
form to send information to the service tier for scenario creation.
The “Scenario creation” web service is designed to handle the BMP scenario creation
request. The service writes the scenario information into a scenario table (see Appendix B, Table
B.4). It also updates the system interface using a HTML template for BMP scenario
development, which is the next step.
Figure 4-8: Component diagram for BMP scenario creation
Task step: BMP scenario development
The component diagram for BMP scenario development is shown in Figure 4-9. To
support the scenario development, three components are designed in the client tier: a button
group is used to select BMP types, an interactive map is used to display different BMP layers,
and a BMP assignment table is used to store the status of BMP assignments. The interactive map
Scenario creation form
Scenario table
Scenario creation
Write
Sent
Client
Service
Data
RenderHTML template
for scenario development
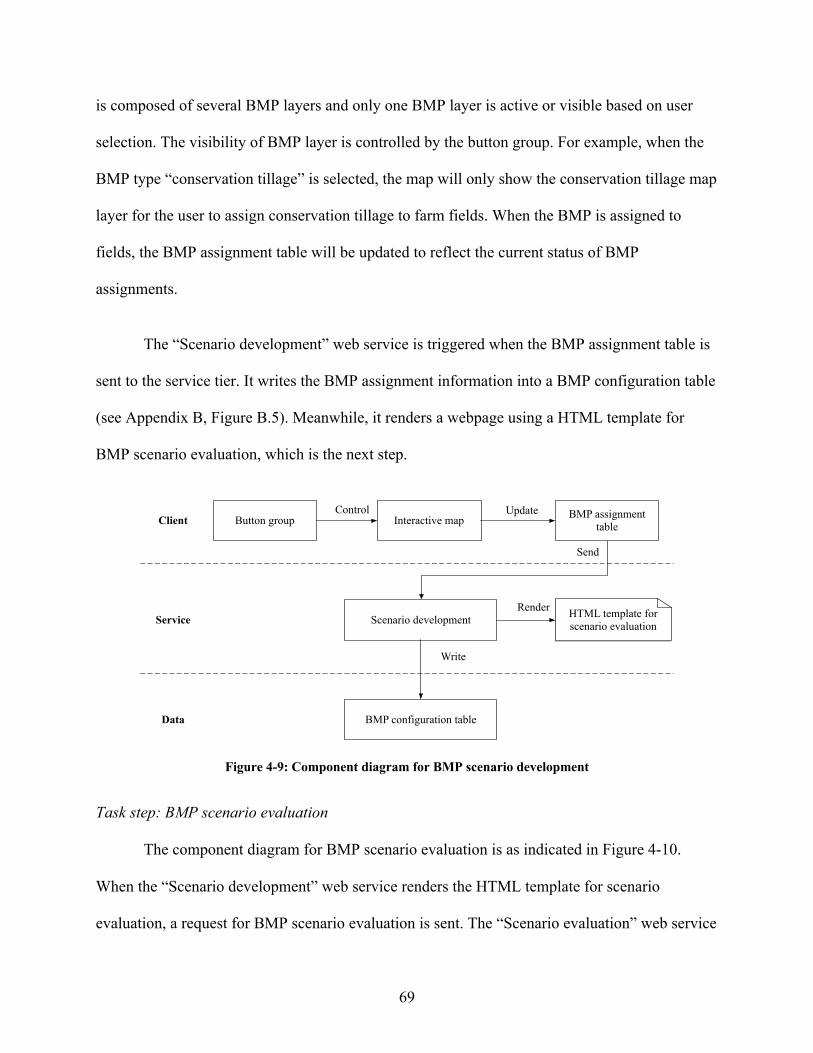
69
is composed of several BMP layers and only one BMP layer is active or visible based on user
selection. The visibility of BMP layer is controlled by the button group. For example, when the
BMP type “conservation tillage” is selected, the map will only show the conservation tillage map
layer for the user to assign conservation tillage to farm fields. When the BMP is assigned to
fields, the BMP assignment table will be updated to reflect the current status of BMP
assignments.
The “Scenario development” web service is triggered when the BMP assignment table is
sent to the service tier. It writes the BMP assignment information into a BMP configuration table
(see Appendix B, Figure B.5). Meanwhile, it renders a webpage using a HTML template for
BMP scenario evaluation, which is the next step.
Figure 4-9: Component diagram for BMP scenario development
Task step: BMP scenario evaluation
The component diagram for BMP scenario evaluation is as indicated in Figure 4-10.
When the “Scenario development” web service renders the HTML template for scenario
evaluation, a request for BMP scenario evaluation is sent. The “Scenario evaluation” web service
Interactive map
BMP configuration table
Scenario development
Write
Send
Client
Service
Data
BMP assignment table
UpdateButton group
Control
HTML template for scenario evaluation
Render

70
is designed to handle the scenario evaluation request. The request is handled in two steps. Firstly,
the “Scenario evaluation” web service calls the integrated economic-hydrologic model to
generate the scenario evaluation results, i.e. economic costs and environmental benefits of the
BMP scenario. The scenario evaluation results are written into a modelling result table (see
Appendix B, Table B.6). Secondly, the “Scenario evaluation” web service reads the modelling
results and generates the scenario evaluation map file.
To support the presentation of the scenario evaluation results, two components are
designed in the client tier. An interactive map is used to render the scenario evaluation map file,
and an evaluation chart is used to visualize the BMP evaluation results within a time frame. The
data for rendering the evaluation chart is read from the modelling result table and sent to the
client by the “Scenario evaluation” web service.
Figure 4-10: Component diagram for BMP scenario evaluation
Figure 4-11 shows the component diagram for exploring the evaluation results. In the
client tier, a button group is used for a user to examine the modelling results by different
variables (e.g. total phosphorous, total nitrogen, sediment, cost and revenue). Clicking a button
Scenario evaluation map file
Scenario evaluation
Write
Sent
Client
Service
Data
BMP assignment table
Modelling result table
Write
Interactive map
Read
Evaluation chart
Render
Integrated economic-hydrologic model
Call
Read Write
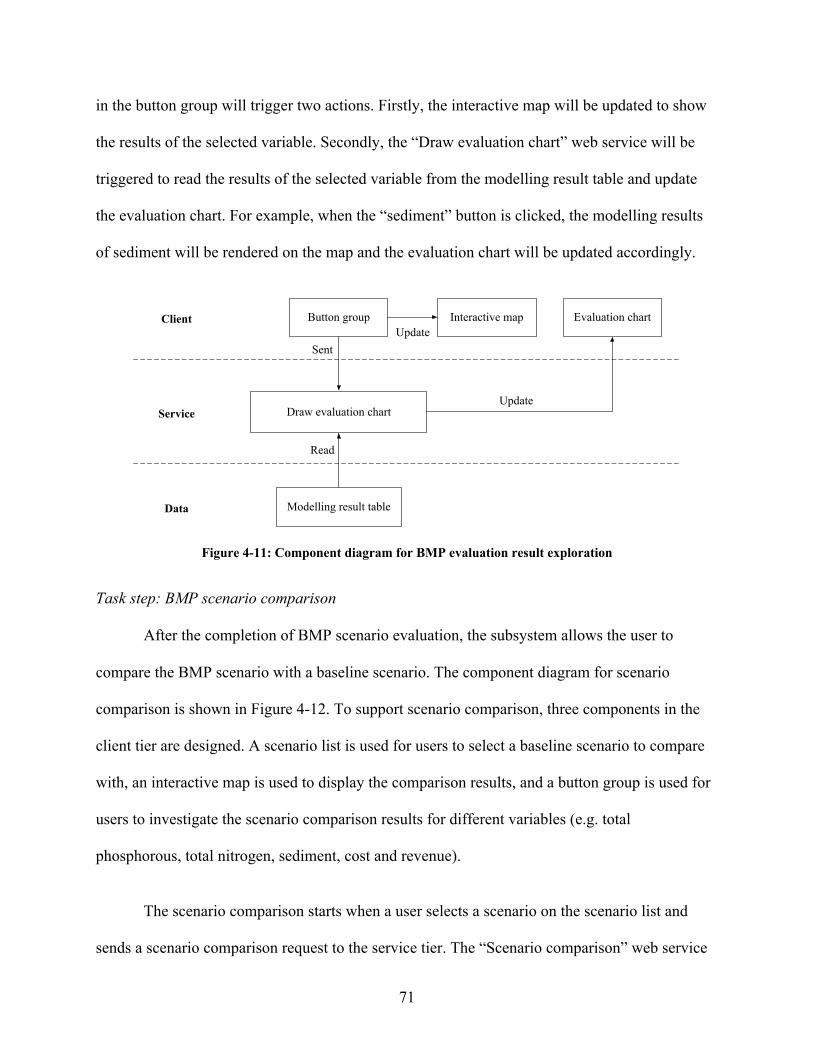
71
in the button group will trigger two actions. Firstly, the interactive map will be updated to show
the results of the selected variable. Secondly, the “Draw evaluation chart” web service will be
triggered to read the results of the selected variable from the modelling result table and update
the evaluation chart. For example, when the “sediment” button is clicked, the modelling results
of sediment will be rendered on the map and the evaluation chart will be updated accordingly.
Figure 4-11: Component diagram for BMP evaluation result exploration
Task step: BMP scenario comparison
After the completion of BMP scenario evaluation, the subsystem allows the user to
compare the BMP scenario with a baseline scenario. The component diagram for scenario
comparison is shown in Figure 4-12. To support scenario comparison, three components in the
client tier are designed. A scenario list is used for users to select a baseline scenario to compare
with, an interactive map is used to display the comparison results, and a button group is used for
users to investigate the scenario comparison results for different variables (e.g. total
phosphorous, total nitrogen, sediment, cost and revenue).
The scenario comparison starts when a user selects a scenario on the scenario list and
sends a scenario comparison request to the service tier. The “Scenario comparison” web service
Draw evaluation chart
Sent
Client
Service
Data
Button group
Modelling result table
Read
Interactive mapUpdate
Evaluation chart
Update

72
is designed to handle the request. To make the comparison, it reads the results of the baseline
scenario, calculates the difference between the two scenarios, and writes the comparison results
into a comparison map file. When the map file is generated, the file will be read by the
interactive map for presentation. The comparison between the “What if” BMP scenario and the
baseline scenario will show the effect of BMPs including BMP costs, benefits, and cost-
effectiveness.
Figure 4-12: Component diagram for BMP scenario comparison
4.5.2.3 Module: Policy/Management
The “Policy/Management” module aims to supports conservation managers to design
BMP policy at a watershed scale. The module achieves this objective in two steps. Firstly, the
module allows scenario optimization to generate the BMP policy/management information.
Secondly, the module provides tools for users to explore the optimization results.
Scenario comparison
Sent
Client
Service
Data
Scenario list
Modelling result table
Read
Interactive map
Comparison map file
Render
Write
Button group
Update

73
Task step: Scenario optimization
Figure 4-13 shows the component diagram for scenario optimization. In the client tier, an
optimization input component is designed for users to submit required parameters for BMP
policy/management design, which include the policy/management type (economic vs.
environmental), the pollutant type, a set of selected farm fields and an optimization constraint
(environmental vs, economic). In addition, an interactive map, an optimization chart, and an
optimization table are designed for the optimization result presentation. The optimization result
shows the configurations of BMPs in farm fields to achieve specific environmental or economic
objectives. The interactive map allows users to examine the BMP configuration in farm fields,
the optimization chart allows users to examine the trade-offs between the economic costs and
environmental benefits, and the optimization table allows users to examine the BMP
configuration by farm field through a table list.
Figure 4-13: Component diagram for scenario optimization
To generate the BMP policy/management information, the parameters for
policy/management design are sent to the server. The optimization request is handled by the
“Scenario optimization” web service in two steps. Firstly, it calls an optimization model to
Optimization result map file
Scenario optimization
Write
Read
Client
Service
Data
Optimization input
Optimization result table
Interactive map
Write
Optimization chart
Sent
Optimization table
An optimization modelCall
Render
Read

74
generate the optimization results and write the results into an optimization result table (see
Appendix B, Figure B.7). Secondly, it reads the optimization results from the table and generates
a map file and at the same time, sends the optimization results to the client to render the
optimization chart and optimization table. This generated map file will be read by the interactive
map to present the policy/management information.
Task step: Exploration of the optimization results
The generated BMP policy/management information can be explored through the
optimization chart. Figure 4-14 shows the component diagram for the information exploration. A
“click” event is attached to several key points on the optimization chart to allow users to
investigate the trade-off between the economic costs and environmental benefits of BMP
configurations in fields. Each key point represents a configuration of BMPs with the
corresponding economic costs and environmental benefits at that point. When the “click” event
is triggered and a key point is selected, the “Draw optimization chart” web service will be
triggered. The service will read the optimization results from the optimization result table and
send it back to the client. The retrieved information will be used to render the interactive map
and the optimization table to reflect the BMP configuration at the selected key point on the chart.
Figure 4-14: Component diagram for optimization result exploration
Draw optimization chart
Read
Client
Service
Data Optimization result table
Interactive map Optimization chart Optimization table
Sent
Render
Button groupControl
Update

75
4.5.2.4 Module: Discussion
The “Discussion” module aims to support two tasks. One is to submit discussion topics.
Another is to submit discussion replies. Figure 4-15 shows the component diagram of the
“Discussion” module. Three components are designed in the client tier: a discussion topic form
is used to support discussion topic submission, a discussion reply form is used to support
discussion reply submission, and a discussion window is used to show discussion threads which
organize discussion topics and replies. To enable user interactions with the components, a
“submission” event is attached to both the discussion topic form and discussion reply form.
When a form is submitted, the request will be sent to the service tier.
Two web services are designed to support the two tasks. The “Discussion topic creation”
web service is designed to write discussion topics into a discussion topic table (see Appendix B,
Figure B.8) and update the topic in the discussion window. The “Discussion thread
management” web service is designed to write discussion replies into the discussion thread table,
update the discussion network table, and update the discussion thread in the discussion window.
The discussion thread table is used to maintain discussion replies under a discussion topic (see
Appendix B, Table B.9). The discussion network table is used to maintain the number of
communications between two users (see Appendix B, Table B.10).

76
Figure 4-15: Component diagram of the “Discussion” module
4.5.2.5 Module: Report
The “Report” module supports farmers and conservation managers to generate HTML
and PDF reports from the “Scenario exploration” and “Policy/Management” results. The
component diagram of the “Report” module is shown in Figure 4-16. The client tier of the
module is composed of a button group which includes two separated buttons. One button is for
HTML report generation and another is for PDF report generation. Both buttons support a
“click” event to send a report generation request to the service tier for report generation.
A “Report generator” web service is designed to handle the report generation request.
The logic of the service is designed in two steps. Firstly, it gathers information for report
generation, which includes BMP configuration information from the BMP configuration table,
and scenario evaluation, comparison, and optimization results. Secondly, the web service
chooses different methods to generate the report. To generate the HTML report, the web service
inserts the collected information into a HTML report template. To generate the PDF report, the
Discussion topic form
Discussion topic table
Discussion topic creation
Write
Submit
Client
Service
Data Discussion thread table
Discussion thread management
Discussion reply form
Submit
Discussion network table
Write Update
Discussion window
Update Update

77
service inserts the collected information into a text report template and then converts the
template into a PDF using the Pandoc – a software to convert files between different formats.
Figure 4-16: Component diagram of the “Report” module
4.5.3 The components of the modules in the administration subsystem
4.5.3.1 Module: User registration
The module of “User registration” supports the system administrator to register new users
to access the BMP planning subsystem. The component diagram of the module is shown in
Figure 4-17. A user registration form is designed in the client tier to allow the administrator to
enter necessary information for the registration, which includes the user’s name, email address,
the role of the user and the user’s farm number. The role of a user can be either farmer or
conservation manager. The user’s farm number is used to link the user with his/her farm fields.
This linkage is important as it controls the availability/visibility of farm fields when a user logs
into the BMP planning subsystem. Farmers can view only their own farm fields, while the
conservation manager can view all the fields in a watershed.
Button group
Report generator
Read
Client
Service
Data BMP configuration table
HTML report template
Insert
Send
CallPandoc
HTMLor

78
Figure 4-17: Component diagram of the “User registration” module
The registration process starts with the registration request sent from the client. A “User
registration” web service handles the request. Upon receiving the user information for
registration, the service will write the user information into the user table (see Appendix B, Table
B.3) and at the same time, prepare modelling files for the user. Those modelling files contain the
integrated economic-hydrologic models and the optimization model for running the modules of
“Scenario exploration” and “Policy/Management”. Once the user registration completes, the
service will send an email to the registered email address to notify the success of registration.
Because the email client is not within the scope of this module design, the component of email
client in the diagram is within a dotted rectangle.
4.5.3.2 Module: System monitoring
The “System monitoring” module provides monitoring information on user activities in
the BMP planning subsystem. The component diagram of the module is shown in Figure 4-18.
To support monitoring tasks, three components are designed in the client tier: two tables to
present scenario information, and a communication network to present the frequency of
User registration form
User Table
User registration
PrepareWrite
Sent
Client
Service
Data Modelling files
Send emailEmail client

79
communications among users. A summary information table is used to present summarized
monitoring information on the usage of the BMP planning subsystem, such as the total number
of scenarios created and completed, and total number of discussion topics and replies submitted.
A personal information table is used to present personal monitoring information, such as the total
number of scenarios created and completed, and the total number of discussion topics and replies
submitted by each user.
The communication network is designed to illustrate the frequency of communications
among users. It is designed as a bi-directed graph. Each node on the graph represents a user (a
farmer or a conservation manager); each connection on the graph that connects two nodes
represents a communication link between the two users. The activeness of a user for
communications is shown by the size of the node – more active users are presented as bigger
nodes.
Figure 4-18: Component diagram of the “System monitoring” module
The information in the tables and the communication network is obtained by two web
services. The “Scenario management” web service is designed to obtain information to render
Summary information table
Scenario table
Scenario management
Read
Client
Service
Data Discussion topic table Discussion reply table
Render
Personal information table Community network
Communication management
Read
Discussion network table
Render

80
the two tables. The information is generated by joining three tables: the scenario table, the
discussion topic table, and the discussion reply table. The “Communication management” web
service is designed to render the communication network from the discussion network table.
4.6 Summary
This chapter presents the system architecture and design of the WebGIS-based decision
support system for facilitating agricultural BMP adoption. To implement the information model
for BMP adoption, the WebGIS-based decision support system is designed into three subsystems
including a public subsystem, a BMP planning subsystem and an administration subsystem.
The public subsystem includes 1) an “Information sharing site” module to share
information on their field characteristics, environmental concerns, and BMP adoption using
annotations and 2) a “Public information center” module to facilitate farmers to obtain
information on agri-environmental policies and BMP related technical knowledge of their
interest using database search functions.
The BMP planning subsystem includes 1) an “Access control” module for restricting the
users to farmers and/or conservation managers, 2) a “Scenario exploration” module with “What
if” BMP scenario creation, scenario development, scenario evaluation, and scenario comparison
functions, 3) a “Policy/Management” module for spatial targeting of BMPs based on either
environmental targets or financial constraints, 4) a “Discussion” module for submitting and
replying to various BMP related topics, and 5) a “Report” module for generating BMP
evaluation and/or policy/management reports in HTML or PDF formats.

81
The administration subsystem includes 1) a “User registration” module that supports the
system administrator to register new users to access the BMP planning subsystem and 2) a
“System monitoring” module that provides information on user activities in the system.

82
Chapter 5 A Prototype of the WebGIS-based Decision Support System for the Gully Creek Watershed
This chapter presents a prototype of the WebGIS-based decision support system for a
representative study watershed. The chapter starts with the introduction of the study area, the
Gully Creek watershed. In the second section, the development of the system prototype is
introduced: the software for the development is introduced, system localization for the Gully
Creek watershed is discussed, and a demonstration of the system prototype is given to illustrate
the functionalities of the WebGIS-based decision support system prototype to support
agricultural BMP adoption in the study area.
5.1 Study area
The 14.3-km2 Gully Creek watershed is a representative watershed of a series of small
watersheds along the shoreline of Lake Huron (Figure 5-1). Similar to other lakeshore streams,
Gully Creek discharges directly into Lake Huron. Due to its potential to influence near shore
water quality, the watershed has been classified as an Environmentally Sensitive Area (Veliz et
al., 2006). The Gully Creek watershed has an undulating terrain, typical of the small lakeshore
watersheds. Land elevations of the watershed range from 176 to 281 m. The average slope in the
watershed is 6% with a minimum of 0% in flat areas and as high as 95% in incised gully areas
(typically greater than 9% in riparian areas). About 70% of the land is agricultural and 25% is
natural vegetation, including trees, shrubs and grasses. This natural vegetation primarily buffers
the main channel. Corn, soybean and winter wheat are the main crops grown in the watershed.
With growing concerns about near-shore water quality of Lake Huron, BMP implementation in
shoreline watersheds has become one of the important measures for mitigating these negative

83
effects. Representative BMPs in the Gully Creek watershed include conservation tillage, nutrient
management, cover crop, and water and sediment control basins (WASCoBs).
Figure 5-1: The Gully Creek Watershed in Southern Ontario, Canada (Shao et al., 2017)

84
5.2 The prototype development for the Gully Creek watershed
5.2.1 Principles for software selection
Based on the design of the WebGIS-based decision support system, the implementation
involves technologies and tools for both client (i.e. client tier) and server (i.e. service and data
tier) development. This section will introduce the principles for software selection to implement
the WebGIS-based decision support system. Key software technologies and their roles for the
implementation are discussed.
The system development utilizes several server-side and client-side software products.
Given that various technological choices are available on the current market for system
development, a careful software selection process is necessary. For this development, the
selection of the software products follows three main principles.
Firstly, the system development uses mainstream software products with better technical
support and broader user communities. When deciding between two competing software
products, the development chooses the product that is intensively evaluated and stably updated.
For example, for the client interface development, a gridding framework is necessary for User
Interface component alignment on the browser. Both Bootstrap and Foundation are popular
gridding frameworks on the current market. Bootstrap is selected for this development as it
provides more themes and has a bigger user community (“Bootstrap vs. Foundation”, 2019).
Secondly, the development and maintenance costs for the software should be low. For
this reason, free and open source software is favored for the development. For example, while
many online mapping software exist, OpenLayers is selected for developing online mapping

85
functionalities (Gratier et al., 2015). Google Map is not chosen as it imposes a limit on the daily
access and a charge for the extra usage (“Pricing for maps, routes, and places”, 2019).
Finally, the system development is open to utilizing third-party software libraries.
However, pre-testing those libraries should be made to ensure that they can work properly as
expected and meet the system development needs.
5.2.2 Software for system prototype development
Client-side software
The client is developed based on three web technologies. Specifically, Hyper Text
Markup Language (HTML) is used to define the arrangement of User Interface (UI) components,
Cascading Style Sheets (CSS) is used to style the appearance of UI components such as their
positions, heights, widths, colors and fonts, and JavaScript is used to define user interactions
with UI components, such as clicking on a button or submitting a form.
Many software and tools from HTML, CSS and JavaScript are utilized for this
development. Bootstrap, a gridding framework, is utilized to support quick prototyping of the
client. With a set of snippets of HTML, CSS and JavaScript, the Bootstrap framework offers
readily available utilities for arranging and styling UI components and defining interactions with
UI components. The Bootstrap framework also supports responsive design which means that the
system client built from it is able to adapt to different screen resolutions.
A JavaScript library, OpenLayers, is used to implement the interactive map and mapping
functionalities. It handles the development of map presentations, controls, and interactions.
GeoJSON is the format that OpenLayers uses to render vector map layers (i.e. field, stream and

86
boundary map layers). Multiple map layers and overlays can be grouped by OpenLayers in an
assigned order. Based on the attributes of a feature, OpenLayers can style features with different
visibilities, colors and levels of transparency. OpenLayers also provides several default map
controls including zoom in/out, pan, direction, rotation, center and full screen view, and some
default map interactions such as select, draw and hover. New controls and interactions can be
customized to specific map interaction tasks. For example, a draw interaction is customized in
this study for selecting multiple map features as a group to assign BMPs to multiple fields.
HighChart, which is a chart visualization tool, is used to present BMP evaluation results
(i.e. phosphorous, nitrogen, sediment, flow, cost, and revenue) and cost-effectiveness trade-off
curve of BMP policies. The chart is interactive and allows users to explore information by
selecting and hovering.
A visualization tool, sigma.js, is used to visualize the communication network for the
administrator to monitor the communications among users of the BMP planning subsystem. This
library can render undirected, unidirectional or bidirectional graph/network. Interaction methods
such as selecting and hovering are supported by sigma.js for users to examine nodes and their
neighbourhoods in the communication network.
Because multiple JavaScript libraries are used for the client development, the study uses a
tool, node.js, to manage JavaScript libraries. This tool helps organize the libraries in a structured
manner in the development environment. It also helps install dependences required by those
libraries. Furthermore, this tool offers version control to support updating libraries.

87
Server-side software
Golang is a programming language used for developing the server. The server handles
multiple tasks including serving static files such as images and HTML templates, routing and
redirecting HTTP requests from the client, processing information, and reading and writing
databases. In recent years the Golang community has developed several libraries and packages to
support the server development and enrich the functionalities of Golang. In this study, a Golang
package, Gomail, is used to enable email communications among stakeholders in both
administration and BMP planning subsystems.
To facilitate user tasks and fulfill their information requirements, three external models or
tools are called from the server. Firstly, an integrated economic-hydrologic model is called from
the server to generate the modelling results for the “What if” BMP scenarios. Secondly, an
optimization model is called from the server to generate the BMP policy/management
information. Finally, a tool “Pandoc” is called from the server to generate PDF reports. Pandoc is
an executable tool for converting a document into other formats.
For data management, the system development uses two databases. The database
PostGRE is used to manage administration-related and scenario-related data, such as user
account and user scenario information. The database SQLite is used to store BMP planning
information such as the economic cost and environmental benefits generated from BMP scenario
evaluation and BMP policy/management information generated from scenario optimization.
Table 5-1 provides a summary of the software for the system development, their
functions, and corresponding system/subsystem and client/server.

88
Table 5-1: Software for system development
Software Functions System/subsystem Client/Server
JavaScript
HTML
Bootstrap
CSS
Node.js
Highcharts
OpenLayers
Sigma.js
User interaction/information processing
UI components arrangement
Gridding framework
UI component style
Library management
Chart visualization
Online mapping library
Network visualization
All
All
All
All
All
Planning subsystem
Public/Planning subsystems
Administration subsystem
Client
Golang
PostGRE
SQLite
Integrated model
Optimization tool
Pandoc
HttpRequest handling, Information
processing
Data management (Administration,
Scenario)
Data management (BMP planning)
BMP evaluation
BMP optimization
PDF generator (external)
All
All
Planning subsystem
Planning subsystem
Planning subsystem
Planning subsystem
Server
5.2.3 System localization for the Gully Creek watershed
The system localization refers to a process wherein the system is customized to a specific
location, which is, in this case, the Gully Creek watershed. Table 5-2 lists the tasks by
subsystems and then by modules required for the system localization for the Gully Creek
watershed.
In the “Information sharing site” module of the public subsystem, the Gully Creek
watershed GIS layer is set up as the interactive map to provide the geospatial context for public
annotating. In “Public information center” module, the public information on agri-environmental
policies and BMP related technical knowledge is collected and uploaded into the database. For

89
the Gully Creek watershed, the collected public information is mostly associated with Ontario
and the Great Lakes region.
Table 5-2: System localization checklist
Subsystems Module Description
The public subsystem Information sharing site Render Gully Creek watershed map to set up geospatial context for annotations
Public information center Maintain agri-environmental policies and BMP related technical knowledge in the public information table
The BMP planning subsystem Scenario exploration 1. Provide the Gully Creek watershed map
2. Prepare the integrated economic-hydrologic model for BMP evaluation in the Gully Creek watershed
Policy/Management 1. Provide the Gully Creek watershed map
2. Prepare the optimization model for spatial targeting of BMPs in the Gully Creek watershed
Report A basic description of the Gully Creek watershed and headings for BMP evaluation results in the “What if” BMP scenarios and BMP spatial targeting in the “Policy/Management” scenarios for the HTML template (for HTML) and the report text template (for PDF)
The administration subsystem User registration Prepare the farm number and field number lookup table to match farmer users with their fields
In the “Scenario exploration” module of the BMP planning subsystem, the Gully Creek
watershed GIS layers is set up as an interactive map for users to develop BMP scenarios and
view the modelling results. The engine of the “Scenario exploration” module is the integrated
hydrologic-economic model for the Gully Creek watershed, which was developed by the Water
Evaluation Group (WEG) at the University of Guelph (Shao et al., 2017). The basic datasets for
the integrated modelling include geospatial data (DEM, land use, soil), climate data, flow and
water quality data, BMPs and agricultural management data, and related agricultural economic

90
data. Within the integrated modelling, the farm economic modelling was calibrated and validated
based on checking magnitudes of model simulation against various sources of literature
including government reports such as Ontario Ministry of Agricultural, Food and Rural Affaires
(OMAFRA) crop budgets. The SWAT hydrologic model was calibrated through adjusting model
parameters to optimize the agreement between water quantity and quality monitoring data and
model simulation results (Shao et al., 2017). The integrated modelling generates information on
economic costs, environmental benefits, and cost-effectiveness of various “What if” BMP
scenarios.
In the “Policy/Management” module of the BMP planning subsystem, an optimization
model is prepared to generate BMP policy/management information based on field-specific BMP
cost and environmental benefit data for the Gully Creek watershed (Shao et al., 2017). The BMP
policy/management information includes the spatial configuration of selected fields and BMP
types, and also economic costs and environmental benefits resulted from the configuration. The
information is displayed in the interactive map and the chart.
In the “Report” module of the BMP planning subsystem, a HTML template and a text file
template for the Gully Creek watershed are prepared for generating HTML and PDF reports
respectively. Both templates include a background chapter about the watershed such as climate,
land use, slope pattern, soil, and BMPs. BMP evaluation results from “What if” BMP scenarios
and “Policy/Management” scenarios are inserted into the templates to generate reports.
For the administration subsystem, a look-up table on farm number and field number is
used for the “User registration” module. A dropdown list is set up based on the lookup table for
the administrator to select the farm number to register a user.

91
5.2.4 A demonstration of the system prototype functionalities
This section provides a demonstration of the system prototype functionalities. The
demonstration illustrates how the information model is fulfilled by system functionalities and
user interactions. The descriptions are provided for each subsystem and then modules within the
subsystem.
5.2.4.1 The public subsystem
The public subsystem is developed to support the communication process of the public
information. A welcome webpage is developed to facilitate users to access the two modules of
the public subsystem (Figure 5-2). The left panel is used to access the information sharing site,
and the right panel is used to access the public information center.
Figure 5-2: The welcome webpage of the public subsystem
Information sharing site Pubic information center

92
Module: Information sharing site
The layout of the information sharing site is shown in Figure 5-3. The map selector above
the interactive map is for users to select the map layer of the Gully Creek watershed. The Gully
Creek watershed is rendered on the interactive map to provide a geospatial context for submitting
and viewing public annotations. The annotation list is created beside the map to display all the
submitted annotations in the Gully Creek watershed. The annotation filter tool is placed above
the list to allow users to filter annotations based on annotation contents or categories.
Figure 5-3: The interface of the information sharing site
To support users to submit public annotations, a web form is implemented for users to
submit information along with annotations (Figure 5-4). The information content includes soil
condition, crop type, environmental concerns, land management practices, structural
management practices, and others. The form also allows users to attach a picture to the
annotation. The form can be extended to include other topics if necessary.

93
Figure 5-4: The form for uploading information on field characteristics and BMP adoption
On the interactive map of the Gully Creek watershed, the submitted annotations are
presented on both the map and the annotation list. The annotations in the list are linked to the
annotation markers on the map through their shared geo-locations. Users can either interact with
the map or use the annotation filter to explore the submitted annotations:
1) The interactive map allows users to select an annotation by hovering over an
annotation marker. When an annotation marker is selected, the marker and its corresponding
annotation on the annotation list will be highlighted to show the information content.
2) The annotation filter above the annotation list allows users to select annotations based
on information contents or categories. For example, users can filter annotations by management
Web form
Click

94
practices. When the filter is applied, all the annotations including the specified practice will be
highlighted on both the map and the list.
Module: Public information center
The public information center provides a searching tool for farmers to use a keyword to
search for agri-environmental policies and BMP related technical knowledge. The searching
results will be presented in a result table that comprises of three columns (Figure 5-5). The left
column displays information on agri-environmental policies, the middle column presents web
contents related to BMPs, and the right column shows BMP technical documents.
Figure 5-5: The interface of the public information center

95
5.2.4.2 The BMP planning subsystem
The BMP planning subsystem is developed based on the information model to support
the communication process of the BMP planning information. The subsystem supports farmers
and conservation managers to evaluate the economic and environmental effects of BMPs
including conservation tillage, cover crop, nutrient management and WASCoBs. The subsystem
also supports conservation managers to design BMP policies subject to environmental targets or
economic constraints.
Module: Access control
To support user access control, a system login page is created for users including farmers
and conservation managers to enter their user name and password for authorization (Figure 5-6).
When the user authentication succeeds, the user will be directed into the BMP planning
subsystem and start to use the “Scenario exploration” module.
Figure 5-6: The login webpage of the BMP planning subsystem
User name
Password

96
Module: “Scenario exploration”
The scenario exploration supports farmers and conservation managers to evaluate
economic and environmental effects of agricultural BMPs. The task starts with creating a “What
if” BMP scenario. A form is implemented for the user to input a scenario name and a scenario
description (Figure 5-7). When the information on scenario name and description is submitted, a
“What if” BMP scenario is created, and an interface will be displayed for scenario development.
Figure 5-7: The form for creating a “What if” BMP scenario
Figure 5-8 shows the WebGIS interface for scenario development. On the interactive
map, the farm field and WASCoB layers are rendered. The field map layer is used to assign three
land management BMPs - conservation tillage, cover crop and nutrient management to fields,
and the WASCoB layer is used to assign the structural BMP, WASCoBs, to specific locations.
To support the BMP assignments, two button groups are provided above the interactive map. The
right button group allows users to select a BMP type, and the left button group provides two
feature selection methods (i.e. individual or multiple selection) for users to assign a BMP to an
individual or multiple fields or locations. The BMP assignment table on the right of the map is
developed to show the current BMP assignments in fields and will be updated when a new
assignment of BMPs is made. The CC, CT and NM in the table represent Cover Crop,
Scenario name
Scenario description

97
Conservation Tillage and Nutrient Management respectively. Below the BMP assignment table
are two buttons. The “Reset” button is created for resetting or clearing the current BMP
assignments. The “Proceed” button is used to save the BMP assignment table to the PostGRE
database and send the BMP assignment information to the integrated economic-hydrologic
modelling for evaluating the developed “What if” BMP scenario.
Figure 5-8: The WebGIS interface for developing a "What if" BMP scenario
The WebGIS interface allows a user to review the assignments of BMPs by selecting the
four BMP types. As shown in Figure 5-9, when a BMP type is selected, the map will be updated
to show BMP assignment fields or locations for the specified BMP type. For conservation tillage,
cover crop and nutrient management, the fields with BMP assignments are highlighted in orange.
For WASCoBs, the locations with WASCoB assignments are highlighted with a light-yellow
border for the dots.

98
Figure 5-9: BMP assignments in the Gully Creek watershed
After scenario development, the integrated economic-hydrologic model will be triggered
to generate economic and hydrologic modelling results in the watershed. The hydrologic
modelling results are generated by the SWAT model, which include phosphorus, nitrogen, and
sediment loadings and flow from each field in the watershed. The economic results are generated
by a farm economic model for three economic variables, i.e. net return, revenue, and production
cost at the field level. When the scenario is evaluated, the economic and hydrologic modelling
results will be written into a SQLite database and at the same time, a GeoJSON file will be
generated for presenting the modelling results on the interactive map. In this system prototype,
the BMP scenario is evaluated for a ten-year time frame from 2002 to 2011 to understand the
long-term effects of BMPs on economic and environmental variables.
Conservation tillage Cover crop
Nutrient management WASCoB

99
Figure 5-10 shows the WebGIS interface for presenting the modelling results for the
“What if” BMP scenario, which involves three economic variables (i.e. net return, revenue and
cost) and four environmental variables (i.e. phosphorous, nitrogen, and sediment loadings and
flow). The presented results include both on-site and off-site results. The on-site results refer to
the results at a field scale; the off-site results refer to the accumulative results at the watershed
outlet. To support information exploration, a button group above the map allows users to check
out the results for a specific environmental or economic variable. For example, when the button
“Phosphorus” is clicked as shown in the Figure 5-10, the map is updated with the “total
phosphorus” results. Because the evaluation period is ten years, the value of total phosphorus on
each field is an averaged value for the ten years. The total phosphorus at the off-site level
represents the result at the outlet of the watershed.
Figure 5-10: The WebGIS interface for scenario evaluation result presentation and exploration

100
The evaluation chart is developed to present the scenario results of a specific variable
over a time period at on-site and off-site levels. When a field on the interactive map is selected,
the evaluation chart shows the on-site results of the selected variable (e.g. total phosphorus) for
that field. When all the fields on the map are deselected, the chart will render the off-site results
of the selected variable (e.g. total phosphorus) at the watershed outlet. For example, the
evaluation chart in Figure 5-10 shows the off-site results of total phosphorus over a ten-year time
frame from 2002 to 2011. The curved line in the chart indicates the results of total phosphorus in
each year, and the straight line shows the averaged result of total phosphorus over the years.
After scenario evaluation, the module supports comparing the BMP scenario with a
baseline scenario. Figure 5-11 shows the WebGIS interface for scenario comparison. A scenario
list is provided for user to select a baseline scenario for the comparison, which can be either
historical or conventional scenario. When a baseline scenario from the scenario list is chosen, the
comparison results will be rendered on the interactive map.

101
Figure 5-11: The WebGIS interface for scenario comparison
Above the interactive map, a button group is provided for users to examine the scenario
comparison results for specific variables and the cost-effectiveness of BMPs. The comparison
results include three groups: economic costs, environmental benefits, and cost effectiveness of
BMPs. The economic costs and environmental benefits are estimated through comparing the
evaluation results of the two scenarios (i.e. the “What if” and a baseline scenario). The economic
results include the differences of the three economic variables, i.e. cost, revenue and net return,
and reflect the economic effects of BMPs in the fields. The environmental results include the
differences of the four environmental variables i.e. phosphorus, nitrogen, and sediment loadings
and flow, and reflect the environmental effects of BMPs. Figure 5-12 shows the comparison

102
results of the net return in the fields between the “What if” and the baseline scenario. The
negative net return implies the BMP costs incurred by implementing the BMPs. The positive net
return implies economic gains from implementing BMPs (e.g. cost saving from fertilization
management). Similarly, Figure 5-13 shows the comparison results of total phosphorus in the
fields between the “What if” and the baseline scenarios. The negative number indicates the
phosphorus reduction from implementing the BMPs.
Figure 5-12: Differences in net return between the “What if” and the baseline scenario

103
Figure 5-13: Differences in total phosphorus between the "What if" and the baseline scenario
The integrated result is the combination of both economic and environmental results,
which represents the cost-effectiveness of BMPs. The cost effectiveness for phosphorus,
nitrogen, and sediment loadings and flow are estimated by the differences of the specific
environmental variable divided by the differences of the net returns between the “What if” and
the baseline scenario. The BMP cost effectiveness is represented as the environmental changes
for $1,000 BMP cost. The units for BMP cost-effectiveness are mm/$1,000 for flow, ton/$1,000
for sediment yield, and kg/$1,000 for TN and TP yields, which indicate the water
quantity/quality effects per $1,000 BMP costs (Yang et al. 2013).
Figure 5-14 shows the cost-effectiveness of BMPs on the total phosphorus reduction. The
pattern of cost-effectiveness should be interpreted with caution because the cost effectiveness
results may have negative or positive signs due to various combinations of water quantity/quality

104
effects and BMP costs (Table 5-3). In typical cases, environmental benefits (baseline – “What
if”) are achieved with economic loss (negative net return), which lead to negative cost-
effectiveness (Situation 1). The higher absolute value of cost-effectives indicates more cost-
effectiveness. In some cases, environmental benefits could be achieved with economic gains (net
return increase), for example, when nutrient management reduces the cost on fertilizer (Situation
2). However, due to complex nutrient cycling and hydrologic processes and landscape
conditions, BMP implementation could also lead to environmental harms (Situation 3 and
Situation 4). Those cases need to be specifically analyzed (Yang et al. 2013).
Figure 5-14: Cost-effectiveness of BMPs on total phosphorus reduction

105
Table 5-3: Various combinations of water quantity/quality effects and BMP costs (Yang et al. 2013)
Situation Environmental benefits Economic costs Cost-effectiveness
(integrated)
1 Water/pollutant reduction (+) Net return reduction (-) Negative (-)
2 Water/pollutant reduction (+) Net return increase (+) Positive (+)
3 Water/pollutant increase (-) Net return reduction (-) Positive (+)
4 Water/pollutant increase (-) Net return increase (+) Negative (-)
In the WebGIS interface for scenario comparison, there is a button group below the
scenario list. The “Optimization” button allows users to enter the “Policy/Management” module,
and the “Report” button allows users to generate reports based on the scenario comparison
results.
Module: Policy/Management
The “Policy/Management” module supports users to design two types of policies: the
environmental policy/management, which minimizes economic costs subject to environmental
targets and the economic policy/management, which maximizes environmental benefits subject
to financial constraints.
The WebGIS interface is developed to allow users to set parameters for running the
optimization model for the BMP policy/management scenario (Figure 5-15). The required
parameters include the policy/management type, the fields for optimization, the pollution type,
and the BMP policy/management constraint. For an environmental policy, this constraint is a
range of environmental benefit targets (e.g. phosphorus reduction in kg/year). For an economic
policy/management, this constraint is a range of the BMP costs in dollar/year. The
policy/management type, the farm fields for optimization, and the pollution type are prerequisites
to determine the BMP policy/management constraint.

106
To support users to set the parameters, the WebGIS interface provides button groups,
buttons and an input box. Above the interactive map, there are three button groups and a button.
The left button group allows users to select a policy/management type – “Env” for the
environmental policy/management and “Eco” for the economic policy/management, the middle
button group allows two field selection methods for users to specify the farm fields in which the
BMP policy/management will be applied (“S” for a single field and “M” for multiple fields), and
the right button group allows users to select a pollutant type (P – Phosphorus, N – Nitrogen, S –
Sediment, F – Flow), indicating which pollutant the policy/management is applicable to. The red
button “RS” beside the right button group is used to reset the policy/management type and field
selection.
Figure 5-15: The WebGIS interface for the “Policy/Management” module
After specifying the policy/management type, selected fields (multiple fields/locations or
all crop fields/locations) and the pollution type (such as phosphorus), the user can obtain a
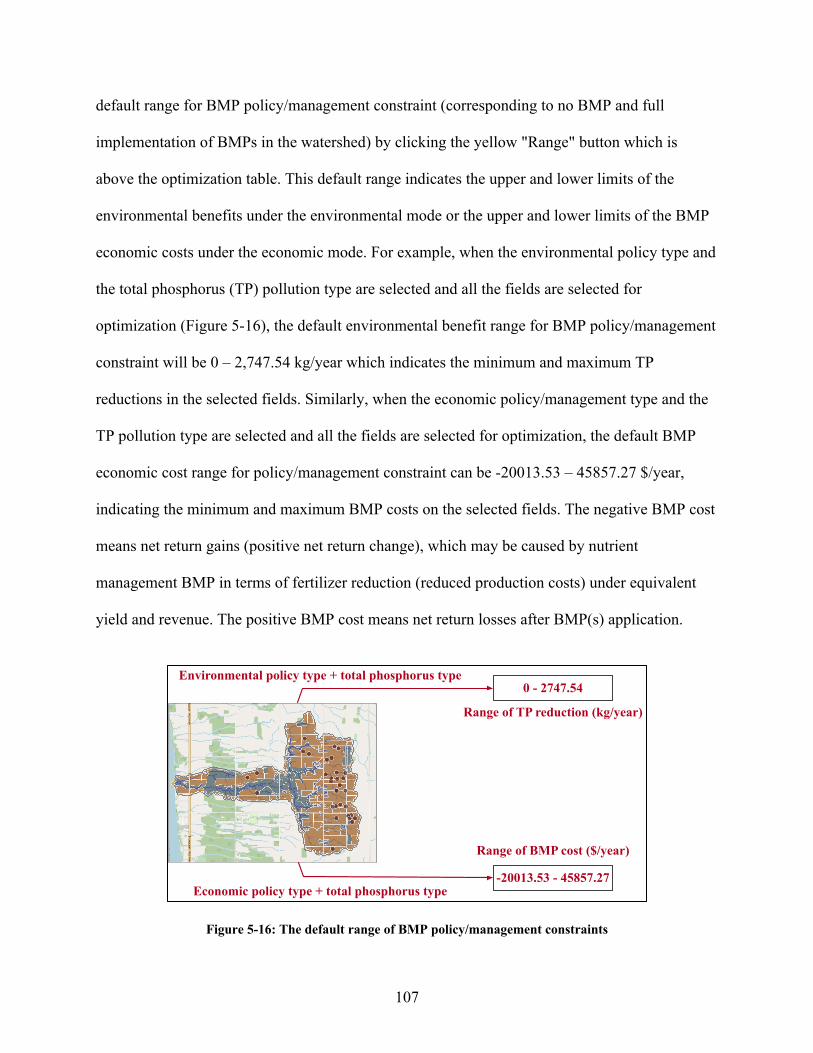
107
default range for BMP policy/management constraint (corresponding to no BMP and full
implementation of BMPs in the watershed) by clicking the yellow "Range" button which is
above the optimization table. This default range indicates the upper and lower limits of the
environmental benefits under the environmental mode or the upper and lower limits of the BMP
economic costs under the economic mode. For example, when the environmental policy type and
the total phosphorus (TP) pollution type are selected and all the fields are selected for
optimization (Figure 5-16), the default environmental benefit range for BMP policy/management
constraint will be 0 – 2,747.54 kg/year which indicates the minimum and maximum TP
reductions in the selected fields. Similarly, when the economic policy/management type and the
TP pollution type are selected and all the fields are selected for optimization, the default BMP
economic cost range for policy/management constraint can be -20013.53 – 45857.27 $/year,
indicating the minimum and maximum BMP costs on the selected fields. The negative BMP cost
means net return gains (positive net return change), which may be caused by nutrient
management BMP in terms of fertilizer reduction (reduced production costs) under equivalent
yield and revenue. The positive BMP cost means net return losses after BMP(s) application.
Figure 5-16: The default range of BMP policy/management constraints
0 - 2747.54
-20013.53 - 45857.27
Environmental policy type + total phosphorus type
Economic policy type + total phosphorus type
Range of TP reduction (kg/year)
Range of BMP cost ($/year)

108
The default BMP policy/management constraint is displayed in the input box above the
optimization table and on the left of the “Range” button. Based on the default BMP
policy/management constraint, the user can revise the default range to specify a new BMP
policy/management constraint, such as the range of environmental targets (pollutant reductions)
or the range of financial constraints (BMP costs). After the setup of the BMP policy/management
constraint, the user can click the “Opt” button next to the “Range” button to run the optimization
model to obtain BMP policy/management optimization results.
Figure 5-17 and Figure 5-18 show the interfaces for presenting and exploring the
environmental and economic policy/management information. The environmental
policy/management information is generated using the parameters in Table 5-4.
Table 5-4: The parameters for producing the BMP policy/management information
Policy/management
type
Selected fields Pollutant type BMP policy/management constraint
Environmental See Figure 17 Phosphorous 2,200.00 – 2,747.54 kg/year phosphorus
reduction (indicating a 30% - 37%
phosphorus reduction - 37% is the
percentage when the maximum reduction
2,747.54 kg/year phosphorus is obtained)
Economic See Figure 18 Phosphorous -20,013.53 – 40,000.00/year BMP cost
The layouts of two interfaces are identical. The BMP policy/management information is
visualized using three information presentation options. The interactive map is implemented to
show BMP combinations in each farm field. Different color indicates different combinations of
BMPs. The information on field-specific BMP combinations is also presented in the
policy/management table. Each row of the table indicates how BMPs are assigned to a specific
field (“Y” means assigned and “N” means not assigned). Moreover, a line chart is used to present

109
the trade-off relationship between the economic costs and environmental benefits within the
range of constraints. In both Figures, i.e. Figure 5-17 and Figure 5-18, two zoomed-in
screenshots are provided to facilitate the examination of the chart. The Y-axis of the chart
indicates the environmental benefits and X-axis indicates the economic costs. Ten points on the
curve represent ten sets of BMP configurations on the selected fields with the corresponding
economic costs and environmental benefits. When clicking a point on the chart, the
corresponding BMP configuration will be rendered on the map and the policy/management table.
Figure 5-17: The interface for exploring environmental policy/management information
Optimization table
Interactive map
Optimization chart
WASCoB

110
Figure 5-18: The interface for exploring economic policy/management information
Module: Discussions between farmers and conservation managers
The interface for supporting communications between farmers and conservation
managers is shown in Figure 5-19. The discussion topic form is provided to allow farmers to
submit various discussion topics. When a topic is created, the topic is appended to the discussion
topic list. The topics on the list are clickable to expand the discussion thread of the topic in a
discussion window. The discussion window enables users to provide replies or comments to the
topic. Conservation managers can access and reply to all the discussion topics created by
farmers. An email function is integrated with the discussion function. When farmers and
conservation managers submit discussion topics or post on the discussion thread, emails will be
sent to them for notification.
Optimization table
Interactive map
Optimization chart
WASCoB

111
Figure 5-19: The interface for supporting communications between farmers and conservation managers
Module: Scenario report
To facilitate communicating the “Scenario exploration” scenario and
“Policy/Management” scenario results, both HTML and PDF reports can be generated from the
system (Figure 5-20). The HTML report can be generated after running the scenario and it allows
for a quick review of the scenario results. Because the HTML report is essentially a webpage, all
the components on the HTML report are interactive. For example, users can click on buttons on
the HTML report to check the BMP evaluation results for different variables on the map.
The PDF report shares the same report content with the HTML report. It can be
downloaded, printed, and saved as a file. A template is used to align information contents in the
PDF report.
Discussion topic
Discussion topic list
Discussion thread

112
Figure 5-20: Scenario reports in HTML(Left) and PDF(Right) formats
To enable the report generation, the system provides two separated buttons in both
“Scenario exploration” and “Policy/Management” modules. One is for HTML report generation,
and the other is for PDF report generation. When the button is clicked, the report will be
generated, and the new report will be displayed in a new browser tab.
5.2.4.3 The administration subsystem
The administration subsystem shares the same login page with the BMP planning
subsystem (Figure 5-6). It requires system administrator’s user name and password for the login.
When the user authorization completes, a webpage will be displayed for the administrator to
view the monitoring information (Figure 5-21). On the up-right corner of the page, three tabs are
provided for the system administrator to navigate different system modules and functions: the
HTML PDF

113
“System” tab to view the monitoring information in tables, the “Network” tab to view the
monitoring information through the communication network, and the “Registration” tab to
register new users to use the BMP planning subsystem.
Figure 5-21: The webpage after login to the administration subsystem
Module: System usage monitoring
The administration subsystem provides two tables and a communication network to
support the system administrator to monitor the use of the BMP planning subsystem by farmers
and conservation managers. The tables include a usage summary information table and a
personal usage information table (Figure 5-22). The usage summary information table shows the
summarized usage information of the system, including the total number of users, scenarios, and
discussion requests that users have created, while the personal usage information table displays

114
usage information by individuals, including user names, the number of scenarios and discussions
created by each user, and scenario completion status that is indicated by the rate of completion.
Figure 5-22: Tables for displaying the usage information of the BMP planning subsystem
The communication network visualizes communication relationships among farmers and
conservation managers based on their discussions in the BMP planning subsystem (Figure 5-23).
On the communication network, each node represents a user (farmer/conservation manager), and
the diameter of a node reflects the centrality closeness of that user, indicating the frequency the
user communicates with others. A connection on the network represents an existing connection
between two users. Links have two colors given that each user has one of the two roles, e.g
farmer or conservation manager. Links between farmers are colored in yellow and those between
conservation managers and farmers are colored in red. A user list is also provided on the left-
hand side of the communication network to show all the farmers and conservation managers in
the network.
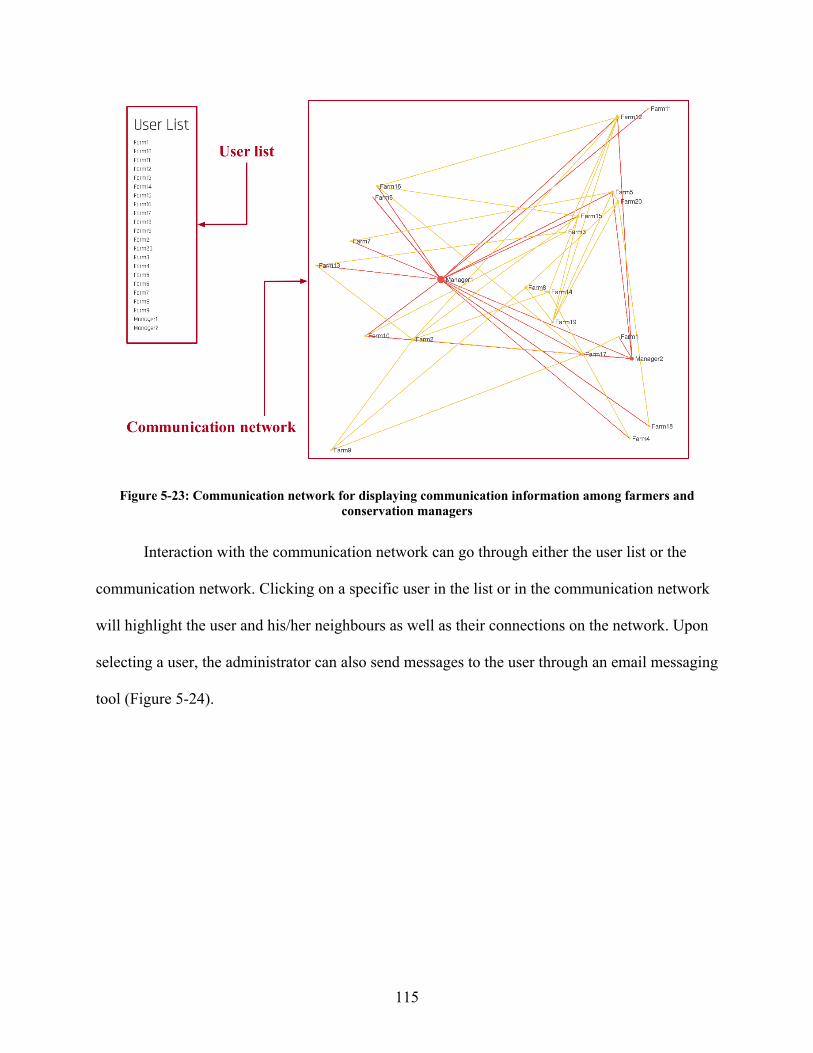
115
Figure 5-23: Communication network for displaying communication information among farmers and conservation managers
Interaction with the communication network can go through either the user list or the
communication network. Clicking on a specific user in the list or in the communication network
will highlight the user and his/her neighbours as well as their connections on the network. Upon
selecting a user, the administrator can also send messages to the user through an email messaging
tool (Figure 5-24).

116
Figure 5-24: Interaction within the communication network
Module: User registration
A registration form is provided for the system administrator to register new users. The
required information for registration includes username, email address, role and farm number
(Figure 5-25). The role of the user can be either a farmer or a conservation manager. The farm
number is used to link a farm to its fields to control the user access to the fields within the farm.
The farm number for the conservation managers is 0 by default so they have access to all fields
in a watershed. Because the user registration involves preparing a copy of all data and models in
the BMP planning subsystem for the created user, the registration takes a few minutes. Once the
registration is completed, an email will be sent to the user to notify the compeletion of
registration. A self-assigned username and an encrypted password is provided through the email
and only known to the registered user.

117
Figure 5-25: The user registration form
5.3 Summary
This chapter introduces a prototype of the WebGIS-based decision support system for the
Gully Creek watershed. The chapter starts with introducing the study area. The “System
localization” section discusses how the WebGIS-based decision support system is adapted to the
Gully Creek watershed. The localization procedure shows the implementation of the system
design to a specific watershed. After that, each subsystem and its modules are demonstrated from
three aspects: user interface, user interactions and information presentations. The demonstration
of the user interface focuses on the layout of the interface, the demonstration of user interactions
shows the actions for facilitating user tasks within the system, and the demonstration of
information presentations emphasizes the methods for information presentation and interactions
with the information content. The system demonstration illustrates the fulfillment of information
needs of stakeholders and the processes of information communications based on GIS, models
and ICTs.

118
Chapter 6 Evaluating the WebGIS-Based Decision Support System
This chapter presents the evaluation of the WebGIS-based decision support system
prototype for the Gully Creek watershed. The content of this chapter is organized into three
sections. The first section defines usability evaluation. The second section introduces evaluation
methods, including both evaluation by direct use and evaluation during demonstration. In the
third section, evaluation results are presented.
6.1 Usability evaluation
6.1.1 Defining system usability
The term “usability” has been widely used in the studies of human-computer interaction
(HCI) and graphical interactive interface to describe and measure the performance of a system
and how “usable” it is likely to be in a specified context of use (Fischer, 2001). However,
challenges exist in defining the term “usability” for its complexity and specific context. As
indicated by Issa & Isaias (2015), “usability is not determined by just one or two constituents but
is influenced by a number of factors which interact with one another in sometimes complex
ways”. The usability, when being investigated, is factually a collective outcome of several
variables of a system including system function, characteristics of users and tasks, and their
inter-relationships (Fischer, 2001).
The two widely accepted definitions of usability are from ISO 9241-11: “the extent to
which a product can be used by specified users to achieve specific goals with effectiveness,
efficiency and satisfaction in a specified context of use” and ISO 9126-1 : “the capability of the
software product to be understood, learned, operated, attractive to the user, and compliant to

119
standards/guidelines, when used under specific conditions”. Based on the HCI and software
engineering perspectives, both definitions outline the key elements of the usability as
effectiveness, learnability, efficiency and satisfaction. The effectiveness measures if the system
could support users to successfully achieve their objectives in compliance with what the system
is designed for, the learnability indicates to what extent the system is easy for user to become
familiar with and know how to use it on subsequent visits, and the efficiency and satisfaction
denote the time spent to complete certain tasks and whether users enjoy interacting with the
system during the process.
6.1.2 Usability evaluation approaches
Evaluating the usability of a system has become a critical step for releasing the system
for practical use. The approaches for usability evaluation can be classified into two categories,
namely the quantitative approach and the qualitative approach (Grinnell, 2001). A major
difference between the two approaches lies in the data that they use for the evaluation.
Specifically, the quantitative approach relies on the collection and analysis of numerical data,
whereas the qualitative approach relies on the interpretation of descriptive text/narrative
(Grinnell, 2001). The data for evaluation can be collected from different sources. The
quantitative numerical data is commonly collected from survey or questionnaire; the qualitative
descriptive data can be collected through participant observation, open-ended questions,
interview, or focus group (Garbarino & Holland, 2009). The focus group is a form of group
conversations where key users are invited to discuss their opinions towards a central topic
together (Mazza & A. Berre, 2007).

120
Both quantitative method and qualitative approaches have specific advantages. The
quantitative approach, due to its numeric basis, can apply statistical techniques to analyze
numerical data and reveal the correlations between evaluation measures and evaluation
objectives. Hence, the quantitative approach has been widely used to address questions like to
“what” extent a factor can lead to a certain result (Barkmann et al., 2009). Compared to the
quantitative approach, the qualitative approach seeks to explain the “why” and “how” behind the
“what” (Kaplan & Maxwell, 2006). Through interpreting the text/narrative, the qualitative
approach provides in-depth descriptive information about evaluators’ feelings, experiences and
perspectives regarding the system use (Fossey et al., 2002). Instead of building direct links
between evaluation measures with evaluation objectives, the qualitative approach explains
behaviours and outcomes in the complex social-technological context.
In this study, the qualitative approach was selected for evaluating the WebGIS-based
decision support system. The selection was based on two considerations. Firstly, the evaluation
mainly focuses on the process of system use by evaluators. The qualitative approach helps to
probe information to explain how the WebGIS-based decision support system fulfills users’ task
and information requirements. Secondly, the implemented system is a prototype. The qualitative
approach can provide a great opportunity to collect suggestions on further improving the system.
As indicated by Kaplan & Maxwell (2006), using qualitative method can help in identifying
potential problems, thereby providing opportunities to improve the system as it develops.
However, it is worth noting that the qualitative approach for evaluation has its limitations. The
qualitative approach is meant to study a specific issue (i.e. BMP adoption) in a particular context
(i.e. the Gully Creek watershed). The results may be not generalizable to other areas with
different geographical conditions and social, cultural and economic contexts (Leung, 2015).

121
6.2 Evaluating the WebGIS-based decision support system using a qualitative approach
Evaluating the WebGIS-based decision support system involved two steps. Firstly,
usability evaluation measures were identified. Secondly, usability evaluation methods were
introduced to illustrate how the evaluation was conducted and data were collected.
6.2.1 Usability evaluation measures
Nielsen’s heuristics presents a classical list of usability principles (Nielsen, 1990). It
classified common design issues into ten categories, including visibility of system status, match
between system and the real world, user control and freedom, consistency and standards, error
prevention, recognition rather than recall, flexibility and efficiency of use, aesthetic and
minimalist design, help users recognize, diagnose and recover from errors, help and
documentation. By far, Nielsen’s heuristics have been referenced by many studies (Mankoff, et
al., 2003; Pinelle, Wong & Stach, 2008). However, due to different characteristics of systems,
the list has to be extended or modified to meet specific usability evaluation objectives. For
example, Mankoff et al. (2003) developed a modified set of principles for evaluating ambient
displays, which are abstract and aesthetic peripheral displays portraying non-critical information
on the periphery of a user’s attention. They referred to Neilsen’s heuristics but eliminated the
non-applicable ones due to the passive nature of the displays. Moreover, Pinelle, Wong & Stach
(2008) developed a set of principles for evaluating the video game design. They stated that while
the Nielsen’s heuristics cover generic design issues, they are not specific enough to address some
important issues in game video design, such as “using proper camera angles when displaying the
game world or providing intuitive control mappings”.

122
In this study, the usability evaluation measures were developed based on the updated
Information System Success Model (Figure 6-1) by DeLone and Mclean (2003), which was
originated from Nielsen’s heuristics (Nielsen, 1990). The Information System Success Model
provided a framework to understand different aspects of a “successful” information system,
including not only the usability principles that focus on system interface but also factors related
to information and services. The model also offered a mechanism for organizing the evaluation
measures. According to the model, evaluation measures were organized into six categories, i.e.
system quality, information quality, service quality, satisfaction, intention to use, and impact
(Table 6-1).
The system quality characterizes the technical success of the system. Evaluation
measures in this category include user interface, task completeness, and learnability. User
interface determines how users communicate with system information, functions, and modules.
A good user interface should be clear, simple, direct, easy to navigate, and enable users to fully
control their actions (Nielsen, 1990). Task completeness means that the system can successfully
complete required user tasks to fulfill their objectives (Hamilton & Chervany, 1981). Lastly,
learnability indicates the easiness with which the system can be picked up and understood by
users.

123
Figure 6-1: The updated Information System Success Model (DeLone & Mclean, 2003)
The information quality describes the success of information in supporting BMP
adoption. It can be measured by comprehensiveness, accuracy, clarity, and interactivity. The
comprehensiveness means that the information provided to users should be complete and
adequate; the accuracy means that the information should be correct; the clarity means that the
information should be clear in meaning; and the interactivity means that, for complex
information content, the presentation methods should enable users to explore information in
various dimensions and in multiple ways.
The service quality characterizes the success of web services. This category includes two
evaluation measures: service responsiveness and support. The service responsiveness describes
the timeliness of web services responding to the service requests. For web-based systems, the
service responsiveness is significantly related to the user experience with the system (Palmer,
2002). The support refers to the availability of supporting materials for users to complete their
tasks.

124
Table 6-1: Measures for evaluating the WebGIS-based decision support system
Category Measures Description
System quality User interface The system interface is simple, clear, easy to
navigate, and enables users to fully control
their actions.
Task completeness The system can successfully complete
required user tasks for BMP adoption.
Learnability The system is easy to be picked up and
understood by users.
Information quality Comprehensiveness Information provided to users is complete
and adequate.
Accuracy Information is correct.
Clarity Information is clear in meaning.
Interactivity Information is interactive for users to explore
different dimensions of information.
Service quality Responsiveness The system responds to user’ service requests
in a timely manner.
Support The system provides supporting materials to
facilitate and guide users to complete tasks.
User satisfaction Satisfaction Users are overall satisfied with the system.
Intention to use Intention to use Users are willing to adopt the system in their
future work.
Impact Awareness The system increases user’ environmental
awareness.
Knowledge The system improves user’ knowledge of
BMPs.
The satisfaction describes the degree of user satisfaction based on their perceived system,
information, and service quality.
The intention to use describes the willingness of users to adopt the system in the future.
The intention to use and user satisfaction are closely interrelated. When users have satisfied
experience with using the system, their intention to use the system will be strengthened. They are

125
more likely to re-use the system and recommend the system to others. On the other hand,
dissatisfaction weakens their intention to use the system and reduces the usage of the system.
The impact measures perceived usefulness and challenges of the system for supporting
the adoption of BMPs. The positive impact will reinforce subsequent intention to use and user
satisfaction, while the negative impact would cause a decreased use of the system and even a
discontinuance of the system use in the worst case. Evaluation measures in this category include
awareness and knowledge. Awareness means that the system can improve user’s environmental
awareness, and knowledge means that the system is able to increase user’s knowledge of BMPs
and support their decisions on BMP adoption.
6.2.2 Usability evaluation methods
In this study, usability evaluation uses two complementary methods: evaluation by direct
use and evaluation during demonstration (Figure 6-2). Evaluation by direct use is implemented
by inviting a panel of usability experts to evaluate the system. The main focus of this method is
to identify system design flaws subject to a set of usability principles such as error prevention
and simplicity. According to Jeffries, & Desurvire (1992), evaluation by direct use can work
very well to generate useful results from only 3-4 evaluators (Jeffries, et al., 1991; Togazzini,
1992). However, evaluation by direct use has its limitations. Firstly, evaluation by direct use
involves usability experts who may lack practical domain knowledge (Chin, Diehl, & Norman,
1988; Nielsen,1993; Holzinger, 2005). The usability experts mostly focus on interface
interactivity but may not emphasize on examining realistic user scenarios. For example, a
usability expert may not select those farm fields with higher erosion potential for conservation
tillage BMP. Secondly, evaluation by direct use has no built-in mechanism to ensure functions in

126
the system are thoroughly explored. As Tyllinen, et al. (2016) mentioned, evaluation by direct
use may be not able to identify missing functionalities.
To address the aforementioned challenges, this study also used evaluation during
demonstration. Complementary to evaluation by direct use, evaluation during demonstration has
several advantages. In addition to identifying the violation of usability principles, evaluation
during demonstration allows for discovering missing functionalities of the user scenario
(Tyllinen, et al., 2016). This is realized by broadening the scope of evaluator engagement.
Evaluation during demonstration allows novice users or usability non-experts to be engaged
within the evaluate process, especially the ones with practical domain knowledge. As noted by
Tyllinen, et al. (2016), demonstrations could focus evaluators on the tasks and information
without distracting or burdening them. Demonstrations allow usability non-experts to evaluate a
wide range of use scenarios and functionalities. The results from both evaluation by direct use
and evaluation during demonstration are collected and coded into the evaluation measures to
provide an overall assessment of system usability.

127
Figure 6-2: Evaluation by direct use and evaluation during demonstration
6.2.2.1 Conducting evaluation by direct use
For evaluation by direct use, four usability experts were invited: two of them were from
University IT department and the other two were research colleagues at the University of
Guelph. The two IT experts had been managing university-websites deployment for years and
had adequate experience in the domain of user interface design. The two research colleagues
were from research domains of integrated GIS and watershed modelling, and computer science.
The four experts were invited to evaluate the system using their personal computers.
These experts were asked to complete key user tasks in the subsystems as shown in Table 6-2. A
system user manual was provided to the evaluators before the evaluation and no other assistance
such as training and chauffeurs were provided. The system user manual provided a reference to
the system functions that describes the objectives and steps of each user task.
Evaluation by direct use Evaluation during demonstration
Usability principles User task and information
Usability non-expertUsability expert
Aggregated result

128
Table 6-2: Key user tasks for evaluation by direct use
Subsystem Tasks
The public subsystem Submit and load public annotations at the information sharing site
Check BMP related knowledge and local agri-environmental policies in the
public information center
The BMP planning subsystem Log into the BMP planning subsystem
Create a scenario
Develop a scenario
Evaluate a scenario
Compare the scenario with a baseline scenario
Optimize a scenario
Initiate a discussion thread by submitting a discussion topic
Submit a discussion reply on a discussion thread
Generate a HMML and PDF report
The administration subsystem Log into the administration subsystem
Check information of system usage
Explore the communication network
Register a new user account
Send a message through the communication network
After the evaluations were completed, individual interviews were conducted to collect
feedbacks from each evaluator. Based on the developed evaluation measures, their feedback was
compiled into scripts and coded into the evaluation measures (Appendix E, Table E.1). Given
that the evaluators were all with a strong technical background, the evaluation results, as
expected, were mostly related to technical aspects of the system.
6.2.2.2 Conducting evaluation during demonstration
The evaluation during demonstration was carried out in the forms of research group
discussion and program panel review. The research group discussion involved three researchers
with different areas of expertise. One researcher was from the domain of agricultural economics

129
and had extensive managerial experiences on agri-environmental programs, one researcher was
from a multi-disciplinary field of GIS and watershed analysis and developed a desktop-based
GIS system named “WhiteBox”, and one researcher was from the domain of GIS and conducted
research on a variety of GIS research topics, such as services, data modelling, visualization,
collaborative decision-making and environmental management.
The program panel review involved one system demonstration for two hours to 8 staff
members in the Ausable Bayfield Conservation Authority (ABCA) and one system
demonstration for one and a half hour to 25 people including researchers, IT staff, and agri-
environmental program managers from the Ontario Ministry of Agriculture, Food and Rural
Affaires (OMAFRA). As suggested by staff from ABCA and OMAFRA, local farmers in the
Gully Creek watershed were not included in the evaluation due to the sensitiveness in
communicating with farmers by people outside conservation authority and government. Several
staff members from ABCA and OMAFRA had experience in farming operations and understood
the BMP adoption process well. Furthermore, they indicated that the system would be preferably
used by conservation authority and/or OMAFRA staff to evaluate BMP scenarios together with
farmers when visiting them to discuss BMP adoption. Therefore, they can serve as surrogates to
evaluate the system.
Before each demonstration, a brief presentation was given to introduce the background
and objectives of the system. During the demonstration, the system was introduced in the order
of subsystems, modules and user tasks. User interactions with the system were demonstrated step
by step to illustrate how the interface design supports user tasks. The participants were asked to
evaluate the system for the interface, user task, and information (Table 6-3). To be specific, the

130
evaluation during demonstration aims to understand how participants perceive the interface
design, how they agree upon the design of task and operational process for supporting user tasks,
and how the information satisfies their needs for BMP adoption.
The research group discussion and two demonstrations were conducted using a large
projection screen and evaluators could interrupt and raise questions freely during the process.
The evaluation results from the research group discussion and two demonstrations were collected
and then, based on the developed evaluation measures, compiled into feedback scripts after the
demonstrations (See Appendix E, Table E.2).
During the evaluation by demonstration, conservation managers served as surrogates of
farmers for evaluating the system. However, as farmers are not directly involved in the
evaluation process, the evaluation method has several limitations. Firstly, conservation managers
are typically more knowledgeable and technically competent than farmers. The difficulty level of
system functions such as visualizing BMP modelling results may be underestimated. Secondly,
farmers have different social and economic characteristics. Their design of BMP scenarios may
be different from that of the conservation managers. Considering that the system aims to
facilitate farmers to make decisions on BMP adoption, it would be ideal to collect feedback from
farmers with different characteristics for evaluating the system.

131
Table 6-3: System design for evaluation during demonstration
Category Description
Interface Is the interface attractive, e.g. websites layout and color contrast?
Are the interactive operations with interface straightforward?
Are the navigations among subsystems and modules clear?
User task Is the task flow in the “What if” BMP scenario design sensible, i.e. scenario creation,
development, evaluation and comparison?
To what extent the system functions satisfy your task requirements?
Is the operation flow for conducting user tasks easy to understand and remember?
Information To what extent the information generated by the system is adequate to support your tasks
for BMP adoption?
To what extent the information is accurately and clearly presented and easy to perceive?
Are the discussion forum and Email functions useful to promote communications among
farmers and conservation managers?
6.3 The evaluation results
The results from evaluation by direct use and evaluation during demonstration were
aggregated and interpreted to develop an overall assessment of the system. Firstly, based on the
evaluation measures, the feedback scripts were examined, and those scripts associated with more
than one evaluation measures were divided into short scripts for specific measures. Secondly, all
feedback scripts were also examined to remove repetitions among the scripts. However, the
number of the repetitive scripts was recorded to indicate the significance of the opinion.
The discussions were organized by various categories of evaluation measures including
system quality, information quality, service quality, satisfaction, intention to use, and impact.

132
System quality
The evaluators provided an overall positive feedback on the system quality. They
mentioned that the system interface was user-friendly, the navigation within the system was
clear, and interactions with the system were straightforward. They also reported that the system
met the task completeness criterion, and the design of task flows was reasonable to guide
complex user tasks such as scenario evaluation and optimization.
However, there were several concerns. One major concern was regarding the learnability
of the system. The evaluators indicated that due to the complexity of the BMP scenario design
and evaluation process, farmers with less technical knowledge may have difficulties in using the
system. They suggested that “Tooltips or other assistance tools should be integrated into the
system to guide user operations and improve the learnability of the system”. Several other
concerns were reported regarding the system interface. An evaluator mentioned that “User
controls should be added when operations have dependency relationships”. An evaluator also
suggested “an improvement of the color contrast between the system background and working
space”. Furthermore, an evaluator suggested that “An adjustment of the font size should be made
to make the text more readable on the screen”.
Information quality
Evaluators agreed that the system improved information accessibility and achieved the
objective to meet various information needs by stakeholders. They, in particular, valued the
information generated from the “What if” BMP scenario evaluation and scenario optimization.
The “What if” BMP scenario evaluation provides information on the integrated economic and

133
environmental effects of BMPs; the scenario optimization identifies recommended solutions on
BMP planning (optimal BMP scenarios and their locations) subject to economic or
environmental constraints. They also mentioned that the various types of information
presentations, including the map, table, and chart, allowed them to better explore and understand
the modelling results.
The major concerns regarding information quality include the quality of data in the public
system and the information accuracy of the modelling and optimization results. Given the public
system allows farmers to submit public annotations, most of evaluators suggested that “Specific
mechanisms need to be developed to control or verify the information quality”. Because the BMP
planning information plays an essential role in support the BMP adoption decisions, evaluators
also emphasized that “BMP planning information generated from the integrated economic-
hydrologic model and optimization model needs to be accurate”, and “Explanations to the
modelling and optimization results should be added in the system to facilitate users’
understanding and interaction with the results”.
Service quality
Evaluators generally agreed that the web services were responsive, despite the fact that
the integrated economic-hydrologic model took around 2 minutes to generate the evaluation
results of BMP scenarios. Given the model simulates ten years of daily data, the running time is
acceptable to the evaluators.
One major concern regarding the service quality was about the documentation and
tutorial. Evaluators suggested that “A well-documented user manual needs to be integrated into

134
the system to explain and guide user tasks by steps, particularly for the scenario optimization.
Video tutorial would also be helpful to support the use of the system”.
Satisfaction
Based on the evaluation results on system quality, information quality, and service
quality, the evaluators were satisfied with the system overall. They valued the simplicity of the
interface design. They also assessed that the system meets the information needs for making
BMP adoption decisions. In particular, they showed a high interest in some system modules and
functions. An evaluator indicated that “The automated reporting process is very helpful in BMP
planning”. An evaluator also reported that “The embedded discussion forum and email functions
provide a convenient way for farmers to reach conservation managers”. Furthermore, an
evaluator mentioned that “The network diagram showing the communication relationships
among farmers and conservation managers is an interesting and innovative function”.
Several comments on further improvements to the design of the system were also raised.
For example, evaluators suggested that “The system can be improved by implementing an online
community forum to facilitate general discussions and sharing BMP adoption experiences” and
“The system can be improved by providing the historical BMP adoption information to
farmers”. Evaluators also suggested that “A mobile version of the public system can be
developed to improve the usability of the system”.
Intention to use
The evaluators showed a high interest in the system design and functions. Particularly,
the evaluators indicated that the WebGIS-based decision support system provides a platform for

135
communicating complex BMP modelling results to farmers and conservation managers. Staff in
the conservation authorities commented that “The system can be used when visiting farmer to
discuss BMP adoptions”. Farmers and conservation mangers can use the system to evaluation
various BMP scenarios together to develop consensus on BMP adoption. The staff in OMAFRA
also commented that “The public system has a great potential to be used for collecting data on
on-ground activities including BMP adoption”.
Impact
The evaluators indicated that the system has the potential to play a role in improving their
environmental awareness and BMP knowledge, and supporting their decisions on BMP adoption.
For example, they mentioned that “The public subsystem, specifically the public annotation
sharing site, can be used as a tool to increase farmers’ environmental awareness”. They also
mentioned that “The information center in the public subsystem is useful to find locale specific
information, such as agri-environmental policies” and “The BMP planning subsystem provides
an effective tool to improve the understanding on the economic and environmental effects of
BMPs”.
6.4 Summary
This chapter presents the evaluation of the WebGIS-based decision support system for
facilitating agricultural BMP adoption in the Gully Creek watershed. The evaluation uses two
methods including evaluation by direct use and evaluation during demonstration. The evaluation
measures include system quality, information quality, service quality, satisfaction, intention to
use, and impact. The aggregated evaluation results show that the evaluators were overall satisfied

136
with the system design and functionalities. Several suggestions on further improvements to the
system were also provided.

137
Chapter 7 Conclusion
7.1 Summary
This research developed a WebGIS-based decision support system for facilitating BMP
adoption. The system supports the information communication processes for BMP adoption.
Specifically, the system provides farmers and conservation managers with easy access to the
public and BMP evaluation and policy/management information; the system also supports
information communications between farmers and conservation managers so that they can
discuss concerns and reach consensus on BMP adoption. It is worth noting that the WebGIS-
based decision support system evaluates environmental benefits of BMPs in terms of water
quantity and quality, but not others such as soil health, ecological benefits, etc. Moreover, the
WebGIS-based decision support system does not examine the social and cultural aspects of BMP
adoption.
The Chapter 1 introduced the background and the objectives of the research. Famers and
conservation managers face various barriers on effective communications for BMP adoption
based on relevant information content, which includes field characteristics, environmental
concerns, BMP adoption status, BMP technical knowledge, BMP policies, BMP costs, BMP
benefits, and BMP cost effectiveness. To address the challenge, the aim of this research is to
develop a WebGIS-based decision support system to facilitate information communications for
agricultural BMP adoption.
The Chapter 2 reviewed literature in the related research domains and identified research
gaps. Specifically, BMP adoption studies were analyzed, and information needs of stakeholders

138
for BMP adoption were identified. Many modelling systems have been developed to generate
valuable information for BMP evaluation (Srivastava et al., 2002; Yang et al., 2003; Turpin et
al., 2005). However, those modelling systems and desktop-based interfaces were commonly too
complex for farmers and conservation managers to operate. Moreover, despite the fact that some
applications of GIS have been developed to facilitate watershed modelling and BMP evaluation
(Jayakrishnan et al., 2005; Olivera et al., 2006; Liu, Bralts, & Engel, 2015; Karki et al., 2017;
Jang, Ahn, & Kim, 2017), an identified need is to extend those GIS systems to improve
stakeholders’ access to information and facilitate their communications to address the possible
adoption concerns.
The Chapter 3 developed an information model to characterize information content,
communications, and related technologies and tools in the information communication process
for BMP adoption. The development of the information model was based on the analysis of
information needs and the use of ICTs. The information needs of farmers and conservation
managers were classified into two categories: public information and BMP planning information.
The characteristics of different ICTs and the potential of ICTs were discussed to understand the
use of ICTs to support various information needs of stakeholders.
The Chapter 4 introduced the design of a WebGIS-based decision support system for
facilitating agricultural BMP adoption. The task-oriented design approach was used to
implement the information model and guide the design of the WebGIS-based decision support
system at three design levels: subsystem, module, and component level. Subsystems were
designed to support the information needs of stakeholders, modules of each subsystem were
designed to support information tasks required to achieve the information needs in the

139
information communication process, and components at the client, service and data tiers of
modules were designed to support user interactions with the interface to complete information
tasks.
The Chapter 5 showcased a prototype of WebGIS-based decision support system, which
was adapted to the Gully Creek watershed. The procedure of system localization for the Gully
Creek watershed was discussed, which can provide references for transferring the WebGIS-based
decision support system to other watersheds. In the demonstration of the prototype, the user
interfaces (interface layout and components) were introduced, user interactions with the interface
were described, and the means of information presentations were illustrated. The demonstration
showed how the information needs of stakeholders were met and information communications
among stakeholders were fulfilled through the WebGIS-based decision support system.
The chapter 6 evaluated the WebGIS-based decision support system through direct use
and demonstration. The evaluation by direct use identified violence to usability principles, while
the evaluation during demonstration evaluated user task and information of the system. The
results from evaluation by direct use and evaluation during demonstration were aggregated for
assessment of the system usability. The evaluation results revealed that the evaluators overall
satisfied with the system. Specifically, the system interface was easy to use, the web services
were responsive, and the functions and information satisfied their task requirements for
agricultural BMP adoption.

140
7.2 Research contributions
Theoretical contribution
This research examined BMP adoption as an information communication process
wherein stakeholders request information to improve their knowledge and collaboratively
address their concerns towards BMP adoption. Based on the innovation diffusion theory (Rogers,
1995), the research identified key stakeholders and defined the role of stakeholders in the
information communication process. Specifically, scientific researchers, conservation managers
and farmers are the key stakeholders for BMP adoption. Scientific researchers play an important
role as they identify environmental problems, design BMPs and generate the information on
economic costs, environmental benefits and cost-effectiveness of BMPs. Farmers are adopters of
BMPs. Conservation managers are BMP policy designers and facilitators for BMP adoption.
During the process, both farmers and conservation managers need information to improve their
understanding on BMPs and their effects (Shao et al., 2017). They also need have frequent
communications on the information on economic costs, environmental benefits, and cost-
effectiveness of BMPs to reach consensus on BMP adoption decisions.
In addition to a variety of social, cultural and economic factors, information is an
essential factor for the adoption process of agricultural BMPs (Rogers, 1995; Alonge and Martin,
1995; Kaiser et al., 1999; Smithers & Furman, 2003; Dietz et al.2004; Claassen et al., 2008;
Atari et al., 2009). Based on the understanding on agricultural BMP adoption process, the
research developed an information model to conceptualize the information processes for BMP
adoption. The information model improves knowledge on how the information communication
process for agricultural BMP adoption can be achieved by the application of GIS, integrated

141
economic-hydrologic models and ICTs. Specifically, a WebGIS can be used to facilitate
information sharing among farmers about their field characteristics, environmental concerns, and
BMP adoption (Kingston et al., 2000). The public information portal can be used to disseminate
environmental policies and BMP related technical knowledge (Janssen & Kies, 2005). The
WebGIS, coupled with an economic-hydrologic model and an optimization model, can improve
stakeholders’ access to the BMP planning information (Goodchild et al., 1993). Moreover, the
communication tools such as discussion forum and email can be used facilitate communications
among stakeholders (Sidlar and Rinner, 2007; Butt and Li, 2012).
Methodological contribution
Existing GIS applications for BMP evaluation were mostly used by experts (Jayakrishnan
et al., 2005; Olivera et al., 2006; Liu, Bralts, & Engel, 2015; Karki et al., 2017; Jang, Ahn, &
Kim, 2017). The innovation of the WebGIS-based decision support system is to communicate
BMP evaluation modelling information to stakeholders including farmers and conservation
managers. This research used a task-oriented design approach to design a user-friendly WebGIS-
based decision support system for facilitating the adoption of agricultural BMPs. Based on the
understanding on the information communication process presented by the information model, a
hierarchy of user tasks was developed to facilitate the achievement of the information model and
guide the system design at three different design levels: the subsystem, module and component
levels.
The design of the WebGIS-based decision support system extends the desktop-based
integrated economic-hydrologic modelling systems for BMP adoption by allowing stakeholders
to easily access a wider range of information which includes public information (field

142
characteristics, environmental concerns, BMP adoption status, BMP technical knowledge, BMP
policies) and BMP planning information (BMP costs, BMP benefits, BMP cost effectiveness,
and spatial targeting of BMPs). The WebGIS-based decision support system also extends the
traditional desktop GIS by offering a collaborative environment for stakeholders and improving
information communications between farmers and conservation managers to reach consensus on
BMP adoption.
Practical contribution
This research developed a prototype of the WebGIS-based decision support system for
the Gully Creek watershed. The software for the prototype development was discussed. The
localization of the design to the Gully Creek watershed was outlined. By adapting the system
design to the Gully Creek watershed, the WebGIS-based decision support system prototype
demonstrates that the system has the potential to be transferred to other watersheds with various
customization tasks.
The system prototype supports the information communication process for BMP adoption
and facilitates farmers and conservation managers in the Gully Creek watershed to conduct
various tasks related to BMP adoption. In particular, the system allows farmers and conservation
managers to evaluate economic costs, environmental benefits, and cost-effectiveness of four
BMPs (i.e. conservation tillage, cover crop, nutrient management and WASCoBs) on farm fields.
The system also supports the conservation manager to design economic and environmental
policies for BMP implementation in the Gully Creek watershed.

143
7.3 Future study
The WebGIS-based decision support system has the potential to be further developed to
support agricultural BMP adoption in various watershed contexts:
1) Scenario scripts were utilized as a tool to derive key user tasks and design
requirements based on an existing watershed BMP modelling project in the research group with
inputs from staff members at conservation authority and government. These scenario scripts can
be further developed by interviewing representative farmers and conservation managers from
other conservation organizations.
2) The architecture of the WebGIS-based decision support system included key system
components for supporting agricultural BMP adoption. However, the system design can be
further modified and/or expanded to include more information communication tasks. For
example, a module can be designed to show the historical results of BMP adoption. Moreover, a
community forum can be incorporated into the system to enhance the information sharing among
a wide range of stakeholders to further facilitate the adoption of BMPs.
3) The system can be further improved to support different parameterization schemes,
such as climate scenarios. In this regard, enhancements of system should be made. Especially, an
interface between the WebGIS interface and the integrated economic-hydrologic model can be
built to allow users to modify model inputs or parameters. Instead of arbitrarily assigning fixed
values of parameters, this interface should enable the model to explore a parameter space to
generate a range of BMP cost-effectiveness. By evaluating BMPs subject to the parameter space,

144
a range of BMP cost effectiveness can be obtained, and the uncertainty or confidence interval of
BMP cost effectiveness can be calculated.
4) A prototype of the WebGIS-based decision support system for the Gully Creek
watershed was developed based on four representative BMPs which included conservation
tillage, cover crop, nutrient management, and WASCoBs. The engine of the system was based on
existing farm economic, watershed hydrologic, and integrated modelling for the watershed.
Various workflows can be developed for adapting the system to other watersheds with various
BMPs, which improve the transferability of the WebGIS-based decision support system. The
workflows may include basic dataset collection, modelling development, and system function
development.
5) The prototype of the WebGIS-based decision support system for the Gully Creek
watershed was evaluated through direct use and demonstration. Based on the evaluation results, a
very positive feedback was received. However, local farmers were not included in the evaluation
due to the sensitiveness in communicating with farmers by people outside conservation authority
and government. Further work may include working with conservation authority and government
to develop a trust relationship with local farmers and conduct a user evaluation by them to
understand the strengths and limitations of the system.
6) This study designed the WebGIS-based decision support system to facilitate
information communication among stakeholders for facilitating agricultural BMP adoption.
Future studies can be developed to quantify the effects of the WebGIS-based decision support
system on improving BMP adoption. Specifically, efforts can be made to understand the

145
potential usage of the WebGIS-based decision support system among stakeholders, and to what
extent the system usage contributes to BMP adoption.

146
REFERENCES
Ackerman, D., & Stein, E. D. (2008). Evaluating the Effectiveness of Best Management
Practices Using Dynamic Modeling. Journal of Environmental Engineering, 134(8).
https://doi.org/10.1061/(ASCE)0733-9372(2008)134:8(628)
Ahmed, A.A.N., Haque, H.F., Rahman, A., Ashraf, M.S., Saha, S., Shatabda, S. (2017). A
Participatory Sensing Framework for Environment Pollution Monitoring and Management.
Retrieved from: https://arxiv.org/abs/1701.06429
Ajzen, I. (1991). The theory of planned behavior. Organizational Behavior and Human Decision
Processes, 50(2), 179-211. https://doi.org/10.1016/0749-5978(91)90020-T
Alonge, A. J., & Martin, R. A. (1995). Assessment of the adoption of sustainable agriculture
practices: Implications for agricultural education. Journal of Agricultural Education, 36(3),
34-42.
Annett, J. (2004). Hierarchical task analysis. In N. Stanton, A. Hedge, K. Brookhuis, E. Salas, &
H. Hendrick (Eds.), Handbook of Human Factors and Ergonomics Methods. Boca Raton,
FL: CRC Press.
Arabi, M., Frankenberger, J. R., Engel, B. A., & Arnold, J. G. (2008). Representation of
agricultural conservation practices with SWAT. Hydrological Processes, 22(16), 3042-
3055. https://doi.org/10.1002/hyp.6890

147
Arnold, J. G., Srinivasan, R., Muttiah, R. S., & Williams, J. R. (1998). Large area hydrologic
modeling and assessment part I: Model development. Journal of the American Water
Resources Association, 34(1), 73-89. https://doi.org/10.1111/j.1752-1688.1998.tb05961.x
Atari, D. O. A., Yiridoe, E. K., Smale, S., & Duinker, P. N. (2009). What motivates farmers to
participate in the Nova Scotia environmental farm plan program? Evidence and
environmental policy implications. Journal of Environmental Management, 90(2), 1269-
1279. https://doi.org/10.1016/j.jenvman.2008.07.006
Barkmann, H., Lincke, R., & Löwe, W. (2009). Quantitative evaluation of software quality
metrics in open-source projects. In Proceedings - International Conference on Advanced
Information Networking and Applications, Bradford (pp.1067-1072).
https://doi.org/10.1109/WAINA.2009.190
Baumgart-Getz, A., Prokopy, L. S., & Floress, K. (2012). Why farmers adopt best management
practice in the United States: A meta-analysis of the adoption literature. Journal of
Environmental Management, 96(1), 17-25. https://doi.org/10.1016/j.jenvman.2011.10.006
Bicknell, B. R., Imhoff, J. C., Kittle, Jr., J. L., Jobes, T. H., & Donigian, Jr., A. S. (2005).
Hydrological simulation program - Fortran: HSPF version 12.2 user’s manual. Cooperation
with the US Geological Survey and US Environmental Protection Agency
Bingner, R. L., & Theurer, F. D. (2003). AnnAGNPS technical processes: documentation version
3.2. Retrieved from
https://www.ars.usda.gov/ARSUserFiles/60600505/AGNPS/PLModel/Document/Tech_Do
c.PDF

148
Bootstrap vs. Foundation (2019), Retrieved from https://stackshare.io/stackups/bootstrap-vs-
foundation
Boroushaki, S., & Malczewski, J. (2010a). Using the fuzzy majority approach for GIS-based
multicriteria group decision-making. Computers and Geosciences, 36(3), 302-312.
https://doi.org/10.1016/j.cageo.2009.05.011
Boroushaki, S., & Malczewski, J. (2010b). Measuring consensus for collaborative decision-
making: A GIS-based approach. Computers, Environment and Urban Systems, 34(4), 322-
332. https://doi.org/10.1016/j.compenvurbsys.2010.02.006
Böhlke, J. K. (2002). Groundwater recharge and agricultural contamination. Hydrogeology
Journal, 10(1), 153-179. https://doi.org/10.1007/s10040-001-0183-3
Breetz, H. L., Fisher-Vanden, K., Jacobs, H., & Schary, C. (2005). Trust and communication:
mechanisms for increasing farmers’ participation in water quality trading. Land Economics,
81(2), 170-190. https://doi.org/10.3368/le.81.2.170
Brent Hall, G., Chipeniuk, R., Feick, R. D., Leahy, M. G., & Deparday, V. (2010). Community-
based production of geographic information using open source software and Web 2.0.
International Journal of Geographical Information Science, 24(5), 761-781.
https://doi.org/10.1080/13658810903213288
Brown, G., & Kyttä, M. (2014). Key issues and research priorities for public participation GIS
(PPGIS): A synthesis based on empirical research. Applied Geography, 46, 122-136.
https://doi.org/10.1016/j.apgeog.2013.11.004

149
Brown, G. (2012). Public Participation GIS (PPGIS) for regional and environmental planning:
feflections on a decade of empirical research. Journal of the Urban and Regional
Information Systems Association (URISA), 25(2), 7-18. https://doi.org/10.1068/b2751t
Bugs, G., Granell, C., Fonts, O., Huerta, J., & Painho, M. (2010). An assessment of Public
Participation GIS and Web 2.0 technologies in urban planning practice in Canela, Brazil.
Cities, 27(3), 172-181. https://doi.org/10.1016/j.cities.2009.11.008
Bultena, G. L., & Hoiberg, E. O. (1983). Factors affecting farmer adoption of conservation
tillage. Journal of Soil and Water Conservation, 38(3), 281-284.
Butt, M. A., & Li, S. (2012). Open source based online map sharing to support real-time
collaboration. OSGeo Journal, 10, 4-15.
Butt, M. A., & Li, S. (2012). Developing a web-based, collaborative PPGIS prototype to support
public participation. Applied Geomatics, 4(3), 197-215. https://doi.org/10.1007/s12518-
012-0085-1
Carlson, J. E., D. A. Dillman and W. R. Lassey. (1981). The farmer and erosion: Factors
influencing the use of control practices. Bulletin No. 601, Agricultural Experiment Station,
University of Idaho, Moscow, Idaho.
Carroll, J. M. (1997). Human-computer interaction: Psychology as a science of design.
International Journal of Human Computer Studies, 48, 61-83.
https://doi.org/10.1006/ijhc.1996.0101

150
Chapman, R., Slaymaker, T., & Paper, W. (2002). ICTs and Rural Development: Review of the
Literature, Current Interventions and Opportunities for Action. Retrieved from
https://www.odi.org/resources/docs/2670.pdf
Chin, J. P., Diehl, V. a and Norman, L. K. (1988) ‘Development of an instrument measuring user
satisfaction of the human-computer interface’, CHI ’88- Proceedings of the SIGCHI
conference on Human factors in computing systems, pp. 213–218. doi:
10.1145/57167.57203.
Claassen, R., Cattaneo, A., & Johansson, R. (2008). Cost-effective design of agri-environmental
payment programs: U.S. experience in theory and practice. Ecological Economics, 65(4),
737-752. https://doi.org/10.1016/j.ecolecon.2007.07.032
Coggan, A., Whitten, S. M., & Bennett, J. (2010). Influences of transaction costs in
environmental policy. Ecological Economics, 69(9), 1777-1784.
https://doi.org/10.1016/j.ecolecon.2010.04.015
Coleman, D. J., Georgiadou, Y., Labonte, J., Observation, E., & Canada, N. R. (2009).
Volunteered Geographic Information: the nature and motivation of produsers.
GeoInformation Science, 4, 332-358.
Dabney, S. M. (1998). Cover crop impacts on watershed hydrology. Journal of Soil and Water
Conservation, 53(3), 207-213.

151
DeLone, W. H. & Mclean, E. R. (2003). The DeLone and McLean Model of Information
Systems Success: A Ten-Year Update. Journal of Management Information Systems /
Spring, 19(4), 9–30. doi: 10.1073/pnas.0914199107.
D’souza, G., Cyphers, D., & Phipps, T. (1993). Factors affecting the adoption of sustainable
Agricultural Practices. Agricultural and Resource Economics Review, 22(2), 159-165.
https://doi.org/10.1017/S1068280500004743
Dietz, M. E., Clausen, J. C., & Filchak, K. K. (2004). Education and changes in residential
nonpoint source pollution. Environmental Management, 34(5), 684-690.
https://doi.org/10.1007/s00267-003-0238-4
Dupont, D. P. (2010). Cost-sharing incentive programs for source water protection: The Grand
River’s rural water quality program. Canadian Journal of Agricultural Economics, 58(4),
481-496. https://doi.org/10.1111/j.1744-7976.2010.01197.x
Ebert, P., & Shapiro, S. (2009). The good, the bad and the ugly. Synthese, 170(3), 415-441.
https://doi.org/10.1007/s11229-007-9263-9
Elwood, S., & Ghose, R. (2011). PPGIS in community development planning: Framing the
organizational context. In Classics in Cartography: Reflections on Influential Articles from
Cartographica (pp:83-105). New York, NY: John Wiley & Son Ltd.
https://doi.org/10.1002/9780470669488.ch8
Elwood, S., Goodchild, M. F., & Sui, D. Z. (2012). Researching Volunteered Geographic
Information: Spatial Data, Geographic Research, and New Social Practice, 102(3), 571-

152
590. Annals of the Association of American Geographers.
https://doi.org/10.1080/00045608.2011.595657
Engel, S., Pagiola, S., & Wunder, S. (2008). Designing payments for environmental services in
theory and practice: An overview of the issues. Ecological Economics, 65(4), 663-674.
https://doi.org/10.1016/j.ecolecon.2008.03.011
Environmental Protection Agency (US EPA) 1999, Preliminary Data Summary of Urban
Stormwater Best Management Practices, United States Environmental Protection Agency
report No. EPA- 821-R-99-012: www.epa.gov/waterscience/stormwater
Eppler, M. J., & Muenzenmayer, P. (2002). Measuring Information Quality in the Web Context:
A survey of state-of-art instruments and an application methodology (Practice-Oriented).
Proceedings of the Seventh International Conference on Information Quality (ICIQ-02) (pp.
187-196). https://doi.org/10.1.1.477.4680
Falconer, K. (2000). Farm-level constraints on agri-environmental scheme participation: A
transactional perspective. Journal of Rural Studies, 16(3), 379-394.
https://doi.org/10.1016/S0743-0167(99)00066-2
Feather, P. M., & Amacher, G. S. (1994). Role of information in the adoption of best
management practices for water quality improvement. Agricultural Economics, 11, 159-
170.
Fischer, G. (1993). Beyond human computer interaction: Designing useful and usable
computational environments. In: People and Computers VIII: Proceedings of the HCI'93

153
Conference (Loughborough, England), Cambridge University Press, Cambridge, UK, pp.
17-31.
Fischer, G. (2001). User modeling in human-computer interaction. User Modeling and User-
Adapted Interaction, 11, 65-86. https://doi.org/10.1023/A:1011145532042
Flanagin, A. J., & Metzger, M. J. (2008). The credibility of volunteered geographic
information. GeoJournal, 72, 137-148. https://doi.org/10.1007/s10708-008-9188-y
Fossey, E., Harvey, C., McDermott, F., & Davidson, L. (2002). Understanding and evaluating
qualitative research. Australian and New Zealand Journal of Psychiatry, 36, 717-732.
https://doi.org/10.1046/j.1440-1614.2002.01100.x
Garbarino, S., & Holland, J. (2009). Quantitative and qualitative methods in impact evaluation
and measuring results. Governance and Social Development Resource Center. Discussion
Paper. Birmingham: University of Birmingham.
Garnett, T., Appleby, M. C., Balmford, A., Bateman, I. J., Benton, T. G., Bloomer, P., …
Godfray, H. C. J. (2013). Sustainable intensification in agriculture: Premises and policies.
Science, 341(6141), 33-34. https://doi.org/10.1126/science.1234485
Ghebremichael, L. T., Veith, T. L., & Hamlett, J. M. (2013). Integrated watershed- and farm-
scale modeling framework for targeting critical source areas while maintaining farm
economic viability. Journal of Environmental Management, 114, 381-394.
https://doi.org/10.1016/j.jenvman.2012.10.034

154
Gitau, M. W., Veith, T. L., & Gburek, W. J. (2004). Farm-level optimization of BMP placement
for cost-efficient pollution reduction. Transactions of the ASAE, 47(6), 1923-1931.
https://doi.org/10.13031/2013.17805
Glendenning, C. J., & Ficarelli, P. P. (2012). The relevance of content in ICT initiatives in Indian
agriculture. International Food Policy Research Institute. Retrieved from
http://www.researchintouse.com/resources/riu11discuss16info-comms.pdf
GLRI funding. (n, d), Retrieved from https://www.glri.us/funding
Goodchild, M. F., Parks, B. O., & Steyaert, L. T. (1993). Environmental modeling with GIS.
New York: Oxford University Press
Goodchild, M. F., & Li, L. (2012). Assuring the quality of volunteered geographic information.
Spatial Statistics, 1, 110-120. https://doi.org/10.1016/j.spasta.2012.03.002
Gratier, T., Spencer, P., Hazzard, E. (2015): OpenLayers 3: Beginners's Guide, Packt Publishing Ltd.,
Birmingham, UK
Greiner, R., & Gregg, D. (2011). Farmers’ intrinsic motivations, barriers to the adoption of
conservation practices and effectiveness of policy instruments: Empirical evidence from
northern Australia. Land Use Policy, 28(1), 257-265.
https://doi.org/10.1016/j.landusepol.2010.06.006
Grinnell, R. M., Jr. (Ed.). (2001). Social work research and evaluation: Quantitative and
qualitative approaches (7th ed.). Belmont, CA: Wadsworth.

155
Hamilton, S., & Chervany, N. L. (2006). Evaluating Information System Effectiveness - Part I:
Comparing Evaluation Approaches. MIS Quarterly, 5(3), 55-69.
https://doi.org/10.2307/249291
Havlin, J. L., Beaton, J. D., Tisdale, S. L., & Nelson, W. L. (1999). Soil Fertility and Fertilizers:
An Introduction to Nutrient Management. In Soil Fertility and Fertilizers. NYC, NY:
Pearson https://doi.org/10.1007/s10310-009-0124-x
Holzinger, a (2005) ‘Usability engineering methods for software developers’, Communications
of the ACM, 48(1), pp. 71–74. doi: 10.1145/1039539.1039541.
Issa T., & Isaias P. (2015) Usability and Human Computer Interaction (HCI) (pp. 19-36). In:
Sustainable Design. Springer, London
Jang, S. S., Ahn, S. R., & Kim, S. J. (2017). Evaluation of executable best management practices
in Haean highland agricultural catchment of South Korea using SWAT. Agricultural Water
Management, 180(Part B), 224-234. https://doi.org/10.1016/j.agwat.2016.06.008
Janssen, D., & Kies, R. (2005). Online forums and deliberative democracy. Acta Politica, 40(3),
317-335. https://doi.org/10.1057/palgrave.ap.5500115
Jayakrishnan, R., Srinivasan, R., Santhi, C., & Arnold, J. G. (2005). Advances in the application
of the SWAT model for water resources management. Hydrological Processes, 19(3), 749-
762. https://doi.org/10.1002/hyp.5624

156
Jeffries, R. et al. (1991) ‘User interface evaluation in the real world: a comparison of four
techniques’, in Proceedings of the SIGCHI conference on Human factors in computing
systems, pp. 119–124. doi: 10.1145/108844.108862.
Jeffries, R. and Desurvire, H. (1992) ‘Usability testing vs. heuristic evaluation’, ACM SIGCHI
Bulletin, 24(4), pp. 39–41. doi: 10.1145/142167.142179.
Kaiser, F. G., Wölfing, S., & Fuhrer, U. (1999). Environmental attitude and ecological
behaviour. Journal of Environmental Psychology, 19(1), 1-19.
https://doi.org/10.1006/jevp.1998.0107
Kaplan, B., & Maxwell, J. A. (2006). Qualitative Research Methods for Evaluating Computer
Information Systems. In Evaluating the Organizational Impact of Healthcare Information
Systems,30-55. https://doi.org/10.1007/0-387-30329-4_2
Karatzas K., Peinel G., Rose T. (2000): GIS-based Dissemination of Air Quality Information in
APNEE. 6th European Commission GI and GIS Workshop, The Spatial Information
Society - Shaping the Future, Lyon, France.
Karki, R., Tagert, M. L. M., Paz, J. O., & Bingner, R. L. (2017). Application of AnnAGNPS to
model an agricultural watershed in East-Central Mississippi for the evaluation of an on-farm
water storage (OFWS) system. Agricultural Water Management, 192, 103-114.
https://doi.org/10.1016/j.agwat.2017.07.002

157
Kelly, K. E., Belcher, K., & Khakbazan, M. (2018). Economic targeting of agricultural beneficial
management practices to address phosphorus runoff in Manitoba. Canadian Journal of
Agricultural Economics, 66(1), 143-166. https://doi.org/10.1111/cjag.12143
Kershner, R., Mercer, N., Warwick, P., & Staarman, J. K. (2010). Can the interactive whiteboard
support young children’s collaborative communication and thinking in classroom science
activities? International Journal of Computer-Supported Collaborative Learning, 5(4), 359-
383. https://doi.org/10.1007/s11412-010-9096-2
Keßler, C. 2004. Design and implementation of argumentation maps. Münster, Germany:
Diploma Thesis, Westfälische Wilhelms-Universitäty Münster, Germany. Available online
at http://www.carstenkessler.de/argumap/.
Kingston, R., Carver, S., Evans, A., & Turton, I. (2000). Web-based public participation
geographical information systems: An aid to local environmental decision-making.
Computers, Environment and Urban Systems, 24(2), 109-125.
https://doi.org/10.1016/S0198-9715(99)00049-6
Kingston, R. (2007). Public Participation in Local Policy Decision-making: The Role of Web-
based Mapping. The Cartographic Journal, 44(2), 138-144.
https://doi.org/10.1179/000870407X213459
Kitajima, M. (2018). Cognitive Walkthrough for the Web. Journal of Japan Society for Fuzzy
Theory and Systems. https://doi.org/10.3156/jfuzzy.14.5_14

158
Knowler, D., & Bradshaw, B. (2007). Farmers’ adoption of conservation agriculture: A review
and synthesis of recent research. Food Policy, 32(1), 25-48.
https://doi.org/10.1016/j.foodpol.2006.01.003
Leach, W. D., Pelkey, N. W., & Sabatier, P. A. (2002). Stakeholder partnerships as collaborative
policymaking: Evaluation criteria applied to watershed management in California and
Washington. Journal of Policy Analysis and Management, 21(4), 645-670.
https://doi.org/10.1002/pam.10079
Lee, T., Rister, M. E., Narashimhan, B., Srinivasan, R., Andrew, D., & Ernst, M. R. (2010).
Evaluation and spatially distributed analyses of proposed cost-effective BMPs for reducing
phosphorus level in Cedar Creek Reservoir, Texas. Transactions of the ASABE, 53(5),
1619-1627.
Lee, Y. W. et al. (2002). AIMQ: A methodology for information quality assessment. Information
and Management, 40, 133-146. https://doi.org/10.1016/S0378-7206(02)00043-5
Leung, L. (2015). Validity, reliability, and generalizability in qualitative research. Journal of
Family Medicine and Primary Care, 4(3), 324–327. https://doi.org/10.4103/2249-
4863.161306
Lewis, C., & Rieman, J. (1994). Task-Centered User Interface Design: A Practical Introduction
[PDF file]. Retrieved from ftp.cs.colorado.edu/pub/cs/distribs/clewis/HCI-Design- Book.
Liu, Y., Bralts, V. F., & Engel, B. A. (2015). Evaluating the effectiveness of management
practices on hydrology and water quality at watershed scale with a rainfall-runoff model.

159
Science of the Total Environment, 511, 298-308.
https://doi.org/10.1016/j.scitotenv.2014.12.077
Llewellyn, R. S. (2007). Information quality and effectiveness for more rapid adoption decisions
by farmers. Field Crops Research, 104(1-3), 148-156.
https://doi.org/10.1016/j.fcr.2007.03.022
Logan, T. J. (1993). Agricultural best management practices for water pollution control: current
issues. Agriculture, Ecosystems and Environment, 46(1-4), 223–231.
https://doi.org/10.1016/0167-8809(93)90026-L
Lu, Y., Song, S., Wang, R., Liu, Z., Meng, J., Sweetman, A. J., … Wang, T. (2015). Impacts of
soil and water pollution on food safety and health risks in China. Environment International,
77, 5-15. https://doi.org/10.1016/j.envint.2014.12.010
Lubell, M., & Fulton, A. (2007). Local diffusion networks act as pathways to sustainable
agriculture in the Sacramento River Valley. California Agriculture, 61(3), 131-137.
https://doi.org/10.3733/ca.v061n03p131
Luchette, J., & Crawford, T. (2008). A public participation GIS application for citizen-based
watershed monitoring in the Pamlico-Tar River basin, North Carolina. Southeastern
Geographer, 48(2), 184-200 https://doi.org/10.1353/sgo.0.0022
Luzar, E. J., & Diagne, A. (1999). Participation in the next generation of agriculture conservation
programs: The role of environmental attitudes. Journal of Socio-Economics, 28(3), 335-349.
https://doi.org/10.1016/S1053-5357(99)00021-9

160
Ma, S., Swinton, S. M., Lupi, F., & Jolejole-Foreman, C. (2012). Farmers’ Willingness to
Participate in Payment-for-Environmental-Services Programmes. Journal of Agricultural
Economics, 63(3), 604-626. https://doi.org/10.1111/j.1477-9552.2012.00358.x
Maharjan, G. R., Ruidisch, M., Shope, C. L., Choi, K., Huwe, B., Kim, S. J., … Arnhold, S.
(2016). Assessing the effectiveness of split fertilization and cover crop cultivation in order
to conserve soil and water resources and improve crop productivity. Agricultural Water
Management, 163(1), 305-318. https://doi.org/10.1016/j.agwat.2015.10.005
Malczewski, J. (2004). GIS-based land-use suitability analysis: A critical overview. Progress in
Planning, 62(1), 3-65. https://doi.org/10.1016/j.progress.2003.09.002
Mankoff, J. et al. (2003) ‘Heuristic evaluation of ambient displays’, in Proceedings of the
conference on Human factors in computing systems - CHI ’03, p. 169. doi:
10.1145/642611.642642.
Matson, P. A., Parton, W. J., Power, A. G., & Swift, M. J. (1997). Agricultural intensification
and ecosystem properties. Science, 277(5325), 504-509.
https://doi.org/10.1126/science.277.5325.504
Mazza, R., & A. Berre. (2007). Focus Group Methodology for Evaluating Information
Visualization Techniques and Tools. In 11th International Conference of Information
Visualization. Zürich, Switzerland, (pp. 74-80).

161
Mbilinyi, B. P., Tumbo, S. D., Mahoo, H. F., & Mkiramwinyi, F. O. (2007). GIS-based decision
support system for identifying potential sites for rainwater harvesting. Physics and
Chemistry of the Earth, 32(15-18), 1074-1081. https://doi.org/10.1016/j.pce.2007.07.014
McCown, R. L. (2002). Locating agricultural decision support systems in the troubled past and
socio-technical complexity of “models for management.” Agricultural Systems, 74(1), 11-
25. https://doi.org/10.1016/S0308-521X(02)00020-3
McCoy, N., Chao, B., & Gang, D. D. (2015). Nonpoint source pollution (article). Water
Environment Research, 87(10), 1576–1594. https://doi.org/10.2175/106143015
x14338845156263
Morrison, K., & FitzGibbon, J. E. (2014). Adaptive governance of dynamic social-ecological
systems: the case of the ontario Environmental Farm Plan (1992-2011). Agroecology and
Sustainable Food Systems, 38(4), 378-409. https://doi.org/10.1080/21683565.2013.870627
Murray, M. (2002). An investigation of specifications for migrating to a web portal framework
for the dissemination of health information within a public health network. Paper presented
at Proceedings of the 35th Annual Hawaii International Conference on System Science, Big
Island, Hawaii, USA (pp. 1917-1925). USA: IEEE Computer Society, Los Alamitos,
California, USA
Nielsen, J. (1990) ‘Ten Usability Heuristics’, Communications of the ACM, 3(1990), pp. 1–2.
Available at: http://www.useit.com/papers/heuristic/heuristic_list.html.
Nielsen, J. (1993) Usability Engineering, Usability Engineering. doi: 10.1145/1508044.1508050.

162
Nielsen, J. (1994). Usability inspection methods. In Conference companion on Human factors in
computing systems - CHI ’94. https://doi.org/10.1145/259963.260531
Nxumalo, K. K. S., & Oladele, O. I. (2013). Factors affecting farmers’ participation in
agricultural programme in Zululand District, Kwazulu Natal Province, South Africa.
Journal of Social Sciences, 34(1), 83-88. https://doi.org/10.1080/09718923.2013.11893120
Olivera, F., Valenzuela, M., Srinivasan, R., Choi, J., Cho, H., Koka, S., & Agrawal, A. (2006).
ArcGIS-SWAT: A geodata model and GIS interface for SWAT. Journal of the American
Water Resources Association, 42(2), 295-309. https://doi.org/10.1111/j.1752-
1688.2006.tb03839.x
Open maps. (n.d.) Retrieved from https://open.canada.ca/en/open-maps.
Osei, E., Gassmann, P. W., Jones, R. D., Pratt, S. J., Hauck, L. M., Beran, L. J., … Williams, J.
R. (2000). Economic and environmental impacts of alternative practices on dairy farms in
an agricultural watershed. Journal of Soil and Water Conservation, 55(4), 466-472.
Palmer, J. W. (2002). Web site usability, design, and performance metrics. Information Systems
Research, 13(2), 151–167. doi: 10.1287/isre.13.2.151.88.
Panteli, N., & Dawson, P. (2001). Video conferencing meetings: Changing patterns of business
communication. New Technology, Work and Employment, 16(2), 88-99.
https://doi.org/10.1111/1468-005X.00079

163
Parajuli, P. B., Mankin, K. R., & Barnes, P. L. (2008). Applicability of targeting vegetative filter
strips to abate fecal bacteria and sediment yield using SWAT. Agricultural Water
Management, 95(10), 1189-1200. https://doi.org/10.1016/j.agwat.2008.05.006
Peris, R., Gimeno, M. A., Pinazo, D., Ortet, G., Carrero, V., Sanchiz, M., & Ibáñez, I. (2002).
Online chat rooms: Virtual spaces of interaction for socially oriented people.
CyberPsychology & Behavior, 5(1), 43-51. https://doi.org/10.1089/109493102753685872
Pinelle, D., Wong, N. and Stach, T. (2008) ‘Heuristic evaluation for games: usability principles
for video game design’, Proceedings of SIGCHI Conference on Human Factors in
Computing Systems, pp. 1453–1462. doi: 10.1145/1357054.1357282.
Plummer, R., Spiers, A., Summer, R., & FitzGibbon, J. (2008). The contributions of stewardship
to managing agro-ecosystem environments. Journal of Sustainable Agriculture, 31(3), 55-
84. https://doi.org/10.1300/J064v31n03_06
Prager, K., & Freese, J. (2009). Stakeholder involvement in agri-environmental policy making -
Learning from a local- and a state-level approach in Germany. Journal of Environmental
Management, 90(2), 1154-1167. https://doi.org/10.1016/j.jenvman.2008.05.005
Prager, K., Reed, M., & Scott, A. (2012). Encouraging collaboration for the provision of
ecosystem services at a landscape scale-Rethinking agri-environmental payments. Land Use
Policy, 29(1), 244-249. https://doi.org/10.1016/j.landusepol.2011.06.012
Pricing for maps, routes, and places (2019), Retrieved from https://cloud.google.com/maps-
platform/pricing/sheet/

164
Prokopy, L. S., Floress, K., Klotthor-Weinkauf, D., & Baumgart-Getz, A. (2008). Determinants
of agricultural best management practice adoption: Evidence from the literature. Journal of
Soil and Water Conservation, 63(5), 300-311. https://doi.org/10.2489/jswc.63.5.300
Qi, H., & Altinakar, M. S. (2011). A GIS-based decision support system for integrated flood
management under uncertainty with two dimensional numerical simulations. Environmental
Modelling and Software, 26(6), 817-821. https://doi.org/10.1016/j.envsoft.2010.11.006
Qi, H., & Altinakar, M. S. (2011). A conceptual framework of agricultural land use planning
with BMP for integrated watershed management. Journal of Environmental Management,
92(1), 149-155. https://doi.org/10.1016/j.jenvman.2010.08.023
Rao, M., Fan, G., Thomas, J., Cherian, G., Chudiwale, V., & Awawdeh, M. (2007). A web-based
GIS Decision Support System for managing and planning USDA’s Conservation Reserve
Program (CRP). Environmental Modelling and Software, 22(9), 1270-1280.
https://doi.org/10.1016/j.envsoft.2006.08.003
Reimer, A. P., Thompson, A. W., & Prokopy, L. S. (2012). The multi-dimensional nature of
environmental attitudes among farmers in Indiana: Implications for conservation adoption.
Agriculture and Human Values, 29(1), 29-40. https://doi.org/10.1007/s10460-011-9308-z
Reimer, A. P., Weinkauf, D. K., & Prokopy, L. S. (2012). The influence of perceptions of
practice characteristics: An examination of agricultural best management practice adoption
in two indiana watersheds. Journal of Rural Studies, 28(1), 118-128.
https://doi.org/10.1016/j.jrurstud.2011.09.005

165
Richardson, D. (2006). How can agricultural extension best harness ICTs to improve rural
livelihood in developing countries? In ICT in Agriculture: Perspectives of Technological
Innovation (ed) E. Gelb, A. European Federation for Information Technologies in
Agriculture, Food and the Environment p. 14
Rinner, C. (2001). Argumentation maps: GIS-based discussion support for on-line planning.
Environment and Planning B: Planning and Design, 28(6), 847-863.
https://doi.org/10.1068/b2748t
Rogers, E. M. (1995). Diffusion of Innovations, Fourth Edition, the Free Press, New York
Schlossberg, M., & Shuford, E. (2005). Delineating “public” and “participation” in PPGIS.
URISA Journal, 16, 15-26.
Shao, H., Yang, W., Lindsay, J., Liu, Y., Yu, Z., & Oginskyy, A. (2017). An open source GIS-
based decision support system for watershed evaluation of best management practices.
Journal of the American Water Resources Association, 53(3), 521-531.
https://doi.org/10.1111/1752-1688.12521
Sidlar, C. L., & Rinner, C. (2007). Analyzing the usability of an argumentation map as a
participatory spatial decision support tool. Urisa, 19(1), 47-55.
https://doi.org/10.1097/01.smj.0000242748.61025.e3
Sieber, R. (2006). Public participation geographic information systems: A literature review and
framework. Annals of the Association of American Geographers, 96(3), 491-507.
https://doi.org/10.1111/j.1467-8306.2006.00702.x

166
Silva, H. De. (2008). Using ICT to reduce transaction costs in agriculture through better
communication: A case study from Sri Lanka. LIRNEasia, Colombo, Sri Lanka, Available
at: http://www.lirneasia.net/wp-content/up- loads/2008/11/transactioncosts.pdf
Simão, A., Densham, P. J., & (Muki) Haklay, M. (2009). Web-based GIS for collaborative
planning and public participation: An application to the strategic planning of wind farm
sites. Journal of Environmental Management, 90(6), 2027-2040.
https://doi.org/10.1016/j.jenvman.2007.08.032
Smithers, J., & Furman, M. (2003). Environmental farm planning in Ontario: Exploring
participation and the endurance of change. Land Use Policy, 20(4), 343-356.
https://doi.org/10.1016/S0264-8377(03)00055-3
Srivastava, P., Hamlett, J. M., Robillard, P. D., & Day, R. L. (2002). Watershed optimization of
best management practices using AnnAGNPS and a genetic algorithm. Water Resources
Research, 38(3), 3-1–3-14. https://doi.org/10.1029/2001WR000365
Stubbs, M. (2014). Conservation reserve program (CRP): Status and issues. Conservation
Provisions in the 2014 Farm Bill and Associated Issues.
Sugumaran, R., Meyer, J. C., & Davis, J. (2004). A Web-based environmental decision support
system (WEDSS) for environmental planning and watershed management. Journal of
Geographical Systems, 6(3), 307-322. https://doi.org/10.1007/s10109-004-0137-0

167
Tang M.Y. (2006). Design and implementation of a GIS-enabled online discussion forum for
participatory planning, MScE thesis, Department of Geodesy and Geomatics Engineering
Technical Report No. 244, Fredericton (NB), University of New Brunswick.
Tang, T. M., & Coleman, D. J. (2008). GeoDF Bridging the communication gap in online
participatory planning. Revue Internationale de Géomatique, 18(4), 443-470.
https://doi.org/10.3166/geo.18.443-470
Togazzini, B. (1992). 1og on Interface. Reading, MA: Addison-Wesley Publishing Company,
Inc.
Trujillo-Barrera, A., Pennings, J. M. E., & Hofenk, D. (2016). Understanding producers’ motives
for adopting sustainable practices: The role of expected rewards, risk perception and risk
tolerance. European Review of Agricultural Economics, 43(3), 359-382.
https://doi.org/10.1093/erae/jbv038
Turpin, N., Bontems, P., Rotillon, G., Bärlund, I., Kaljonen, M., Tattari, S., … Zahm, F. (2005).
AgriBMPWater: Systems approach to environmentally acceptable farming. Environmental
Modelling and Software, 20(2), 187-196. https://doi.org/10.1016/j.envsoft.2003.09.004
Tyllinen, M. et al. (2016). We Need Numbers!: Heuristic Evaluation During Demonstrations
(HED) for Measuring Usability in IT System Procurement’, in Proceedings of the 2016 CHI
Conference on Human Factors in Computing Systems (pp. 4129–4141). doi:
10.1145/2858036.2858570.

168
Udeigwe, T. K., Eze, P. N., Teboh, J. M., & Stietiya, M. H. (2011). Application, chemistry, and
environmental implications of contaminant-immobilization amendments on agricultural soil
and water quality. Environment International, 37(1), 258-267.
https://doi.org/10.1016/j.envint.2010.08.008
Van Haaren, R., & Fthenakis, V. (2011). GIS-based wind farm site selection using spatial multi-
criteria analysis (SMCA): Evaluating the case for New York State. Renewable and
Sustainable Energy Reviews, 15(7), 3332-3340. https://doi.org/10.1016/j.rser.2011.04.010
Vanclay, F. (1992). The social context of farmers’ adoption of environmentally sound farming
practices. In: Lawrence, G., Vanclay, F., Furze, B. (Eds.) Agriculture, Environment and
Society. Melbourne: Macmillan, pp. 94–121.
Veith, T. L., Wolfe, M. L., & Heatwole, C. D. (2003). Optimization procedure for cost effective
BMP placement at a watershed scale. Journal of the American Water Resources
Association, 39(6), 1331-1343. https://doi.org/10.1111/j.1752-1688.2003.tb04421.x
Veith, T. L., Wolfe, M. L., & Heatwole, C. D. (2004). Cost-effective bmp placement:
optimization versus targeting. Transactions of the ASAE, 47(5), 1585-1594.
https://doi.org/10.13031/2013.17636
Veliz, M., Brock, H. and Neary, J. 2006. Ausable Bayfield Conservation Authority watershed
report card 2007. Ausable Bayfield Conservation Authority. Exeter, Ontario. 104 pp.

169
Weiss, P. T., Erickson, A. J., & Gulliver, J. S. (2007). Cost and Pollutant Removal of Storm-
Water Treatment Practices. Journal of Water Resources Planning and Management, 133(3),
218-229. https://doi.org/10.1061/ (asce)0733-9496(2007)133:3(218)
Werts, J. D., Mikhailova, E. A., Post, C. J., & Sharp, J. L. (2011). An integrated WebGIS
framework for volunteered geographic information and social media in soil and water
conservation. Environmental Management, 13(3), 751-767. https://doi.org/10.1007/s00267-
012-9818-5
Westerman, D. (2008). How do people really seek information about others?: Information
seeking across Internet and traditional communication channels. Journal of Computer-
Mediated Communication. https://doi.org/10.1111/j.1083-6101.2008.00418.x
Xie, H., Chen, L., & Shen, Z. (2015). Assessment of agricultural best management practices
using models: Current issues and future perspectives. Water, 7(3), 1088-1108.
https://doi.org/10.3390/w7031088
Yang, W., & Weersink, A. (2004). Cost-effective targeting of riparian buffers. Canadian Journal
of Agricultural Economics, 52(1), 17-34. https://doi.org/10.1111/j.1744-
7976.2004.tb00092.x
Yang, W., Khanna, M., Farnsworth, R., & Önal, H. (2003). Integrating economic, environmental
and GIS modeling to target cost effective land retirement in multiple watersheds. Ecological
Economics, 46(2), 249-267. https://doi.org/10.1016/S0921-8009(03)00141-1

170
Yang, W., Liu, Y., Ou, C., & Gabor, S. (2016). Examining water quality effects of riparian
wetland loss and restoration scenarios in a southern ontario watershed. Journal of
Environmental Management, 174, 26-34. https://doi.org/10.1016/j.jenvman.2016.03.001
Yang, W., Liu, Y.B., Simmons, E.S., Oginskyy, A., McKague, K., 2013. SWAT modelling of
agricultural BMPs and analysis of BMP cost effectiveness in the Gully Creek watershed.
Final Research Report Submitted to Ausable Bayfield, Conservation Authority and Ontario
Ministry of Agriculture and Food
Yang, W., Sheng, C., & Voroney, P. (2005). Spatial targeting of conservation tillage to improve
water quality and carbon retention benefits. Canadian Journal of Agricultural Economics,
53(4), 477-500. https://doi.org/10.1111/j.1744-7976.2005.00031.x
Yiridoe, E. K., Vyn, T. J., Weersink, A., Hooker, D. C., & Swanton, C. (2000). Farm-level
profitability analysis of alternative tillage systems on clay soils. Canadian Journal of Plant
Science, 80(1), 65-73. https://doi.org/10.4141/P99-004
Young, R. A., Onstad, C., Bosch, D., & Anderson, W. (1989). AGNPS: A nonpoint-source
pollution model for evaluating agricultural watersheds. Journal of Soil and Water
Conservation, 44, 168-173. https://doi.org/citeulike-article-id:13481122
Zhang, Y., Sugumaran, R., McBroom, M., DeGroote, J., Kauten, R. L., & Barten, P. K. (2011).
Web-Based Spatial Decision Support System and Watershed Management with a Case
Study. International Journal of Geosciences, 2, 195-203.
https://doi.org/10.4236/ijg.2011.23021

171
Zhang, Y., Wang, L., & Duan, Y. (2016). Agricultural information dissemination using ICTs: A
review and analysis of information dissemination models in China. Information Processing
in Agriculture, 3(1), 17-29. https://doi.org/10.1016/j.inpa.2015.11.002
Zhou, J. & Civco, D.L. (1996). Using genetic learning neural networks for spatial decision
making in GIS. Photogrammetric Engineering and Remote Sensing, 62, 1287–1295.

172
APPENDIX A
“What if” and Policy/Management Scenarios
Table A.1 shows an example of a “What if” BMP scenario script. From the script, three
main user tasks are identified. At first, farmer Bob develops a “What if” scenario. The “What if”
BMP scenario is developed in two steps: 1) select a BMP and 2) assign the selected BMP to
fields. After he develops the scenario, he requests the system to evaluate the environmental and
economic effects of the “What if” BMP scenario. Then, to know the differences before and after
the BMP implementation, he compares the evaluation results of the “What if” BMP scenario
with those of a historical baseline scenario. Clarifying these tasks in the “What if” BMP scenario
is helpful to identify design problems and streamline the design practices.
Table A.1: An example of "What if" scenario
Objective: Describe “What if” BMP scenario
Actors: Bob (a farmer)
Description:
To evaluate a “What if” BMP scenario, Bob chooses BMPs and assigns those BMPs onto
three fields - field 5, field 11, and field 16. Once the BMPs are assigned to his fields, Bob
requests the system to evaluate the environmental and economic effects of the developed
scenario. Bob examines and explores different variables of the modelling results. Then he
selects a historical baseline scenario to examine what the differences in environmental
benefits and economic costs before and after he implements those BMPs are. The
differences reflect the costs, benefits and cost-effectiveness of BMPs.

173
User task steps: Develop a “What if” scenario, Examine and explore the environmental
and economic effects of the “What if” scenario, Compare the scenario with a baseline
scenario to obtain the costs, benefits and cost-effectiveness of BMPs.
Table A.2 and A.3 are generated to derive key user tasks involved in the
policy/management design. Key user tasks include 1) select the policy/management type (either
economic or environmental), 2) select fields in which BMPs will be applied, 3) choose a
pollutant type, 4) specify the economic constraint or environmental target, 5) run the scenario
optimization to obtain the BMP policy/management information, 6) examine the BMP
policy/management information (a combination of BMPs and fields and the corresponding
economic and environmental effects), and 7) investigate the trade-offs between the BMP costs
and the corresponding environmental benefits.
Table A.2: An example of an economic policy/management scenario
Objective: Design economic policy/management for BMP implementation
Actors: Bob (a conservation manager)
Description:
Bob is a conservation manager in a local conservation agency. His current task is to use
the system to design policy/management to implement BMPs to maximize total
phosphorus (TP) reductions under a financial budget constraint. Because the
policy/management design involves a budget constraint, Bob selects the economic
policy/management type. Then, he selects fields to indicate which fields the
policy/management will be applied to. Because the policy/management aims to
maximize TP reductions, he also selects TP as the environmental objective of the

174
policy/management. Based on the selected policy/management type, pollution type, and
fields, the system suggests a range of economic costs for BMP combinations in those
selected fields. Based on the range, Bob specifies a range of budget (economic
constraint) available for implementing BMPs. After he submits the economic constraint,
the system generates a BMP policy/management scenario which includes the BMP
combinations in the selected fields that can maximize environmental benefits (i.e. TP
reductions) under the budget constraints. Also, the system shows the trade-offs between
the economic costs and TP reductions within the specified budget range.
User task steps: Specify the BMP policy/management type; Select fields; Specify the
economic constraint; Run the scenario optimization; Examine the BMP
policy/management information; Examine the trade-offs between the economic costs
and environmental benefits.
Table A.3: An example of an environmental policy/management scenario
Objective: Design environmental policy/management for BMP implementation
Actors: Bob (a conservation manager)
Description:
Bob is a conservation manager in a local conservation agency. His current task is to use
the system to design policy/management to implement BMPs to reduce the TP loadings.
Because the policy/management design involves an environmental target, Bob selects
the environmental policy/management type. Then, he selects fields to indicate which
fields the policy/management will be applied to. Because the policy/management aims
to reduce the TP loadings, he further selects TP as the pollutant type. Based on the

175
selected policy/management type, pollution types, and fields, the system suggests a
number range to indicate the possible TP abatement from BMP combinations in the
fields. Based on the range, Bob specifies a range of TP abatement the
policy/management aims to achieve. After he submits the TP abatement targets, the
system generates a BMP policy/management result to inform him the BMP
combinations in the selected fields that can meet the environmental target and the
corresponding economic costs. Also, the system shows the trade-offs between the
economic costs and TP reductions of BMPs within the specified TP abatement range.
User task steps: Specify the BMP policy/management type; Select fields; Specify
environmental target; Run the scenario optimization service; Examine the BMP
policy/management information; Examine the trade-offs between the economic costs
and environmental benefits.

176
APPENDIX B
Database Table Design for the WebGIS-based Decision Support System for
Facilitating Agricultural BMP Adoption
Table D.1: Structure of the public annotation table
SoilCondition CropType Lat Lon Map Landmanagment Structural
Table D.2: Structure of the news, policy and BMP technical knowledge table
Title Source Content
Table D.3: Structure of the user table
Name Role Password Email Farm ID
Table D.4: Structure of the scenario table
ScenarioName Description UserName ScnearioID CreationDate BMPConfig
Table D.5: Structure of the BMP configuration table
FieldID ConservationTill CoverCrop NutrientManagement WASCoBs
Table D.6: Structure of the modelling result table
FieldID year Flow Sediment Nitrogen Phosphorous Cost Revenue NetReturn

177
Table D.7: Structure of the optimization result table
FieldID BMP NetReturn WaterChange TNChange TPChange SedimentChange
Table D.8: Structure of the discussion topic table
Scenario Date Title Content UserName TopicID
Table D.9: Structure of the discussion thread table
UserName Reply Date ScenarioID TopicID
Table D.10: Structure of the network table
Source Target Weight Role
Table D.11: Structure of the table for “Policy/Management”
BMP_comb Sed_change Water_change TP_change TN_change
NetReturn_change Revenue_change Cost_change

178
APPENDIX C
HttpRequest Sent to Server Using JavaScript
Table B.1: Request to submit an annotation
$.ajax({ url: '/public/writeannotation, type: post, contentType: 'application/json; charset=utf-8', dataType: 'json', data: Annotation, });
Table B.2: Request to search for information
$.ajax({ url: '/public/publicinformationmanagement, type: post, contentType: 'application/json; charset=utf-8', dataType: 'json', data: Keyword, });
Table B.3: Request for user authorization
$.ajax({ url: '/userauthorization', type: 'post', contentType: 'application/json; charset=utf-8', dataType: 'json', data: User, })
Table B.4: Request for scenario creation
$.ajax({ url: '/private/scenariocreation, type: post, contentType: 'application/json; charset=utf-8', dataType: 'json', data: Scenario,

179
});
Table B.5: Request to maintain the BMP assignment relationship
$.ajax({ url: '/private/scenariodevelopment, type: post, contentType: 'application/json; charset=utf-8', dataType: 'json', data: BMPConfiguration, });
Table B.6: Request to run the scenario evaluation
$.ajax({ url: '/private/scenarioevaluation, type: post, contentType: 'application/json; charset=utf-8', dataType: 'json', data: BMPConfiguration, });
Table B.7: Request to update the scenario evaluation chart
$.ajax({ url: '/private/drawevaluationchart, type: post, contentType: 'application/json; charset=utf-8', dataType: 'json', data: ElementType, });
Table B.8: Request to compare two scenarios
$.ajax({ url: '/private/scenariocomparison, type: post, contentType: 'application/json; charset=utf-8', dataType: 'json', data: BaseScenarioName, });

180
Table B.9: Request for scenario optimization
$.ajax({ url: '/private/scenariooptimization, type: post, contentType: 'application/json; charset=utf-8', dataType: 'json', data:OptimizationParameters, });
Table B.10: Request to update the scenario optimization chart
$.ajax({ url: '/private/drawoptimizationchart, type: post, contentType: 'application/json; charset=utf-8', dataType: 'json', data:OptimizationCurveNumble, });
Table B.11: Request to submit the discussion topic
$.ajax({ url: '/private/discussiontopiccreation, type: post, contentType: 'application/json; charset=utf-8', dataType: 'json', data:DiscussionTopic, });
Table B.12: Request to submit the discussion reply
$.ajax({ url: '/private/discussionthreadmanagement, type: post, contentType: 'application/json; charset=utf-8', dataType: 'json', data:DiscussionReply, });
Table B.13: Request for report generation
$.ajax({ url: '/private/reportgeneration, type: post,

181
contentType: 'application/json; charset=utf-8', dataType: 'json', data:ScenarioResults, });
Table B.14: Request for user registration
$.ajax({ url: '/private/userregistration, type: post, contentType: 'application/json; charset=utf-8', dataType: 'json', data:User, });

182
APPENDIX D
Web Services for the WebGIS-based Decision Support System for Facilitating
Agricultural BMP Adoption
Table C.1: WritePublicAnnotation web service
func WritePublicAnnotation(w http.ResponseWriter, r *http.Request, p httprouter.Params) { ConnectToDatabase(annotationDB) WriteAnnotationToDatabse(p.annotation) }
Table C.2: ReadPublicAnnotation web service
func ReadPublicAnnotation(w http.ResponseWriter, r *http.Request, p httprouter.Params) { ConnectToDatabase(annotationDB) ReadAnnotationsFromDatabse(p.mapName) SendAnnotationsToClient(annotationList) }
Table C.3: PublicInformationManagement web service
func PublicInformationManagement(w http.ResponseWriter, r *http.Request, p httprouter.Params) { ConnectToDatabase(publicinformationDB) SearchInformation(p.keyword) SendMessageToClient(searchresult) }
Table C.4: UserAuthorization web service
func UserAuthorization(w http.ResponseWriter, r *http.Request, p httprouter.Params) { ConnectToDatabase(userDB) FindByName(p.name) If name not exist: error message If name exist: If password not correct: error message If password correct: Role(p.name) If user is farmer/manager: direct the user to BMP planning subsystem If user is administrator: direct the user to administration subsystem }

183
Table C.5: ScenarioCreation web service
func ScenarioCreation(w http.ResponseWriter, r *http.Request, p httprouter.Params) { ConnectToDatabase(scenarioDB) WriteScenarioInformationToDatabase(scenarioDB, p.scnearioInfo) RenderTemplate(scenariodevelopmentHTML) }
Table C.6: ScenarioDevelopment web service
func ScenarioDevelopment(w http.ResponseWriter, r *http.Request, p httprouter.Params) { CreateDatabase(BMPConfigurationDB) WriteBMPConfigurationToDatabase(BMPConfigurationDB, p.BMPConfiguration) RenderTemplate(scenarioevaluationHTML) }
Table C.7: ScenarioEvaluation web service
func ScenarioEvaluation(w http.ResponseWriter, r *http.Request, p httprouter.Params) { CreateDatabase(scenarioevaluationresultDB) evaluationResult = Call(integratedmodel, p.BMPConfiguration) WriteEvaluationResultToDatabase(evaluationResult) WriteMapFile(evaluationResult) }
Table C.8: DrawEvaluationChart web service
func DrawEvaluationChart(w http.ResponseWriter, r *http.Request, p httprouter.Params) { elementResult = ReadDatabase(scenarioevaluationresultDB, p.elementType) SendElementResultToClient(evaluationResult) }
Table C.9: ScenarioComparison web service
func DrawEvaluationChart(w http.ResponseWriter, r *http.Request, p httprouter.Params) { basescenarioResult = ReadDatabase(basescenarioDB, p.basescenarioname) comparisonResult = ResultComparison(basescenarioResult, scenarioevaluationResult) WriteMapFile (comparisonResult) }
Table C.10: ScenarioOptimization web service
func ScenarioOptimization(w http.ResponseWriter, r *http.Request, p httprouter.Params) {

184
optimizationResult = Call(programRoutine, p.parameters) CreateDatabase(scenariooptimizationresultDB) WriteEvaluationResultToDatabase(optimizationResult) WriteMapFile (optimizationResult) SendOptimizationResultToClient (optimizationResult) }
Table C.11: DrawOptimizationChart web service
func DrawOptimizationChart(w http.ResponseWriter, r *http.Request, p httprouter.Params) { optimizationchartInfo = ReadDatabase(scenariooptimizationDB, p.optimizationcurvenumber) SendOptimizationResultToClient (optimizationResult) }
Table C.12: DiscussionTopicCreation web service
func DiscussionTopicCreation(w http.ResponseWriter, r *http.Request, p httprouter.Params) { ConnectToDatabase(discussionDB) WriteDiscussionTopicToDatabase(discussionDB, p.topic) SendNotificationEmail(message) }
Table C.13: DiscussionThreadManagement web service
func DiscussionThreadManagement(w http.ResponseWriter, r *http.Request, p httprouter.Params) { ConnectToDatabase(discussionDB) WriteDiscussionReplyToDatabase(discussionDB, p.reply) UpdateCommunicationNetwork (p.replySender, p.replyReciever) SendNotificationEmail(message) }
Table C.14: ReportGenerator web service
func ReportGenerator(w http.ResponseWriter, r *http.Request, p httprouter.Params) { BMPConfiguration = ReadBMPConfigureation(BMPConfigurationDB) If p.reportType == “HTML”: RenderHTMLReport(p.scenarioResult, BMPConfiguration) If p.reportType == “PDF”: text = GenerateTextReport(p.scenarioResult, BMPConfiguration) CallPandoc(text) }

185
Table C.15: UserRegistration web service
func UserRegistration(w http.ResponseWriter, r *http.Request, p httprouter.Params) { ConnectToDatabase(userDB) WriteUserInfo(p.userInfo) SendNotificationEmail(message) }
Table C.16: ScenarioMonitoring web service
func ScenarioManagement(w http.ResponseWriter, r *http.Request, _ httprouter.Params) { tableInfo = ReadTableInfo(discussionDB) SendTableInfoToClient(tableInfo) }
Table C.17: CommunicationManagement web service
func CommunicationManagement (w http.ResponseWriter, r *http.Request, _ httprouter.Params) { networkInfo = ReadTableInfo(discussionDB) SendTableInfoToClient(networkInfo) }

186
APPENDIX E
Evaluation Feedback Scripts
Table E.1: Feedback script examples from evaluation by direct use
Category Measures Feedback scripts System quality Task completeness
& Learnability I finished all the intended tasks. The public subsystem is easy and fun to use. But I found that the BMP planning subsystem a little bit complex. In particular, the procedure of scenario optimization caused some confusion, such as setting the range of constraints.
Task completeness I tested the system performance under a multi-user situation: running the modelling tasks with 20 users at the same time. The system performance was good. No decline in modelling time was noticed compared to the single user situation.
User interface The system interface is well designed. I had no difficulty in navigating the system.
User interface User controls should be added when operations have dependency relationships. For running the optimization model, the “Range” button should be disabled before other parameters were set, i.e. fields, optimization mode, and pollutant type.
User interface The contrast between the button font color and the button background color should be enhanced. I found it hard to read the white font color on the light blue background.
User interface I liked the responsive web page layout, but found the buttons were not arranged properly under small screen resolutions.
User interface The font size may be too small to read. User interface If images are used to indicate entrances of different
modules, it should be clickable to facilitate the system navigation. Tooltips should also be displayed, when the mouse is hovering over the image, to facilitate the system navigation.
User interface Some animations can be removed such as the animation on buttons, because those animations required extra user operations but did not benefit the task process.
User interface The web interface is not fully compliant with the Accessibility for Ontarian with Disabilities (AODA).

187
Improvement is needed at code level (e.g. add attribute to HTML elements).
Information quality
Accuracy The value of the “What if” BMP scenario evaluation results including total phosphorus, total nitrogen, and sediment should be rounded to 3 decimal places.
Clarity I found it difficult to perceive the difference in field-level BMP evaluation results from the map color gradient, which is not in a gradual order. Checking the numerical results was helpful to understand the difference.
Service quality Responsiveness The system loading was fast. Overall the service responded web service requests in a timely manner. The “What if” BMP scenario evaluation took around 1-2 minutes.
Support The user manual was helpful to explain the operation flow to complete the tasks.
Satisfaction Satisfaction I am satisfied with the overall design of the system. It facilitates the use of modelling functions and supports key information tasks for BMP adoption.
Table E.2 Feedback script examples from evaluation during demonstration
Category Measures Feedback scripts System quality Learnability The BMP planning subsystem can be challenging for
farmers to use due to the complexity of the BMP design and evaluation process. Tooltips or other assistance tools should be integrated into the system to guide user operations and improve the learnability of the system.
Task completeness The system provided a set of useful functions to support user tasks in BMP adoption.
User interface The system interface seems easy to navigate. The interface components are well aligned on the web pages.
Information quality
Accuracy The public subsystem allows users to submit public annotations. But mechanisms need to be developed to control or verify the information quality.
Accuracy The BMP planning information generated from integrated economic-hydrologic model and optimization model needs to be accurate.
Clarity The map should display the stream map layers to provide a more complete geographic context.
Interactivity The system offers different ways to present information using maps, tables and charts.

188
Interactions with maps, tables and charts seem straightforward.
Interactivity Explanations to the modelling and optimization results should be added in the system to facilitate users’ understanding and interaction with the results.
Service quality Responsiveness The system modelling takes approximately 1-2 minutes to generate the evaluation result. Given the model simulates ten years of daily data, the running time is acceptable.
Support A well-documented user manual needs to be integrated into the system to explain and guide user tasks by steps. Video tutorial would also be helpful to support the use of the system
Satisfaction Satisfaction The system has a good interface design and offers good functions.
Satisfaction The BMP planning subsystem provides essential and easy-to-access information for supporting decision making on BMP adoptions.
Satisfaction The automated reporting process is very helpful in BMP planning.
Satisfaction The embedded discussion forum and email functions provide a convenient way for farmers to communicate with conservation managers.
Satisfaction The information center in the public subsystem is useful to provide farmers with locale specific information.
Satisfaction The system can be improved by implementing an online community forum for farmers to conduct general discussions and share experiences on BMP adoption.
Satisfaction The system can be improved by incorporating the historical BMP adoption results.
Satisfaction The system can be improved by migrating the public subsystem to the mobile platform.
Impact Awareness The information center in the public subsystem is useful for providing farmers with local specific BMP information.
Awareness The public subsystem, specifically the public annotation sharing site, can be used as a tool to increase farmers’ environmental awareness.
Knowledge The information center in the public subsystem can be used to improve farmers’ knowledge about BMPs.
Knowledge The BMP planning subsystem provides an effective tool to improve the understanding on the economic and environmental effects of BMPs.

189
Intention to use Intention to use The public subsystem has the potential to be used by government staff to collect and monitor information.
Intention to use Future efforts can be planned to train and engage farmers to use this new technology.
Intention to use The system can be used when visiting farmer to discuss BMP adoptions