© 2012 Alam et al, publisher and licensee Dove Medical Press Ltd. This is an Open Access article which permits unrestricted noncommercial use, provided the original work is properly cited.
International Journal of Nanomedicine 2012:7 5705–5718
International Journal of Nanomedicine
Development and evaluation of thymoquinone-encapsulated chitosan nanoparticles for nose-to-brain targeting: a pharmacoscintigraphic study
Sanjar Alam1
Zeenat I Khan1
Gulam Mustafa1
Manish Kumar2
Fakhrul Islam3
Aseem Bhatnagar4
Farhan J Ahmad1
1Department of Pharmaceutics, Faculty of Pharmacy, Jamia Hamdard, Hamdard Nagar, New Delhi, India; 2Advanced Instrumentation Research Facility, Jawaharlal Nehru University, New Delhi, India; 3Department of Medical Elementology and Toxicology, Neurotoxicology Laboratory, Jamia Hamdard, Hamdard Nagar, New Delhi, India; 4Government of India, Ministry of Defence, Institute of Nuclear Medicine and Allied Sciences, Brig SK Mazumdar Marg, Delhi, India
Correspondence: Farhan J Ahmad Department of Pharmaceutics, Faculty of Pharmacy, Jamia Hamdard, Hamdard Nagar, New Delhi, India 110062 Tel +91 98 9167 4226 Email [email protected]
Abstract: Chitosan (CS) nanoparticles of thymoquinone (TQ) were prepared by the ionic
gelation method and are characterized on the basis of surface morphology, in vitro or ex vivo
release, dynamic light scattering, and X-ray diffractometry (XRD) studies. Dynamic laser light
scattering and transmission electron microscopy confirmed the particle diameter was between 150
to 200 nm. The results showed that the particle size of the formulation was significantly affected
by the drug:CS ratio, whereas it was least significantly affected by the tripolyphosphate:CS
ratio. The entrapment efficiency and loading capacity of TQ was found to be 63.3% ± 3.5%
and 31.23% ± 3.14%, respectively. The drug-entrapment efficiency and drug-loading capacity
of the nanoparticles appears to be inversely proportional to the drug:CS ratio. An XRD study
proves that TQ dispersed in the nanoparticles changes its form from crystalline to amorphous.
This was further confirmed by differential scanning calorimetry thermography. The flat ther-
mogram of the nanoparticle data indicated that TQ formed a molecular dispersion within the
nanoparticles. Optimized nanoparticles were evaluated further with the help of scintigraphy
imaging, which ascertains the uptake of drug into the brain. Based on maximum concentration,
time-to-maximum concentration, area-under-curve over 24 hours, and elimination rate constant,
intranasal TQ-loaded nanoparticles (TQ-NP1) proved more effective in brain targeting compared
to intravenous and intranasal TQ solution. The high drug-targeting potential and efficiency
demonstrates the significant role of the mucoadhesive properties of TQ-NP1.
Keywords: thymoquinone, chitosan, nanoparticles, nose-to-brain targeting, gamma
scintigraphy
IntroductionAlzheimer’s disease (AD) is the most common form of progressive neurodegenerative
disorder and primarily affects the elderly population (50%–60% of the .65-year-old
age group).1 More than 18 million of the global population currently suffers from AD
and this is expected to double by 2025. AD is a major medical and social problem for
developing societies. The etiology of AD involves cognitive dysfunction, primarily
memory loss,2,3 and in later stages it causes language deficits, depression, and behavioral
problems including agitation, mood disturbances, and psychosis.4,5
Moreover, senile plaques, neurofibrillary tangles, oxidative stress, inflammatory
processes, and neurotransmitter disturbances are common diagnostic features found in
the brain of an AD patient. Many promising agents have failed in clinical trials because
of their therapeutic limitations in providing symptomatic relief from cognitive deficits.
An agent that not only improves cognitive functions, but also blocks neuronal loss
in the brain, is urgently needed.6 Alternatively, the use of medicinal plants has been
Dovepress
submit your manuscript | www.dovepress.com
Dovepress 5705
O R I G I N A L R E S E A R C H
open access to scientific and medical research
Open Access Full Text Article
http://dx.doi.org/10.2147/IJN.S35329

International Journal of Nanomedicine 2012:7
another new therapeutic approach in the treatment of AD.7
Most herbal drugs, especially those with a hydrophobic
nature, although possessing excellent potential, fail in
clinical trials because of a lack of safety or poor efficacy.
Although natural products have served as sources for the
majority of drugs, poor oral bioavailability has hindered
their development.7 In traditional and folk medicines, herbal
drugs have been used extensively to enhance cognition and to
alleviate other symptoms associated with AD.8 This approach
has been used in various practices of traditional medicine,
including Ayurveda and Unani, where herbal medication is
frequently prescribed. An ethnopharmacologic approach for
the treatment of AD is expected to be useful in providing
leads to identify plants and potential new drugs.
Recently, thymoquinone (TQ) a major active lipophilic
component of Nigella Sativa (Ranunculaceae) was reported
to have many pharmacological qualities such as its immu-
nomodulation, anticancer, anti-inflammatory, antiasthmatic,
and antioxidant effects. In many reports, the antioxidant and
anti-inflammatory effects showed amelioration of cognitive
deficits and neurodegeneration.9–11
Hydrophobic drugs delivered orally encounter permeabil-
ity problems and hence poor bioavailability. They undergo
chemical and enzymatic degradation in the gastrointestinal
tract and show extensive hepatic first-pass metabolism.
Similarly, various additional factors hinder drug discovery
and the development of an effective delivery of different
therapeutic molecules for the treatment and prevention of
AD. The inability to deliver drugs effectively to the brain is
due to the numerous protective natural barriers surrounding
the central nervous system (CNS) such as the blood–brain
barrier (BBB). These natural barriers also limit the effective-
ness of various potential drug-delivery systems (DDS) based
on transdermal, buccal, and intravenous routes.12,13
Many strategies that include development of DDS,
magnetic drug targeting, and drug carrier systems such as
antibodies, liposomes, or nanoparticles (NPs) have been
developed to overcome these problems. Among the various
DDS, polymeric NPs have attracted great attention as poten-
tial DDS for the CNS because they can efficiently deliver a
wide range of therapeutic molecules to the targeting area.
These NP carrier molecules also fulfill the criteria for con-
trolled and site-specific delivery of a variety of hydrophilic,
hydrophobic natural and synthetic drugs, proteins, vaccines,
and biological macromolecules.14,15
Despite various added advantages, CNS drug-delivery
strategies through the intranasal route have received relatively
little attention. Intranasal drugs are transported along olfactory
sensory neurons to yield significant concentrations in the
cerebrospinal fluid (CSF) and olfactory bulb. Recent evidence
of direct nose-to-brain transport and direct access to CSF of
neuropeptides bypassing the bloodstream has been shown in
human trials, despite the inherent difficulties of delivery.16,17
Intranasal delivery is noninvasive and essentially painless,
does not require sterility regulations, and is readily adminis-
tered by the patient or health professionals. DDS are designed
to promote the localized therapeutic effect and minimize toxic
side effects. This may be achieved by optimizing the amount
and duration of the drug in the vicinity of the target cells while
reducing the drug exposure to nontarget cells.18
Owing to the success of the intranasal DDS, especially for
brain targeting, the present investigation aimed to formulate
a nanoparticulate delivery system for TQ targeted to the brain
through a nasal route to avoid first-pass metabolism and its
distribution to a nontargeted site with sustained action. This
may lead to a decrease in peripheral side effects. The mucoad-
hesive polymeric NPs of TQ that we developed are expected
to offer many advantages over conventional nasal dosage
forms, such as increased nasal residence and possibility of
drug release at a slow and constant rate to the brain.17,19,20
As part of the development studies for TQ delivery into
the brain, the objective of the present study was to simulta-
neously investigate the plasma pharmacokinetics and brain
distribution profiles of the TQ-loaded NPs in Wistar rats
after intravenous and intranasal administration and to assess
whether there is a direct nose-to-brain transport pathway.
Materials and methodsCS with medium molecular weight and degree of deacety-
lation about 96% and sodium tripolyphosphate (TPP) was
purchased from Sigma-Aldrich (St Louis, MO). Potassium
dihydrogen phosphate, methanol, sodium hydroxide (NaOH),
and 1-octanol were all purchased from SD Fine Chemicals,
Ltd (Mumbai, India). Glacial acetic acid was purchased
from IOL Chemical Ltd (Mumbai, India). Methanol high-
pressure liquid chromatography (HPLC) grade, acetonitrile
HPLC grade, and ammonia solution analytical reagent (AR)
grade were also procured from SD Fine Chemicals, Ltd.
A cellophane tube (mol wt cut-off: 12,000 Da, flat with
25 mm, diameter of 16 mm, capacity 60 mL/ft) was obtained
from Sigma-Aldrich. All reagents were of analytical grade.
Preparation of chitosan NPs using ionic gelation methodCS NPs were prepared according to the ionic gelation
process.21,22 Placebo NPs were obtained upon dropwise
submit your manuscript | www.dovepress.com
Dovepress
Dovepress
5706
Alam et al

International Journal of Nanomedicine 2012:7
addition of TPP aqueous solution (2 mg/mL) to a CS solution
(1.5 mg/mL) with continuous stirring at room temperature.
The formation of NPs was a result of the ionic interaction
between the positively charged amino groups of CS and
negative groups of TPP. The ratio of CS/TPP was established
according to the preliminary studies. TQ-loaded NPs were
obtained according to the same procedure and the ratio of
CS/TPP remained unchanged. A variable ratio of TQ was
incorporated in the CS solution prior to the formation of NPs
in order to investigate the effect of the initial TQ concentration
on the NP characteristics and in vitro release profiles. NPs were
collected by centrifugation (Remi, Delhi, India) at 15,000 rpm
for 30 minutes at 4°C and the supernatant was discarded.
Loading capacity, entrapment efficiency, and process yieldsProcess yield (Y) of NPs with desired particle size range and
polydispersity index (PDI) was calculated from the weight
of dried NPs recovered (W1) and the sum of the initial dry
weight of starting materials (W2) as free drug:
YW
W= ×
1
2100. (1)
Similarly, the entrapment efficiency (EE) and loading
capacity (LC) of NPs were determined by ultracentrifuga-
tion at 15,000 rpm, 4°C for 30 minutes. The amount of free
TQ in the supernatant was measured by the reverse phase-
HPLC method (water:methanol:2-propanol::50:45:5% [v:v];
2 mL min–1) at 254 nm reported previously.23 The EE and LC
of NPs were calculated by the following equations and all
measurements were performed in triplicate (n = 3).
%EE =−
×Total drug Free drug
Total drug100 (2)
%LC =−
×Total drug Free drug
Nanoparticle weight100 (3)
Dynamic light scattering (DLS) measurementsThe particle size, particle size distribution, PDI, and zeta
potential were determined by Zetasizer Nano ZS (Malvern
Instruments Ltd, Malvern, UK). The sample volume used for
the analysis was kept constant (1 mL). The particles exhibit
Brownian motion, which causes the intensity of light to scatter
from particles, which is then detected as a change in inten-
sity with suitable optics and a photo multiplier. All the data
analyses were performed in automatic mode with triplicate
measurement within each run. The instrument is well equipped
with appropriate software for particle size analysis and PDI.
Differential scanning calorimetry (DSC) studyDSC analysis of pure TQ, pure CS, physical mixture
(CS + TQ), and freeze-dried TQ-loaded CS NPs was carried
out using a PerkinElmer DSC-7® (PerkinElmer, Inc., Waltham,
MA) calibrated with indium. A 5 mg sample was placed
onto a standard aluminum pan, crimped and heated from
20°C −350°C at a heating rate of 5°C/minute under continuous
purging of nitrogen (20 mL/minute). An empty sealed pan was
used as reference. All samples were run in triplicate.
X-ray diffractometry (XRD)X-ray diffractometry was used to investigate the physical
form (crystalline or amorphous) of drug dispersion within the
matrix of the CS NPs. The XRD experiments were performed
over the range 2θ from 5 to 50°C, using an XRD (PANalytical
X’pert PRO; PANalytical, Almelo, The Netherlands), with
Cu Kα radiation at a scanning speed of 5°/minute.
Transmission electron microscopy (TEM)The surface morphology of the prepared NPs was determined
using TEM. A drop of nanosuspension was placed on a paraffin
sheet and a copper grid was placed on the sample and left for
1 minute to allow the NPs to adhere. The grid was placed on a
drop of phosphotungstate for more than 5 seconds. The remain-
ing solution was removed by absorbing the liquid with a piece
of filter paper and samples were air dried. The samples were
further examined by TEM (Morgagni 268D; FEI Company,
Hillsboro, OR).
Scanning electron microscopy (SEM)The surface texture of the optimized NPs was further confirmed
by SEM (Zeiss EVO40; Carl Zeiss, Cambridge, UK). Samples
were spread over a double-sided conductive tape fixed on to a
metallic stud and coated under vacuum with gold in a Blazers
SCD020 sputter coater unit (BAL-TEC GmbH, Witten, Ger-
many) in an argon atmosphere at 50 mA for 100 seconds.
In vitro release modelingThe in vitro release profile of the TQ suspension and TQ-
loaded CS NPs was performed using dialysis sacs (MWCO
12,000 g/mole; Sigma-Aldrich). Equivalent volume of drug-
loaded CS-TQ NPs (TQ was 4.275 mg) was filled in cellulose
membrane dialysis sacs and study was performed using dis-
solution apparatus 2 (Veego, Mumbai, India) containing 500
submit your manuscript | www.dovepress.com
Dovepress
Dovepress
5707
Thymoquinone-encapsulated chitosan nanoparticles for nose-to-brain targeting

International Journal of Nanomedicine 2012:7
mL of PBS (pH 6.5) at 37°C ± 0.5°C. At predetermined time
intervals, aliquots were withdrawn from the released medium
and replaced with the phosphate buffer. The samples were
analyzed in triplicate using reported HPLC. The data obtained
from in vitro drug release were fitted to various release models
(zero order, first order, Higuchi, and Korsemeyer Peppas) to
understand the possible mechanism of drug release from the
NPs.24
Ex vivo permeation studies on nasal mucosaFresh nasal tissues were carefully removed from the nasal
cavities of goats obtained from the local slaughterhouse. Tissue
samples were fixed in cells displaying a permeation area of
0.785 cm2 (Logan Instrument Corporation, Piscataway, NJ).
Twenty milliliters of phosphate-buffered saline (PBS; pH 7.4)
maintained at 37°C was added to the receptor chamber. After
a preincubation time of 20 minutes, pure drug solution and
formulation equivalent to 5 mg of TQ was placed in the donor
chamber (2 mL) in each case. At predetermined time points,
0.5 mL samples were withdrawn from the receptor chamber,
replacing the sampled volume with PBS over a period of
24 hours. The withdrawn samples were passed through a
membrane filter before analysis. Blank samples (without
TQ) were run simultaneously throughout the experiment to
check for any interference. The amount of permeated drug
was determined using reverse-phase HPLC.
Radiolabeling protocolThe TQ solution and TQ-NP1 were radiolabeled using
technetium (99mTc) by a direct labeling method.17,25 One
milliliter of the TQ solution and TQ-NP1 (5 mg/mL) was taken
separately and stannous chloride dihydrate solution (100 mg
in 100 mL of 0.10 N HCl) was added. The pH was adjusted to
7.0 ± 0.50 using 50 mM sodium bicarbonate solution. To the
resultant mixture, 1 mL of sterile 99mTc-pertechnetate (75 to
400 MBq) was added gradually over a period of 1 minute
with continuous mixing. The resultant mixture was incubated
(30°C ± 0.5°C) for 30 minutes in an inert environment. The
final volume was made up using isotonic (0.90% w/v) saline
solution. The radiochemical purity of 99mTc-TQ solution
(99mTc-labeled TQ) and 99mTc-TQ-NP1 (99mTc-labeled
TQ-loaded CS NP) were determined by instant thin-layer
chromatography (ITLC; Gelman Sciences, Inc, Ann Arbor,
MI) using a previously optimized mobile phase consisting of
acetone (100% v/v). The effect of incubation time, pH, and
stannous chloride concentration on radiolabeling efficiency
were studied to achieve optimum reaction conditions.
The optimized radiolabeled formulations were assessed for in
vitro stability in normal saline solution, rat plasma and in rat
brain homogenate. Finally, the optimized stable radiolabeled
formulations were used to study biodistribution in rats.
Biodistribution and pharmacokineticsAll experiments conducted on animals were approved by
the animal ethical committee of Jamia Hamdard, New Delhi
(Proposal no 635/173/CPCSEA for the purpose of control
and supervision on animals and experiments). Male Wistar
rats aged 5–6 months, weighing between 200–250 g (average
weight 200 g), were selected for the study. Three rats were
used for each formulation per time point (0.25, 0.5, 2, 4, 6,
24 hours). Prior to nasal administration of the formulations,
the rats were anesthetized using chloral hydrate (400 mg/kg,
intraperitoneally) and the formulations were instilled into the
nostrils with the help of a micropipette (100 μL) attached to
a low-density polyethylene tube (0.1 mm internal diameter).
The radiolabeled complex of 99mTc-TQ (100 mCi/100 mL)
containing 500 µg of TQ/25 µL (equivalent to 0.5 mg/200 g
body weight) was administered intranasally in each nostril.10,11,26
The rats were held by their backs in a slanted position during
the intranasal administration of the formulations. The rats
were sacrificed at predetermined time intervals (0.25, 0.5, 2,
4, 6, 24 hours) and blood was collected by cardiac puncture.
Subsequently, different tissues/organs including the brain
were dissected, washed twice using normal saline solution,
made free from adhering tissue/fluid, and weighed. The
radioactivity present in each tissue/organ was measured
using a shielded well-type gamma scintillation counter. The
radiopharmaceutical uptake per gram in each tissue/organ was
calculated as a fraction of the administered dose.17
The pharmacokinetic parameters were derived from
Figure 1(A–C) using Kinetica (version 4.10; Innaphase, Phil-
adelphia, PA) and recorded in Table 1. To evaluate the nose-
to-brain targeting of different formulations, two indices, ie,
brain-targeting efficiency (% DTE) and brain drug-targeting
potential (% DTP) were adopted as mentioned below:25,27
DTE%AUC /AUC
AUC /AUCbrain blood in
brain blood iv
=( )( ) × 100 (4)
In order to more clearly define nose-to-brain direct trans-
port, the brain drug direct transport percentage (DTP%), was
derived from the equation given below:
DTPB B
Bin x
in
% ,=−( )
× 100 (5)
submit your manuscript | www.dovepress.com
Dovepress
Dovepress
5708
Alam et al

International Journal of Nanomedicine 2012:7
where Bx = (B
iv/P
iv) × P
in, B
x is the brain area-under-the-curve
(AUC) fraction contributed by systemic circulation through
the BBB following an intranasal administration; Biv is the
AUC0–24
(brain) following intravenous administration; Piv is
the AUC0–24
(blood) following intravenous administration;
Bin is the AUC
0–24 (brain) following intranasal administra-
tion; and Pin is the AUC
0–24 (blood) following intranasal
administration.
Statistical analysisAll data are reported as mean ± standard error of mean and the
differences between the groups were tested using Student’s
t-test at a significance level of P , 0.05. More than two
groups were compared using analysis of variance and the
difference of P , 0.05 was considered significant.
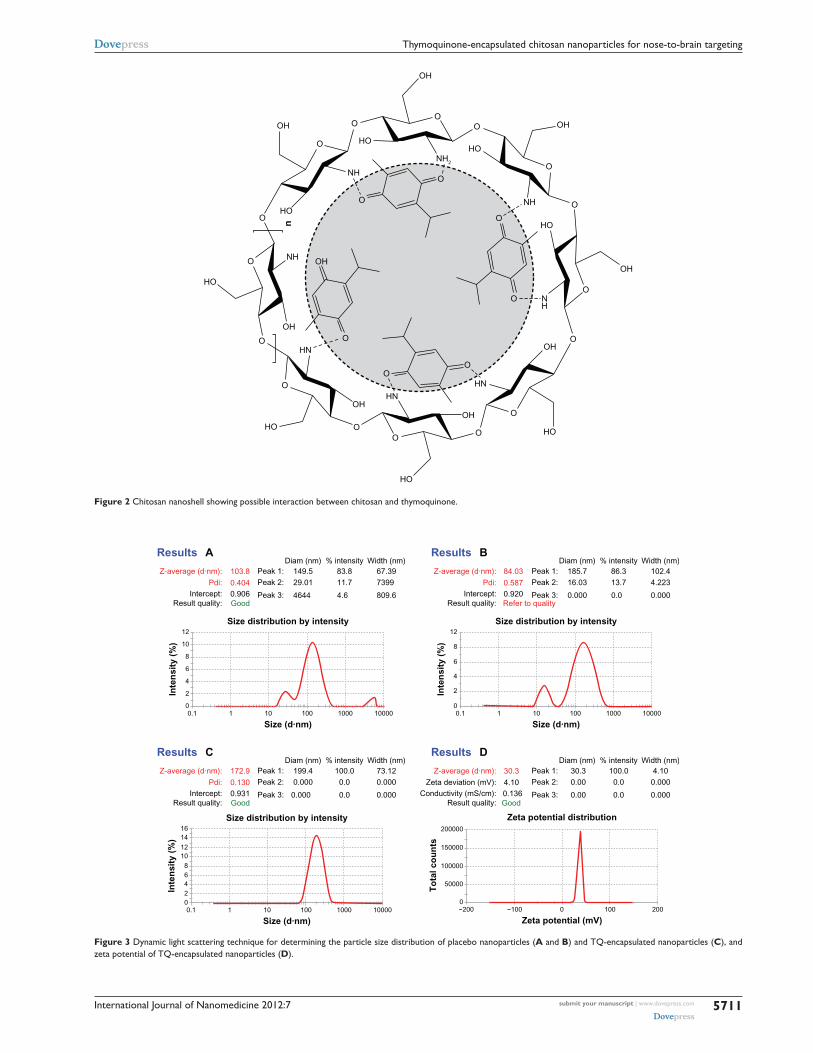
Results and discussionFormulation selectionBased on previously published literature, different trial
compositions were performed to obtain an optimized
formulation primarily on the basis of clarity and system
aggregation (Table 2) and later with improved performance
of minimum particle size and PDI, high process yield, EE,
and LC (Table 3). High EE may be the consequence of
an ionic interaction between negatively charged TQ with
positively charged CS (Figure 2). Among various trials, the
selected formulation S-3C (103.7 nm, 0.404, and 54.43%)
had a smaller minimum particle, optimum PDI, and higher
process yields than S-3A (368 nm, 0.215, and 44.86%)
and S-3B (227 nm, 0.382, and 47.71%), respectively.
Although S-4C, S-5C, and S-6B had a greater process
30
25
20
15
10
5
00.25 0.5 2 4
Time (h)
Biodistribution of intravenous API solution
% r
adio
co
un
ts/g
m o
rgan
6 24
20
15
10
5
00.25 0.5 2 4
Time (h)
Biodistribution of intranasal chitosan nanoparticle
% r
adio
co
un
ts/g
m o
rgan
wei
gh
t
6
Blood
Brain
Heart
Lungs
Liver
Spleen
Kidney24
18
14
16
12
10
8
4
6
2
00.25 0.5 2 4
Time (h)
Biodistribution of intranasal API solution
% r
adio
co
un
ts/g
m o
rgan
6 24
A
C
B
Figure 1 Biodistribution study of (A) TQ solution (intravenous), (B) TQ solution (intranasal), and (C) chitosan nanoparticles encapsulating TQ (intranasal).
Table 1 Pharmacokinetic profile of different formulations
Formulations Organ Cmax (count/g) Tmax (hr) AUC0→24 AUC0→infKel (h
–1) T1/2 (h)
TQ-NP 1 (intranasal) Brain 2417.17 0.5 34074.377 41553.62 0.0696 12.62Blood 5453.73 0.5 57367.617 66666.795 0.0985 7.0355
TQ solution (intravenous) Brain 242.88 2 2112.66 2309.37 0.1009 7.492Blood 30254.39 0.5 118220.82 121310.32 0.156 4.376
TQ solution (intranasal) Brain 1717.74 2 2677.54 20318.97 0.0866 10.76Blood 4283.04 2 55383.78 69560.85 0.0929 9.489
Abbreviations: AUC0–24, area under the curve; Cmax, maximumconcentration; Kel, elimination rate constant; NP, nanoparticle; Tmax, time at which concentration is maximum; TQ, thymoquinone.
submit your manuscript | www.dovepress.com
Dovepress
Dovepress
5709
Thymoquinone-encapsulated chitosan nanoparticles for nose-to-brain targeting

International Journal of Nanomedicine 2012:7
yield than S-3C, the particle size was above 200 nm. Some
formulations have low process yield whereas some have
a higher yield due to low and high concentrations of CS,
respectively. Therefore, S-3C was chosen as the optimized
formulation of TQ-NPs. The above findings conclude that a
unique ratio of CS:TPP (1.25–1.87) showed a particle size
below 200 nm with a percentage yield greater than 25%
whereas CS:TPP ratios exceeding the above limit showed
a larger variability in particle size and percentage yield
(Table 3). These findings are also in agreement with earlier
reports that the ratio between CS and TPP is an important
factor controlling the size distribution and process yield
of NPs.28 Although the minimum particle size obtained
was 84.03 nm, containing 0.5 mg/mL CS and 1.5 mg/mL
TPP (Figure 3), the low percent yield (18.78%) limits its
applicability (Table 3). The mean particle size of optimized
placebo NPs containing 1.5 mg/mL CS and 2 mg/mL
TPP was found to be 103.6 nm. A comparative evaluation
of particle size, PDI, and percentage yields of different
preliminary formulations is listed in Table 3. On the basis
Table 2 Results showing effects of different concentration of CS and TPP
Formulation code
Concentration of CS (mg/mL)
S no Concentration of TPP (mg/mL)
Visual observation
S-1 0.5 A 1 ClearB 1.5 ClearC 2 Milky with aggregatesD 3 Milky with aggregates
S-2 1.0 A 1 ClearB 1.5 ClearC 2 AggregatesD 3 Aggregates
S-3 1.5 A 1 Opalescent without pptB 1.5 Opalescent without pptC 2 Opalescent without pptD 3 Milky with aggregates
S-4 1.75 A 1 ClearB 1.5 Opalescent with pptC 2 Opalescent without pptD 3 Milky with aggregates
S-5 2.0 A 1 ClearB 1.5 ClearC 2 Opalescent without pptD 3 Aggregate
S-6 2.25 A 1 Clear
B 1.5 Clear
C 2 Opalescent without ppt
D 3 Aggregate
Abbreviations: CS, chitosan; ptt, precipitate; TPP, tripolyphosphate.
Table 3 Particle size and particle size distribution of placebo formulations
Formulation code Concentration of CS (mg/mL)
Concentration of TPP (mg/mL)
Mean particle size (nm ± SD)
Mean (PDI ± SD)
Percent (yield ± SD)
S-1C 0.5 1 106.7 ± 8.0 0.395 ± 0.045 25.21 ± 2.30S-1D 0.5 1.5 84.08 ± 8.03 0.587 ± 0.032 18.78 ± 3.46S-2C 1 1 248.5 ± 5.6 0.253 ± 0.032 33.41 ± 5.13S-2D 1 1.5 174 ± 4.0 0.333 ± 0.022 30.88 ± 2.24S-3A 1.5 1 368.3 ± 6.6 0.215 ± 0.013 62.86 ± 3.56S-3B 1.5 1.5 227.1 ± 9.2 0.382 ± 0.035 57.71 ± 2.50S-3C 1.5 2 103.7 ± 8.02 0.404 ± 0.012 54.43 ± 3.12S-4C 1.75 2 201.7 ± 7.6 0.595 ± 0.065 56.03 ± 3.09S-5C 2 2 224.2 ± 8.6 0.623 ± 0.065 59.55 ± 2.37S-6B 2.25 2 279.6 ± 5.8 0.537 ± 0.023 61.23 ± 3.25
Abbreviations: CS, chitosan; TPP, tripolyphosphate; PDI, polydispersity index; SD, standard deviation.
submit your manuscript | www.dovepress.com
Dovepress
Dovepress
5710
Alam et al
International Journal of Nanomedicine 2012:7
Results A
Z-average (d·nm): 103.8Pdi: 0.404
Intercept: 0.906
Peak 1: 149.5Peak 2: 29.01
Peak 3: 4644
83.811.7
4.6
67.39Diam (nm) % intensity Width (nm)
7399
809.6Result quality: Good
Results B
Z-average (d·nm): 84.03Pdi: 0.587
Intercept: 0.920
Peak 1: 185.7Peak 2: 16.03
Peak 3: 0.000
86.313.7
0.0
102.4Diam (nm) % intensity Width (nm)
4.223
0.000Result quality: Refer to quality
Results C
Z-average (d·nm): 172.9Pdi: 0.130
Intercept: 0.931
Peak 1: 199.4Peak 2: 0.000
Peak 3: 0.000
100.00.0
0.0
73.12Diam (nm) % intensity Width (nm)
0.000
0.000Result quality: Good
Results D
Z-average (d·nm): 30.3Zeta deviation (mV): 4.10
Conductivity (mS/cm): 0.136
Peak 1: 30.3Peak 2: 0.00
Peak 3: 0.00
100.00.0
0.0
4.10Diam (nm) % intensity Width (nm)
0.000
0.000Result quality: Good
00.1 1 10 100
Size (d·nm)
Size distribution by intensity
Inte
nsi
ty (
%)
1000 10000
2
4
6
8
10
12
00.1 1 10 100
Size (d·nm)
Size distribution by intensity
Inte
nsi
ty (
%)
1000 10000
2468
1012
1416
00.1 1 10 100
Size (d·nm)
Size distribution by intensity
Inte
nsi
ty (
%)
1000 10000
2
4
6
8
12
0−200 −100 0
Zeta potential (mV)
Zeta potential distribution
To
tal c
ou
nts
100 200
50000
100000
150000
200000
Figure 3 Dynamic light scattering technique for determining the particle size distribution of placebo nanoparticles (A and B) and TQ-encapsulated nanoparticles (C), and zeta potential of TQ-encapsulated nanoparticles (D).
O
O
O
OO
O
O
O
O
O
O
O
OO
O
O
OO
O
O
O
O
O
HO
HO
HO
HO
HO
HO
HO
HO
NH
NH
nNH
HN
HN
HN
NH2
NH
OH
OH
OH
OH
OH
OHOH
OH
OH
Figure 2 Chitosan nanoshell showing possible interaction between chitosan and thymoquinone.
submit your manuscript | www.dovepress.com
Dovepress
Dovepress
5711
Thymoquinone-encapsulated chitosan nanoparticles for nose-to-brain targeting

International Journal of Nanomedicine 2012:7
of the above findings, S-3C was considered an optimized
formulation.
The effects of drug concentration on particle size, PDI,
EE, and LC of optimized TQ-NPs are summarized in Tables 4
and 5. It was observed that, upon increasing the drug: poly-
mer ratio from 1 to 3, the average size of TQ-loaded NPs
increased from 172.4 ± 7.4 (TQ-NP1) to 281.3 ± 4.7 nm
(TQ-NP3). Increasing drug proportions in solution caused
a reduction of CS and TPP interaction, which leads to an
increased NP size. The increase in drug concentration also
slightly increases the PDI value (0.24 [TQ-NP3] . 0.22
[TQ-NP2] . 0.130 [TQ-NP1]) with a decrease in percent-
age yield (42.12 [TQ-NP3] , 47.82 [TQ-NP2] , 53.42
[TQ-NP1]) (Table 4). The surface charge of optimized TQ-
loaded NPs was found to be positive, indicating the partial
stabilization of cationic charge of CS by anionic charged
TPP.22 The positive surface charge will also support better
interactions with the negatively charged biomembrane.29
This will be discussed in detail in the section on surface
morphology.
LC and EE of TQ-loaded chitosan NPsThe EE and LC increased from 28.1% to 63.3% and 19.23%
to 31.23%, respectively, depending upon the drug:polymer
ratio (Table 5). The above data clearly shows that the 1:1
drug:polymer ratio shows better entrapment and LC. With
the increase in initial CS concentration during the entrap-
ment process, more protonized CS (–NH3
+) were available
in the system, as shown by increased surface charge, which
leads to a stronger electrostatic attraction between TQ
(negative charge) and CS (positive charge) (Figure 2). This
high polymer concentration leads to an increase in binding
sites for TPP with high EE. When the drug:polymer ratio
increased, the ionic interaction between CS and TPP was
hindered by drug molecules and hence led to lower entrap-
ment and larger particle size (Tables 4 and 5). This finding
seems to be in agreement with Mohanraj and Chen: the
higher the drug concentration, the lower the entrapment
and LC.30
Dynamic light scattering (DLS) measurementsFigure 3A and B show the particle size distribution of
placebo-optimized CS NPs, whereas Figure 3C shows the
TQ-loaded NPs. The size of the CS NPs could be influenced
by factors such as TPP:CS ratio and concentration of CS.
These trends show that the NP size was directly dependent
on concentration and drug loading. The droplet size of the
CS-based NPs was the smallest when the TQ:CS ratio was
1:1, whereas the droplet size was maximized by increasing the
ratio to 3:1. Their droplet sizes at this concentration ratio were
172 and 281 nm, respectively (Table 4). The NPs showed a
positive surface electric charge (measured by zeta potential),
which varied depending on the proportion of CS and TQ
(Figure 3D). Because of enough protonated amine groups
remaining, the process of the ionic crosslinking occurs more
easily for CS with a high degree of deacetylation. The data
of mean particle size and zeta potential are listed in Table 4.
The surface charge is the critical parameter on the stability of
the nanosuspension and bioadhesion of particulate systems
on biological surfaces. CS NPs are all positively charged,
which is a typical characteristic of CS:TPP particles. This
Table 4 Particle size and particle size distribution of drug-loaded formulation
Code Drug:polymer ratio
Concentration of CS (mg/mL)
Concentration of TPP (mg/mL)
Mean particle size (nm ± SD)
Mean zeta potential (mv ± SD)
Mean (PDI ± SD)
Percent (yield ± SD)
TQ-NP1 1:1 1.5 2 172.4 ± 7.4 30.3 ± 2.15 0.130 ± 0.065 53.42 ± 4.62TQ-NP2 2:1 1.5 2 255.4 ± 5.6 27.6 ± 1.07 0.22 ± 0.045 47.82 ± 5.13TQ-NP3 3:1 1.5 2 281.3 ± 4.7 24.5 ± 3.18 0.24 ± 0.064 42.12 ± 4.68
Abbreviations: TQ-NP, thymoquinone nanoparticles; CS, chitosan; TPP, tripolyphosphate; PDI, polydispersity index; SD, standard deviation.
Table 5 Effect of TQ concentration on EE and LC
Code Volume of CS added (mL)
Volume of TPP added (mL)
Concentration of CS (mg/mL)
Concentration of TPP (mg/mL)
Concentration of drug added (mg)
Drug:polymer ratio
EE ± SD (%)
Percent LC ± SD
TQ-NP1 10 4 1.5 2 15.0 1:1 63.3 ± 3.5 31.23 ± 3.14TQ-NP2 10 4 1.5 2 30.0 2:1 42.6 ± 4.2 26.67 ± 2.78TQ-NP3 10 4 1.5 2 45.0 3:1 28.1 ± 3.8 19.23 ± 1.84
Abbreviations: TQ-NP, thymoquinone nanoparticles; CS, chitosan; TPP, tripolyphosphate; PDI, polydispersity index; SD, standard deviation; EE, entrapment efficiency; LC, loading capacity.
submit your manuscript | www.dovepress.com
Dovepress
Dovepress
5712
Alam et al

International Journal of Nanomedicine 2012:7
quality can be explained by the particle formation mechanism
since the cationic charged amine groups are neutralized by
their interaction with the anionic charge of TPP molecules.
The residual amino groups are responsible for the positive
potential.
A higher zeta potential in a certain range (24–30 mV)
signifies the stability of CS NPs (Figure 3D and Table 4).
It also signifies a hindrance imposed by long-chain amino
groups and an anion adsorption to keep the high value of
the electrical double layer thickness, thus preventing the
aggregation. The zeta potentials in three batches of TQ-
NPs are over +20 mV. The positive surface charge of NPs
will improve the interaction, especially with the mucosal
Figure 4 Transmission electron (A) and scanning electron (B) microscopy study of optimized nanoparticles.
surfaces, which carry negative surface charge. This way,
the biologically active molecule will act favorably on the
target tissues.
Surface morphology (TEM and SEM study)The shape and surface texture of the NPs could be detected
using a number of sophisticated techniques such as TEM or
SEM, respectively. NPs showed a round and smooth surface
in TEM. The morphology of TQ-loaded CS-NPs as prepared
is shown in Figure 4A and B. NP size was determined by
TEM, which proved its sphericity. The particle size ranged
between 150 and 200 nm (Figure 4A). The SEM of NPs
proved their smooth surface texture (Figure 4B). Elec-
tron microscopy and DLS studies (Figure 3A–C) further
corroborated the NP size.
Differential scanning calorimetry (DSC)The DSC thermograms of TQ, physical mixture of TQ-CS,
and CS- and TQ-encapsulated TQ-NPs, respectively, are
shown in Figure 5A. An experimental study showed a sharp
and well-defined endothermic peak at ∼46.59°C equivalent
to the melting point of TQ followed by an endothermic
broad band at 146.7°C corresponding to the decomposi-
tion process, and ending at 160°C. Similarly, the physical
mixture of TQ-CS showed the characteristic peaks of CS
and TQ, which was absent in TQ-encapsulated CS NPs.
Drug-loaded NPs showed a very small exothermic peak,
whereas the polymer showed a predominant endothermic
peak at 132.41°C, the drug had an endothermic peak at
126.053°C, and the physical mixture showed both drug
and polymer peaks. No peak of TQ and CS was visible
in the TQ-loaded NPs. This finding suggests that TQ is
molecularly dispersed within the CS NPs showing the
amorphous nature that further authenticates the entrap-
ment of TQ.28,31
X-ray diffractometry (XRD)In order to identify the physical state of the drugs incor-
porated in CS NPs, XRD was performed and the patterns
of TQ, CS, and the physical admixture of TQ-CS as well
as TQ encapsulated CS NPs are shown in Figure 5B(a–d).
Powder diffraction data were collected at room temperature
in the 2θ range 5.5° to 57.058° (d = 11.451–1.495 Å).
Figure 5B represents the characteristic diffraction pattern
of TQ at 6.7 Å. In the XRD patterns of the TQ-CS NPs, the
characteristic peaks at 2θ = 12.09°, 18.65°, and 24.26° can be
attributed to the crystalline structure of CS which is missing
in TQ-encapsulated NPs (Figure 5B). TQ probably formed a
Table 6 Coefficient of correlation for optimized CS NPs
Release model Equation Coefficient of correlation (R2)
Zero order Ct Co kt= + 0.815
First order log Ct log Co kt / 2.303= + 0.964
Higuchi model Q k t= 0.981
Peppas model log(Mt /M ) logk n logt/2.303∞ = + 0.970Release exponent (n) 0.43 , n , 0.85
Notes: Since the coefficient of correlation (R2) for the Higuchi model was nearer to unity (ie, 0.981) for the TQ-loaded CS NPs, the best-fit model for TQ-loaded CS NPs was the Higuchi model.Abbreviations: Ct, cumulative amount of drug release; Co, initial amount of drug; k, release constant; CS, chitosan; Mt/M∞, fraction of drug release; n, release exponent; NPs, nanoparticles; Q, fraction drug release; t, time; TQ, thymoquinone.
submit your manuscript | www.dovepress.com
Dovepress
Dovepress
5713
Thymoquinone-encapsulated chitosan nanoparticles for nose-to-brain targeting

International Journal of Nanomedicine 2012:7
molecular dispersion or an amorphous nanodispersion within
the CS matrix of the NPs.32
In vitro release modelingThe release profile of TQ from optimized CS NPs showed a
sustained release pattern. It was observed that the released
TQ primarily showed a rapid initial release (burst release)
followed by a characteristic slow-release pattern. The initial
rapid release of drug may be due to release of TQ from the
NP surface, while at a later stage, TQ may be constantly
released from the core of NPs as a consequence of CS
00 6 12 16 24
10
% p
erm
eati
on
20
30
40
50
60
TQ-NP1 TQ-NP2 TQ-NP3 API suspension
70
Time (h)
Ex vivo permeation
Figure 6 Ex vivo permeation of nanoparticles using porcine nasal mucosa.
50
Inte
nsi
ty
Position [°2 theta]
30025020015010050−1−1
5
10
15
20
25
30
35
40
45
Hea
t fl
ow
en
do
up
(m
W)
50
53.85
Temperature (°C)
a
b
c
d
a
b
c
d
40302010
A
B
Figure 5 Differential scanning calorimetry (A) and X-ray diffraction spectroscopy (B) of thymoquinone (a), chitosan (b), physical mixture of thymoquinone–chitosan (c), and thymoquinone containing chitosan nanoparticles (d), respectively.
Table 7 In vitro radiolabeling stability in normal saline, rat plasma, and in rat brain homogenate
Sampling time (minutes)
Percentage of radiolabeling (retained)
Saline Plasma Brain homogenate
0.25 99.79 ± 2.6 97.57 ± 2.06 98.55 ± 2.960.5 99.74 ± 0.75 97.56 ± 3.12 98.68 ± 1.811 99.65 ± 1.95 97.45 ± 2.35 98.53 ± 2.122 99.43 ± 1.76 97.41 ± 2.76 97.48 ± 3.283 99.41 ± 2.61 97.31 ± 3.21 97.24 ± 2.774 99.34 ± 2.57 97.21 ± 3.43 97.42 ± 1.975 98.77 ± 4.3 96.84 ± 2.71 97.21 ± 3.326 98.74 ± 4.65 95.68 ± 4.05 96.79 ± 4.638 98.52 ± 4.02 95.46 ± 5.11 96.37 ± 1.0122 97.47 ± 3.16 95.15 ± 5.16 96.25 ± 5.2924 97.39 ± 4.26 95.07 ± 4.28 96.12 ± 3.52
submit your manuscript | www.dovepress.com
Dovepress
Dovepress
5714
Alam et al

International Journal of Nanomedicine 2012:7
hydration and swelling.33 The release pattern was further
confirmed by applying the release kinetic to ascertain the
release order (Table 6). Among various models tried, the
coefficient of correlation (R2) for the Higuchi model was
near to unity (ie, 0.981), therefore the best-fit model for
TQ-NPs was the Higuchi model. When the release data
were analyzed using the Korsmeyer–Peppas equation, the
value of the release exponent n was between 0.43 and 0.85
(Table 6), which is an indication of both diffusion-con-
trolled and swelling-controlled drug release, ie, anomalous
transport.33
Ex vivo permeation studies on nasal mucosaThe TQ-loaded CS NPs showed more permeation compared
to the pure drug solution (Figure 6). The significant differ-
ence in permeation profile (P . 0.001) of the optimized for-
mulation TQ-NP1 might be due to the permeation-enhancing
activity of CS. The maximum permeation in 24 hours
was found to be .60% whereas API was only 20.39%.
The increase in permeation of TQ could be attributed to
an interaction of a positively charged amino group on the
carbon two position of CS with negatively charged sites on
the cell membranes. Similarly, one possible mechanism may
be related to the tight junction permeability of the mucosal
epithelial cells.34 A justification for the least permeability
of pure drug solution might be its hydrophobicity and
possessing negative surface charge. Similarly, Richter and
Keipert suggested that the drug should be lipophilic for
better permeation through nasal mucosa.35 The smaller size
(,200 nm) and surface hydrophobicity of TQ-loaded CS
NPs may support better partitioning through the biological
membrane. Finally, on the basis of smaller particle size,
higher percentage yield, better EE as well as LC, and rela-
tively enhanced permeation profile, TQ-NP1 was selected
as the final optimized formulation.
Radiolabeling stability studyTQ-NP1 effectively radiolabeled with 99mTc was optimized
for maximum labeling efficiency and stability in normal
saline, rat plasma, and in rat brain homogenate for 24 hours.
The optimal SnCl2⋅2H
2O concentration was found to be
100 mg/mL at pH 7.0 with an incubation time of 30 minutes.
The radiolabeling stability achieved was 97.39 ± 4.26,
95.07 ± 4.28, and 96.12 ± 3.52 in normal saline, rat plasma,
and rat brain homogenate, respectively (Table 7). The results
suggested a high bonding strength and stability of 99mTc-
TQ-NP1. Therefore, 99mTc-TQ-NP1 were found suitable for
biodistribution studies in rats. The results obtained are also
in agreement with the earlier findings.17,25,27
Biodistribution and pharmacokinetic studyThe biodistribution pattern and different pharmacokinetic
properties of intranasal administered NPs was evaluated using
scintigraphic imaging. Scintigraphic imaging was performed
using a gamma camera and the activity counts (TQ-TC99m) in
different organs such as brain, liver, kidney, spleen, heart, and
lungs were performed with a gamma counter. Figure 1A–C
shows the concentration of 99mTC in different organs after the
administration of intravenous 99mTC-TQ solutions, intranasal 99mTC-TQ solution, and intranasal 99mTC-TQ-NP. The pres-
ent investigation observed that the tissue concentration in
the form of counts (99mTC) was higher in the brain with the
intranasal administration of TQ-NP in comparison to the TQ
solution after intravenous and intranasal administration. The
above finding might be due to existence of direct nose-to-
brain transport bypassing the BBB.36,37 Similar to systemic
organs, the concentration of TQ-NP was higher in the brain
compared to the TQ intranasal solution. This finding might
be the combined upshot of the nanometric size range and
mucoadhesive nature of the formulation. The special mucoad-
hesive property of CS will decrease mucociliary clearance,
whereas the conventional intranasal formulation rapidly exits
the nasal tract. The concentrations of 99mTC-loaded TQ-NPs
in the liver when administered intravenously was higher
compared to intranasal 99mTC-loaded TQ-NPs and 99mTC
solution because of the presence of the reticuloendothelial
system (Figure 1). A similar pattern of 99mTC-loaded TQ-NP
distribution was also obtained in the lungs and in kidney.17,25,27
The higher concentrations of 99mTC achieved in the highly
perfused organs, such as liver, lungs, and kidney are probably
due to the combined activity of the circulating blood passing
through the organs as well as particle uptake by reticuloen-
dothelial system cells. The above results further support the
Table 8 Nose-to-brain drug-targeting parameters of different formulations
Formulations Brain-targeting efficiency (DTE%)
Direct nose-to-brain transport (DTP%)
Relative bioavailability
TQ-NP 1 (intranasal)
3318.24 ± 65.79 96.99 ± 3.64 16.13 ± 0.87
TQ solution (intranasal)
206.94 ± 18.73 53.57 ± 8.34 1.26 ± 0.079
TQ-NP 1 (intravenous)
0.0179 ± 0.0023 – –
Abbreviations: NP, nanoparticle; TQ, thymoquinone.
submit your manuscript | www.dovepress.com
Dovepress
Dovepress
5715
Thymoquinone-encapsulated chitosan nanoparticles for nose-to-brain targeting

International Journal of Nanomedicine 2012:7
earlier finding by Wang et al after intranasal administration
of CS NPs.18,38
The highest bioavailability in the brain might be the
consequences of drug uptake from the nasal mucosa via three
proposed pathways (Figure 1). One is the systemic pathway by
which some of the drug is absorbed into the systemic circula-
tion and subsequently reaches the brain by crossing the BBB.
The others are the olfactory pathway and the trigeminal neural
pathway by which partly the drug travels directly from the
nasal cavity to the CSF and brain tissue.39 We can conclude that
the amount of drug reaching the brain tissue after intranasal
administration is attributed to these three pathways.20,40–42
The pharmacokinetic parameters (Tables 1 and 8) were
also calculated from a time-to-99mTC-activity graph (Figure 7).
Intranasal administration of TQ-NP1 showed lower Tmax
for
brain (0.5 hours) compared to blood (2 hours). This may be
attributed to preferential nose-to-brain transport following
intranasal administration, which correlates with reports in
the literature.16,39–42 The brain:blood ratio of the drug was
found to be higher for the TQ-NP1 formulation over the
intranasal TQ solution (Table 1 and Figure 1). Similarly, the
brain:blood ratio of the drug were higher for the intranasal
TQ solution compared to the intravenous TQ solution. This
finding further proved the significant role of the olfactory lobe
in direct nose-to-brain transport. The concentrations of the
drug in the brain following intranasal administration of TQ
solution and TQ-NP1 were significantly higher (P . 0.005)
at all sampling time points (24 hours) compared to the intra-
venous TQ solution. Moreover, following intranasal TQ-NP1,
the drug concentrations in the brain were sustained for
2–3 hours, which was lacking in TQ solution (intranasal and
intravenous). The substantially higher uptake in the brain after
intranasal administration suggests a larger extent of selective
transport of TQ-NP1 from nose-to brain. The formulations
showed a significant difference in Tmax
(0.5 and 2 hours),
Cmax
(242.88, 1717.74, and 2417.17 counts) and Kel (0.101,
0.086, and 0.0696 counts/hour) for intravenous TQ solution,
intranasal TQ solution, and intranasal TQ-NP1, respectively.
Significantly lower Cmax
(P . 0.01) and AUC (P . 0.005)
for the intranasal TQ solution may be due to the mucociliary
clearance under normal circumstances, which rapidly clears
the instilled formulation. On the other hand, TQ-NP1 which
shares an intrinsic mucoadhesive property showed a significant
improvement in Cmax
and AUC. This demonstrates the value of
the mucoadhesive agent in prolonging the contact time of the
formulation with the nasal mucosa. The significantly higher
AUC and Cmax
for TQ-NP1 compared to the TQ solution is
attributed to the importance of nanoparticulate carriers.
Similarly, different nose-to-brain targeting parameters
(Table 8) were calculated with the help of pharmacokinetics
00 5 10
Time (hr)
Co
un
ts/g
m
Biodistribution of intravenous API solution
15 20 25
8000
16000
24000
32000
00 5 10
Time (hr)
Biodistribution of intravenous API solution
15 20 25
100
200
300
00 5 10
Time (hr)
Co
un
ts/g
m
Co
un
ts/g
mC
ou
nts
/gm
Biodistribution of intranasal API solution
15
Plasma activity Plasma activity
Blood activity
Brain activity
Brain activity
20 25
1000
2000
3000
4000
5000
00 5 10
Time (hr)
Biodistribution of intranasal nanoparticle
15 20 25
3000
6000
9000
Brain activity
Figure 7 Concentration–time profile of thymoquinone (TQ) in plasma and brain after intravenous administration of TQ solution and intranasal administration of TQ solution and TQ nanoparticles, respectively (anti-clockwise).Abbreviation: API, active pharmaceutical ingredient.
submit your manuscript | www.dovepress.com
Dovepress
Dovepress
5716
Alam et al

International Journal of Nanomedicine 2012:7
parameters as shown in Table 1. DTP (%) represents the
percentage of drug directly transported to the brain via
the olfactory pathway and the trigeminal neural pathway.
The TQ-NP1 showed significantly high (P . 0.001) DTE
(%) and DTP (%) values among all the other formulations.
The almost 15-fold higher DTE (%) and twofold higher
DTP (%) for TQ-NP1 compared to the intranasal TQ
solution shows the benefit of the mucoadhesive formula-
tion (Table 8). The higher DTE (%) and DTP (%) suggest
that TQ-NP1 has better brain targeting efficiency mainly
because of substantial and direct nose-to-brain transport.
The possible mechanism may be that the cationic TQ-CS
systems showed a higher targeting efficiency in brain,
which is consistent with previous studies.43,44 These findings
are in congruence with the observations reported by Zhang
et al, who also proved the potential role of nanocarriers in
nose-to-brain targeting.45
ConclusionIn the present investigation, TQ-encapsulated CS NPs were
prepared successfully. A physical evaluation and electron
microscope screening supported the suitability for intranasal
administration. The scintigraphic study in rats demonstrated
that intranasal administration delivers TQ to the brain rapidly
and more effectively than previous methods. The accumula-
tion of TQ-NP1 formulation within interstitial spaces and
transport of the drug to the brain may be due the nanometric
size range and the stretching of tight junctions within the
nasal mucosa. The finding also supported the formulation’s
CSF-penetrating potential. The studies suggest intranasal
delivery of TQ to be a promising approach for brain target-
ing as well as in reducing the systemic exposure. However,
benefit-to-risk ratio and clinical intricacies need to be estab-
lished scientifically for its suitability in clinical practice in
the management of Alzheimer symptoms.
AcknowledgmentsThe authors are grateful to University Grant Commission
(UGC), Government of India for providing fellowship to
Sanjar Alam. Authors are also thankful for the support
provided by Advanced Instrumentation Research Facility
(AIRF), Jawaharlal Nehru University, and Institute of Nuclear
Medicine and Allied Sciences (INMAS), New Delhi in this
research activity.
DisclosureThe authors report no conflicts of interest in or financial
benefit from this work.
References 1. Francis PT, Palmer AM, Snape M, Wilcock GK. The cholinergic hypoth-
esis of Alzheimer’s disease: a review of progress. J Neurol Neurosurg Psychiatry. 1999;66:137–147.
2. Desgranges B, Baron JC, de la Sayette V, et al. The neural substrates of memory systems impairment in Alzheimer’s disease: A PET study of resting brain glucose utilization. Brain. 1998;121:611–631.
3. Forstl H, Hentschel F, Sattel H, et al. Age-associated memory impair-ment and early Alzheimer’s disease. Drug Res. 1995;45(1):394–397.
4. Kumar V, Durai NB, Jobe T. Pharmacologic management of Alzheimer’s disease. Clin Geriatr Med. 1998;14(1):129–146.
5. McGeer PL, Schulzer M, McGeer EG. Arthritis and anti-inflammatory agents as possible protective factors for Alzheimer’s disease: a review of 17 epidemiologic studies. Neurology. 1996;47:425–432.
6. Ishrat T, Hoda MN, Khan MB, et al. Amelioration of cognitive deficits and neurodegeneration by curcumin in rat model of sporadic dementia of Alzheimer’s type (SDAT). Eur Neuropsychopharmacol. 2009;19: 636–647.
7. Akhondzadeh S, Abbasi SH. Herbal medicine in the treatment of Alzheim-er’s disease. Am J Alzheimers Dis Other Demen. 2006;21(2): 113–118.
8. Howesa MR, Houghton PJ. Plants used in Chinese and Indian tradi-tional medicine for improvement of memory and cognitive function. Pharmacol Biochem Behav. 2003;75:513–527.
9. Al-Majed AA, Al-Omar FA, Nagi MN. Neuroprotective effects of thy-moquinone against transient forebrain ischemia in the rat hippocampus. Eur J Pharmacol. 2006;543:40–47.
10. Al-Ghamdi MS. The anti-inflammatory, analgesic and antipyretic activ-ity of Nigella sativa. J Ethnopharmacol. 2001;76:45–48.
11. Mansour MA, Nagi MN, El-Khatib AS, Al-Bekairi AM. Effects of thymoquinone on antioxidant enzyme activities, lipid peroxidation and DT-diaphorase in different tissues of mice: a possible mechanism of action. Cell Biochem Funct. 2002;20:143–151.
12. Lockman PR, Mumper RJ, Khan MA, Allen DD. Nanoparticle technol-ogy for drug delivery across blood–brain barrier. Drug Dev Ind Pharm. 2002;28:1–12.
13. Witt KA, Davis TP. CNS drug delivery: Opioid peptides and the blood-brain barrier. AAPS J. 2006;8(1):76–88.
14. Gabriel AS. Nanotechnology approaches for drug and small molecule delivery across the blood brain barrier. Surg Neurol. 2007;67: 113–116.
15. Hans ML, Lowman AM. Biodegradable nanoparticles for drug delivery and targeting. Curr Opin Solid State Mater Sci. 2002;6(4): 319–327.
16. Illum L. Transport of drugs from the nasal cavity to central nervous system. Eur J Pharm Sci. 2000;11:1–18.
17. Vyas TK, Shahiwala A, Marathe S, Misra A. Intranasal drug delivery for brain targeting. Curr Drug Del. 2005;2:164–175.
18. Wang X, Chi N, Tang X. Preparation of estradiol chitosan nanoparticles for improving nasal absorption and brain targeting. Euro J Pharm Biopharm. 2008;70:735–740.
19. Ugwoke MI, Verbeke N, Kinget R. The biopharmaceutical aspects of nasal mucoadhesive drug delivery. J Pharm Pharmacol. 2001;53: 3–21.
20. Fazil M, Md S, Haque S, et al. Development and evaluation of rivastigmine loaded chitosan nanoparticles for brain targeting. Eur J Pharm Sci. 2012;47(1):6–15.
21. Calvo P, Remunan-Lopez C, Vila-Jata JL, Alonso MJ. Chitosan and chitosan: ethylene oxide-propylene oxide block copolymer nanopar-ticles as novel carriers for proteins and vaccines. Pharm Res. 1997;14: 1431–1436.
22. Aktas Y, Andrieux K, Alonso MJ, et al. Preparation and in vitro evalu-ation of chitosan nanoparticles containing a caspase inhibitor. Int J Pharm. 2005;298:378–383.
23. Ghosheh OA, Houdi AA, Crooks PA. High performance liquid chro-matographic analysis of the pharmacologically active quinones and related compounds in the oil of the black seed (Nigella sativa L.). J Pharm Biomed Anal. 1999;19:757–762.
submit your manuscript | www.dovepress.com
Dovepress
Dovepress
5717
Thymoquinone-encapsulated chitosan nanoparticles for nose-to-brain targeting

International Journal of Nanomedicine
Publish your work in this journal
Submit your manuscript here: http://www.dovepress.com/international-journal-of-nanomedicine-journal
The International Journal of Nanomedicine is an international, peer-reviewed journal focusing on the application of nanotechnology in diagnostics, therapeutics, and drug delivery systems throughout the biomedical field. This journal is indexed on PubMed Central, MedLine, CAS, SciSearch®, Current Contents®/Clinical Medicine,
Journal Citation Reports/Science Edition, EMBase, Scopus and the Elsevier Bibliographic databases. The manuscript management system is completely online and includes a very quick and fair peer-review system, which is all easy to use. Visit http://www.dovepress.com/ testimonials.php to read real quotes from published authors.
International Journal of Nanomedicine 2012:7
24. Ge H, Hu Y, Jiang X, et al. Preparation, characterization, and drug release behaviors of drug nimodipine-loaded poly(e-caprolactone)-poly(ethylene oxide)-poly(e-caprolactone) amphiphilic triblock copo-lymer micelles. J Pharm Sci. 2002;91:1463–1473.
25. Babbar AK, Singh AK, Goel HC, Chauhan UPS, Sharma RK. Evaluation of 99mTc labelled Photosan-3, a haematoporphyrin derivative, as a potential radiopharmaceutical for tumor scintigraphy. Nucl Med Biol. 2000;27:419–426.
26. Burits M, Bucar F. Antioxidant activity of Nigella sativa essential oil. Phytother Res. 2000;14(5):323–328.
27. Kumar M, Misra A, Babbar AK, Mishra AK, Mishra P, Pathak K. Intranasal nanoemulsion based brain targeting drug delivery system of risperidone. Int J Pharm. 2008;358:285–291.
28. Papadimitriou S, Bikiaris D, Avgoustakis K, Karavas E, Georgarakis M. Chitosan nanoparticles loaded with dorzolamide and pramipexole. Carbohydr Polym. 2008;73:44–54.
29. Quellec P, Gref R, Perrin L, et al. Protein entrapment within polyeth-ylene glycol-coated nanospheres. I. Physicochemical characterization. J Biomed Mater Res. 1998;42:45–54.
30. Mohanraj VJ, Chen Y. Nanoparticles – A review. Trop J Pharm Res. 2006;5:561–573.
31. Joshi SA, Chavhan SS, Sawant KK. Rivastigmine-loaded PLGA and PBCA nanoparticles: Preparation, optimization, characterization, in vitro and pharmacodynamic studies. Eur J Pharm Biopharm. 2010;76:189–199.
32. Pagola S, Benavente A, Raschi A, Romano E, Molina MAA, Stephens PW. Crystal structure determination of thymoquinone by high-resolution X-ray powder diffraction. AAPS PharmSciTech. 2003;5(2):e28.
33. Ritger PL, Peppas NA. A simple equation for description of solute release II. Fickian and anomalous release from swellable devices. J Control Release. 1987;5:37–44.
34. Vllasaliu D, Exposito-Harris R, Heras A, et al. Tight junction modulation by chitosan nanoparticles: comparison with chitosan solution. Int J Pharm. 2010;400(1–2):183–193.
35. Richter T, Keipert S. In vitro permeation studies comparing bovine nasal mucosa, porcine cornea and artificial membrane: androstenedione in microemulsions and their components. Eur J Pharm Biopharm. 2004;58:137–143.
36. Tosi G, Costantino L, Rivasi F, et al. Targeting the central nervous system: In vivo experiments with peptide-derivatized nanoparticles loaded with Loperamide and Rhodamine-123. J Control Release. 2007;122:1–9.
37. Vergoni AV, Tosi G, Tacchi R, Vandelli MA, Bertolini A, Costantino L. Nanoparticles as drug delivery agents specific for CNS: in vivo biodistribution. Nanomed Nanotech Biol Med. 2009;5: 369–377.
38. Wang X, He H, Leng W, Tang X. Evaluation of brain-targeting for the nasal delivery of estradiol by the microdialysis method. Int J Pharm. 2006;317:40–46.
39. Thorne RG, Pronk GJ, Padmanabhan V, Frey WH 2nd. Delivery of insulin-like growth factor-I to the rat brain and spinal cord along olfactory and trigeminal pathways following intranasal administration. Neuroscience. 2004;127:481–496.
40. Bhavna, Sharma V, Ali M, Baboota S, Ali J. Preparation and characterization of chitosan nanoparticles for nose to brain deliv-ery of a cholinesterase inhibitor. Ind J Pharm Sci. 2007;69(5): 712–723.
41. Al-Ghananeem AM, Saeed H, Florence R, Yokel RA, Malkawi AH. Intranasal drug delivery of didanosine-loaded chitosan nanoparticles for brain targeting; an attractive route against infections caused by AIDS viruses. J Drug Target. 2010;18(5):381–388.
42. Soni S, Kumar BA, Kumar SR, Banerjee T, Maitra A. Pharmacoscinti-graphic evaluation of polysorbate 80-coated chitosan nanoparticles for brain targeting. Am J Drug Del. 2005;3(3):205–212.
43. Huo MR, Zhou JP, Wei Y, Lu L. Preparation of paclitaxel-loaded chito-san polymeric micelles and influence of surface charges on their tissue biodistribution in mice. Acta Pharm Sin. 2006;41:867–872.
44. Mahato RI, Kawabata K, Nomura T, Takakura Y, Hashida M. Physicochemical and pharmacokinetic characteristics of plasmid DNA/cationic liposome complexes. J Pharm Sci. 1995;84:1267–1271.
45. Zhang Q, Jiang X, Xiang W, Lu W, Su L, Shi Z. Preparation of nimodipine-loaded microemulsion for intranasal delivery and evaluation of the targeting efficiency to brain. Int J Pharm. 2004; 275:85–96.
submit your manuscript | www.dovepress.com
Dovepress
Dovepress
Dovepress
5718
Alam et al


![Fabrication of Curcumin Encapsulated Chitosan-PVA Silver ... · [18]. Polyvinyl alcohol (PVA), a water soluble synthetic polymer, having less toxicity, possess excellent wound dressing](https://static.cupdf.com/doc/110x72/60a7a1ff0f83e13018683769/fabrication-of-curcumin-encapsulated-chitosan-pva-silver-18-polyvinyl-alcohol.jpg)