Sanjiv Satoor, 10 May 2017
DEVELOPER TOOLS UPDATE IN CUDA 9.0

2
TOOLS OFFERINGS
IDE: Nsight Eclipse Edition (Nsight EE)
Debug: cuda-gdb, CUDA Debug API, Nsight EE
Memcheck: cuda-memcheck
Profile/Trace: CUDA Visual Profiler, nvprof, CUPTI
3
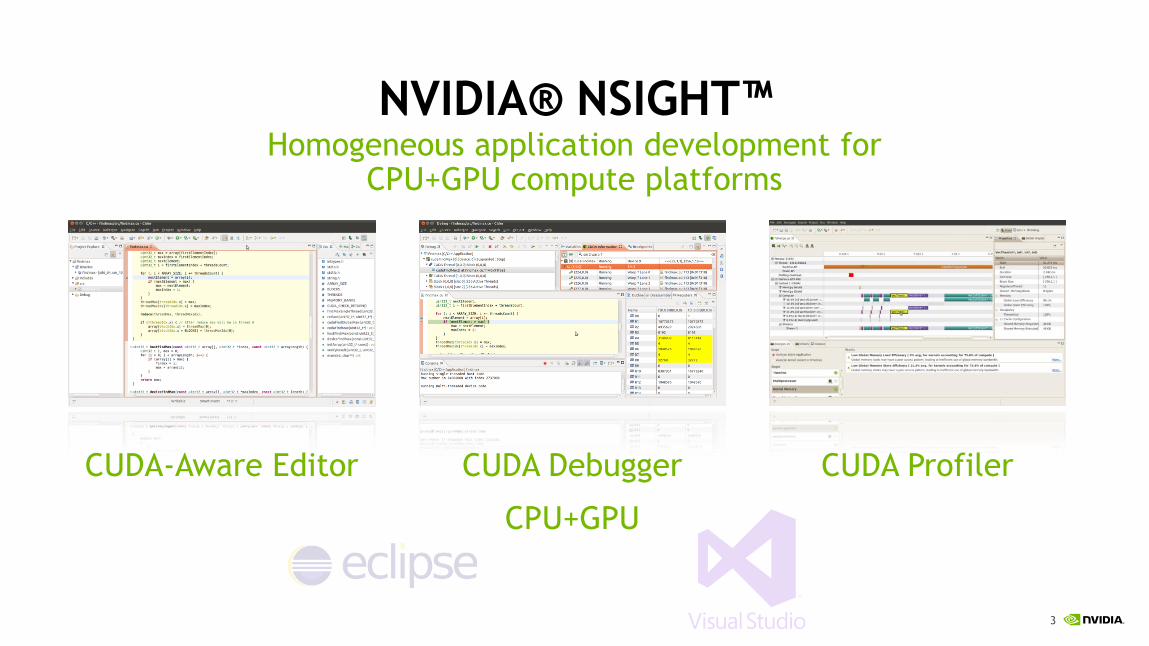
NVIDIA® NSIGHT™Homogeneous application development for
CPU+GPU compute platforms
CUDA-Aware Editor CUDA Debugger
CPU+GPU
CUDA Profiler

4
TOOLS OFFERINGS
CUDA-GDB
• Debug CUDA kernels with CLI
• Debug CPU and GPU code
• CPU and GPU core dump support
NVPROF
• Collect Performance events and metrics
VISUAL PROFILER
• Trace CUDA activities
• Profile CUDA kernels
• Correlate performance instrumentation
with source code
• Expert-guided performance analysis
CUDA-MEMCHECK
• Detect out-of-bounds memory accesses
• Detect race condition in memory accesses
• Detect uninitialized variable accesses
• Detect incorrect GPU thread synchronizationNVDISASM, CUOBJDUMP
GPU LIBRARY ADVISOR
• Detect CUDA library optimization
opportunities

5
NSIGHT EE AND DEBUGGER
Nsight Eclipse Edition becomes a pure plugin into the Eclipse standalone IDE
Feature parity with current Nsight EE, can be used in existing Eclipse installs
Support for Power9 powered systems
Volta GPU support
Debug Power9 CPU & Volta GPU
CUDA-GDB upgrade to GDB 7.12 source base

6
NSIGHT EE PLUGINS - FEATURES
• Edit, build, debug and profile CUDA-C applications
• CUDA aware source code editor – syntax highlighting, code completion and inline help
• Debugger - Seamless and simultaneous debugging of both CPU and GPU code
➢ View program variables and registers across several CUDA threads
➢ View, Navigate and filter to selectively track execution across threads
➢ Set breakpoints and single-step execution at both source-code and assembly levels
➢ View memory and disassembly
➢ Cross compile cuda applications to run and debug the application on remote devices.
• Profiler integration – Launch visual profiler as an external application with the CUDA application built in this IDE to easily identify performance bottlenecks
Eclipse plugins for the full set IDE features for CUDA development

7
ECLIPSE INTEGRATION
• Required Eclipse version 4.4 or 4.5
• Developed based on Eclipse CDT/DSF framework.
• Using Eclipse remote system explorer(RSE) plugins to connect to the remote devices.
• Nsight EE plugins are bundled as an archive file(zip) and can be installed using standard Eclipse plugins install dialog.
• The dependent plugins (CDT/RSE) will be automatically installed.
• It can coexist with other eclipse plugins in the user environment.
Plugins can be installed on any standard eclipse
8
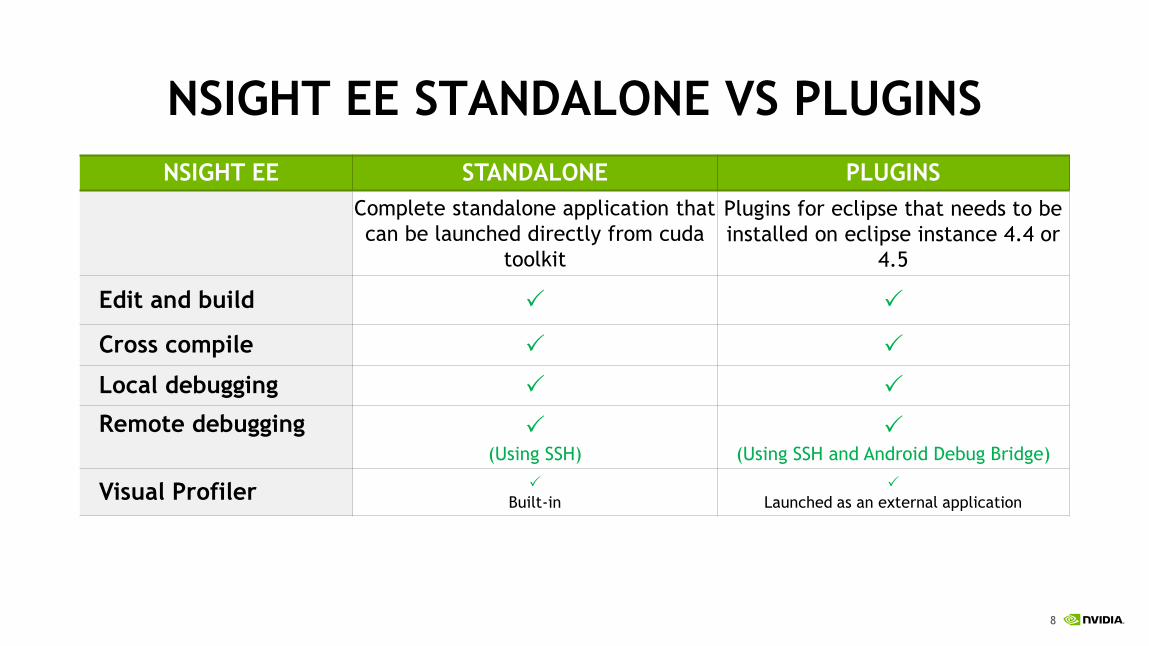
NSIGHT EE STANDALONE VS PLUGINS
NSIGHT EE STANDALONE PLUGINS
Complete standalone application that
can be launched directly from cuda
toolkit
Plugins for eclipse that needs to be
installed on eclipse instance 4.4 or
4.5
Edit and build
Cross compile
Local debugging
Remote debugging
(Using SSH)
(Using SSH and Android Debug Bridge)
Visual Profiler
Built-in
Launched as an external application
9
CUDA-MEMCHECK
Support for Volta architecture
Memcheck support for shared memory atomic instructions
Memcheck detects accesses that extend beyond an allocation
Support for Cooperative Groups and new synchronization primitives

10
CUDA-MEMCHECK
Warp-level programming commonly used to achieve high performance but relied on lock-step execution
With Volta, threads in a warp do not necessarily execute in lock-step in all cases
Volta may require updates to unsynchronized warp-level code to guarantee correctness
cuda-memcheck’s racecheck tool can be used to detect such unsafe code
cuda-memcheck –tool racecheck
Support for Cooperative Groups

11
CUDA-MEMCHECK
Unsafe warp-level programming can be detected on Kepler and later with racecheck
Support for Cooperative Groups
UNSAFE CODE
__device__ char reduce(char val) {extern __shared__ char smem[];const int tid = threadIdx.x;
#pragma unrollfor(int i = warpSize/2; i > 0; i /= 2) {smem[tid] = val;val += smem[tid ^ i];
}return val;
}
RACECHECK OUTPUT
$ cuda-memcheck –tool racecheck --racecheck-report hazard ./a.out
========= CUDA-MEMCHECK========= WARN:(Warp Level Programming) Potential RAW hazard detected at __shared__ 0xf in block (0, 0, 0) :
========= Write Thread (15, 0, 0) at 0x00000e08 in /home/user/reduction.cu:32:kernel(void)
========= Read Thread (14, 0, 0) at 0x00000ef0 in /home/user/reduction.cu:33:kernel(void)...

12
CUDA-MEMCHECK
CUDA 9.0 introduces the Cooperative Groups programming model
Cooperative Groups adds explicit block- and warp-level synchronization APIs
Support for Cooperative Groups
UNSAFE CODE
__device__ char reduce(char val) {extern __shared__ char smem[];const int tid = threadIdx.x;thread_group warp = tiled_partition(this_thread_block(), warpSize);
#pragma unrollfor(int i = warpSize/2; i > 0; i /= 2) {smem[tid] = val; warp.sync();val += smem[tid ^ i]; warp.sync();
}return val;
}
SAFE COOP. GROUPS CODE
__device__ char reduce(char val) {extern __shared__ char smem[];const int tid = threadIdx.x;
#pragma unrollfor(int i = warpSize/2; i > 0; i /= 2) {smem[tid] = val;val += smem[tid ^ i];
}return val;
}
ROBUST AND PERFORMANT
13
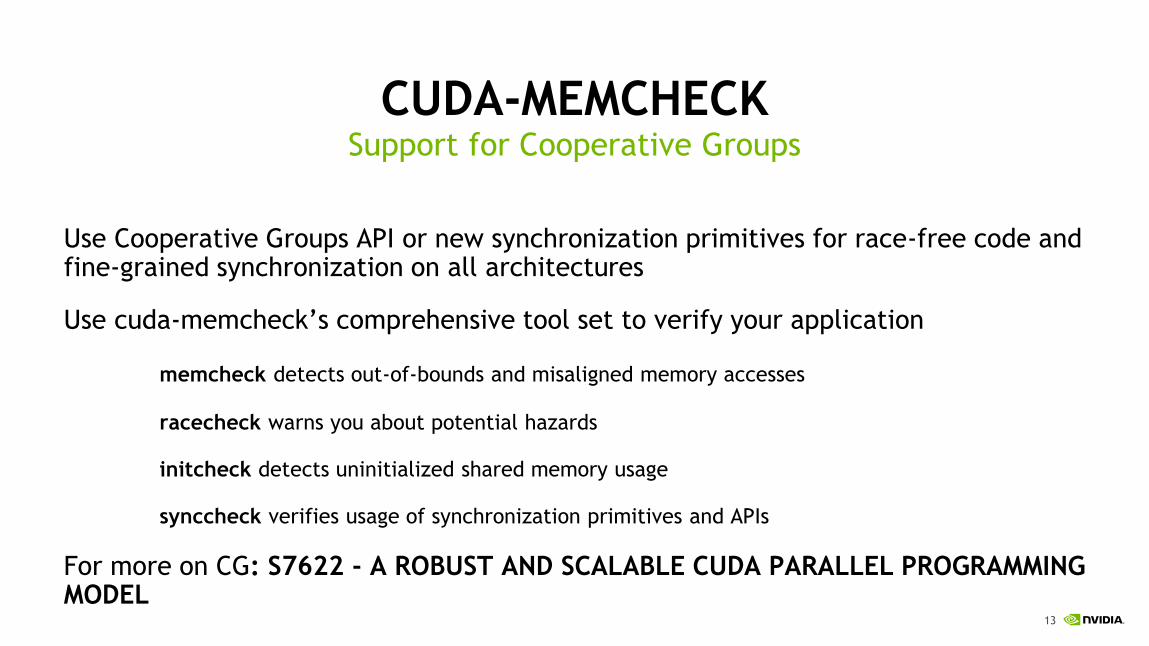
CUDA-MEMCHECK
Use Cooperative Groups API or new synchronization primitives for race-free code and fine-grained synchronization on all architectures
Use cuda-memcheck’s comprehensive tool set to verify your application
memcheck detects out-of-bounds and misaligned memory accesses
racecheck warns you about potential hazards
initcheck detects uninitialized shared memory usage
synccheck verifies usage of synchronization primitives and APIs
For more on CG: S7622 - A ROBUST AND SCALABLE CUDA PARALLEL PROGRAMMING MODEL
Support for Cooperative Groups
14
PROFILING
Unified Memory
NvLink
MPI Profiling
Multi-hop remote profiling
PC sampling
Volta support
Enhancements in CUDA 9.0
15
UNIFIED MEMORY PROFILING
Correlate CPU page fault with the source code
New events for page thrashing, throttling, remote map
Option to switch between segment and non-segment mode on the timeline
Filter events based on the virtual address, migration reason or the page fault access type

16
CPU PAGE FAULT SOURCE CORRELATION
Source line causing cpu page fault

17
NVLINK EVENTS ON TIMELINE

18
NVLINK TOPOLOGY
19
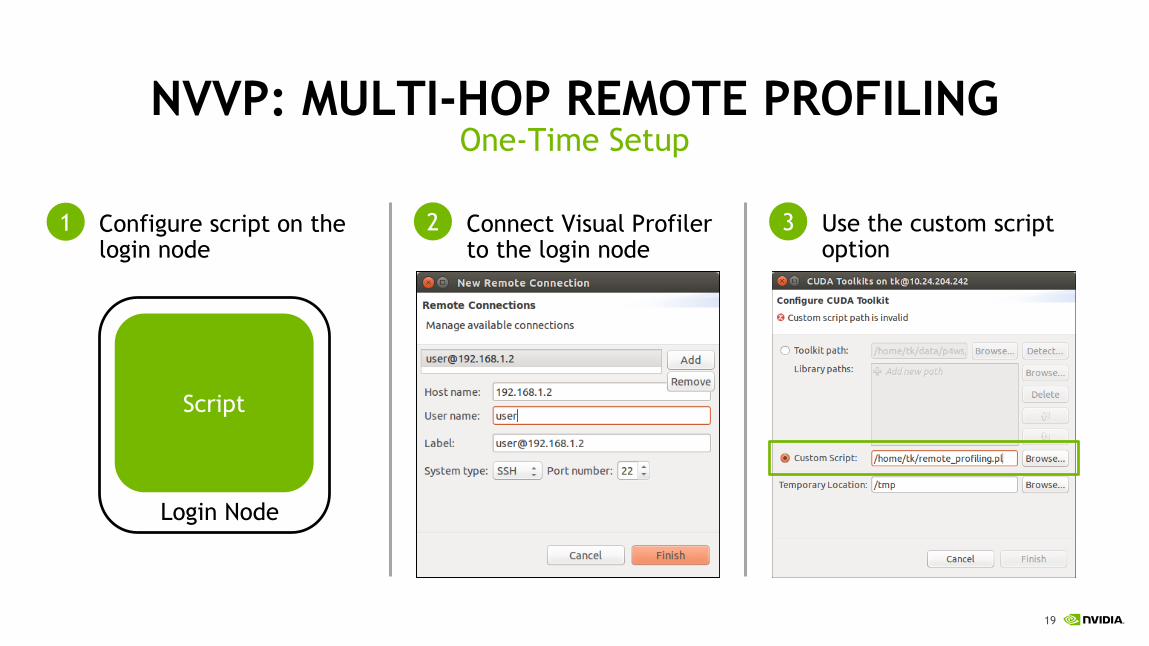
NVVP: MULTI-HOP REMOTE PROFILING
1 2 3
Login Node
Script
Connect Visual Profiler to the login node
Configure script on the login node
Use the custom script option
One-Time Setup

20
NSIGHT VISUAL STUDIO EDITION
Visual Studio 2017 support
21
FOR MORE INFORMATION …NVIDIA toolkit download: https://developer.nvidia.com/cuda-downloads
NVIDIA toolkit documentation: http://docs.nvidia.com/
NVIDIA Tools: https://developer.nvidia.com/tools-ecosystem
Other GTC 2017 sessions:
S7519 - DEVELOPER TOOLS FOR AUTOMOTIVE, DRONES AND INTELLIGENT CAMERAS APPLICATIONS
L7140 - JETSON TX2 DEVELOPER TOOLS
SE7142 - CUDA DEVELOPER TOOLS ROUND TABLE
S7495 - OPTIMIZING APPLICATION PERFORMANCE WITH CUDA PROFILING TOOLS
S7444 - WHAT THE PROFILER IS TELLING YOU: OPTIMIZING GPU KERNELS
S7445 - WHAT THE PROFILER IS TELLING YOU: OPTIMIZING WHOLE APPLICATION PERFORMANCE


![Parallel Programming Oracle Developer Tools[1]](https://static.cupdf.com/doc/110x72/547738055806b555068b4601/parallel-programming-oracle-developer-tools1.jpg)