


DETERMINANTS OF COLLECTIVE MARKETING PERFORMANCE 1
Determinants of collective marketing performance: Evidence
from Kenya’s coffee cooperatives
Miriam Vorlaufer, Meike Wollni, Fabrice Pinard, Dagmar Mithöfer
Miriam Vorlaufer, Georg-August University of Goettingen, Germany, Platz der Göttinger
Sieben 5, 37073 Goettingen, Germany, [email protected], Tel. +49(0)55139-4835
Meike Wollni, Georg-August University of Goettingen, Germany, Platz der Göttinger Sieben
5, 37073 Goettingen, Germany, [email protected]
Fabrice Pinard, World Agroforestry Centre (ICRAF), United Nations Avenue, P.O. Box
30677, Nairobi, Kenya, [email protected]
Dagmar Mithöfer, Rhine Waal University of Applied Sciences, Marie Curie Str. 1, 47533
Kleve, Germany, [email protected]
DETERMINANTS OF COLLECTIVE MARKETING PERFORMANCE 2
1 Introduction
Smallholders in developing countries face numerous constraints due to the pervasive
imperfections of markets. Increasing evidence shows that through collective action
smallholders can reduce the transaction costs of accessing input and output markets, adopt
efficiency-increasing and value-adding technologies, and tap into high-value markets
associated with certification and labeling (Kersting and Wollni, 2012; Wollni and Zeller,
2007; Gruere et al., 2009; Devaux et al., 2009; Narrod et al., 2009). Additionally, collective
marketing can lead to improved bargaining power in negotiations with buyers and
intermediaries (Markelova et al., 2009; Stockbridge et al., 2003). Against the background of
these potential benefits, the support of farmer groups and community associations is high on
the policy agenda (Bernard and Spielman, 2009). Success stories of farmer organizations,
cooperatives or alternative forms of collective action are documented in several studies:
coffee cooperatives in Costa Rica (Wollni and Zeller, 2007), green bean marketing
cooperatives in Kenya (Narrod et al., 2009), banana farmer organizations in Kenya (Fischer
and Qaim, 2012), and dairy marketing cooperatives in Ethiopia (Holloway et al., 2000).
However, these success stories cannot simply be generalized. Cases are documented where
farmer organizations did not improve the farmer’s situation and where forms of collective
action eventually collapsed (Markelova et al., 2009; Poulton et al., 2010; Vandeplas et al.
2013).
The failure of many collective action initiatives can be partly attributed to the little attention
that was given to understanding how collective action works (Meinzen-Dick et al., 2004).
Agrawal (2001) based on the earlier work of Wade (1998), Ostrom (1990), and Baland and
Platteau (1996) distinguishes three broad categories of variables, including group
characteristics, institutional arrangements, and the external environment that determine the
functioning of collective action and are relevant in the context of smallholder market access.
A critical aspect of the functioning of collective action concerns the extent to which group
members are committed to their cooperative. Member commitment can be considered an
antecedent attitude of loyal behavior, which might determine the actual loyalty of members
(Cechin et al., 2013). Group characteristics, institutional arrangements and the external
environment affect the functioning of collective action via formal institutions, such as rules,
fines, and regulations or via informal social constraints, such as norms, shared values and
conventions. Formal institutions directly create incentives and control, inducing group
members to behave towards a common interest or purpose (Stockbridge et al., 2003). First,

DETERMINANTS OF COLLECTIVE MARKETING PERFORMANCE 3
informal institutions strengthen internal cohesion, which is characterized by a common sense
of purpose and accountability. Second, informal institutions enforce the mechanism of
reciprocity (Habyarimana et al., 2009). In other words, in order to maintain their reputation
and to increase the likelihood of receiving help from someone else, individuals in a close-knit
social network repeat loyal behavior (and, thus, avoid opportunistic behavior) (Collier, 1998).
When members are committed to their cooperative, i.e., collective action functions well, this
is likely to have a direct effect on the performance of the group: committed members are less
likely to ‘sell outside’, when better prices or services are offered by alternative buyers;
commitment also reduces transaction costs associated with sanctions and regulations of the
cooperative due to a lower likelihood of opportunistic behavior (Cechin et al., 2013).
Several case studies investigate the determinants of performance in marketing cooperatives.
Based on 34 farmer groups in Tanzania, Barham and Chitemi (2009) show that different
group characteristics (e.g. origin, and structural and cognitive social capital) affect the
marketing performance of the group. Devaux et al. (2009) highlight the importance of the
coexistence of external facilitation and support and institutional arrangements, such as a
strong leadership, as in the case of the Papa Andina network in Peru and Bolivia. Fewer
quantitative studies on factors that affect the success of collective action in sub-Saharan
Africa have been conducted. One of them conducted by Bernard and Spielman (2009)
analyzes the relationship between characteristics of membership (heterogeneity), governance
and performance based on data from 160 marketing cooperatives in Ethiopia. Their analysis
demonstrates the trade-off between the extent of inclusiveness associated with members’
heterogeneity and the cooperative’s performance.
In this study, we use original survey data from 120 Kenyan coffee cooperatives to analyze the
determinants of perceived member commitment and marketing performance. Coffee is
traditionally the backbone of Kenya’s highland economy. It is mostly produced by
smallholders with 75% of the coffee area under smallholder production system (Mude, 2005).
Smallholder coffee producers are legally bound to market their coffee through cooperatives
(Mude, 2007). Triggered by low and volatile coffee world market prices and political reforms
in the Kenyan coffee sector in the 1990’s, national coffee production and productivity
decreased considerably in the last two decades while coffee prices have continuously
increased since 2003. The political reforms came along with an increase in corruption and
patronage in Kenya’s coffee cooperatives (Mude, 2007). Yet, until now a systematic analysis
of the determinants of collective action and of the marketing performance of Kenyan coffee

DETERMINANTS OF COLLECTIVE MARKETING PERFORMANCE 4
cooperatives has been lacking. Based on Agrawal (2001), we first estimate the effect of group
characteristics, institutional arrangements and external factors on members’ commitment to
their cooperative. In the second stage, we identify the effect of commitment on different
indicators of cooperative marketing performance.
The remainder of this paper is structured in the following manner. In the next section, we
provide background information on the Kenyan coffee sector and coffee cooperatives. Section
2 gives details on the original survey data used in this study. In section 3 and 4, we present
and discuss results of the econometric analyses on the determinants of perceived commitment
and on collective marketing performance, respectively. The last section concludes.
2 Background: Coffee cooperatives in Kenya
Since its introduction as a cash crop in the early 1900s, coffee has traditionally been the
backbone of Kenya’s highland economy. Until the global coffee crisis in 1933, when Brazil
released its surpluses onto the world market and prices plummeted, coffee was grown
exclusively by European settlers around Nairobi. Starting in Kisii and Meru districts,
smallholders were allowed to produce coffee on an experimental basis. In 1944, smallholders
were required by law to join local cooperatives run by the government. The growth of the
smallholder coffee sector was accompanied by the exclusive control over production and
marketing by the Coffee Board of Kenya (CBK) and the Coffee Marketing Board (CMB)
(Hyde, 2008). Today, there are around 600,000 smallholder coffee farmers1 in Kenya
(Ministry of Agriculture, 2010) who farm about 75% of the coffee area (Mude, 2005).
Smallholders are legally bound to deliver their coffee cherries to cooperatively owned
factories for primary processing. Each cooperative runs one or more factories within a certain
catchment area defined by natural borders, political boundaries and/or generally accepted
informal boundaries. Coffee farmers within a catchment area hold shares of the cooperative’s
capital and are, thereby, obliged to deliver their coffee to the factories of that particular
cooperative. Primary processing at the factory level, known as wet processing, involves the
sorting of coffee cherries, pulping, fermentation, drying and storage and results in parchment
coffee. The parchment coffee is marketed collectively, either at the cooperative or factory
level. The coffee produced at each factory or cooperative is pooled so that one farmer’s 1 Farmers who have less than five acres of coffee are defined as smallholders (Ministry of
Agriculture, 2010).
DETERMINANTS OF COLLECTIVE MARKETING PERFORMANCE 5
contribution is not discernible from another’s. The parchment coffee is delivered to the miller,
where the secondary processing takes place. It involves hulling, grading, milling of coffee and
final grading. Currently there are six main millers in Kenya (Nyambene, Thika Coffee Mills,
Sasini, Kofinaf, Central Kenya and KPCU). After milling, the coffee is supposed to be passed
on to the marketing agent. Coffee producers are paid twice per year. In the beginning of the
season producers receive the coffee advance payment, which is the lowest expected payment
per kilogram of the season (Mude, 2007). The calculation of the second and final payment is
based on the revenue received from coffee sales. The cooperative management then deducts
all of its operating costs, including maintenance and service expenses, loan repayments and
salaries. The final payment can either be done at the cooperative level or the factory level.
The second method allows for inter-factory, intra-cooperative price variation. Besides primary
processing and marketing, cooperatives provide inputs as well as education and extension
services to their members.
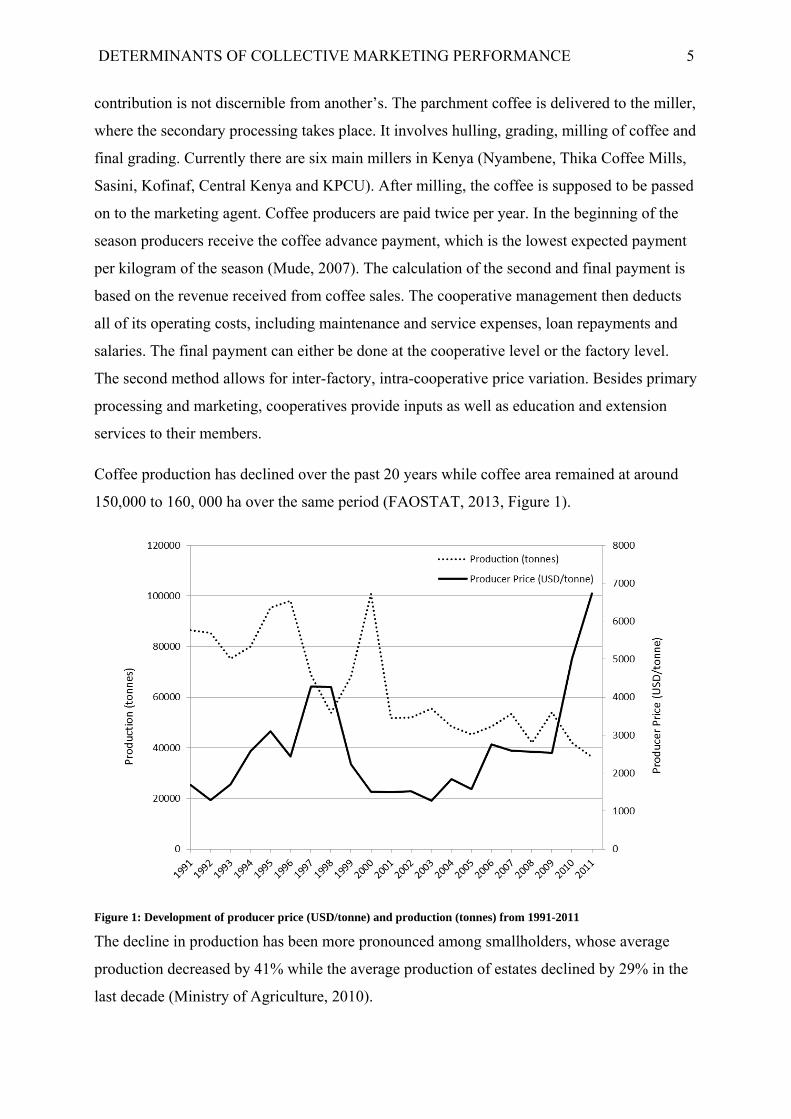
Coffee production has declined over the past 20 years while coffee area remained at around
150,000 to 160, 000 ha over the same period (FAOSTAT, 2013, Figure 1).
Figure 1: Development of producer price (USD/tonne) and production (tonnes) from 1991-2011
The decline in production has been more pronounced among smallholders, whose average
production decreased by 41% while the average production of estates declined by 29% in the
last decade (Ministry of Agriculture, 2010).

DETERMINANTS OF COLLECTIVE MARKETING PERFORMANCE 6
The weak performance of Kenya’s coffee sector in terms of declining production contradicts
increasing performance in terms of rising coffee prices. This suggests that additional
circumstances specific to the Kenyan coffee sector contribute to low levels of coffee
production and productivity.
Since the early 1990s, the liberalization of the Kenyan coffee sector has fundamentally altered
the structure of the coffee value chain. As well as the dismantling of the monopoly power of
the Coffee Board of Kenya as a marketing agent, it also led to the removal of all policy-
making jurisdictions over the economic activities of cooperatives. On one hand, the reforms
encouraged farmer and private sector participation through the reduction of government
involvement in the coffee sector. Processing costs and statutory deductions, especially at the
milling and marketing stages, decreased substantially due to increasing competition in the
coffee value chain. On the other hand, problems of corruption, political opportunism, and
mismanagement have increased across all institutions in the coffee sector, especially in coffee
cooperatives (Karanja and Nyoro, 2002; Mude, 2007).
While Karanja and Nyoro (2002) and Mude (2007) have identified factors explaining the low
performance of Kenyan coffee sector based on case studies, we investigate determinants of
members’ commitment and its impact on the marketing performance based on a
representative data set which includes 120 coffee cooperatives.
3 Study design and empirical data
In this paper, we use data from a representative survey of coffee cooperatives in the Central
and Eastern provinces of Kenya. Around 50% of all Kenyan coffee cooperatives are located in
these two provinces, which account for approximately 50% of the national coffee production
(Ministry of Agriculture, 2010). In preparation for the survey, a list of all cooperatives in this
region was compiled in collaboration with the Ministry of Agriculture and with coffee
cooperative unions at district level. Out of a total of 180 coffee cooperatives, 120 cooperatives
were randomly selected, ensuring an equal ratio of around 70% of the total population
selected in each district. The survey was conducted between January and March 2011.
The target person for the interview was the secretary manager of the cooperative who is
employed by the cooperative and was chosen for two main reasons: (1) the secretary manager
is responsible for the accounting and bookkeeping and, thus, best knows the data and figures
associated with the cooperative; and (2) because -the secretary manager is employed by the
DETERMINANTS OF COLLECTIVE MARKETING PERFORMANCE 7
cooperative and not elected, he/she is considered the most objective person among possible
interviewees. The interviews comprised a standardized questionnaire that included sections on
the following aspects: (1) general information; (2) certification; (3) input provision; (4)
education provision; (5) processing; (6) milling/marketing; (7) payment to farmers; (8)
organizational structure; (9) institutional arrangements; (10) financial status; and (11) social
capital among members and between members and millers/marketers. In general, the data
collected refers to the coffee year 2009/102. Key data, such as the final payment to members,
delivered quantity, and marketing strategy, were also recorded for a recall period of five years
(2005/06 - 2009/10). These years represent a period of relatively steadily increasing prices for
Kenyan coffee on the world market.
In addition to the cooperative survey, four expert interviews were carried out to make tacit
knowledge more explicit. These included interviews with representatives of two public
institutions: the Ministry of Cooperative Development and Marketing in Nairobi, and the
Kenyan Coffee Board in Thika. Furthermore, to cover a traditional intermediary between the
private and the public sector, managers of Mugama Farmers’ Cooperative Union in Muranga
were visited. Finally, we interviewed a more recently-emerged stakeholder of the coffee
sector ─ Sustainable Management Services in Nyeri, which is a service provider in the coffee
sector and belongs to the international coffee trader ECOM. They provide training and
extension services to seven coffee cooperatives in collaboration with the Dutch development
organization HIVOS (Humanist Institute for Development Cooperation).
4 Determinants of perceived commitment in Kenyan coffee cooperatives
(a) Methodology
We estimate the effect of various potential explanatory variables on the extent of perceived
member commitment as rated by the secretary manager using an ordered logit model. In our
survey, the secretary manager was asked to indicate on a five-point-Likert scale whether or
not members of the cooperative contribute time and money towards common development
goals. Thus, perceived commitment is measured as a categorical variable ranging from one
(very low levels of perceived commitment) to five (very high levels of perceived 2 The coffee year 2009/10 includes the time from 1st October 2009 to 30th September 2010.

DETERMINANTS OF COLLECTIVE MARKETING PERFORMANCE 8
commitment). We assume that there is a continuous level of commitment underlying this
perception, which is, however, difficult to quantify and, therefore, is unobserved. The
underlying level of perceived commitment is modeled as:
(1)
where Y* is the latent outcome variable; X1, X2 and X3 are vectors of independent variables
related to group characteristics, institutional arrangements, and the external environment,
respectively; β is a parameter vector to be estimated; and ε is a random error term. While we
do not observe the underlying level of commitment, we observe that
where αj are unknown threshold parameters to be estimated.
The first set of variables included in X1 relates to the characteristics of the group. We consider
five main aspects: the size of the group, the age of the group, the origin of the group, the
number of factories belonging to the group and the extent of democratic decision-making.
The size of the group is measured by the number of active members. The effect of group size
on commitment is controversially discussed in the literature (Meinzen-Dick et al., 1997). On
one hand, larger groups can exploit economies of scale and, thus, be associated with positive
incentives for collective action (e.g. Stringfellow et al., 1997). On the other hand, increasing
group size also increases transaction costs associated with monitoring the actions of other
group members and may, thus, lead to lower levels of commitment (e.g. Coulter et al., 1999).
The age of the group is often used as a proxy for experience-based trust. According to
Meinzen-Dick et al. (1997), individuals in older groups know what to expect from other group
members because they have already built collective cognition associated with shared norms
and values. Hence, we expect that older groups receive higher levels of commitment.

DETERMINANTS OF COLLECTIVE MARKETING PERFORMANCE 9
Regarding the origin of the group, we include a dummy variable that equals one if the
cooperative is a split-off3. In the last two decades, many cooperatives have split from their
mother cooperatives, mostly due to internal disputes among members of the original
cooperative. This process is often accompanied by a financial liquidation (Karanja and Nyoro,
2002). Thus, on one hand, the split-off of a cooperative can be associated with a strengthening
of shared norms and trust among members through a process of self-selection. On the other
hand, in the Kenyan cases, financial constraints associated with the split-off have often
reduced payments to members and may adversely affect members’ commitment to contribute
time and money to the cooperative.
The number of factories is used as an indicator reflecting social heterogeneity of the
membership base. Larger numbers of factories are usually a result of factories being
maintained due to intra-cooperative political dissent. Hence, a larger number of factories can
be associated with higher variability in social background and objectives among members and
is, therefore likely to result in lower levels of perceived commitment4 (Habyarimana et al.,
2009; Baland and Platteau, 1999).
To measure the extent of democratic decision-making we include a dummy variable that
equals one if the cooperative has an above average rate of participation in meetings. In
addition, we include a variable on the number of special resolutions contributed by members
in the last five years. Special resolutions can be contributed by any member of the cooperative
and need to be passed by two thirds of the attending members in a special general meeting.
We expect that higher levels of democratic decision making within a cooperative have a
3 Note that all Kenyan coffee cooperatives were founded by the government and, therefore, it
is of little relevance to make a distinction between state-founded and e.g. farmer-founded
groups in this context.
4 Another potential explanation for a larger number of factories is a higher demand for
processing capacities. However, in the case of Kenyan coffee cooperatives the processing
capacity of the factories is only used up to 20% on the average.

DETERMINANTS OF COLLECTIVE MARKETING PERFORMANCE 10
positive effect on members’ identification with the decisions taken by the group and, thus, a
positive effect on perceived commitment (Stockbridge et al., 2003).
In successful cooperatives or farmers organizations, informal social mechanisms are often
embedded within institutional arrangements, including formal rules and organizational
structures (Ostrom, 1990; Agrawal and Ostrom, 2001; Shiferaw et al., 2008; Stockbridge et
al., 2003). Therefore, the second set of variables included in X2 relates to the institutional
arrangements governing the relationships within the cooperative. We add a dummy variable
that equals one if fines for breaching the by-laws exist. To ensure continuous cooperation,
members need the assurance that other members of the cooperative meet their side of the
bargain (Ostrom, 1990). Hence, we expect that the existence of fines positively effects the
perceived commitment of members.
Furthermore, we include a variable on the extent of price differentiation implemented by the
cooperative. In general, all coffee delivered to the cooperative is pooled and a final producer
price is paid that depends on the average coffee quality produced by all members. This allows
members with low coffee quality to benefit from high coffee qualities delivered by other
members. Given that members with high quality coffee do not receive an adequate price for
their product, their commitment to the cooperative decreases. In this context, if the final price
is paid at the factory rather than the cooperative level, it allows for intra-cooperative, inter-
factory price discrimination. A high value of the included variable indicates that heterogeneity
in the delivered coffee quality among members is mediated by price differentiation across
factories and is, therefore, expected to result in an increased likelihood of members’
commitment at the cooperative level.
Finally, the variables included in X3 refer to the external environment in which the
cooperative operates. Three variables are included to reflect the distance to markets. First, we
measure the average distance in kilometers from members’ farms to an agro-vet shop
reflecting farmers’ access to input markets. Second, we include two variables on the travel
time from the cooperative headquarters to the district headquarters and to Nairobi,
respectively.
Last but not least, we include two variables to control for the personal characteristics of the
secretary manager that might influence his or her ability to estimate member commitment.
The first variable measures the experience of the secretary manager in years. The second
variable is a dummy variable that equals one if the secretary manager holds at least a college
DETERMINANTS OF COLLECTIVE MARKETING PERFORMANCE 11
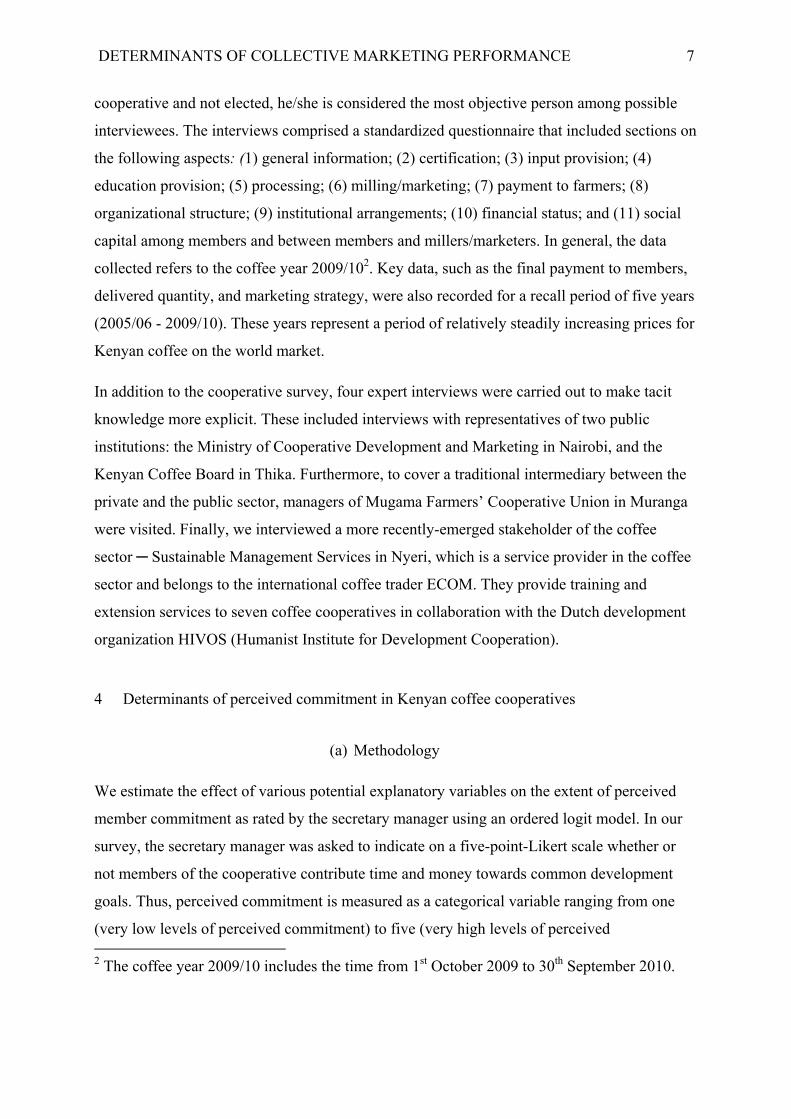
degree. Table 1 provides descriptions and summary statistics for the variables included in the
econometric model on the extent of the perceived commitment.
Table 1: Description and summary statistics for the variables included in the model on the extent of perceived commitment
Variable Measurement Number of observations
Mean Standard Deviation
Measurement scale
Perceived commitment Do members of the coop. contribute time and money towards common development goals? (1= very low level of commitment; 2= low level of commitment; 3= average level of commitment; 4= high level of commitment; 5= very high level of commitment)
119 2.88 1.14 Categorical
Group characteristics Size (members) Number of active members a 119 2071 1905.02 Continuous Age Years since cooperative has been founded 119 20 16.93 Continuous Offspring Cooperative is split-off from mother
cooperative 119 0.76 0.43 Dummy
Number factories Number of factories belonging to cooperative
119 3.24 2.56 Continuous
Democratic decision-making
Participation rate in meeting is above average b
120 .44 .50 Dummy
Number of special resolutions contributed by members in the last five years
114 7.97 3.58 Continuous
Institutional arrangements
Fixation of fine Fixation of fines in by-laws 117 .78 .42 Dummy Intra-cooperative price differentiation
Relative distribution of the final payment across factories over last five years c
120 .90 1.09 Continuous
External environment Distance to markets Average distance (km) from members’
farms to nearest agrovet shop d 119 3.5
3.19 Continuous
Travel time (in minutes) from the cooperative headquarters to district headquarters e
119 66 39.56 Continuous
Travel time (in minutes) from the cooperative headquarters to Nairobi e
119 264 88.99 Continuous
Experience secretary manager
Number of years secretary manager employed in cooperative
102 5.91 4.35 Continuous
Education secretary manager
Secretary manger holds at least college degree
112 0.62 0.49 Dummy
a Active membership requires the delivery of at least one kilogram of coffee cherries to the cooperative within one year. It authorizes the member to receive inputs and further services from the cooperative. b The term for committee membership is fixed at three years. Each year a certain share of members is up for re-election. The election takes place either at the cooperative level or at the factory level. Each cooperative has five, seven or nine committee members, depending on the group size. This implies, considering a three-year rotation term that one, two, or three committee members are re-elected every year. Across all cooperatives, the average participation rate of cooperative members in the election of committee members is 24%. Descriptive statistics show no link between the numbers of committee members that face re-election, the number of factories that vote and the average number of participants in the election. Hence, we use a dummy variable that equals one as an indicator, if the cooperative has an above average rate of election participation.
C The relative distribution is calculated as the highest final price paid by a factory minus the lowest final price paid by a factory divided by the average final price across all factories belonging to the cooperative.

DETERMINANTS OF COLLECTIVE MARKETING PERFORMANCE 12 d The data are based on estimates from the secretary manager.
e The calculation of the travel time is based on the market accessibility analysis developed by the International Center for Tropical Agriculture. The accessibility surface is derived by running a cost distance analysis on the friction surface. The friction surface is a grid where each cell’s value represents the cost of traversing that particular cell. The cost calculation takes into account the road condition, slope of the road, land use class (agriculture/non agriculture), urban areas, rivers and barriers. Further information on this methodology can be found at http://gisweb.ciat.cgiar.org
Source: Authors’ own survey
(b) Results and discussion
Figure 1 shows the distribution of the levels of perceived commitment. The level of perceived
commitment of cooperative members to contribute time and money towards common
development goals differs considerably among the coffee cooperatives in our sample. While
in 31.7% of the cooperatives, the secretary manager stated a very high or high level of
commitment of the cooperative members, in 31.7% of the cooperatives they reported low or
very low levels of commitment.
Figure 2: Distribution of the levels of perceived commitment
Source: Author’s own survey
Table 2 presents the results of the econometric analysis on the determinants of perceived
commitment. The ordered logit model relies on the underlying assumption of proportional
odds across response categories. We use an approximate likelihood ratio test to test the null-
hypothesis that there is no difference between the coefficients across categories. The null-

DETERMINANTS OF COLLECTIVE MARKETING PERFORMANCE 13
hypothesis of proportional odds cannot be rejected indicating that the ordered logit model is
an appropriate specification. An odds ratio greater than one indicates a positive association
between the independent variable and the outcome variable. Accordingly, if the value of the
independent variable increases, the likelihood of being in a higher category, versus the
combined middle and lower categories increases, ceteris paribus. An odds ratio smaller than
one implies that an increase in the value of the independent variable is associated with an
increase in the likelihood of being in a lower category of perceived commitment. In addition,
we apply a likelihood ratio (LR) chi-square test to test the null-hypothesis that all coefficients
are equal to zero, i.e., the model has no explanatory power. The test statistic is significant at
the 1% level, indicating that at least one of the regression coefficients is not equal to zero. We
calculate variance inflation factors, which are smaller than ten, indicating that multi-
collinearity is not a problem.
Table 2: Results of the ordered logit models on the extent of perceived commitment
Dependent variable: perceived commitment (categorical) Odds
ratio
Group characteristics Size (no.) 1.00**
(.00)
Age (years) .98 (.01)
Offspring (0/1) .21** (.14)
Number of factories (no.) .60*** (.11)
High participation in meeting (0/1) 1.69 (.73)
Special resolutions contributed by members in last five years (no.) 1.10*** (.03)
Institutional arrangements Intra-cooperative price differentiation 1.52*
(.37)
Fixation of fines in by-laws (0/1) 3.30** (1.84)
External environment Distance from members´ farm to nearest agrovet shop (km) .92
(.06)
Travel distance from coop. headquarters to district headquarters (min.) 1.00 (.00)
Travel distance from coop. headquarters to Nairobi (min.)
1.00* (.00)
Experience of secretary manager (years) 1.02 (.05)
Education secretary manager (0/1) .80 (.35)
Number of observations 96 LRchi2 (13) 41.27 Prob>chi2 .00 Likelihood-ratio test of proportionality of odds LRchi2 ( 39 ) 50.04 Prob>chi2 .11 Notes: *p<0.10, **p< 0.05, ***p<0.01. Standard errors in parenthesis
Source: Authors’ own survey
DETERMINANTS OF COLLECTIVE MARKETING PERFORMANCE 14
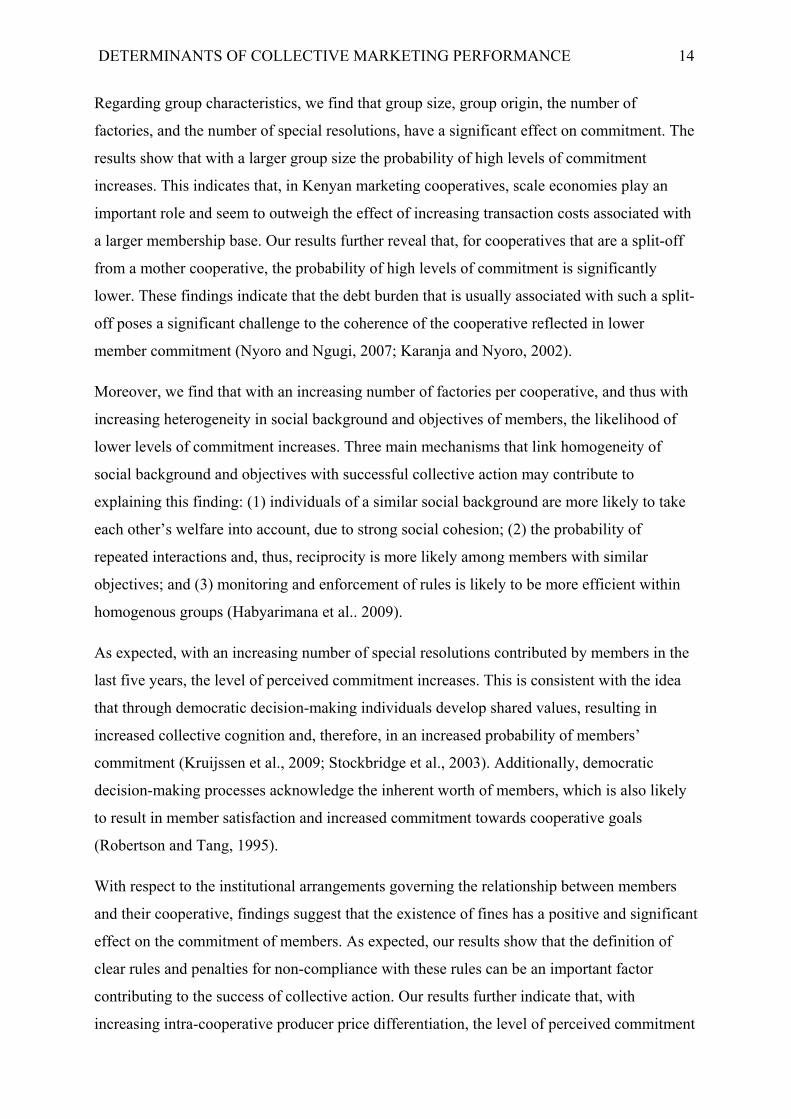
Regarding group characteristics, we find that group size, group origin, the number of
factories, and the number of special resolutions, have a significant effect on commitment. The
results show that with a larger group size the probability of high levels of commitment
increases. This indicates that, in Kenyan marketing cooperatives, scale economies play an
important role and seem to outweigh the effect of increasing transaction costs associated with
a larger membership base. Our results further reveal that, for cooperatives that are a split-off
from a mother cooperative, the probability of high levels of commitment is significantly
lower. These findings indicate that the debt burden that is usually associated with such a split-
off poses a significant challenge to the coherence of the cooperative reflected in lower
member commitment (Nyoro and Ngugi, 2007; Karanja and Nyoro, 2002).
Moreover, we find that with an increasing number of factories per cooperative, and thus with
increasing heterogeneity in social background and objectives of members, the likelihood of
lower levels of commitment increases. Three main mechanisms that link homogeneity of
social background and objectives with successful collective action may contribute to
explaining this finding: (1) individuals of a similar social background are more likely to take
each other’s welfare into account, due to strong social cohesion; (2) the probability of
repeated interactions and, thus, reciprocity is more likely among members with similar
objectives; and (3) monitoring and enforcement of rules is likely to be more efficient within
homogenous groups (Habyarimana et al.. 2009).
As expected, with an increasing number of special resolutions contributed by members in the
last five years, the level of perceived commitment increases. This is consistent with the idea
that through democratic decision-making individuals develop shared values, resulting in
increased collective cognition and, therefore, in an increased probability of members’
commitment (Kruijssen et al., 2009; Stockbridge et al., 2003). Additionally, democratic
decision-making processes acknowledge the inherent worth of members, which is also likely
to result in member satisfaction and increased commitment towards cooperative goals
(Robertson and Tang, 1995).
With respect to the institutional arrangements governing the relationship between members
and their cooperative, findings suggest that the existence of fines has a positive and significant
effect on the commitment of members. As expected, our results show that the definition of
clear rules and penalties for non-compliance with these rules can be an important factor
contributing to the success of collective action. Our results further indicate that, with
increasing intra-cooperative producer price differentiation, the level of perceived commitment
DETERMINANTS OF COLLECTIVE MARKETING PERFORMANCE 15
increases. This also indicates that if suitable mechanisms to deal with heterogeneity are
implemented by the institution, the commitment of cooperative members can effectively be
increased.
Finally, among the variables reflecting the external environment, only the distance to Nairobi
is statistically significant. Unexpectedly, we find that, with an increasing distance to Nairobi,
the likelihood of high levels of perceived commitment experienced by the cooperative
decreases. This is contrary to previous studies that have argued that due to relaxed social ties
and high opportunities for off-farm employment, the commitment of cooperative’s members
is likely to be less prevalent in areas located in close proximity to markets (Ostrom and
Gardener, 1993; Meinzen-Dick et al., 1997). In our study, the negative effect of distance on
commitment might be explained by the fact that, in those districts located further away from
Nairobi, coffee has successively lost importance during recent years and farmers have
replaced their coffee trees with Miraa5 cultivation instead (Mude, 2007).
5 Determinants of the marketing performance of Kenyan coffee cooperatives
(a) Methodology
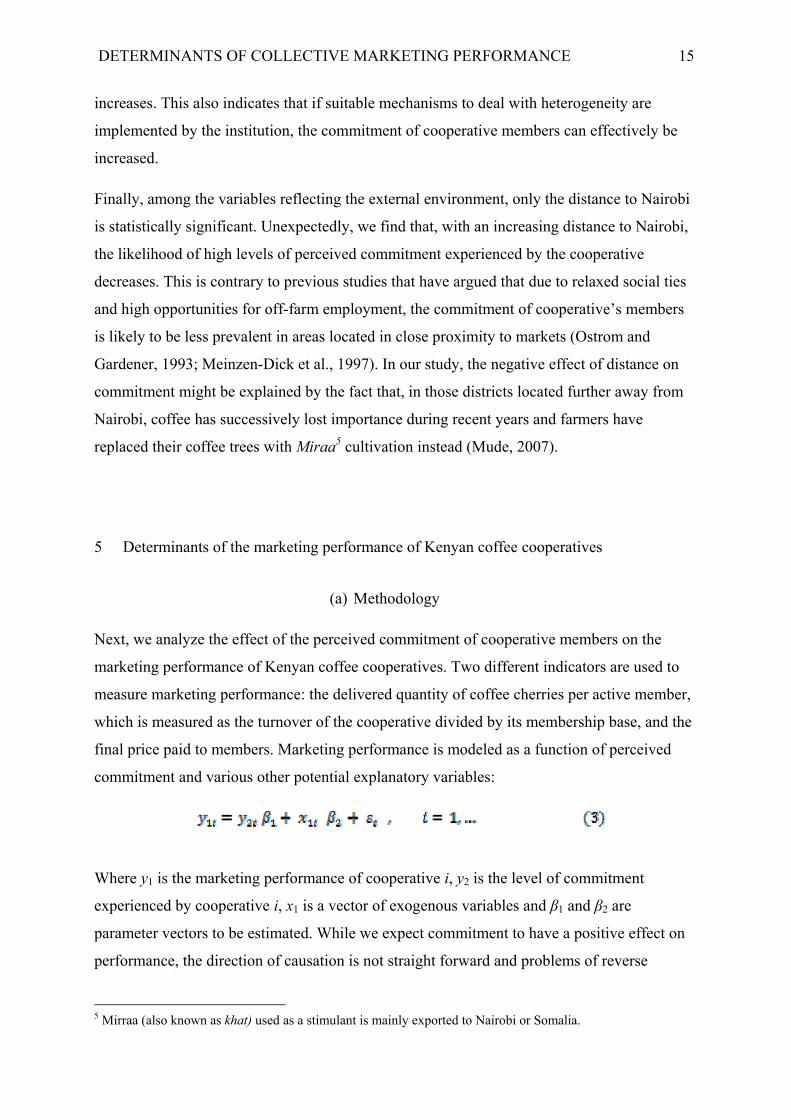
Next, we analyze the effect of the perceived commitment of cooperative members on the
marketing performance of Kenyan coffee cooperatives. Two different indicators are used to
measure marketing performance: the delivered quantity of coffee cherries per active member,
which is measured as the turnover of the cooperative divided by its membership base, and the
final price paid to members. Marketing performance is modeled as a function of perceived
commitment and various other potential explanatory variables:
Where y1 is the marketing performance of cooperative i, y2 is the level of commitment
experienced by cooperative i, x1 is a vector of exogenous variables and β1 and β2 are
parameter vectors to be estimated. While we expect commitment to have a positive effect on
performance, the direction of causation is not straight forward and problems of reverse
5 Mirraa (also known as khat) used as a stimulant is mainly exported to Nairobi or Somalia.

DETERMINANTS OF COLLECTIVE MARKETING PERFORMANCE 16
causality may exist, which would lead to biased estimates in an ordinary least squares
estimation. In particular, it may be the case that low performance levels at the cooperative
level increase the probability of low levels of commitment among members. As a result,
parameter estimates for commitment in a simple regression framework would be biased
upward. In order to control for potential endogeneity of the variable commitment, we apply an
instrumental variables approach, where the first stage equation is specified as:
where x2 is a vector of instruments for the endogenous regressor, perceived commitment, that
satisfy E(εi | x2i)=0 (Cameron and Trivedi, 2010). The two equations are estimated by two-
stage least squares6. As exclusion restrictions, we include the number of special resolutions
contributed by members during the last five years and a dummy variable on the fixation of
fines in the by-laws. While both variables have a significantly positive effect on commitment,
they are not expected to directly influence marketing performance other than through their
indirect effect through commitment.
Farmers are usually paid in two or three installments. The first installment is usually paid at
the beginning of the season, and later installments are made as the cooperative is marketing
the coffee. At the end of the season, after all operating costs, including maintenance and
service expenses, loan repayments and salaries, are deducted from total coffee revenues, the
final payment is made to members. This final payment can be done either at the cooperative
(paying the same final price to all members) or at the factory level (paying the same final
price to members delivering to each factory). In our analysis, the final price per kilogram of
6 We use a linear regression in the first stage of the IV model. According to Angrist and
Krueger (1991) the application of a probit or logit in the first stage is not necessary and is
even self-defeating due to the fact that in a two-stage least square model the consistency of
the parameter estimates in the second stage does not depend on the suitable functional form of
the first stage. In addition, plugging the fitted values of a non-linear estimation in the first
stage directly into a linear regression in the second stage ─ with the exception of when the
assumption of linearity is exactly right ─ can cause inconsistent estimates (Roy and Thorat,
2008).
DETERMINANTS OF COLLECTIVE MARKETING PERFORMANCE 17
coffee is calculated as the sum of all installments throughout the coffee year. If the final
payment is implemented at the factory level, we use the non-weighted average final price
across all factories of the cooperative.
Most importantly, we expect that high levels of perceived commitment increase marketing
performance and, thus, the average quantity of coffee cherries delivered per active member,
which is used as an indicator for the marketing volume of the cooperative. Variables included
as explanatory factors are the marketing strategy of the cooperative, management skills, and
market access. Furthermore, we include a dummy variable that equals one if the cooperative
is located in an area that has suitable agro-climatic conditions for coffee production. Agro-
climatic suitability results in a higher productivity potential and is, therefore, expected to have
a positive impact on the average quantity of coffee delivered. Furthermore, we include a
number of variables that reflect input and service provision by the cooperative. The provision
of farm inputs refers to inorganic fertilizers, pesticides, herbicides, equipment for pruning and
chemical applications, and plant material, such as coffee and shade tree seedlings. Chemicals
and seedlings are mainly provided to members on credit. We, therefore, also include a
variable that measures the average deduction per active member for inputs on credit in our
model. District-level dummies are included to control for regional heterogeneity.
The second model identifies the factors influencing the final price paid to members. We
expect that high levels of perceived commitment increase marketing performance and, thus,
the final price paid to members. Furthermore, we account for the level at which the payment
is implemented (factory or cooperative level); the share of the total revenue that is transferred
to members, and the share of coffee graded as high quality (grades AA/AB). Green coffee in
Kenya is sold by grades7, and coffee prices paid at the auction decrease considerably with a
change from grade AB to C. Therefore, we include the share of green coffee graded as
AA/AB in the regression as a proxy for coffee quality8. Furthermore, marketing strategy,
7 In the mills, the green coffee is graded. Currently, twelve different coffee grades are traded
at the auction (AA/AB/C/E/MH/ML/PB/T/TT/UG/UG1/UG2).
8 Due to the lack of record keeping by the interviewed cooperatives, it was not possible to
obtain data on the produced coffee quantity by coffee grade. Hence, the data are based on
estimates of the individual secretary managers.

DETERMINANTS OF COLLECTIVE MARKETING PERFORMANCE 18
management skills, and market access are likely to be important determinants of the final
price paid to farmers. Regarding the marketing strategy, new opportunities have emerged
during recent years. This includes certification at the cooperative level, which allows
cooperatives to access high-value niche markets. Moreover, the option to directly market
coffee (bypassing the auction) was introduced in 2005/2006. This gives cooperatives the
opportunity to obtain a marketing license authorizing them to bargain directly with coffee
exporters or marketing agents. To control for these marketing strategies, we include two
dummy variables that capture whether or not the cooperative has obtained certification and a
direct marketing license. Further variables that are important in the context of the marketing
strategy relate to the relationship with the miller to which the cooperative delivers. This is
especially critical because in many cases the marketer, who sells the green coffee to exporters
at the coffee auction in Nairobi, is a sub-company of the miller9 and, therefore, marketer
choice is determined by miller choice. Since the monopoly formerly held by Kenya Planters
Cooperative Union (KPCU) was abolished during the liberalization of the milling sector,
coffee milling is now dominated by six companies. However, the qualitative interviews show
that lack of transparency10 and poor services have resulted in low levels of trust between
millers and cooperatives and, thus, in relatively short-term relationships. We account for this
in our analysis by including a variable that captures the share of seasonally changing millers
that the cooperative delivers to. At the cooperative level, the choice of the miller is
determined through democratic elections, where each member can vote for their preferred
miller. In practice, farmers are often offered bribes by millers to buy their votes, resulting in
pressure among members to vote for a specific miller. We include a dummy variable in our
model that captures this aspect of stated election capture by the secretary manager. We expect
that in the case that election capture exists, miller choice is driven by factors other than good
performance and will, therefore, result in lower marketing performance. Finally, district
dummies are included in the model to control for regional heterogeneity. Table 3 describes the
variables included in the marketing performance models and provides summary statistics.
9 Around 83% of the cooperatives in our sample state that at least one of the marketers they
worked with was a sub-company of the miller they delivered to in 2009/10.
10 Lack of transparency is an issue e.g. with respect to the exchange rate between US dollars
and Kenyan shillings or with respect to the extent of processing losses.
DETERMINANTS OF COLLECTIVE MARKETING PERFORMANCE 19
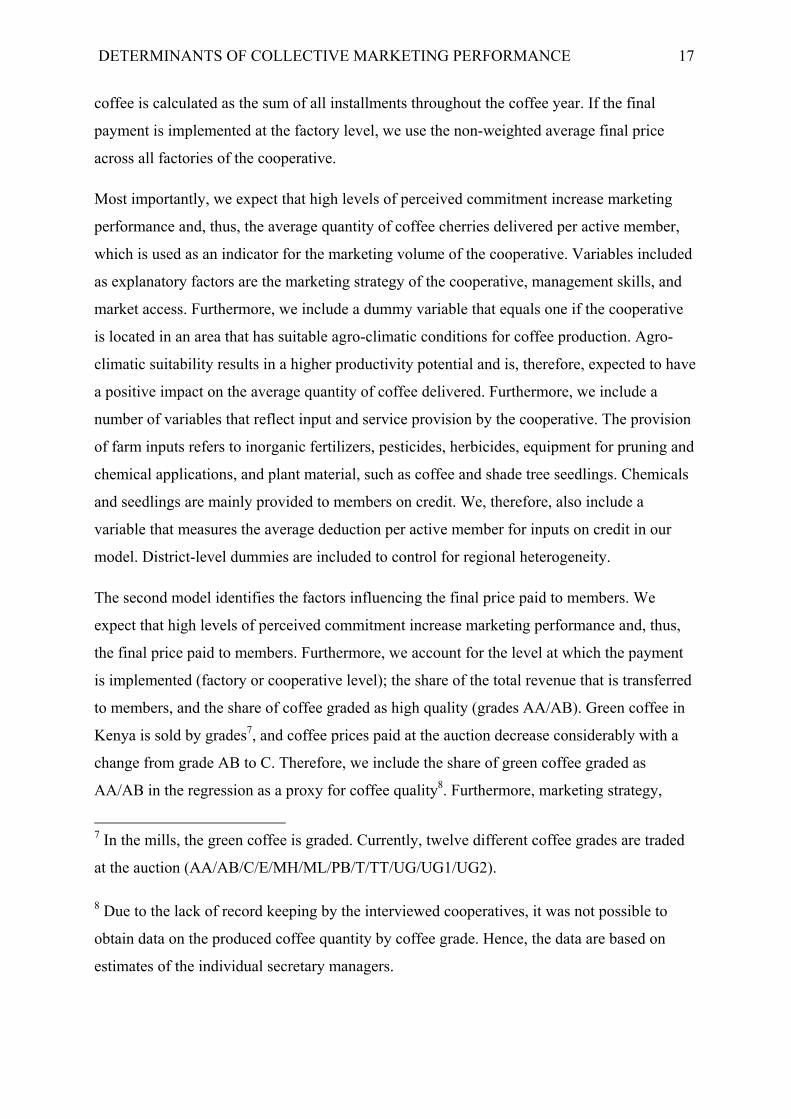
Table 3: Description and summary statistics for the variables included in the marketing performance models
Variable Measurement Number of observations
Mean Standard Deviation
Measurement scale
Average turnover Average quantity of coffee cherries delivered per active member (kg)
116 309.44 140.05 Continuous
Final price Logarithm of final price paid to members (KSh/delivered kg of coffee cherries)
117 3.83 .33 Continuous
Perceived commitment Do members of the coop. contribute time and money towards common development goals? (1= very low level of commitment; 2= low level of commitment; 3= average level of commitment; 4= high level of commitment; 5= very high level of commitment)
119 2.88 1.14 Categorical
Payment level Payment occurs at the cooperative level 119 .37 .48 Dummy Revenue share Revenue share paid to members 118 80.74 5.69 Continuous Quality share Share of green coffee graded as AA/AB 102 53.85 16.40 Continuous
Suitability coffee Land suitable for coffee cultivation a 110 .83 .38 Dummy
Input/service provision
Input provision Input provision through cooperative 119 .90 .30 Dummy Input quantity Average deduction (KSh) per active
member for inputs on credit 112 825.15 1054.95 Continuous
Advance payment Provision of advance payments 119 .78 .41 Dummy
Transport services Provision of transport facilities of coffee cherries from members´ farm to factories
119 .14 .35 Dummy
Trainings index (member)
Number of training days received by the members/(number of active members/average number of participants per training day)
113 .03 .08 Continuous
Marketing strategy
Certification Cooperative is certified 119 .05 .22 Dummy Direct marketing Cooperative used direct marketing
channel 112 .35 .48 Dummy
Instability of marketing strategy
Share of seasonally changing millers over last five years
116 1.11 .78 Continuous
Election capture Pressure among members concerning the vote of the miller exists
115 .54 .50 Dummy
Management skills Rotation factory manager
Factory managers rotate among the cooperative´s factories
119 .40 .49 Dummy
Trainings index (committee members)
Number of training days received by the management/(number of committee members/average number of participants per training day)
119 .19 .24 Continuous
Education cooperative´s leader
Highest educational level of secretary manager or chairman college or university
115 .76 .43 Dummy
Market Access Village distance Average distance (km) from members’
farms to nearest agrovet shop 119 3.5
3.19 Continuous
District headquarters distance
Travel hours (minutes) from the cooperative`s headquarters to district headquarters
119 66 39.56 Continuous
Instrumental Variables Special resolutions Special resolutions contributed by
members in the last five years 114 10.30 6.79 Continuous
Fixation of fines Fixation of fines in by-laws 117 .78 .42 Dummy a This dummy variable considers various agro-ecological aspects, as average annual rainfall of 1200-2500ml, mean annual temperature of 15-24 Celsius, altitude 1100-2073m above sea level and loamy fertile soil of well-drained clay. The GPS coordinates of the cooperatives’ headquarters were used. Source: Authors’own survey

DETERMINANTS OF COLLECTIVE MARKETING PERFORMANCE 20
(b)Results and discussion
Table 4 presents the results of the OLS and two-stage least square estimations for the two
marketing performance models11.
Table 4: Results of the 2SLS and OLS regressions for marketing performance
Average delivered quantity of coffee cherries per active member (kg/active member)
Log of final price paid to members (KSh/delivered kg coffee cherries)
OLS 2SLS OLS 2SLS Perceived commitment 16. 54
(11.00) 37.31** (17.84)
.05** (.02)
.088342* (.04)
Payment level (0/1) .06 (.06)
.04 (.05)
Revenue share .02*** (.00)
.02** (.00)
Quality share -.00 (.00)
-.00 (.00)
Suitability coffee production (0/1)
31.65 (36.46)
47.70 (32.54)
Input/service provision Provision farm inputs (0/1) 94.39**
(45.80) 80.55** (40.02)
Extent of farm input provision (KSh/active member)
.03** (.01)
.03*** (.01)
Provision advance payment (0/1) 39.16 (29.49)
54.36* (27.90)
Provision transport services (0/1) -35.50 (36.19)
-32.26 (31.30)
Trainings index members 205.61* (118.74)
211.14** (102.48)
Marketing strategy Certification (0/1) 115.13
(71.91) 106.06* (62.00)
.12 (.14)
.11 (.12)
Direct marketing (0/1) 14.88 (23.83)
9.95 (21.27)
.01 (.05)
.00 (.04)
Instability of marketing strategy -40.03*** (14.79)
-40.90*** (12.98)
-.06** (.03)
-.06** (.03)
Election capture (0/1) -17.80 (23.83)
-9.95 (20.64)
-.10* (.05)
-.09* (.05)
Management skills Rotation factory manager (0/1) -19.96
(24.08) -21.82 (21.13)
.06 (.05)
.05 (.05)
Trainings index committee members 37.62 (41.78)
36.40 (35.92)
.14 (.09)
.16* (.08)
Education cooperative´s leader (0/1) 21.00 (26.94)
23.48 (24.21)
-.04 (.05)
-.03 (.05)
Market Access Distance from members´ farm to nearest agrovet shop (km)
-2.47 (3.88)
-2.15 (3.34)
-.02** (.01)
-.02* (.00)
Travel distance from coop. headquarters to district headquarters (min.)
.65* (.38)
.76** (.32)
-.00 (.01)
-.00 (.00)
Number of observations 86 84 89 87 F (25,60) 6.23 (25, 58) 5.92 (22,66) 7.95 (22,64) 7.80 Prob>F .0000 .0000 .0000 .0000 Adj R2/ Centered R2 .61 .95 .64 .73
11 Results from the first stage linear regression on commitment are provided by the authors on
request.

DETERMINANTS OF COLLECTIVE MARKETING PERFORMANCE 21
Wu-Hausman F test F p-value
(1/57) 1.40966 .24
(1/62) 1.20 .27
Under-identification test
p-value
.0000
.0000
Stock-Yogo weak ID test
F statistic
11.12
11.11
Sargan statistic p-value
.54
.48
Notes: *p<0.10, **p< 0.05, ***p<0.01. Depicted are coefficients; Standard errors in parenthesis District dummies are included. Full model results including first-stage regression results are available from the authors on request. Source: Authors’ own survey
A Wu-Hausman F test is applied to test the null-hypothesis that the OLS estimator yields
consistent estimates, i.e., the variable commitment is exogenous in the models. For both
models, we cannot reject the null-hypothesis and, hence, in the following, we focus on the
discussion of the OLS results.
The first two columns in Table 4 report the results of the marketing performance model using
the average volumes marketed through the cooperative as an outcome measure. With respect
to this outcome measure, the perceived commitment does not have a significant influence on
performance. We further find that the instability of the marketing strategy reflected by
frequent changes of the miller has a significantly negative effect on the average quantity of
coffee delivered per member. This confirms that insecurity in the marketing relationship
decreases collective marketing performance in terms of both marketed quantity as well as
final price. Furthermore, the average quantity delivered is influenced by the services provided
by the cooperative to its members. Accordingly, we find that the extent of input provision, as
well as the provision of advance payments, both have a significantly positive effect on the
average quantity of coffee delivered to the cooperative. In addition, the number of trainings
provided to the cooperative´s members positively affects the delivered amount of coffee.
Finally, with an increase in the distance of the cooperative headquarters to the district
headquarters, the delivered quantity of coffee cherries increases significantly. For the
performance of the organization, this provides some evidence for the importance of
geographical proximity of the cooperative headquarters to the rural areas where members are
located.
Concerning the final price paid to members, the regression results show that, with increasing
levels of perceived commitment of cooperative’s members, marketing performance increases,
resulting in higher final prices paid to members. Consistent with expectations, we also find
that higher revenue shares transferred to members are associated with higher final prices paid

DETERMINANTS OF COLLECTIVE MARKETING PERFORMANCE 22
per kilogram of coffee. With respect to the marketing strategy, we find that the marketing
relationship with the miller has an important effect on the final price. Both the instability of
the marketing strategy reflected by the frequent change of millers as well as the existence of
election capture are significantly and negatively related to the final price paid to members.
Finally, access to input markets measured as the distance from members´ farms to the nearest
agrovet shop is negatively associated with the final price paid to members. This indicates that
cooperatives operating in more remote, less connected areas pay lower final prices to their
members, which may be partly due to higher operating costs incurred by those cooperatives.
6 Conclusions
In this article, we use survey data from 120 coffee cooperatives located in two provinces of
Kenya to analyze the determinants of collective marketing performance. In particular, we
investigate the factors influencing commitment at the cooperative level and the impact of
commitment on the performance of coffee cooperatives in terms of final price paid to
cooperative members as well as the average quantity delivered to the cooperative per active
member. Performance is measured by two indicators; the quantity of coffee cherries delivered
per active member and the final price paid to members.
The results of an ordered logit model show that member heterogeneity with respect to social
background and objectives, measured by the number of factories, has a negative effect on
commitment. However, the results also suggest that institutional mechanisms, such as intra-
cooperative, inter-factory price differentiation, can mediate the negative effect of
heterogeneity on commitment. Our findings further suggest that democratic decision-making
processes, measured as the number of special resolutions contributed by group members,
positively affect commitment. Finally, we find that the existence of sanctions and fines is
associated with higher levels of commitment. Hence, our findings emphasize the importance
of democratic-decision-making on one hand that empowers members to govern their
cooperative, and strong institutional arrangements on the other hand that legitimize leadership
to take disciplinary action against ‘non-loyal’ behavior.
Member commitment has a significant and positive effect on the final price paid to members.
Since the liberalization of the coffee sector, the organizational structure of the milling and
marketing sector has changed dramatically. Recently, the supply relationship between coffee
cooperatives and millers or marketers has increasingly been characterized by low levels of
DETERMINANTS OF COLLECTIVE MARKETING PERFORMANCE 23
trust and a lack of transparency, resulting in short-term relationships. The payment of bribes
by millers at the farm level results in pressure on committee members from other cooperative
members trying to influence the choice of the miller. Instable marketing relationships
measured in this study as the share of seasonally changing millers over the last five years
results in decreased marketing performance in terms of the final producer price and the
average quantity delivered per active member. The results of this study support the need to
facilitate an institutional environment that fosters transparency, not only within cooperatives,
but also between different stages of the coffee value chain.
References
Agrawal, A. (2001). Common Property Institutions and Sustainable Governance of
Resources. World Development, 29, p.1649-1672.
Angrist, J.D., and Krueger, A.B. (1991). Instrumental Variables and the Search for
identification: from Supply and Demand to Natural Experiments. Journal of Economic
Perspectives, 15, p. 69-85.
Araral, J.E. (2009). What Explains Collective Action in the Commons? Theory and Evidence
from the Philippines. World Development, 37, p.687-697.
Bain, J.S. (1959). Industrial Organization. New York, USA: Wiley.
Baland, J.M., and Platteau, J.P. (1996). Halting Degradation of natural resources: Is there a
role for rural communities? New York, USA: Oxford University Press.
Baland, J.M., and Platteau, J.P. (1999). The Ambiguous Impact of Inequality on Local
Resource Management, World Development, 27, p. 773–788.
Barham, J., and Chitemi, C. (2009). Collective action initiatives to improve marketing
performance: Lessons from farmer groups in Tanzania, Food Policy, 34, p.53-59.
Bebbington, A., Dharmawan, L., Fahmi, E., and Guggenheim, S. (2006). Local capacity,
village governance, and the political economy of rural development in Indonesia, World

DETERMINANTS OF COLLECTIVE MARKETING PERFORMANCE 24
Development, 34, p.1958-1976.
Bernard, T., and Spielman, D. (2009). Reaching the rural poor through rural producer
organizations? A study of agricultural marketing cooperatives in Ethiopia, Food Policy, 34,
p. 60-69.
Cameron, A. C., and Trivedi, P. K. (2010). Microeconomics Using Stata, College Station,
Texas, USA: Stata Press.
Coffee Research Foundation (2012),
http://www.crf.co.ke/index.php?option=com_content&view=article&id=48&Itemid=107.
Collier, P. (1998). Social Capital and Poverty, Social Capital Initiative Working Paper No. 4,
World Bank, Washington D.C., USA.
Coulter, J., Goodland, A., Tallontire, A., and Stringfellow, R. (1999). Marrying farmer
cooperation and contract farming for service provision in a liberalizing Sub-Saharan Africa,
Natural Resource Perspectives, 48, ODI, London, UK.
Devaux, A., Horton, D., Velasco, C., Thiele, G., Lopez, G., Bernet, T., Reinoso, I., and
Ordinola, M. (2009). Collective action for market chain innovation in the Andes, Food Policy,
34, p.31-38.
Fafchamps, M., and Minten, B. (1999). Social Capital and the Firm: Evidence from
Agricultural Trade, Social Capital Initiative Working Paper Series, 17, World Bank,
Washington D.C., USA.
FAOSTAT (2013) http://faostat3.fao.org/faostat-gateway/go/to/download/Q/QC/E
Fischer, E., and Qaim, M. (2011). Linking Smallholder to Markets: determinants and Impacts
of Farmer Collective Action in Kenya, World Development, 40, p. 1255-1268.
Fujiie, M., Hayami, Y., and Kikuchi, M. (2005). The conditions of collective action for local
commons management: The case of irrigation in the Philippines, Agricultural Economics, 33,
DETERMINANTS OF COLLECTIVE MARKETING PERFORMANCE 25
p.179-189.
Grootaert, C., and Van Bastelaer, T. (2001). Understanding and measuring social capital: A
synthesis of findings and recommendations from the social capital initiative, Social capital
Initiative Working Paper Series, 24, World Bank, Washington D.C., USA.
Gruere, G., Nagarajan, L., and King, E. (2009). The role of collective action in the marketing
of underutilized plant species: Lessons from a case study on minor millets in South India,
Food Policy, 34, p. 39-45.
Habyarimana, J. P., Humphreys, M., Posner, D. N., and Weinstein, J. M. (2009): Coethnicity:
Diversity and the dilemmas of collective action, New York, USA: Russell Sage Foundation.
Hardin, G. (1968). The Tragedy of the Commons, Science, 162, p.1243–1248.
Hyde, D. (2008). Global Coffee and Decolonisation in Kenya: Overproduction, quotas and
rural restructuring, Commodities of Empire Working Paper, 8, University of East London,
London, UK.
Isham, J., and Kähkönen, S. (1999). What Determines the Effectiveness of Community –Based
Water Projects? Evidence from Central Java, Indonesia on Demand Responsiveness, Service
Rules, and Social Capital, Social Capital Initiative Working Paper, 14, World Bank,
Washington, D.C., USA.
Karanja, A.M., and Nyoro, J.K. (2002). Coffee process and regulation and their impact on
livelihoods of rural community in Kenya, Tegemeo Institute of Agricultural Policy and
Development, Egerton University, Nairobi, Kenya.
Kersting, S, and Wollni, M. (2012). New institutional arrangements and standard adoption:
Evidence from small-scale and vegetable farmers in Thailand, Food Policy, 37, p. 452-462.
Krishna, A., and Uphoff, N. (1999). Mapping and Measuring Social Capital: A Conceptual
and Empirical Study of Collective Action for Conserving and Developing Watersheds in
Rajasthan, India, Social Capital Initiative Working Paper Series, 13, World Bank,
DETERMINANTS OF COLLECTIVE MARKETING PERFORMANCE 26
Washington D.C., USA.
Kruijssen, F., Keizer M., and Giuliani, A. (2009). Collective action for small-scale producers
of agricultural biodiversity products, Food Policy, 34, p.46-52.
Markelova, H., Meinzen-Dick, R., Hellin, J., and Dohrn, S. (2009): Collective action for
smallholder market access, Food Policy, 34, p.1-7.
Meinzen-Dick, R., DiGregorio, M., and McCarthy, N. (2004). Methods for studying collective
action in rural development, Agricultural Systems, 82, p.197-214.
Meinzen-Dick, R., Mendoza, M.S., Saddoulet, L., Abiad-Shields, G., and Subramanian, A.
(1997). Sustainable water user associations: Lessons from a literature review, In A.
Subramanian, N.V. Jagannathan, N.V.,& R. Meinzen-Dick (Eds.), User organizations for
sustainable water services, World Technical Paper, 354, Washington D.C., USA: World
Bank.
Ministry of Agriculture (2010). Economic review of Agriculture 2010.
http://www.kilimo.go.ke/kilimo_docs/pdf/ERA_2010.pdf.
Mude, A.G. (2007). Institutional Incompatibility and Deregulation: Explaining the Dismal
Performance of Kenya`s Coffee Cooperatives. In C.B. Barrett, A.G. Mude, & J.M. Omitii
(eds.), Decentralization and the Social Economics of Development Lessons from Kenya
(p.33-63). Oxfordshire, UK; Cabi.
Mude, A. (2005). Imperfections in Membership Based Organisations for the Poor: An
Explanation for the Dismal Performance of Kenya’s Coffee Cooperatives. Strategies and
Analysis for Growth and Access (SAGA)Project Policy Brief, Cornell and Clark Atlanta
Universities.
Narrod, C., Roy, D., Okello, J., Avendano, B, Rich, K., & Thorat, A. (2009). Public–private
partnerships and collective action in high value fruit and vegetable supply chains, Food
Policy, 34, p.8-15.
DETERMINANTS OF COLLECTIVE MARKETING PERFORMANCE 27
Nyoro, J.K., and Ngugi, I.K. (2007). A Qualitative Analysis of Success and Failure Factors of
Agricultural Cooperatives in Central Kenya. In C.B. Barrett, A.G. Mude, & J.M. Omitii
(eds.), Decentralization and the Social Economics of Development Lessons from Kenya
(p.13-32). Oxfordshire, UK; Cabi.
Olson, M. (1965). The Logic of Collective Action: Public Goods and the Theory of
Groups, Harvard, USA: Harvard University Press.
Ostrom, E. (1990). Governing the commons: The evolution of institutions for collective action,
Cambridge, UK: Cambridge University Press.
Ostrom, E., and Gardner, R. (1993). Coping with asymmetries in the commons: Self-
governing irrigation systems can work, Journal of Economic Perspectives, 7, p.93-112.
Porter, P. K., and Scully, G.W. (1987). Economic Efficiency in Cooperatives, Journal of Law
& Economics, 30, p.489-512.
Poteete, A. R., and Ostrom E. (2004). Heterogeneity, Group Size and Collective Action: The
Role of Institutions in Forest Management, Development and Change, 35, p.435-461.
Reid, C., and Salmen, L. (2000). Understanding Social Capital. Agricultural Extension in
Mali: Trust and Social Cohesion, Social Capital Initiative Working Paper Series, 22, World
Bank, Washington D.C., USA.
Rose, R. (1998). Getting Things Done in an Anti-Modern Society: Social Capital Networks in
Russia, Social Capital Initiative Working Paper Series, 6, World Bank, Washington D.C.,
USA.
Roy, D., and Thorat, A. (2008). Success in High Value Horticultural export Markets for the
Small Farmers: The Case of Mahagrapes in India, World Development, 36, p. 1874-1890.
Stringfellow, R., Coulter, J., Lucey, T., McKone, C., and Hussain, A. (1997). Improving the
access of smallholders to agricultural services in Sub-Saharan Africa: Farmer cooperation
and the role of the donor community, Natural Resource Perspective, 20, ODI, London, UK.

DETERMINANTS OF COLLECTIVE MARKETING PERFORMANCE 28
Stockbridge, M., Dorward, A., and Kydd, J. (2003). Farmer organizations for market access:
Learning from success.
http://econegociosagricolas.com/ena/files/farmer_organisations_for_market_access-
stockbridge.pdf.
Ternstrom, I. (2003). The management of common pool resources: Theoretical essays and
empirical evidence. Unpublished doctoral dissertation, The Economic Research Institute of
the Stockholm School of Economics, Stockholm, Sweden. http://hhs.diva-
portal.org/smash/record.jsf?pid=diva2:221416
Uphoff, N. (2000). Understanding Social Capital: Learning from the Analysis and Experience
of Participation. In P. Dasgupta, & I. Seragedlin (Eds.), Social Capital: A Multifaceted
Perspective. Washington D.C., USA: World Bank
Vandeplas, A.; Minten, B.; and Swinnen, J. (2013). Multinationals vs. Cooperatives: The
Income and Efficiency Effects of Supply Chain Governance in India, Journal of Agricultural
Economics, 64, 217-244
Wade, R. (1998). Village republics: Economic conditions for collective action in South India.
Oakland, USA: ICS Press.
Wambugu, S.N., Okello, J.J., and Nyikal, R.A. (2010). Effect of Social Capital on
performance of smallholder organizations in Western Kenya, Journal of Agricultural Science
and Technology, 4, p.10-19.
Wollni, M., and Zeller, M. (2007). Do farmers benefit from participating in specialty markets
and cooperatives? The case of coffee marketing in Costa Rica, Agricultural economics, 37, p.
243-248.


![Experience in collective potato marketing of the ... · PDF fileExperience in collective potato marketing of the Fédération des Paysans [Smallholders’ Federation] of Fouta Djallon](https://static.cupdf.com/doc/110x72/5aaeeab77f8b9a59478cab87/experience-in-collective-potato-marketing-of-the-in-collective-potato-marketing.jpg)


