Design of Piezoelectric Micromachined Ultrasonic Transducer
(PMUT) Arrays for Intrabody Networking Applications
A Thesis Presented
by
Bernard Herrera Soukup
to
The Department of Electrical and Computer Engineering
in partial fulfillment of the requirements
for the degree of
Master of Science
in
Electrical and Computer Engineering
Northeastern University
Boston, Massachusetts
August 2017

Contents
List of Figures iv
List of Tables vi
List of Acronyms vii
Acknowledgments ix
Abstract of the Thesis x
1 Introduction 11.1 Motivation . . . . . . . . . . . . . . . . . . . . . . . . . . . . . . . . . . . . . . . 21.2 Previous Work . . . . . . . . . . . . . . . . . . . . . . . . . . . . . . . . . . . . . 31.3 State of the Art . . . . . . . . . . . . . . . . . . . . . . . . . . . . . . . . . . . . 4
2 Background 82.1 PMUTs . . . . . . . . . . . . . . . . . . . . . . . . . . . . . . . . . . . . . . . . 82.2 Piezoelectric Actuation . . . . . . . . . . . . . . . . . . . . . . . . . . . . . . . . 92.3 Mechanics of a Vibrating Membrane . . . . . . . . . . . . . . . . . . . . . . . . . 102.4 Acoustic Radiation . . . . . . . . . . . . . . . . . . . . . . . . . . . . . . . . . . 102.5 PMUT Models . . . . . . . . . . . . . . . . . . . . . . . . . . . . . . . . . . . . 12
2.5.1 Equivalent Circuits . . . . . . . . . . . . . . . . . . . . . . . . . . . . . . 122.5.2 Matrix Models . . . . . . . . . . . . . . . . . . . . . . . . . . . . . . . . 15
2.6 Transducer Arrays . . . . . . . . . . . . . . . . . . . . . . . . . . . . . . . . . . . 152.7 Performance Parameters . . . . . . . . . . . . . . . . . . . . . . . . . . . . . . . 16
2.7.1 Electromechanical Coupling Factor . . . . . . . . . . . . . . . . . . . . . 162.7.2 Quality Factor . . . . . . . . . . . . . . . . . . . . . . . . . . . . . . . . 17
3 PMUT Array Design 183.1 Design Constraints . . . . . . . . . . . . . . . . . . . . . . . . . . . . . . . . . . 193.2 700 kHz Resonant Frequency . . . . . . . . . . . . . . . . . . . . . . . . . . . . . 21
3.2.1 Resonant Frequency . . . . . . . . . . . . . . . . . . . . . . . . . . . . . 213.2.2 Source Impedance Matching . . . . . . . . . . . . . . . . . . . . . . . . . 233.2.3 Modeling . . . . . . . . . . . . . . . . . . . . . . . . . . . . . . . . . . . 25
ii

3.2.4 Load Impedance Matching . . . . . . . . . . . . . . . . . . . . . . . . . . 253.2.5 Bandwidth . . . . . . . . . . . . . . . . . . . . . . . . . . . . . . . . . . 263.2.6 Directivity . . . . . . . . . . . . . . . . . . . . . . . . . . . . . . . . . . 273.2.7 System-wide Model . . . . . . . . . . . . . . . . . . . . . . . . . . . . . 29
3.3 2 MHz Resonant Frequency . . . . . . . . . . . . . . . . . . . . . . . . . . . . . 313.3.1 Resonant Frequency . . . . . . . . . . . . . . . . . . . . . . . . . . . . . 313.3.2 Source Impedance Matching . . . . . . . . . . . . . . . . . . . . . . . . . 313.3.3 Modeling . . . . . . . . . . . . . . . . . . . . . . . . . . . . . . . . . . . 323.3.4 Load Impedance Matching . . . . . . . . . . . . . . . . . . . . . . . . . . 323.3.5 Bandwidth . . . . . . . . . . . . . . . . . . . . . . . . . . . . . . . . . . 333.3.6 Directivity . . . . . . . . . . . . . . . . . . . . . . . . . . . . . . . . . . 333.3.7 System-wide Model . . . . . . . . . . . . . . . . . . . . . . . . . . . . . 33
4 Fabrication 354.1 Process . . . . . . . . . . . . . . . . . . . . . . . . . . . . . . . . . . . . . . . . 374.2 Layout . . . . . . . . . . . . . . . . . . . . . . . . . . . . . . . . . . . . . . . . . 37
5 Conclusion 39
Bibliography 41
iii

List of Figures
1.1 Summary of implantable devices with their corresponding transmission requirements 31.2 General ultrasonic transducer frequency limits for corresponding communication
ranges . . . . . . . . . . . . . . . . . . . . . . . . . . . . . . . . . . . . . . . . . 41.3 Principle of operation illustration for bimorph PMUTs . . . . . . . . . . . . . . . 51.4 Structure of curved PMUT . . . . . . . . . . . . . . . . . . . . . . . . . . . . . . 61.5 Structure of ring PMUT . . . . . . . . . . . . . . . . . . . . . . . . . . . . . . . . 61.6 Membrane maximum displacement frequency response and mode shapes for rectan-
gular PMUT . . . . . . . . . . . . . . . . . . . . . . . . . . . . . . . . . . . . . . 7
2.1 Ultrasonic electroacoustic transducer topologies . . . . . . . . . . . . . . . . . . . 92.2 Single element directivity for varying membrane radius . . . . . . . . . . . . . . . 122.3 PMUT Equivalent Circuit . . . . . . . . . . . . . . . . . . . . . . . . . . . . . . . 142.4 Van Dyke equivalent circuit . . . . . . . . . . . . . . . . . . . . . . . . . . . . . . 142.5 Schematic illustration of beam forming and steering . . . . . . . . . . . . . . . . . 16
3.1 Connections to FPGA Diagram . . . . . . . . . . . . . . . . . . . . . . . . . . . . 203.2 700 kHz transducer vented and sealed cavity Comparison . . . . . . . . . . . . . . 223.3 700 kHz transducer performance in air. . . . . . . . . . . . . . . . . . . . . . . . . 233.4 700 kHz transducer source impedance Matching . . . . . . . . . . . . . . . . . . . 243.5 700 kHz transducer frequency response with matching inductor . . . . . . . . . . . 243.6 700 kHz transducer single element output acoustic pressure vs distance . . . . . . 263.7 700 kHz transducer receiver electric output for a varying load . . . . . . . . . . . . 273.8 700 kHz transducer frequency response . . . . . . . . . . . . . . . . . . . . . . . 273.9 Array directivity . . . . . . . . . . . . . . . . . . . . . . . . . . . . . . . . . . . . 283.10 Three-dimensional directivty plots for PMUT arrays . . . . . . . . . . . . . . . . . 293.11 System-wide components and variables . . . . . . . . . . . . . . . . . . . . . . . 303.12 System-wide ADS simulation circuit . . . . . . . . . . . . . . . . . . . . . . . . . 303.13 700kHz transducer receiver short-circuit current vs number of array elements . . . 303.14 2MHz transducer frequency response in water . . . . . . . . . . . . . . . . . . . . 313.15 2MHz transducer source impedance matching . . . . . . . . . . . . . . . . . . . . 323.16 2MHz transducer matched frequency response . . . . . . . . . . . . . . . . . . . . 323.17 2MHz transducer single element output acoustic pressure vs distance . . . . . . . . 343.18 2 MHz transducer frequency response . . . . . . . . . . . . . . . . . . . . . . . . 34
iv

4.1 PMUT main fabrication options . . . . . . . . . . . . . . . . . . . . . . . . . . . 364.2 Optical images of fabrication steps . . . . . . . . . . . . . . . . . . . . . . . . . . 374.3 Layout components . . . . . . . . . . . . . . . . . . . . . . . . . . . . . . . . . . 38
v

List of Tables
1.1 State-of-the-art PMUT Parameters . . . . . . . . . . . . . . . . . . . . . . . . . . 7
2.1 Equivalent circuit analog variables . . . . . . . . . . . . . . . . . . . . . . . . . . 13
3.1 PMUT Parameters . . . . . . . . . . . . . . . . . . . . . . . . . . . . . . . . . . 203.2 Design Constraints . . . . . . . . . . . . . . . . . . . . . . . . . . . . . . . . . . 213.3 Cavity Radii for 700kHz resonant frequency . . . . . . . . . . . . . . . . . . . . . 223.4 700 kHz transducer matching inductor value . . . . . . . . . . . . . . . . . . . . . 243.5 700 kHz transducer matrix model parameters . . . . . . . . . . . . . . . . . . . . 253.6 700 kHz transducer medium parameters . . . . . . . . . . . . . . . . . . . . . . . 263.7 700 kHz transducer system-wide performance summary . . . . . . . . . . . . . . . 303.8 700 kHz transducer system-wide performance summary. No source impedance
matching . . . . . . . . . . . . . . . . . . . . . . . . . . . . . . . . . . . . . . . 313.9 Cavity radius for 2MHz resonant frequency . . . . . . . . . . . . . . . . . . . . . 313.10 2MHz transducer matching inductance value . . . . . . . . . . . . . . . . . . . . . 333.11 2MHz transducer matrix model parameters . . . . . . . . . . . . . . . . . . . . . 333.12 2MHz transducer system-wide performance summary . . . . . . . . . . . . . . . . 333.13 2MHz transducer system-wide performance summary. No source impedance matching. 34
4.1 Main fabrication options . . . . . . . . . . . . . . . . . . . . . . . . . . . . . . . 364.2 Fabrication process flow . . . . . . . . . . . . . . . . . . . . . . . . . . . . . . . 37
vi

List of Acronyms
ADC Analog to Digital Converter
ADS Advanced Design System
AlN Aluminum Nitride
BAN Body Area Network
BW Band Width
CMUT Capacitive Micromachined Ultrasonic Transducer
DC Direct Current
DRIE Deep Reactive Ion Etching
DSP Double Side Polished
ECG Electro Cardio Gram
EEG Electro Encephalo Gram
EMG Electro Myo Gram
FEM Finite Element Modeling
FPGA Field Programmable Gate Array
GSG Ground Signal Ground
IVUS Intra Vascular Ultra Sound
KOH Potassium Hydroxide
LTO Low Temperature Oxide
MAC Medium Access Control
MEMS Micro Electro Mechanical Systems
MPPT Maximum Power Point Tracking
vii

PMUT Piezoelectric Micromachined Ultrasonic Transducer
RF Radio Frequency
SiO2 Silicon Dioxide
SiN Silicon Nitride
SOI Silicon On Insulator
SONAR SOund Navigation and Ranging
UCD University of California Davis
XeF2 Xenon Difluoride
viii

Acknowledgments
I would like to warmly regard my advisor, Prof. Matteo Rinaldi, for his continuous trustand support. I also want to thank my committee members: Prof. Tommaso Melodia, with whom wecollaborate in this project and Prof. Aatmesh Shrivastava.
Additionally, I want to acknowledge Cristian Cassella’s mentorship and the guidance fromGuofeng Chen and William Zhu, especially regarding fabrication.
ix

Abstract of the Thesis
Design of Piezoelectric Micromachined Ultrasonic Transducer (PMUT)
Arrays for Intrabody Networking Applications
by
Bernard Herrera Soukup
Master of Science in Electrical and Computer Engineering
Northeastern University, August 2017
Dr. Matteo Rinaldi, Advisor
The present work details the design process for Piezoelectric Micromachined UltrasonicTransducer (PMUT) arrays for wireless intrabody networking applications. Transducers operating at0.7 and 2MHz are designed for creating a communication link in the body medium interfacing withField Programmable Gate Array (FPGA) based circuitry and transmission protocols developed inprevious work. After definition of the transducer geometry, design constraints such as dimensions,source power, directivity, transmission distance, and bandwidth are addressed for allowing thetransducers to operate within miniaturized implantable devices.
A matrix model is obtained for the transducer and, along with a medium transmissionmodel, a system-wide representation is obtained allowing simulation of the transmitter, medium andreceiver arrangement with varying parameters. An equivalent circuit model is also developed forprediction of performance parameters. The necessary quantities for these models are extracted fromFinite Element Modeling (FEM) simulation.
A micro fabrication process is also developed for the designed topology and progress in itsimplementation is shown.
x
Chapter 1
Introduction
SOund Navigation and Ranging (SONAR) and Ultrasound Imaging are well established
technologies that, albeit operating in widely distant scales, have the commonality of being based on
ultrasonic wave transmission. Both use timing information between emission and reception of an
ultrasonic pulse that is reflected from an object of interest to estimate the distance to it. The same
principle is used but the dimensions, operating frequencies and intensities allowed for safe operation
are orders of magnitude away.
The operation of SONAR is characterized by low frequency, large transducers designed for
long distances. Applications of the technology include bottom topology mapping in oceanography,
submarine guidance and communication systems and sonobuoy beacons [1]. Contrasting to this,
ultrasound imaging uses high frequency ultrasound at short distances having the advantage of
improved resolution.
The point of this digression is to illustrate the versatility of ultrasound to adapt to different
scenarios. Even so, it has not reached the popularity of Radio Frequency (RF) wave transmission due
to the superiority of electromagnetic wave transmission in air at long distances. When the medium is
changed to water, the story is quite different however, as radio waves have a very high attenuation in
this medium.
This fact, plus the developments in Micro Electro Mechanical Systems (MEMS), open up
new possibilities for utilization of ultrasonic waves. The small form factor, plus better matching to
aqueous media, has already been exploited by miniaturized ultrasound imaging devices and Intra
Vascular Ultra Sound (IVUS) for imaging or kidney stone oblation [2].
Nevertheless, the implementation of ultrasound for medical applications has been limited
to stand-alone devices, leaving the known possibility of communication by ultrasonic waves behind.
1

CHAPTER 1. INTRODUCTION
It is here that a qualitative leap has been proposed [3], [4] to exploit this capability for developing
ultrasound-based Body Area Network (BAN)s. The present work fits within this framework by
exploiting the advantages of MEMS technology to develop transducers optimized for the requirements
of intra-body communication.
1.1 Motivation
The main motivation for pursuing wireless communication within the body is to provide a
wide platform to enhance the functionality of implantable devices. The objective is not to address
a specific illness or condition but to provide a wide ranging platform for several kinds of sensors
and actuators that either only function within the body or for which the performance or accuracy is
greater if they are implanted.
The most widespread and evident of these applications is pacemakers. Advancements in
pacemaker technology currently allow them to be reprogrammed based on the user’s progress and
even some dynamically adjust the pace relative to the level of activity measured by accelerometers,
metabolic or blood oxygen saturation implantable sensors [5]. A distributed pacemaker, in which the
stimulation not only occurs on a particular region of the heart but on several spots with a coordination
scheme can also make the heart response smoother and better controlled. For all of this possibilities,
a wireless communication network is a requirement.
Pacemakers also operate on batteries that require periodic replacement. This involves
a surgical procedure with a higher associated risk of infection on each iteration. The same wire-
less ultrasonic link developed for communication can be used for energy transmission for battery
recharging. Furthermore, the ultrasonic transducer may work as an energy harvester by converting
available acoustic energy from ambient noise to electrical energy that can charge the batteries when
the communication link is not in use.
Metabolyte (specific chemicals present in the body regulating or aiding a particular func-
tion) regulation is also a major possible field of application. The most known of these is insuline,
which needs to be artificially provided in patients with diabetes. Implantable chemical dispensers are
a possible solution to this which could be networked to an insuline level sensor or a programmable
control unit in general [6]. Other examples of chemical regulation include the endocrine system
(hormone regulation) or drug dispensers localized on the affected area, like a cancerous tumor
Telemetry and logging of measurements from several implanted sensors on a centralized
unit is another possibility for monitoring patients that are recovering from surgery or who suffer from
2

CHAPTER 1. INTRODUCTION
a chronic disease. The centralized unit can then be connected to a mobile device or to the internet
to be accessed by a physician. Electro Cardio Gram (ECG) signals, heart rate, blood oxygen level,
pressure and position and orientation of the body are measurements that these implanted sensors
could provide to obtain an integral snapshot of the current state of the patient [6].
Figure 1.1 shows a summary of sensors and other more complex devices that could be
interfaced to a BAN with their data transmission rate and corresponding bandwidth requirements.
Figure 1.1: Summary of implantable devices with their corresponding transmission requirements(from [7])
1.2 Previous Work
In [3], ultrasonic waves are proposed as a physical medium for communication in BANs.
An overview of the requirements and challenges is also presented. After an initial model for
transmission of acoustic waves within the body is developed, the wide range of possible dimensions
of the transducers and their operating frequencies is narrowed (Figure 1.2). Considerations such as
bandwidth, reflection and scattering issues and health concerns are initially addressed.
A Medium Access Control (MAC) scheme is proposed which is further developed in [4].
An Adaptive Time hopping scheme, based on short pulses of ultrasound, is detailed. The short-
duration pulses reduce detrimental heating effects in tissue while limiting reflections and scattering.
3
CHAPTER 1. INTRODUCTION
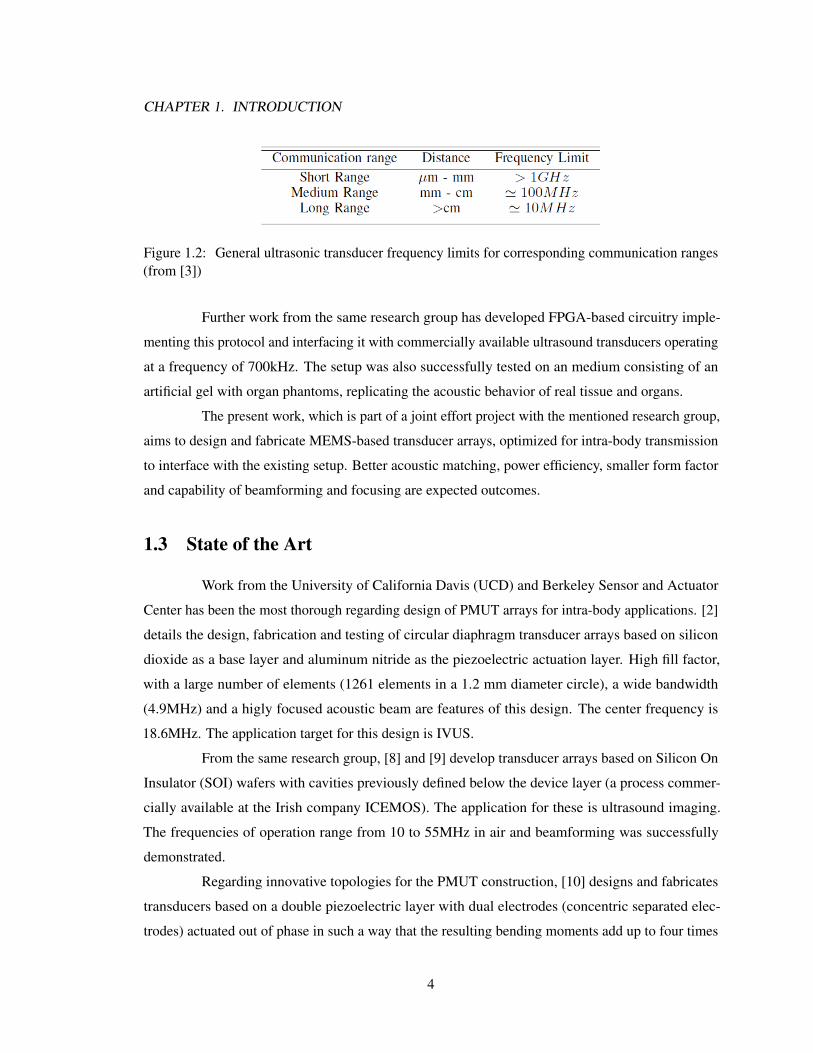
Figure 1.2: General ultrasonic transducer frequency limits for corresponding communication ranges(from [3])
Further work from the same research group has developed FPGA-based circuitry imple-
menting this protocol and interfacing it with commercially available ultrasound transducers operating
at a frequency of 700kHz. The setup was also successfully tested on an medium consisting of an
artificial gel with organ phantoms, replicating the acoustic behavior of real tissue and organs.
The present work, which is part of a joint effort project with the mentioned research group,
aims to design and fabricate MEMS-based transducer arrays, optimized for intra-body transmission
to interface with the existing setup. Better acoustic matching, power efficiency, smaller form factor
and capability of beamforming and focusing are expected outcomes.
1.3 State of the Art
Work from the University of California Davis (UCD) and Berkeley Sensor and Actuator
Center has been the most thorough regarding design of PMUT arrays for intra-body applications. [2]
details the design, fabrication and testing of circular diaphragm transducer arrays based on silicon
dioxide as a base layer and aluminum nitride as the piezoelectric actuation layer. High fill factor,
with a large number of elements (1261 elements in a 1.2 mm diameter circle), a wide bandwidth
(4.9MHz) and a higly focused acoustic beam are features of this design. The center frequency is
18.6MHz. The application target for this design is IVUS.
From the same research group, [8] and [9] develop transducer arrays based on Silicon On
Insulator (SOI) wafers with cavities previously defined below the device layer (a process commer-
cially available at the Irish company ICEMOS). The application for these is ultrasound imaging.
The frequencies of operation range from 10 to 55MHz in air and beamforming was successfully
demonstrated.
Regarding innovative topologies for the PMUT construction, [10] designs and fabricates
transducers based on a double piezoelectric layer with dual electrodes (concentric separated elec-
trodes) actuated out of phase in such a way that the resulting bending moments add up to four times
4

CHAPTER 1. INTRODUCTION
the moment of a single layer, thus producing a four fold greater output pressure. Figure 1.3 shows
the topology for the transducer.
Figure 1.3: Principle of operation illustration for bimorph PMUTs. a) Single layer, b) Single layerwith differentially-driven electrodes, c) Bimorph and differential drive (from [10])
[11] shows a stress engineering approach to create curved diaphragm PMUTs optimizing
the fill factor for the same radius and increasing the output pressure. The construction, based on the
difference of residual stresses after deposition of silicon nitride and Low Temperature Oxide (LTO)
films, can be seen in Figure 1.4.
A ring shape for the diaphragm is used in [12], which allows for an additional degree of
freedom in the geometry of the PMUT as both the radius of the structure as well as its width can
be separately varied. Reportedly, the width sets the main resonant frequency while the radius sets a
second, acoustically matched, frequency in the same mode of vibration when the device operates
in fluid. Selection of an adequate radius that produces a peak on the second resonant frequency
allows both resonant modes to merge resulting in a large bandwidth spectrum. A 620kHz, tunable
bandwidth was reported. Figure 1.5 shows the geometry of the device.
5

CHAPTER 1. INTRODUCTION
Figure 1.4: Structure of curved PMUT (from [11])
Figure 1.5: Structure of ring PMUT (from [12])
6

CHAPTER 1. INTRODUCTION
An option for achieving a higher bandwidth is shown in [13], where long, rectangular
diaphragms are built that have several mode shapes at resonant frequencies in air that are close
together. Once the devices operate in water, the peaks become less narrow and merge in a wide
region of large response. Figure 1.6 illustrates the geometry, modes of operation and frequency
response in air (when in fluid, the peaks of the frequency response merge together).
Figure 1.6: a) Membrane maximum displacement frequency response and b) Mode shapes forrectangular PMUT(from [13])
The performance data obtained in the main state-of-the-art papers is collected in Table 1.1.
Source [2] [8] [10] [11] [12] [13]Structure Cavity Cavity Bimorph Curved Ring Rect.Radius (µ m) 25 50 170 200 275 1550x250Passive layer (um) 0.8 2.5 0.15 4.65 1 11Piezoelectric (um) 0.95 0.8 0.95 2 0.8 2Array Number 1261 72x9 1 1 1 1Air f0 (MHZ) 18.6 19 0.345 0.647 2 1.12Fluid ∆f (MHZ) 4.9 3.4 - - 0.8 1Air ∆ymax (nm/V) - 13.7 452 40 100 -P (kPa/V) 2 - - - - -Quality Factor 45 140 - - - -
Table 1.1: State-of-the-art PMUT Parameters
7

Chapter 2
Background
2.1 PMUTs
There are several methods for electroacoustic actuation, including magnetic fields on a
coil producing motion of a magnet, an electrostatic force creating the vibration or piezoelectric
strain being generated from applied electric potential. The first has been widely used in speakers
and underwater transducers but is not easily subject to miniaturization. The second is the basis for
operation of the Capacitive Micromachined Ultrasonic Transducer (CMUT), where the ”capacitive”
term comes from the geometry of the transducer being an electrode separated by air (dielectric)
to another one and is characterized by a varying capacitance. Even though CMUTs do benefit
from MEMS techniques to be miniaturized, they present the drawback of requiring a high Direct
Current (DC) bias for achieving high performance. The final option, piezoelectric actuation, allows
for miniaturization with less geometric constraints, and lower power requirements [14]. The topology
of the small form factor transducers can be seen in Figure 2.1.
PMUTs operate by the conversion of electrical potential to mechanical force through the
piezoelectric material. A thin layer of piezoelectric material, together with some thin passive layer,
form a membrane. When the piezoelectric material tries to contract or expand, as the membrane is
clamped on the edges, it produces a deformation that displaces the membrane out of the horizontal
plane, displacing the medium around it and creating a pressure wave.
8

CHAPTER 2. BACKGROUND
Figure 2.1: Ultrasonic electroacoustic transducer topologies: a)d33 mode bulk piezoelectric ultrasonictransducer, b) CMUT, c) PMUT
2.2 Piezoelectric Actuation
Piezoelectricity is a phenomenon appearing in several crystalline materials in which a
stress applied on a material (piezo derived from the greek piezein meaning squeeze) creates an
electric potential. The converse effect also occurs: applying a voltage to a piezoelectric material
causes it to expand or contract depending on the polarity of this voltage [1]
As both the mechanical, elastic stress-strain relationship and the piezoelectric effect coexist
in the material, a matrix relationship is used to express both simultaneously. The equations relating
these variables are as follow, where S and T are 1x6 column matrices containing the longitudinal
and shear components of stress and strain respectively, d is a 3x6 matrix of the corresponding
piezoelectric coefficients, εT is a 3x3 matrix containing permittivity coefficients, and the superscripts
denote which variable was held constant when measuring the coefficients in order to represent only
the effect of the variable that is being changed [1]:
S = sET + dtE (2.1)
D = dT + εTE (2.2)
Many of the coefficients involved are null and the relationships from (2.1) and (2.2) reduce
to four linear equations for two cases of practical interest: the electric field and the corresponding
strain is parallel, related to piezoelectric coefficient d33, and the electric field is perpendicular to the
resulting strain, relating to d31. Talking specifically about the PMUT geometry, d33 relates a potential
applied on the faces of the membrane to expansion or contraction in a direction perpendicular to this
faces. d31 relates the same applied potential to a lateral contraction of the membrane, causing it to
deflect out of plane as it is clamped on the edges (Figure 2.1).
9

CHAPTER 2. BACKGROUND
2.3 Mechanics of a Vibrating Membrane
Any material, within its elastic regime, is subject to a linear stress-strain relationship when
it is compressed or expanded. This is characterized by the bulk material property Young’s modulus
(E) and the geometry. The contraction or expansion perpendicular to the applied force (as the volume
of the element must remain constant) is characterized by the material’s bulk Poisson ratio (ν). When
bending is involved, the Young’s modulus does not characterize the problem fully, but the flexural
rigidity, which is obtained by use of the elastic modulus and integration over the geometry.
Additional considerations must be taken in our scenario as the membrane of the PMUT
does not only statically deflect but vibrates as a specific frequency. The mass of the membrane itself
affects this dynamic behaviour, depending on it’s density (ρ). The resistance of the medium affects
the vibration as a load, characterized by it’s acoustic impedance, which is frequency dependent.
Also, the piezoelectric material relates the stiffness of the membrane to the electrical domain, where
frequency dependent loading effects also occur. It is because of this multidomain dependance that
the vibrating membrane cannot be characterized in isolation but the equivalent circuit approach will
be taken as explained in Chapter 2.5.1.
However, a useful link between the mechanics of the membrane and its resonant frequency
in air, where very little medium loading occurs, can be seen in equation (2.3). This relationship only
holds if the residual stress (present in the membrane without actuation, due to the fabrication only) is
low [8]. On equation (2.4), it is important to note that the Young’s modulus depends on the distance
to the neutral axis (z) as there are several materials in the stack.
f0 =
(3.2
r
)2√D
ρ(2.3)
D =
∫ top
bot
E(z)z2
1 − ν(z)2dz (2.4)
2.4 Acoustic Radiation
An element vibrating within a medium produces a disturbance in the latter. Regarding
a vibrating membrane, when it bulges out into the surrounding medium, it pushes the particles
composing it closer together (compression), and when it retracts, it pulls them further away from
each other (rarefaction). This effect progressively spreads out through the medium as a pressure
wave.
10
CHAPTER 2. BACKGROUND
A model for the spatial pattern of this acoustic radiation is desirable to predict the intensity
at point in space where a receiving element could be situated, to guarantee safe operating intensity
levels and to design transmitters for a specific application. Such a model has been developed in
Acoustics theory by posing a wave equation and solving it relating to the geometry and parameters
of the setup. This equation is formulated from the application of Newton’s second law on a small
fluid element along with continuity equations of the medium [15].
There are complex interactions between the emitted waves close to the surface of the
transducer but, from a certain distance, it acts as a concentrated source emitting a single spherical
wave. This region is known as the far field, and the solution for the pressure p at a certain radial
distance r is as follows [8]:
p(r) = jka2
2rP0e
j(ωt−kr)D(θ) (2.5)
D(θ) =48J3(ka sin θ)
(ka sin θ)3(2.6)
P0 = ρcu0 (2.7)
k =2π
λ=ω
c(2.8)
k is a parameter called the wave number related to the angular frequency of the wave ω and
the sound speed for the particular medium c and is also related to the wavelength λ = c/f . a is the
radius of the membrane. D(θ) is the directivity factor, which increases or reduces the pressure at a
certain angle. The directivity is smaller (narrower beam) for higher frequency of the wave. A general
guide for the directivity is that if 2a < λ/2, the response is omni directional, while larger dimensions
in relation to the wave number have a narrower beam width. Figure 2.2 shows the resulting directivity
function for varying dimensions.
Equation (2.7) relates the membrane surface pressure P0 to the velocity at the center of
the membrane u0. This velocity is also the product of the displacement amplitude and the angular
frequency. For the case of a vibrating membrane,the average displacement value must be used, which
is a third of the maximum value (at the center of the membrane). In a more general case, the relation
between the pressure and velocity is called acoustic impedance (Zac):
P = uZac (2.9)
Equation (2.5) assumes an ideal, lossless medium. In reality however, there is attenuation
besides the simple spherical (1/r) radiation predicted by this equation. Attenuation is higher with
11

CHAPTER 2. BACKGROUND
Figure 2.2: Single element directivity for membrane diameter: a)0.1λ , b)0.5λ, c)λ and d)3λ
increasing frequency. Equation (2.10) empirically models this effect as a factor that should be
multiplied by the value previously obtained for pressure. The equation shown for the α factor is for
water.
pattenuation(r) = p(r)e−αr (2.10)
α[dB/cm] = 2.17 · 10−15f2 (2.11)
2.5 PMUT Models
2.5.1 Equivalent Circuits
The equivalent circuit model for the transducer aims to treat every element of the electrical,
mechanical and acoustical domains as a single, lumped element of an electrical equivalent circuit. For
this, every parameter must be converted to an equivalent resistor, inductor, capacitor or transformer
[1]. Table 2.1 shows the analogies between elements and how they are converted to equivalent circuit
components. Electrical elements do not need to be converted. The radiation resistance and reactance
(mass) are the real and imaginary parts of the radiation impedance. Compliance is the reciprocal of
the stiffness (bending equivalent to the spring constant).
12

CHAPTER 2. BACKGROUND
Equivalent Circuit Acoustic MechanicalResistance Radiation Resistance (Rr) Damping (Rm)Inductance Radiation Mass (Mr) Mass (M )Capacitance - Compliance (Cm = 1/Km)
Voltage Force (on an area) (P ) Force (F )Current Velocity (U ) Velocity (U )
Table 2.1: Equivalent circuit analog variables
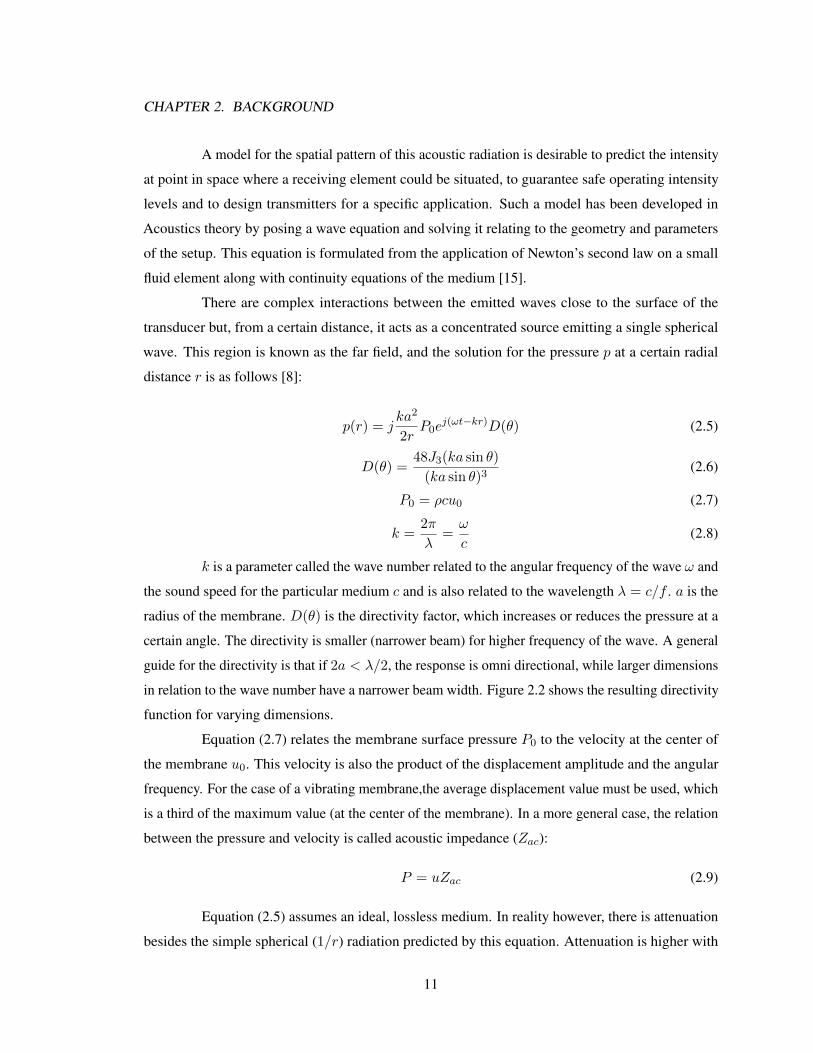
By this definitions, it is possible to represent all the interactions in the transducer with
the equivalent circuit of Figure 2.3. The turns ratio N directly relates the voltage on the PMUT
to the force exerted on the membrane and is related to the electromechanical transduction. If the
mechanical damping and radiation resistance are added, the same is done for the mechanical and
radiation reactance and the mechano-acoustical element values are multiplied by N , the simplified
Van Dyke circuit of Figure 2.4 is obtained.
Solving the equivalent circuit is the analogue of finding the solution to the linear differential
equations characterizing the behaviour of the electrical, acoustical and mechanical elements all
together. By solving for the electrical impedance, equation (2.12) is obtained [1]:
Y = jωC0 +N2
(R+Rr) + j[ω(M +Mr) − 1/ωCEm](2.12)
The resonant frequency wr is a particular frequency value that maximizes the admittance,
and thus the transducer response, and occurs when ω(M +Mr) − 1/ωCEm = 0:
ωr = 1/√
(M +Mr)CEm (2.13)
The antiresonant frequency is a minimum in the admittance and its value is:
ωa = 1/√
(M +Mr)CDm (2.14)
CDm = CEm/(1 +N2CEm/C0) (2.15)
As can be seen, resonant and antiresonant frequencies have an explicit relation to the
equivalent circuit parameters. Thus, measuring the resonant and antiresonant frequencies from
experimental admittance frequency response curves can be used to determine the circuit component
values to represent a transducer.
13
CHAPTER 2. BACKGROUND
Figure 2.3: PMUT equivalent circuit (from [1])
Figure 2.4: Van Dyke equivalent circuit (from [1])
14
CHAPTER 2. BACKGROUND
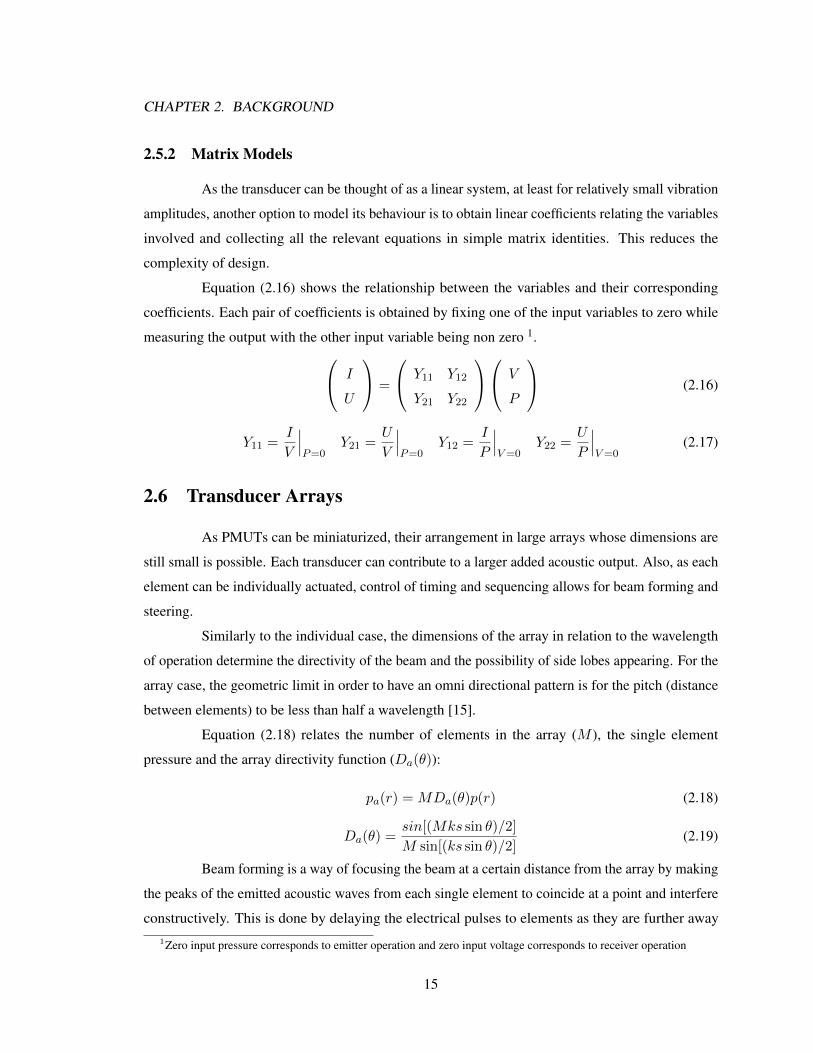
2.5.2 Matrix Models
As the transducer can be thought of as a linear system, at least for relatively small vibration
amplitudes, another option to model its behaviour is to obtain linear coefficients relating the variables
involved and collecting all the relevant equations in simple matrix identities. This reduces the
complexity of design.
Equation (2.16) shows the relationship between the variables and their corresponding
coefficients. Each pair of coefficients is obtained by fixing one of the input variables to zero while
measuring the output with the other input variable being non zero 1. I
U
=
Y11 Y12
Y21 Y22
V
P
(2.16)
Y11 =I
V
∣∣∣P=0
Y21 =U
V
∣∣∣P=0
Y12 =I
P
∣∣∣V=0
Y22 =U
P
∣∣∣V=0
(2.17)
2.6 Transducer Arrays
As PMUTs can be miniaturized, their arrangement in large arrays whose dimensions are
still small is possible. Each transducer can contribute to a larger added acoustic output. Also, as each
element can be individually actuated, control of timing and sequencing allows for beam forming and
steering.
Similarly to the individual case, the dimensions of the array in relation to the wavelength
of operation determine the directivity of the beam and the possibility of side lobes appearing. For the
array case, the geometric limit in order to have an omni directional pattern is for the pitch (distance
between elements) to be less than half a wavelength [15].
Equation (2.18) relates the number of elements in the array (M ), the single element
pressure and the array directivity function (Da(θ)):
pa(r) = MDa(θ)p(r) (2.18)
Da(θ) =sin[(Mks sin θ)/2]
M sin[(ks sin θ)/2](2.19)
Beam forming is a way of focusing the beam at a certain distance from the array by making
the peaks of the emitted acoustic waves from each single element to coincide at a point and interfere
constructively. This is done by delaying the electrical pulses to elements as they are further away1Zero input pressure corresponds to emitter operation and zero input voltage corresponds to receiver operation
15

CHAPTER 2. BACKGROUND
Figure 2.5: Schematic illustration of beam forming and steering (from [15])
from the center of the array. Beam steering can also be done by activating consequent elements in
cascade. The delay within activations determines the steering angle. These techniques can also be
applied at the receiver by activating reception of individual PMUTs at specific times. Figure 2.5
illustrates these techniques.
2.7 Performance Parameters
2.7.1 Electromechanical Coupling Factor
The electromechanical coupling factor, as it name suggests, is a measure of conversion of
energy from the electrical to the mechanical domain. It can also be interpreted as a factor representing
the change in capacitance and stiffness of the transducer due to the piezoelectric actuation relating
these mechanical and electrical variables. It can be defined from the difference among the clamped
(no motion) capacitance (C0) and the free (transducer in operation) capacitance Cf :
k2 =Cf − C0
Cf(2.20)
16

CHAPTER 2. BACKGROUND
The coupling factor can also be determined from the resonant and antiresonant frequencies:
k2 = 1 −(ωrωa
)2
(2.21)
2.7.2 Quality Factor
The quality factor Q is related to the bandwidth of the transducer, that is how sharp the
resonant frequency response is. It can be defined from the frequencies f1 and f2 where the response
falls 3dB from the resonant value:
Q =fr
f2 − f1(2.22)
Another definition comes from equivalent circuit parameters:
Q = ωrM +Mr
R+Rr(2.23)
17
Chapter 3
PMUT Array Design
The multi-domain nature of the working principles of the PMUTs require their design to
tackle several, usually interrelated, perspectives. To limit the large amount of possibilities resulting
from this, clear design requirements are first determined from both the available interface circuits
and intra-body focus described in Chapter 1. Next, geometry and materials are defined from the
fabrication process best suited to the needs and available resources. Comsol Multiphysics simulation
is then performed to determine dimensions that achieve the desired center frequency for a single
transducer.
A system-wide model consisting of emitter, medium and receiver elements is desirable
for guaranteeing an acceptable output signal level. Thus, matrix and equivalent circuit models
were obtained for the single transducer. Transmission in the medium for varying distance was also
modeled. These components were linked together in a system-wide circuit, allowing to simulate
changes in distances between transmitter and receiver, medium, source values and number of array
elements.
Optimization was also performed for the source and load (impedance matching). Directivity
of the array is further analyzed. The specific sequence followed is summarized below:
1. Design constraints
2. Single element frequency response
(a) Set resonant frequency
3. Source impedance matching
4. Modeling
18

CHAPTER 3. PMUT ARRAY DESIGN
(a) Single element matrix modeling
(b) Single element equivalent circuit modeling
(c) Medium transmission modeling
5. Load impedance matching
6. Directivity
7. System-wide simulation
(a) Array factor
(b) Overall system input and output check
3.1 Design Constraints
As was detailed in Chapter 1, the design goal is to achieve intra-body acoustic commu-
nication. From the previous work, interface circuitry for ultrasound transducers has already been
designed working at 700kHz and 2MHz. Therefore, the first design constraint is to operate at both
these frequencies.
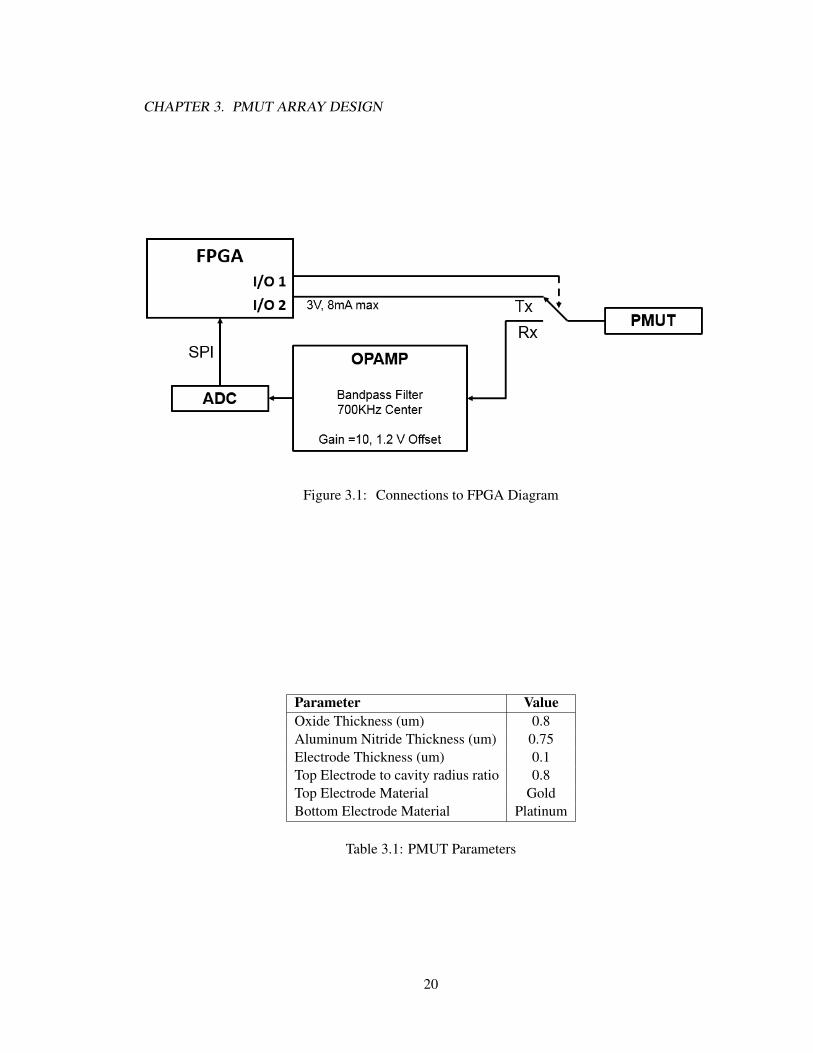
A diagram of the connections to the interface circuit is shown in Figure 3.1. This network
can be switched for transmitter or receiver operation using the same PMUT element. As a transmitter,
an output pin of the FPGA acts as a voltage source for the transducer. A square wave is generated at
the resonant frequency of the PMUT, but due to its electromechanical characteristics, it acts as a low
pass filter in such a way that the source wave can be approximated as a sinusoid. Then, the source
can be simulated as an AC source with a 50 ohm resistance. This is the second design constraint.
As will be further explained in Chapter 4, the PMUT structure is basically a layer of
aluminum nitride in between patterned top and bottom electrodes. This stack lays on top of a silicon
dioxide diaphragm. A cavity in the underlying silicon wafer is opened in order to release this
membrane. The values chosen for this structure are shown in Table 3.1. This defined structure is the
third design constraint. However, a choice remains on whether the cavity is left open to the medium
(vented) or if another silicon wafer is vacuum bonded on the bottom to seal it. Both possibilities are
discussed in Chapter 3.2.1.
The propagation of acoustic waves in the body medium also needs to be taken into account.
Even though the organs, bones and fluids within the body have different densities and some of the
19
CHAPTER 3. PMUT ARRAY DESIGN
Figure 3.1: Connections to FPGA Diagram
Parameter ValueOxide Thickness (um) 0.8Aluminum Nitride Thickness (um) 0.75Electrode Thickness (um) 0.1Top Electrode to cavity radius ratio 0.8Top Electrode Material GoldBottom Electrode Material Platinum
Table 3.1: PMUT Parameters
20

CHAPTER 3. PMUT ARRAY DESIGN
structures are flexible while others are not, a first approximation is to design the transducers to
operate in water, as the body is mostly composed of it. However, as was mentioned in Chapter 2.7,
some of the performance parameters must be measured in air, so behavior in air must be considered
as well. This, along with a reasonable average distance between transmitters and receivers within the
body, constitutes a fourth design constraint.
Single transducers whose dimensions are smaller than the wavelength of the acoustic wave
they are emitting can be considered to have an omni directional emission pattern. However, this
changes when an array of such elements is composed. As the devices can displace or rotate along
with motions of the body, if the directivity is too narrow, the transducers can slide out of the field of
view and lose connection even though they were originally facing each other. Therefore, a minimum
directivity must be set.
Depending on the necessary amount of data to be transmitted, a minimum bandwidth must
be set. This constitutes the fifth design constraint.
Table 3.2 summarizes the requirements.
Constraint ValueOperating Frequency (MHz) 0.7 , 2Source Voltage (V) 3Maximum Source Current (mA) 8Source Resistance (Ω) 50Load Resistance (GΩ) 1.82Medium Water, AirTransmitter-Receiver Distance (m) 0.2Directivity (degrees) 30Chip Size 1 cm x 1 cmBandwidth (MHz) 1
Table 3.2: Design Constraints
3.2 700 kHz Resonant Frequency
3.2.1 Resonant Frequency
Even though equation (2.3) defines the relationship between the rigidity and geometry of a
deflecting membrane with it’s resonant frequency, finite element simulation in Comsol Multiphysics
21
CHAPTER 3. PMUT ARRAY DESIGN
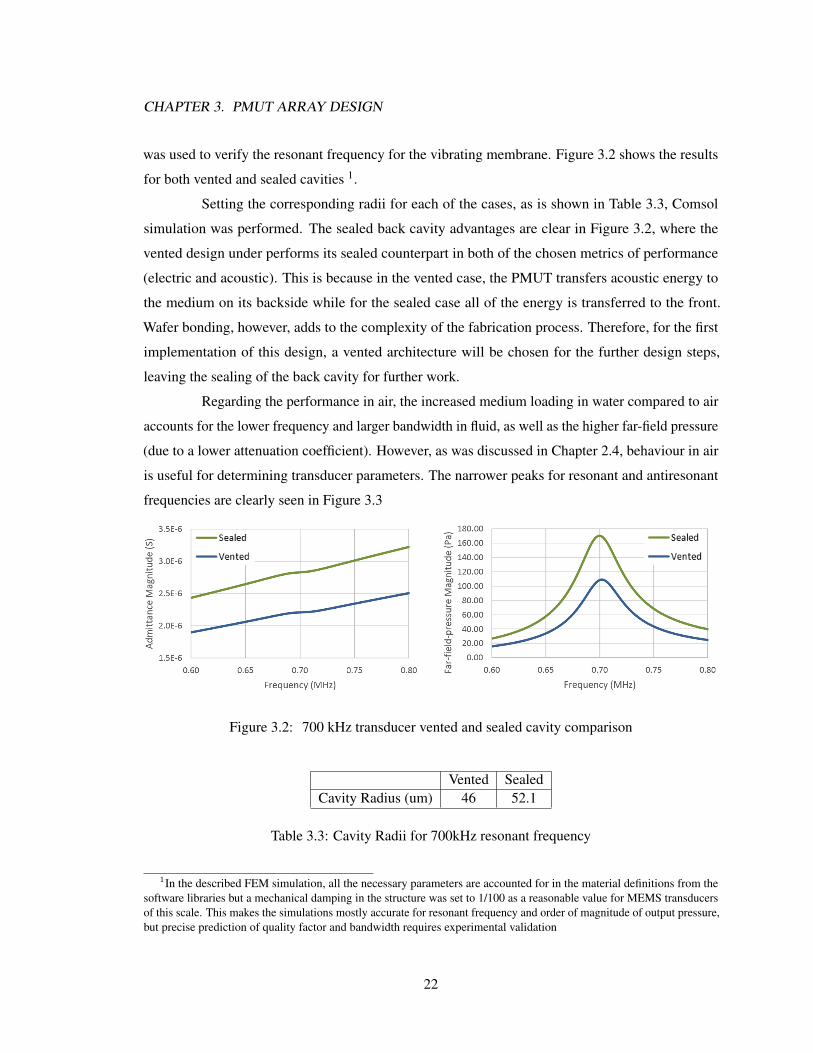
was used to verify the resonant frequency for the vibrating membrane. Figure 3.2 shows the results
for both vented and sealed cavities 1.
Setting the corresponding radii for each of the cases, as is shown in Table 3.3, Comsol
simulation was performed. The sealed back cavity advantages are clear in Figure 3.2, where the
vented design under performs its sealed counterpart in both of the chosen metrics of performance
(electric and acoustic). This is because in the vented case, the PMUT transfers acoustic energy to
the medium on its backside while for the sealed case all of the energy is transferred to the front.
Wafer bonding, however, adds to the complexity of the fabrication process. Therefore, for the first
implementation of this design, a vented architecture will be chosen for the further design steps,
leaving the sealing of the back cavity for further work.
Regarding the performance in air, the increased medium loading in water compared to air
accounts for the lower frequency and larger bandwidth in fluid, as well as the higher far-field pressure
(due to a lower attenuation coefficient). However, as was discussed in Chapter 2.4, behaviour in air
is useful for determining transducer parameters. The narrower peaks for resonant and antiresonant
frequencies are clearly seen in Figure 3.3
Figure 3.2: 700 kHz transducer vented and sealed cavity comparison
Vented SealedCavity Radius (um) 46 52.1
Table 3.3: Cavity Radii for 700kHz resonant frequency
1In the described FEM simulation, all the necessary parameters are accounted for in the material definitions from thesoftware libraries but a mechanical damping in the structure was set to 1/100 as a reasonable value for MEMS transducersof this scale. This makes the simulations mostly accurate for resonant frequency and order of magnitude of output pressure,but precise prediction of quality factor and bandwidth requires experimental validation
22

CHAPTER 3. PMUT ARRAY DESIGN
Figure 3.3: 700 kHz transducer performance in air. Top: sealed, bottom: vented.
3.2.2 Source Impedance Matching
Due to the PMUT basically being a capacitive structure, its resistance is relatively high. In
comparison, the 50 ohm source impedance is almost negligible. No resistive matching can be done.
However, the case is different for the reactive portion as the capacitance of the structure can well be
compensated by adding a matching inductor.
An inductor placed in series at the same reactance value as the one corresponding to the
PMUT electrical capacitance at the resonant frequency can cancel out the complex impedance (create
an LC resonant circuit). To calculate the corresponding value, a parallel plate capacitor approximation
is used on the section of the piezoelectric material that is covered by electrode (parasitic capacitances
from interconnects are ignored):
C = ε0εrA
d= ε0εr
πr2
d(3.1)
The matching inductance would then be:
1
ωC= ωL
23

CHAPTER 3. PMUT ARRAY DESIGN
Figure 3.4: 700 kHz transducer source impedance matching
Figure 3.5: 700 kHz transducer frequency response with matching inductor
L =1
ω2C(3.2)
A parameter sweep perfomed in Comsol for the inductance in series with the PMUT
verifies the admittance and far-field pressure boost at the calculated value as can be seen in Figure 3.4.
A frequency sweep, shown in Figure 3.5, makes it clear that the resonant circuit amplifies both the
admittance and far-field pressure. The cancellation of the electrical capacitance is evident in the
admittance, where the anti resonant frequency effect is masked.
The agreement between the calculated and measured values for the matching inductor is
evident in Table 3.4.
Calculated 114.41 (mH)Simulation 103.03 (mH)
Table 3.4: 700 kHz transducer matching inductor value
24
CHAPTER 3. PMUT ARRAY DESIGN
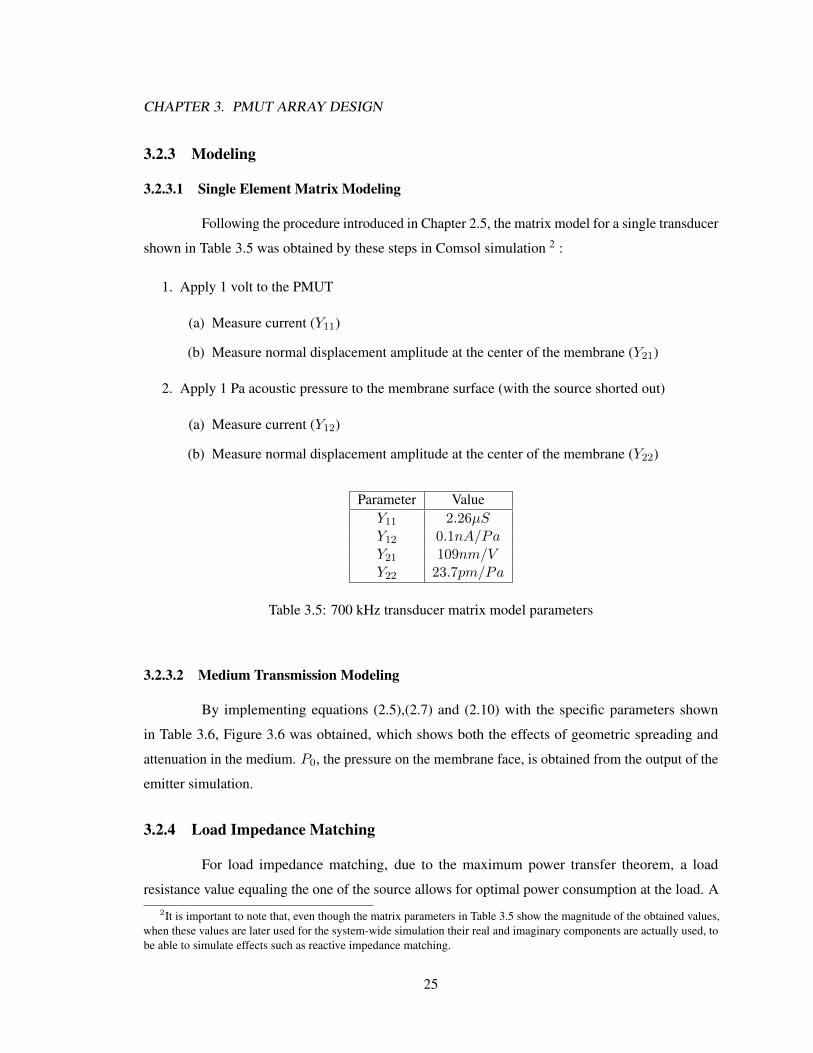
3.2.3 Modeling
3.2.3.1 Single Element Matrix Modeling
Following the procedure introduced in Chapter 2.5, the matrix model for a single transducer
shown in Table 3.5 was obtained by these steps in Comsol simulation 2 :
1. Apply 1 volt to the PMUT
(a) Measure current (Y11)
(b) Measure normal displacement amplitude at the center of the membrane (Y21)
2. Apply 1 Pa acoustic pressure to the membrane surface (with the source shorted out)
(a) Measure current (Y12)
(b) Measure normal displacement amplitude at the center of the membrane (Y22)
Parameter ValueY11 2.26µSY12 0.1nA/PaY21 109nm/VY22 23.7pm/Pa
Table 3.5: 700 kHz transducer matrix model parameters
3.2.3.2 Medium Transmission Modeling
By implementing equations (2.5),(2.7) and (2.10) with the specific parameters shown
in Table 3.6, Figure 3.6 was obtained, which shows both the effects of geometric spreading and
attenuation in the medium. P0, the pressure on the membrane face, is obtained from the output of the
emitter simulation.
3.2.4 Load Impedance Matching
For load impedance matching, due to the maximum power transfer theorem, a load
resistance value equaling the one of the source allows for optimal power consumption at the load. A2It is important to note that, even though the matrix parameters in Table 3.5 show the magnitude of the obtained values,
when these values are later used for the system-wide simulation their real and imaginary components are actually used, tobe able to simulate effects such as reactive impedance matching.
25

CHAPTER 3. PMUT ARRAY DESIGN
Parameter Valueρ 1000kg/m3
c 1484m/sr 46µmα 1.1283 · 10−4m−1
Table 3.6: 700 kHz transducer medium parameters
Figure 3.6: 700 kHz transducer single element output acoustic pressure vs distance
Comsol simulation of the receiver PMUT, with the predicted acoustic pressure at a 20 cm distance
between transmitter and receiver and a varying load resistance, verifies this behaviour (Figure 3.7).
The 450KΩ optimal value corresponds to the sum ofR andRr in the equivalent circuit of Figure 2.3,
as the source is acoustic in this case.
However, the load impedance is fixed by the input resistance of the amplifier circuit, so this
scheme is not feasible. A transformer designed to match the impedance difference could be an option
but, as we are only interested in a detectable voltage for the Analog to Digital Converter (ADC) and
not so much on the actual power transferred, this is not necessary.
A sweep of the value of an inductor placed in parallel to the PMUT to cancel out its
electrical capacitance causes a negligible increase in the output due to the very high load impedance.
This is why a matching inductor is not required at the receiver.
3.2.5 Bandwidth
Figure 3.8 shows the output pressure frequency response where a -6dB bandwidth lower
than 100 kHz is measured. This can be attributed to the low operating frequency of the device. A
26

CHAPTER 3. PMUT ARRAY DESIGN
Figure 3.7: 700 kHz transducer receiver electric output for a varying load
Figure 3.8: 700 kHz transducer frequency response
possible solution for this issue is to have elements of varying radius within the array, in order to
produce an output with a wider combined spectrum.
3.2.6 Directivity
Once the single element response has been optimized, the effect of placing an array of
these elements needs to be considered. The first evident effect is that the output pressure of each
single PMUT adds up to the total array output pressure. However, as there can be interference effects
and a minimum directivity constraint has been placed, the specific pitch of the array elements needs
to be considered.
Similarly to the half-wavelength requirement for element size, the same condition needs to
be met on the array pitch (distance between elements) to avoid sidelobes of the beam and to be able
to perform beam steering (Chapter 2.4). By use of the equation λ = c/f , the resonant frequency and
speed of sound in water, the wavelength is determined to be 2.12mm. The actual pitch that can be
27

CHAPTER 3. PMUT ARRAY DESIGN
Figure 3.9: Array directivity
achieved depends on fabrication but a conservative 100µm pitch would correspond to approximately
0.1λ.
Matlab’s Sensor Array System Toolbox v3.3 can predict the directivity pattern of an
array with specified geometry, number of elements, operating frequency, speed of sound and pitch.
Figure 3.9 shows the 2D directivity pattern for 5x5 and 10x10 arrays with 0.1λ and the maximum
0.5λ pitch for comparison purposes. Using a -6dBi cutoff, it is clear that both array sizes comfortably
achieve the beam-width requirement for the smaller pitch value with no sidelobes. It is therefore
desirable to place more array elements as close as fabrication limits permit, while not exceeding the
maximum supply current and chip size requirements.
Figure 3.10 shows the same patterns in a more intuitive, three-dimensional distribution.
The effect of a wider pitch in creating side lobes becomes evident here.
28

CHAPTER 3. PMUT ARRAY DESIGN
Figure 3.10: Three-dimensional directivty plots for PMUT arrays
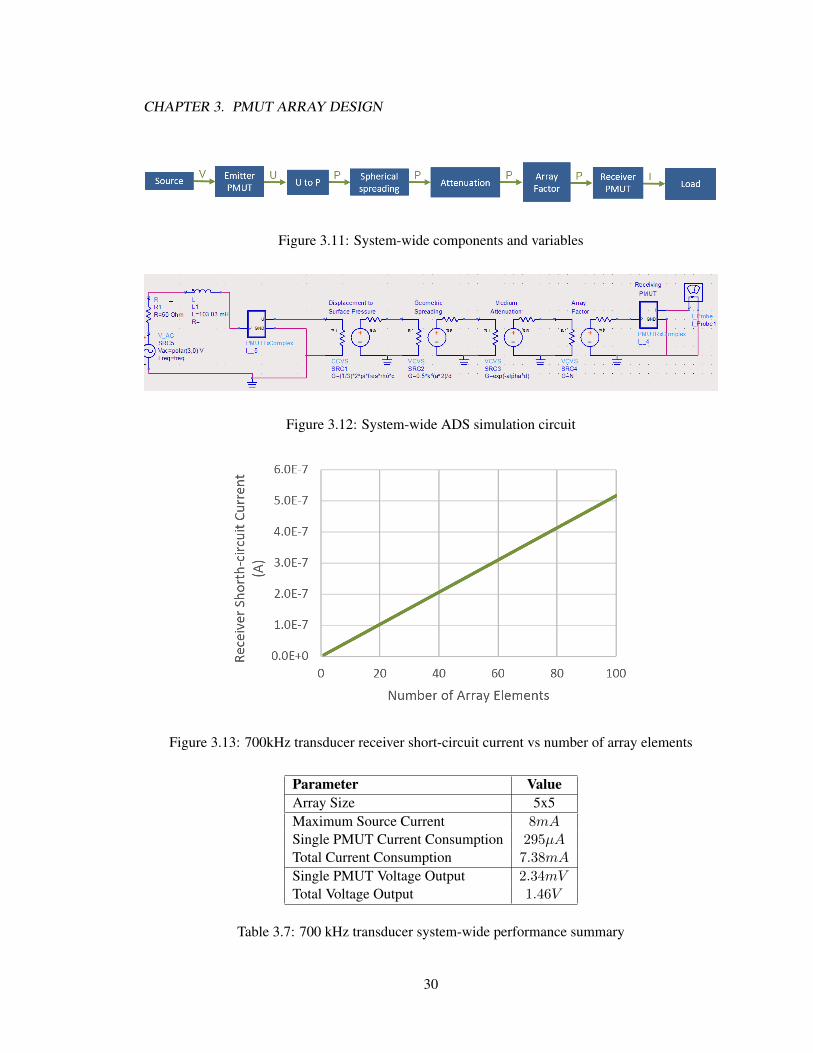
3.2.7 System-wide Model
The PMUT matrix model, medium model, and array factor are integrated in the system-
wide circuit summarized in Figure 3.11. The specific implementation was done in Agilent’s Advanced
Design System (ADS) software and can be seen in Figure 3.12.
The array effect is integrated here as a simple gain factor that accounts for both the emitter
and receiver contributions. Thus N is basically the product of the number of emitter and receiver
elements.This can be done without further consideration as more transducers on the emitter side add
up to the total acoustic output while on the receiver side, each adds up to the produced current. It
must also be emphasized that the circuit predicts the response on the center axis of the transducer
(assumes transmitter and receiver are perfectly aligned), the directivity functions described in the
previous section predict the reduction due to misalignment.
Figure 3.13 shows a linear increment of the output short-circuit current as the total number
of elements increases. The limit to placing as many elements as possible is their current consumption.
As Table 3.7 summarizes, the 5x5 array is the largest the FPGA can source. By having a 5x5 array at
the receiver as well, an easily detectable potential of 1.4 V can be ideally produced on the receiver
circuit.
29
CHAPTER 3. PMUT ARRAY DESIGN
Figure 3.11: System-wide components and variables
Figure 3.12: System-wide ADS simulation circuit
Figure 3.13: 700kHz transducer receiver short-circuit current vs number of array elements
Parameter ValueArray Size 5x5Maximum Source Current 8mASingle PMUT Current Consumption 295µATotal Current Consumption 7.38mA
Single PMUT Voltage Output 2.34mVTotal Voltage Output 1.46V
Table 3.7: 700 kHz transducer system-wide performance summary
30

CHAPTER 3. PMUT ARRAY DESIGN
Parameter ValueArray Size 5x5Maximum Source Current 8mASingle PMUT Current Consumption 6.63µATotal Current Consumption 0.166mA
Single PMUT Voltage Output 46.8µVTotal Voltage Output 29.3mV
Table 3.8: 700 kHz transducer system-wide performance summary. No source impedance matching
3.3 2 MHz Resonant Frequency
The results of applying the same procedure for a 2MHz resonant frequency are shown.
3.3.1 Resonant Frequency
Table 3.9 shows the radius obtained for a 2MHz resonant frequency while Figure 3.14
shows the response of the transducer in water.
Radius (µm) 29.9
Table 3.9: Cavity radius for 2MHz resonant frequency
Figure 3.14: 2MHz transducer frequency response in water
3.3.2 Source Impedance Matching
Figure 3.15 illustrates a frequency sweep of the matching inductor, Figure 3.16 shows the
element frequency response with the optimum value for the inductor implemented and Table 3.10
shows a reasonable match between analytic and simulated obtained values for the necssary inductance.
31

CHAPTER 3. PMUT ARRAY DESIGN
Figure 3.15: 2MHz transducer source impedance matching
Figure 3.16: 2MHz transducer matched frequency response
3.3.3 Modeling
3.3.3.1 Single Element Matrix Modeling
Table 3.11 summarizes the matrix model parameters for the transducer.
3.3.3.2 Medium Transmission Modeling
The pressure attenuation and spreading in the medium at a certain distance from the emitter
is shown in Figure 3.17.
3.3.4 Load Impedance Matching
Similarly to the 700 kHz case, no benefit is obtained from placing an inductor with the aim
to cancel the capacitance of the transducer.
32

CHAPTER 3. PMUT ARRAY DESIGN
Calculated 21.22 (mH)Simulation 30.3 (mH)
Table 3.10: 2MHz transducer matching inductance value
Parameter ValueY11 2.69µSY12 0.0325nA/PaY21 2.67nm/VY22 2.494pm/Pa
Table 3.11: 2MHz transducer matrix model parameters
3.3.5 Bandwidth
A higher bandwidth (around 250kHz) was achieved in comparison to the 700 kHz trans-
ducer due to the higher operating frequency as can be seen in Figure 3.18
3.3.6 Directivity
By use of the equation λ = c/f , the resonant frequency and speed of sound in water, the
wavelength is determined to be 0.742mm. In this case, the 0.1λ pitch would be 74.2µm, which is
still possible to manufacture. The directivity plots are the same as in Figure 3.9 and Figure 3.10.
3.3.7 System-wide Model
Parameter ValueArray Size 5x5Maximum Source Current 8mASingle PMUT Current Consumption 305µATotal Current Consumption 7.625mA
Single PMUT Voltage Output 0.413mVTotal Voltage Output 258mV
Table 3.12: 2MHz transducer system-wide performance summary
33

CHAPTER 3. PMUT ARRAY DESIGN
Figure 3.17: 2MHz transducer single element output acoustic pressure vs distance
Figure 3.18: 2 MHz transducer frequency response
Parameter ValueArray Size 5x5Maximum Source Current 8mASingle PMUT Current Consumption 8.06µATotal Current Consumption 0.202mA
Single PMUT Voltage Output 10.8µVTotal Voltage Output 6.75mV
Table 3.13: 2MHz transducer system-wide performance summary. No source impedance matching.
34
Chapter 4
Fabrication
From the literature review, the piezoelectric-electrode stack is either built by metal de-
position and sol-gel or sputtering for the Aluminum Nitride (AlN) layer. A variety of dimensions
and thicknesses have been reported for this. The passive layer is made out of silicon, Silicon
Dioxide (SiO2) or Silicon Nitride (SiN) in some cases [14], [2], [11].
The release of the device (cavity formation) also presents several options such as anisotropic
wet Potassium Hydroxide (KOH) silicon etching [14], front side Xenon Difluoride (XeF2) etching
[14], sacrificial polysilicon etching and parylene cavity sealing [2] or use of cavity SOI wafers
previously manufactured [8].
The manufacturing options more adequate for the current possibilities of our research
facilities are the cavity SOI wafers, front side XeF2 etching and backside Deep Reactive Ion
Etching (DRIE). Figure 4.1 shows the corresponding topologies while Table 4.1 summarizes their
relative advantages and drawbacks.
Due to the good balance between cost, flexibility in manufacturing at our own facilities
and precise cavity definition (to which the resonant frequency is very sensitive), the chosen process
is the backside DRIE. The main drawback is the vented cavity, which was shown in the design to
be detrimental for the output pressure. However, it avoids the parylene sealing which introduces
additional loading to the membrane in the XeF2 process. Vacuum bonding of the manufactured
dice to a bare silicon handle wafer is a possibility for future work in order to obtain the sealed
cavity benefit from the cavity SOI process while mantaining the freedom to quickly test different
configurations locally.
35

CHAPTER 4. FABRICATION
Figure 4.1: PMUT main fabrication options. Top: cavity SOI, center: backside DRIE, bottom XeF2etch.
Cavity SOI DRIE XeF2 etchingCommercially available Requires manufacturing Requires manufacturing
Anisotropic etch Anisotropic etch Isotropic, rough etchPrecise radius Precise radius Variable radius
Back-side alignment needed Back-side alignment needed Front side processHigher cost Intermediate cost Low cost
Vacuum sealed back Vented back Needs Parylene sealing
Table 4.1: Main fabrication options
36

CHAPTER 4. FABRICATION
4.1 Process
Table 4.2 enumerates the fabrication steps required for the chosen process.
No. Step Mask1 Grow 800 nm of thermal SiO2 on DSP wafer2 Bottom electrode photo lithography 13 5nm titanium adhesion layer e-beam evaporation4 95nm platinum bottom electrode e-beam evaporation5 Metal Liftoff6 750nm AlN sputtering7 Via photolithography 28 Bottom electrode phosphoric acid via etching9 Top electrode photolithography 310 100nm gold top electrode e-beam evaporation11 Metal liftoff12 Wafer Dicing13 Backside alignment and photo lithography 414 Backside cavity DRIE15 Wire bonding
Table 4.2: Fabrication process flow
Figure 4.2 details some of the fabrication steps for the piezoelectric electrode stack.
4.2 Layout
The main considerations for layout design were:
1. Cavity Radii
(a) Place arrays of several cavity radii around the designed value to account for fabrication
tolerance
(b) Half-wavelength diameter requirement
2. Array Pitch
(a) Half-wavelength pitch requirement
3. Connector and via width allowing low resistance
4. Parasitic capacitance
37
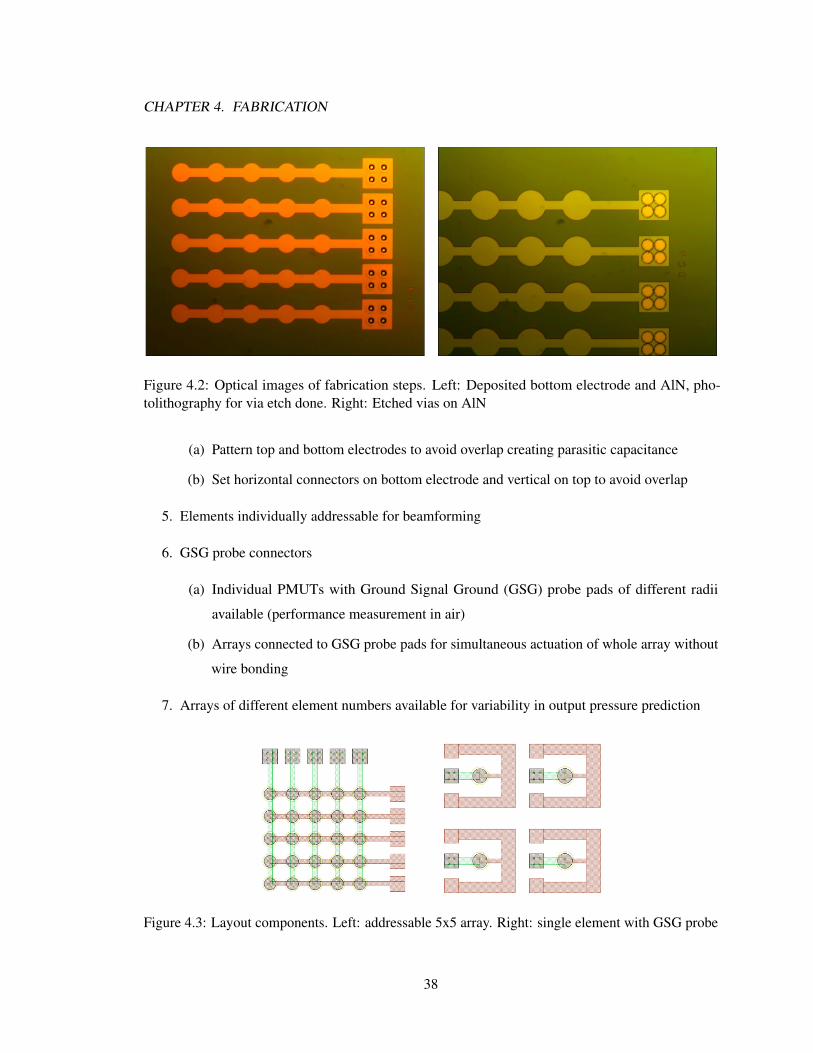
CHAPTER 4. FABRICATION
Figure 4.2: Optical images of fabrication steps. Left: Deposited bottom electrode and AlN, pho-tolithography for via etch done. Right: Etched vias on AlN
(a) Pattern top and bottom electrodes to avoid overlap creating parasitic capacitance
(b) Set horizontal connectors on bottom electrode and vertical on top to avoid overlap
5. Elements individually addressable for beamforming
6. GSG probe connectors
(a) Individual PMUTs with Ground Signal Ground (GSG) probe pads of different radii
available (performance measurement in air)
(b) Arrays connected to GSG probe pads for simultaneous actuation of whole array without
wire bonding
7. Arrays of different element numbers available for variability in output pressure prediction
Figure 4.3: Layout components. Left: addressable 5x5 array. Right: single element with GSG probe
38

Chapter 5
Conclusion
The first step completed in the present work was a clear definition of the requirements
of PMUT arrays for intrabody networking applications. Their interface to existing circuitry from
previous work and the characteristics of the medium in which they will be performing were addressed.
Through FEM simulations, analytic models for the medium, and equivalent models for the transducer,
an integral and interrelated design was performed for both the 700 kHz and 2MHz applications.
The result is a first design iteration of PMUT arrays for relatively low operating frequencies in
comparison to state-of-the-art devices. Additionally, a design framework allowing for adapting the
design to changing requirements or correction for differences between the predicted behaviour and
the experimental measurements was built.
As FEM simulations formed most of the foundations for prediction of transducer behaviour,
their accuracy must be assessed. Resonant frequency, and the order of magnitude of the output
pressure obtained can be assumed to be reliable and are also reasonable compared against similar
transducers such as [8] and [2]. However, predictions of bandwidth, and of the related quality factor
Q, are very much dependent on fabrication and actual obtained material properties. This is why, in
this regard, experimental measurements are essential for precise assessment of performance of the
transducers.
The ADS system-wide model is a valuable output of this work. It is an integral tool for
assessing the performance of the system as a whole. Currently, its parameters are closely related to
FEM simulation outputs, but parameters from experimental measurements can be easily extracted to
increase its accuracy. It allows for impedance matching, variations in number of array elements, and
changes in medium and distance between emitter and receiver arrays.
Directivity requirements were easily achieved due to the small element sizes and small
39

CHAPTER 5. CONCLUSION
array pitch chosen. The wide beam pattern provides a safe margin for possible misalignments due to
motion within the body. Bandwidth requirements, in contrast, pose a more difficult challenge due to
the relatively low frequencies of operation. Integration of elements of different radii within the array
is a possible solution and, once more, experimental validation is required for the predictions.
Due to the possibilities of discrepancy between predicted values and implementation,
variations of geometry were implemented in the layout including cavity radius, number of array
elements and pitch. The designed fabrication process has been currently successful up to the AlN via
etch and is in progress.
Impedance matching was shown to have a considerable impact on the output pressure of
an element and thus on the voltage output on the receiver. However, the required inductance for
this matching poses a limit due to the size of the corresponding element. For initial bench testing, a
sizable inductor could be used, but for the intrabody application this might not be feasible.
A worst case scenario was included in the development within this work where no matching
is performed. Conserving the array dimensions of 5x5, a detectable signal was still obtained at the
receiver for both the 700kHz and 2MHz cases. Even though the detected potential is of a much lower
magnitude, making it more sensitive to noise corruption, the current consumption of each transmitter
element is much lower. Larger arrays, that have been included in the current layout can be used to
compensate for this fact creating a more robust signal at the receiver.
The equivalent circuit representation of the PMUTs was used as a method of explaining
the behaviour of the transducers in terms of frequency response and relation between the involved do-
mains. However, extraction of electromechanical coupling and quality factors, maximum admittance
and low frequency reactance from experimental response data can be used to explicitly determine
the equivalent circuit variables. Once these are known, variations in geometery (thickness of the
membrane stack and radius) can be performed to optimize acoustic matching to the medium, thus
maximizing output and increasing the bandwidth.
40

Bibliography
[1] C. Sherman and J. Butler, Transducers and Arrays for Underwater Sound. Springer, 2007.
[2] Y. Lu, A. Heidari, and D. A. Horsley, “A high fill-factor annular array of high frequency piezo-
electric micromachined ultrasonic transducers,” Journal of Microelectromechanical Systems,
vol. 24, no. 4, pp. 904–913, Aug. 2015.
[3] L. Galluccio, T. Melodia, S. Palazzo, and G. E. Santagati, “Challenges and implications of
using ultrasonic communications in intra-body area networks,” in 2012 9th Annual Conf. on
Wireless On-Demand Network Systems and Services (WONS).
[4] E. Santagati, T. Melodia, L. Galluccio, and S. Palazzo, “Medium access control and rate
adaptation for ultrasonic intrabody sensor networks,” IEEE/ACM Transactions on Networking,
vol. 23, no. 4, pp. 1121–1134, Aug. 2015.
[5] W. V. Shi and M. Zhou, “Body sensors in pacemakers: A survey,” IEEE Sensors Journal,
vol. 12, no. 6, pp. 1817–1827, Jun. 2012.
[6] R. D. Black, “Recent advances in translational work on implantable sensors,” IEEE Sensors
Journal, vol. 11, no. 12, pp. 3171–3182, Dec. 2011.
[7] B. Latr, B. Braem, I. Moerman, C. Blondia, and P. Demeester, “A survey on wireless body area
networks,” Wireless Networks, vol. 17, pp. 1–18, 2011.
[8] Y. Lu, H.-Y. Tang, S. Fung, B. E. Boser, and D. A. Horsley, “Pulse-echo ultrasound imaging
using an aln piezoelectric micromachined ultrasonic transducer array with transmit beam-
forming,” Journal of Microelectromechanical Systems, vol. 25, no. 1, pp. 179–187, Feb. 2016.
41
BIBLIOGRAPHY
[9] Y. Lu and D. A. Horsley, “Modeling, fabrication and characterization of piezoelectric micro-
machined ultrasonic transducer arrays based on cavity soi wafers,” Journal of Microelectrome-
chanical Systems, vol. 24, no. 4, pp. 1142–1149, Aug. 2015.
[10] S. Akhbari, F. Sammoura, C. Yang, M. Mahmoud, N. Aqab, and L. Lin, “Bimorph pmut with
dual electrodes,” in 2015 28th IEEE International Conference on Micro Electro Mechanical
Systems (MEMS), jan. 2015, pp. 928–931.
[11] S. Akhbari, F. Sammoura, C. Yang, A. Heidari, D. Horsley, and L. Lin, “Self-curved diaphragms
by stress engineering for highly responsive pmut,” in 2015 28th IEEE International Conference
on Micro Electro Mechanical Systems (MEMS), Jan. 2015, pp. 837–840.
[12] B. E. Eovino, S. Akhbari, and L. Lin, “Broadband ring-shaped pmuts based on an acoustically
induced resonance,” in 2017 IEEE 30th International conference on Micro Electro Mechanical
Systems (MEMS), jan. 2017, pp. 1184–1187.
[13] T. Wang, T. Kobayashi, and C. Lee, “Micromachined piezoelectric ultrasonic transducer with
ultra-wide frequency bandwidth,” Applied Physics Letters, vol. 106, no. 013501, pp. 1–5, Jan.
2015.
[14] Y. Qiu, J. V. Gigliotti, M. Wallace, F. Griggio, C. E. Demore, S. Cochran, and S. Troiler-
McKinstry, “Piezoelectric micromachined ultrasound transducer (pmut) arrays for integrated
sensing, actuation and imaging,” Sensors, vol. 15, pp. 8020–8041, Apr. 2015.
[15] L. W. S. Jr., Fundamentals of Ultrasonic Phased Arrays. Springer, 2015.
42


![Piezoelectric Ultrasonic Micromotors - [email protected]](https://static.cupdf.com/doc/110x72/6204ee814c89d3190e0cabb2/piezoelectric-ultrasonic-micromotors-emailprotected.jpg)