Democracy Credits:
An Analysis of Washington’s
Proposed Voucher Initiative
Michael J. Malbin
October 2016
PRACTICAL AND OBJECTIVE. RESEARCH FOR DEMOCRACY.
The Campaign Finance Institute is the nation’s pre-eminent think tank
for objective, non-partisan research on money in politics in U.S.
federal and state elections. CFI’s original work is published in scholarly
journals as well as in forms regularly used by the media and policy
making community. Statements made in its reports do not necessarily
reflect the views of CFI's Trustees or financial supporters.
To see all of CFI’s reports and analysis on money in
politics visit our website at www.CFInst.org
BOARD OF TRUSTEES: Anthony J. Corrado – Chair
F. Christopher Arterton
Betsey Bayless
Vic Fazio
Donald J. Foley
George B. Gould
Kenneth A. Gross
Ruth S. Jones
Michael J. Malbin
Ronald D. Michaelson
Ross Clayton Mulford
Phil Noble
ACADEMIC ADVISORS: Robert G. Boatright
Richard Briffault
Guy-Uriel Charles
Diana Dwyre
Erika Franklin Fowler
Michael Franz
Donald P. Green
Keith Hamm
Marjorie Randon Hershey
David Karpf
Robin Kolodny
Raymond J. La Raja
Thomas E. Mann
Lloyd Hitoshi Mayer
Michael G. Miller
Costas Panagopoulos
Kay Lehman Schlozman

ABOUT THE AUTHOR
Michael J. Malbin, co-founder and Executive Director of the Campaign Finance Institute (CFI),
is also Professor of Political Science at the University at Albany, State University of New York.
Before SUNY he was a reporter for National Journal, a resident fellow at the American
Enterprise Institute and held positions in the House of Representatives and Defense
Department. Concurrent with SUNY, he has been a member of the National Humanities Council,
a visiting professor at Yale University and a guest scholar at The Brookings Institution. His co-
authored books include The Day after Reform: Sobering Campaign Finance Lessons from the
American States (1998); Life after Reform: When the Bipartisan Campaign Reform Act Meets
Politics (2003); The Election after Reform: Money, Politics and the Bipartisan Campaign Reform
Act (2006) and Vital Statistics on Congress.
ACKNOWLEDGMENTS
The Campaign Finance Institute gratefully acknowledges The Democracy Fund, The William and
Flora Hewlett Foundation, Sean Eldridge, The John D. and Catherine T. MacArthur Foundation,
The Mertz Gilmore Foundation, The Rockefeller Brothers Fund, and the Smith Richardson
Foundation for their support.
The author also wishes to thank the National Institution on Money in State Politics for the data
used in this research and the Campaign Finance Institute’s Justin Koch, Michael Parrott and
Brendan Glavin for their invaluable assistance in preparing and analyzing the data.

Democracy Credits:
An Analysis of Washington’s
Proposed Voucher Initiative
Michael J. Malbin
The Campaign Finance Institute
CONTENTS
EXECUTIVE SUMMARY 1
BACKGROUND 2
THE SOURCES OF CAMPAIGN MONEY IN WASHINGTON TODAY 3
Table 1: Sources of Funding for Washington’s State Legislative Candidates, 2012-2014. 4
Table 2. Donor Diversity in Washington’s State Legislative Elections 6
A PORTRAIT OF A SYSTEM WITH DEMOCRACY CREDITS 7
Table 3: Sources of Funding for Washington’s State Legislative Candidates,
2012-2014: Current vs. Hypothetical 9
NUMBER OF DONORS NEEDED AND PROJECTED COST 9
Table 4. Number and Cost of the “Democracy Credits” Candidates Would Need
under the Two Hypotheticals, Compared to the Actual Number of Individual
Donors in 2014 and 2014. 11
CONCLUSION 13
WORKS CITED 14

1
EXECUTIVE SUMMARY
The voters of Washington this year will decide the fate of Initiative 1464, a proposal that would
affect many aspects of campaign finance and lobbying law. This report by the Campaign Finance
Institute (CFI) focuses on the provisions in the Initiative that relate to “democracy credits”
(state-funded vouchers) and contribution limits. The analysis is based on methodologies and
projection techniques CFI has developed in seventeen years of nonpartisan, peer-reviewed
research on money in politics. We hope it will inform the public’s deliberations about Initiative
1464. However, the initiative has many more provisions than the ones we analyze here and CFI
does not take positions in support of or opposition to specific pieces of legislation as a whole.
Because voucher systems are new to U.S. elections, there are no direct comparisons for
predicting the likely outcomes. Instead, CFI constructed two fully transparent, hypothetical
scenarios to help understand the range of plausible possibilities. Based on these scenarios CFI
concludes that Initiative 1464 could well have a transformative effect on Washington politics.
At a minimum, it would reduce the electoral importance of the business-oriented interest
groups that give the bulk of campaign contributions today. In 2012 and 2014 non-party
organizations (such as PACs, corporations and labor unions) gave more than half of the money
that went to Washington’s state legislative candidates. With the system proposed in this
initiative, CFI estimates that vouchers and small donors would become the most important
sources of funding. Interest groups would not disappear, but their role would shift toward
becoming donor-mobilizers rather than donors themselves.
2
BACKGROUND
The voters of Washington this year will decide the fate of Initiative 1464, a proposal that would
affect many aspects of campaign finance and lobbying law. This report by the Campaign Finance
Institute (CFI) focuses on the provisions in the Initiative that relate to “democracy credits”
(state-funded vouchers) and contribution limits, which are described more fully in the footnote
below1. Because Democracy Credits would be available only for legislative elections initially, the
analysis is confined to those elections. It is based on a detailed analysis of the state’s campaign
finance records (supplied by the National Institute on Money in State Politics), using
methodologies and projection techniques CFI has developed in seventeen years of nonpartisan,
peer-reviewed research on money in politics. We hope the analysis will help inform the public’s
deliberations about Initiative 1464. However, the initiative has many more provisions than the
ones we analyze here and CFI does not take positions in support of or opposition to specific
pieces of legislation as a whole.
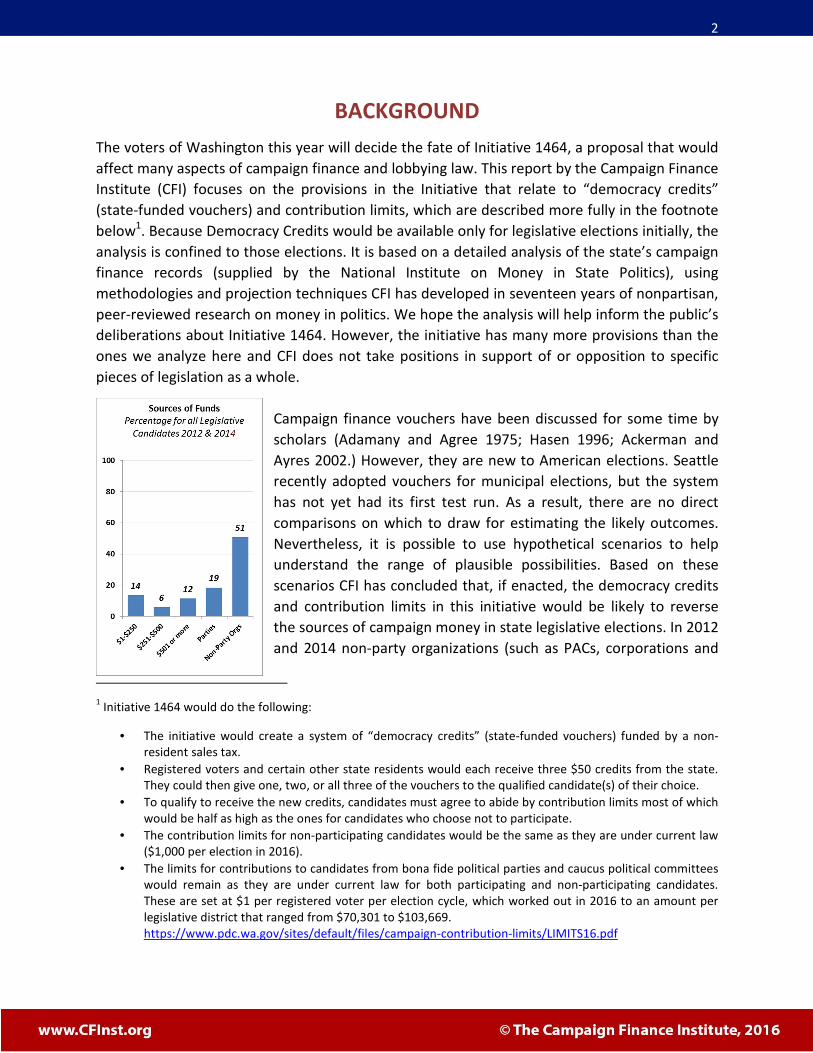
Campaign finance vouchers have been discussed for some time by
scholars (Adamany and Agree 1975; Hasen 1996; Ackerman and
Ayres 2002.) However, they are new to American elections. Seattle
recently adopted vouchers for municipal elections, but the system
has not yet had its first test run. As a result, there are no direct
comparisons on which to draw for estimating the likely outcomes.
Nevertheless, it is possible to use hypothetical scenarios to help
understand the range of plausible possibilities. Based on these
scenarios CFI has concluded that, if enacted, the democracy credits
and contribution limits in this initiative would be likely to reverse
the sources of campaign money in state legislative elections. In 2012
and 2014 non-party organizations (such as PACs, corporations and
1 Initiative 1464 would do the following:
• The initiative would create a system of “democracy credits” (state-funded vouchers) funded by a non-
resident sales tax.
• Registered voters and certain other state residents would each receive three $50 credits from the state.
They could then give one, two, or all three of the vouchers to the qualified candidate(s) of their choice.
• To qualify to receive the new credits, candidates must agree to abide by contribution limits most of which
would be half as high as the ones for candidates who choose not to participate.
• The contribution limits for non-participating candidates would be the same as they are under current law
($1,000 per election in 2016).
• The limits for contributions to candidates from bona fide political parties and caucus political committees
would remain as they are under current law for both participating and non-participating candidates.
These are set at $1 per registered voter per election cycle, which worked out in 2016 to an amount per
legislative district that ranged from $70,301 to $103,669.
https://www.pdc.wa.gov/sites/default/files/campaign-contribution-limits/LIMITS16.pdf
3
labor unions) gave more than half of the money that went to Washington’s state legislative
candidates. Small donors (giving $250 or less) were responsible for less than 15%. With the
system proposed in this initiative, CFI estimates that if all candidates were to participate in the
system, vouchers and small donors would become the most important sources of funding for
state legislative elections while PACs and other non-party interest groups would become
substantially less important. The political parties could continue to play a major role. Note that
we are not claiming that interest groups would simply disappear. We would expect to see
organizations encouraging their members and followers to use vouchers to support favored
candidates. Potentially, this could become quite significant. However, the interest groups’
direct financial involvement would greatly diminish, to be replaced by a system in which more
citizens (from more demographically representative neighborhoods) would play a financially
active role.
We arrive at these conclusions after developing two hypothetical scenarios. One is based on the
conservative assumption that candidates will only raise enough money through the new credits
to replace the money they would lose under the initiative’s lowered contribution limits for
participating candidates. Since accepting the credits would be voluntary, no candidate would be
likely to participate who could not raise at least this much. We consider this assumption
therefore to be a baseline. The other scenario imagines every candidate receiving the maximum
number of credits to be allowed under the proposed law. This is highly unlikely but lets us
develop a high-end scenario. The most likely result would fall somewhere between.
The remaining pages of this report will present the evidence for these conclusions. It will come
in two major parts. The first will analyze the current system – briefly describing the candidates’
sources of funds in summary form along with a demographic overview of the neighborhoods in
which the current donors reside. The second major portion of the report will show how we
expect the system to change using two different sets of assumptions. We do not present these
hypothetical portraits as firm predictions. Rather, they are meant to offer a sense of the new
system’s implications.
THE SOURCES OF CAMPAIGN MONEY IN WASHINGTON TODAY
Very few individual donors give any money to candidates in Washington’s state elections today.
This does not make Washington unusual, but the point nevertheless is important. According to
previously published studies from the Campaign Finance Institute (CFI), slightly less than 1% of
the adult population gave any contributions at all to Washington’s state legislative candidates
in 2014 (CFI, 2015b). While this put Washington toward the middle of CFI’s 50-state ranking, it
meant that 99% of the adults gave nothing. Participation was higher in 2012 (2.73%) when
gubernatorial elections were also held, but 97% still were not giving anything (CFI 2015a.)
Financially, therefore, the political game was being played by only a select few.
4
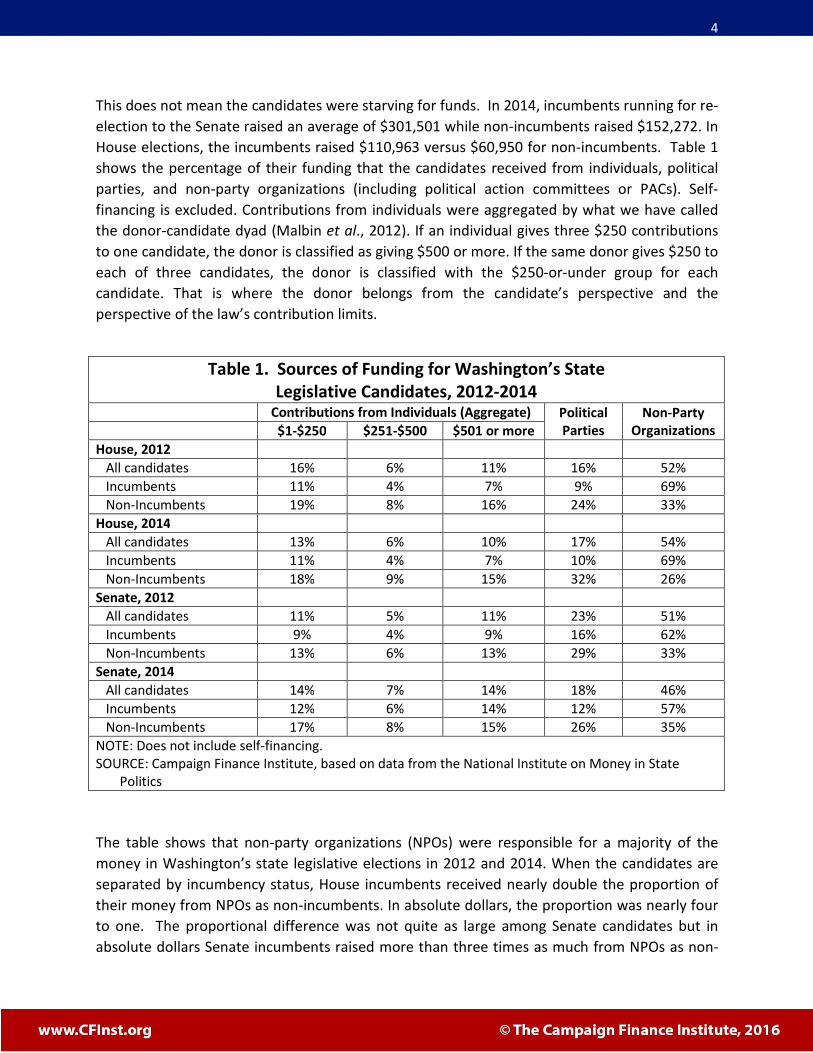
This does not mean the candidates were starving for funds. In 2014, incumbents running for re-
election to the Senate raised an average of $301,501 while non-incumbents raised $152,272. In
House elections, the incumbents raised $110,963 versus $60,950 for non-incumbents. Table 1
shows the percentage of their funding that the candidates received from individuals, political
parties, and non-party organizations (including political action committees or PACs). Self-
financing is excluded. Contributions from individuals were aggregated by what we have called
the donor-candidate dyad (Malbin et al., 2012). If an individual gives three $250 contributions
to one candidate, the donor is classified as giving $500 or more. If the same donor gives $250 to
each of three candidates, the donor is classified with the $250-or-under group for each
candidate. That is where the donor belongs from the candidate’s perspective and the
perspective of the law’s contribution limits.
Table 1. Sources of Funding for Washington’s State
Legislative Candidates, 2012-2014
Contributions from Individuals (Aggregate) Political
Parties
Non-Party
Organizations $1-$250 $251-$500 $501 or more
House, 2012
All candidates 16% 6% 11% 16% 52%
Incumbents 11% 4% 7% 9% 69%
Non-Incumbents 19% 8% 16% 24% 33%
House, 2014
All candidates 13% 6% 10% 17% 54%
Incumbents 11% 4% 7% 10% 69%
Non-Incumbents 18% 9% 15% 32% 26%
Senate, 2012
All candidates 11% 5% 11% 23% 51%
Incumbents 9% 4% 9% 16% 62%
Non-Incumbents 13% 6% 13% 29% 33%
Senate, 2014
All candidates 14% 7% 14% 18% 46%
Incumbents 12% 6% 14% 12% 57%
Non-Incumbents 17% 8% 15% 26% 35%
NOTE: Does not include self-financing.
SOURCE: Campaign Finance Institute, based on data from the National Institute on Money in State
Politics
The table shows that non-party organizations (NPOs) were responsible for a majority of the
money in Washington’s state legislative elections in 2012 and 2014. When the candidates are
separated by incumbency status, House incumbents received nearly double the proportion of
their money from NPOs as non-incumbents. In absolute dollars, the proportion was nearly four
to one. The proportional difference was not quite as large among Senate candidates but in
absolute dollars Senate incumbents raised more than three times as much from NPOs as non-

5
incumbents. In fact, Senate incumbents raised more from the NPOs than non-incumbents
raised from all sources combined.
These contributions are not coming from a random sampling of Washington’s citizens.
According to the National Institute on Money in State Politics, the most important sources of
NPO money in Washington’s 2012 and 2014 legislative elections were the following sectors of
non-party participants, with contributions of at least $1 million per sector: Finance, Insurance
and Real Estate; Health; Labor Unions; General Business; Transportation; Energy/Natural
Resources; Communications/Electronics; and Lawyers/Lobbyists. Organizations with business
before the government and with the economic resources to participate were dominating the
contributions, putting in what they needed (and could afford) to make sure the government
would address the issues they thought important.2
We can see a similar, although less pronounced, economic skew among the individual donors.
For the next table (Table 2) the Campaign Finance Institute geo-coded all disclosed donors’
addresses and placed them into their respective census block groups (CBG). According to the
U.S. Census Bureau, block groups “are generally defined to contain between 600 and 3,000
people”.3 This is much smaller than a zip code. This number of people could live on one city
block of densely populated apartment houses or a cluster of blocks with smaller dwelling units.
It would be preferable for analysis, of course, if we knew the income and racial identity of
individual donors, but this is not possible. Therefore, knowing something about the fine-grained
neighborhoods in which small donors ($250 or less) reside will have to stand as a reasonable
surrogate. After geo-coding, we divided the CBGs into ones with donors who made
contributions of $250 or less and those with donors who gave more than $250. Some CBGs had
donors in both groups and therefore had their data included in each of the groups.
2 Results of a query-based search of Washington’s records conducted on the website, www.followthemoney.org,
October 15, 2016.
3 U.S. Census Bureau, “Geographic Terms and Concepts – Block Groups.” Available at
http://www.census.gov/geo/reference/gtc/gtc_bg.html. Accessed July 27, 2016.

6
Table 2. Donor Diversity in Washington’s State Legislative Elections
Comparing Census Block Groups (CBGs) Having Small Donors ($250 or Less)
with CBGs Having Donors Who Give Larger Amounts ($251 or more)
Donors
who gave …
House
2012
House
2014
Senate
2012
Senate
2014
Governor
2012
% of the state’s CBGs with
donors who gave …
$250 or less 75% 65% 47% 59% 93%
$251 or
more 28% 14% 23% 22% 59%
Average aggregate
contribution, in CBGs with
donors who gave …
$250 or less $91 $100 $93 $97 $91
$251 or
more $693 $692 $734 $733 $985
INCOME: Median household, as
% of the statewide median, in
CBGs with donors who gave …
$250 or less 109%*** 110%*** 109%*** 112%*** 102%***
$251 or
more 118%*** 120%*** 120%*** 126%*** 111%***
POVERTY: % in CBG as a % of
the statewide rate in CBGs
with donors who gave …
$250 or less 84%*** 80%*** 77%*** 79%*** 92%***
$251 or
more 71%*** 69%*** 64%*** 67%*** 76%***
RACE: % nonwhite as a % of the
statewide rate in CBGs with
donors who gave …
$250 or less 96%** 96% 89%*** 98% 108%***
$251 or
more 91%** 90%*** 78%*** 92%*** 95%***
NOTE: The rows for Income, Poverty and Race measure statistical significance in the following ways. For
small donors, significance is calculated using difference in means t-tests for small donors’ CBGs and all
CBGs statewide. For large donors, significance is measured as the difference in means between small
and large donor CBGs. *p<0.1;
**p<0.05;
***p<0.01
SOURCE: The Campaign Finance Institute (CFI), based on data from the National Institute on Money in
State Politics and US Census Bureau. CFI geo-coded each donor by CBG.
The first two rows of the table are unremarkable, telling us how many CBGs have small and
large donors in them and how much the donors in each group typically gave. (Note that the
average contribution for small donors is higher than it would be if we had the addresses for all
donors, instead of only for the ones who gave $25 or more.) In contrast, the final three rows tell
an interesting story. These show household incomes, poverty rates, and the percentages of
nonwhite residents in the CBGs with small donors compared to those with large donors.
Asterisks are used to show statistically significant differences. For the large donor rows,
asterisks mean that the large donors were significantly different from the small donors.
Significance in the small donors’ rows refers to the difference between the small donor CBGs
and the statewide average. In every case, large donors came from CBGs that had higher
incomes, lower poverty rates, and lower nonwhite populations than small donor CBGs.

7
However, this did not mean that the small donor CBGs were fully representative. The small
donor CBGs had higher incomes and lower poverty rates than the whole state and in most
cases, they also had lower percentages of nonwhite populations.
While we cannot be definitive on this point, we would suspect that the small donor CBGs would
have been more representative if unitemized donors were included. More importantly for the
discussion at hand, even the currently knowable differences between small and large donor
CBGs tell us that users of the Democracy Credits will almost surely be more representative of
the population as a whole. With the vouchers essentially being “free money”, affordability will
no longer be a deterrent to potential donors who are motivated.
A PORTRAIT OF A SYSTEM WITH DEMOCRACY CREDITS
Much of the discussion on both sides of the debate about Democracy Credits has been based
on characterizations without quantification. This section of the report will give a quantitative
sense of what the donor mixture might look like if candidates chose to participate in the
system, accepting the 50% lower contribution limits that come along with accepting Democracy
Credits. To develop a quantitative sense of the implications, we have created hypothetical
scenarios assuming the following:
1. Each of the candidates who ran in 2012 and 2014 would continue to do so;
2. Each of the donors who gave in 2012 and 2014 would do so, but only up to the new
legal maximum;
3. No new candidates would be brought into the system, and no new donors except
through Democracy Credits; and
4. Every candidate chooses voluntarily to participate in the system.
There is obviously a certain unreality to these assumptions. At least some of the donors who
max out under the lower contribution limits are likely to transfer some of their money to other
candidates. More importantly, credits are likely to persuade new candidates to run. We
acknowledge these limitations, but believe the scenarios nevertheless provide a useful portrait.
With these assumptions in place, we now make some more to create two very different
hypothetical situations. As noted, any candidate who accepts Democracy Credits would have to
abide by limits on contributions from individuals and non-party organizations that would be half
of the limits for non-participants. Currently, that would mean a cut from $1,000 to $500. (The
limits for political party contributions to candidates would remain unchanged.) It is difficult to
imagine a candidate volunteering to participate in the new system unless the candidate could
attract enough Democracy Credits to replace the money to be lost through the new
contribution limits. In our first scenario (Hypothetical 1: Baseline Estimate), therefore, we
8
assume that all candidates participate and that each raises only the money that she or he will
need to remain “whole” – that is, to replace the money lost through the new limits. We
consider this to be a low estimate, or baseline, if all candidates participate. The second scenario
(Hypothetical 2: Maximum Estimate) goes to the opposite extreme. It assumes not only that
every candidate will participate but that everyone will raise the maximum amount that the new
law would allow. Both scenarios are surely off the mark, with the most likely results falling
somewhere between. However, the two provide boundaries for getting a grasp on the likely
results. Table 3 shows the distribution of funding sources under the status quo and the two
hypotheticals.
One final caveat before reading the table: the column marked “Democracy Credits” only
includes the value of credits that would bring new money into the system – whether from new
donors, or from old donors who both give the credit and continue to contribute as much as
they did under the status quo. In reality, some credits may also replace individual contributions,
particularly from small donors. However, we cannot know how much this will occur. In addition,
this kind of replacement activity will not help the candidate make up for lost money. We
therefore do not include a replacement effect in the table.
As we read Table 3, let us concentrate first on the baseline estimate (Hypothetical 1). Under the
status quo, NPOs were by far the most important sources of money for state legislative
candidates. Under the baseline estimate, Democracy Credits would be more important than
NPOs in three of the four cases (House 2014, Senate 2012, and Senate 2014). (They would be
equal for the House in 2014.) In all four cases, adding small donors to the Democracy Credits
would make them much more important than the NPOs. This in itself would be a major shift of
focus for the fundraising candidate. In addition, contributions from the political parties would
have become as important as contributions from the NPOs in the two Senate elections. The
proportions would change again under the maximum estimate (Hypothetical 2). This time
Democracy Credits would by far be the most important sources of funding for candidates. As
noted, we expect the reality to more likely to fall between two hypothetical estimates.

9
Table 3. Sources of Funding for Washington’s State
Legislative Candidates, 2012-2014: Current vs. Hypothetical Contributions from Individuals
(Aggregate) Political
Parties
Non-Party
Organizations
“Democracy
Credits”
$1-$250 $251-$500 $501 or more
House, 2012
Current 16% 6% 11% 16% 52% NA
Hypothetical 1 16% 11% NA 16% 29% 29%
Hypothetical 2 5% 6% NA 6% 18% 65%
House, 2014
Current 13% 6% 10% 17% 54% NA
Hypothetical 1 13% 10% NA 17% 28% 32%
Hypothetical 2 5% 4% NA 7% 11% 72%
Senate, 2012
Current 11% 5% 11% 23% 51% NA
Hypothetical 1 11% 10% NA 23% 27% 30%
Hypothetical 2 4% 6% NA 9% 20% 62%
Senate, 2014
Current 14% 7% 14% 18% 46% NA
Hypothetical 1 14% 13% NA 18% 19% 36%
Hypothetical 2 8% 7% NA 10% 10% 66%
NOTE: Does not include self-financing.
ASSUMPTIONS:
Hypothetical 1 (Baseline Estimate): (1) The same donors continue to give private contributions, up to the
new legal maximum; (2) All candidates participate; (3) Each candidate raises exactly enough new
money from Democracy Credits as needed to replace the money lost through contribution limits.
Hypothetical 2 (Maximum Estimate): (1) The same donors continue to give private contributions, up to
the new legal maximum; (2) All candidates participate; (3) Every candidate raises the maximum in
Democracy Credits that would be allowed under the initiative.
SOURCE: Campaign Finance Institute, based on data from the National Institute on Money in State
Politics
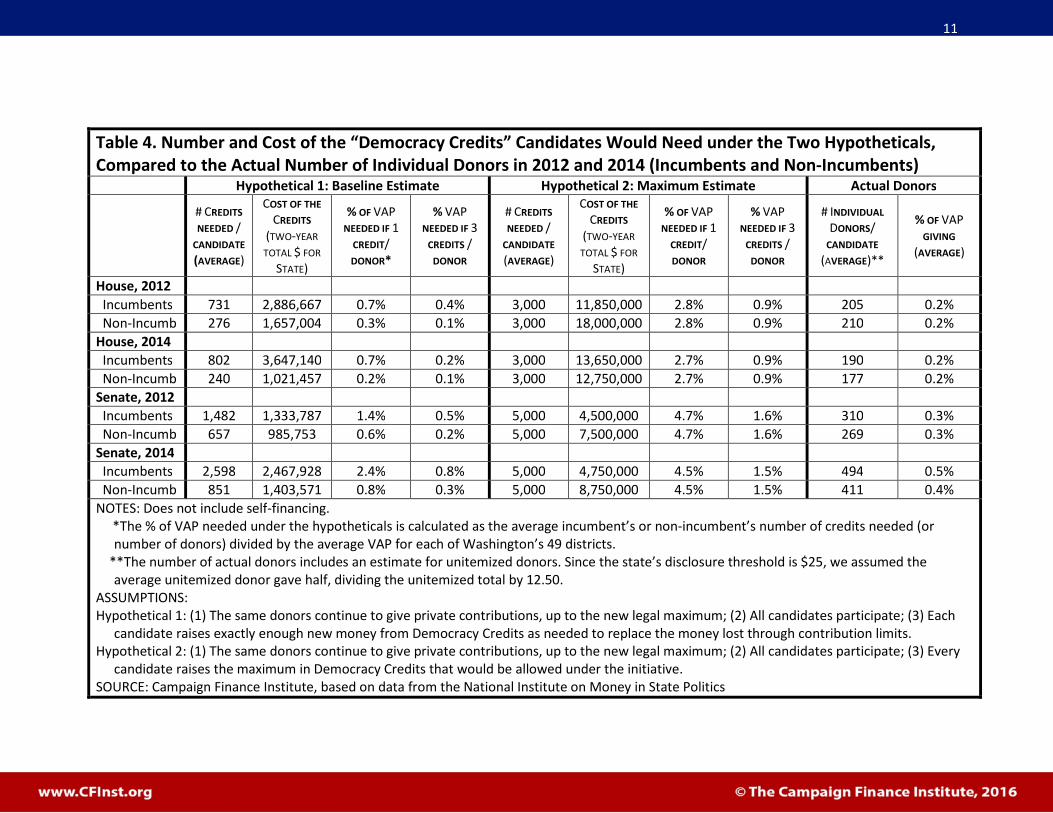
Number of Donors Needed and Projected Cost
One way to test whether the scenarios seem plausible is to consider the number of Democracy
Credits that would be needed to reach the hypothetical goals. Because the situation would be
very different for incumbents and non-incumbents, the results are presented separately in
Table 4. Also shown for perspective are the numbers of individual donors candidates have
under the current system. The numbers of actual donors (second column from the far right)
include estimates for the unitemized donors derived by dividing the unitemized money by
12.50 (half of the disclosure threshold). The column on the far right shows the numbers of
donors as percentages of the adult population (voting age population or VAP) in the average
district. In the columns for the hypotheticals, the percentages of adults a candidate would need

10
to recruit are shown first on the assumption that each new donor will give one credit to one
candidate. The next column makes the assumption that all donors will hand all three credits to
the same candidate. The number of credits in the system, and the number of people donating
credits statewide, would remain the same under either assumption, but the number of people
each candidate has to mobilize would be different.
11
Table 4. Number and Cost of the “Democracy Credits” Candidates Would Need under the Two Hypotheticals,
Compared to the Actual Number of Individual Donors in 2012 and 2014 (Incumbents and Non-Incumbents)
Hypothetical 1: Baseline Estimate Hypothetical 2: Maximum Estimate Actual Donors
# CREDITS
NEEDED /
CANDIDATE
(AVERAGE)
COST OF THE
CREDITS
(TWO-YEAR
TOTAL $ FOR
STATE)
% OF VAP
NEEDED IF 1
CREDIT/
DONOR*
% VAP
NEEDED IF 3
CREDITS /
DONOR
# CREDITS
NEEDED /
CANDIDATE
(AVERAGE)
COST OF THE
CREDITS
(TWO-YEAR
TOTAL $ FOR
STATE)
% OF VAP
NEEDED IF 1
CREDIT/
DONOR
% VAP
NEEDED IF 3
CREDITS /
DONOR
# INDIVIDUAL
DONORS/
CANDIDATE
(AVERAGE)**
% OF VAP
GIVING
(AVERAGE)
House, 2012
Incumbents 731 2,886,667 0.7% 0.4% 3,000 11,850,000 2.8% 0.9% 205 0.2%
Non-Incumb 276 1,657,004 0.3% 0.1% 3,000 18,000,000 2.8% 0.9% 210 0.2%
House, 2014
Incumbents 802 3,647,140 0.7% 0.2% 3,000 13,650,000 2.7% 0.9% 190 0.2%
Non-Incumb 240 1,021,457 0.2% 0.1% 3,000 12,750,000 2.7% 0.9% 177 0.2%
Senate, 2012
Incumbents 1,482 1,333,787 1.4% 0.5% 5,000 4,500,000 4.7% 1.6% 310 0.3%
Non-Incumb 657 985,753 0.6% 0.2% 5,000 7,500,000 4.7% 1.6% 269 0.3%
Senate, 2014
Incumbents 2,598 2,467,928 2.4% 0.8% 5,000 4,750,000 4.5% 1.5% 494 0.5%
Non-Incumb 851 1,403,571 0.8% 0.3% 5,000 8,750,000 4.5% 1.5% 411 0.4%
NOTES: Does not include self-financing.
*The % of VAP needed under the hypotheticals is calculated as the average incumbent’s or non-incumbent’s number of credits needed (or
number of donors) divided by the average VAP for each of Washington’s 49 districts.
**The number of actual donors includes an estimate for unitemized donors. Since the state’s disclosure threshold is $25, we assumed the
average unitemized donor gave half, dividing the unitemized total by 12.50.
ASSUMPTIONS:
Hypothetical 1: (1) The same donors continue to give private contributions, up to the new legal maximum; (2) All candidates participate; (3) Each
candidate raises exactly enough new money from Democracy Credits as needed to replace the money lost through contribution limits.
Hypothetical 2: (1) The same donors continue to give private contributions, up to the new legal maximum; (2) All candidates participate; (3) Every
candidate raises the maximum in Democracy Credits that would be allowed under the initiative.
SOURCE: Campaign Finance Institute, based on data from the National Institute on Money in State Politics

12
The table shows that even though Washington’s legislative candidates typically have few
individual donors, it would not be much of a stretch for House candidates and Senate non-
incumbents to replace the funds they would lose under the lower contributions limits. In fact,
they could go a long way toward reaching this goal by persuading existing donors to give them
their credits while continuing to give a private contribution. Replacing the lost money would be
more difficult for Senate incumbents, but feasible – particularly if the candidate can persuade
donors to give more than one of the donor’s credits. Every credit above the break-even point
would put candidates ahead of the status quo.
Reaching the maximum probably would be a stretch for most candidates, especially if they
relied only on the tried and true fundraising methods they have used in the past. However, we
can easily imagine candidates developing social networking capacities at low cost, and we
would expect to see organizations mobilizing their membership bases to contribute to favored
candidates. With the credits in effect being free to the donor, it would be no surprise to see
numbers well above the baseline – although probably not as many as would be needed for
most candidates to reach the maximum.
The two-year cost for the credits for both chambers in the baseline scenario would have been
$6.9 million for the 2012 election cycle and $8.5 million for 2014. The cost for the maximum
estimate would have been much higher at $41.9 million in 2012 and $39.9 million in 2014. The
budget included in the initiative is $30 million per year, or $60 million for two years. This would
be enough to cover even the maximum estimate. However, the initiative’s sponsors have
created a mechanism for expanding the offices covered if conditions permit. There is a great
deal of uncertainty about where the actual cost might fall within this very wide range. As noted
earlier, there is no experience with vouchers to make estimating easier. Given the uncertainty,
it is wise that the initiative requires a future assessment of revenues and costs before deciding
whether to extend Democracy Credits to more offices.

13
CONCLUSION
If enacted, Initiative 1464 would be likely to have a transformative effect on Washington
politics. At a minimum, it would reduce the electoral importance of the business-oriented
interest groups that give the bulk of campaign contributions today. At the lower end of our
estimates, where we could imagine candidates directly recruiting donors to give credits, the
initiative would also elevate the relative importance of a more representative set of individual
small donors. However, if the credits are used more heavily it is likely to be because
membership-based interest groups and organizations are joining the political parties and
candidates to mobilize potential donors. Because the credits will be cost-free to the donors, this
mobilization by intermediary groups is likely to be more robust than in a small-donor matching
fund system, such as New York City’s (as analyzed in Malbin et al. 2012; Malbin and Parrott,
2016). Because we cannot be sure exactly how the credits will be used until at least one
jurisdiction does so, their implications cannot yet be fully known. But however used, the effects
on the system are likely to be profound.

14
WORKS CITED
Ackerman, Bruce and Ian Ayres. 2002. Voting with Dollars: A New Paradigm for Campaign
Finance. New Haven: Yale University Press.
Adamany, David W. and George E. Agree. 1975. Political Money: A Strategy for Campaign
Financing in America. Baltimore: Johns Hopkins University Press.
Campaign Finance Institute. 2014a. “CFI Releases Analysis on Money in [2012] State Elections.”
Oct. 30. http://cfinst.org/Press/PReleases/14-10-
30/CFI_Releases_Analysis_of_Money_in_State_Elections.aspx
__________. 2014b. “CFI’s Analysis of How Many Gave and the Sources of Candidates’ Funds in
the State Elections of 2014.” December 18. http://www.cfinst.org/Press/PReleases/15-12-
18/CFI%E2%80%99s_Analysis_of_How_Many_Gave_and_the_Sources_of_Candidates%E2%8
0%99_Funds_in_the_State_Elections_of_2014.aspx
Hasen, Richard l. 1996. “Clipping Coupons for Democracy: An Egalitarian/Public Choice Defense
of Campaign Finance Vouchers.” California Law Review 84(1): 1-59.
Malbin, Michael J., Peter W. Brusoe and Brendan Glavin. 2012. “Small Donors, Big Democracy:
New York City’s Matching Funds as a Model for the Nation and States.” Election Law Journal.
11(1), 3–20. http://www.cfinst.org/pdf/state/NYC-as-a-Model_ELJ_As-
Published_March2012.pdf
Malbin, Michael J. and Michael Parrott. 2016. “Would Revising Los Angeles’ Campaign Matching
Fund System Make a Difference?” [This report is a comparative analysis of matching funds in
Los Angeles and New York City.] September. Washington DC: Campaign Finance Institute.
http://www.cfinst.org/pdf/books-reports/LosAngeles_PublicFundingReport_2016.pdf
Text of Initiative 1464. State of Washington. Secretary of State.
https://sos.wa.gov/_assets/elections/initiatives/finaltext_997.pdf
Visit CFI’s website at
www.CFInst.org to
read all of our reports
and analyses of money
in politics at the
federal, state and local
levels.
Follow CFI on Twitter at
@CFInst.org