2011 SUMMER SEMINAR
Deadwood SDJune 22, 2011

PRODUCT TRENDS

NUSUN OIL DOMESTIC/EXPORT USAGE
2000
/01
2001
/02
2002
/03
2003
/04
2004
/05
2005
/06
2006
/07
2007
/08
2008
/09
2009
/10
0
40000
80000
120000
160000
200000
240000
280000
320000
Chart Title
MTLinear (MT)
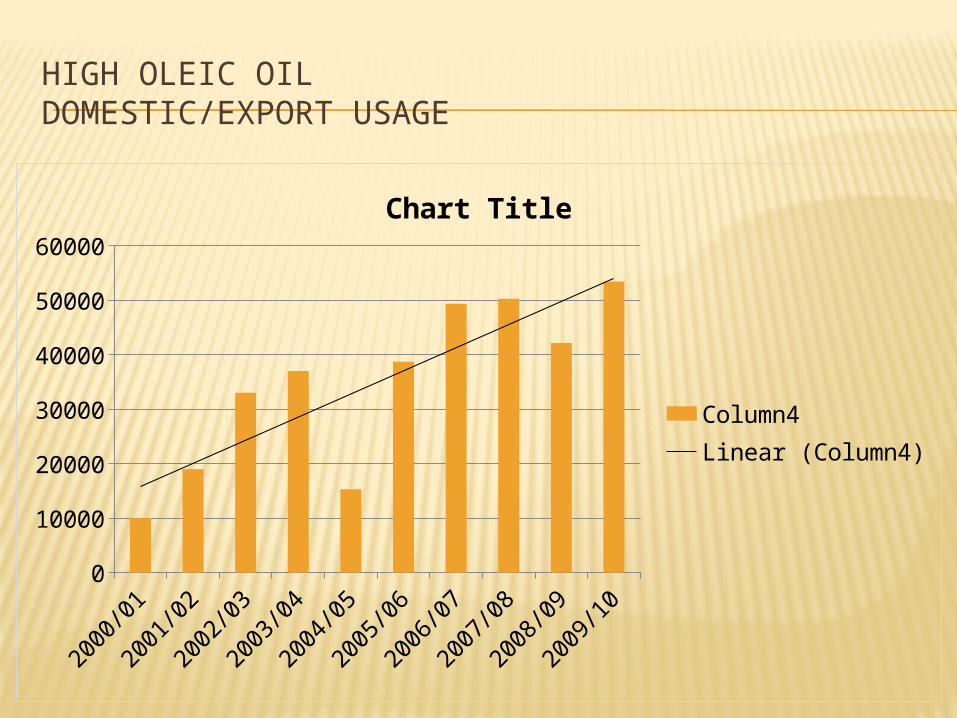
HIGH OLEIC OIL DOMESTIC/EXPORT USAGE
2000
/01
2001
/02
2002
/03
2003
/04
2004
/05
2005
/06
2006
/07
2007
/08
2008
/09
2009
/10
0
10000
20000
30000
40000
50000
60000
Chart Title
MTLinear (MT)
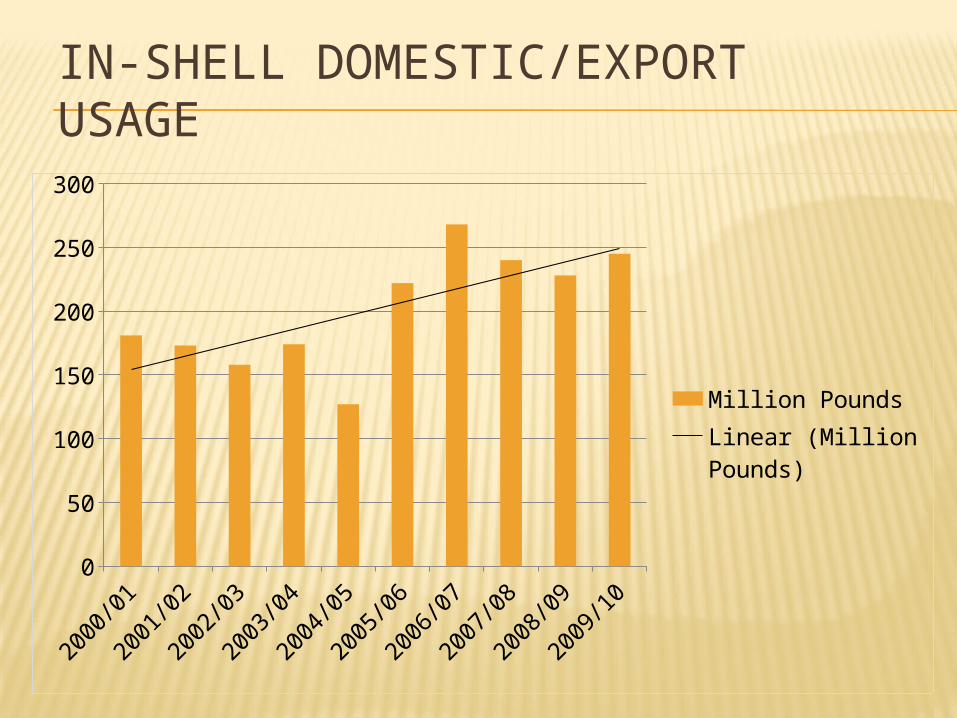
IN-SHELL DOMESTIC/EXPORT USAGE
2000
/01
2001
/02
2002
/03
2003
/04
2004
/05
2005
/06
2006
/07
2007
/08
2008
/09
2009
/10
0
50
100
150
200
250
300
Million PoundsLinear (Million Pounds)
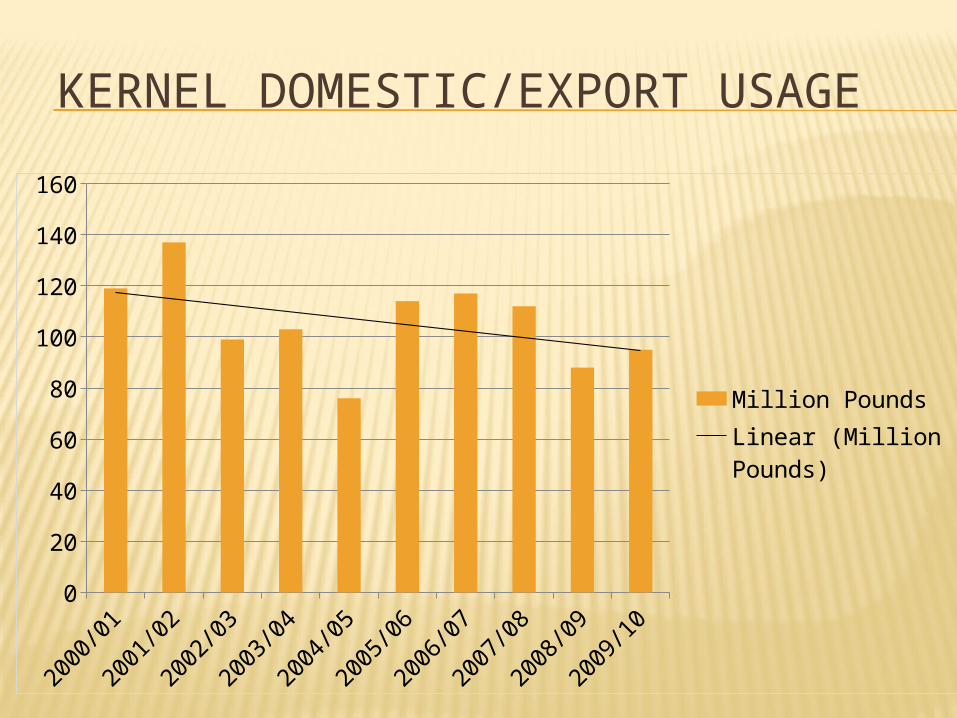
KERNEL DOMESTIC/EXPORT USAGE
2000
/01
2001
/02
2002
/03
2003
/04
2004
/05
2005
/06
2006
/07
2007
/08
2008
/09
2009
/10
0
20
40
60
80
100
120
140
160
Million PoundsLinear (Million Pounds)
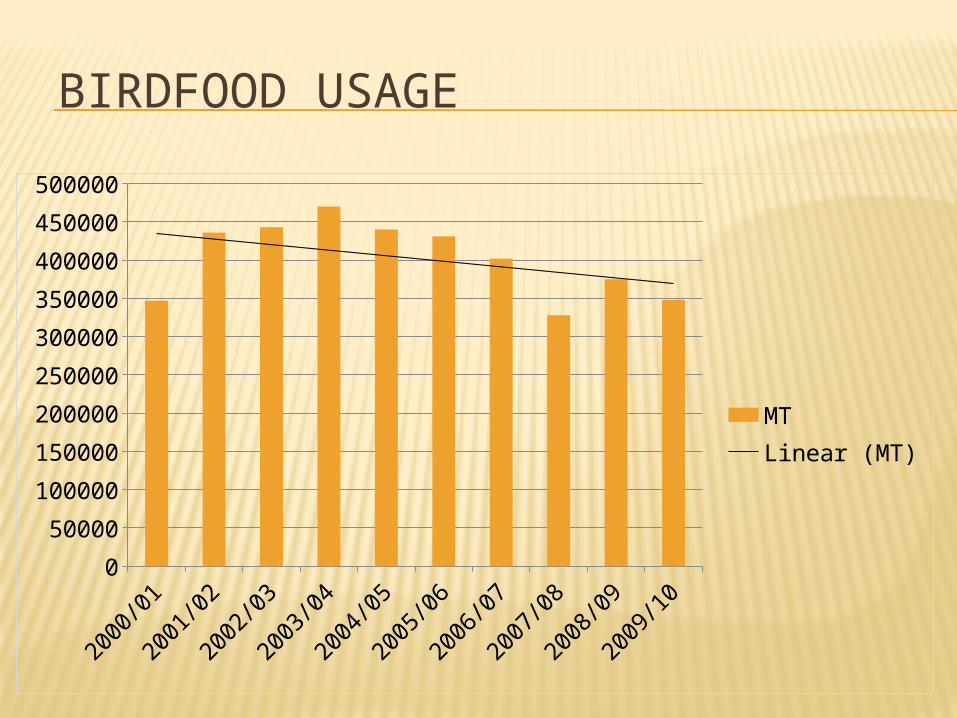
BIRDFOOD USAGE
2000
/01
2001
/02
2002
/03
2003
/04
2004
/05
2005
/06
2006
/07
2007
/08
2008
/09
2009
/10
0
50000
100000
150000
200000
250000
300000
350000
400000
450000
500000
MTLinear (MT)

ACREAGE/YIELD TRENDS
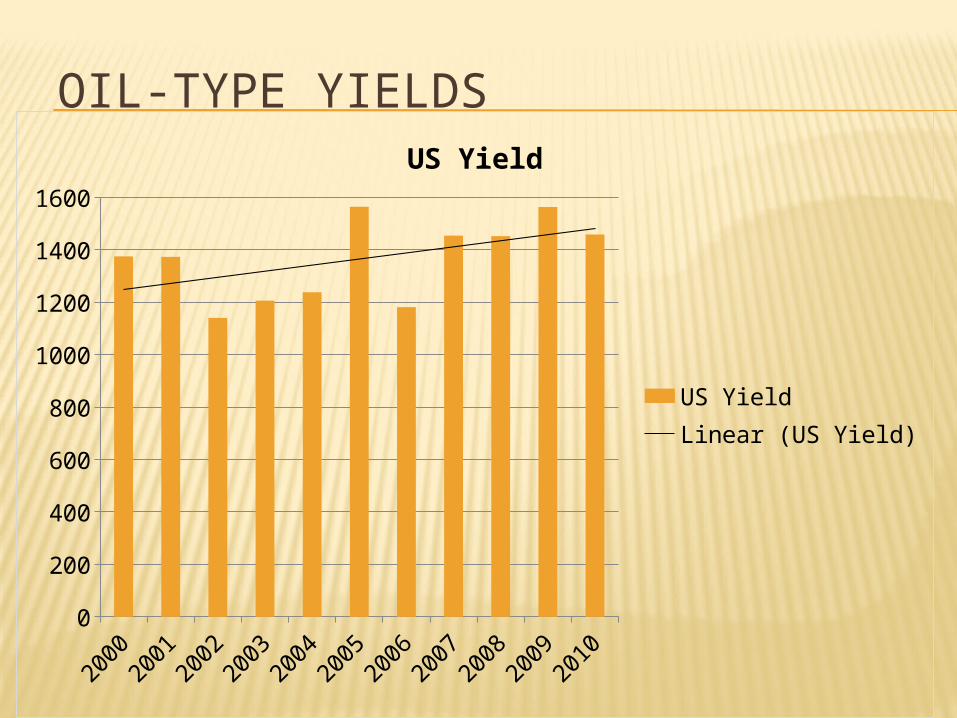
OIL-TYPE YIELDS
2000
2001
2002
2003
2004
2005
2006
2007
2008
2009
2010
0
200
400
600
800
1000
1200
1400
1600
US Yield
US YieldLinear (US Yield)
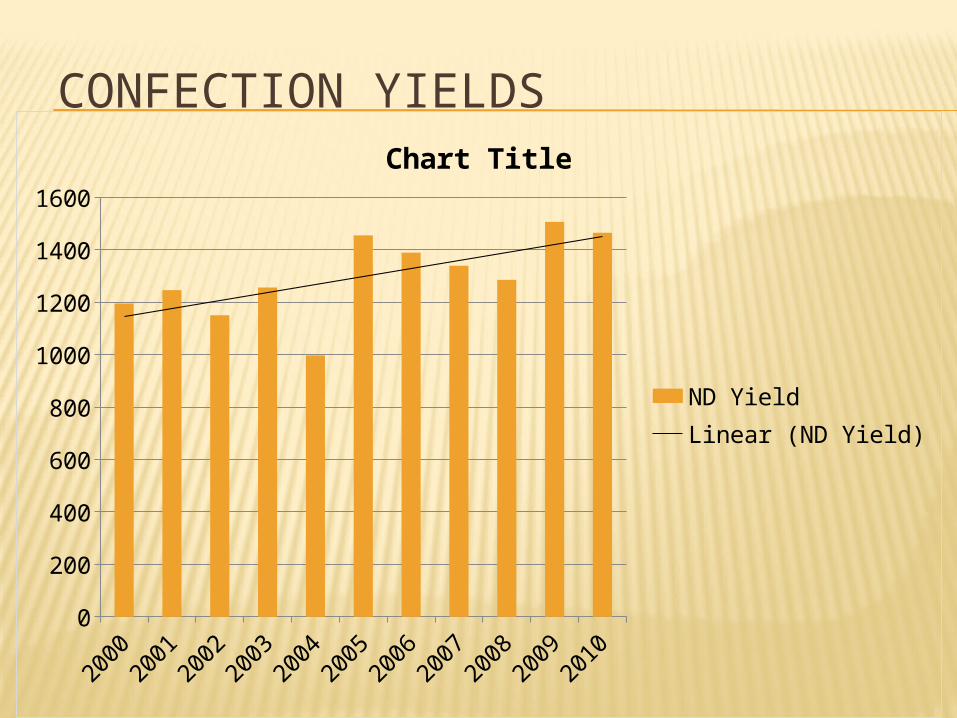
CONFECTION YIELDS
2000
2001
2002
2003
2004
2005
2006
2007
2008
2009
2010
0
200
400
600
800
1000
1200
1400
1600
Chart Title
US YieldLinear (US Yield)

U.S. PLANTED OIL-TYPE ACRES
2000
2001
2002
2003
2004
2005
2006
2007
2008
2009
2010
2011
1000000
1200000
1400000
1600000
1800000
2000000
2200000

U.S. PLANTED CONFECTION ACRES
2000
2001
2002
2003
2004
2005
2006
2007
2008
2009
2010
2011
0
100000
200000
300000
400000
500000
600000
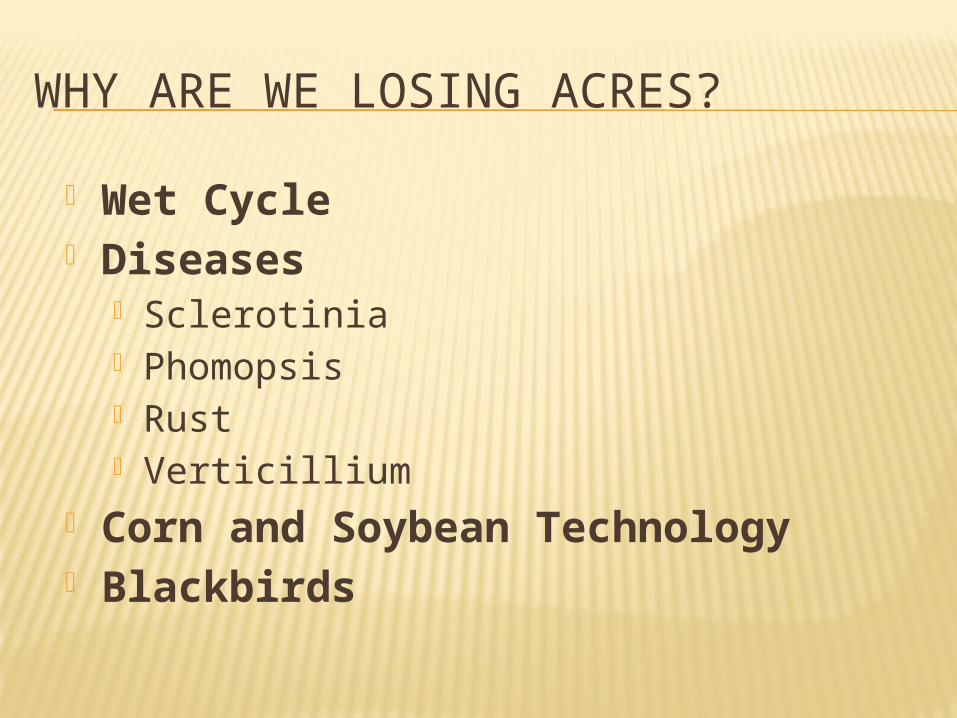
WHY ARE WE LOSING ACRES?
Wet Cycle Diseases
Sclerotinia Phomopsis Rust Verticillium
Corn and Soybean Technology Blackbirds
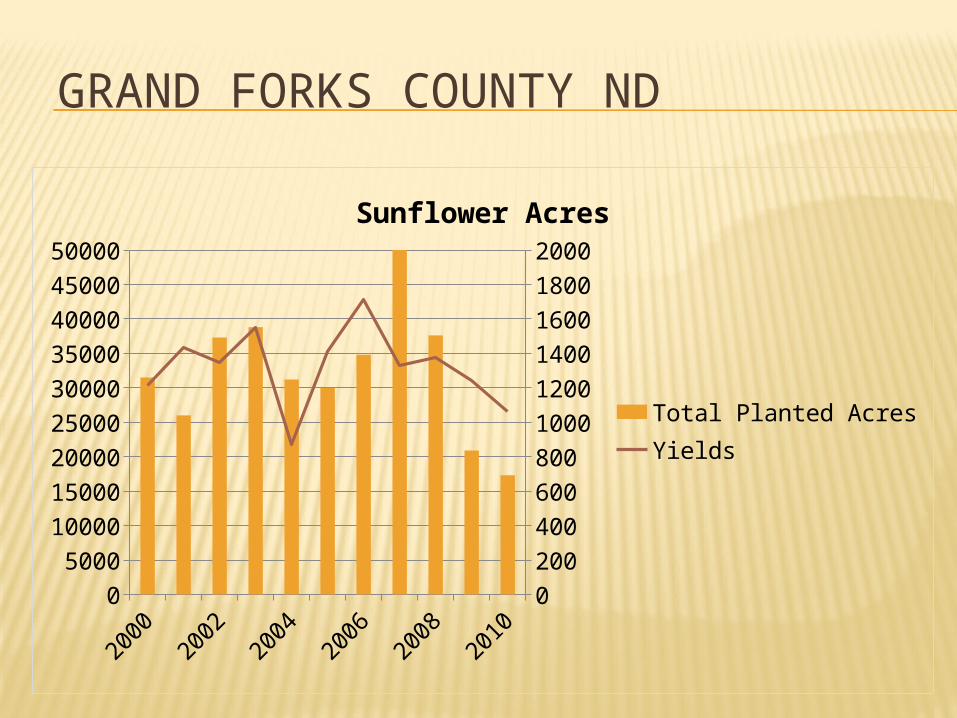
GRAND FORKS COUNTY ND
2000
2002
2004
2006
2008
2010
0
5000
10000
15000
20000
25000
30000
35000
40000
45000
50000
0
200
400
600
800
1000
1200
1400
1600
1800
2000
Sunflower Acres
Total Planted AcresYields

POLK COUNTY MN
2000
2001
2002
2003
2004
2005
2006
2007
2008
2009
2010
0
2000
4000
6000
8000
10000
12000
14000
16000
18000
20000
0
200
400
600
800
1000
1200
1400
1600
1800
2000
Sunflower Acres
Total Planted AcresYields
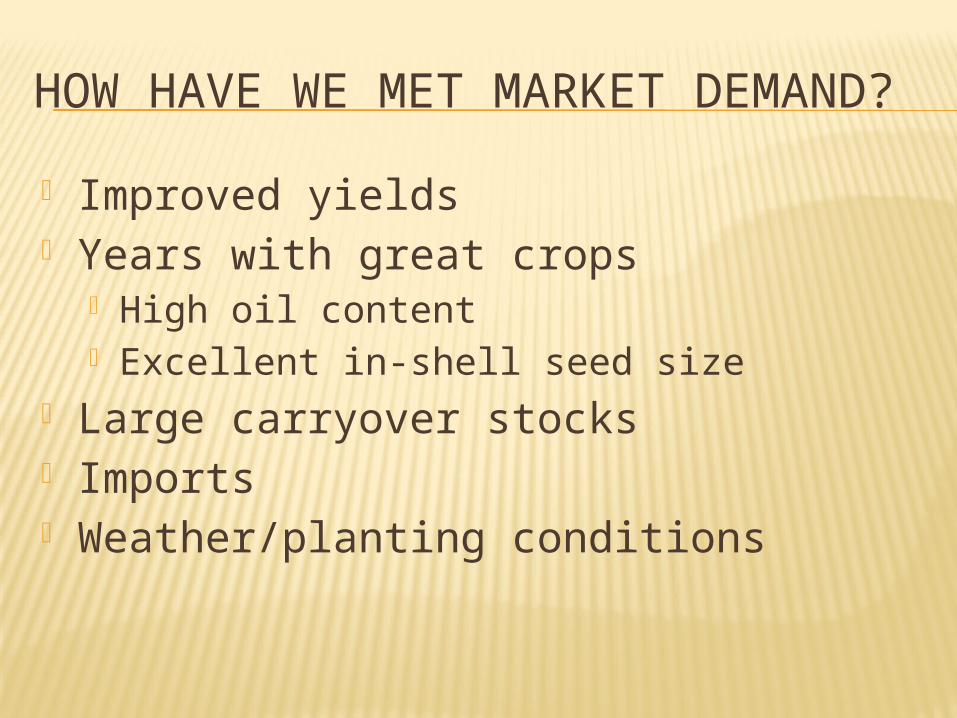
HOW HAVE WE MET MARKET DEMAND? Improved yields Years with great crops
High oil content Excellent in-shell seed size
Large carryover stocks Imports Weather/planting conditions

OIL-TYPE SUNFLOWER TOTAL SUPPLY
0
200000
400000
600000
800000
1000000
1200000
1400000
1600000
1800000
Ending stocksDisappearance
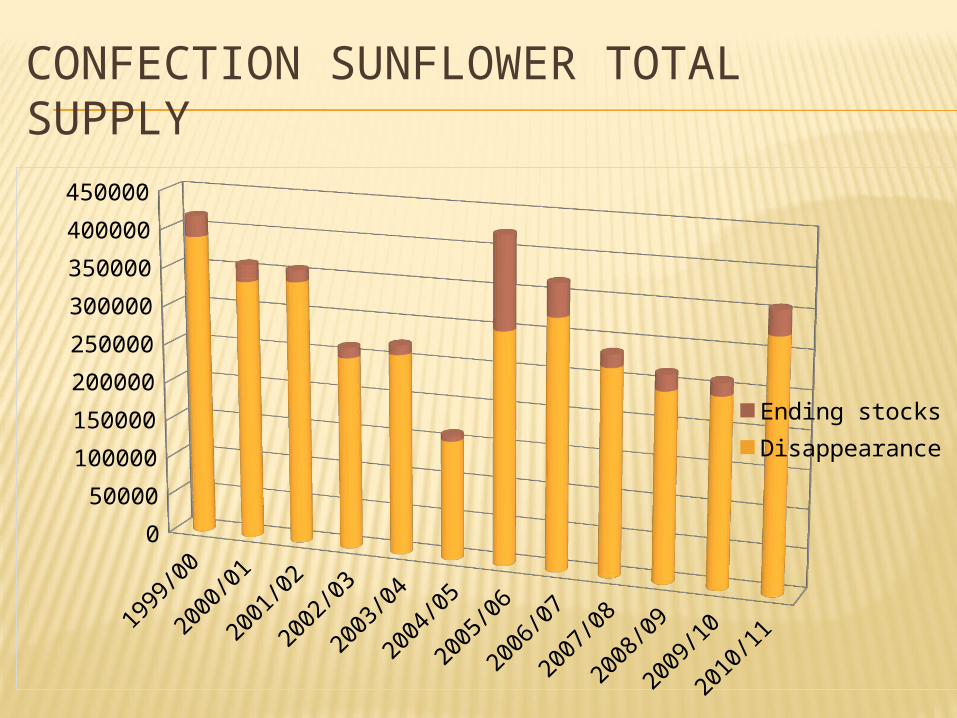
CONFECTION SUNFLOWER TOTAL SUPPLY
0
50000
100000
150000
200000
250000
300000
350000
400000
450000
Ending stocksDisappearance

YIELD GOALS
Work Toward Raising Yields by 25% Oils
Five Year Average 1420 lbs/acre 1775 lbs/acre
Confections Five Year Average - 1390 lbs/acre
1740 lbs/acre
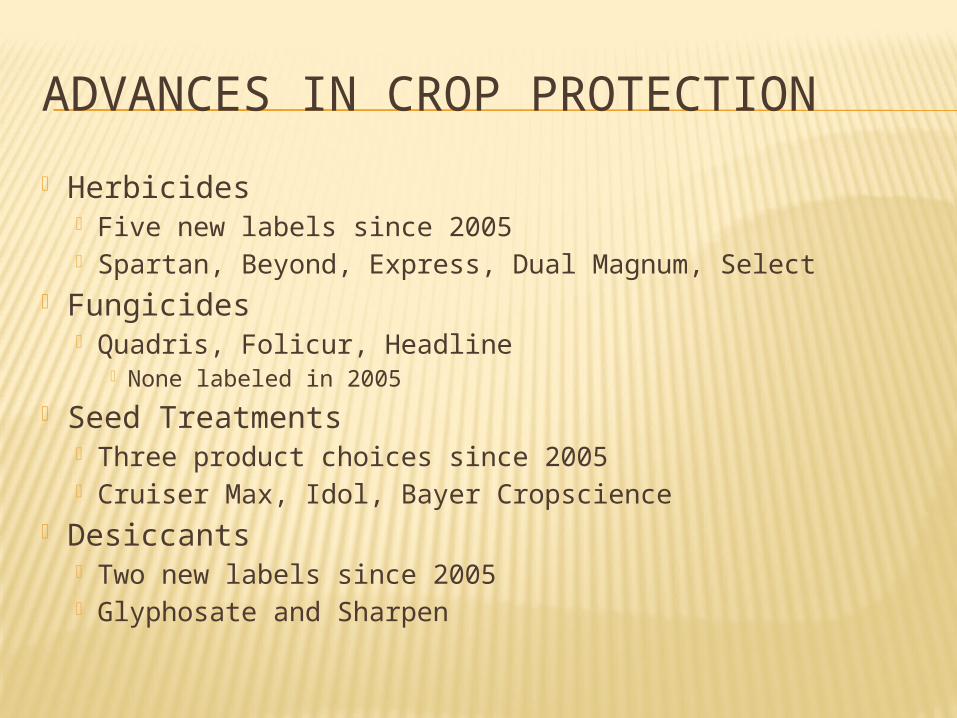
ADVANCES IN CROP PROTECTION
Herbicides Five new labels since 2005 Spartan, Beyond, Express, Dual Magnum, Select
Fungicides Quadris, Folicur, Headline
None labeled in 2005
Seed Treatments Three product choices since 2005 Cruiser Max, Idol, Bayer Cropscience
Desiccants Two new labels since 2005 Glyphosate and Sharpen
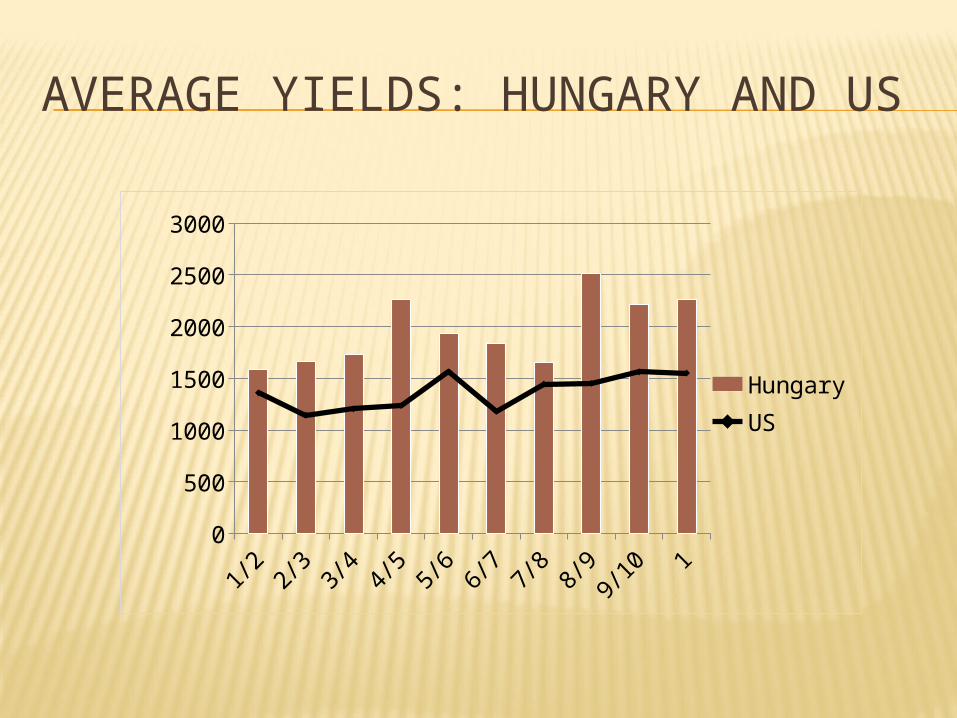
AVERAGE YIELDS: HUNGARY AND US
1/2
2/3
3/4
4/5
5/6
6/7
7/8
8/9
9/10 1
0
500
1000
1500
2000
2500
3000
HungaryUS
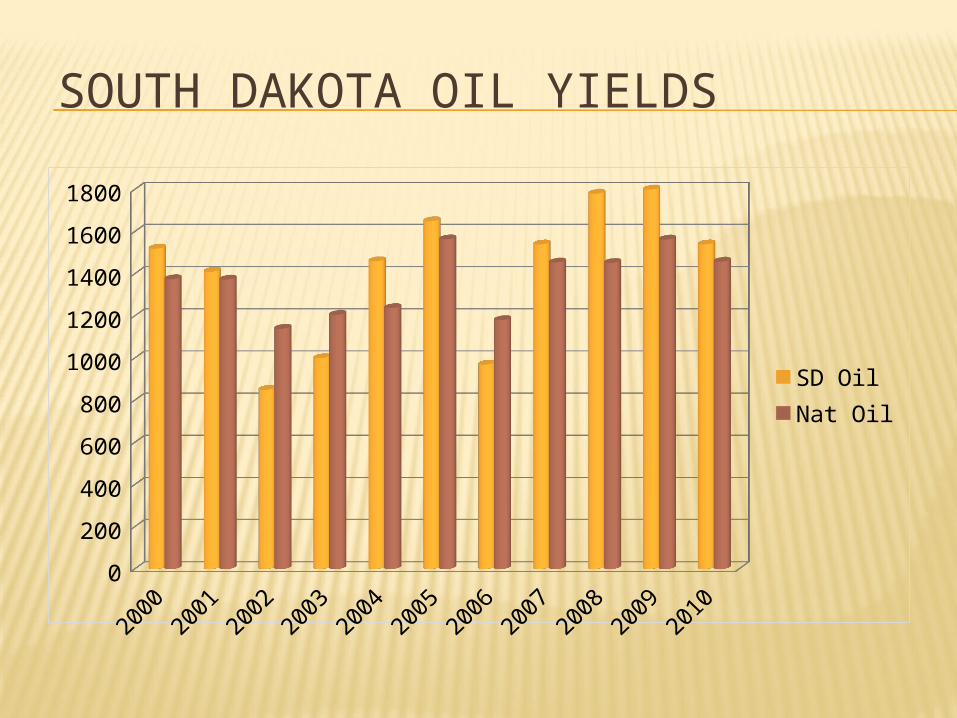
SOUTH DAKOTA OIL YIELDS
2000
2001
2002
2003
2004
2005
2006
2007
2008
2009
2010
0
200
400
600
800
1000
1200
1400
1600
1800
SD OilNat Oil

SUMMARY Product trends are promising Acres are trending downward Yields are improving gradually Need to secure more product to meet
demand
How do we achieve this?