University of Wollongong University of Wollongong
Research Online Research Online
University of Wollongong Thesis Collection 1954-2016 University of Wollongong Thesis Collections
1998
Creep-fatigue behaviour and life prediction Creep-fatigue behaviour and life prediction
Tarun Goswami University of Wollongong
Follow this and additional works at: https://ro.uow.edu.au/theses
University of Wollongong University of Wollongong
Copyright Warning Copyright Warning
You may print or download ONE copy of this document for the purpose of your own research or study. The University
does not authorise you to copy, communicate or otherwise make available electronically to any other person any
copyright material contained on this site.
You are reminded of the following: This work is copyright. Apart from any use permitted under the Copyright Act
1968, no part of this work may be reproduced by any process, nor may any other exclusive right be exercised,
without the permission of the author. Copyright owners are entitled to take legal action against persons who infringe
their copyright. A reproduction of material that is protected by copyright may be a copyright infringement. A court
may impose penalties and award damages in relation to offences and infringements relating to copyright material.
Higher penalties may apply, and higher damages may be awarded, for offences and infringements involving the
conversion of material into digital or electronic form.
Unless otherwise indicated, the views expressed in this thesis are those of the author and do not necessarily Unless otherwise indicated, the views expressed in this thesis are those of the author and do not necessarily
represent the views of the University of Wollongong. represent the views of the University of Wollongong.
Recommended Citation Recommended Citation Goswami, Tarun, Creep-fatigue behaviour and life prediction, Master of Engineering (Hons.) thesis, Department of Materials Engineering, University of Wollongong, 1998. https://ro.uow.edu.au/theses/2476
Research Online is the open access institutional repository for the University of Wollongong. For further information contact the UOW Library: [email protected]

CREEP-FATIGUEBEHAVIOUR AND LIFE PREDICTION
e rf tf?£. s ii submitted in fufjiùnsnt o f t(d xzcjuixsnz^nti
fox iJzz cuxraxd. o f bizs dscjxcz
eJ\J\caÌ£X o f ̂ ncjinzsxincj ( erfonouxiJ
From
THE UNIVERSITY OF WOLLONGONG
By
Tarun Goswami (M.E.)
Department of Materials Engineering University of Wollongong
Australia.

ABSTRACT
This thesis describes an investigation into the creep-fatigue behaviour and life prediction for
high temperature materials. The methodology adapted in this research was not experimental,
but, analytical using data compiled from several sources. High temperature low cycle fatigue
(HTLCF) data generated internationally on 0.5Cr-Mo-V, lCr-Mo-V, 1.25Cr-Mo, 2.25Cr-
lMo, 2.25Cr-lMo-V and 9Cr-lMo low alloy steels were compiled and analysed to identify
trends in creep-fatigue behaviour and life prediction for those steels. Effects of alloying
elements such as chromium and vanadium were investigated and it was shown that with
increase in chromium content the life improved, but with vanadium addition to a 2.25Cr-Mo
steel the life was lowered. For the annealed condition, in which the material tensile properties
were nearly half the value for the normalized and tempered condition, the 2.25Cr-lMo steel
had higher life.
Phenomenological methods of life prediction such as the damage summation approach
(DSA), the frequency modified approach (FMA), the strain range partitioning (SRP), the
damage rate approach (DRA), the hysteresis energy approach (HEA), the damage parameter
approach (DPA) and the assessment procedure R-5 are all in the developmental stage when
examined with the data bank compiled no one method was found to be better than other. The
phenomenological methods require a number of material and test parameters determined from
complex tests, as a result, alternate methods in the creep-fatigue life prediction are explored.
A statistical method, known as Diercks equation has been proposed in the literature as a better
method that was modified and its applicability was extended and assessed with the creep-
fatigue data for low alloy steels compiled in this investigation. The reliability of modified
Diercks equation was found to be higher than other methods.

Microstructural damage produced under HTLCF was documented optically for a titanium
alloy IMI 829 and a nickel based superalloy MAR M 002 under different test conditions. The
alloy IMI 829 contained interfacial cracks, cavitation and oxide banding resulting into
intrusions and multiple cracking at 600°C. However, wedge type of cracking and oxidation
damage by depletion of y' phase were observed for MAR M 002. The HTLCF damage
documented is described by a five stage model developed in this investigation and an
empirical oxidation life prediction method is developed for MAR M 002. A reasonable
prediction was observed at all the temperatures only under unaged condition, however, data
were over-predicted under ageing heat treatment which produced material microstructure
amenable to cracking. Further work is needed to apply this method in the creep-fatigue life
prediction of high temperature materials.

LIST OF PUBLICATIONS
The following chapters from this thesis became individual papers in International Journals as follows:
Chapters 4 and 5 Goswami, T. (1995) Creep - Fatigue : Paper I Compilation of data and trends in the behavior of low alloy steels, High Temperature Materials and Processes, Vol. 14, No. 1, pp 1-20.
Chapter 6 Goswami, T. (1995) Creep - Fatigue : Paper II Life prediction - methods and trends, High Temperature Materials and Processes, Vol. 14, No. 1, pp. 21-33.
Chapter 7 Goswami, T. (1995) Damage development under creep-fatigue in a titanium and a superalloy, High Temperature Materials and Processes, Vol. 14, No. 2, pp. 47-55.
Chapter 8 Goswami, T. (1995) Creep-Fatigue : Paper III Diercks equation : modification and applicability, High Temperature Materials and Processes, Vol. 14, No. 1, pp. 35-45.
Following publication of these papers, National Research Institute for Metals, Tokyo, Japan, provided creep-fatigue data for further analysis which are published as follows:
Paper 1 Goswami, T. (1995) Applicability of modified Diercks equation with NRIM data, High Temperature Materials and Processes, Vol. 14, No. 2, pp. 81-90.
Paper 2 Goswami, T. (1996) Prediction of low cycle fatigue lives of low alloy steels, Iron and Steel Institute of Japan, ISIJ International, Vol. 36, No. 3, pp. 354-360.
Paper 3 Goswami, T. and Plumbridge, W. J. (1996) Applicability of new creep-fatigue life prediction models with low alloy steels, Paper No. C494/095/96.1. Mech. E. London, pp. 175-192.

PREFACE
This thesis submitted for the degree of Master of Engineering (Hons.) of the
University of Wollongong is an account of research carried out at the Materials
Engineering Department and at the Materials Discipline of the Open University
(U.K.). The Work reported in this thesis is original and has not been submitted
elsewhere for any other degree. Works of others used for data compilation have
been duly referenced.
’cvruv̂ QuMdffiiTarun Goswami.

TABLE OF CONTENTSChapter1. Introduction 1
1.1 Frameworks of life prediction 62. Methodology 10
2.1 Compilation and analyses of creep-fatigue data 11
2.1.1. Analysis of the compiled data 12
2.2 Review of creep-fatigue life prediction methods 13
2.2.1. Derivation of material parameters for life prediction
methods 142.3 Trends in the life prediction methods 14
2.4 Investigation of damage features for a IMI 829 and a MAR M 002 15
2.5 Development of an empirical life prediction model for MAR M 002 172.6 Modification and applicability of Diercks equation 172.7 Reliability analysis 182.8 Summary 18
3. Review of creep-fatigue interactions 193.1 Introduction 19
3.2 Experimental variables 213.2.1. Stress based approach 21
3.2.2. Strain control testing 21
3.2.3. Waveforms in creep-fatigue testing 233.2.4. Effect of strain rate on creep-fatigue performance 24
3.3 Data correlation methods 243.3.1. Total strain based approach 25
3.3.2. Plastic strain approach 253 .4 Damage mechanisms under creep-fatigue 263.5 Summary 27
4. Compilation of creep-fatigue data for low alloy steels 284.1 Introduction 28
4.2 Data correlation 30
4.3 Summary of mechanical properties 354 .4 Creep-fatigue data 36
4 .5 Comments on the data compiled 52
5. Creep-fatigue behaviour of low alloy steels - trends 545.1 Introduction 54
5.2 Analyses of creep-fatigue data 55
11
5.3 Creep-fatigue behaviour of low alloy steels - trends 585.3.1. Effects of waveform 58
5.3 .1 .1 . Steel no. 1. 58
5.3.1.2. Steel no. 2. 59
5.3.1.3. Steel no. 3. 60
5.3.1.4. Steel no. 4 60
5.3.1.5. Steel no. 5. 61
5.3.1.6. Effects of combined cycles on Steel no.2 61
5.3.1.7. Effects of combined cycles on Steel no. 4 635.3.2. Effect of product form 64
5.3.2.1. Effects of product form on the performance ofSteel no. 2 64
5.3.2.2. Effect of product form on the performance ofSteel no. 4 65
5.3.3. Effects of composition 65
5.3.3.1. Compositional effects on the performance of
low alloy steels 65
5.3.3.2. Effects of vanadium on creep-fatigue behaviourof Steel no. 4 66
5.4 Summary 67
6. Creep-fatigue life prediction: methods and trends 68
6.1 Introduction 686.2 Review of life prediction methods 69
6.2.1. Linear damage summation 69
6.2.2. Frequency modified and frequency separation approach 70
6.2.3. Strain range partitioning technique 726.2.4. Damage rate approach 736.2.5. Damage function method 736.2.6. Damage parameter approach 74
6.2.7. Assessment procedure R-5 756.3 Empirical methods 77
6.3.1. Diercks equation 77
6.4 Requirements of prediction methods 786.5. Discussion on the applicability of methods 81
6.5.1. Linear damage summation 81
6.5.2. Frequency modified and frequency separation approach 82
6.5.3. Strain range partitioning technique 83

Ill
6.5.4. Damage rate approach 856.5.5. Hysteresis energy approach 856.5.6. Damage parameter approach 866.5.7. Assessment procedure R-5 86
6.5.8. Diercks equation 876.6. Summary 87
7. Creep-fatigue behaviour and life prediction of gas turbine materials 897.1 Introduction 89
7.2 Creep-fatigue data for IMI 829 and MAR M 002 90
7.3 Metallographie investigations and development of a damage model 937.4 Review of empirical oxidation life prediction model 967.5 Development of a new empirical oxidation model for MAR M 002 987.6 Applicability of new method for MAR M 002 1027.7 Summary 103
8. Diercks equation : modification and applicability 105
8.1 Introduction 1058.2 Diercks equation 1068.3 Modification of Diercks equation 107
8.3.1. Introduction of a cycle time factor 108
8.3.2. Material dependent equivalent strain rate 1088.3.3. Limitations of modified Diercks equation 110
8.4 Applicability of the Modified Diercks equation 1108.4.1. Life prediction by modified Diercks equation for
0.5Cr-Mo-V steel 1108.4.1.1. Batch 1 110
8.4.2. Life prediction by modified Diercks equation for
lCr-Mo-V steel 1118.4.2.1. Batch l a n d 2 1118.4.2.2. Batch 3 1118.4.2.3. Batch 4 1118.4.2.4. Batch 5 111
8.4.3. Life prediction by modified Diercks equation for
1.25Cr-Mo steel 112
8.4.3.1. Batch 1 112
8.4.3.2. Batch 2 1128.4.4. Life prediction by modified Diercks equation for
2.25Cr-Mo steel 112

IV
8.4.4.1. Batch l a n d 2 112
8.4.4.2. Batch 3 1128.4.4.3. Batch 4 112
8.4.4.4. Batch 5 113
8.4.4.5. Batch 6 113
8.4.4.6. Batch 7 1138.4.4.7. Batch 8 113
8.4.5. Life prediction by modified Diercks equation for
9Cr-l Mo steel 114
8.4.5.1. Batch 1 114
8.4.5.2. Batch 2 1148.5 Prediction capability and limitations of modified Diercks equation 114
8.6 Summary 116
9. Reliability analysis 1179.1 Reliability analysis 1179.2 Summary 119
10. Conclusions and recommendations 120
References 122
Appendix I

1
1. INTRODUCTION
Engineering materials are selected for particular applications based upon their mechanical and
other relevant properties. An ideal material is expected to perform satisfactorily under severe
loading and environmental conditions where the service loads and the environment change
with respect to time. Materials used to perform at room temperature can not be used at high
temperature because their mechanical properties degrade with rise in temperature. Fatigue
may be one of the candidate failure mechanisms of components operating at room
temperature, however, at high temperature, in addition to fatigue, creep and interactions of
creep-fatigue becomes an important failure mode. Hence, study of creep-fatigue interactions
of high temperature materials is a topic of recent research.
The service requirements of candidate materials in applications such as power
generation and jet propulsion are very demanding. Components for these applications are not
only loaded very severely, but also, are required to operate at high temperatures. The failure
mechanisms of the components operating at high temperature are by creep, fatigue and creep-
fatigue interactions. Creep is a time dependent damage mechanism which occurs mainly
under sustained loading conditions, whereas, fatigue is a cyclic event and results from cyclic
action of loading. When loading of a component is such that there is a component of cyclic
and sustained condition, interaction between creep and fatigue occurs. In practise, study of
creep-fatigue interaction becomes important for high temperature applications such as
components of power plants and gas turbines. Engineering artefacts are designed to
experience the cyclic action of loading and probability that loading will be steady at high
temperature is quite small due mainly to flow fluctuations, pressure difference and plant
operating conditions which depart from ideal conditions. Hence, the study of failure
mechanisms under creep-fatigue interactions of high temperature materials is very important.
The creep-fatigue interactions in high temperature materials are not yet fully
understood due probably to the utilization of various materials for numerous high temperature

2
applications such as power generation and gas turbines. In addition, there is very little
interaction among research workers in the two fields identified above. The materials of
power equipment are mainly stainless steels and low alloy steels containing chromium,
molybdenum and vanadium whereas, gas turbine materials are titanium alloys and
superalloys. The metallurgy and physical and mechanical properties of low alloy steels,
titanium alloys and superalloys are very different. To provide some unification, this
investigation seeks to establish a link between the two groups of research (power generation
and gas turbines) by studying the creep-fatigue behaviour and life prediction of low alloy
steels, a titanium alloy and a superalloy.
Since 1960's there have been many instances of premature failures in the power
industry and also in commercial aircraft engines. Components in these applications operate
under high mechanical loading at high temperatures and their failure mechanisms are due
mainly to creep-fatigue interactions. There is a growing interest to develop reliable life
prediction methods that will be useful to predict life o f components operating at high
temperature. The attention of the research community has been attracted to investigate high
temperature low cycle fatigue (HTLCF) behaviour, creep-fatigue interaction failure
mechanisms and life prediction for such components.
To determine the conservative life o f power equipment and gas turbine components
and to utilize fully their useful life, creep-fatigue life prediction models are very important.
There are economic as well as safety reasons for this endeavour. The methods of life
prediction, are still in the developmental stage and no single method is recommended as a
"code" in the design of power generation and gas turbine components. Methods have been
developed from the results of a selected set o f laboratory creep-fatigue experiments. As a
result, not all the test and material variables were represented in the parametric model
developed from fitting a type of data, where such models were suitable only for particular
test conditions. Validation of models with test data is a feature o f current publications.
Since a limited number of tests are conducted in HTLCF from 5 to 15 tests, the life
3
prediction models are assessed with fewer data. Hence, more knowledge needs to be gained
in the development of a life prediction method and assessment of its applicability with a large
data base.
Elaborate experimental programs need to be undertaken to account for all the test
(e.g., hold times, strain rates, frequency, temperature and waveform) and material (e.g.,
microstructure, heat treatment and product form) variables. Since, creep-fatigue tests are
very precise and expensive and test specimens must represent the actual component, the
number of tests that can be made for a specific application is often limited. For this reason, it
was more useful in the present work to compile the available creep-fatigue data into a data
bank and then to assess the applicability of a life prediction method against that data bank. It
was anticipated that this process would account for various test and material variables.
Manufacturers of power equipment and gas turbines use company proprietary and
classified life prediction technologies. Since the development of these technologies is based
upon service experiences, the methodologies are different among the manufacturers and are
empirical in nature. Components of power equipment and gas turbines often perform random
types of operating cycles and consequently, the life predicted by the manufacture often is over
or under predicted. Additionally, very high confidence level is required in the safe operation
of power equipment and gas turbines. In the case of an accident, liability issues also impose
an additional requirement on the classification of life prediction methodologies. Hence, there
are economical as well as safety interests in the reliable determination of lives of the
components of power generation and gas turbines.
The present research was undertaken to address some of the complex issues related to
material behaviour and development of reliable life prediction methodology for high
temperature materials. Generation of original creep-fatigue data was difficult since there was
a lack of critical equipment, support and materials. Hence, an alternative approach to the
problem was formulated in terms of compiling the published and unpublished data bank for
low alloy steels. The metallography of a titanium alloy and a superalloy, previously tested

4
under creep-fatigue, was investigated in an attempt to bridge the gap between the two
research areas of gas turbines and power research. The research comprised six separate
components as follows.
(1) The research programme was directed towards understanding "creep-fatigue behaviour
and life prediction" and in so doing it expanded the knowledge on creep-fatigue
behaviour and life prediction for a range of materials including low alloy steels, a
titanium alloy and a superalloy.
(2) A compilation of existing published and unpublished creep-fatigue data was made, and
as no such compilation was known to exist for low alloy steels, was an original effort.
An empirical creep-fatigue life prediction method was modified and assessed with the
compiled 250 creep-fatigue data points from various published and unpublished sources
for the 0.5Cr-Mo-V, lCr-Mo-V, 1.25Cr-Mo, 2.25Cr-Mo, 2.25Cr-Mo-V and 9Cr-lMo
steels in annealed, normalized and tempered and quenched and tempered conditions
respectively.
(3) The methods of creep-fatigue life prediction were not understood fully and, in fact, were
the subject of a recent international symposium to review the methods of life prediction
and their applicability. The major emphasis of this research was focused on to the
compilation of a data bank, development and, or, modification of existing life prediction
methods. Parallel to the present investigation, Nuclear Electric Pic. Inc., U .K .,
developed a data base on fatigue, creep and creep-fatigue for high temperature materials
in several of its laboratories and established a team of large number of distinguished
scientists to develop a code known as R-5, for the reliable life prediction of power
equipment. This code is "in confidence of Nuclear Electric Pic. Inc." and remains
classified. Common features of the two studies were:
(a) data collection,
(b) review of methods of life prediction, and
(c) develop a more reliable method of life prediction.

5
During the course of this research, there also was a parallel effort jointly from European
Communities through European Commission, with its 17 laboratories and the low cycle
fatigue committee of Japan with its 10 laboratories, participated in a round robin test
programme to address some of the major issues related to standardisation of test
procedure and life prediction for low alloy steels. Details such as creep-fatigue test
types, data and life prediction methodology employed by them are not yet published and
remain confidential.
(4) The creep-fatigue behaviour of a range of low alloy steels including the 0.5Cr-Mo, lCr-
Mo-V, 1.25Cr-Mo, 2.25Cr-Mo, 2.25Cr-Mo-V and 9Cr-lM o steels were investigated to
widen the scope of the knowledge. Trends in creep-fatigue behaviour with respect to
various material conditions were analysed to determine the effects of composition and
heat treatment.
(5) The metallography, under creep-fatigue test conditions for a titanium alloy and a
superalloy was studied. A large number of specimens, tested under a range of creep-
fatigue test conditions were available, so that the metallographic features developed under
creep-fatigue test conditions were determined and are very important to the knowledge of
creep-fatigue deformation mechanisms. High temperature oxidation in these samples
was also observed qualitatively. Based upon these observations, a damage model was
developed to contribute to the existing knowledge about the role of oxidation in failure
criteria under creep-fatigue.
(6) Since the available creep-fatigue data for the superalloy were inadequate for application
of a phenomenological life prediction method, an empirical life prediction method was
developed using some material parameters used for other superalloys available in the
published literature. This was an original analysis and contributes to existing
knowledge.
6
1.1. FRAMEWORKS OF LIFE PREDICTION
Components of power generating equipment and of gas turbine engines operate under a
complex combination of stresses and temperature which change with respect to time. Failure
mechanisms under such conditions are by creep-fatigue interactions. These components
experience a periodic start up - shut down schedule. Hence deformation in a material
accrues, not by fatigue alone, but also, by accumulation of inelastic strain, or creep, during
hold times. Currently, study of creep-fatigue interactions of high temperature materials is an
important topic of research.
Conventional fatigue designs of engineering components use Goodman diagrams,
which relate alternating and mean stress combinations for a particular life for the
determination of safe life that is derived mainly from the relationship between stress range
and cycle number, known as S-N diagrams. Recently, damage tolerance design concepts that
separate total life into two stages, namely crack initiation and crack propagation to a critical
size, have been used in the design of critical components. In the laboratory, high temperature
low cycle fatigue (HTLCF) data are generated by controlling the total strain range. From the
begin of a HTLCF test, the load decreases gradually with respect to number of cycles. When
a specific percentage (e.g., 5 to 40%) load drop was achieved, the tests are terminated and
considered as life at the employed strain range. These data are also known as cycles to crack
initiation. The crack initiation criterion is applied in the design of power generation and gas
turbine components.
It is not yet possible to define the crack initiation life of critical components which
necessarily contains a period of microscopic crack growth. A crack below detection limit, or
engineering size (of approximately 1 mm), is the critical crack length to cause failure in the
case of a gas turbine discs and blades. Hence, creep-fatigue tests are conducted in a
laboratory where specimen failure is considered as the crack initiation life of the components.
The HTLCF is a failure mechanism of engineering components usually caused by
cyclic thermal stresses. However, in the laboratory, high temperature material behaviour is
7
often evaluated under isothermal conditions by controlling total strain and continuous strain
cycles are often intercepted by a hold time at the peak tensile loading direction to simulate the
service situation of a real component. Inclusion of a hold time at the peak tensile loading
direction reduces the cyclic life of several engineering materials (1). Laboratory simulation of
hold times range from one day to a week for the fossil and nuclear power plant components
respectively, (2), but only a few minutes for gas turbine components (3-4). The design life
of power equipment components varies from a few hundred thousand hours to a few hundred
hours for the gas turbine blades since they operate at higher stresses and temperatures. Thus,
from an engineering view point, it is of great importance to evaluate creep-fatigue behaviour
and to develop a rational life prediction approach to be used in the design of such critical
components.
Life prediction techniques that are proposed to correlate the laboratory strain versus
life data are in the developmental stage. These methods are; American Society of Mechanical
Engineers (ASME) code case 1597 N47 or Damage Summation Technique (5), Frequency
Modified Approach (6), Strain Range Partitioning Technique (7), Damage Parameter
Approach (8), Damage Rate Approach (9), Hysteresis Energy Approach (10) and Code R-5
(11). In addition to these methods, a few empirical methods has been developed to
extrapolate creep-fatigue life for stainless steel type SS 304 by Diercks and Raskey (12) and
in a modified version by Kitagawa et al, (13) were recently proposed. These models have
been developed from test parameters and some form of damage such as a crack and its
growth.
The objectives of the present investigation were:
1 to compile a creep-fatigue data base for low alloy steels and identify salient features of
the data,
2 to determine the sources of variability in material and test parameters, to identify trends
in the creep-fatigue behaviour of low alloy steels, to investigate effects of composition

8
of low alloy steels in creep-fatigue performance and to determine the effect of vanadium
additions on the creep-fatigue behaviour of a 2.25Cr-Mo alloy,
3 to review methods for life prediction, to determine trends in the applicability of life
prediction methods to the collected data, as observed by various workers and to
determine the effect of material conditions and test parameters on the applicability of life
prediction methods,
4 to modify Diercks equation and assess its applicability to the compiled creep-fatigue data
for low alloy steels,
5 to investigate the creep-fatigue behaviour and damage mechanistic features of a titanium
and a nickel based superalloy and to develop a damage mechanistic model of HTLCF for
a titanium alloy and a superalloy, and
6 since the available creep-fatigue data for MAR M 002 was not assessed with any method
of life prediction, a new empirical life prediction method was developed.
These objectives were pursued using the following methodologies.
(a) A review of pertinent literature on the creep-fatigue interactions was conducted and the
effect of test parameters, specimen geometry and strain control methods on the creep-
fatigue life was explored. Data correlation methods using total strain range, plastic
strain range and stress-strain relations were reviewed. An extensive compilation of
creep-fatigue data for low alloy steels was conducted in that the complete details of test
and material parameters were not revealed in the open literature. Data on three material
conditions were collected to study the effect of heat treatment on the creep-fatigue
behaviour. Identification of the data was made which data sets were directly comparable
(Chapters 2 through 4).
(b) From the compiled data, trends in the creep-fatigue behaviour of low alloy steels were
identified (in Chapter 5).
(c) Methods of life prediction were extensively reviewed. Test requirements, equations and
number of material constants needed to apply a particular method of life prediction were
9
discussed. Capability of methods of life prediction as applied by various workers to
their data were analyzed and aggregated to identify the trends in the applicability of
methods of life prediction (in Chapter 6).
(d) An elaborate metallography of samples for lCr-Mo-V, a titanium alloy and a superalloy
was undertaken to investigate the damage features under creep-fatigue conditions. From
these features a damage development model was proposed. An empirical life prediction
method was developed for the creep-fatigue life prediction of a superalloy (Chapter 7).
(e) Diercks equation was modified and its applicability was extended for a range of low
alloy steels. This modified equation was assessed with the compiled creep-fatigue data
for low alloy steels. The reliability of modified Diercks equation was compared with
other methods of life prediction (Chapter 8-9). Finally, conclusions drawn from this
investigation were summarized (Chapter 10).
10
2. METHODOLOGY
In Chapter 1, the scopes, objectives and goals of this investigation were discussed. In the
past, very limited creep-fatigue data were assessed with the methods of life prediction. No
attempts were made to compile creep-fatigue data on low alloy steels or on other high
temperature materials, that can be analysed to identify trends in the creep-fatigue behaviour
and life prediction methods. Hence, in this investigation a creep-fatigue data bank for low
alloy steels used in the power generating equipment was compiled. Subsequently, the
compiled data bank on low alloy steels was assessed with Diercks equation, a statistical
method, modified in this investigation and the reliability analyses in the predicted life for the
compiled data were performed. Metallography of two gas turbine materials, a titanium alloy
IMI 829 and a superalloy MAR M 002 were investigated, by so doing, efforts were made to
unite the two isolated groups of researchers in the power generation and gas turbines in this
research.
From the compiled data, trends in the creep-fatigue behaviour for low alloy steels
were identified. Methods of creep-fatigue life prediction were reviewed and trends in the
prediction capability of different methods assessed with the compiled data were determined.
Metallographie studies were conducted for the two gas turbine materials IMI 829 and MAR M
002 to document the damage features that developed in creep-fatigue testing. From the
documented observations, a five stage damage model and a new empirical life prediction
method for MAR M 002 were developed.
Thus, this thesis consists of a data bank for low alloy steels and the analysis of the
data to identify trends in the creep-fatigue behaviour and life prediction. Applicability of
modified Diercks equation and other methods developed in this investigation were
determined. Hence, methodology in this thesis is different from other conventional theses.
This chapter discusses methodology adapted in carrying out the compilation of the data,
analysis of the data and life prediction of the compiled data in following stages:
11
1 compilation and analyses of creep-fatigue data,
2 review of creep-fatigue life prediction methods,
3 trends in the life prediction methods,
4 investigation of damage features for a IMI 829 and a MAR M 002,
5 development of an empirical life prediction model for MAR M 002,
6 modification and applicability of Diercks equation, and
7 reliability analyses
2.1. COMPILATION AND ANALYSES OF CREEP-FATIGUE DATA
No attempts have been made in the past to compile creep-fatigue data for low alloy steels,
hence, a data bank was compiled as a part of this investigation. Various published and
unpublished data were assembled from the literature and by requesting data from research
workers around the world. In most cases, complete details of the creep-fatigue data were
classified and were not available in the open literature. Hence, the data compiled in this
thesis, consists only of those data which are available in the public domain.
Creep-fatigue data for following materials and conditions were compiled:
1 0.5Cr-Mo steel in normalized and tempered condition (N&T),
2 lCr-Mo-V steel in N&T,
3 1.25Cr-Mo Steel in N&T,
4 2.25Cr-Mo steel in annealed (A), N&T and quenched and tempered (Q&T),
5 2.25Cr-Mo-V steel in N&T, and
6 9Cr-1 Mo steel in N&T.
In total, eighteen (18) research laboratories around the world were requested for the
creep-fatigue data. Data on six low alloy steels, under three conditions namely A, N&T and
Q&T were made available by different laboratories. Heat treatment details such as heating
and cooling temperature ranges, rates of heating and cooling and method of cooling employed
in N&T, A and Q&T conditions were not described in the open literature. Since components
3 0009 03192454 6
12
of power generating equipment and gas turbine operate under very high stresses, design
requirements are placed upon higher strength of materials that result from N&T and Q&T heat
treatments. Creep-fatigue test temperatures ranged from 483°C to 600°C. In excess of 250
test combinations were compiled and examined for unspecified features in the material and
testing parameters. Since every test is statistically different, variations in the materials and in
the creep-fatigue test parameters were identified in Chapters 4 and 5.
2.1.1. Analysis of the compiled data
The data compiled in this investigation are presented in terms of "batches". A "batch" thus
denotes a particular low alloy steel, its test conditions and the source, which laboratory
provided the data. Hence, there are several batches in one particular low alloy steel. Batches
of a particular low alloy steel are compared with other batches to identify the trends in the
creep-fatigue behaviour for that steel and also compared collectively with six steels to
determine the trends in the creep-fatigue performance.
The effects of following were analyzed:
1 waveform on the creep-fatigue performance of low alloy steels,
2 product form on the creep-fatigue performance of low alloy steels, and
3 chemical composition on the creep-fatigue performance of low alloy steels.
Batches of a particular low alloy steel were first analyzed to derive a trend in the
creep-fatigue behaviour in the waveform, product form and composition frameworks. Six
low alloy steels namely the0.5Cr-M o, lCr-Mo-V, 1.25Cr-Mo, 2.25Cr-Mo, 2.25Cr-Mo-V
and 9Cr-lM o were investigated in the three frameworks. Hence, the analyses on the creep-
fatigue behaviour contained combinations of six low alloy steels, three heat treatment
conditions and the three frameworks for the effects of waveform, product form and
composition.

13
2.2. REVIEW OF CREEP-FATIGUE LIFE PREDICTION METHODS
The following life prediction methods were reviewed:
1 damage summation approach (5),
2 frequency modified or separation approach (6),
3 strain range partitioning technique (7),
4 damage parameter approach (8),
5 damage rate approach (9),
6 hysteresi s energy approach (10),
7 assessment procedure R-5 (11),
8 Diercks empirical equation (12,13), and
9 oxidation model (14).
All these methods (5-14) are in the developmental stage where damage under creep-fatigue
condition is modelled depending upon the test parameters and how the damage developed
phenomenologically. The damage accrues under high temperature low cycle fatigue by
transgranular or intergranular cracks. However, at the temperature when creep occurs
cavitation along the grain boundaries is observed. Hence, a life prediction model apply only
under certain combinations of test parameters and materials and for this reason such models
are called parametric methods. When the test and material parameters are changed outside the
range of parametric methods prediction of life also changed. No single method of life
prediction is universally applicable to all types of creep-fatigue test data.
The oxidation model (14) for life prediction was useful in this investigation, as
oxidation was observed during creep-fatigue tests conducted at 850 C and 1000 C on a
superalloy, MAR M 002. Since, the available data were too limited to determine various
material and test parameters, as a result, no life prediction method was assessed with the data.
Hence, a new empirical life prediction method was developed accounting for the role of
oxidation in decreasing the life for a superalloy MAR M 002 by assuming several material
parameters that were available in the published literature (12).

14
2.2.1. Derivation of material parameters for life prediction methods
The mathematical equations for life prediction methods (5-13) required numerous test and
material parameters where every parameter was determined from a particular type of test.
Each method was developed to predict different types of creep-fatigue test conditions. The
material and test parameters were derived generally from a linear logarithmic best fit
extrapolation equation which provided an exponent and a slope. Material parameters
(exponents and slopes) changed when the data e.g., total strain range changed to plastic strain
range with cycles to failure. These material parameters were different when strain rate, stress
range and frequency were plotted with cyclic life. Hence, a large number of material
parameters for various life prediction methods were possible. These parameters were inputs
to develop methods of life prediction where every method required several combinations of
tests and material parameters. Since the data compiled in this investigation were total strain
range and cycles to failure, derivation of only one set of material parameter (total strain range
with life) was possible. Total strain range with life extrapolation equations were determined
for nearly 50 combinations of tests. Additional test and material parameters were needed
such as frequency with life, strain rate with life and stress-strain relationships to apply
methods of life prediction on the data. A complete detail of life prediction methods, equations
and the types of tests needed to apply them is discussed in Chapter 6.
2 .3 . TRENDS IN THE LIFE PREDICTION METHODS
The trends in the life prediction methods (5-13) were identified in this section. To identify
the trends, analysis was confined to specific life prediction methods that were assessed with
the data presented in terms of batches in Chapter 4. Only Priest and Ellison (15) and Inoue et
al, (16) conducted elaborate testing to assess their data with the methods of life prediction
listed in section 2.2. Priest and Ellison (15) modified several methods (5, 9, 10) such that
with those modifications (15) prediction capability of modified versions improved for their
data and no other worker used those modified versions in life prediction for other data
15
batches. These details were aggregated batch by batch and tabulated in Chapter 6 to identify
trends in the life prediction. In general, the capability of life prediction methods were dictated
by test parameters such as temperature, hold times, strain rate and strain range. These
features were identified for all the batches of data, where those details were available. From
such an analysis trends in the life prediction of various methods were identified as set out in
Chapter 6.
2 .4 . INVESTIGATION OF DAMAGE FEATURES FOR A IMI 829 AND A
MAR M 002
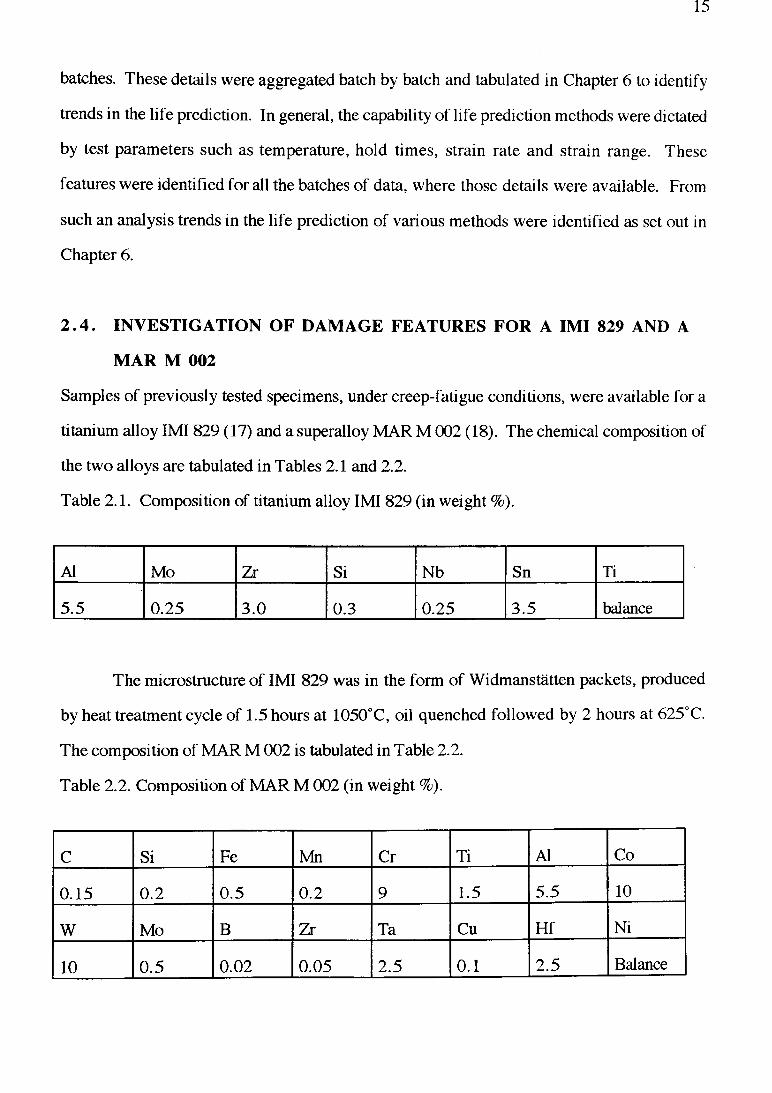
Samples of previously tested specimens, under creep-fatigue conditions, were available for a
titanium alloy IMI 829 (17) and a superalloy MAR M 002 (18). The chemical composition of
the two alloys are tabulated in Tables 2.1 and 2.2.
Table 2.1. Composition of titanium alloy IMI 829 (in weight %).
Al Mo Zr Si Nb Sn Ti
5.5 0.25 3.0 0.3 0.25 3.5 balance
The microstructure of IMI 829 was in the form of Widmanstatten packets, produced
by heat treatment cycle of 1.5 hours at 1050°C, oil quenched followed by 2 hours at 625°C.
The composition of MAR M 002 is tabulated in Table 2.2.
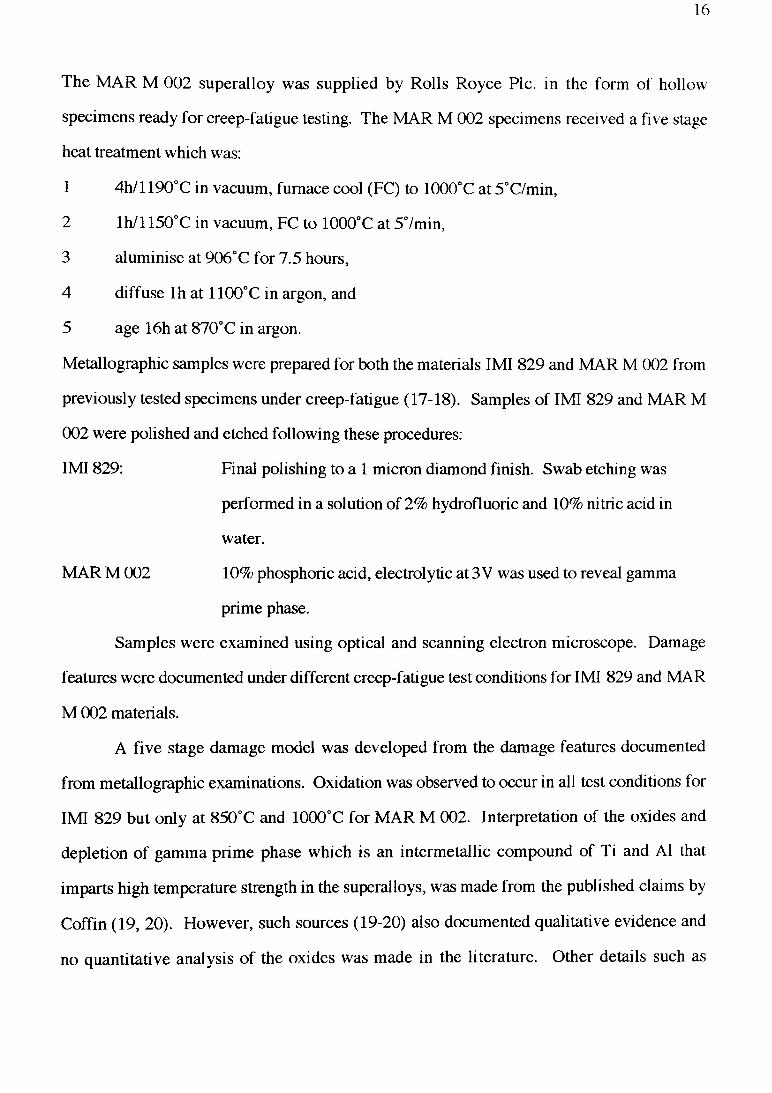
Table 2.2. Composition of MAR M 002 (in weight %).
C Si Fe Mn Cr Ti Al Co
0.15 0.2 0.5 0.2 9 1.5 5.5 10
W Mo B Zr Ta Cu Hf Ni
10 0.5 0.02 0.05 2.5 0.1 2.5 Balance
16
The MAR M 002 superalloy was supplied by Rolls Royce Pic. in the form of hollow
specimens ready for creep-fatigue testing. The MAR M 002 specimens received a five stage
heat treatment which was:
1 4h/l 190°C in vacuum, furnace cool (FC) to 1000°C at 5°C/min,
2 lh /1 150°C in vacuum, FC to 1000°C at 57min,
3 aluminise at 906°C for 7.5 hours,
4 diffuse lh at 1100°C in argon, and
5 age 16h at 870° C in argon.
Metallographic samples were prepared for both the materials IMI 829 and MAR M 002 from
previously tested specimens under creep-fatigue (17-18). Samples of IMI 829 and MAR M
002 were polished and etched following these procedures:
IMI 829: Final polishing to a 1 micron diamond finish. Swab etching was
performed in a solution of 2% hydrofluoric and 10% nitric acid in
water.
MAR M 002 10% phosphoric acid, electrolytic at 3 V was used to reveal gamma
prime phase.
Samples were examined using optical and scanning electron microscope. Damage
features were documented under different creep-fatigue test conditions for IMI 829 and MAR
M 002 materials.
A five stage damage model was developed from the damage features documented
from metallographic examinations. Oxidation was observed to occur in all test conditions for
IMI 829 but only at 850°C and 1000°C for MAR M 002. Interpretation of the oxides and
depletion of gamma prime phase which is an intermetallic compound of Ti and A1 that
imparts high temperature strength in the superalloys, was made from the published claims by
Coffin (19, 20). However, such sources (19-20) also documented qualitative evidence and
no quantitative analysis of the oxides was made in the literature. Other details such as
17
mechanical properties, creep-fatigue data and metallography of the two materials are
presented in Chapter 7.
2.5. DEVELOPMENT OF AN EMPIRICAL LIFE PREDICTION MODEL
FOR MAR M 002
Oxidation damage was found to occur under creep-fatigue test conditions for the superalloy,
MAR M 002. The life prediction methods (5-11) discussed in section 2.2, did not account
for the contributions of oxidation in degrading the mechanical properties and required several
material parameters determined from specialised tests. Since no method (5-11) had been
applied to the data on MAR M 002, in which, oxidation damage was evident, a new empirical
method was developed accounting for the oxidation in life prediction. Those material
parameters for MAR M 002 were unknown were assumed from published sources.
The applicability of the new empirical oxidation method developed in this research
was assessed with the available data on MAR M 002. Several tests were incomplete and only
one test was conducted for a particular condition of tensile, compressive and balanced hold
times. Hence, material parameters determined form such data are likely to contain errors and
require more work to assess and validate applicability of the empirical model developed in
this investigation with a wide range of creep-fatigue data.
2 .6 . MODIFICATION AND APPLICABILITY OF DIERCKS EQUATION
Diercks equation (12), was used to extrapolate the creep-fatigue life for a stainless steel of the
type SS 304 that was modified in this investigation and its applicability was extended to the
creep-fatigue life prediction for low alloy steels. Diercks equation (12) required several test
parameters to perform life prediction analysis. Data under numerous test types such as strain
rates, temperatures, hold times and total strain ranges for SS 304 were used to derive a
multivariate best fit equation. Hence, there were strain range, strain rate, temperature and
18
hold time parameters in Diercks equation. Modification and applicability of Diercks equation
on the compiled creep-fatigue data for low alloy steels is discussed in Chapter 8.
2.7. RELIABILITY ANALYSIS
Reliability assessment for creep-fatigue life predicted by Diercks equation was carried out and
compared with the reliability of other methods where those details were available. The ability
of a method to predict the lives in a range from one half to two times the observed life , i.e.,
+ x2 , was considered to be a reliable life prediction. More data predicted by a method in +
x2 band enhanced the reliability of that particular method. Statistical standard error (SE) and
equivalent factor on life (EF) values, determined the band in which the lives were predicted
for the compiled data, were determined in Chapter 9.
Statistical analysis for every data point was performed for standard error (SE) and
equivalent factor on life (EF) determinations. The SE and EF were determined to
demonstrate the reliability of various life prediction methods.
2.8. SUMMARY
Methodologies adapted in various stages of this investigation to compile the creep-fatigue data
bank for low alloy steels were discussed. The trends in the creep-fatigue behaviour and life
prediction for low alloy steels were identified. Several unspecified test and material features
were identified from the analyses of the compiled data. Life prediction is conducted by using
an existing method or either developing a new method or modifying an available method to
asses its applicability for a data bank. No attempts have been made in the past to compile a
data bank and identify trends in the creep-fatigue behaviour and life prediction for low alloy
steels. Hence, the methodology adapted in this investigation comprised compilation of data
bank, determination of trends in the creep-fatigue behaviour, review and examination of
trends in the life prediction methods, development of alternate approaches to the life
prediction for MAR M 002 and metallographic investigations.
19
3. REVIEW OF CREEP-FATIGUE INTERACTIONS
3.1. INTRODUCTION
Components of power generating equipment and gas turbines operate in a hostile
environment where they experience very high mechanical loading at high temperatures. High
temperature low cycle fatigue (HTLCF) is a failure mechanism where more than one damage
mechanisms such as creep or fatigue interact. The failure of these components occurs in the
low cycle regime where lives are below 10,000 cycles. Therefore, the study of creep-fatigue
interactions is very important to understand the failure mechanisms of components operating
at high temperatures.
Engineering materials are not defect free and contain inherent discontinuities as well
as stress concentration sites arising from complex geometry and fabrication processes. These
are potential sites where fatigue damage develops. Fatigue is a progressive damage
accumulation mechanism within the localised regions of discontinuities. The damage results
from the cyclic action of load at high temperature and causes dislocations to generate,
multiply and saturate to form a crack. Thus, the damage produced under HTLCF is
irreversible and permanent. Therefore, fatigue is defined as a progressive, localised,
irreversible, permanent deformation process (21).
High temperature may be defined in terms of a fraction 0.4 to 0.5 of the homologous
temperature (Th) which is the ratio of operating temperature to melting temperature of the
material on the absolute scale. Such a temperature range is important because it establishes a
boundary where creep becomes operative and allows interactions between creep and fatigue.
A range of operating temperatures for various engineering applications is identified below and
above 0.5 Th in Table 3.1.

20
Table 3.1. Summary of high temperature applications.
High Temperature Applications
High temperature
I--------------------------Below0.5ThPower Plant Components Oil and Petroleum Nuclear Reactor Automotive IC Engines Chemical Reactors Accessaries and Mountings Pipe lines
Above0.5Th
Gas turbine components (turbine discs and blades)Space Shuttle (SS) main engine components SS Structure Rockets and Missiles Solder joints
A conventional operating cycle of power generating equipment and gas turbines resembles a
trapezoid, which has in addition to loading and unloading, a period of steady state loading
condition. Growth of damage increases under trapezoidal loading conditions, because, in
addition to time independent fatigue damage there, a time dependent creep damage occurs
during the steady state period. This time dependent mechanical damage fraction is known as
creep. Interaction of damage under creep and fatigue conditions is not yet fully understood
and is the subject of the present research.
Conventionally, S-N type of fatigue data represented by cyclic stress amplitude range
(Act) with cycles to failure (N/) on a log-log scale are used in the design. A knee point in an
S-N diagram appears in certain materials, at high stress lower life (N / < 104), and also at low
stress -longer life (N /> 107 ) regimes. Since a small variation in the stress amplitude causes
a large change in the cyclic life, material behaviour in the lower life region (<104) cannot be
represented in terms of stress range versus life. Therefore, strain control testing is performed
in the low cycle fatigue (LCF) regime where cycles to failure (N /= 2x reversals) is less than
21
10,000 cycles. Since HTLCF generally has a life range of less than 104 cycles, only strain
control tests and methods of data correlation that will be used in this research are discussed
below.
3.2. EXPERIMENTAL VARIABLES
3.2.1. Stress Based Approach
Wohler (22) pointed out that the number of cycles to failure depends on the stress range (Sr)
and value of Sr, {( Smax - Smin)/2} at any given number of cycles to failure (N/) , decreased
as the mean stress (Sm) increased. Based on the Wohler data, Goodman (23) proposed a
straight line relationship, and equation of the form:
Sa = S e [ l - { S m / S u }] (3.1)
where Sa = stress amplitude (Sm + Sr), Se is the endurance limit and Su is the ultimate tensile
strength. Basquin (24), related semi -stress range (S) with cycles to failure (N/) under
predominantly elastic conditions in the following form:
n / s = constant (3.2)!
where p , is a material constant.
3.2.2. Strain Control Testing
When the total strain range is more than the elastic strain range Aet > A£e, a hysteretic
phenomenon between stress and strain is usually observed. A hysteresis loop can be
produced when ranges of stresses and strains are plotted in a X-Y recorder. However, when
the total strain range is less than the elastic strain range, the loading and unloading traverse
the same path within the linear elastic regime. A difference in loading and unloading paths
forms a hysteresis loop that develops permanent damage in the material. Hence, life is
shorter in the low cycle fatigue regime where plastic strain dominates than the high cycle
fatigue regime where elastic strains dominate. The size and shape of a hysteresis loop

22
depends on test conditions, such as strain rate, total strain range and position of hold time at
the peak tensile or compressive strain levels.
During strain control testing, every cycle is described by a hysteresis loop. If
hysteresis loop tips are connected for different strain levels, the curve so obtained represents
a cyclic stress-strain curve. Before the stress range saturates a small fraction of the life is lost
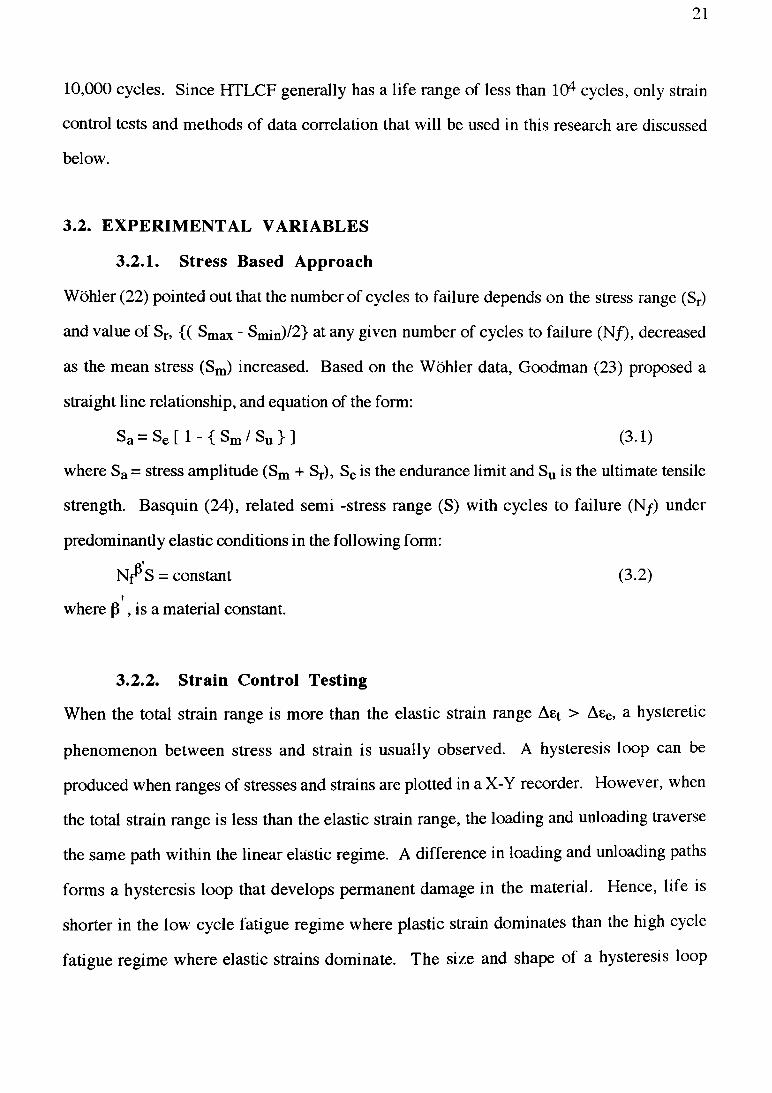
after which the stress-strain behaviour stabilises. The total strain range and its elastic and
plastic components can be correlated with cyclic life only after the saturation point, as shown
in Fig. 3.1. Stress range variation with respect to fatigue cycles at a particular strain range
shows the material behaviour to be either strain softening or hardening, depending upon the
slope of the curve. Usually a material in a hard form (cold worked) softens and a softened
material under annealed condition hardens, for example, lCr-Mo-V and 9Cr-lM o softens,
however, 2.25Cr-Mo hardens in the normalized and tempered condition. Such hardening
and softening behaviour was observed up to approximately 30% of life in the case of the
2.25Cr-Mo (25). Strain range - cyclic life relationship for a titanium alloy IMI 829 is shown
in Fig. 3.2 for different hold times (17). A stress range with percentage of cyclic life
relationship is shown in Fig. 3.3 for a superalloy MAR M 002 tested at 1000°C by
Plumbridge et al (18, 26).
In a creep-fatigue test under total strain control, extensometers are used to control
either axial or diametral strain. Axial extensometers are used for cylindrical specimens
whereas diametral extensometers are used for hourglass specimens. Diametral strain is
converted to longitudinal strain which, in turn is controlled by a computer and very few direct
diametral strain control tests were conducted (27-28). When a hold time was applied the
stresses relax very rapidly with respect to time, which involves elastic strain conversion into
plastic strain. Diametral extensometers overestimated the strain ranges (25) and were
insensitive to measure the relaxed stresses. Over-estimation of longitudinal strains of up to
16% was reported (29) by diametral extensometers during testing of 2.25Cr-Mo at 427°C and
482°C and 5% for lCr-M o-V and stainless steel of type SS 316 (30). However, no
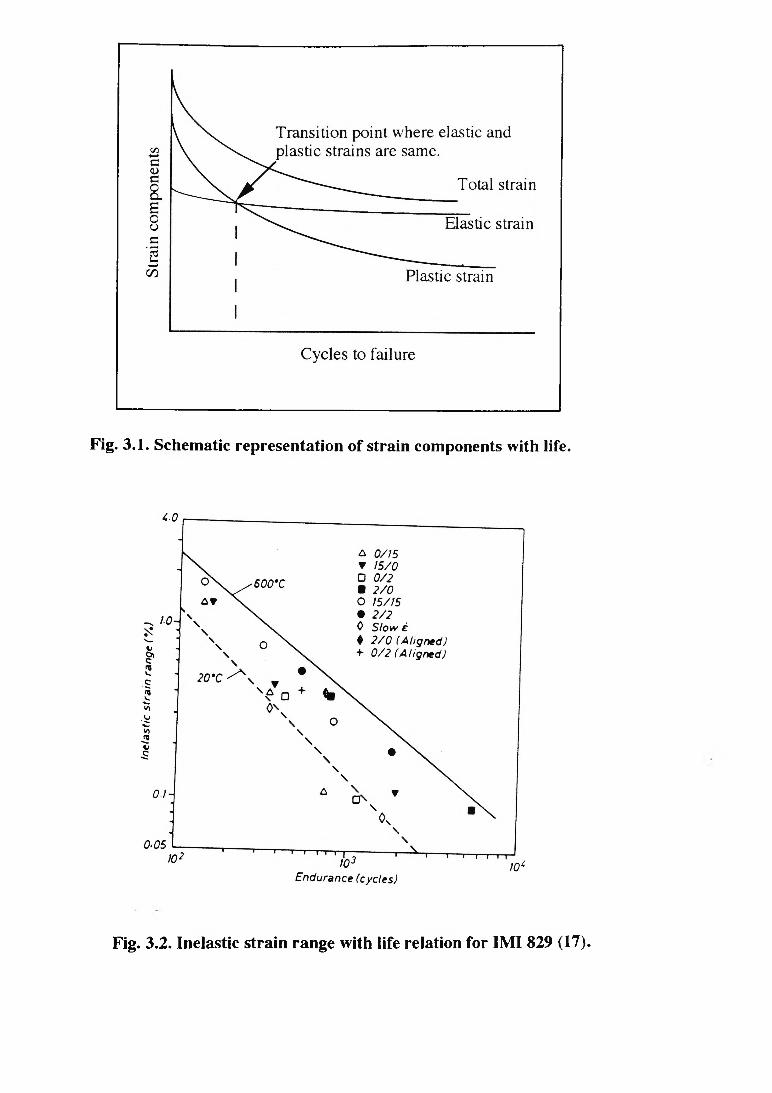
Fig. 3.1. Schematic representation of strain components with life.
Fig. 3.2. Inelastic strain range with life relation for IMI 829 (17).

600-
□ aO a a
ASt = 0-817.a ^
03Q_r ¿00
LD O Z < a:co co w 200►—CO
o o
□ □ 0 a0-617.0 0 o o o o 0 0 o O i l 7.
o o o o
50
PERCENTAGE LIFE
100
Fig. 3.3. Stress range change with life for MAR M 002 (18).
23
difference in the testing with hourglass and cylindrical specimens during the hardening of
stainless steel of type SS 304 was reported in (31).
3.2.3. Waveforms in Creep-Fatigue Testing
Several types of waveforms that provide components of creep and fatigue damages are
possible. A few common examples are shown in Fig. 3.4. To simulate service loading
conditions hold time tests are conducted in the laboratory located in either peak tensile or
compressive strain direction. When an equal hold time is applied at both peak tensile and
peak compressive strain direction, the resulting cycle is known as a balanced cycle and when
the duration of hold time is unequal in both the directions, the resulting cycle is known as
unbalanced cycle. A hold cycle in either tension or compression direction results in the
generation of a complex hysteresis loop. Partitioning strains in plastic fatigue and inelastic
creep components of a complex hysteresis loop is very difficult. These loops have the
components of total, plastic and transformed strains as shown in Fig. 3.4.
Some materials are sensitive to tensile hold times applied at the peak loading
conditions whereas, other materials are sensitive to hold times in peak compression direction
where a life debit results. Dwell sensitivity refers to a situation in which the interaction effect
between creep and fatigue is more active in one loading direction than in the other, for
example, lCr-Mo-V is found to be a tensile dwell sensitive (32), whereas, 2.25Cr-Mo is
compressive dwell sensitive (33). Several nickel based superalloys are found to be
compressive dwell sensitive (34). For lCr-Mo-V, a tensile hold results in cavitation (32),
whereas for 2.25Cr-Mo, oxidation attack is observed under compressive hold cycles (35). In
nickel based superalloys and titanium alloys, in general, a compressive dwell develops tensile
mean stresses, which lowers the creep-fatigue life (36).

CONTINUOUS STRAIN CYCLING
TENSION STRAIN HOLD
TENSION AND COMPRESSION STRAIN HOLD
Fig. 3.4. W aveforms in high tem perature low cycle fatigue testing.

24
3.2.4. Effect of Strain Rate on Creep-Fatigue Performance
The strain rate (e) is also represented in terms of frequency (v) only under continuous
triangular waveforms (25). A relationship between strain rate, frequency and strain range, is
described in equation 3.3.
e t = 2v Ae t (3.3)
where Ae t, total strain range, e t , total strain rate and v is frequency.
The strain rate, which is the rate of change of strain with time (d£ / dt), also implies
that, with decreasing strain rate, life debits usually result. Strain rate has not yet been-3 -5
standardised for different test conditions, it varies from 10 to 10 /sec for an uniaxial-2
tension test. During strain control fatigue tests, strain rate ranges from as high as 10 to a
lower value of 10 /sec. Thus, during a constant strain hold, this rate of change is a zero
term. Strain rate for a cycle which contains a hold period is expressed by the strain change
per sec of the cycle (i.e., Ae / cycle time, where cycle time = [1/v +hold time]. In the
published data, strain rate is often omitted and data are presented either in terms of total strain
range or plastic strain range with cycles to failure.-3
Wareing et al, (37) showed that as the plastic strain rate was reduced from 5x10 to
2x10 /sec. for a 20Cr-25Ni-Nb alloy at 750°C, the value of Cp (intercept) and the exponent
P (slope of plastic strain versus cyclic life) in a Coffin-Manson equation (discussed in section
3.3.1 and equation 3.4), decreased from 1008 to 293 and 0.17 to 0.03 respectively.
Negative strain rate effects, i.e., increases of cyclic strength with decreases in strain rate were
observed for low alloy steels (38), and serrations appeared in the hysteresis loop during
dynamic strain ageing.
3.3. DATA CORRELATION METHODS
Low cycle fatigue tests that are conducted under total strain control can either be represented
in terms of total strain with life or plastic strain with life. These are discussed below.
25
3.3.1. Total Strain Based Approach
The loading of components is expressed in terms of percentage total strain. Total strain range
may be partitioned into elastic and plastic strain components as follows.
As t = Ase + Asp
Ae e = Act / E, and also =Ce (NO a
Ae p = Cp (Nf )P
Ae t = A a / E + Aep
Aet = C e (N O a + C p ( N f ) P (3.4)
where A a is stress range, E is modulus, Cp, Ce, a and (3 are material constants.
Partitioned strain components are related with cyclic lives. A best fit equation
determined to fit the data in terms of plastic strains with cycles to failure is known as the
Coffin-Manson equation. Elastic (se), plastic (sp) and total strain (E t ) components are
represented in an universal slope method (39), shown in Fig. 3.1, was derived by Manson
by curve fitting HTLCF data for several materials. Equation 3.5 separates the total strain into
elastic and plastic components below.
A Et = 3.5 ( ou / E) (N/)"012 + e/ 0 6 (Nf) -°-6 (3.5)
where Ou is the tensile strength and e/ fracture ductility.
Recently Muralidharan and Manson (40) modified the universal slope method in the
following form.
A Et= 0.0266 e/ 0.155 (Ou / E) -°-53 N f ~0 56 + 1.17 (cyE )0-832^ - 009 (3.6)
This equation was derived from the HTLCF data for 57 materials including steels,
aluminium and titanium alloys. Equation 3.6 was claimed in (40) to be better approach than
equation 3.5 since it was applicable for longer life regimes.
3.3.2. Plastic Strain Approach
The Coffin-Manson equation correlates plastic strain range with cyclic life as shown in
equation 3.7
26
Cp (Aep ) P = Nf (3.7)
where, Cp and p are material constants.
Cyclic stress range may be correlated with plastic strain range in the following stress-strain
equation form:
A a= K Aepn (3.8)
where K is the intercept of cyclic stress range at unit plastic strain range and the exponent n is
the slope of the curve. This is known as the cyclic stress-strain curve.
3.4. DAMAGE MECHANISMS UNDER CREEP-FATIGUE
A schematic representation of damage mechanisms under creep, fatigue and creep-fatigue
interactions was reported by Hales (41). He (41) showed schematically that fatigue, creep-
fatigue interactions and creep damage mechanisms occur under different waveforms which
contain components of creep and fatigue. At high temperature, under axial loading, fatigue
damage occurs by transgranular crack growth, whereas creep occurs by grain boundary
sliding. Cavitation, as a result of creep, is a feature observed at grain boundary triple points.
Creep cavitation together with a major crack, occurs under creep-fatigue interactions and is
shown schematically in Fig. 3.5.
Damage under creep-fatigue interactions depends upon strain rate of the cycle. In
creep-fatigue, cavitation results only at strain rates below some critical value, above which
there is no creep damage. The critical strain rate in compression is much lower than that for
tension and hence reversal of damage caused in tension occurs in compression half cycle
(42). At low strain rates and stresses failure occurs by intergranular cavitation. However, at
higher strain rates and stresses constrained intergranular cavitations occur. A strain rate
dependent damage map for lCr-Mo-V was proposed by Priest and Ellison (43) and for SS
304 by Majumdar (42). The contribution of oxide scale formation along specimen surface
with respect to exposure time under HTLCF has not been investigated. No standard tool is
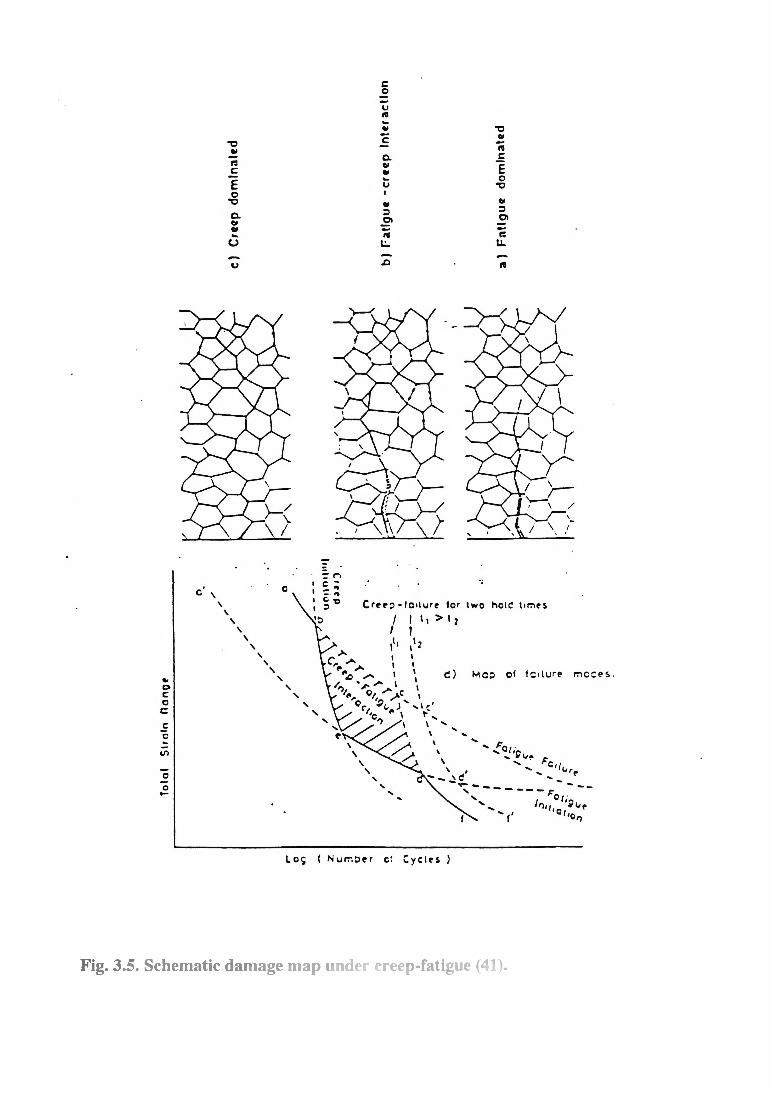
Fig. 3.5. Schematic dam age m ap under creep-fatigue (41).
27
available to account for creep-fatigue and oxidation and their interactions (44-45) and
modelling in terms of mechanistic methods.
3.5. SUMMARY
A brief review of creep-fatigue interaction is provided in this Chapter. The high temperature
low cycle fatigue is a failure mechanism under creep-fatigue which results below 104 cycles.
Experimental variables such as stress, strain ranges, strain rates together with conventional
waveforms with different possibilities of hold times in testing were explored. The limiting
value of strain rate below and above which damage by intergranular cavitation and
constrained intergranular cavitation result was discussed. Data correlation methods in terms
of stress-strain and strain range with cyclic life, expressed by Basquin and Coffin-Manson
equations respectively, were reviewed.

28
4. COMPILATION OF CREEP-FATIGUE DATA FOR
LOW ALLOY STEELS
A creep-fatigue data bank for low alloy steels has been compiled in this Chapter for six steels
of the type 0.5Cr-Mo-V, lCr-Mo-V, 1.25Cr-Mo, 2.25Cr-Mo, 2.25Cr-Mo-V and 9Cr-lMo
respectively. Published and unpublished creep-fatigue data were compiled for the six steels
where data for a particular alloy was recorded in terms of a "batch", therefore, there were
several batches of data for the same low alloy steel. Data "batches" in the same steel category
were compared against each other to identify the creep-fatigue behaviour for the same material
under different test conditions. In the open literature, numerous details related to material
conditions, heat treatment parameters, microstructures and test parameters such as total strain
rates and failure criteria were not revealed. As a result, there is a need to develop a consensus
on standardization of laboratory test procedure in the creep-fatigue. One of the primary
objectives of undertaking this research was to compile a creep-fatigue data bank for low alloy
steels. The compiled data were used to identify trends in the creep-fatigue behaviour and life
prediction for low alloy steels and to assess the applicability of a life prediction method
modified in this investigation.
4.1. INTRODUCTION
Creep-fatigue data are of considerable importance since such data are used in the design of
power plant components and in component life prediction. A volume of creep-fatigue data is
not available in the public domain. In other cases, where data were published, the details
related to microstructure, heat treatment conditions, failure criteria and material production
histories were not reported. Research workers around the world were requested for the
creep-fatigue data, additionally, a data bank was constructed from the published sources,
therefore, this Chapter contains both the published and unpublished data.

29
Creep-fatigue data for the 0.5Cr-Mo-V, lCr-Mo-V, 1.25Cr-Mo, 2.25Cr-Mo, 2.25Cr-Mo-V
and 9C r-lM o steels were collected. Each low alloy steel had been creep-fatigue tested in
several laboratories in several countries. Creep-fatigue data for a particular low alloy steel,
tested in one laboratory was denoted by a "batch". Hence, a large number of "batches" were
formed from the data for the same and other low alloy steels. Thus, the terminology "batch"
is used to identify a low alloy steel and its other particulars such as product form, test
temperature and the source.
In fatigue, no two test conditions are the same since numerous parameters related to
material surface finish, axiality, orientation, specimen dimensions, extensometry, load levels,
difficulty in duplicating test parameters that a machine control system faces and material
microstructures vary with specimens. A sa result, each test varies with respect to the other
test due mainly to associated test and material variability in creep-fatigue data. The
"variability" that exists among batches of a particular low alloy steel are due to:
1 differences in the specimen geometry and orientation,
2 differences in extensometry employed in testing (longitudinal or diametral),
3 differences in composition of material,
4 differences in a particular heat treatment condition;
(a) heating and cooling rates,
(b) cooling media,
(c) higher and lower tempering temperature ranges, and
(d) time of hold at a specified temperature.
5 differences in microstructure of the same low alloy steel under N&T condition,
6 differences in material production routes,
7 differences in creep-fatigue test parameters;
(a) test temperature,
(b) strain rate,
(c) type of heating e.g., induction and resistance, and

30
(d) test interruptions,
8 differences in the material product form e.g., casting and forging, and
9 differences in failure criteria employed in creep-fatigue testing.
In addition to the above items 1 through 9, there is also associated variability due to data
generated in different countries. Since a code of practise does not exist or is in the
developmental stage, standardisation of laboratory procedure is required to conduct creep-
fatigue tests.
4.2. DATA COLLECTION
Creep-fatigue data from various international societies, laboratories, universities and private
research institutions were collected and represented in "batches" for six low alloy steels.
Table 4.1 describes the creep-fatigue data compiled on low alloy steel types, data
representation in different batches and other details related to source, heat treatment or
material conditions, test temperature and each data batch is duly referenced.
Table 4.1. Summary of the creep-fatigue data compiled.
Alloy Type "Batch" Source Heat
Treatment
Test
Temperature
Reference
0.5Cr-Mo-V 1 CEGB N&T 550°C 46
lCr-Mo-V 1 NASA N&T 540°C 47
1 NASA -do- 485°C 47
2 G.E. Company -do- 538°C 48
2 -do- -do- 483°C 48
3 B.B. Company Hot rolled 550°C 49
4 Univ.of Bristol Forged form
N&T
565°C 50

31
5 CEGB Forged N&T 550°C 46
1.25Cr-Mo 1 Elcom, Victoria As received 550°C 51
2 N.I.of Metals
Japan
N&T 600°C 52
2.25Cr-Mo 1 NASA Annealed 540°C 47
1 -do- N&T -do- 47
1 -do- Q&T 485°C 47
2 G.E. Company Annealed 538°C 48
2 -do- N&T 538°C 48
2 -do- Q&T 483°C 49
3 J.S.M.S. N&T 600°C 53
4 O.R.N.L. N&T 502°C 54
5 M.H.Eng. N&T 600°C 55
6 European
Communities
N&T 550°C 56
7 University of
Connecticut
N&T 593°C 57
8 -do- N&T 593°C 57
9Cr-lMo 1 University of
Bristol
N&T 550°C 58
2 O.R.N.L. N&T 538°C 59, 60
For a series of data batches, details of test and material parameters, for example,
normalizing and tempering temperatures were unspecified for most N&T conditions that
varied with batch to batch and steel to steel. These features were identified in this
investigation and tabulated in Table 4.2.

32
Table 4.2. Summary of salient features of the compiled data.
l/2Cr-Mo-V Steel
Batch Source Creep-fatigue
Data Type
Heat
Treatment
Salient Feature Temp.
°C
1 CEGB 0.5, 2 and 16 hrs
tensile dwells
N&T Unknown
composition and
stress ranges
550
lCr-Mo-V Steel
1 NASA 23 and 47 hrs.
hold, Combined
cycles (n).
N&T Unknown
composition and
stress ranges
540 and
485
2 G.E.Co. 0/0, 23 and 47
hrs., combined
cycles (n).
N&T Unknown
composition and
stress ranges
538 and
483
3 B.B.& Co. max. o f 1/2 hr.
unknown details
N&T Unknown total
strain range
550
4 Bristol
University
0,1/2hr. t/0, t/t,
0/t & 18 hrs..
N&T unknown test
details.
565
5 CEGB 0.5, 2 and 16
hrs. tensile
dwell
N&T unknown heat
treatment details
550
1.25Cr-Mo Steel
1 Electricity
com. (V)
up to 10 min. as received
condition
Not heat treated
as N&T.
550
2 NIM up to 1 hr. N&T known details 600
33
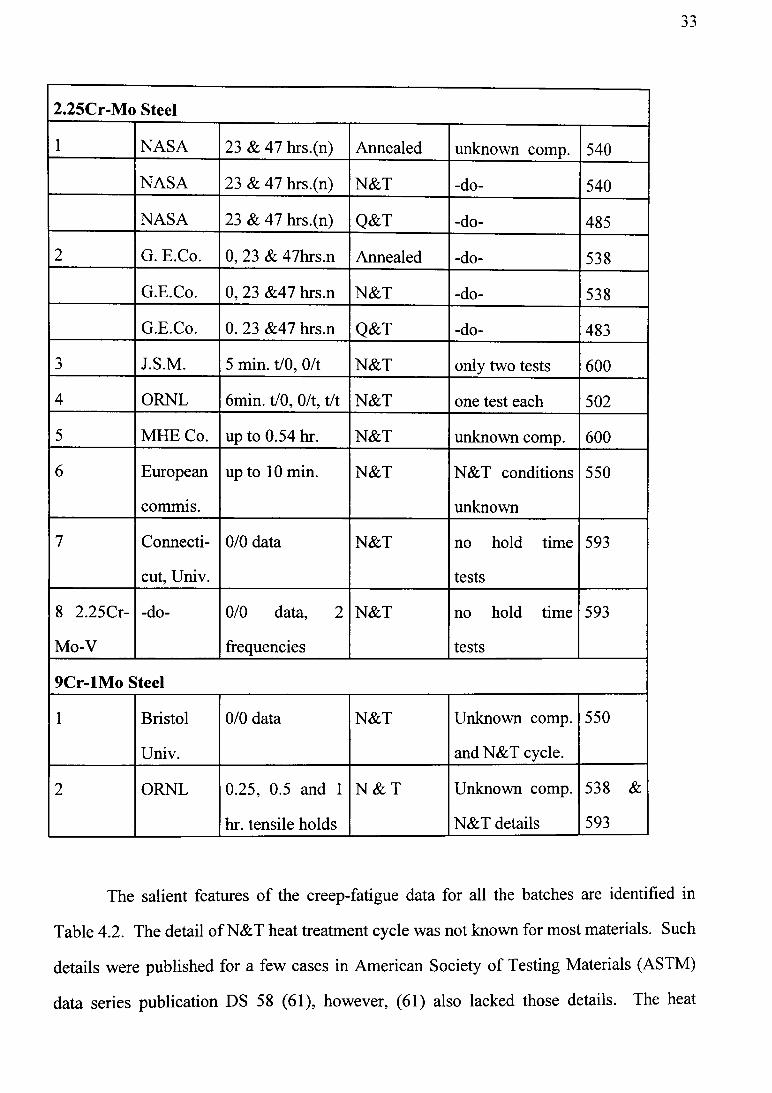
2.25Cr-Mo Steel
1 NASA 23 & 47 hrs.(n) Annealed unknown comp. 540
NASA 23 & 47 hrs.(n) N&T -do- 540
NASA 23 & 47 hrs.(n) Q&T -do- 485
2 G. E.Co. 0, 23 & 47hrs.n Annealed -do- 538
G.E.Co. 0, 23 &47 hrs.n N&T -do- 538
G.E.Co. 0. 23 &47 hrs.n Q&T -do- 483
3 J.S.M. 5 min. t/0, 0/t N&T only two tests 600
4 ORNL 6min. t/0, 0/t, t/t N&T one test each 502
5 MHE Co. up to 0.54 hr. N&T unknown comp. 600
6 European
commis.
up to 10 min. N&T N&T conditions
unknown
550
7 Connecti
cut, Univ.
0/0 data N&T no hold time
tests
593
8 2.25Cr-
Mo-V
-do- 0/0 data, 2
frequencies
N&T no hold time
tests
593
9Cr-lMo Steel
1 Bristol
Univ.
0/0 data N&T Unknown comp,
and N&T cycle.
550
2 ORNL 0.25, 0.5 and 1
hr. tensile holds
N & T Unknown comp.
N&T details
538 &
593
The salient features of the creep-fatigue data for all the batches are identified in
Table 4.2. The detail of N&T heat treatment cycle was not known for most materials. Such
details were published for a few cases in American Society of Testing Materials (ASTM)
data series publication DS 58 (61), however, (61) also lacked those details. The heat
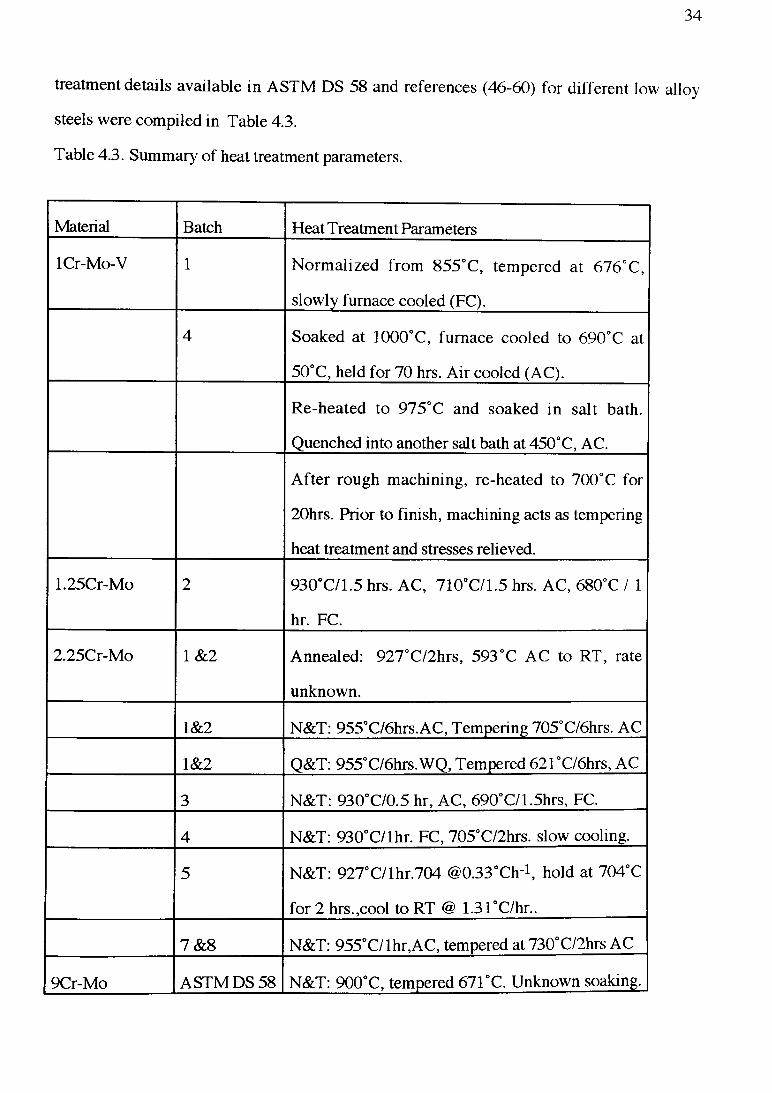
34
treatment details available in ASTM DS 58 and references (46-60) for different low alloy
steels were compiled in Table 4.3.
Table 4.3. Summary of heat treatment parameters.
Material Batch Heat T reatment Parameters
lCr-Mo-V 1 Normalized from 855°C, tempered at 676°C,
slowly furnace cooled (FC).
4 Soaked at 1000°C, furnace cooled to 690°C at
50°C, held for 70 hrs. Air cooled (AC).
Re-heated to 975°C and soaked in salt bath.
Quenched into another salt bath at 450°C, AC.
After rough machining, re-heated to 700°C for
20hrs. Prior to finish, machining acts as tempering
heat treatment and stresses relieved.
1.25Cr-Mo 2 930°C/1.5 hrs. AC, 710°C/1.5 hrs. AC, 680°C / 1
hr. FC.
2.25Cr-Mo 1&2 Annealed: 927°C/2hrs, 593°C AC to RT, rate
unknown.
1&2 N&T: 955°C/6hrs.AC, Tempering 705°C/6hrs. AC
1&2 Q&T: 955°C/6hrs.WQ, Tempered 621'C/6hrs, AC
3 N&T: 930°C/0.5 hr, AC, 690°C/1.5hrs, FC.
4 N&T: 930°C/lhr. FC, 705°C/2hrs. slow cooling.
5 N&T: 927“C/lhr.704 © O .SSTlr1, hold at 704“C
for 2 hrs.,cool to RT @ 1.31°C/hr..
7& 8 N&T: 955°C/lhr,AC, tempered at730°C/2hrs AC
9Cr-Mo ASTM DS 58 N&T: 900°C, tempered 671°C. Unknown soaking.
35
There were considerable variations between the normalizing and tempering temperatures,
periods of soaking and cooling rates within the same N&T condition where cooling types
varied from furnace, air and water for the same heat treatment of the same low alloy steel.
Thus, contributions of such variations on the creep-fatigue behaviour and life are unknown
and their influence were isolated and ignored to identify trends in the creep-fatigue behaviour
of low alloy steels.
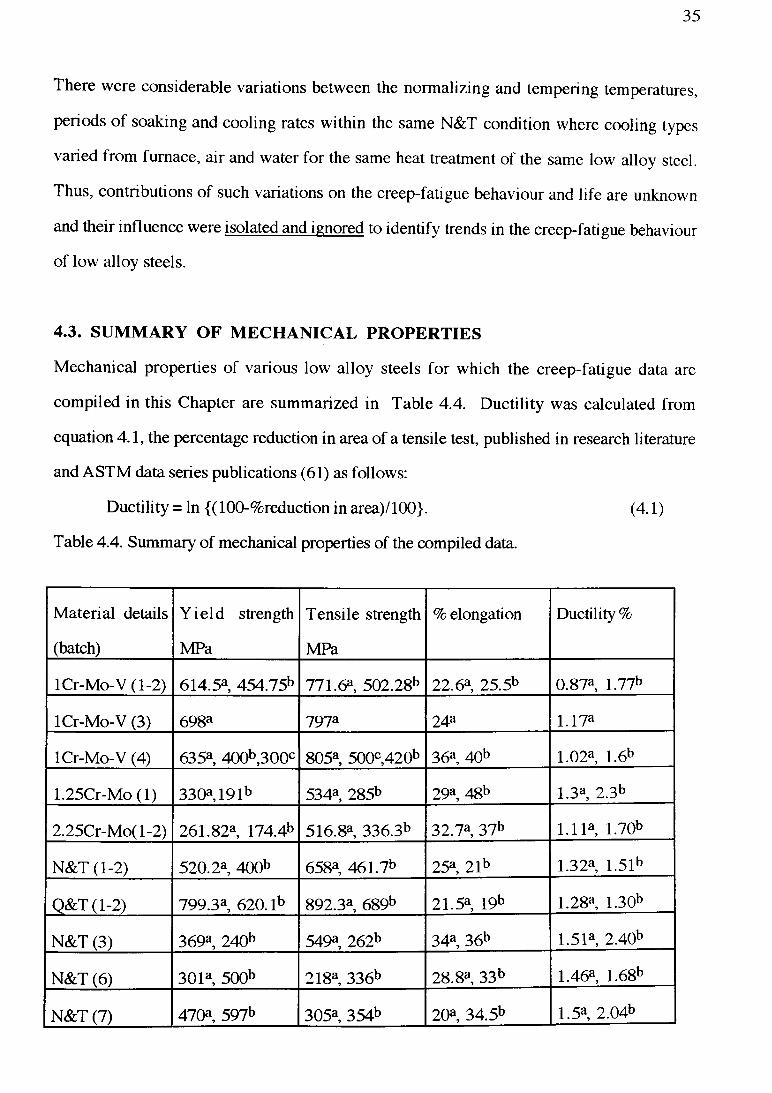
4.3. SUMMARY OF MECHANICAL PROPERTIES
Mechanical properties of various low alloy steels for which the creep-fatigue data are
compiled in this Chapter are summarized in Table 4.4. Ductility was calculated from
equation 4.1, the percentage reduction in area of a tensile test, published in research literature
and ASTM data series publications (61) as follows:
Ductility = In {(100-%reduction in area)/100}. (4.1)
Table 4.4. Summary of mechanical properties of the compiled data.
Material details
(batch)
Y ie ld strength
MPa
Tensile strength
MPa
% elongation Ductility %
lCr-Mo-V (1-2) 614.5* 454.75b 771.6*, 502.28b 22.6*, 25.5b 0.87*, 1.77b
lCr-Mo-V (3) 698a 797a 24a 1.17a
lCr-Mo-V (4) 635* 400b,300c 805*, 500c,420b 36*, 40b 1.02*, 1.6b
1.25Cr-Mo (1) 330* 191b 534*, 285b 29*, 48b 1.3*, 2.3b
2.25Cr-Mo(l-2) 261.82* 174.4b 516.8*, 336.3b 32.7*, 37b 1.11*, 1.70b
N&T (1-2) 520.2* 400b 658*, 461.7b 25*, 21b 1.32*, 1.51b
Q&T (1-2) 799.3* 620. l b 892.3*, 689b 21.5*, 19b 1.28*, 1.30b
N&T (3) 369* 240b 549*, 262b 34*, 36b 1.51*, 2.40b
N&T (6) 301* 500b 218*, 336b 28.8*, 33b 1.46*, 1.68b
N&T (7) 470*, 597b 305*, 354b 20*, 34.5b 1.5*, 2.04b

36
N&T (8) 620a, 443b 720a, 456b 18a, 26.5b 1.37a, 1.73b
4.4. CREEP-FATIGUE DATA
A large number o f waveforms were utilized to generate the creep-fatigue data world-wide,
where some workers used the ramp rates in which strain rate was different in tension and
compression directions, others used the hold times (t) at the peak tension followed by no
compression hold denoted by (t/0), or compression holds with no tension hold denoted by
(0/t) cycles. When hold time was the same in both the directions, it was known as the
balanced dwell cycle (t/t), however, when hold time was different in tension and
compression, the cycle was known as an unbalanced dwell cycle (ti/t2). In most cases, the
hold time was applied only in the tension direction (t/0) and very few compressive dwell
tests (0/t) were conducted. Conventional types of waveforms popularly used in high
temperature low cycle fatigue testing are shown in Figure 4.1. Complex combined cycles
were used in the generation of creep-fatigue data under the Metals Properties Council Inc.
(47-48) efforts. Combined cycles were used to investigate creep-fatigue interspersion
effects, in that, a number (n) o f pure fatigue cycles were applied at the end of a creep-
fatigue hold time. A combined cycle employed by NASA (47) and General Electric
Laboratories (48) is shown in Fig. 4.2. Creep-fatigue data for low alloy steels under
different test combinations o f hold times are tabulated in Tables 4.5-4.21.
a and b represent properties at room and creep-fatigue test temperatures (see Table 4.1).

No. Strain wave pattern
Strain vs.time diagram
A£(%)
th(mi n)
B-l Fast-fast
t = 0 £
■ 5*/S
a a a2.0,1.2,0.8
0.6,0.4—
V V v t
B-2 Slow-fast
t = 0 e
.01 and -0.5%/s
/ \ / \ -2.0,1.2,0.8
0.6,0.4—
B-3 Fast-slow
t = 0 e
.5 and -0.01%/s
K / \2.0,1.2,0.8
0.6,0.4-
v V
B-4 Slow-slow
t = 0 £
.01 V s
| / \ /2.0,1.2,0.8
0.6,0.4—
r \ / 1
B-5
Fast-fast with hold time in tension
t = 0
C X f X U
2.0 5
1.0 . 5V V t 1.0 30
B-6
Fast-fast with hold time in compression
t = 0 £.5%/s
1 A A 2.0 5
Fig. 4.1. Illu s tra tio n of w aveform s used in the creep-fatigue characteriza tion
of 2.25Cr-M o steel u n d e r benchm ark pro ject (53).

Fig. 4.2. Schem atic hysteresis loops associated with M PC C reep-fatigue
in te rsp e rsio n tests (47).

37
Table 4.5. Creep-fatigue data for 0.5Cr-Mo-V .Batch 1 (46).
Total strain range
(%)
Hold time
(hours)
T est-temperature
(°C)
Observed-cycles
(N /)
Remarks
1.51 0.5 550 375
1 0.5 h 537
0.70 0.5 it 998
1.02 2 1! 519
1 16 h 340
0.4 16 » 1590
2.39 16 « 124
1.25 16 » 314
0.61 16 ft 604
0.43 16 « 675
0.34 16 II 1249
2.3 16 h 209
0.92 16 h 611
0.62 16 h 647
0.4 16 h 1126
0.3 16 h 1700
Table 4.6. Creep-fatigue data for lCr-Mo-V Batch 1 (47).
Total strain range Hold time T est-temperature Observed-cycles Remarks
(%) (hours) CQ (N /)
0.55 23 540 29 n=l
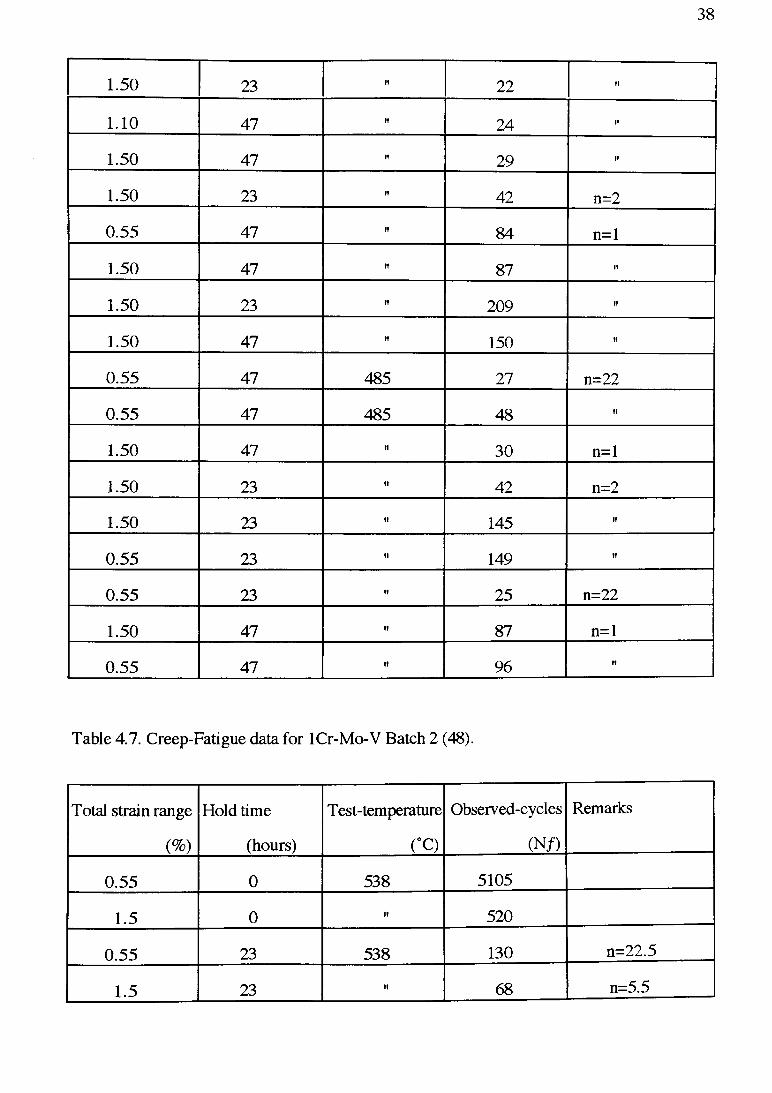
38
1.50 23 » 22 h
1.10 47 » 24 II
1.50 47 h 29 If
1.50 23 h 42 n=2
0.55 47 h 84 n=l
1.50 47 h 87 II
1.50 23 h 209 h
1.50 47 h 150 11
0.55 47 485 27 n=22
0.55 47 485 48 »
1.50 47 h 30 n=l
1.50 23 h 42 n=2
1.50 23 h 145 h
0.55 23 h 149 h
0.55 23 » 25
<N(NIIG
1.50 47 h 87 n=l
0.55 47 h 96 If
Table 4.7. Creep-Fatigue data for lCr-Mo-V Batch 2 (48).
Total strain range
(%)
Hold time
(hours)
Test-temperature
C C)
Observed-cycles
(N /)
Remarks
0.55 0 538 5105
1.5 0 h 520
0.55 23 538 130 n=22.5
1.5 23 h 68 n=5.5
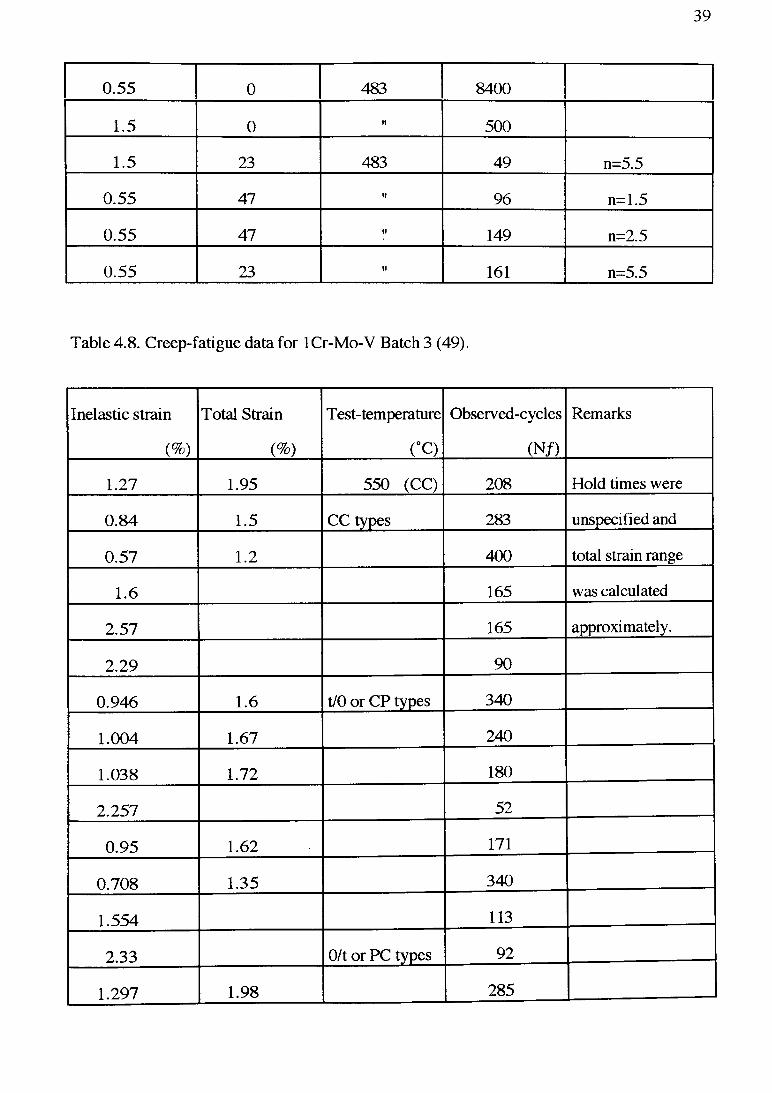
39
0.55 0 483 8400
1.5 0 » 500
1.5 23 483 49 n=5.5
0.55 47 » 96 n=1.5
0.55 47 h 149 n=2.5
0.55 23 « 161 n=5.5
Table 4.8. Creep-fatigue data for lCr-Mo-V Batch 3 (49).
Inelastic strain Total Strain T est-temperature Observed-cycles Remarks
(%> (%) co (N/)
1.27 1.95 550 (CC) 208 Hold times were
0.84 1.5 CC types 283 unspecified and
0.57 1.2 400 total strain range
1.6 165 was calculated
2.57 165 approximately.
2.29 90
0.946 1.6 t/0 or CP types 340
1.004 1.67 240
1.038 1.72 180
2.257 52
0.95 1.62 171
0.708 1.35 340
1.554 113
2.33 0/t or PC types 92
1.297 1.98 285

40
1.14 1.81 250
2.18 95
0.24 0.83 1460
0.24 0.83 1230
0.76 1.41 380
1.32 2 185
1.11 1.78 255
0.5 1.13 590
0.3 0.9 t/t or CC types 625
0.57 1.2 350
1.167 1.84 180
1.923 108
0.892 1.55 260
0.369 0.98 600
0.093 0.6 950
Table 4.9. Creep-fatigue data for lCr-Mo-V Batch 4 (50).
Total strain range
(%)
Hold time
(hours)
T est-temperature
C Q
Observed-cycles
(N /)
Remarks
1.5 0 565 327 Stress range was
1.0 0 » 490 unknown,
0.7 0 » 960 inelastic strain
1.96 3 97 range unknown
1.08 3 h 150
1.96 0.5 tt 135

41
1.08 0.5 I! 220
0.53 0.5 II 435
0.86 1 II 1275
1.06 0.5/0.5 !! 385
1.46 0.5/0.5 h 220
2.0 0.5/0.5 h 215
1.4 0.5/0.5 H 390
1.3 16 K 73
1.3 16/0.003 » 208
2.0 0.5 « 180
1.5 0.5 h 215
1.0 0.5 h 300
2.0 0/0.5 h 300
1.5 0/0.5 it 374
1.1 0/0.5 h 560
2.04 0/0.5 h 320
1.24 0/0.5 h 562
1.53 0/0.5 « 362
0.85 0/0.5 « 500
Table 4.10. Creep-fatigue data for lCr-Mo-V Batch 5 (46).
Total strain range Hold time Test-temperature Observed-cycles Remarks
(%) (hours) fC ) (N /)
3.2 0.5 550 80
2 0.5 » 176
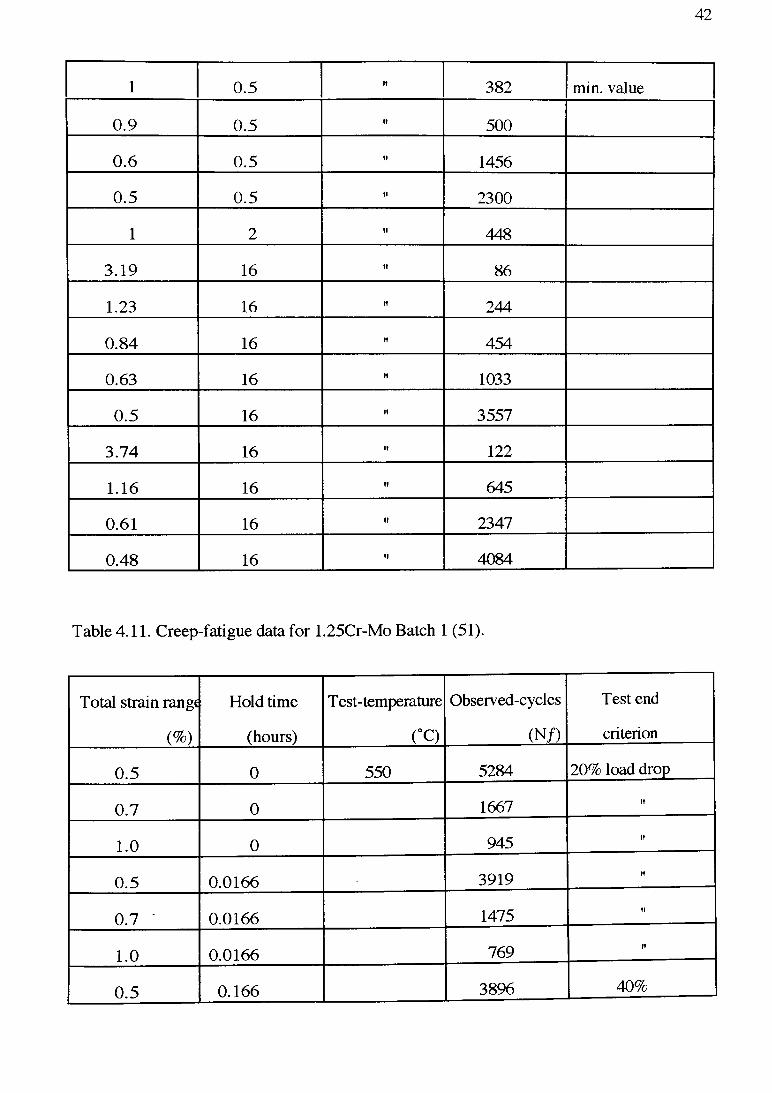
42
1 0.5 h 382 min. value
0.9 0.5 » 500
0.6 0.5 h 1456
0.5 0.5 h 2300
1 2 « 448
3.19 16 h 86
1.23 16 h 244
0.84 16 fl 454
0.63 16 » 1033
0.5 16 h 3557
3.74 16 K 122
1.16 16 h 645
0.61 16 h 2347
0.48 16 fl 4084
Table 4.11. Creep-fatigue data for 1.25Cr-Mo Batch 1 (51).
Total strain rang« Hold time T est-temperature Observed-cycles Test end
(%) (hours) fC ) (N /) criterion
0.5 0 550 5284 20% load drop
0.7 0 1667 h
1.0 0 945 «
0.5 0.0166 3919 ft
0.7 ' 0.0166 1475 «
1.0 0.0166 769 ff
0.5 0.166 3896 40%

43
0.7 0.166 1311 33%
1.0 0.166 820 20%
1.0 0.5 601 20%
Table 4. 12. Creep-fatigue data for 1.25Cr-Mo Batch 2 (52).
Total strain range Hold time T est-temperature Observed-cycles Saturated stress
(%> (hours) CC) (N/) range(N//2) MPa.
2.01 0 600 560 575
1.52 0 ti 760 527
0.98 0 » 1500 505
0.62 0 » 6100 460
0.59 0 » 5800 459
0.48 0 » 5000 438
2.04 0.03 n 418 599
1.04 n n 871 526
2.05 0.08 H 327 583
0.95 » ii 772 533
2.04 0.16 « 292 583
1.04 ti » 605 522
2.03 0.5 » 230 551
1.04 « n 455 488
2.03 1 ii 195 528
0.99 « n 418 481
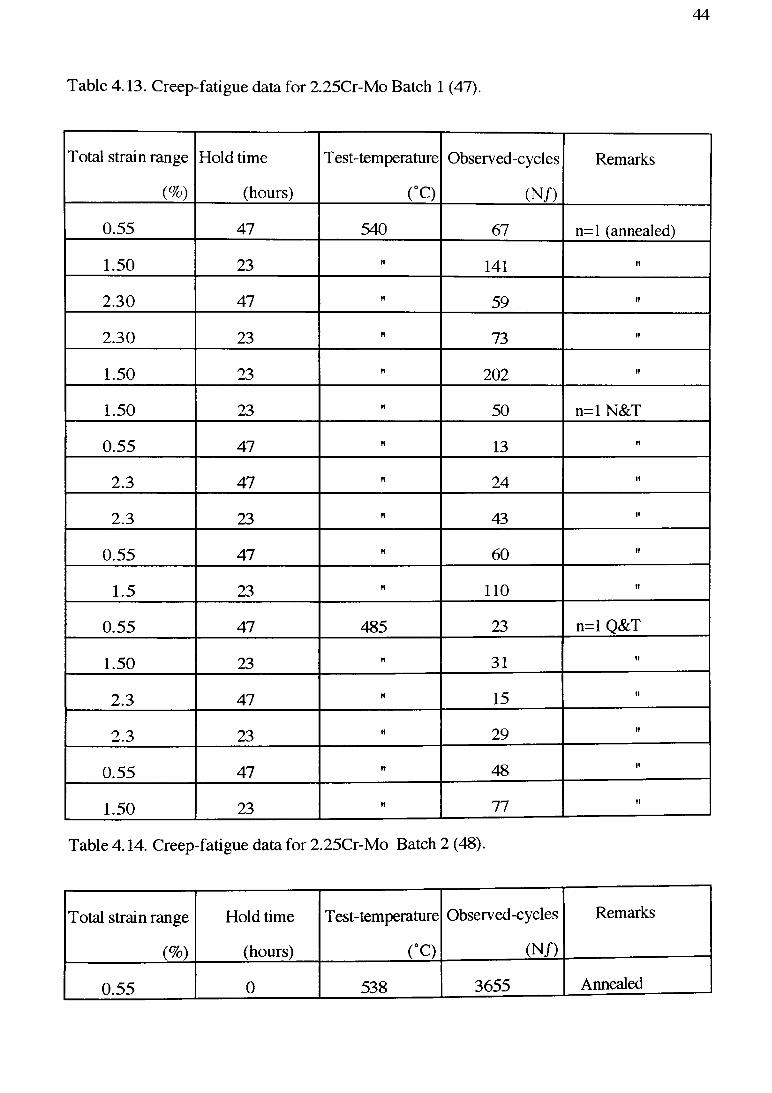
44
Table 4.13. Creep-fatigue data for 2.25Cr-Mo Batch 1 (47).
Total strain range
(%)
Hold time
(hours)
T est-temperature
(°C)
Observed-cycles
(N/)
Remarks
0.55 47 540 67 n=l (annealed)
1.50 23 » 141 h
2.30 47 h 59 ft
2.30 23 » 73 tl
1.50 23 » 202 h
1.50 23 h 50 n=l N&T
0.55 47 h 13 ft
2.3 47 h 24 if
2.3 23 « 43 «
0.55 47 fl 60 fl
1.5 23 it 110 h
0.55 47 485 23 n=l Q&T
1.50 23 Vf 31 II
2.3 47 h 15 tl
2.3 23 « 29 11
0.55 47 ft 48 11
1.50 23 » 77 It
Table 4.14. Creep-fatigue data for 2.25Cr-Mo Batch 2 (48).
Total strain range Hold time T est-temperature Observed-cycles Remarks
(%) (hours) CO (N /)
0.55 0 538 3655 Annealed

45
1.5 0 » 930 ii
2.3 0 it 348 ii
0.55 47 it 67 n=1.5
0.55 23 ii 103 n=5.5
1.50 23 ii 13 n=5.5
0.55 0 538 2990 N&T
1.5 0 n 672 ii
2.3 0 n 281 11
0.55 47 it 13 n=l .5
0.55 23 ii 32 n=5.5
0.55 47 n 60 n=l .5
1.5 23 ii 13 n=22.5
0.55 0 483 7440 Q&T
1.50 0 it 474 if
2.3 0 it 265 n
0.55 47 ti 23 n=1.5
0.55 23 ii 90 n=5.5
1.50 23 ii 77 n=1.5
Table 4.15. Creep-fatigue data for 2.25Cr-Mo Batch 3 (53).
Total strain range Hold time Test-temperature Observed-cycles Remarks
(%) (hours) r o (N /)
2.0 600 257 Five strain rates
ii ii 355 fast -fast (FF)
1.2 _ n 780 0.5%/s
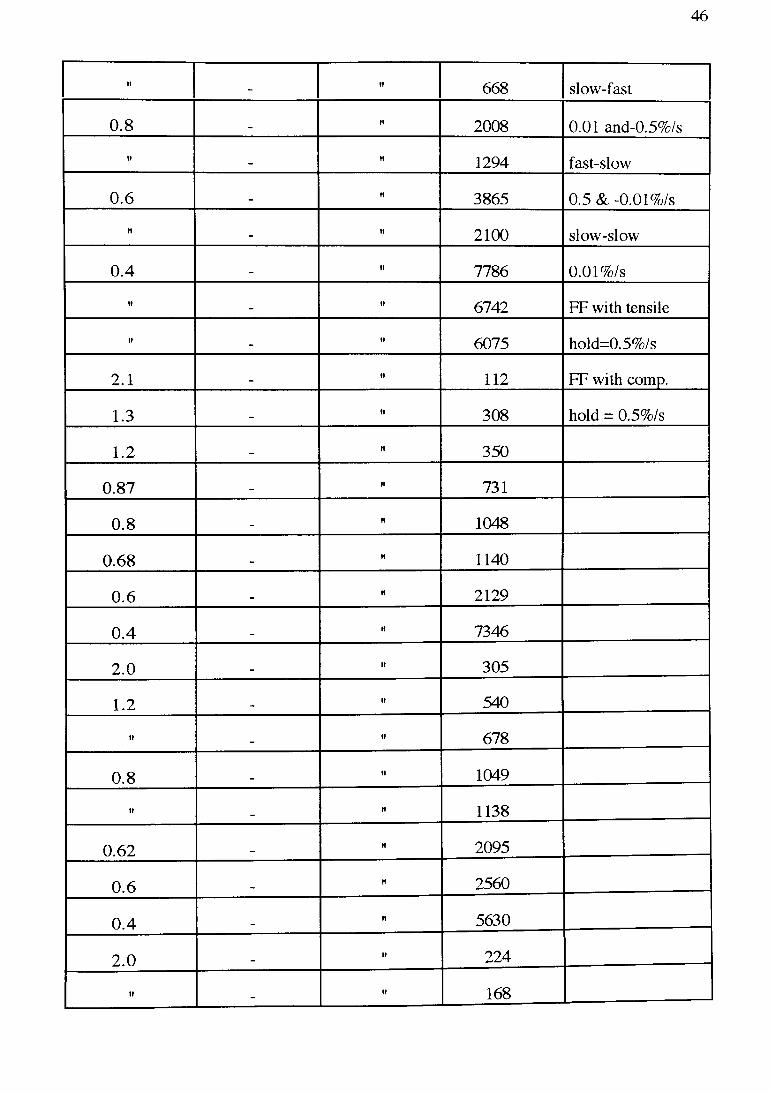
46
II ii 668 slow-fast
0.8 it 2008 0.01 and-0.5%/s
H n 1294 fast-slow
0.6 _ ii 3865 0.5 & -0.01%/s
ii _ it 2100 slow-slow
0.4 _ n 7786 0.01%/s
n _ n 6742 FF with tensile
ii tt 6075 hold=0.5%/s
2.1 ii 112 FF with comp.
1.3 _ n 308 hold = 0.5%/s
1.2 . n 350
0.87 . ii 731
0.8 H 1048
0.68 it 1140
0.6 ii 2129
0.4 ii 7346
2.0 H 305
1.2 ff 540
n ii 678
0.8 H 1049
it it 1138
0.62 it 2095
0.6 n 2560
0.4 H 5630
2.0 it 224
n - ii 168

47
1.2 _ it 325
it ii 496
0.86 _ ii 915
0.8 _ ii 955
0.6 it 1768
ii ii 1229
0.4 ii 9227
2.0 0.083 ii 312
1.0 0.083 ii 720
2.0 0/0.083 it 325
1.0 0/0.083 n 894
Table 4.16. Creep-fatigue data for 2.25Cr-Mo Batch 4 (54).
Total strain range
(%)
Hold time
(hours)
Test-temperature
C Q
Observed-cycles
(Nf)
Saturated stress
range (N//2)MPa.
0.5 0/0.1 502 61111 216
0.5 0.1 n 20147 209
0.5 0.1/0.1 ii 3420 209
1.0 n 3721 259
1.0 0/ 0.1 n 1924 264
1.0 0.1 ii 2059 252

48
Table 4.17. Creep-fatigue data for 2.25Cr-Mo Batch 5 (55).
Total strain range
(%)
Hold time
(hours)
T est-temperature
rc)Observed-cycles
(N/)
Inelastic strain
range %
1.01 0.23 600 1360 0.79
1.99 0.22 ti 472 1.75
1.00 0.01 it 1070 0.79
1.07 0.54 H 820 0.9
1.02 0.08 II 940 0.85
1.97 0.22 ii 410 1.78
Table 4.18. Creep-fatigue data for 2.25Cr-Mo Batch 6 (56).
Total strain range
(%>
Hold time
(hours)
T est-temperature
fC )
Observed-cycles
(N/)
Saturated stress
range(N//2) MPa.
3.20 0.016 550 234 697
2.15 it ii 410 647
0.54 ii ii 5200 485
1.05 ii ii 1520 549
4.30 ii n 200 722
3.20 ii ti 208 687
2.20 n n 380 630
1.20 n ii 150 736
0.52 ii n 6100 422
1.05 ii n 1450 510
4.25 0.034 ii 165 657
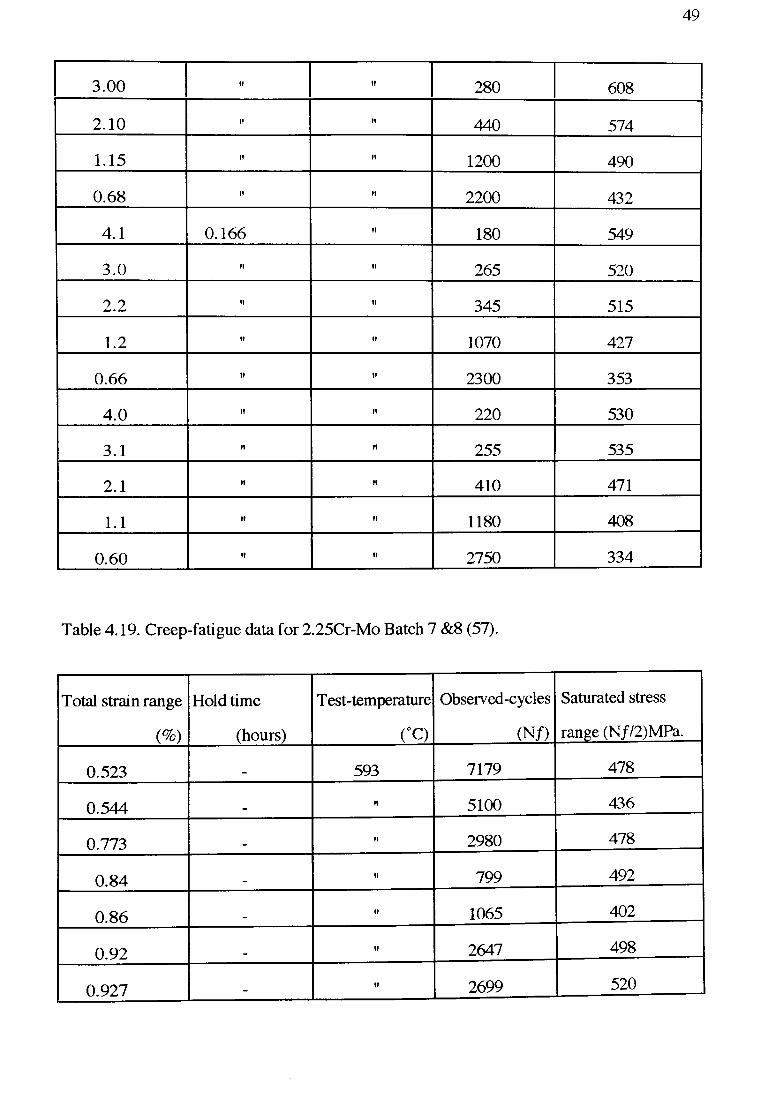
49
3.00 H ii 280 608
2.10 If H 440 574
1.15 11 ii 1200 490
0.68 n ii 2200 432
4.1 0.166 ii 180 549
3.0 H ii 265 520
2.2 it ii 345 515
1.2 it ii 1070 427
0.66 n ii 2300 353
4.0 it n 220 530
3.1 n it 255 535
2.1 H n 410 471
1.1 H ii 1180 408
0.60 H ii 2750 334
Table 4.19. Creep-fatigue data for 2.25Cr-Mo Batch 7 &8 (57).
Total strain range
(%)
Hold time
(hours)
T est-temperature
fC )
Observed-cycles
(N /)
Saturated stress
range (Nf/2)MPa.
0.523 593 7179 478
0.544 H 5100 436
0.773 ii 2980 478
0.84 it 799 492
0.86 n 1065 402
0.92 ii 2647 498
0.927 - ii 2699 520
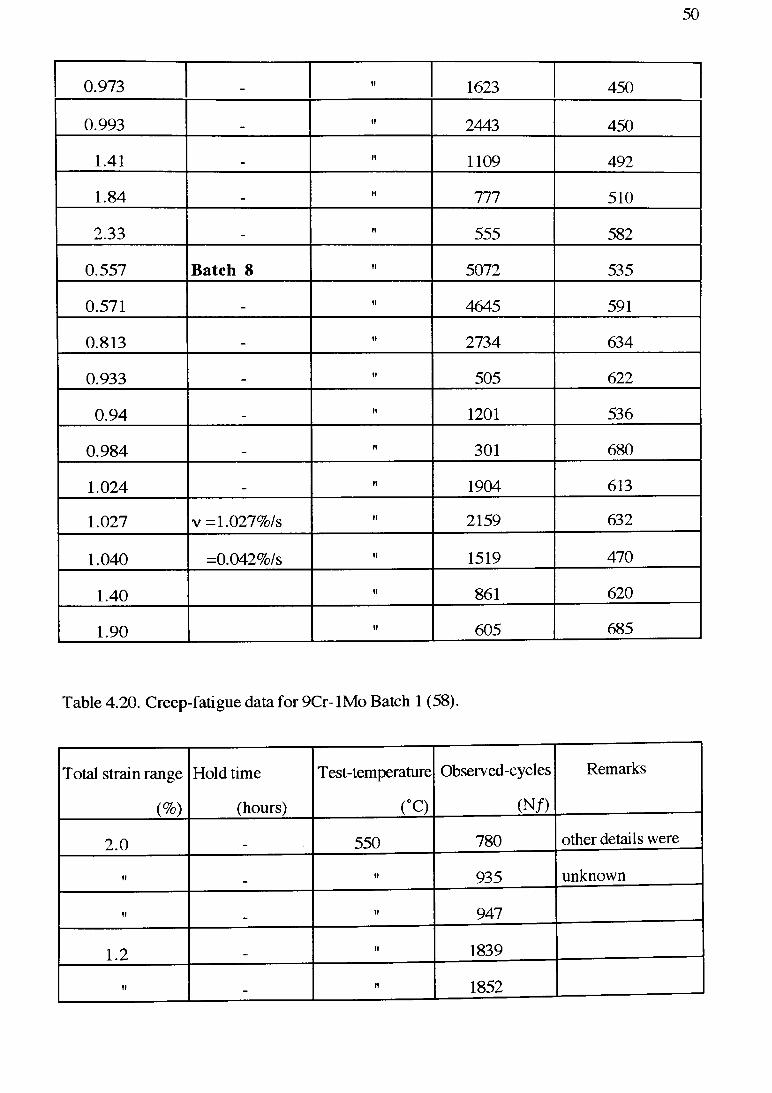
50
0.973 _ H 1623 450
0.993 II 2443 450
1.41 1» 1109 492
1.84 _ II 777 510
2.33 _ II 555 582
0.557 Batch 8 II 5072 535
0.571 _ II 4645 591
0.813 _ II 2734 634
0.933 _ II 505 622
0.94 . II 1201 536
0.984 . II 301 680
1.024 II 1904 613
1.027 v =1.027%/s II 2159 632
1.040 =0.042%/s II 1519 470
1.40 II 861 620
1.90 II 605 685
Table 4.20. Creep-fatigue data for 9Cr-lM o Batch 1 (58).
Total strain range Hold time T est-temperature Observed-cycles Remarks
(%) (hours) (°C) (N /)
2.0 550 780 other details were
« h 935 unknown
h h 947
1.2 h 1839
« _ « 1852

51
Il h 1740
0.6 _ fl 16960
h h 13000
h _ h 10300
Table 4.21: Creep-fatigue data for 9Cr-lM o Batch 2 (59).
Total strain range Hold time T est-temperature Observed-cycles Saturated stress
(%) (hours) c o (N /) range(N//2) MPa.
0.5 0/0 538 13786 535
0.5 0/0 h 15455 604
0.7 0/0 « 6844 556
0.7 0/0 h 9676 549
0.78 0.25 « 3537 482
0.5 0.25 h 8840 475
0.5 0.5 h 6975 508
0.51 0.5 h 7770 513
0.52 0/0 593 13125 505
0.49 0/0 h 7420 472
0.5 0.5 « 3360 426
0.5 0.5 h 4150 465
0.5 1 « 3207 370
0.5 1 « 2870 203
0.5 1 h 2882 363
0.5 1 li 2900 429
52
4.5. COMMENTS ON THE DATA COMPILED
In all the batches of creep-fatigue data tabulated in Tables 4.5- 4.21, several features were
found to be unspecified in the open literature, for example, the effects of microstructure on
the creep-fatigue life was evidently ignored by all workers. Strain rates during creep-
fatigue tests were mostly unspecified in the open literature. Total strain range and hold
times were unspecified (48) for lCr-Mo-V "batch" 3, in Table 4.8. For Table 4.8, total
strain ranges (Aet) were derived using the equations 4.2 for the approximate determination,
Ae t = Act / E + As p
where Aa = K (As p)n (4.2)
where Ae t is total strain range, Aa is stress range, E is modulus of elasticity, Aep is plastic
strain range, K, and n are the material parameters.
Value of K and n were assumed for "batch" 8 from Jaske and Mindlin (62), who
found them 1008 MPa and 0.09 respectively for lCr-Mo-V tested at 538°C. Such
conversion from inelastic strain to total strain was made below inelastic strain range of
1.4% (25, 62). Beyond this limit, the two values assumed, changed (62). The approximate
analysis performed in this section randomises the data which will be useful in assessing the
applicability of a method of life prediction and must not be used in design analyses.
Another aspect of the data relates to the saturated stress range which was sparingly
available in the literature. Hence, saturated stress range appear in the data tables where
details were available. In most cases, longitudinal extensometers were used with
cylindrical specimens. However, complete details of the specimens, extensometry and how
the temperature and strain rates were controlled were not generally specified in the open
literature. The failure criteria also varied from laboratory to laboratory and in one particular
case for 1.25Cr-Mo "batch" 1 from tests to tests. Why different failure criteria were used
for different tests was not specified in the open literature.
A code of practice (63) is in the developmental stage in the United Kingdom,
however, several test parameters such as strain rates in tension and compression and hold

53
times and their directions as well as other parameters are not standardised in this code. An
elaborate standard of practice in laboratory generation of creep-fatigue tests is highly desired.

54
5. CREEP-FATIGUE BEHAVIOR OF LOW ALLOY STEELS - TRENDS
A creep-fatigue data bank has been compiled for low alloy steels in Chapter 4 which was
used in this Chapter to identify trends in the creep-fatigue behaviour of low alloy steels.
Several material and test parameters were identified in Chapter 4 that enhanced the variability
in creep-fatigue testing. How numerous variables, identified in Chapter 4, affect the creep-
fatigue life of materials are unknown, hence, effects of unknown variables in creep-fatigue
response are isolated to identify the trends in the creep-fatigue behaviour of low alloy steels.
Effects of composition on the creep-fatigue behaviour of low alloy steels were assessed in a
range of chromium content from 0.5 to 9 weight percent, where the creep-fatigue behaviour
in general improved with the increase in chromium content. When other elements (e.g.,
vanadium) were added to a 2.25Cr-Mo steel, the creep-fatigue performance deteriorated.
Effects of hold times in tension and compression directions were assessed to investigate the
dwell sensitive behaviour of the materials. A material was dwell sensitive if there was
associated decrease in life when either a tension or a compression hold at peak strain range
was applied. The 2.25Cr-Mo steel was observed to be compressive dwell sensitive,
whereas, lCr-Mo-V steel was tensile dwell sensitive. When a number (n) of pure fatigue
cycles were applied at the end of a creep-fatigue cycle, known as combined cycles, either
improvement or deterioration of creep-fatigue resistance occurred and the response depended
upon the number of combined cycles employed.
5.1. INTRODUCTION
Creep-fatigue tests are conducted to simulate the actual service conditions of engineering
components operating in the creep range. The microscopic damage features are also
investigated to document failure modes under creep-fatigue that aid in the development of life
prediction or extension methods. These studies are conducted to gain more knowledge on the
high temperature low cycle fatigue (HTLCF), which is a candidate failure mechanism of

55
components operating in the creep range. Effects of numerous material and test parameters
on the creep-fatigue behaviour of low alloy steels are not understood, therefore, the influence
of several variables are isolated to identify trends in the creep-fatigue behaviour of low alloy
steels. The trends in the creep-fatigue behaviour of low alloy steels are discussed below.
5.2. ANALYSES OF CREEP-FATIGUE DATA
Creep-fatigue data, in which the plastic strain dominates, usually the life ranges from 103 to
104 cycles and elastic strain component is found smaller than plastic. The data compiled in
Chapter 4 are represented by total strain range and cycles to failure, hence total strain range
and life data were fitted with a least square best fit equation on a log-log scale. A least square
best fit equation was determined for at least 50 combinations of continuous fatigue and hold
time test sequences. The best fit equation so obtained had an intercept (A) and a slope (m),
known as material parameters. Only two data points were used to determine the parameters
of linear extrapolation when only two data points were available. Such equations are
questionable and should not be used in the design by extrapolating total strain and life
combinations. As intercept (A) and negative slope (m) increased creep-fatigue life decreased.
The equation has the following form :
Ae t = A (N /) m (5.1)
where A and m are material parameters.
Material parameters were determined for various combinations of tests tabulated in Table 5.1.
Thus, Table 5.1 is a source table from which the information on creep-fatigue behaviour of
low alloy steels can be gathered and a total strain- life relationship can be determined.
Table 5.1. Material parameters of total strain versus life equation of the compiled data.
Material / (Batch) Temperature Slope Intercept Remarks
0.5Cr-Mo-V (1) 550° C -0.77 2.12 0.5 hour tensile hold.
550° C -0.84 2.18 16 hours tensile hold.
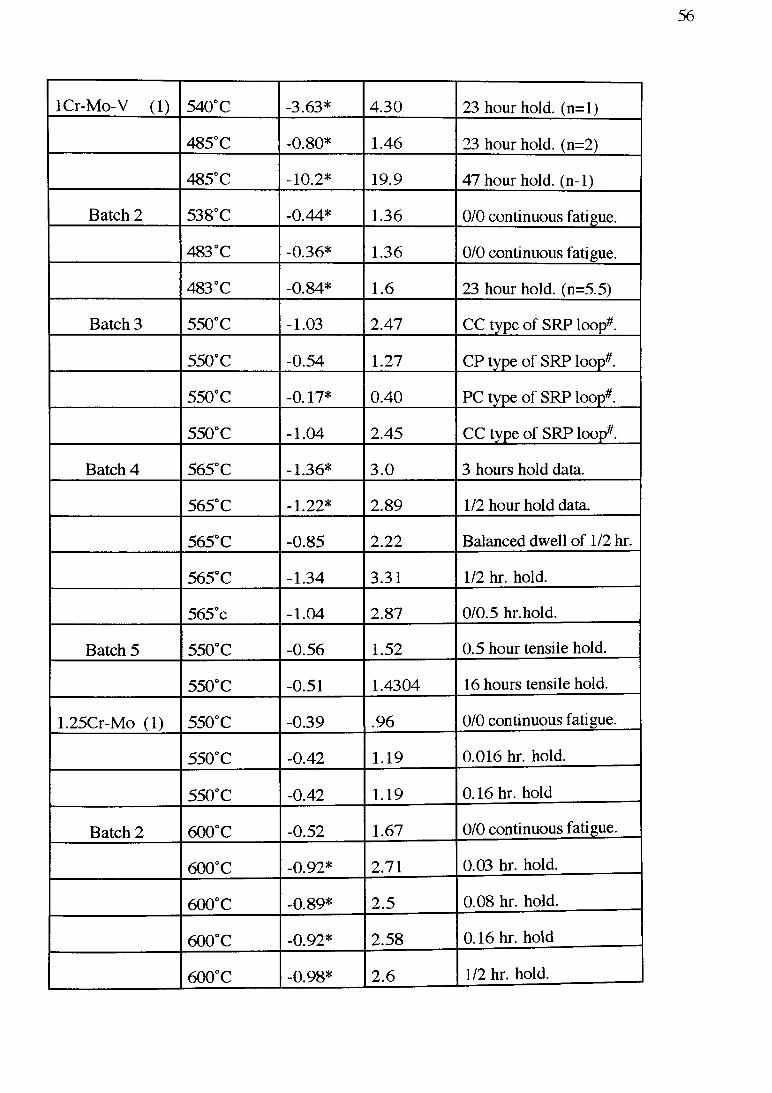
56
lCr-Mo-V (1) 540° C -3.63* 4.30 23 hour hold. (n=l)
485° C -0.80* 1.46 23 hour hold. (n=2)
485° C -10.2* 19.9 47 hour hold, (n-1)
Batch 2 538°C -0.44* 1.36 0/0 continuous fatigue.
483°C -0.36* 1.36 0/0 continuous fatigue.
483°C -0.84* 1.6 23 hour hold. (n=5.5)
Batch 3 550° C -1.03 2.47 CC type of SRP loop#.
550° C -0.54 1.27 CP type of SRP loop#
550° C -0.17* 0.40 PC type of SRP loop#.
550° C -1.04 2.45 CC type of SRP loop#.
Batch 4 565° C -1.36* 3.0 3 hours hold data.
565° C -1.22* 2.89 1/2 hour hold data.
565°C -0.85 2.22 Balanced dwell of 1/2 hr.
565° C -1.34 3.31 1/2 hr. hold.
565°c -1.04 2.87 0/0.5 hr.hold.
Batch 5 550° C -0.56 1.52 0.5 hour tensile hold.
550° C -0.51 1.4304 16 hours tensile hold.
1.25Cr-Mo (1) 550° C -0.39 .96 0/0 continuous fatigue.
550° C -0.42 1.19 0.016 hr. hold.
550° C -0.42 1.19 0.16 hr. hold
Batch 2 600° C -0.52 1.67 0/0 continuous fatigue.
600° C -0.92* 2.71 0.03 hr. hold.
600° C -0.89* 2.5 0.08 hr. hold.
600° C -0.92* 2.58 0.16 hr. hold
600° C -0.98* 2.6 1/2 hr. hold.
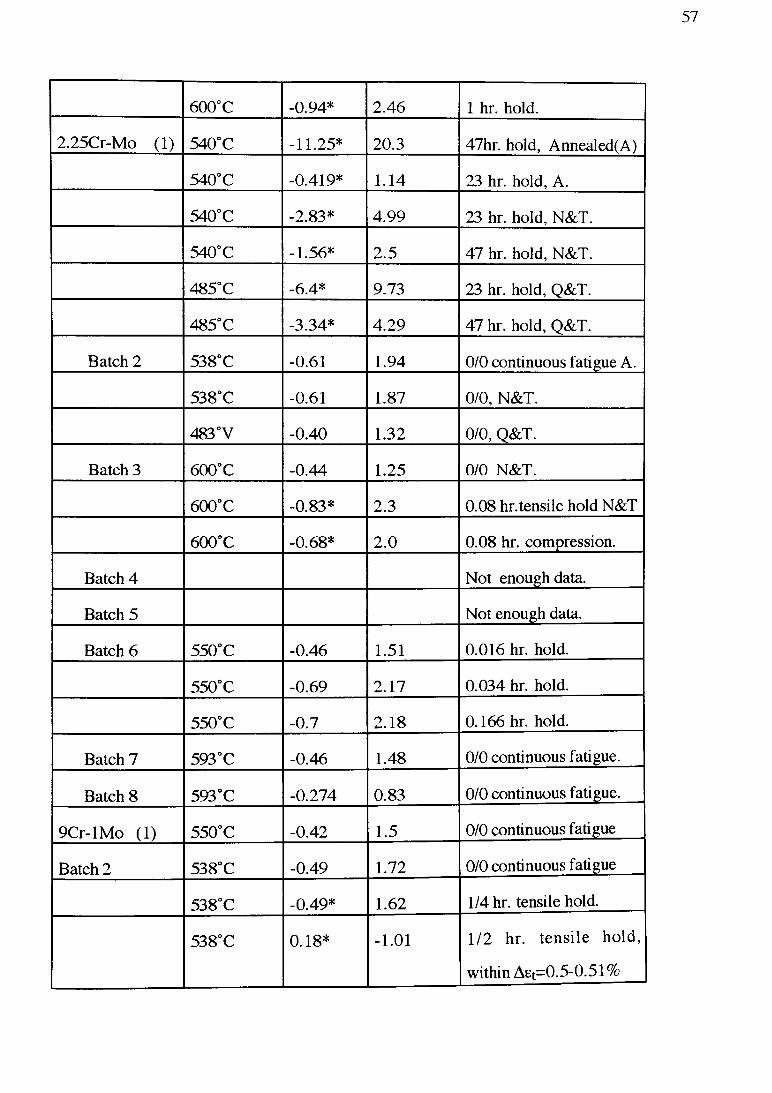
57
600° C -0.94* 2.46 1 hr. hold.
2.25Cr-Mo (1) 540° C -11.25* 20.3 47hr. hold, Annealed(A)
540° C -0.419* 1.14 23 hr. hold, A.
540°C -2.83* 4.99 23 hr. hold, N&T.
540° C -1.56* 2.5 47 hr. hold, N&T.
485° C -6.4* 9.73 23 hr. hold, Q&T.
485° C -3.34* 4.29 47 hr. hold, Q&T.
Batch 2 538° C -0.61 1.94 0/0 continuous fatigue A.
538°C -0.61 1.87 0/0, N&T.
483°V -0.40 1.32 0/0, Q&T.
Batch 3 600° C -0.44 1.25 0/0 N&T.
600° C -0.83* 2.3 0.08 hr.tensile hold N&T
600° C -0.68* 2.0 0.08 hr. compression.
Batch 4 Not enough data.
Batch 5 Not enough data.
Batch 6 550° C -0.46 1.51 0.016 hr. hold.
550° C -0.69 2.17 0.034 hr. hold.
550° C -0.7 2.18 0.166 hr. hold.
Batch 7 593°C -0.46 1.48 0/0 continuous fatigue.
Batch 8 593°C -0.274 0.83 0/0 continuous fatigue.
9Cr-lM o (1) 550° C -0.42 1.5 0/0 continuous fatigue
Batch 2 538° C -0.49 1.72 0/0 continuous fatigue
538°C -0.49* 1.62 1/4 hr. tensile hold.
538°C 0.18* -1.01 1/2 hr. tensile hold,
within AEt=0.5-0.51 %
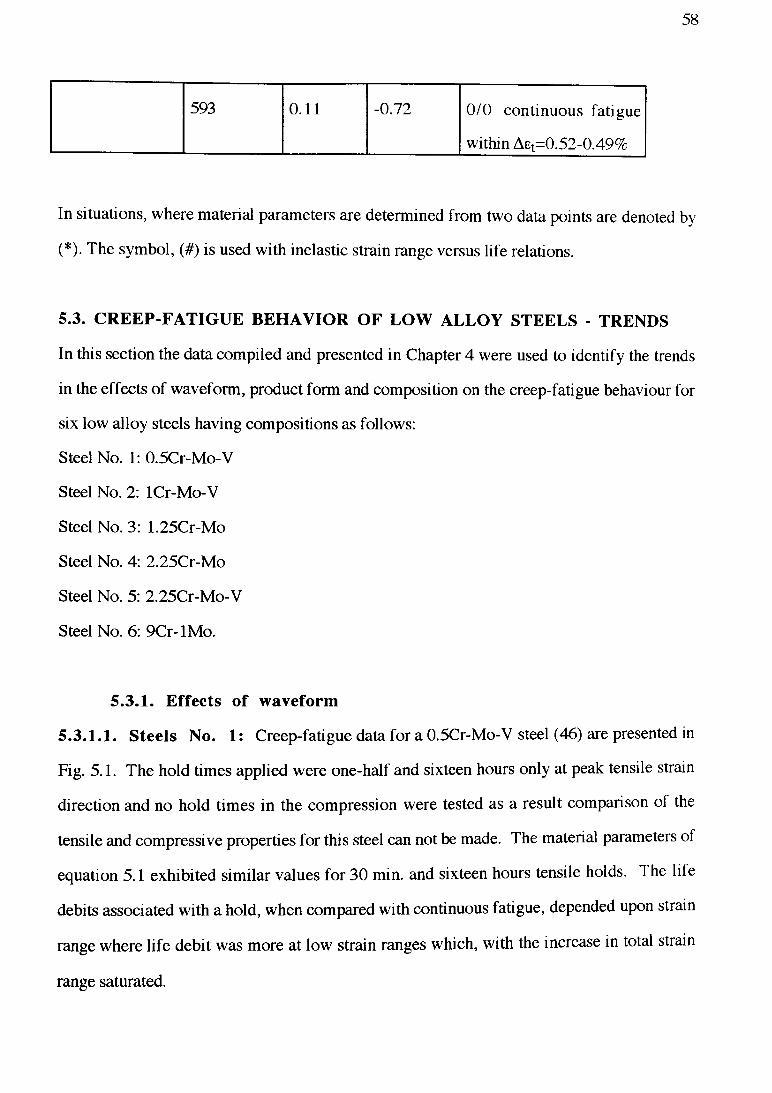
58
593 0.11 -0.72 0/0 continuous fatigue
within A£t=0.52-0.49%
In situations, where material parameters are determined from two data points are denoted by
(*). The symbol, (#) is used with inelastic strain range versus life relations.
5.3. CREEP-FATIGUE BEHAVIOR OF LOW ALLOY STEELS - TRENDS
In this section the data compiled and presented in Chapter 4 were used to identify the trends
in the effects of waveform, product form and composition on the creep-fatigue behaviour for
six low alloy steels having compositions as follows:
Steel No. 1: 0.5Cr-Mo-V
Steel No. 2: lCr-Mo-V
Steel No. 3: 1.25Cr-Mo
Steel No. 4: 2.25Cr-Mo
Steel No. 5: 2.25Cr-Mo-V
Steel No. 6: 9Cr-lMo.
5.3.1. Effects of waveform
5.3 .1.1. Steels No. 1: Creep-fatigue data for a 0.5Cr-Mo-V steel (46) are presented in
Fig. 5.1. The hold times applied were one-half and sixteen hours only at peak tensile strain
direction and no hold times in the compression were tested as a result comparison of the
tensile and compressive properties for this steel can not be made. The material parameters of
equation 5.1 exhibited similar values for 30 min. and sixteen hours tensile holds. The life
debits associated with a hold, when compared with continuous fatigue, depended upon strain
range where life debit was more at low strain ranges which, with the increase in total strain
range saturated.

0>&X)cau
cduwW5"c3■ woH
10
1 -
.1
.01
□
ana □ □
□
Keys
a 0.5/0 Batch 1o 2/0 Batch 1□ 16/0 Batch 1
1 oT - n —r y
10I I ' l l T —T~
1 0
Cyclic life
Fig. 5.1. Creep-fatigue behavior of 0.5Cr-Mo-V steel with different hold times.
59
5.3.I.2. Steel No.2: This steel has been extensively tested for creep-fatigue performance
under different tension and compression holds, where a tensile hold caused more damage
than hold in the compression, balanced hold and unbalanced holds for "batch 4" (36, 50).
Although the same hold periods were applied in tension and compression at the same strain
range, tensile holds were nearly two times more damaging. Material parameters, such as
slope of 30 min. tensile dwell cycles were more negative than the same compressive dwell
cycles shown in Table 5.1. The material parameter (m) of equation 5.1 for one-half hour
tensile dwell cycles was -1.22, whereas for the same compressive hold cycles it was -1.04.
For unbalanced cycles (ti/t2), with 16 hours tensile hold, followed by 10 seconds hold in
compression, caused a healing effect. With the application of 16h/10 sec. cycle, life
enhanced by a factor of 3 from only tensile hold of 16 hours shown in Fig. 5.2.
In creep-fatigue condition, where damage accrues by creep-fatigue interaction is
interpreted in terms of relaxed strains when a hold time is applied at constant stress level
and stress relax when a hold time is applied at constant strain. In both the cases, the plastic
strain component is increased, such that, when the magnitude of relaxed strains exceed the
creep ductility of the material, failure occurs. Creep ductility is a variable quantity which
depends not only upon stress, temperature and time, but also, upon microstructure, grain
size, heat treatment and material composition. For a typical estimate, for "batch 4" (32, 36,
50), it was found 5%, however, no consideration of factors that influence the creep ductility
was made. The rates of stress relaxation were assumed (11) to be the same in both tension
and compression directions, however, the mechanistic features of damage observed under
tension and compression holds were different (32), that implies rates of stress relaxation in
tension and compression directions to be different.
Data for various hold time cycles were normalized with continuous fatigue data, in
terms of normalized cycle ratio (NCR), which was a ratio of number of cycles to failure
under hold time cycle with continuous fatigue at the same strain ranges. The NCR was
presented with total strain range for lCr-Mo-V steel in Fig. 5.3. When the NCR of various
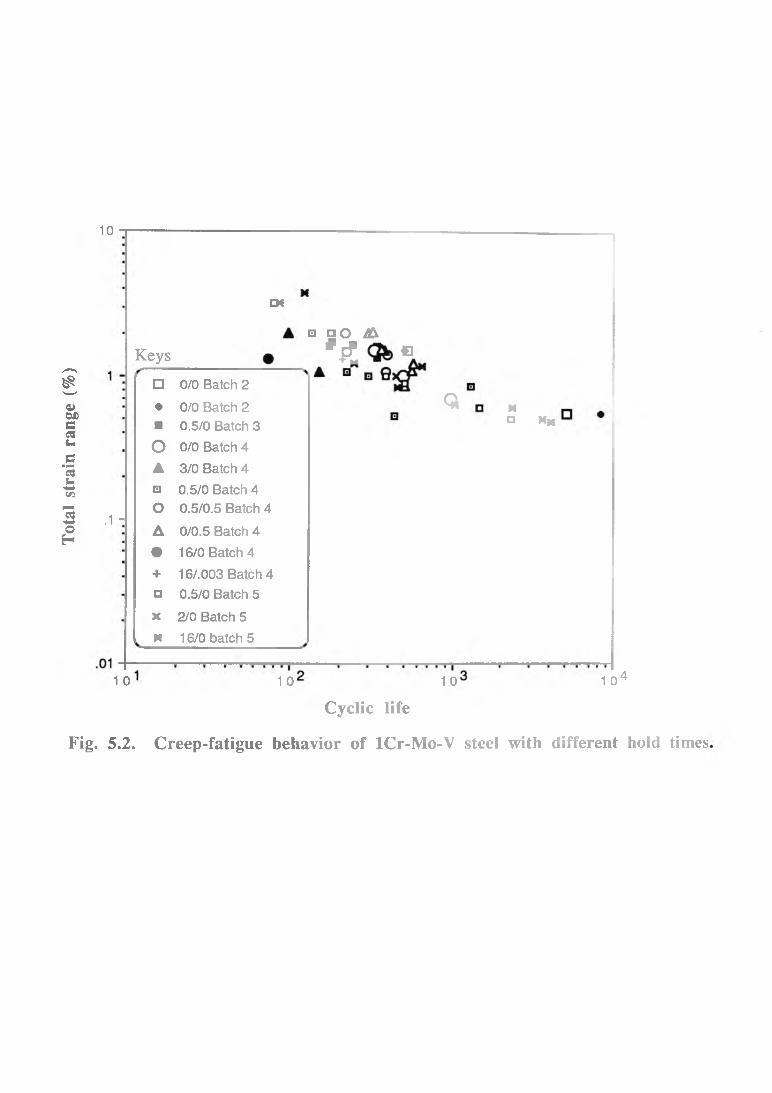
Tot
al s
trai
n ra
nge
(%)
10
.1 -
CK
Keys
1 o
□ 0/0 Batch 2• 0/0 Batch 2■ 0.5/0 Batch 3o 0/0 Batch 4A 3/0 Batch 4□ 0.5/0 Batch 4o 0.5/0.5 Batch 4
A 0/0.5 Batch 4• 16/0 Batch 4+ 16/.003 Batch 4□ 0.5/0 Batch 5X 2/0 Batch 5M 16/0 batch 5
□ □ O A' Æ «
Q M□ km
1 0 1 0 1 0 4
Cyclic life
Fig. 5.2. Creep-fatigue behavior of lCr-Mo-V steel with different hold times
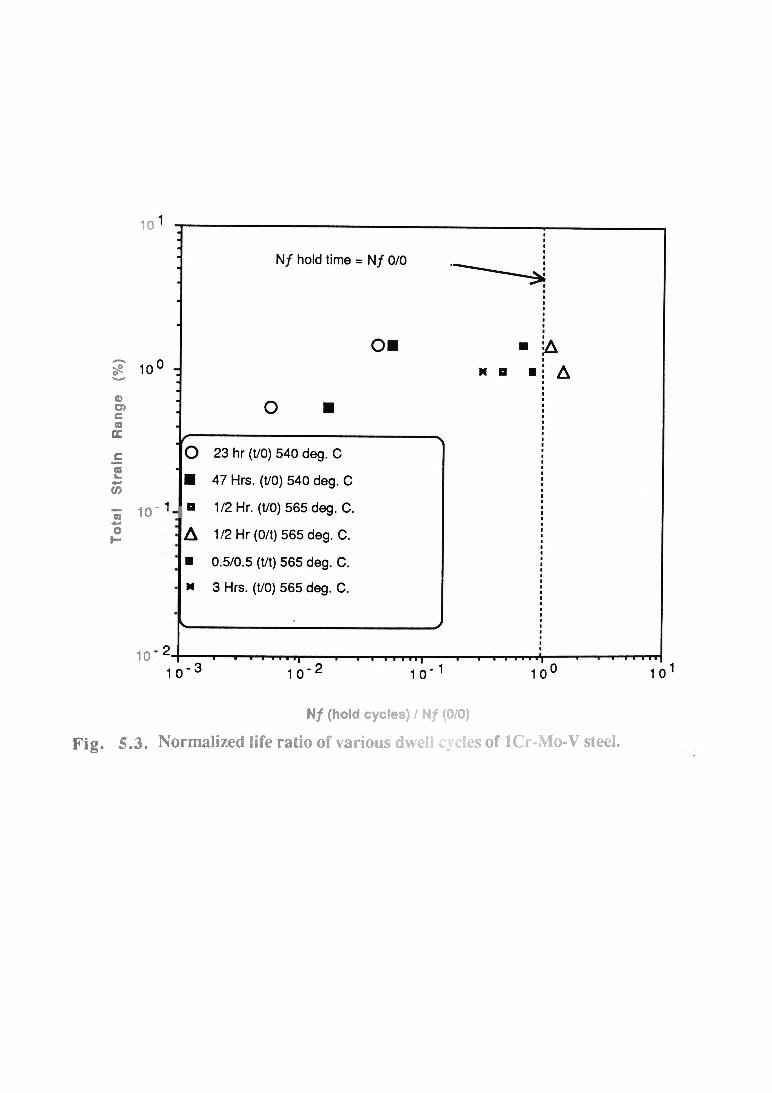
Tota
l S
trai
n R
ange
(%
)
Fig .
10
10 '
10
N/ (hold cycles) / N/ (0/0)
5.3. Normalized life ratio of various dwell cycles of lCr-M o-V steel.
60
tensile dwell containing cycles were less than unity, the material was tensile dwell sensitive.
However, when the normalized cycle ratios of the compressive dwell containing cycles
were more than unity, those cycles were beneficial than continuous fatigue (0/0).
5.3.1.3. Steel No. 3: For this steel the material conditions and heat treatment details were
not specified in the literature (51) for "batch" 1. The data compiled for two batches of
1.25Cr-Mo steels were compared against each other by isolating the effects of material
conditions. A difference of 50°C existed in the test temperatures for two batches which
contributed to lower the tensile properties o f the material. When compared at the same total
strain ranges, both materials performed identically when no hold time was applied. With 10
and 30 minutes tensile holds creep-fatigue response for "batch 1" was slightly better than
"batch 2" as shown in Fig. 5.4 at the same strain range. It may not be possible to conclude
from the available data whether a decrease in temperature from 600 to 550°C, raised the life
by 1.25 times or, ignoring the effects of temperature, material in as-received condition was
superior.
Various hold time data were normalized by continuous fatigue data in terms of NCR
and presented with total strain range in Fig. 5.5. As the NCR of various tensile dwell cycles
was much less than one, the material was tensile dwell sensitive. Since no compressive hold
time data was available, and the normalized cycle ratios of tensile hold data were less than
one, it was considered to be a tensile dwell sensitive material.
5.3.1.4. Steel No. 4: This is a compressive dwell sensitive material, where compressive
dwell at a strain range and temperature causes more damage than the dwell in the tension
direction (33). Challenger et al (54), explained that a possible reason for such behaviour
was mainly oxidation of the material. The oxide cracking that occurs in the case of 2.25Cr-
lM o steels was a function of strain range, temperature and time of hold in peak compressive
loading direction. Later evidence for oxidation at 593°C of this alloy was reported by
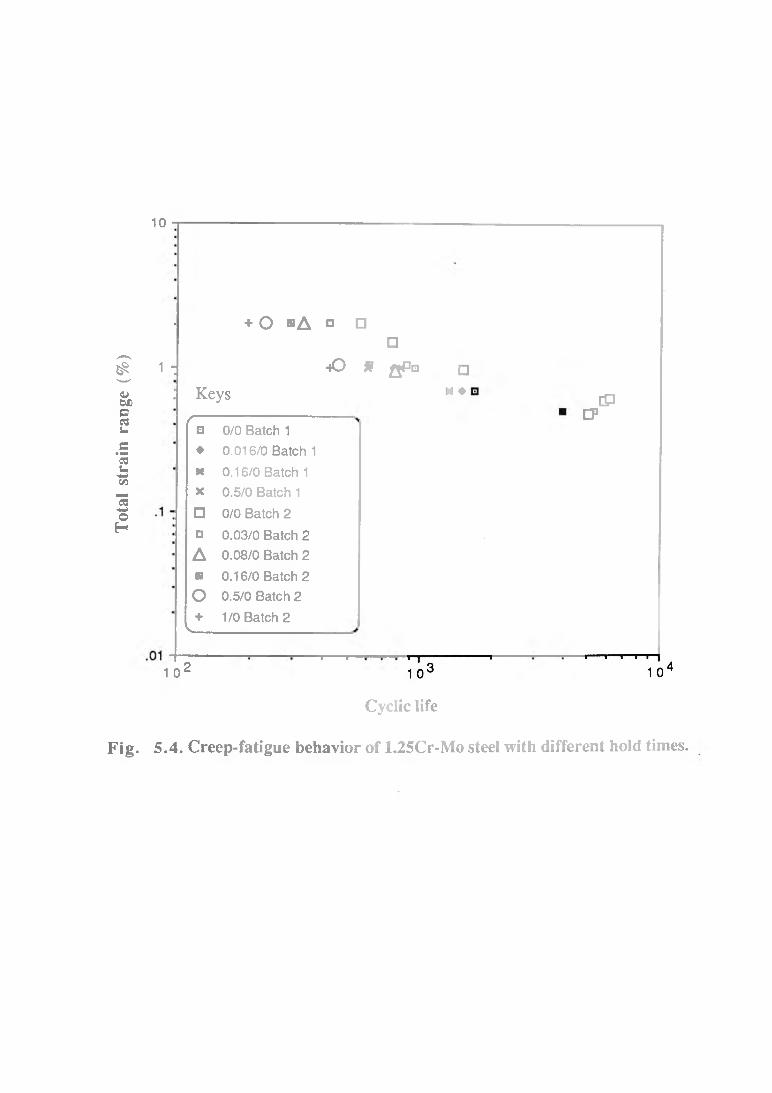
Tot
al s
trai
n ra
nge
(%)
10
■ + O " A ° □□
1 : - O f f q Pd □
: Keys « ♦( —
□ 0/0 Batch 1• 0.016/0 Batch 1M 0.16/0 Batch 1X 0.5/0 Batch 1□ 0/0 Batch 2□ 0.03/0 Batch 2A 0.08/0 Batch 2H 0.16/0 Batch 2o 0.5/0 Batch 2+ 1 /0 Batch 2
V____________________
- I I1 o 2
dPCP
Cyclic life
Fig. 5.4. Creep-fatigue behavior of 1.25Cr-Mo steel with different hold times.

Tota
l S
trai
n R
ange
(%
)
10! r+ 0.0166 Hr (t/0) 550 deg. C.
! K 0.167 Hr (t/0) 550 deg. C.
’ n 0.5 Hr (t/0) 550 deg. C.
x 0.03 Hr (t/0) 600 deg. C.
\
-
• A
- A •
m o x
G X D + M
X +
a .rO 0.08 Hr (t/0) 600 deg. C. ̂
□ 0.167 Hr (t/0) 600 deg. C.
• 0.5 Hr (t/0) 600 deg. C.
' a 1 Hr (t/0) 600 deg. C.^ J
“ ;
10 - 11 0 -1 10°
N/ (hold time) / N/ (0/0)
Fig. 5.5. Normalized life ratio of various dwell cycles of 1.25Cr-Mo steel.

61
Teranishi and McEvily (57) and Narumuto (6.4). A threshold in the temperature range was
observed (33,64), above which the oxidation damage occurred. This temperature was found
to be 450°C in (33) and was lower (250 - 350°C) for 2.25Cr-Mo steel (64).
Apart from a threshold in temperature there also was a hold time criterion, below
which life debit did not occur. Five minutes tensile and compressive holds were compared
with continuous fatigue data in Fig. 5.6 tested at 600°C for 2.25Cr-Mo steel (53) "batch" 3.
Creep-fatigue lives under such hold periods were between the maximum and mean response
of continuous fatigue behaviour.
Creep-fatigue life for various dwell data were normalized by continuous fatigue data
and NCR with total strain range was presented in Fig. 5.7. As the normalized cycle ratio for
various tensile dwell containing cycles was more than compression dwells, the material was
compressive dwell sensitive.
5.3.1.5. Steel No. 5: Only two batches of creep fatigue data were available with several
hold times and continuous fatigue combinations with only two tests conducted for every
condition. The best fit equations determined from two data points are questionable and
should not be extrapolated for other total strain range and life combinations. Creep-fatigue
data for 9Cr-lM o steel are shown in Fig. 5.8.
Creep-fatigue life under various dwell cycles were normalized by continuous fatigue
life and presented with total strain range in Fig. 5.9. Since there were no compressive hold
time data and the normalized cycle ratio of various tensile dwell containing cycles were much
less than one, the material was assumed tensile dwell sensitive.
5.3.1.6. Effects of combined cycles on Steel No. 2: A combined cycle comprised
in addition to a tensile dwell, a specified number of pure fatigue cycles represented by n, as
shown in Fig. 4.2, in Chapter 4. Combined cycles were applied after a tensile hold of 23 and
47 hours in (47-48). The effects of combined cycles on creep-fatigue performance of "batch
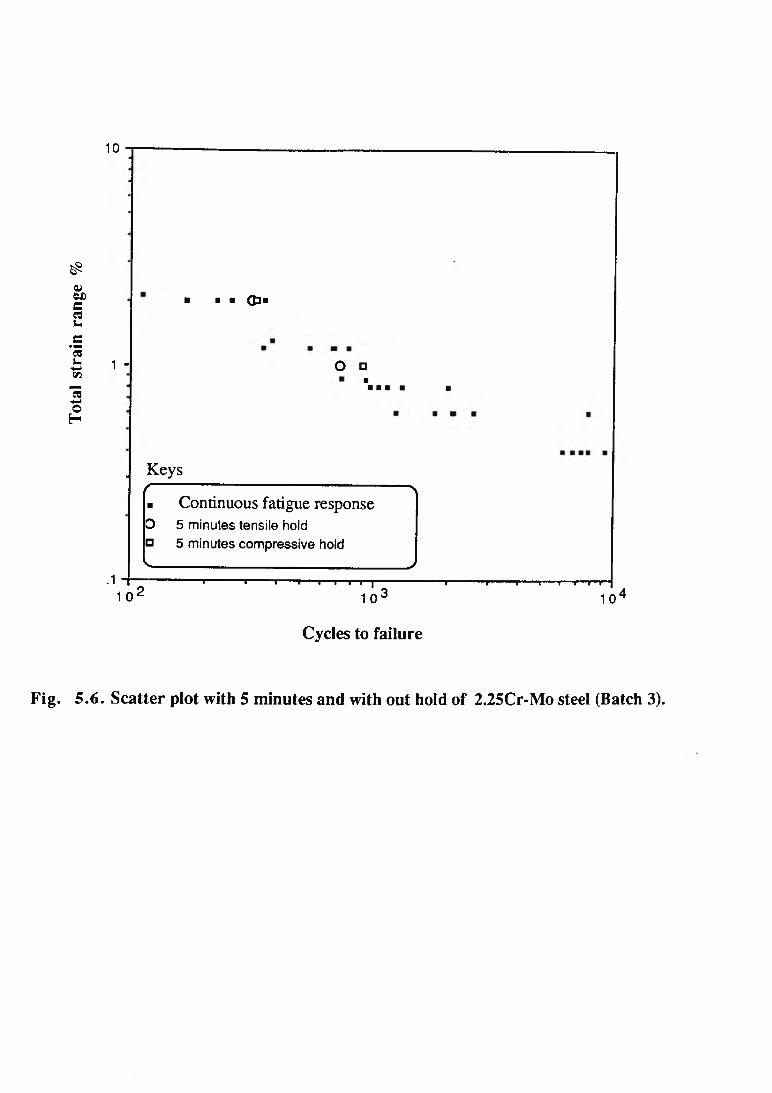
Tot
al s
trai
n ra
nge
%
10
■ ■ ■ CD*
1 - O
. Keys( ] ----------------------\■ Continuous fatigue responseO 5 minutes tensile hold□ 5 minutes compressive holdV-------------------------------------------------)
.1 - I ■ . « ■—I I i i I — I T— r r I— I— I I
10 2 1o 3 1o4
Cycles to failure
Fig. 5 .6 . Scatter plot with 5 minutes and with out hold of 2.25Cr-Mo steel (Batch 3).

Tota
l S
trai
n R
ange
(%
)
10
JA 47 Hrs. (t/0) 540 deg. C. A.
□ 23 Hrs. (t/0) 540 deg. C. A.•N_______________________
10° H
10 * 1
AD
O 47 Hrs. (t/0) 540 deg. C.N&T.
+ 23 Hrs. (t/0) 540 deg. C. N&T.
O HAD
N f hold cycles = N f 0/0
1 o -3 1 0 -2i i i i 11
1 0 - 1 1 0
N/(Hold cycles)/ N/(0/0)
Fig . 5 .7 . Normalized life ratio of various dwell cycles of 2.25Cr-Mo steel.
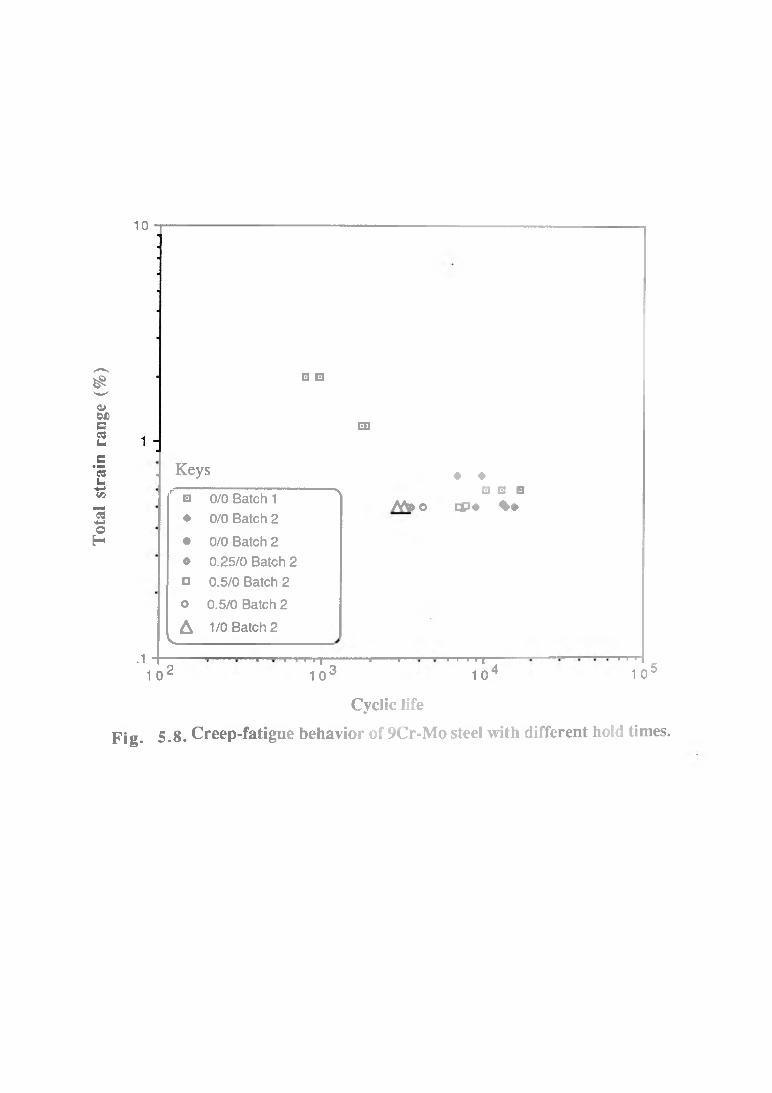
Tot
al s
trai
n ra
nge
(%)
10
. Keys
□ □
r □ 0/0 Batch 1 — \
♦ 0/0 Batch 2
• 0/0 Batch 2o 0.25/0 Batch 2□ 0.5/0 Batch 2o 0.5/0 Batch 2
A 1/0 Batch 2V____
.1 "I - n - . y I ! ! I1 0 2 1 0 3
EE
T
♦ ♦□ □ □
Ato o Epo %#
T 1 1 ■ T1 o 4
V I I
1 0 5
Cyclic life
F ig . 5.8. Creep-fatigue behavior of 9Cr-M o steel with different hold times.
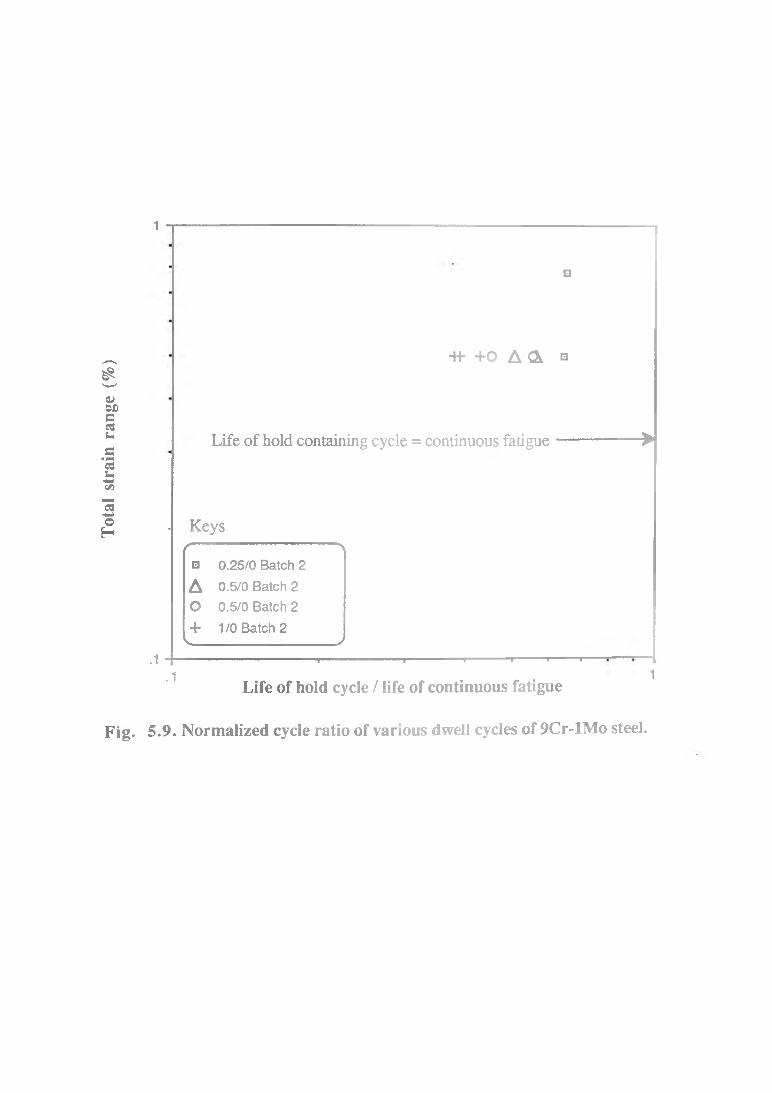
Tot
al s
trai
n ra
nge
(%)
1
□
+»- + 0 A & s
Life of hold containing cycle = continuous fatigue----------------►
. Keys/ — — \
□ 0.25/0 Batch 2
A 0.5/0 Batch 2o 0.5/0 Batch 2+ 1 /0 Batch 2
V, J.1 -|--------------------------- 1----------------1-----------1-------- ------- ■ ■
.1Life of hold cycle / life of continuous fatigue
1
Fig. 5.9. Normalized cycle ratio of various dwell cycles of 9Cr-lM o steel.

62
1 and 2" are tabulated in Table 5.2. Continuous fatigue behaviour were compared with
tensile hold data for 23 and 47 hours where number of pure fatigue cycles ranging from n=l
to 22.5 were applied. Life lowered 311 times from continuous fatigue data for test
combinations of a 47 hours hold at 485°C with (n=l) when the total strain range was 0.55%.
At the same strain range and 540°C the life reduced by 170 times from continuous fatigue
behaviour shown in Table 5.3. However, with 1.5% strain range at 540°C with 23 hour
hold time and n= l, the life was 24 times lower than continuous fatigue performance shown in
Table 5.4. When the number of fatigue cycles was increased from 1 to 22, the creep-fatigue
life decreased with respect to n=l data. A maximum beneficial effect was observed when
number of pure fatigue cycles was from 1 to 5.5. In the case of n=22, a decreasing trend in
life compared with n=l was observed. The effect of combined cycles for Steel no. 2 are
tabulated in Tables 5.2-5.4.
Table. 5.2. Effect of combined cycles on the performance of lCr-Mo-V steel.
Strain
range %
Hold time
hrs.
Temp.
°C
Nf no. of fatigue
cycles (n)
Life Increase
from 47 hr.
and n=l
Life Debit
from 0/0
data
0.55 0 483 8400 0 .
0.55 47 485 27 1 311
0.55 47 483 96 1.5 3.55 87.5
0.55 47 485 149 2 5.51 56.4
0.55 47 483 149 2.5 5.37 58
0.55 47 485 48 22 1.7 175

63
Table. 5.3. Effect of combined cycles on the performance of lCr-Mo-V steel.
Strain
range %
Hold time
hrs.
Temp.
°C
Nf no. of fatigue
cycles (n)
Life Increase
from 47 hr.
and n=l
Life Debit
from 0/0
data
0.55 0 538 5105 0
0.55 23 540 29 1 170
0.55 23 538 157 5 5.4 32.5
0.55 23 540 130 22 4.48 39.3
Table 5.4. Effect of combined cycles on the performance of lCr-Mo-V steel.
Strain
range %
Hold time
hrs.
Temp.
°C
Nf no. of fatigue
cycles (n)
Life Increase
from 47 hr.
and n=l
Life Debit
from 0/0
data
1.5 0 538 520 0 _1.5 23 540 22 1 23.63
1.5 23 538 68 5.5 3.09 7.64
1.5 23 540 11 22 0.5 47.27
5.3.1.7.: Effect of Combined Cycle on Steel No. 4: The effects of combined
cycles in the case of a 2.25Cr-Mo steel were quite similar to those observed for a lCr-Mo-V
steel. Very limited data for the 2.25Cr- IMo steel were available in the annealed condition that
were analyzed collectively from "batch 1 & 2", and presented in Table 5.5.
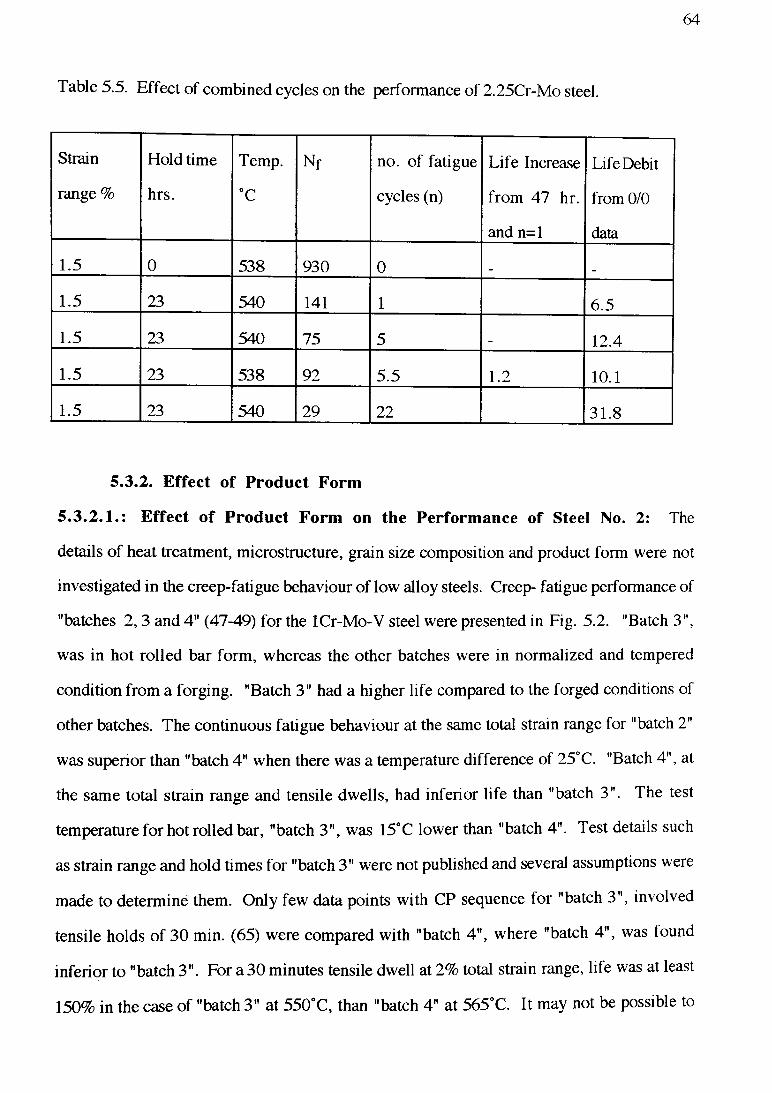
64
Table 5.5. Effect of combined cycles on the performance of 2.25Cr-Mo steel.
Strain
range %
Hold time
hrs.
Temp.
°C
Nf no. of fatigue
cycles (n)
Life Increase
from 47 hr.
and n=l
Life Debit
from 0/0
data
1.5 0 538 930 0
1.5 23 540 141 1 6.5
1.5 23 540 75 5 12.4
1.5 23 538 92 5.5 1.2 10.1
1.5 23 540 29 22 31.8
5.3.2. Effect of Product Form
5.3.2.1.: Effect of Product Form on the Performance of Steel No. 2: The
details of heat treatment, microstructure, grain size composition and product form were not
investigated in the creep-fatigue behaviour of low alloy steels. Creep- fatigue performance of
"batches 2 ,3 and 4" (47-49) for the lCr-Mo-V steel were presented in Fig. 5.2. "Batch 3",
was in hot rolled bar form, whereas the other batches were in normalized and tempered
condition from a forging. "Batch 3" had a higher life compared to the forged conditions of
other batches. The continuous fatigue behaviour at the same total strain range for "batch 2"
was superior than "batch 4" when there was a temperature difference of 25°C. "Batch 4", at
the same total strain range and tensile dwells, had inferior life than "batch 3". The test
temperature for hot rolled bar, "batch 3", was 15°C lower than "batch 4". Test details such
as strain range and hold times for "batch 3" were not published and several assumptions were
made to determine them. Only few data points with CP sequence for "batch 3", involved
tensile holds of 30 min. (65) were compared with "batch 4", where "batch 4", was found
inferior to "batch 3". For a 30 minutes tensile dwell at 2% total strain range, life was at least
150% in the case of "batch 3" at 550°C, than "batch 4" at 565°C. It may not be possible to
65
address if a temperature increase of 15°C reduced creep-fatigue life for "batch 4", or material
condition for "batch 3" enhanced creep-fatigue performance. A conclusion may be drawn
from Fig. 5.2, that though there were differences in the testing parameters and material
conditions, "batch 3" had higher lives in a ferritic form at the same strain range and tensile
dwells, compared with the tempered bainitic form of "batch 4".
5 .3 .2 .2 E ffe c t of Product form on the Performance of Steel No. 4: "Batches
1 and 2" (47-48) were characterized with identical material conditions, heat treatments,
compositions and the test parameters. At same total strain range and temperature, material in
the annealed condition had longer lives than the normalized and tempered (N&T) condition.
At 0.55% total strain range for quenched and tempered (Q&T) tested at 485°C the creep-
fatigue behaviour was found superior than N&T and annealed conditions tested at 55°C
higher temperatures. A cross over in the behaviour was observed at a strain range of nearly
1% for both N&T and annealed conditions, below which Q&T was found superior as shown
in Fig. 5.10. However, a temperature difference of 55°C was quite considerable and no
conclusion should be drawn from such trends.
5.3.3. Effects of composition
5.3.3.1. Effects of composition on the performance of low alloy steels: Low
alloy steels are investigated in the order of percentage chromium content from 0.5 to 9 they
are 0.5Cr-Mo-V, lCr-Mo-V, 1.25Cr-Mo, 2.25Cr-Mo, 2.25Cr-Mo-V and 9Cr-lMo steels.
Creep-fatigue behaviour of these alloys with or without hold periods, are shown in Fig.
5.11. Limited data points are analyzed in Fig. 5.11 which show the scatter in the creep-
fatigue data. In general, the creep-fatigue performance of materials improved with the
increase in chromium content. Isolating several factors such as temperature differences,
material conditions, strain rates and microstructures, properties of lCr-Mo-V steel was at the
lower extreme. Better properties were found with the increase in chromium to 9%.

Tot
al s
trai
n ra
nge
(%)
10
Fig .
M» □
K ♦ □
1 -
□ Annealed ♦ N&T « Q&T
1 00 1000
Cyclic life
♦ □ N
I I I I I I ■! ' '10000
.10. Effect of heat treatment on the creep-fatigue performanceof 2.25Cr-Mo steel.

10
$o>W)c03u
09uVi13wOH
1 -
.1
V
— \— f l — 1 Cr-Mo-V (Batch 3)
*—D ~ 1 Cr-Mo-V (Batch 1&2)
1.25Cr-Mo (Batch 1 )
— - 1.25Cr-Mo (Batch 2)•..... 2.25Cr-Mo (Batch 3)
— x .... 2.25Cr-Mo (Batch 6)V J
•■ û > \ •-.•Qk "K .9Cr-1 Mo Steel
1 Cr-Mo-V Steel•O"
■ o
-A -
2.25Cr-Mo (Batch 7)
2.25Cr-Mo-V (Batch 8)
9Cr-1Mo (Batch 1)
1 0 1 0 10 1 0
Fig. 5
Cyclic life
11. Effect of composition on the creep-fatigue behavior of low alloy steels.
66
5.3.3.2.: Effect of vanadium on creep-fatigue behaviour of Steel No. 4:
"Batches 7 and 8" (57) were investigated to determine the effect of vanadium on the
HTLCF properties o f 2.25Cr-Mo steel as shown in Fig. 5.12. With the inclusion of
vanadium in 2.25Cr-Mo steel, the HTLCF life deteriorated. This observation was on the
basis o f only two data sets, (Batch no. 7 and 8) with limited creep-fatigue tests. Therefore,
additional data (several batches) will be needed to validate such a hypothesis.
Nevertheless, the inferior life with vanadium addition was hypothesized from
monotonic properties of both the materials. The yield and the tensile strength of the alloy
improved with the increase in the total element addition in 2.25Cr-Mo-V steel. With the
increase in element addition, modulus (E) and proof strength increased. As strength
increased the ductility and % elongation decreased as shown in Table 5.6. Under total
strain control testing, plastic strain reduces with the increase in strength achieved by
element additions. The saturated stresses at half-life in the case o f 2.25Cr-Mo-V steel were
50 to 75 MPa higher than at the similar strain ranges for 2.25Cr-Mo steel. As a result,
mean stresses in the 2.25Cr-Mo-V steel were higher than the 2.25Cr-Mo steel. Such
behaviour was also observed for a titanium alloy IMI 829 and a superalloy MAR M 002
under HTLCF, where the plastic strain per cycle reduced and enhanced retained mean
stresses (26, 66). The same was observed also in 2.25Cr-Mo-V steel, when increased
strength resulted in lower plasticity. Retained mean stresses caused life shortening effects,
however, compared with the 2.25Cr-Mo steel, which has more plastic strains and less
mean stresses in Table 6, 2.25Cr-Mo-V steel performed inferior under HTLCF.
Table. 5.6. Monotonic properties o f the 2.25Cr-Mo steel (57).
Alloy Temperature YS MPA UTS MPa % Elongation
2.25Cr-Mo RT 470 597 20
-do- 593 305 334 34.5
2.25Cr-Mo-V RT 620 720 18
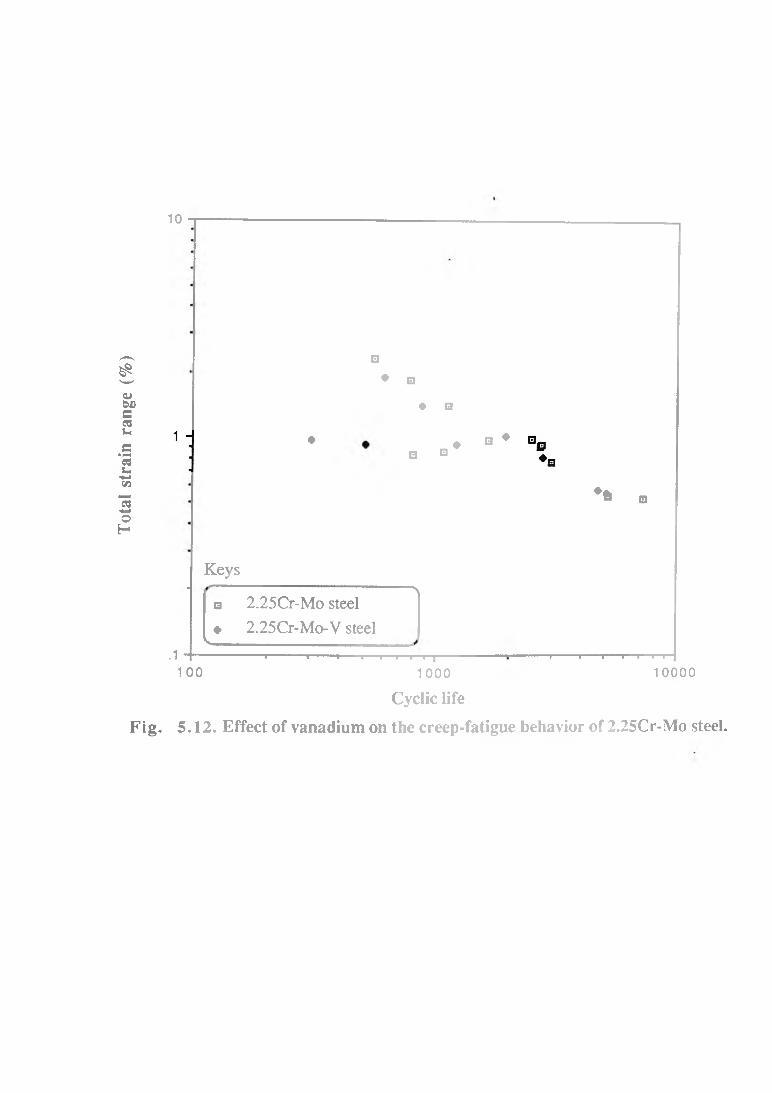
Tot
al s
trai
n ra
nge
(%)
10
□♦ □
♦ □
♦□ □ ♦ □ •
♦ä □
Keys■ ----------------------------------------------------------\□ 2.25Cr-Mo steel♦ 2.25Cr-Mo-V steel
v_________________________. 1 ” i — — i------------------- 1----------------- 1 i i i — i ■ »■ | — i i 1— — i— i— i i
100 1000 10000
Cyclic life
Fig. 5.12. Effect of vanadium on the creep-fatigue behavior of 2.25Cr-Mo steel.
67
-do 593 443 456 26.5
5.4. SUMMARY
The following trends were observed:
(1) isolating variations in the materials arising from microstructures, N&T heat treatments
and test parameters such as temperature and strain rate, the creep-fatigue response of
low alloy steels improved with the increase in chromium content,
(2) dwell sensitivity of low alloy steels with hold times in either tension or compression
and associated life debits were different for different low alloy steels,
(3) vanadium additions to a standard 2.25Cr-Mo alloy, caused deterioration to the high
temperature creep-fatigue response, and
(4) there was a limiting value in the test temperature, direction of hold time and the strain
rate above which only the life debit occurred for 2.25Cr-Mo steel.

68
6. CREEP - FATIGUE LIFE PREDICTION : METHODS AND TRENDS
Creep-fatigue data for low alloy steels were compiled and presented in Chapter 4. Using
these data, trends in the creep-fatigue behaviour of low alloy steels were identified in Chapter
5. The inform ation presented in Chapters 4 and 5 are used, in general, to develop
"phenomenological” life prediction methods. A review of existing life prediction methods
within the phenomenological framework is provided in Chapter 6. As every life prediction
method requires different types of creep-fatigue data and material parameters, knowledge of
creep-fatigue test requirements for different methods is very important to the design of
experimental programs. Details of test requirements and material parameters are not critically
examined for different life prediction methods in the open literature. Capability of life
prediction methods assessed by various workers for different batches of six low alloy steels
were aggregated to identify trends in the life prediction of various methods in this Chapter.
6.1. INTRODUCTION
Development of a reliable life prediction method for creep-fatigue interactions is very
important to the conduct of structural analyses and the prediction of lifetimes of engineering
components operating at high temperature. Development of life prediction approach requires
creep-fatigue data bank. Much of creep-fatigue data is classified and not available in open
literature. There also is a lack of publications describing the analysis of a life prediction
method with creep-fatigue data. Presently, there are only two publications (15-16) that
describe the analysis of life prediction for low alloy steels. Two low alloy steels of the type
lCr-M o-V and 2.25Cr-M o were assessed in those publications to compare the prediction
capability of methods with each other. Hence publications (15-16) play a key role in
discussion of the applicability of life prediction methods.
Two reviews (67, 68) were published on the methods of life prediction and analysis
conducted for low alloy and stainless steels, however, neither examined the capabilities of
69
methods for life prediction with an international data bank. Hence, to overcome this
deficiency, prediction capabilities of various methods (5-14, 69-91) for different "batches"
of the same and six low alloy steels are examined in this Chapter. Comparison of prediction
capability for different methods under a range of conditions such as test temperature, hold
time and material conditions will be useful in applying methods of life prediction or
identifying where a method will be more suitable.
6.2. REVIEW OF LIFE PREDICTION METHODS
6.2.1. Linear Damage Summation
Conceptually this method was similar to the linear damage summation technique proposed
by Miner (69) for fatigue analysis. Life prediction under creep-fatigue was proposed by
Robinson (70) and modified by Taira (71). Damage under creep-fatigue utilizes linear
summation of time dependent creep fraction and time independent fatigue fraction
separately. Damage culminates to final failure when the linear summation of fraction creep
and fraction fatigue becomes unity. The fatigue or cycle fraction, is a ratio of number of
cycles (n) at a stress or strain level with cycles to failure (N/ ) at the same loading
conditions, whereas, the creep or time fraction is a ratio of time of hold (t) with time to
rupture (tf), at same loading conditions. Equation 6.1 shows the linear damage summation:
S n / N f + £ t /tf = D = 1 at failure (6.1)
where, n / and t / 1̂ are cycle and time fractions respectively. Linear damage summation
method was accepted by the American Society of Mechanical Engineers as a code in the
design of pressure vessel and piping under Code Case N 47 1597 (5). Deficiencies were
observed in the life prediction of balanced dwell cycles since this method assumed same the
time fractions for tension and compression dwells. Hold times at very low strain ranges in
peak tensile direction produced a damage parameter (D) much less than unity. Interaction
effects among creep and fatigue and others were unaccounted, which, in the case of 2.25Cr-
lMo, reduced the creep-fatigue life (35) when hold was applied in compression direction.
70
6.2.2. Frequency Modified and Frequency Separation Approach
To account for the environmental and other time dependent effects, Coffin (72-74) introduced
time effects in the Coffin-Manson relationship by a frequency term . Thus the Coffin-
Manson equation {Aep = Q(Nf)-a }becomes
Aep = Ci (Nf. v k-1)"01 (6.2)
where Aep is plastic strain range, Nf is cyclic life, v is frequency, and Ci, k and a are material
parameters. Life for complex creep-fatigue cycles were predicted using material parameters
determined from continuous fatigue data and other test types. Thus, with the frequency term
in equation 6.2, and transferring strains in terms of stress by the Basquin relation, several
expressions for life prediction could be obtained.
for hold time cycles:
For test types the required Basquin stress-strain equation was:
A ' ( N f) ' P ' v K' = A a (6.3)
where, K', p' and A' are material parameters that can be obtained by conducting regression
analysis of the stress range and cyclic life data on log-log scale. The number of cycles to
failure (N^) is given by:
Nf = (A' / Aarf) 1/P ' [v t , 2]K '7 P ' (6.4)
where Aasf is stress range with unequal ramp rates and vt is the tensile frequency. The
frequency is separated in tension and compression in equation 6.4 and the predicted life was
good for simplified cycles. Further modifications were made to enable the applicability of
this method for unequal ramp rates and for hold time cycles.
Life prediction for unequal ramp rate cycles:
The frequency modified approach was found to be not effective for prediction of creep-
fatigue life when there were unequal ramp rates in which strain rates in tension and
compression (9) were different. It was assumed that the damage occurred only during the
tensile part of the cycle in a hysteresis loop. However, such an assumption is inappropriate

71
for dwell sensitive materials in which damage caused by a hold cycle was more in one
direction compared to the same hold applied in other. The equation for stress range (Aa f) for
unequal ramp rate cycles was partitioned in terms of frequency in tension or compression
directions in frequency separation approach, as follows:
Act f = 0.5 A" Asp [(v , /2)K1 +(v </2)Kl ] (6.5)
where, A", n' and K i were coefficients of the Basquin relation obtained from unequal ramp
rates data:
A a = A" Aep n v ^1 (6.6)
The use of unequal ramp rates as equivalent to hold times is quite questionable. Therefore, a
further modification was made by Coffin in terms of frequency separation approach.
Frequency separation approach:
Frequency separation approach requires coefficients from balanced loops with equal tension
and compression holds are accounted for by separating the tensile and compressive strain
rates. The material parameters in the above model were determined from continuously cycled
tests and also from some hold time tests that may be applied to any complex creep-fatigue
cycle for life prediction in equation 6.7.
N f = [ F/A8p] i ;P ' [vt / 2] ! -K [vc/ v t ] d (6.7)
In the equation 6.7 v, p' and K are material parameters obtained from balanced loop data and
d was obtained from unbalanced hold data to predict life for hold time cycles.
Frequency modified and separation models were criticized for under-predicting the
life. The damage produced by a tensile hold was considered to be the same irrespective of the
location in a cycle where a hold was applied. Tensile mean stresses were not accounted that a
compressive hold cycle produced. With increasing peak tensile hold this method predicted
shorter life, that may not be the case as the opposite was found in the case of SS 304 (9),
2.25Cr-Mo (35) and superalloys (34), where a tensile hold was less damaging compared to
compressive holds.
72
6.2.3. Strain Range Partitioning Technique
Manson, Halford and Hirschberg (7) developed a technique known as strain range
partitioning (SRP) in which plastic fatigue (P) and inelastic creep (C) strains were separated
in a hysteresis loop. Representation of strain components in two directions resulted in
combined PP, PC, CP or CC loops so that four base-line relationships were involved in
describing combinations of plastic and inelastic strains with respect to cyclic life. Strain
components AEpp, AEpC, Ae^ and A£Cp represented the combination of strains where the
subscripts denoted p for plasticity and c for creep and the first subscript refers to be in tension
direction and the second refers to the compression direction.
Representation of life was made in terms of the Coffin-Manson equation
N-=A-A e- ij a ij a e ij
(6.8)
where N -, Ay and Ae-j is cyclic life, a material constant and the strain range respectively, 0 is
slope and ij refers to plasticity (p) or creep (c) combinations.
Damage fractions, Fy were added by an interacting damage rule.
F\\ = F IN + F IN + F IN + F IN U PP PP pc pc cc cc cp cp
i.e., Fy=AEjk/AEln
where Ae- . was the inelastic strain rangeHi,
Asin = A e^+A e^+A e^+A e
(6.9)
(6.10)
The technique, SRP was criticized for the difficulty in partitioning the loop and the omission
of environmental terms in the damage criterion. Bounds on life relationships generated with
four baseline strain combinations such as PP, PC, CP and CC, where PP, PC, CP and CC
response determined a particular combination was the the most damaging. Behaviour of four
baseline strain-life relations when observed as parallel lines one of them was considered
representing service condition in the design. For gas turbine blade materials such as IN 100
and MAR M 200, these combinations coincided (76) and helped as a design criterion.
However, for other materials such as stainless steels and some low alloy steel, for example,
2.25Cr-Mo and 9Cr-lM o steels, these lines intersected (33) and posed difficulties in selecting

73
a particular line appropriate to the service condition. This model was further modified as a
total strain version of SRP (77) to account for mean stresses, low strain range and long hold
time situations.
6.2.4. Damage Rate Approach
Majumdar and Maiya (9, 78-79) developed damage rate approach in which it was assumed
that, under high temperature fatigue, the rate of fatigue or creep damage accumulation
depended upon plastic strain rate. Damage was thought to be micro crack growth, which
occurred differently under tension and compression from an initial length (a*)) to a final length
(a/). Scaling factors in tension (T) and compression (C) were introduced, as follows:m . k
da/dN = a [T] [e ] [8 ] (in the presence of tensile stress)r r
m . kda/dN = a[C] [e ] [8 ] (in the presence of compressive stress) (6.11)
r r
where m and k are material parameters which remain constant over a range of plastic strain
rate 8 p and plastic strain range AEp. Scaling factors T and C were introduced to account for
the differences in crack growth rate (da/dN) that occurred under tension or compression
holds. Crack growth by fatigue and cavity growth by creep were dealt with independently.
The cavity growth equation was expressed as follows:
1/ c da/dt = G [sp]m [e p]k' (6.12)
where c is the cavity size, t the test duration and G is a material constant.
Material parameters of the equations 6.11-6.12 are determined from completely reversed
cycle data at different strain rates. However, prediction of longer hold time data required
hold time tests to determine the material parameters of the equation 6.11-6.12.
6.2.5. Damage Function Method
The change in internal energy per unit volume of material in a time interval from 0 to a
particular time t or (0, t) was assumed to be a measure of damage, as follows:
U = / a ij a ij 8 ij dt - / h dt (6.13)
74
where a y and hy are shape factors where the former corrects a distorted hysteresis loop,
whereas latter term accounts for the heat generated in plastic deformation respectively.
Morrow (80) proposed that hysteretic energy per cycle be considered as a measure of fatigue
damage in equation 6.14.
C = AW Nf v (6.14)
where, AW is an energy term, C is a material constant and v the frequency.
Damage function model was developed within the premise that the energy of a
hysteresis loop contributes to damage. Only tensile part of a hysteresis loop was assumed to
contribute to damage (10) since the crack tip remained open during tensile half loading.
There was also a limiting value of tensile energy above which damage accumulated and below
that limiting value closure occurred. For a strain controlled, low cycle fatigue test, since
identification of closure limit line was difficult, it was proposed (10) to consider the total
tensile energy as damaging.
Ostergren (10) introduced a damage function, a a T A ep where the product of stress
and strain or the energy was used in frequency modified equations as follows:
C = a a T A s p N f P v ^ K-1) (6.15)
where C, p, and k are material parameters, O j the maximum tensile stress and a is a shape
factor. Since equation 6.15 considered the energy term which was difficult to define, life
predicted by this method was also depended upon type of creep-fatigue cycle.
6.2.6. Damage Parameter Approach
Historically, Kachanov (81) described creep rupture behaviour in terms of a damage
parameter (co), which was related to the cavitated area fraction of grain boundaries. The
damage parameter was unity at failure and zero for the virgin or undamaged condition. To
describe the damage parameter, the concept of material continuity (^) was introduced which
was unity when there was no damage for the virgin condition and zero at failure. The change
of continuity was expressed by Kachanov as:

75
dip/dt = -A (a/oj)n (6 16)
where (a/co) is an effective stress term and a is the nominal stress. Equation 6.16 can be
integrated between extremes of the virgin and failure conditions. The damage under creep-
fatigue interactions was described by the rate of damage accumulation, a function of effective
stress:
dcu/dt = / [ a / (l-o))] (6.17)
This concept has been explored further in the literature (82-83). Chrzanowski (8) proposed
damage parameter approach based upon the above damage concepts of equation 6.17
assuming that:
(1) damage comprised time dependent and time independent parts,
(2) damage by fatigue increased as stress increased, whereas in creep damage increased by
both positive and negative stress rates, and
(3) rates of fatigue and creep damage were zero under negative stresses in compression
directions.
Damage was considered to occur only under positive stress increments and the damage law
was expressed by a non linear equation which describes the rate of damage accumulation, as
a function of effective stress:
doa/dt = [ Co {a/(l-o))}voda/d t H (da) + C{a/ (l-a>) v}] H (a) (6.18)
The first and second terms represent fatigue and creep damage respectively, and Co, C, v0
and v are material parameters and H is the heaviside function of tensile stress. Life prediction
under creep-fatigue interactions by equation 6.18 can be performed by integrating a known
stress-time history to predict life.
6.2.7. Assessment Procedure R 5
Code R 5 was developed by the Nuclear Electric Inc., as "An assessment procedure for the
high tem perature response of structures" (11). The cyclic endurance of a component
subjected to an arbitrary cycle in which a dwell of any length may be present, can be
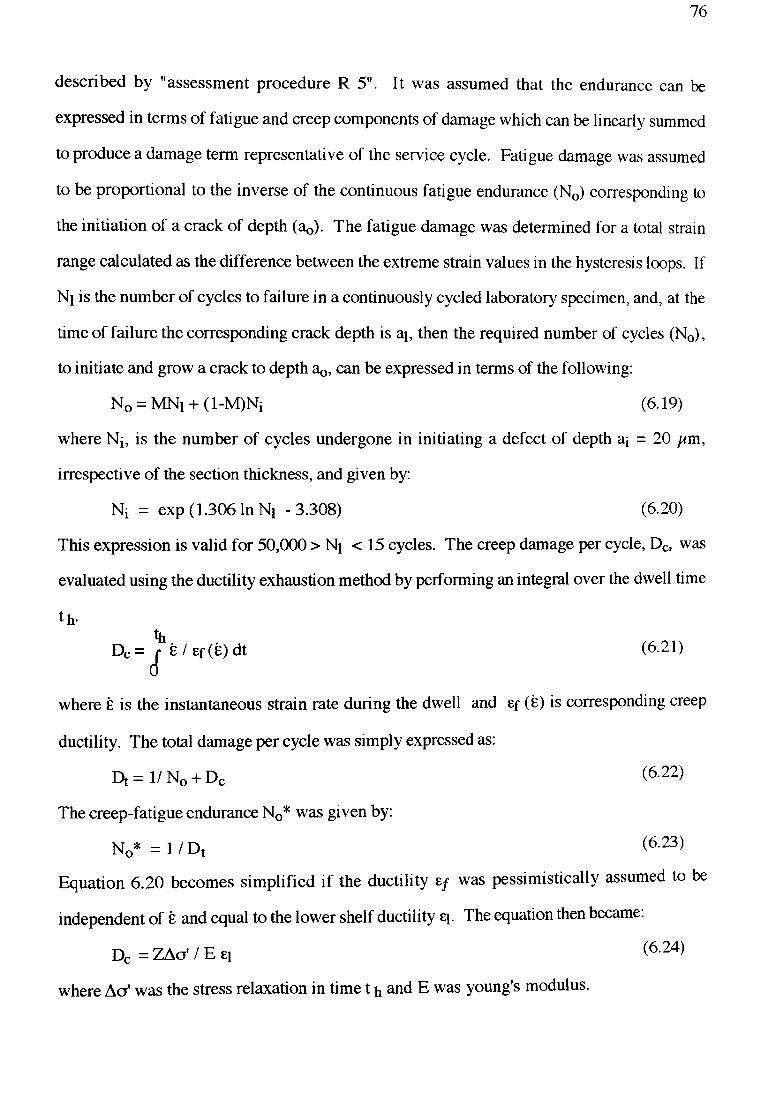
76
described by "assessment procedure R 5". It was assumed that the endurance can be
expressed in terms of fatigue and creep components of damage which can be linearly summed
to produce a damage term representative of the service cycle. Fatigue damage was assumed
to be proportional to the inverse of the continuous fatigue endurance (N0) corresponding to
the initiation of a crack of depth (a*)). The fatigue damage was determined for a total strain
range calculated as the difference between the extreme strain values in the hysteresis loops. If
Ni is the number of cycles to failure in a continuously cycled laboratory specimen, and, at the
time of failure the corresponding crack depth is ai, then the required number of cycles (N0),
to initiate and grow a crack to depth ao, can be expressed in terms of the following:
N0 = MNi + (l-M )Ni (6.19)
where Nj, is the number of cycles undergone in initiating a defect of depth ai = 20 jAm,
irrespective of the section thickness, and given by:
Ni = exp (1.306 In Ni -3 .308) (6.20)
This expression is valid for 50,000 > N\ < 1 5 cycles. The creep damage per cycle, Dc, was
evaluated using the ductility exhaustion method by performing an integral over the dwell time
t h*
Dc =hi
8 / Ef (8) dt (6.21)
where 8 is the instantaneous strain rate during the dwell and Ef (8) is corresponding creep
ductility. The total damage per cycle was simply expressed as:
D t = l / N 0 + Dc (6-22)
The creep-fatigue endurance N0* was given by:
N0* = 1 / D t <6-23)
Equation 6.20 becomes simplified if the ductility ef was pessimistically assumed to be
independent of 8 and equal to the lower shelf ductility q. The equation then became:
Dc = ZAo' / E ei (6 24)
where A o' was the stress relaxation in time t h and E was young's modulus.

77
Similarly if the dwell occurred in the compressive part of the cycle then equation 6.24
simplifies to:
Dc = ZAa' / Esu (6.25)
The arbitrary value of Z was estimated by:
calculating the 0/0 endurance (N0) from N\ (equation 6.19), and the
endurance N0*, including the effects of hold times, using
N0* = (1/No + ZD c)“1 (6.26)
where Dc calculated from Z =1 in equation 6. 25 and with higher values of Z, the life
prediction was found to be too pessimistic.
"Assessment procedure R-5" was assessed with very limited creep-fatigue data in (11), using
tensile hold times from 3 min. to 16 hours, and, sparingly with compressive holds.
6.3. EMPIRICAL METHODS
Empirical methods were pursued as an alternate to the phenomenological life prediction
models due mainly to the limitations in the use of phenomenological methods. One of these
models is the Diercks equation which has been successfully applied in the creep-fatigue life
prediction for low alloy steels.
6.3.1. Diercks Equation
Diercks and Raskey (12) compiled a bank of creep-fatigue data for stainless steel of type SS
304 and obtained a multivariate best fit equation for creep-fatigue life extrapolation in
regression functions of various test parameters as follows:
(log Nf)-1/2 = 1.20551064 + 0.66002143*S + 0.18040042 S*S - 0.00814329*S4 +
0.00025308 R*S4+ 0.00021832TS4 - 0.00054660 RT2- 0.005567RH2-
0.00293919HR2+ 0 .0119714H*T-0.00051639H2T2 (6.27)
with strain range parameter S = (As t / 100),
strain rate parameter R = ( log 8 ),
temperature parameter T = (Tc /100), and,
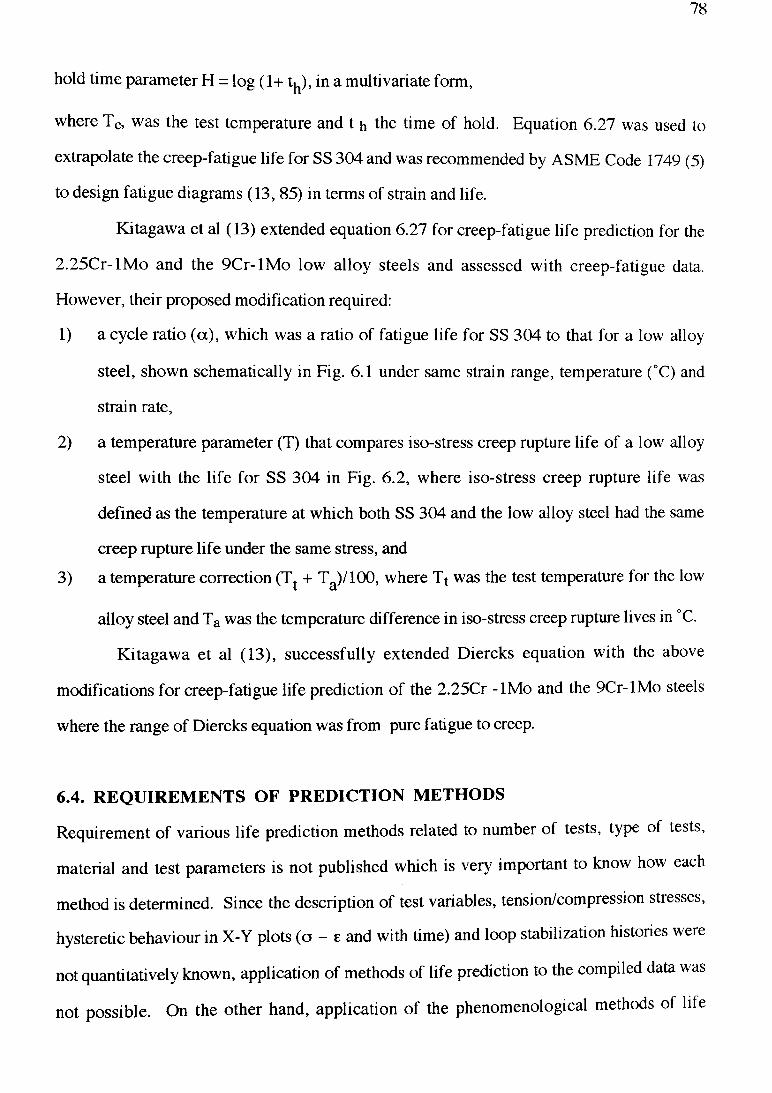
78
hold time parameter H = log (1 + 1^), in a multivariate form,
where Tc, was the test temperature and t h the time of hold. Equation 6.27 was used to
extrapolate the creep-fatigue life for SS 304 and was recommended by ASME Code 1749 (5)
to design fatigue diagrams (13, 85) in terms of strain and life.
Kitagawa et al (13) extended equation 6.27 for creep-fatigue life prediction for the
2 .25C r-lM o and the 9C r-lM o low alloy steels and assessed with creep-fatigue data.
However, their proposed modification required:
1) a cycle ratio (a ), which was a ratio of fatigue life for SS 304 to that for a low alloy
steel, shown schematically in Fig. 6.1 under same strain range, temperature (°C) and
strain rate,
2) a temperature parameter (T) that compares iso-stress creep rupture life of a low alloy
steel with the life for SS 304 in Fig. 6.2, where iso-stress creep rupture life was
defined as the temperature at which both SS 304 and the low alloy steel had the same
creep rupture life under the same stress, and
3) a temperature correction (Tt + Ta)/100, where Tt was the test temperature for the low
alloy steel and Ta was the temperature difference in iso-stress creep rupture lives in °C.
K itagaw a et al (13), successfully extended Diercks equation with the above
modifications for creep-fatigue life prediction of the 2.25Cr -IMo and the 9Cr-lM o steels
where the range of Diercks equation was from pure fatigue to creep.
6.4. REQUIREMENTS OF PREDICTION METHODS
Requirement of various life prediction methods related to number of tests, type of tests,
material and test parameters is not published which is very important to know how each
method is determined. Since the description of test variables, tension/compression stresses,
hysteretic behaviour in X-Y plots (a - e and with time) and loop stabilization histories were
not quantitatively known, application of methods of life prediction to the compiled data was
not possible. On the other hand, application of the phenomenological methods of life
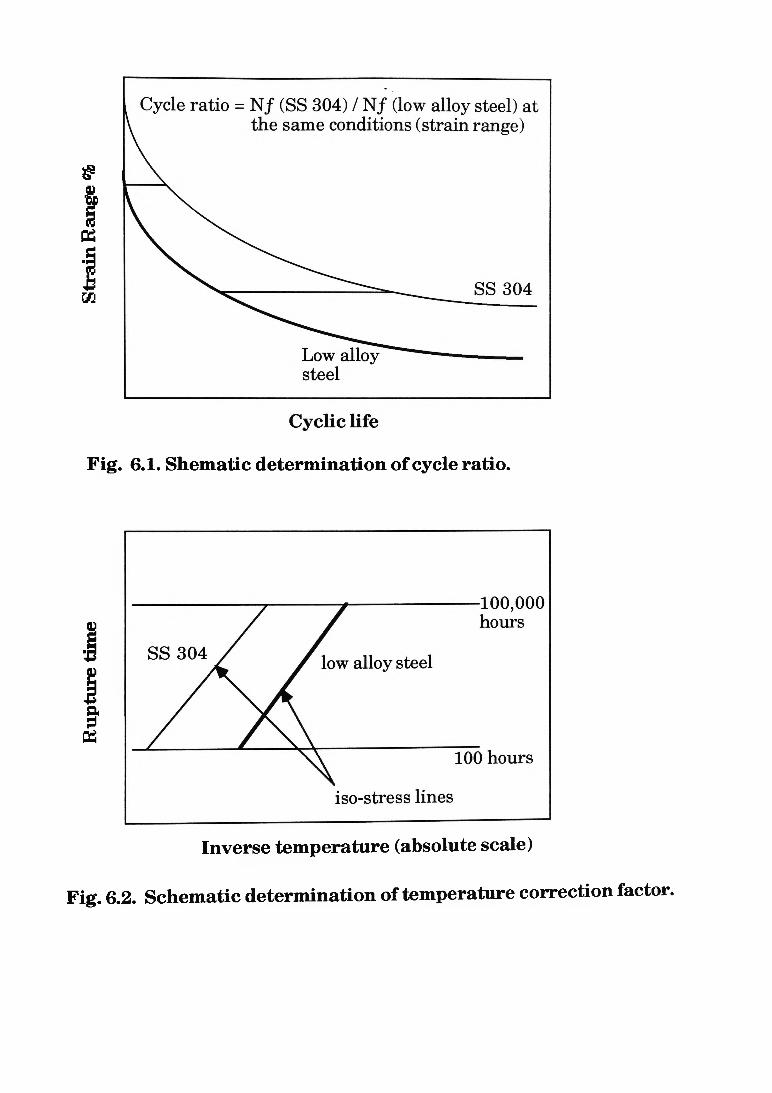
Rup
ture
tim
e ^
Stra
in R
ange
%
ig. 6.1. Shematic determination of cycle ratio.
Inverse temperature (absolute scale)
Fig. 6.2. Schematic determination of temperature correction factor.

79
prediction to creep-fatigue data requires a large number of test information, and material
parameters such as:
(a) creep rupture properties at the same test temperature employed in creep-fatigue, the
stress and time to rupture data provided two material parameters in each linear
behaviour as the trends were bilinear above or below a stress,
(b) stress relaxation with respect to hold time,
(c) total strain and life relationships provided four parameters representing elastic and
plastic behaviours,
(d) stress - strain relationships that provided two parameters,
(e) tests with balanced and unbalanced hold times and unequal ramp rates,
(f) apart from these, several parameters that may be needed to apply a method e.g.,
SRP needs 8 such parameters, inelastic strain with life components, and
(g) frequency - life data.
In the laboratory, creep-fatigue tests are conducted by controlling the total strain.
Under hold time waveform, when a hold is applied at constant strain, stress changes with
respect to time, where the stress is much higher at the begin of a cycle than at the end due to
stress relaxation. The log-log relationship between creep rupture time and applied stress is
often found to be a bilinear. Ellison and Walton (86), compiled such data for lCr-Mo-V
tested at 565°C. They observed a bilinear trend below or above 280 MPa. The ratio of two
slopes and intercepts (stress value at unit rupture time) was 2.15 and 2x10^0 respectively,
between stresses above and below 280 MPa.. A slight difference in stress resulted in a large
variation in the extrapolated rupture life. Also, creep rupture properties changed considerably
with slight increase in temperature. The iso-stress (15 Kgf/mm^) creep rupture properties in
the case of low alloy steels, varied from 50 to 105 hours in a temperature range of 485 to
590°C. Hence applicability of life prediction methods cannot be assessed with the material
parameters determined from one set of data.

80
Table 6.1 summarizes requirements of individual life prediction methods. Methods of
life prediction, conditions under which they apply.
Table 6.1. Constants of the phenomenological approaches.
M ethod o f life
prediction
Life prediction equation No. of constants (n) Details of the
tests
L i n e a r life
fraction
1 = Z n / N / + Z t / T r - strain -life data (4)
- creep-rupture (2 to 4)
0/0 tests (et-N/)
creep rupture°C.
stress relaxation
Frequency
modified
Approach
Nf = [ F/Aep] 1/P '
[vt/ 2jl k[vc v , ] d
-strain-life data (4)
- frequency vs. life (2)
- stress-strain (2)
0/0 tests,
some hold times
frequency -life
S t r a i n range
partitioning
N..=A..Ae.6jk IJ U U
ij represent PP, PC, CP
and CC loops.
four inelastic strain vs.
life relations. (2x4)
Tests producing
com plex loops
PP, PC, CP and
CC.
D a m a g e Rate
Approach.
( n o creep
damage)
da/dN = a [T] [ep]m £ k
P1 k da/dN = a[C][sp]m [8p]k
scaling factors (2)
strain -life (4)
strain rate-life (2)
assuming a crack size
0/0 tests,
metallographic
evidence,
hold time tests.
with creep 1/ c da/dt = G [ep]m [8
k'/
scaling factor in creep
cavity size(l)
strain-life and rate (6)
metallographic
evidence,
creep data, test
duration

81
Damage
function method
C = a T As p N f ^ v P(K"
1)
strain-life (4)
frequency-life (2)
stress-strain (2)
shape correction factor
0/0 data,
frequency data
stress-life data
hold time data.
Damage dco/dt = [ Co {a/(l-oo)}vO material constants (3) s t r e s s versus
parameter da/dt H(da) + C{a/(l-a>) fatigue -damage (2) damage in creep
approach V1 H (a) creep-damage (2) and fat]gue-____
6.5. DISCUSSION ON THE APPLICABILITY OF METHODS
Applicability of life prediction methods for low alloy steels under different test combinations
such as hold times waveforms and temperatures had been examined by various workers with
the data compiled in Chapter 4 are aggregated to identify trends in the prediction capability of
methods discussed below.
6.5.1. Linear Damage Summation
Under constant tensile strain hold, steady state creep strain rate was computed and
integrated for duration of test. During a dwell, stress relaxation was modelled by 2 t / t ,̂
where t was hold time and t f, rupture time at the same load levels. It was pointed out (50)
for lCr-M o-V, "batch 4", at 565°C, that the magnitude of relaxed stresses was considerable
even at the end of first cycle. Relaxed stresses accounted for 43% of the peak tensile stress
after a 0.5 hour hold. However, peak tensile stresses were rising with the increase in number
of cycles. At 50% life, the relaxed stresses were 33% of the peak stresses, hence, exact
knowledge of creep rupture behaviour was extremely important which was not discussed in
the literature.
Applicability of damage summation method was assessed for lCr-Mo-V, 1.25Cr-Mo
and 2.25Cr-Mo steels in Table 6.2 where percentage of test data points predicted in a factor
of + x 2 of observed life for different batches of low alloy steels was tabulated. It can be

82
seen that applicability of this method depends upon material conditions and test temperatures
in Table 6.2. With the decrease in temperature from 600 to 485°C, the prediction capability
improved for both lCr-Mo-V and 2.25Cr-Mo steels. At 485°C damage summation approach
predicted 100% of test data points in a factor of + x2, for both N&T and Q&T conditions.
For annealed condition, prediction capability was very poor, and this method was not
applicable. With increase in temperature to 600°C, 2.25Cr-Mo, "batch 3 and 7" in N&T
condition the prediction was quite poor. Hence, the life predicted by damage summation
approach was influenced by test parameters such as temperature and material conditions as
identified in Table 6.2.
Table 6.2. Prediction Capability of Damage Summation Approach.
Material Batch no. Heat % Data in + x 2 Temp
Treatment °C
lCr-Mo-V 1 N&T 69 540
1 N&T 100 485
4 N&T 57 565
4 N&T 43 565
2.25Cr-Mo 1 Annealed 29 540
1 N&T 82 540
1 Q&T 100 485
3 N&T 70 600
5 N&T 0 600
6.5.2. Frequency Modified Approach
Frequency modified approach (FMA) underestimated life for constant tensile load cycles and
longer tensile hold cycles for lCr-Mo-V in (15). Effects of unbalanced cycles. 16 hours/16
sec. were beneficial to creep-fatigue response that were unaccounted by this model (6).

83
Melton (65), observed excellent agreement between experimental and predicted results for
lCr-Mo-V, "batch 3", within ± x 1.5 for a hot rolled bar material. The parameter of
equations 6.2 - 6.7, p '(K -l) was = -0.076 for "batch 3", which in the case of "batch 4" was -
0.46. The F MA method was not well explored for other low alloy steels since it required
the material parameters determined from tests with unequal ramp rates and balanced and
unbalanced dwells. Table 6.3 describes the prediction capability for FMA method.
Table 6.3. Prediction capability of Frequency Modified Approach.
Material Batch Heat % tests Temperature
Treatment in ± 2 °C
lCr-Mo-V 3 N&T 100 550
4 -do- 66 565
6.5.3. Strain Range Partitioning Technique
A base line relationship involved four PP, PC, CP and CC combinations in strain and life in
the following form (6)
NcPorPC = FCP or PC/ ( 1/Nobsrv- - Fpp/Npp) (6.28)
Two steel grades of the lCr-Mo-V and the 2.25Cr-Mo types have been assessed in the
literature. Trends in the prediction capability for longer tensile dwell data were reasonable,
which was not good for too short or long dwell cycles for lCr-Mo-V and 2.25Cr-Mo batch
3" (65) and "batch 4". However, there were conflicting opinions about SRP prediction
capability for lCr-Mo-V alloy (15)’ type 304 SS (87), IN-738 LC (88) whereas, it was
shown as a reliable technique for, type SS 304, SS 316, 2.25Cr-Mo (89), IN 100 (90), lCr-
Mo-V rotor steel (91) and many others (92). Bicego et al (84, 91) examined predicted and
experimental data for forged lCr-Mo-V steel at various strain rates and temperatures, where
specimens were machined from different positions of a rotor forging. In some cases, life
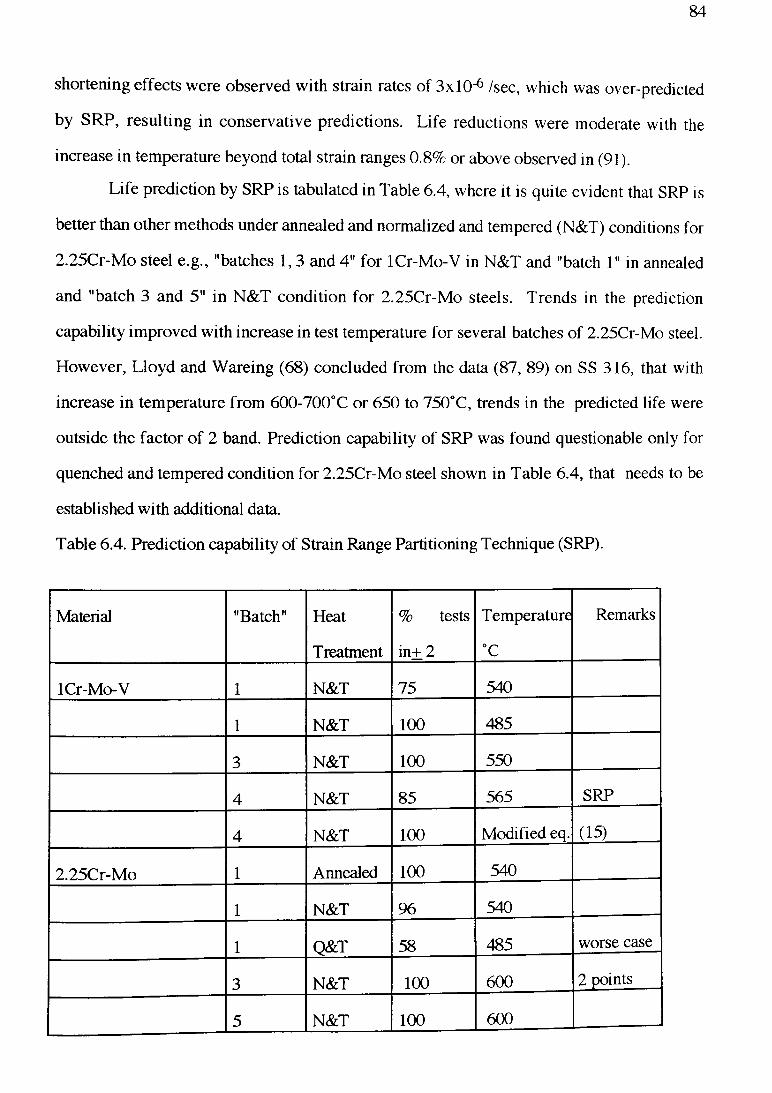
84
shortening effects were observed with strain rates of 3x10^ /sec, which was over-predicted
by SRP, resulting in conservative predictions. Life reductions were moderate with the
increase in temperature beyond total strain ranges 0.8% or above observed in (91).
Life prediction by SRP is tabulated in Table 6.4, where it is quite evident that SRP is
better than other methods under annealed and normalized and tempered (N&T) conditions for
2.25Cr-Mo steel e.g., "batches 1,3 and 4" for lCr-Mo-V in N&T and "batch 1" in annealed
and "batch 3 and 5" in N&T condition for 2.25Cr-Mo steels. Trends in the prediction
capability improved with increase in test temperature for several batches of 2.25Cr-Mo steel.
However, Lloyd and Wareing (68) concluded from the data (87, 89) on SS 316, that with
increase in temperature from 600-700°C or 650 to 750°C, trends in the predicted life were
outside the factor of 2 band. Prediction capability of SRP was found questionable only for
quenched and tempered condition for 2.25Cr-Mo steel shown in Table 6.4, that needs to be
established with additional data.
Table 6.4. Prediction capability of Strain Range Partitioning Technique (SRP).
Material "Batch" Heat % tests Temperature Remarks
Treatment in + 2 °C
lCr-Mo-V 1 N&T 75 540
1 N&T 100 485
3 N&T 100 550
4 N&T 85 565 SRP
4 N&T 100 Modified eq. (15)
2.25Cr-Mo 1 Annealed 100 540
1 N&T 96 540
1 Q&T 58 485 worse case
3 N&T 100 600 2 points
5 N&T 100 600

85
6.5.4. Damage Rate Approach
Plumbridge et al (32), investigated the metallographic damage development for "batch 4"
lCr-M o-V steel where fatigue and creep damages were independent of each other. Since,
damage rate approach accounted for growth of fatigue damage in terms of cracks and creep
damage by cavities, a very good prediction for "batch 4" of the lCr-Mo-V steel and "batch 3"
of the 2.25Cr-Mo steel (15-16) were observed, in Table 6.5.
Table 6.5. Prediction capability of Damage Rate Approach.
Material "Batch" Heat % tests in Remarks
Treatment + x2
lCr-Mo-V 4 N&T 100 at 565° C
2.25Cr-Mo 3 N&T 100 at 600°C with two data
points, 5 min. hold.
6.5.5. Hysteresis Energy Approach
The prediction capability of hysteresis energy approach for only tensile hold data for 16 hours
duration was found non conservative for lCr-Mo-V steel, "batch 4" 0. However, prediction
for compressive and balanced data was within a factor of + x2. A further modification made
on the approach proposed by Ostergren (10) in (15) by using the hold time data to determine
the material parameters. This improved the prediction capability for "batch 4" lCr-Mo-V
steel, as set out in Table 6.6. The equation proposed in ( 15) had the following form:
[ N f v ̂ (v t / v) r ] a À£p at = C (6 29)
With the modifications equation 6.29 was assessed with very limited creep-fatigue data. Only
"batch 4" lCr-M o-V steel was assessed and applicability of equation 6.29 needs to be
established with additional data.

86
Table 6.6. Prediction capability of Hysteresis Energy Approach.
Material "Batch" Heat % tests Remarks
Treatment in + 2
lCr-Mo-V Original 4 N&T 61 565° C by Ostergren (10)
Modified method 4 N&T 78 565°C by Priest et al,(15)
2.25Cr-Mo 3 N&T 100 at 600°C for 0/0 and two
tests with 5 min. hold.
6.5.6. Damage Parameter Approach
A non-conservative prediction was observed for tension only hold periods for the lCr-Mo-V
steel batch 4 as shown in Table 6.7. Though better predictions were observed for
compression only hold, further work and extension of this model to both dwell cases needs
to be established.
Table 6.7. Prediction capability of damage Parameter Approach.
Material "Batch" Heat % tests Remarks
Treatment in+ 2
lCr-Mo-V 4 4 N&T 50 at 565° C
2.25Cr-Mo 3 3 N&T 100 at 600°C with 0/0 and
two tests of 5min. hold.
6.5.7. Assessment Procedure R 5
Two low alloy steels of the type the 0.5Cr-Mo-V and the lCr-Mo-V were reviewed. In the
case of the 0.5Cr-Mo-V steel, 75% of the test data points were predicted in a factor of ± x2.
It was observed in the analysis of the data as the life range reduced, the trend in the prediction
capability was found to improve. In the case of the lCr-Mo-V steel, 56% of the test data
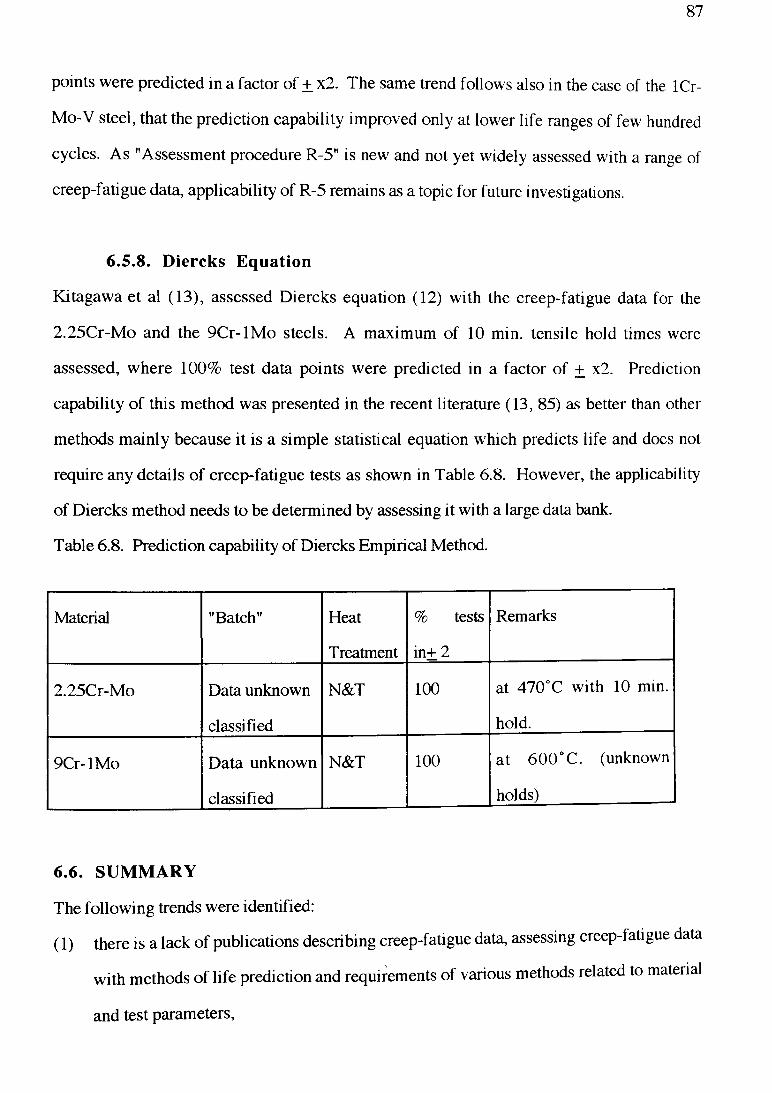
87
points were predicted in a factor of + x2. The same trend follows also in the case of the lCr-
Mo-V steel, that the prediction capability improved only at lower life ranges of few hundred
cycles. As "Assessment procedure R-5" is new and not yet widely assessed with a range of
creep-fatigue data, applicability of R-5 remains as a topic for future investigations.
6.5.8. Diercks Equation
Kitagawa et al (13), assessed Diercks equation (12) with the creep-fatigue data for the
2.25Cr-M o and the 9C r-lM o steels. A maximum of 10 min. tensile hold times were
assessed, where 100% test data points were predicted in a factor of + x2. Prediction
capability of this method was presented in the recent literature (13, 85) as better than other
methods mainly because it is a simple statistical equation which predicts life and does not
require any details of creep-fatigue tests as shown in Table 6.8. However, the applicability
of Diercks method needs to be determined by assessing it with a large data bank.
Table 6.8. Prediction capability of Diercks Empirical Method.
Material "Batch" Heat % tests Remarks
Treatment in+ 2
2.25Cr-Mo Data unknown N&T 100 at 470°C with 10 min.
classified hold.
9Cr-lM o Data unknown N&T 100 at 600° C. (unknown
classified holds)
6.6. SUMMARY
The following trends were identified:
(1) there is a lack of publications describing creep-fatigue data, assessing creep-fatigue data
with methods of life prediction and requirements of various methods related to material
and test parameters,

88
(2) various material parameters determined from one type of tests for one low alloy steel
type cannot be extended to other creep-fatigue data for other low alloy steels,
3) the life prediction methods within the phenomenological approach require a large
number of material parameters and laboratory tests where parametric relationships are
evolved by fitting those data, which often lack generalization to global creep-fatigue
data,
4) trends in the methods of life prediction depend upon test and material parameters, such
as strain rate, temperature, material condition and heat treatment where the prediction
capability of most methods deteriorated with increase in temperature,
5) the empirical methods of creep-fatigue life prediction were recommended in the
literature as promising, and
6) several modifications of the existing life prediction methods are possible, specific to a
data type, hence, any modification made on an existing method should be examined with a
data bank before proposing the applicability of the modified version.
89
7. CREEP-FATIGUE BEHAVIOUR AND LIFE PREDICTION
OF GAS TURBINE MATERIALS
In this Chapter creep-fatigue behaviour and life prediction of two gas turbine materials are
examined. Low alloy steels are used for power equipment, whereas, titanium alloys and
superalloys are used in gas turbines. Only limited studies were conducted to investigate
either the deformation mechanisms under creep-fatigue or life prediction for gas turbine and
power equipment materials. As a result there is a lack of interaction between the two
groups o f researchers in power generation and gas turbines, hence, to provide an
unification, damage features under creep-fatigue for a titanium alloy (IMI 829) and a
superalloy (MAR M 002) were investigated and compared with low alloy steels in this
research. The combined study o f low alloy steels the titanium alloy, and the superalloy,
conducted in this research, will advance the knowledge of creep-fatigue behaviour and life
prediction for high temperature materials.
7.1. INTRODUCTION
Previously tested specimens were available (17, 18) from which metallographic samples
were prepared and examined for high temperature low cycle fatigue (HTLCF) damage
mechanisms for a titanium alloy (IMI 829) and a superalloy (MAR M 002). Samples were
machined, etched and polished to conduct metallographic and fractographic investigations
to document the damage development under creep-fatigue. Since limited tests were
conducted (17-18), assessment o f any life prediction method with the data was not possible
(18). Due to this limitation, research in the development of an empirical life prediction
method, and its applicability to the available data on MAR M 002 was undertaken.
However, more work needs to be done to propose the applicability of the method developed
in this investigation in creep-fatigue life prediction for high temperature materials.
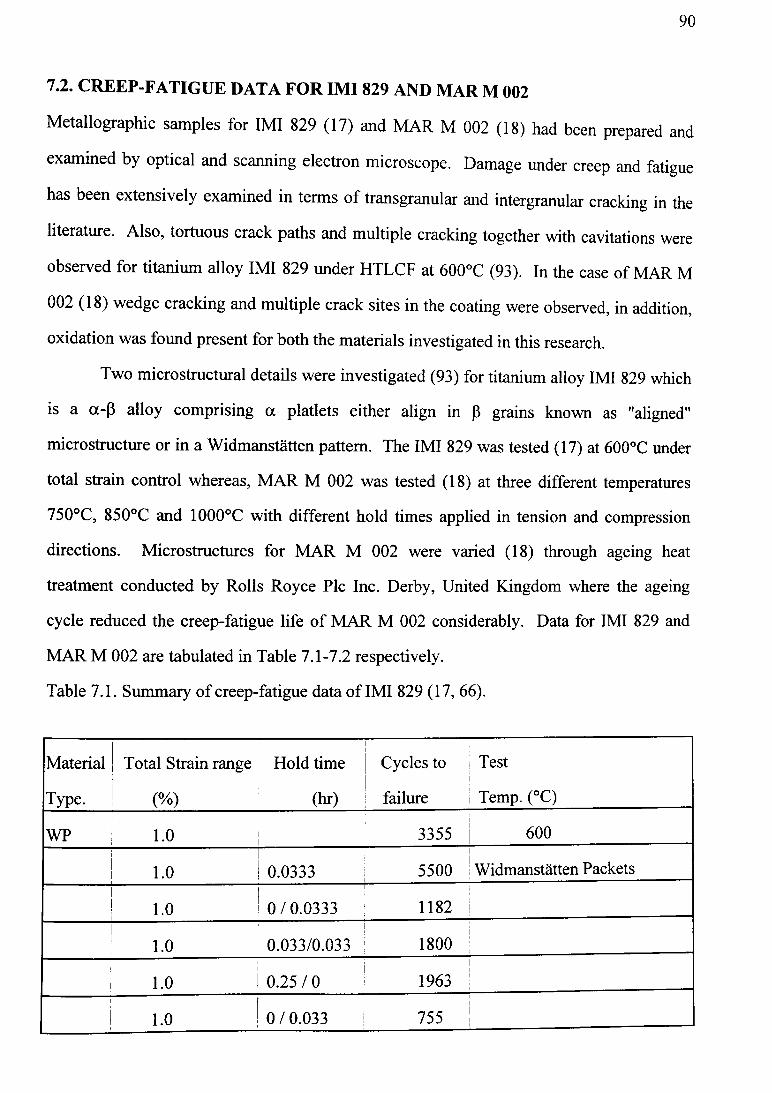
90
7.2. CREEP-FATIGUE DATA FOR IMI 829 AND MAR M 002
Metallographic samples for IMI 829 (17) and MAR M 002 (18) had been prepared and
examined by optical and scanning electron microscope. Damage under creep and fatigue
has been extensively examined in terms o f transgranular and intergranular cracking in the
literature. Also, tortuous crack paths and multiple cracking together with cavitations were
observed for titanium alloy IMI 829 under HTLCF at 600°C (93). In the case of MAR M
002 (18) wedge cracking and multiple crack sites in the coating were observed, in addition,
oxidation was found present for both the materials investigated in this research.
Two microstructural details were investigated (93) for titanium alloy IMI 829 which
is a a-P alloy comprising a platlets either align in p grains known as "aligned"
microstructure or in a Widmanstatten pattern. The IMI 829 was tested (17) at 600°C under
total strain control whereas, MAR M 002 was tested (18) at three different temperatures
750°C, 850°C and 1000°C with different hold times applied in tension and compression
directions. Microstructures for MAR M 002 were varied (18) through ageing heat
treatment conducted by Rolls Royce Pic Inc. Derby, United Kingdom where the ageing
cycle reduced the creep-fatigue life o f MAR M 002 considerably. Data for IMI 829 and
MAR M 002 are tabulated in Table 7.1-7.2 respectively.
Table 7.1. Summary of creep-fatigue data o f IMI 829 (17, 66).
Material Total Strain range Hold time Cycles to Test
Type. (%) (hr) failure Temp. (°C)
WP 1.0 3355 600
! l.o 0.0333 5500 Widmanstätten Packets
! l.o 0 /0 .0333 1182
1.0 0.033/0.033 1800
1.0 0.25 / 0 1963
1.0 0 /0 .033 1 755
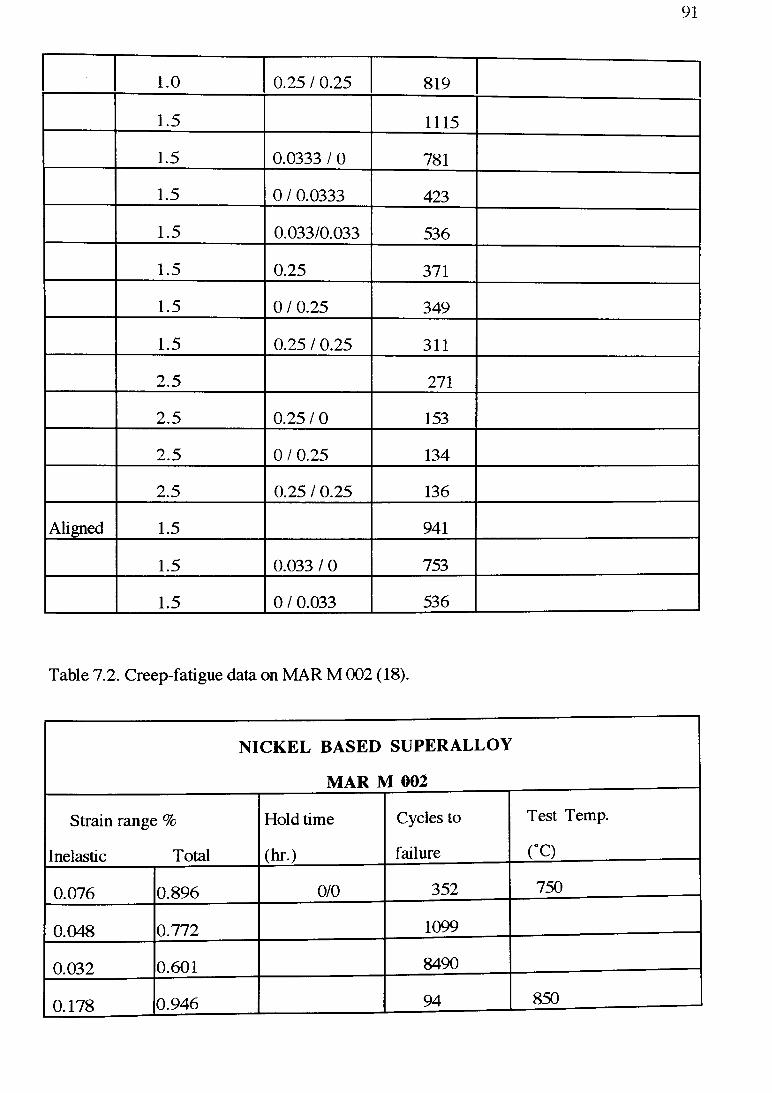
91
1.0 0.25 / 0.25 819
1.5 1115
1.5 0.0333 / 0 781
1.5 0 / 0.0333 423
1.5 0.033/0.033 536
1.5 0.25 371
1.5 0 / 0.25 349
1.5 0.25 / 0.25 311
2.5 271
2.5 0.25 / 0 153
2.5 0 / 0.25 134
2.5 0.25 / 0.25 136
Aligned 1.5 941
1.5 0.033 / 0 753
1.5 0 / 0.033 536
Table 7.2. Creep-fatigue data on MAR M 002 (18).
NICKEL BASED SUPERALLOY
MAR M 002
Strain range % Hold time Cycles to Test Temp.
Inelastic Total (hr.) failure r c )
0.076 0.896 0/0 352 750
0.048 0.772 1099
0.032 0.601 8490
0.178 0.946 94 850
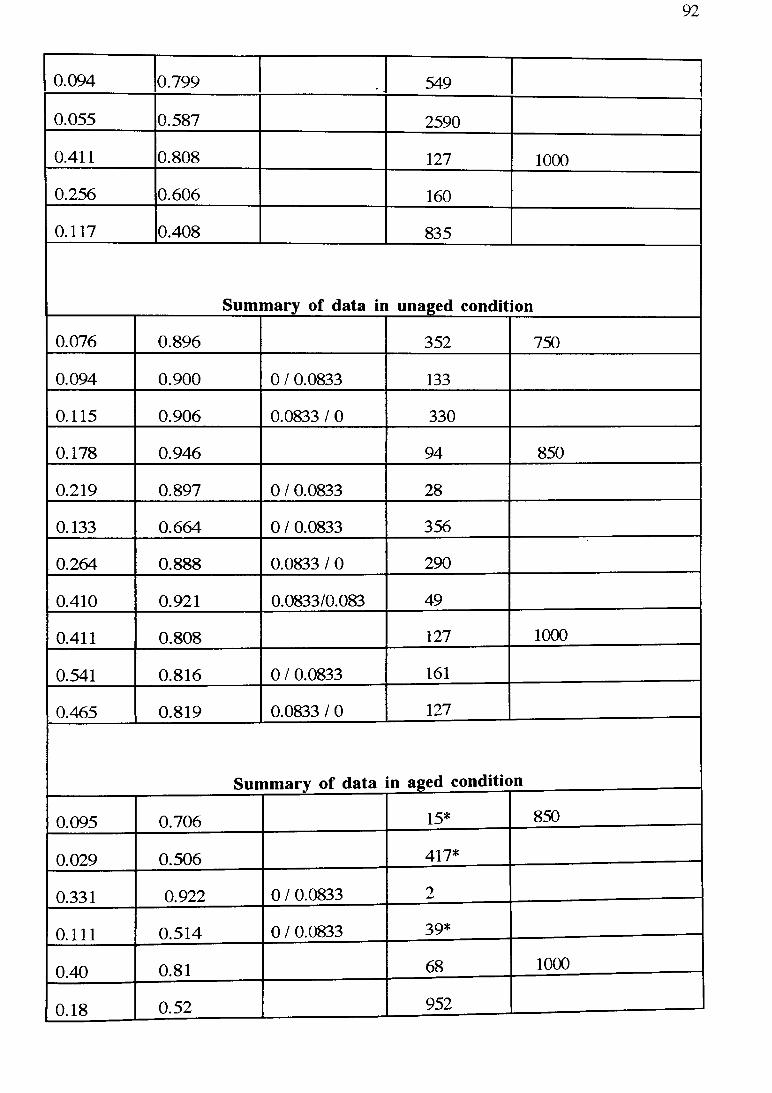
92
0.094 0.799 549
0.055 0.587 2590
0.411 0.808 127 1000
0.256 0.606 160
0.117 0.408 835
Summary of data in unaged condition
0.076 0.896 352 750
0.094 0.900 0 / 0.0833 133
0.115 0.906 0.0833 / 0 330
0.178 0.946 94 850
0.219 0.897 0 / 0.0833 28
0.133 0.664 0 / 0.0833 356
0.264 0.888 0.0833 / 0 290
0.410 0.921 0.0833/0.083 49
0.411 0.808 127 1000
0.541 0.816 0 / 0.0833 161
0.465 0.819 0.0833 / 0 127
Summary of data in aged condition
0.095 0.706 15* 850
0.029 0.506 417*
0.331 0.922 0 / 0.0833 2
0.111 0.514 0 / 0.0833 39*
0.40 0.81 68 1000
0.18 0.52 952

93
0.059 0.26 >5420
0.38 0.74 0 / 0.0833 38
0.41 0.73 0.0833 / 0 65
(* 10% load drop.)
7 . 3 . METALLOGRAPHIC INVESTIGATIONS AND DEVELOPMENT OF
A DAMAGE MODEL
Samples from the tabulated test conditions set out in Tables 7.1-7.2 were examined for
metallographic features that occurred under HTLCF. For IMI 829, Widmanstatten packet
(WP) morphology was mainly tested (93) except for few tests on a aligned structure. A
"scale" interpreted in this study as oxides formed on the specimen surface due to high
temperature exposure in all tests. The "scale" was seen under an optical microscope as "black
irregular bands" on the specimen gauge surface which contained multiple crack sites. Since
quantitative characterization and or, analysis of oxides required advanced capabilities,
interpretation of oxidation was made from published sources. The publications describing
the oxidation were also in terms of qualitative interpretations from the evidence of ' black
bands" for different materials. The crack paths were mainly of the tortuous type dominating
in the case of the IMI 829 alloy. However, for superalloys, depletion of intermetallic phases
(Y') were reported by Coffin (19-20) and other workers (94) from the metallographic
observations. For MAR M 002, oxide banding was observed together with y' depleted
regions. A t 850°C and 1000°C, grain boundary wedge cracking, oxidation and y' depletion
were more prevalent than at 750°C.
Metallographic observations made on the samples from the gauge section, revealed
"oxide scales" on the external surfaces for both materials. Accumulation of this scale resulted
in "oxide banding", the shape of which was found to depend upon the specimen surface
finish. Since each specimen contained surface irregularities where the surface finish changed
from point to point, these were reflected on the depth of "oxide band when microscopic
studies were conducted shown in photomicrographs Fig. 7.1 (a-d).

iBakeliteMounting
▼4
Oxide Band
i Matrix
30 |iin
Fig. 7.1 (a). Oxide band form ation and m ultiple intrusions in IMI 829(at 600° C, a balanced cycle 15/15 min. and 1% total strain range).
" Bakelite Mounting
j Oxide Ban<
AMatrix
60 |im\
\
Fiff 7 1 (b). Oxide band form ation and m ultiple intrusions in IMI 829' (at 600°C, a balanced cycle 15/15 min. a t 1% total strain range).
94
Depending upon oxide band size, surface roughness and loading conditions, localised
stress concentrations developed along surface irregularity valleys. From the regions of
higher stresses, oxide scale penetrated further into the matrix by oxide spikes. For MAR M
002, which was strengthened by y', which is an intermetallic compound of A1 and Ti,
depletion of the y' occurred. The depletion of y' was thermal activation dependent which at
high temperatures enhanced the diffusion processes such that elements A1 and Ti diffused in
the matrix and along the main crack for MAR M 247 (45). Also, depletion of y' occurred
along the grain boundaries that resulted in intergranular wedge cracking. Wedge cracking,
transgranular and intergranular cracking together with y' depletion were observed for MAR M
002. Depleted y' regions for MAR M 002 are shown in Fig. 7.2 (a-b) where interpretation of
y’ depletion is made from such claims (19-20, 94) in the published literature.
A threshold temperature was identified (33,64) in Chapter 5 for the 2.25Cr-Mo steel
only above that temperature oxidation results. When oxidation occurs it accelerates the
damage of fatigue, creep and their interactions. The interactions among creep-fatigue and
other processes are in the research stage and not much is known about their mechanisms.
The threshold temperature for a 2.25Cr-Mo steel was in a range of 250 - 450°C (33, 64)
which was 0.3 times the homologus temperature (Th). Oxidation was found to accelerate
transgranular crack growth under fatigue (45), whereas, the same effect with creep cavitation
and intergranular cracking occurred when oxidation interacted with creep (45). The
contribution of oxidation in accelerating the fatigue and creep damage and in reducing life is
not yet established because the complexities involved in three interacting mechanisms are
difficult to model.
From the metallographic features documented under creep-fatigue for IMI 829 and
MAR M 002, a model describing various stages in which damage under fatigue, creep and
oxidation developed is proposed in this investigation. "Damage" is defined as a change in
material state (microstructure) that occurs due to high temperature testing which can be
observed under metallographic examination. A change in the microstructure was first
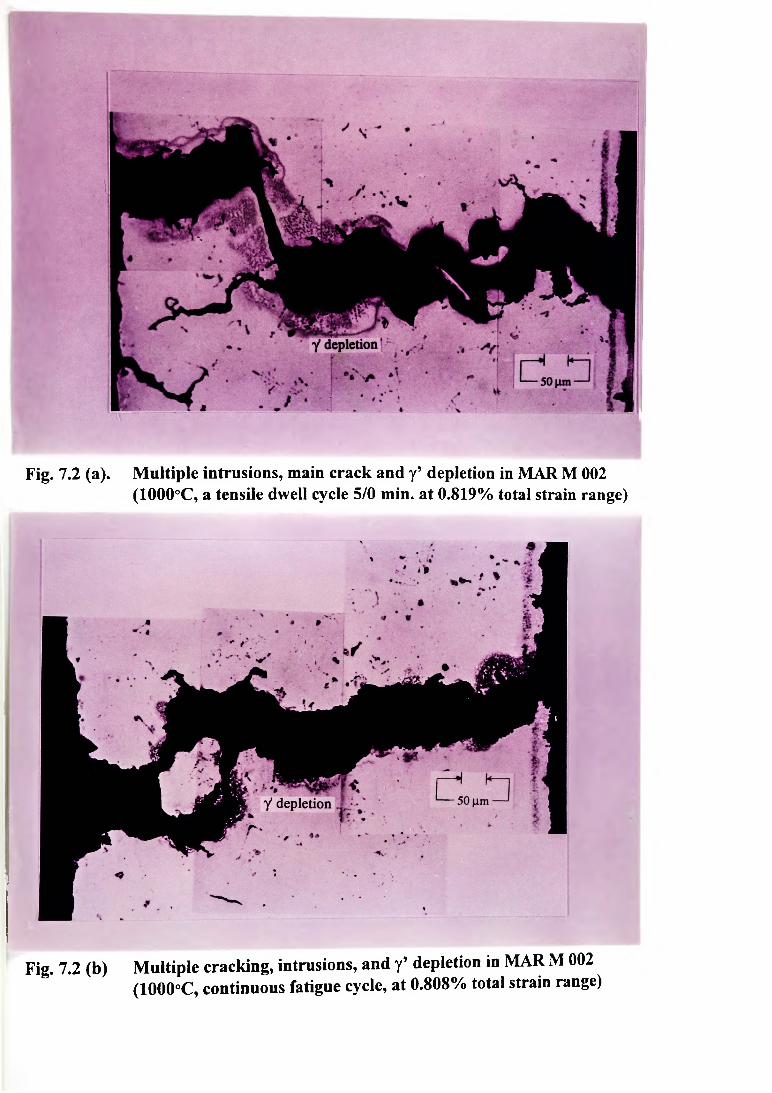
Fig. 7.2 (a). M ultiple intrusions, main crack and y’ depiction in MAR M 002(1000°C, a tensile dwell cycle 5/0 min. a t 0.819% total strain range)
Fig. 7.2 (b) M ultiple cracking, intrusions, and y’ depletion in MAR M 002 (1000°C, continuous fatigue cycle, a t 0.808% total strain range)
95
observed on the specimen surface when oxide scales formed due to exposure at high
temperature. Rate of oxide scale formation was enhanced with the increase in exposure time
at high tem perature and load for several superalloys (95). As a result, specimen
circumference over the gauge length was covered with oxide scales and away from the
specimen outer surface, changes in the matrix such as cracking and cavitation for IMI 829
were also observed. The five stages in which damage developed are shown in Fig.7.3 where
individual steps are described below.
'Stage I describes the formation of oxide scale on the specimen surface because of
high tem perature exposure. Stress concentration developed at the regions of surface
irregularities due to fatigue cycling. Depending upon exposure time and loading, new layers
of oxides developed and accumulated on the specimen surface, where thickness of "oxide
layers" was different from point to point.
'Stage II ': growth of the oxide bands took place externally as well as in the internal
matrix depending upon the strain concentrations and the diffusion of alloying elements.
Since diffusion of alloying elements such as aluminium and titanium in a superalloy resulted
in the depletion of y \ oxidation damage was accelerated. Also the external surface
irregularities in term of peaks and valleys with exposure time became filled with products of
oxides. When observed internally from the matrix, external peaks transformed into internal
valleys and external valleys into internal peaks respectively as shown in Fig. 7.3 (Stage I).
When the thickness of the oxide scale reached a critical value a layer of material ruptured as
shown in Fig. 7.3.
'Stage III': the rate of oxide scale formation and subsequent rupture of material layers
increased with time and load cycling. Multiple oxide layers formed and ruptured with the
increase in time and load cycling.
'Stage IV ': the concentration of numerous ruptured material layers resulted in the
formation of an oxide spike into the matrix. The process of generation of an oxide spike
functioned as a micro-crack by intrusion. Intrusions so generated were of the order of a few
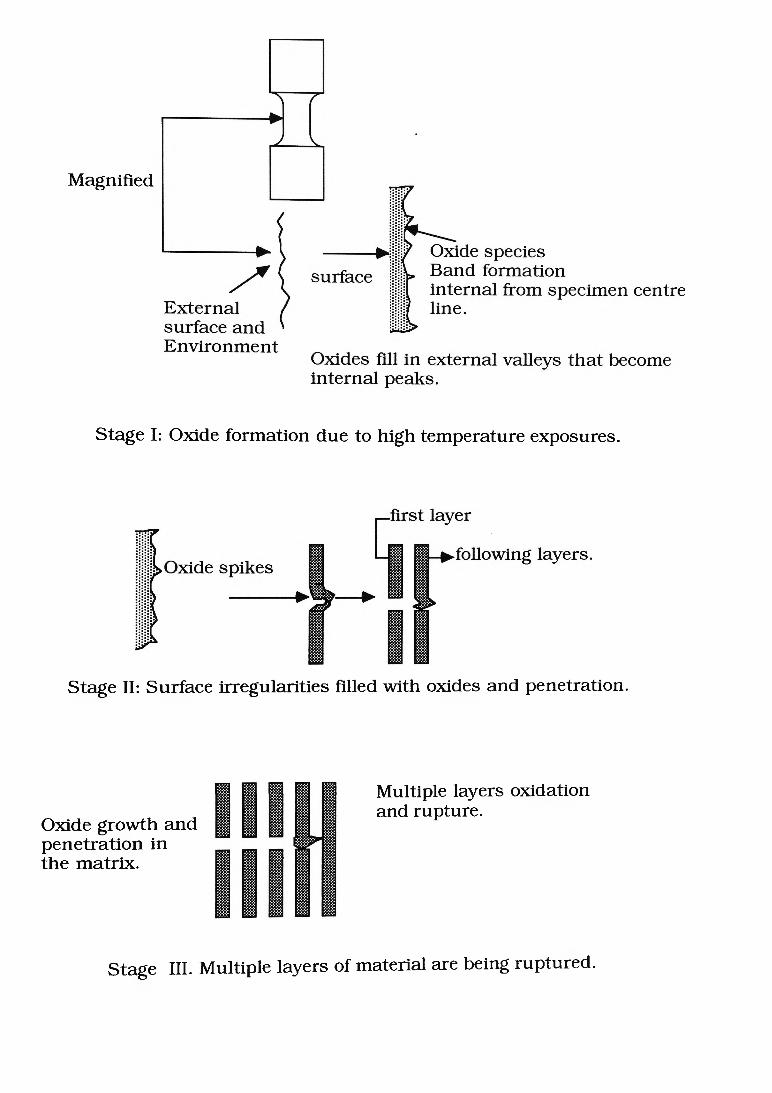
M a g n ifie d
S ta g e I: O x id e fo rm a tio n d u e to h ig h te m p e ra tu re e xp o su re s .
S ta g e II : S u rfa c e ir re g u la r it ie s f ille d w ith o x id e s a n d p e n e tra tio n .
O x id e g ro w th a n d p e n e tra tio n in th e m a tr ix .
M u lt ip le la y e rs o x id a tio n a n d ru p tu re .
S ta g e I I I . M u lt ip le la y e rs o f m a te r ia l a re b e in g ru p tu re d .
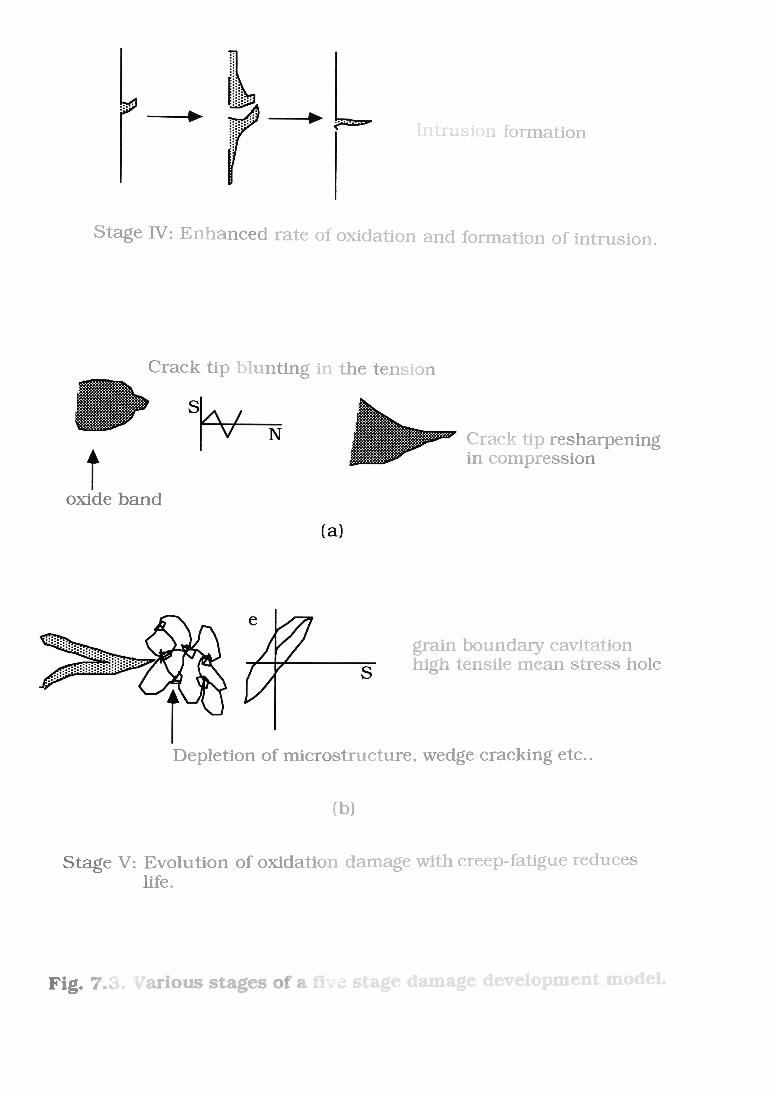
In tru s io n fo rm a tio n
S ta g e IV : E n h a n c e d ra te o f o x id a tio n a n d fo rm a tio n o f in tru s io n .
C ra c k t ip b lu n tin g in th e te n s io n
o x id e b a n d
C ra c k t ip re s h a rp e n in g in co m p re s s io n
g ra in b o u n d a ry c a v ita tio n h ig h te n s ile m e a n s tre s s ho le
D e p le tio n o f m ic ro s tru c tu re , w edge c ra c k in g e tc ..
(b )
S ta g e V : E v o lu tio n o f o x id a tio n dam age w ith c re e p -fa tig u e re d u ce s life .
Fig. 7.3. Various stages of a five stage damage development model.

96
microns to several hundred microns (macro-crack) as shown in Fig. 7.1 (a-d). Multiple
intrusions may form depending upon local material stress/strain conditions and surface
irregularities that were present on the specimens.
—ta£e V - fatigue damage by transgranular crack growth was accelerated, as oxides
formed and ruptured that resulted in spikes or cracks. The cracks so developed, filled with
oxides and resharpened the crack tip in every compression half cycle. In the case of IMI 318
(96) and IMI 829 (17, 66) the compression hold times were more deleterious under HTLCF
than dwell in the opposite (tension) direction are contributed simultaneously to the formation
of oxides and crack tip resharpening. Such behaviour, at three strain levels with several
compressive dwell periods is described in Fig.(a) of Stage V. For some alloys, a hold in the
peak tensile strain direction resulted in the generation of cavities at grain boundary triple
points by grain boundary sliding. Cavitation for a low alloy lCr-Mo-V (32) steel batch 4
(see Chapter 4) and IMI 829 (93) were observed and documented in Fig. (a).
The MAR M 002, experienced grain boundary sliding and intergranular crack
propagation under HTLCF in a temperature range of 850-1000°C (26). Depletion of y'
resulted in wedge type of cracking. Depletion of y' was observed in this investigation along
the crack face and internal matrix that dominated the growth of damage in Fig. (b) of 'Stage
V '.
The development of "oxide banding" and multiple intrusions along the specimen
surface, described in damage model (Fig. 7.3), was validated with fracture surface
examinations at low magnifications for IMI 829 specimens. Distinct multiple crack sites and
sites of oxidation spikes are shown in Fig. 7.4 (a and b, pointed by arrows).
7.4. REVIEW OF EMPIRICAL OXIDATION LIFE PREDICTION MODEL
A review of an empirical life prediction method was conducted for a MAR M derivative alloy
MAR M 509 which is used as a material for gas turbine vanes. In MAR M 509, Rauchet and
Remy (14) observed transgranular crack propagation, and oxidation attack was external as
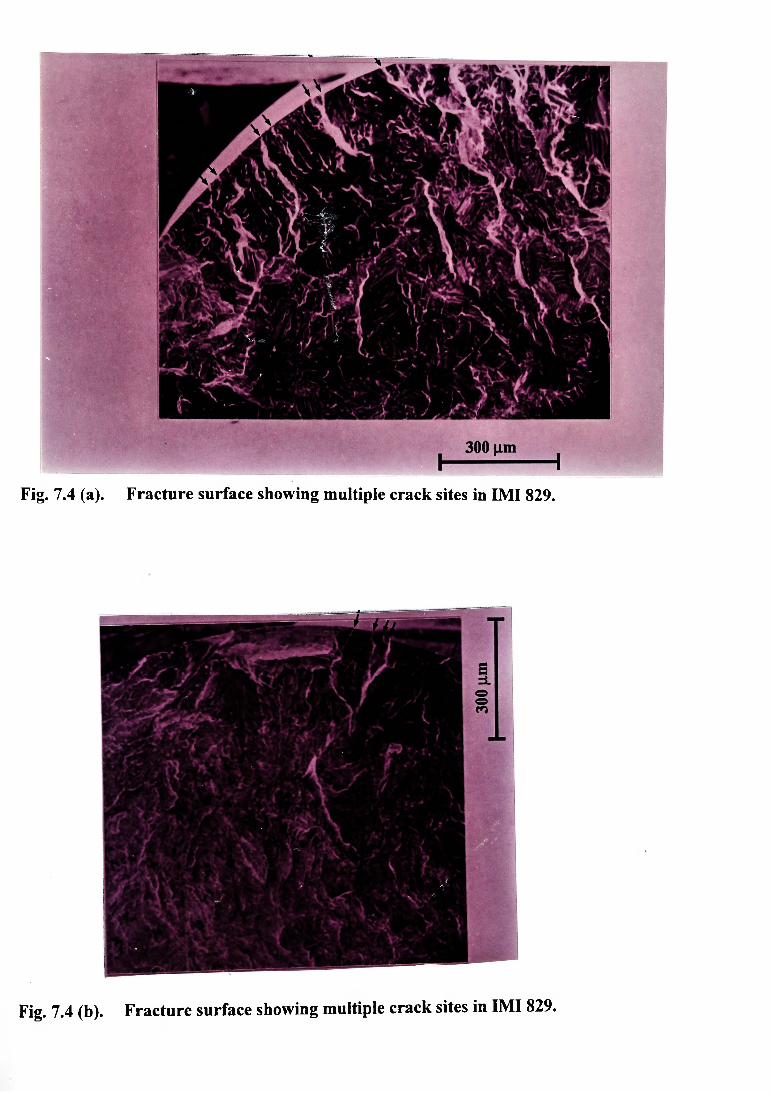
Fig. 7.4 (a). F rac tu re surface showing multiple crack sites in IM I 829.
Fig. 7.4 (b). F rac tu re surface showing multiple crack sites in IM I 829.

97
well as along the internal matrix in the y' carbides. The kinetics of matrix oxidation was
expressed by a parabolic equation which was assumed to correlate the growth of oxide scale
thickness (14,45, 97) in the following form:
h = V (D° .t)
h = VD* exp (-Q /R T ). t (7>1)
where, D is the diffusion coefficient, R is the universal gas constant, T is absolute
tem perature (K) and h is the thickness of the oxide layer after time t. The diffusion
coefficient was related in the following form:
D* = D0* e(-Q/RT) (7 2)
where D0 is the diffusion constant and other symbols have their usual meanings. The crack
growth equation was expressed empirically, as follows (14),
da / dN= 0.51 Aep [ 1/ (Cos (jt/2. a/T) -1]. a + ( l- /* c) a °M (l+ K MA8p/2)Vt1
+ /* c a c° exp (bo) t j 1/4. (7.3)
where, a is the maximum cyclic tensile stress, T is the tensile fracture stress, a is the crack
size at initiation, f*c is the effective fraction of carbides on the crack path, a M° is the
diffusion constant, Km and b are temperature dependent parameters and t is the duration of
the test. This equation was assessed with MAR M 509 tested at 900°C where prediction was
found in a factor of +x2 the observed life. A number of terms used in the equation 7.3 were
determined empirically or assumed and applicability of this method was assessed with creep-
fatigue data on MAR M 002.
Although there are several empirical models, their applicability to a range of data and
materials is not yet determined. Some models (14) assumed linear summation of the damages
in terms of crack growth by fatigue, and oxidation, whereas others (45) assumed the growth
of damage by a chain rule, which multiplied damage fractions. From study of these models it
is evident that no consensus exists about whether a linear summation or multiplication of
damage fractions should be used in life prediction. Also, assessment of a phenomenological
life prediction method, reviewed in Chapter 6 requires a bank of creep and fatigue data, such

98
an expanded data bank was not available for MAR M 509 and also for MAR M 002. Hence,
a new model was developed from the available data and material parameters for the creep-
fatigue life prediction for MAR M 002.
7 . 5 . DEVELOPMENT OF A NEW EMPIRICAL OXIDATION MODEL FOR
MAR M 002
A limited number of creep-fatigue tests were carried out on MAR M 002 (18) at 750°C,
850 C and 1000 C. The life prediction methods discussed in Chapter 6 required some hold
time data in addition to high temperature fatigue and creep data. Methods such as damage
summation and strain range partitioning required more information on creep behaviour of the
materials to determine the accumulation of inelastic strains under hold times. These details
were unknown for both I MI 829 and MAR M 002. Creep strain components for the tests
conducted for IMI 829 (17, 66) and MAR M 002 (18, 26) had not been identified. The data
were correlated in terms of either total or plastic strain ranges and life by separating total in
plastic and elastic strain components. As a result, no phenomenological method was
applicable to assess the life prediction for MAR M 002.
The role of oxidation is not yet understood in the creep-fatigue behaviour and life
prediction for high temperature materials. Oxidation damage was documented in this
investigation in five stages that were identified in the damage model developed in section 7.3.
Only empirical models have been found to account for the effects of oxidation in creep-
fatigue, since such models, did not require consensus on various laws and material stress-
strain relationships, research workers used both the extremes of a linear summation and chain
rule in developing damage equations. Hence an attempt was made to develop a new empirical
model for creep-fatigue life prediction when oxidation was found to influence life for MAR M
002.
D iffusion constants and activation energy were determined from Arrhenius
relationships from tests conducted at 750°C, 850°C and 1000°C. Extensive oxidation in the

99
matrix, along crack faces and depleted y' phases were observed for tests conducted at 850°C
and 1000 C. Oxide scale formation due to high temperature exposure in the case of metallic
materials was modelled in terms of linear, parabolic and cubic growth rates. Growth of the
surface oxide layer was assumed to be described by a parabolic law (14, 45, 95). The
models (14, 45, 97) required several parameters which were not available for MAR M 002.
Hence an alternate empirical approach was developed using the oxide scale growth together
with creep ductility and fatigue cycle time concepts.
A parabolic growth equation was assumed to describe the thickness of oxide layer,
represented by the equation below
h = V (D*. e (-Q/RT).t) (7.4)
where h is the thickness of oxide layer /sec, D* is the diffusion coefficient for the lattice
diffusion, Q is the activation energy, R is universal gas constant, T is test temperature (K)
and t is the test duration. Oxide scale formation and its growth rate had not been determined
previously (17, 18). Hence, the parameters D* and Q of equation 7.4 were assumed from the
creep data for MAR M 002 (18).
Oxidation was found to occur in multiple steps discussed in damage development
model described in section 7.3. At high temperature damage developed by oxidation, which
depleted y' carbides in superalloys and produced multiple cracks for IMI 829. Since y'
improves the strength and fatigue and creep resistance of superalloys, matrix oxidation
resulting into y' depletion was associated with a decrease in material strength and high
temperature creep and fatigue resistance. Since previous models (14, 45, 97) assumed only
that the external oxidation and oxide growth, role of internal oxidation such as y' depletion
was not accounted. In the new model, equivalent growth of external and internal oxides was
assumed twice that of equation 7.1. Also both the creep and the oxidation are diffusion
controlled phenomena, where thermal activation determines the damage under both creep and
oxidation. The contribution of oxidation under fatigue and creep enhanced the crack growth
rate under transgranular or intergranular mode (45).
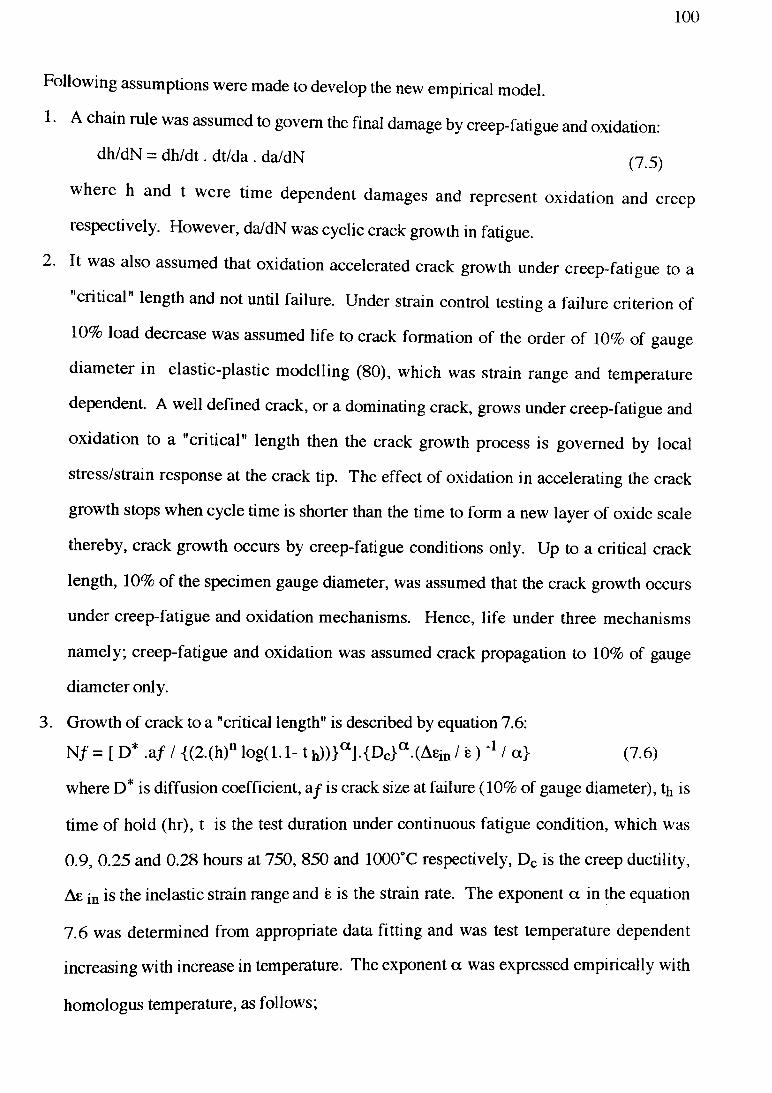
100
Following assumptions were made to develop the new empirical model.
1 • A chain rule was assumed to govern the final damage by creep-fatigue and oxidation:
dh/dN = d h /d t. dt/da . da/dN (7
w here h and t were time dependent damages and represent oxidation and creep
respectively. However, da/dN was cyclic crack growth in fatigue.
2. It was also assumed that oxidation accelerated crack growth under creep-fatigue to a
critical length and not until failure. Under strain control testing a failure criterion of
10% load decrease was assumed life to crack formation of the order of 10% of gauge
diam eter in elastic-plastic modelling (80), which was strain range and temperature
dependent. A well defined crack, or a dominating crack, grows under creep-fatigue and
oxidation to a "critical" length then the crack growth process is governed by local
stress/strain response at the crack tip. The effect of oxidation in accelerating the crack
growth stops when cycle time is shorter than the time to form a new layer of oxide scale
thereby, crack growth occurs by creep-fatigue conditions only. Up to a critical crack
length, 10% of the specimen gauge diameter, was assumed that the crack growth occurs
under creep-fatigue and oxidation mechanisms. Hence, life under three mechanisms
namely; creep-fatigue and oxidation was assumed crack propagation to 10% of gauge
diameter only.
3. Growth of crack to a "critical length" is described by equation 7.6:
N f = [ D * .a/ / {(2.(h)n log(l. 1 -1 h))}a ] {Dc}a (AEin / fe) '* / a} (7.6)
where D* is diffusion coefficient, af is crack size at failure (10% of gauge diameter), th is
time of hold (hr), t is the test duration under continuous fatigue condition, which was
0.9, 0.25 and 0.28 hours at 750, 850 and 1000°C respectively, Dc is the creep ductility,
Ae in is the inelastic strain range and e is the strain rate. The exponent a in the equation
7.6 was determined from appropriate data fitting and was test temperature dependent
increasing with increase in temperature. The exponent a was expressed empirically with
homologus temperature, as follows;
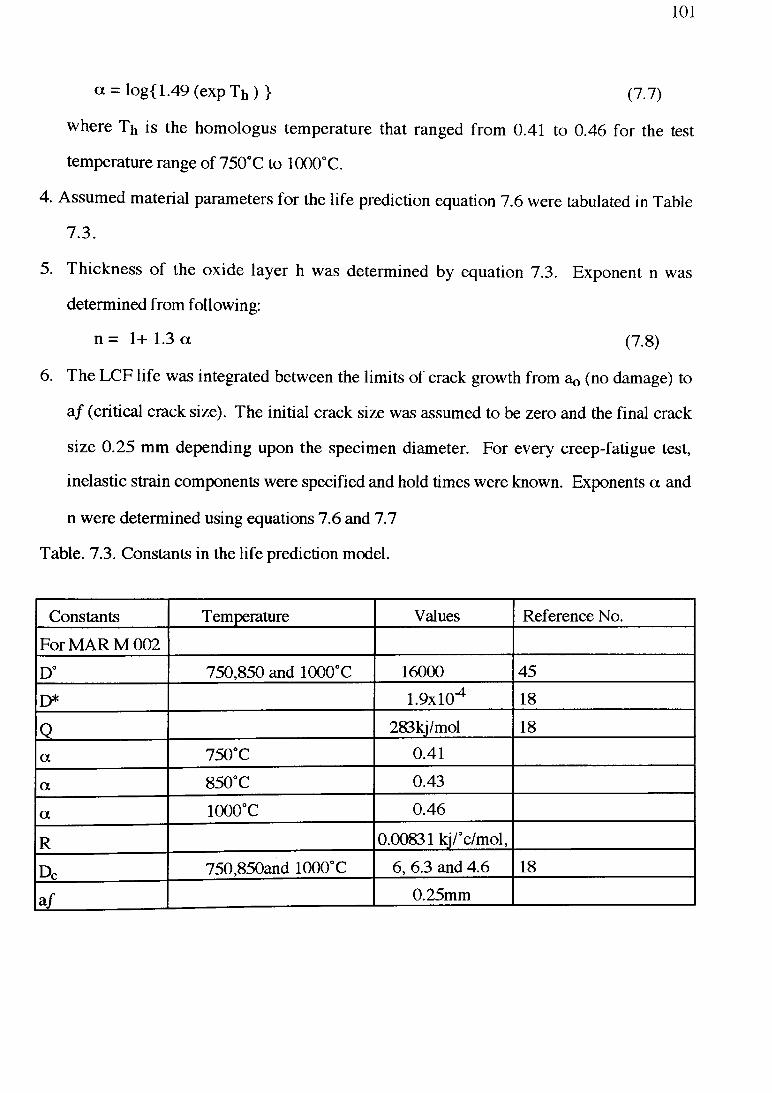
101
where Th is the homologus temperature that ranged from 0.41 to 0.46 for the test
temperature range of 750°C to 1000°C.
4. Assumed material parameters for the life prediction equation 7.6 were tabulated in Table
7.3.
5. Thickness of the oxide layer h was determined by equation 7.3. Exponent n was
determined from following:
n = 1+ 1.3 a (7.8)
6. The LCF life was integrated between the limits of crack growth from ao (no damage) to
af (critical crack size). The initial crack size was assumed to be zero and the final crack
size 0.25 mm depending upon the specimen diameter. For every creep-fatigue test,
inelastic strain components were specified and hold times were known. Exponents a and
n were determined using equations 7.6 and 7.7
Table. 7.3. Constants in the life prediction model.
a = log{1.49 (exp Th ) } (7.7)
Constants Temperature Values Reference No.
For MAR M 002
D° 750,850 and 1000°C 16000 45
D* 1.9x10^ 18
0 283kj/mol 18
a 750°C 0.41
a 850°C 0.43
a 1000°C 0.46
R 0.00831 kj/°c/mol,
Dc 750,850and 1000°C 6, 6.3 and 4.6 18
a. f 0.25mm
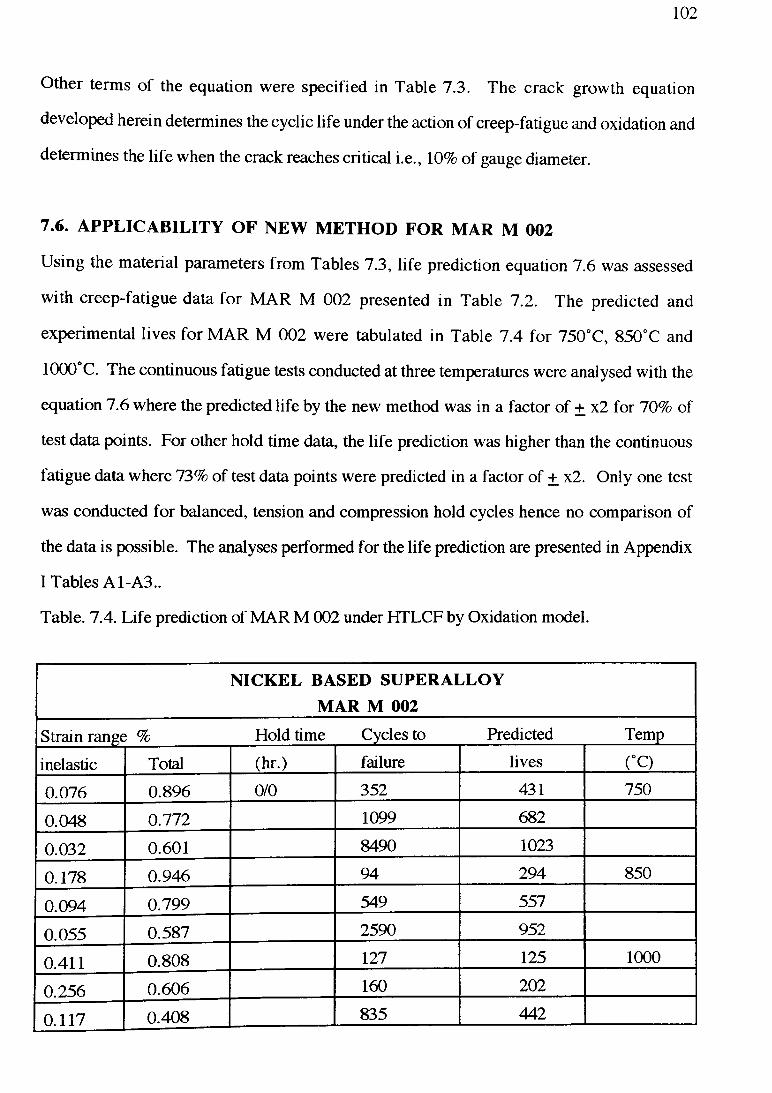
102
Other terms of the equation were specified in Table 7.3. The crack growth equation
developed herein determines the cyclic life under the action of creep-fatigue and oxidation and
determines the life when the crack reaches critical i.e., 10% of gauge diameter.
7.6. APPLICABILITY OF NEW METHOD FOR MAR M 002
Using the material parameters from Tables 7.3, life prediction equation 7.6 was assessed
with creep-fatigue data for MAR M 002 presented in Table 7.2. The predicted and
experimental lives for MAR M 002 were tabulated in Table 7.4 for 750°C, 850°C and
1000°C. The continuous fatigue tests conducted at three temperatures were analysed with the
equation 7.6 where the predicted life by the new method was in a factor of + x2 for 70% of
test data points. For other hold time data, the life prediction was higher than the continuous
fatigue data where 73% of test data points were predicted in a factor of + x2. Only one test
was conducted for balanced, tension and compression hold cycles hence no comparison of
the data is possible. The analyses performed for the life prediction are presented in Appendix
I Tables A1-A3..
Table. 7.4. Life prediction of MAR M 002 under HTLCF by Oxidation model.
NICKEL BASED SUPERALLOY MAR M 002
Strain range % Hold time Cycles to Predicted Temp
inelastic Total (hr.) failure lives (°C)
0.076 0.896 0/0 352 431 750
0.048 0.772 1099 682
0.032 0.601 8490 1023
0.178 0.946 94 294 850
0.094 0.799 549 557
0.055 0.587 2590 952
0.411 0.808 127 125 1000
0.256 0.606 160 202
0.117 0.408 835 442
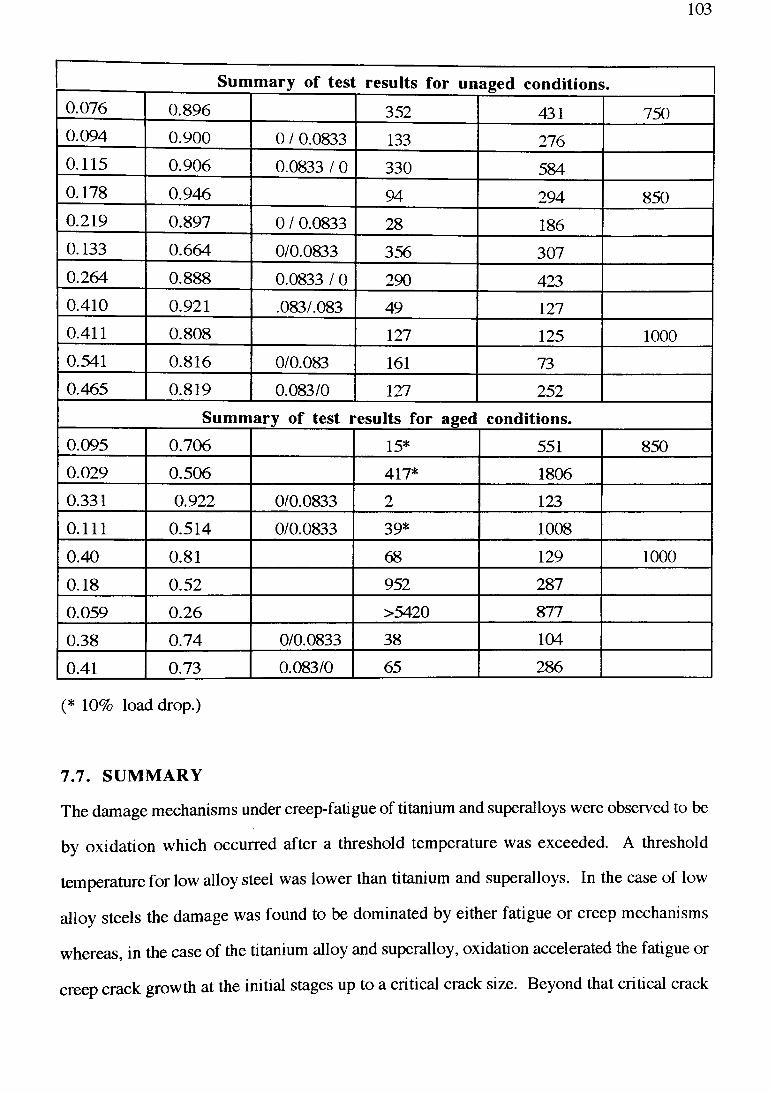
103
S um m ary of te s t resu lts fo r unaged conditions.0.076 0.896 352 431 7500.094 0.900 0 / 0.0833 133 2760.115 0.906 0.0833 / 0 330 5840.178 0.946 94 294 8500.219 0.897 0 / 0.0833 28 1860.133 0.664 0/0.0833 356 3070.264 0.888 0.0833 / 0 290 4230.410 0.921 .083/.083 49 1270.411 0.808 127 125 10000.541 0.816 0/0.083 161 730.465 0.819 0.083/0 127 252
S um m ary of test resu lts fo r aged conditions.
0.095 0.706 15* 551 850
0.029 0.506 417* 1806
0.331 0.922 0/0.0833 2 123
0.111 0.514 0/0.0833 39* 1008
0.40 0.81 68 129 1000
0.18 0.52 952 287
0.059 0.26 >5420 877
0.38 0.74 0/0.0833 38 104
0.41 0.73 0.083/0 65 286
(* 10% load drop.)
7 .7 . SU M M A R Y
The damage mechanisms under creep-fatigue of titanium and superalloys were observed to be
by oxidation which occurred after a threshold temperature was exceeded. A threshold
temperature for low alloy steel was lower than titanium and superalloys. In the case of low
alloy steels the damage was found to be dominated by either fatigue or creep mechanisms
whereas, in the case of the titanium alloy and superalloy, oxidation accelerated the fatigue or
creep crack growth at the initial stages up to a critical crack size. Beyond that critical crack
104
size it is speculated that the mechanisms of damage growth under creep-fatigue for the
titanium alloy and superalloy will be similar to that for low alloy steels. A model was
developed to describe the damage evolution under high temperature low cycle fatigue where
difference by which damage in fatigue, creep and oxidation developed were identified.
An empirical life prediction model was developed which combined crack growth by fatigue,
creep and oxidation below a critical size. Since limited data were available comparison of the
new method with other standard life prediction models was not possible.

105
8. DIERCKS EQUATION : MODIFICATION AND APPLICABILITY
Creep-fatigue data for low alloy steels were compiled in Chapter 4 and trends in that
behaviour were identified in Chapter 5. Trends in the methods of life prediction using the
compiled data were examined in Chapter 6. Creep-fatigue behaviour and life prediction for a
titanium alloy IMI 829 and a superalloy MAR M 002 were discussed in Chapter 7. A new
model was developed to describe the damage under creep-fatigue for IMI 829 and MAR M
002 and a new life prediction method was developed for MAR M 002 as set out in Chapter 7.
Diercks equation, which is a multivariate creep-fatigue life extrapolation equation for stainless
steel SS 304, was modified and extended to predict creep-fatigue life for low alloy steels in
this Chapter. The applicability of the modified Diercks equation for life prediction was
assessed in Chapter 8 using creep-fatigue data compiled in Chapter 4 for low alloy steels. As
the Diercks equation is a statistical method derived from a data bank for SS 304 in terms of a
multivariate equation, extension of this equation for the life prediction of low alloy steels does
not require creep-fatigue tests and material parameters determined therefrom, therefore, use of
this method may be made in generating creep-fatigue response curves for low alloy steels.
8.1. INTRODUCTION
Diercks equation (12), and other statistical methods, were widely explored (98-101) as an
alternate tool to phenomenological methods for the creep-fatigue life prediction of low alloy
steels and other materials. There are many phenomenological methods of life prediction
where no one method is better than other methods identified in Chapter 6. Hence, alternate to
phenom enological methods are explored in the creep-fatigue life prediction of high
temperature materials. Historically, Diercks and Raskey (12), in the Argonne National
Laboratory, compiled a bank of creep-fatigue data for stainless steel of type SS 304. They
(12) obtained a best fit multi-variate equation, known as the Diercks equation for the data.
Therefore, this equation contained several test parameters under which the data were

106
compiled and fitted with a multi-variate equation. The American Society of Mechanical
Engineers (5) recommended this equation for the construction of fatigue diagrams for SS
304.
8.2. DIERCKS EQUATION
The multi-vanate best fit Diercks equation, has been expressed (12) by regression functions
in strain range, strain rate, temperature, and hold time parameters for creep-fatigue life
extrapolation of SS 304, as follows:
(log N f)_1/2= 1.20551064 + 0.66002143 S + 0.18040042 S2 - 0.00814329 S4
+ 0.00025308 RS4+ 0.00021832 TS4 - 0.00054660 RT2- 0.005567 RH2-
0.00293919HR2+ 0.0119714HT - 0.00051639 H2T2. (8.1)
where, S is a strain range parameter (S= Ae t /100), R is a strain rate parameter R = (log £),
T is a temperature parameter (T= Tc/100), H is a hold time parameter, H= log(l+th), Aet is
the percentage total strain range, £ is the strain rate, Tc is test temperature for SS 304 and th
is the duration of hold time in hours.
Modifications were made to the equation by Kitagawa et al (13) by introducing a
fatigue (a ) and a temperature correction factor (Ta) such that the life predicted for SS 304 was
for a low alloy steel. The fatigue correction factor (a) or "cycle ratio" was observed to be
temperature, strain range and strain rate dependent where it varied from 1 to 5 for high to low
strain ranges under the condition that the other test parameters remained constant. The "cycle
ratio" (a ) is a ratio of life for SS 304 and a low alloy steel under same test conditions and
requires the fatigue data for both the materials.
a = Nf (of SS 304) / Nf (of low alloy steel) under same conditions.
[ log (a N f)]_1/2 = C (right hand side of equation 8.1) (8.2)
Also, the modifications proposed in (13) required relative material properties for SS 304 and
a low alloy steel, as evident in equation 8.2, under the same test conditions to establish the
fatigue correction factor. The temperature correction factor required the iso-stress creep

107
rupture properties, which is the value of stress at which same creep rupture life for SS 304
and the low alloy steel occur, when the temperature changed. Kitagawa et al (13), found that
the iso-stress creep rupture properties of low alloy steels ranged from 50 to 100°C lower than
the creep rupture properties of SS 304 at the same stresses . With the introduction of the
temperature correction factor in equation 8.2, creep-fatigue life for low alloy steels did not
change significantly when life prediction was carried out with equation 8.2. Hence, the
temperature correction factor was assumed to be the same from (13) with the assumption that
iso-stress creep rupture behaviour for low alloy steels was 100°C lower than SS 304. A
limited number of creep-fatigue data for 2.25Cr-Mo and 9Cr-lM o were analyzed in (13)
where the prediction was found in a factor of + x2.
The material data for SS 304 and low alloy steels are quite scarce, hence it was very
difficult to establish the fatigue and temperature correction factors. Therefore, a simpler
modification was needed to make this equation applicable for a wide range of conditions and
low alloy steels. A cycle time factor and a material dependent equivalent strain rate term were
introduced to modify Diercks equation. These were determined for every low alloy steel
using the data fitting techniques and by trial and error methods by fitting a selected set of
data. Later, these terms were kept constant for each low alloy steel and life assessment was
carried out. The proposed modifications were conducted to generalize the equation due
mainly to the lack of strain rates and other test details in the published literature.
8.3. MODIFICATION OF DIERCKS EQUATION
The Diercks equation (12) is modified in this section due mainly to the complexities
associated with the modifications proposed by Kitagawa et al (13). The two parameters, for
example, fatigue and temperature correction factors required a bank of data under a range of
test conditions to establish them. Hence, a simpler modification was needed to extend the
applicability of Diercks equation in the life prediction of low alloy steels. A simpler
modification undertaken in this investigation is described below.
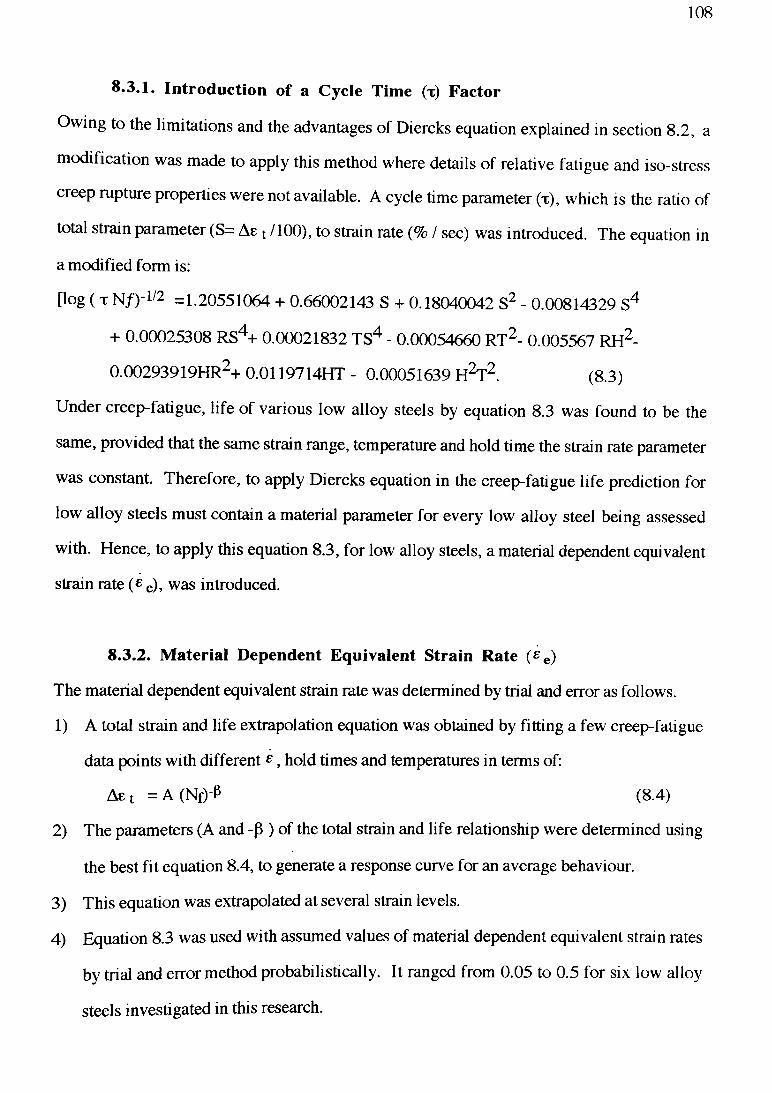
108
8.3.1. Introduction of a Cycle Time (x) Factor
Owing to the limitations and the advantages of Diercks equation explained in section 8.2, a
modification was made to apply this method where details of relative fatigue and iso-stress
creep rupture properties were not available. A cycle time parameter (x), which is the ratio of
total strain parameter (S= A e t /100), to strain rate (% / sec) was introduced. The equation in
a modified form is:
[log ( x N f)~112 =1.20551064 + 0.66002143 S + 0.18040042 S2 - 0.00814329 S4
+ 0.00025308 RS4+ 0.00021832 TS4 - 0.00054660 RT2- 0.005567 RH2-
0.00293919HR2+ 0.0119714HT - 0.00051639 H2T2. (8.3)
Under creep-fatigue, life of various low alloy steels by equation 8.3 was found to be the
same, provided that the same strain range, temperature and hold time the strain rate parameter
was constant. Therefore, to apply Diercks equation in the creep-fatigue life prediction for
low alloy steels must contain a material parameter for every low alloy steel being assessed
with. Hence, to apply this equation 8.3, for low alloy steels, a material dependent equivalent
strain rate (e e), was introduced.
8.3.2. Material Dependent Equivalent Strain Rate ( £ e )
The material dependent equivalent strain rate was determined by trial and error as follows.
1) A total strain and life extrapolation equation was obtained by fitting a few creep-fatigue
data points with different £ , hold times and temperatures in terms of:
Ae t = A (Nf)'P (8.4)
2) The parameters (A and -p ) of the total strain and life relationship were determined using
the best fit equation 8.4, to generate a response curve for an average behaviour.
3) This equation was extrapolated at several strain levels.
4) Equation 8.3 was used with assumed values of material dependent equivalent strain rates
by trial and error method probabilistically. It ranged from 0.05 to 0.5 for six low alloy
steels investigated in this research.

109
5) The value of material dependent equivalent strain rate (£ e), was selected when a good
degree of fit between the extrapolated life and that predicted by equation 8.3 was
obtained. Choices may be made between the most conservative and least conservative
responses.
Figure 8.1 describes the fit between the extrapolated behaviour with the life predicted
by equation 8.3, with different values of material dependent equivalent strain rate (£ e)-
Further derivatives of the material dependent equivalent strain rate should be derived
depending upon the individual material condition, composition, and the form of the materials
by the method described in section 8.3.2.
Material dependent equivalent strain rate varied from data to data as the parameters of
the extrapolated equation changed with the creep-fatigue test types. For the six low alloy
steels studied in this investigation, the material dependent equivalent strain rate ranged from
0.1 to 0.5. However, one value of the material dependent equivalent strain rate may be very
conservative for one type of creep-fatigue data with a particular hold direction and may over
predict for the other holds. Hence, the material dependent strain rate should be determined by
appropriate data fitting. The material parameters were kept constant for all combinations of
hold times and strain ranges for six low alloy steels tabulated in Table 8.1.
Table 8.1. Material parameters of modified Diercks equation.
Material Material dependent term or
equivalent strain rate.
Temperature difference in °C
from SS 304.
0.5Cr-Mo-V 0.1 100
lCr-Mo-V 0.1 100
1.25Cr-Mo 0.25 100
2.25Cr-Mo 0.5 100
2.25Cr-Mo-V 0.5 100
9Cr-Mo 0.5 100

Tot
al s
trai
n R
ange
Cycles to fa ilu reF ie 8 1. D eterm ination of m ateria l dependent equivalent s tra in ra te (M DESR)
for lC r-M o-V . .
110
8.3.3. Limitations of Modified Diercks Equation
A few limitations of the modified method are:
1 equations (1-3) only account for hold times in tension,
2 equations (1-3) apply only below a life of 10000 cycles,
3 modified equation 8.3 applies when plastic strain greater than elastic strain range, and
4 the effect of strain rate and waveforms are accounted in tension.
8.4. APPLICABILITY OF MODIFIED DIERCKS EQUATION
The life prediction equation 8.3 was assessed with all the creep-fatigue data compiled in
Chapter 4 and the analysis was carried out for every data point presented in Appendix I. In
some cases, for example, combined cycles, were beyond the scope of this equation which
predicted the same lives under same strain range and hold times with different combined
cycles. The effects of combined cycles were very complex where it either resulted in
improving or deteriorating the life which was difficult to model and such creep-fatigue data
were not assessed with other methods of life prediction discussed in Chapter 6. The
comparison of life predicted by the modified Diercks equation with the experimentally
determined lives for all the compiled data are tabulated in Tables A4 - A 19 in Appendix I.
8.4.1. Life Prediction by Modified Diercks Equation for 0.5Cr-Mo-V Steel
8.4.1.1. Batch 1: Limited data were available for this low alloy steel where only 6% of
the test data points were predicted outside the factor of + x2. The remaining 94% of test data
points were predicted in a factor of 2. From 30 min. to 16 hour tensile hold times were
assessed and shown in Fig. 8.2. Details of predicted and actual lives are tabulated in Table
A4 in Appendix I.

Pre
dict
ed
life
Fig. 8.2. Life Prediction of 0.5Cr-Mo-V "Batch”! by Modified Dierck's Equation.
I l l
8-4.2. Life Prediction by Modified Diercks Equation for lCr-Mo-V Steel
8 .4 .2 .1 . Batch 1 and 2: Comprised interspersion fatigue-creep tests with 23 and 47
hours tensile hold times for the lCr-M o-V steels. The effect of combined cycles on the
creep-fatigue behaviour were noted in Chapter 5. There were beneficial as well as damaging
effects of combined cycles, that were like other methods, unaccounted by this model.
Predicted life was the same for the same strain range and the same hold time but with
different combined cycles. The details of the life predicted by modified Diercks equation for
a range of data points are presented in Table A5 in Appendix I.
8.4.2.2. Batch 3: When assessed, 70% of test data points were predicted in a factor of +
x 2, and remaining 30% of data were in a factor from 3 to 11, shown in Fig. 8.3. The
discrepancy exists in the very nature of these data (11).
8 .4 .2 .3. Batch 4: A large number of test combinations were employed for this "batch".
The prediction by the modified Diercks equation was found conservative within a factor of +
x2, shown in Fig. 8.4. The beneficial effect caused by an unbalanced hold (16/0.003 hrs.),
enhanced life by 3 times than from only 16 hours tensile hold cycle such effects were not
accounted by any other method. However, life predicted for a 16 hrs. tensile dwell cycle was
in a factor of + x2.
8.4.2.4. Batch 5: Hold time sequences of 30 min. to 16 hours were assessed with the
modified Diercks equation. At lower strain ranges (0.5 to 0.6%), with hold times of 30 min.
and 16 hours, the life predicted by modified Diercks equation was very conservative. 75% of
the test data points were predicted in a factor of + x2 as shown in Fig. 8.5.
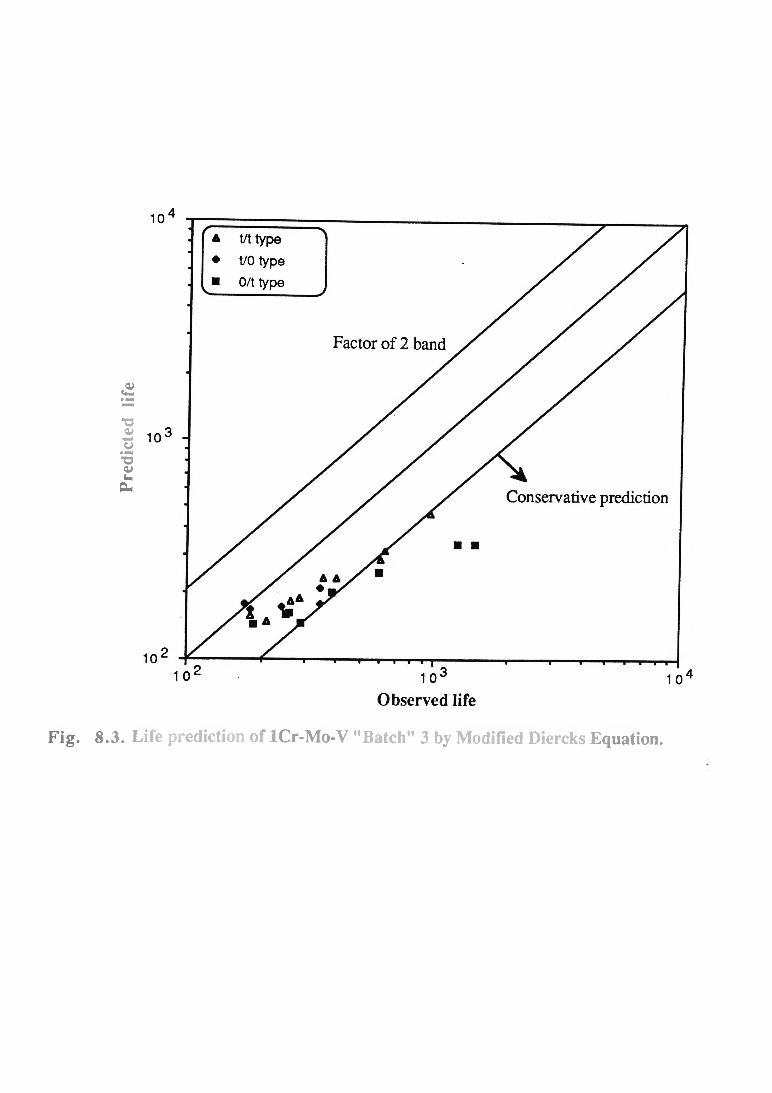
Pre
dict
ed
life
Fig. 8.3. Life prediction of lCr-Mo-V "Batch” 3 by Modified Diercks Equation.
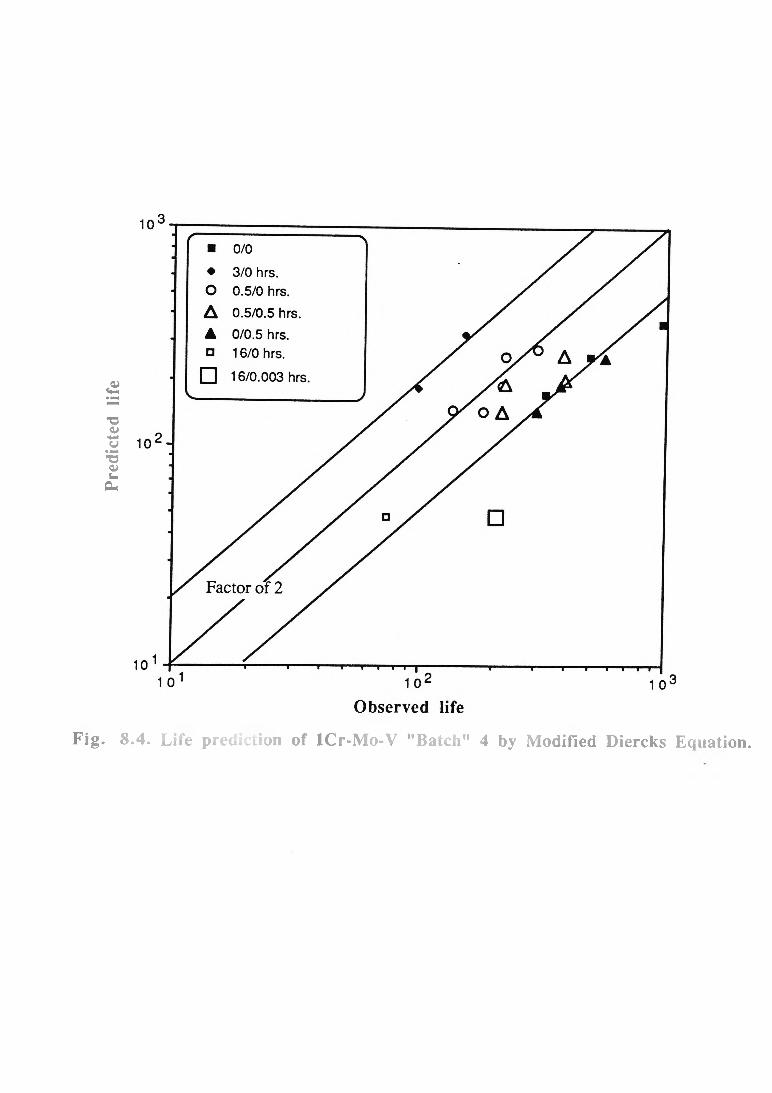
Pre
dict
ed
life
Fig. 8.4. Life prediction of lCr-Mo-V "Batch” 4 by Modified Diercks Equation.
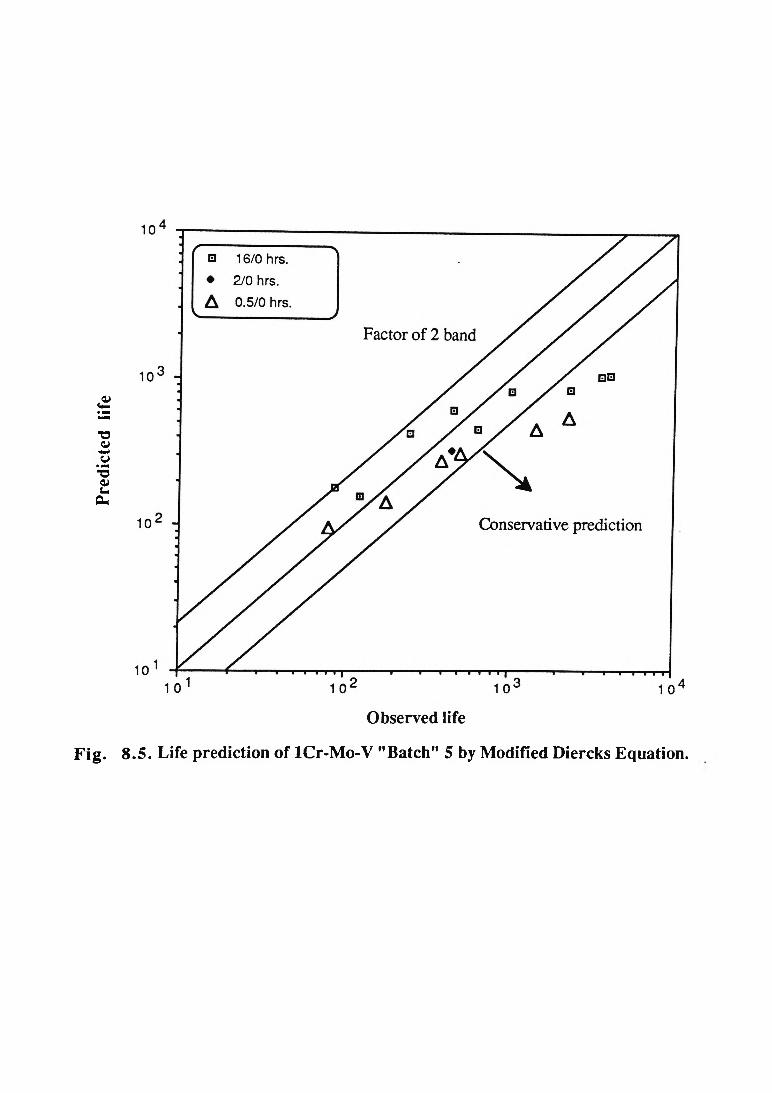
Pre
dict
ed
life
Fig. 8.5. Life prediction of ICr-Mo-V "Batch” 5 by Modified Diercks Equation.

112
8.4.3. Life Prediction by Modified Diercks Equation for 1.25Cr-Mo Steel
8 .4 .3 .1 . Batch 1: Pure fatigue and creep-fatigue combinations were analysed with the
modified Diercks equation. At least 66% of the test data points were predicted in a factor of
± x2 and the remaining 33% were predicted in a factor of 4 as shown in Fig. 8.6. The
discrepancy in the predicted life may be due to the definition of failure criterion which was
different for every test, where cycles to failure varied from 20, 33 and 40% decrease in load
levels.
8.4.3.2. Batch 2: As high as 90% of the test data points were predicted in a factor of +
x2. In the case of 30 min. hold cycle at 2.03% total strain range the life predicted by the
modified Diercks equation was in a factor of 2.06. All creep-fatigue data for "batch 2" were
predicted in a factor of ± x2 are shown in Fig. 8.7.
8.4.4. Life Prediction by Modified Diercks Equation for 2.25Cr-Mo Steel
8.4.4.1. Batch 1 and 2: Data compiled in batch 1 and 2 contained interspersion, creep
and fatigue type of tests that involved combined cycles. It was pointed out earlier that for a
lCr-M o-V steel "batch 1 and 2", combined cycles associated a healing or detrimental effect
that can not be accounted for in the models. The modified Diercks equation was assessed
with the data where predicted and actual lives are tabulated in Table A 12 in Appendix I.
8.4.4.2. Batch 3 : When assessed, 67.5% of the test data points were predicted in a factor
of + x2 and remaining 32.5% were predicted in a factor of + x3 shown in Fig. 8.8. It may
be seen from the data that 5 minutes tensile and compressive hold times were not causing any
damage at all, however, life prediction was in a factor of + x2.
8.4.4.3. Batch 4: When assessed below a life range of 104 cycles, for balanced hold
cycles only, the life was predicted in a factor of + x2 as shown in Fig. 8.9. For other data
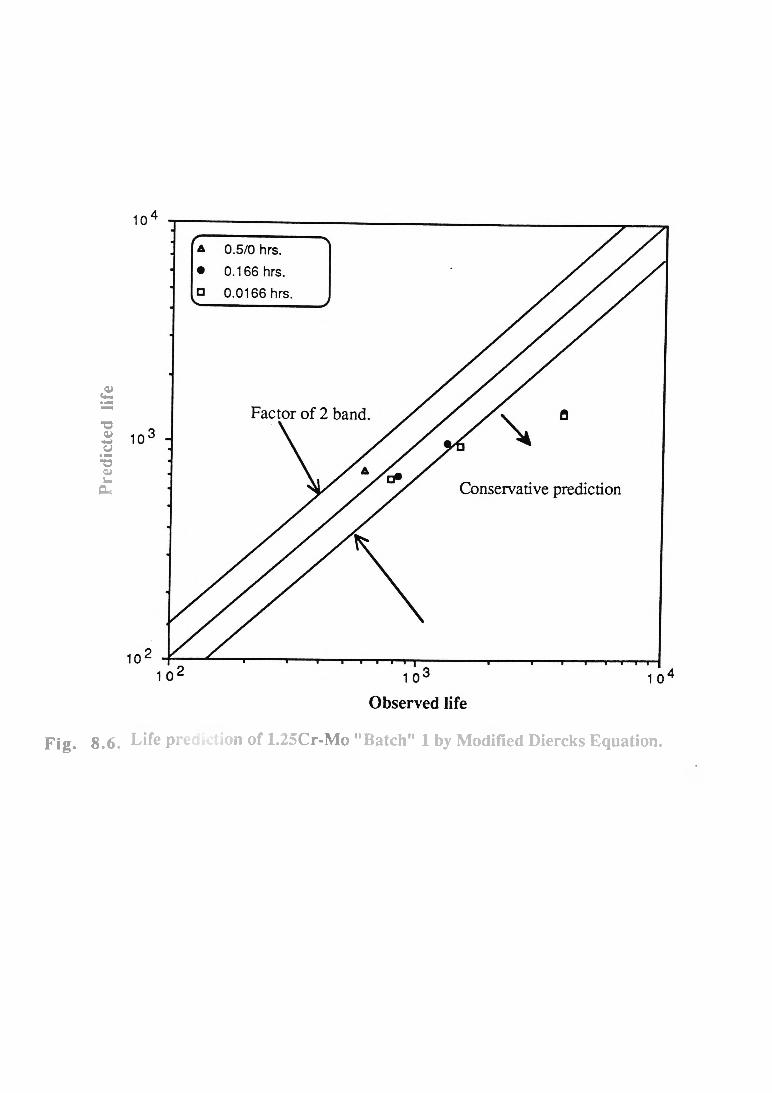
Pre
dict
ed
life
Fig. 8.6. Life prediction of 1.25Cr-Mo "Batch" 1 by Modified Diercks Equation.

Pre
dict
ed
life
Fig. 8.7. Life prediction of 1.25Cr-Mo "Batch" 2 by Modified Diercks Equation.
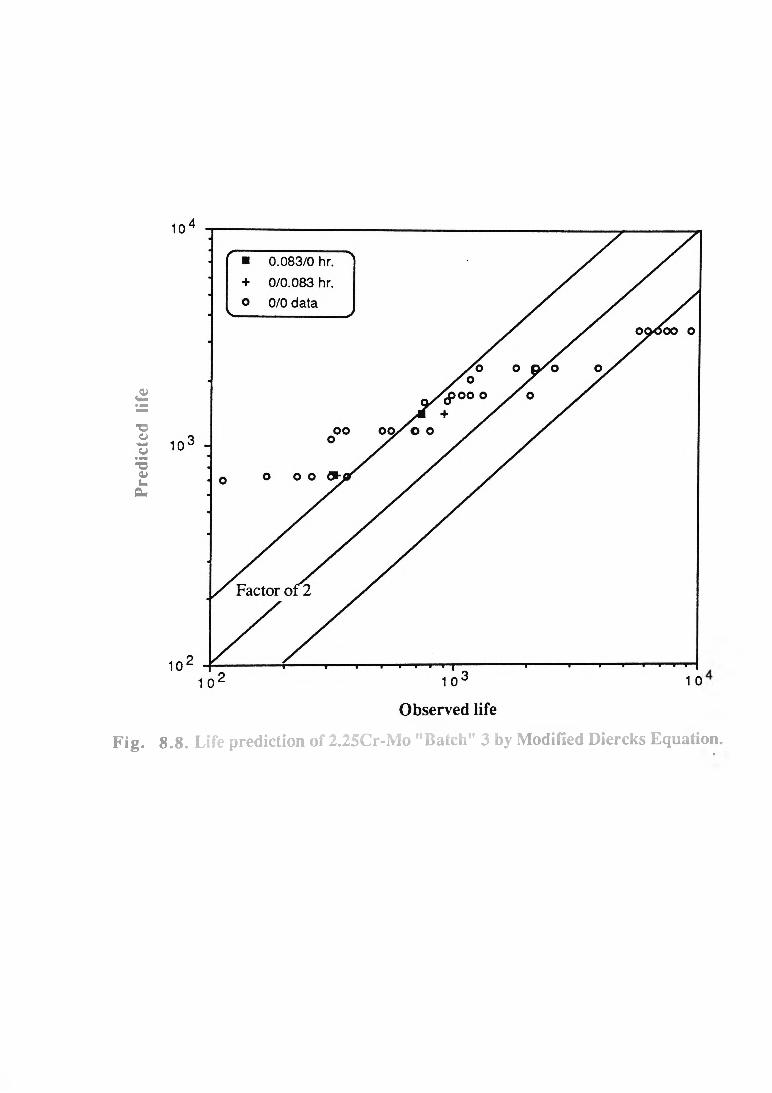
Pre
dict
ed
life
Fig. 8.8. Life prediction of 2.25Cr-Mo "Batch" 3 by Modified Diercks Equation.

Pre
dict
ed
life
Fig. 8.9. Life prediction of 2.25Cr-Mo "Batch" 4 by Modified Diercks Equation.
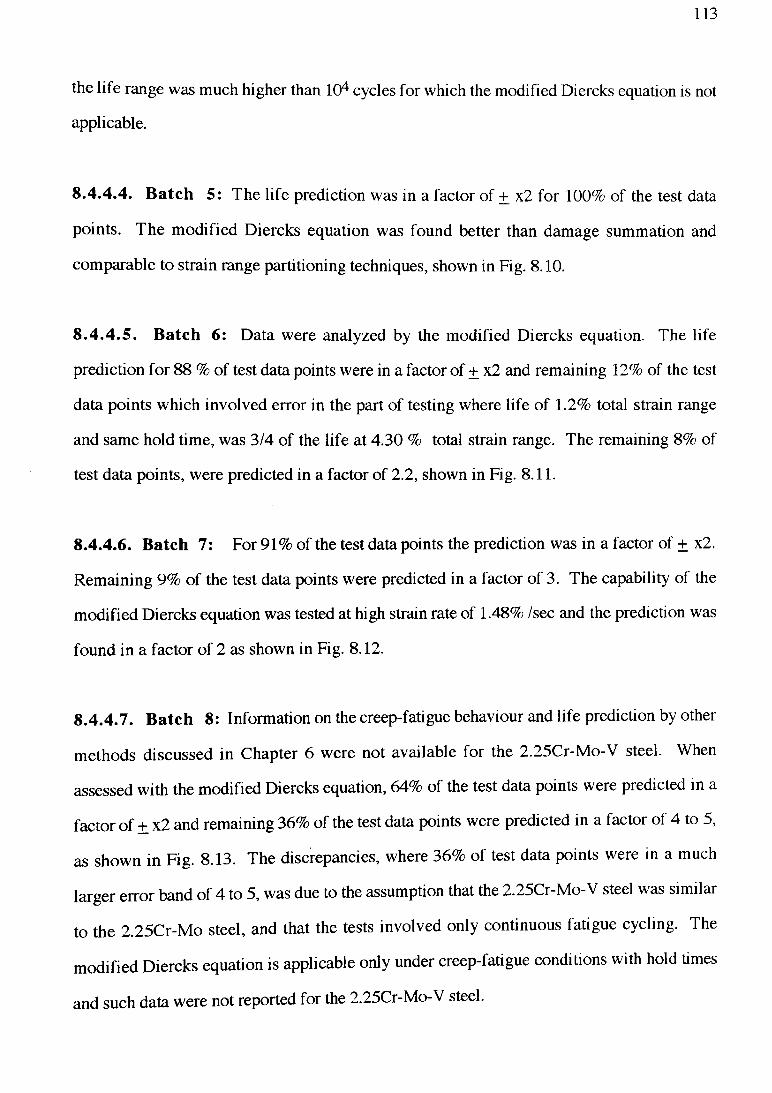
113
the life range was much higher than 104 cycles for which the modified Diercks equation is not
applicable.
8.4.4.4. Batch 5: The life prediction was in a factor of + x2 for 100% of the test data
points. The modified Diercks equation was found better than damage summation and
comparable to strain range partitioning techniques, shown in Fig. 8.10.
8.4 .4 .5 . Batch 6: Data were analyzed by the modified Diercks equation. The life
prediction for 88 % of test data points were in a factor of + x2 and remaining 12% of the test
data points which involved error in the part of testing where life of 1.2% total strain range
and same hold time, was 3/4 of the life at 4.30 % total strain range. The remaining 8% of
test data points, were predicted in a factor of 2.2, shown in Fig. 8.11.
8.4.4.6. Batch 7: For 91% of the test data points the prediction was in a factor of + x2.
Remaining 9% of the test data points were predicted in a factor of 3. The capability of the
modified Diercks equation was tested at high strain rate of 1.48% /sec and the prediction was
found in a factor of 2 as shown in Fig. 8.12.
8.4.4.7. Batch 8: Information on the creep-fatigue behaviour and life prediction by other
methods discussed in Chapter 6 were not available for the 2.25Cr-Mo-V steel. When
assessed with the modified Diercks equation, 64% of the test data points were predicted in a
factor of + x2 and remaining 36% of the test data points were predicted in a factor of 4 to 5,
as shown in Fig. 8.13. The discrepancies, where 36% of test data points were in a much
larger error band of 4 to 5, was due to the assumption that the 2.25Cr-Mo-V steel was similar
to the 2.25Cr-Mo steel, and that the tests involved only continuous fatigue cycling. The
modified Diercks equation is applicable only under creep-fatigue conditions with hold times
and such data were not reported for the 2.25Cr-Mo-V steel.

Pre
dict
ed
life
Fig. 8.10. Life prediction of 2.25Cr-Mo "Batch” 5 by Modified Diercks Equation.

Pre
dict
ed
life
Fig. 8.11* Life prediction of 2.25Cr-Mo "Batch” 6 by Modified Diercks Equation.
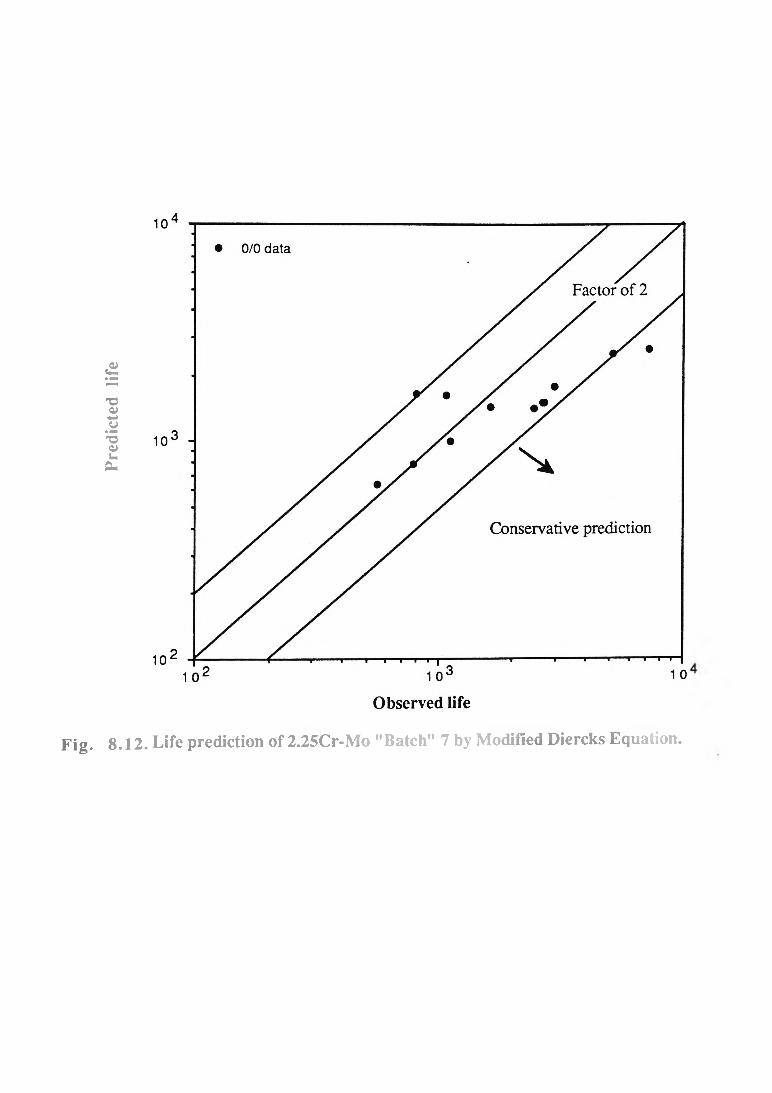
Pre
dict
ed
life
Fig. 8.12. Life prediction of 2.25Cr-Mo "Batch” 7 by Modified Diercks Equation.
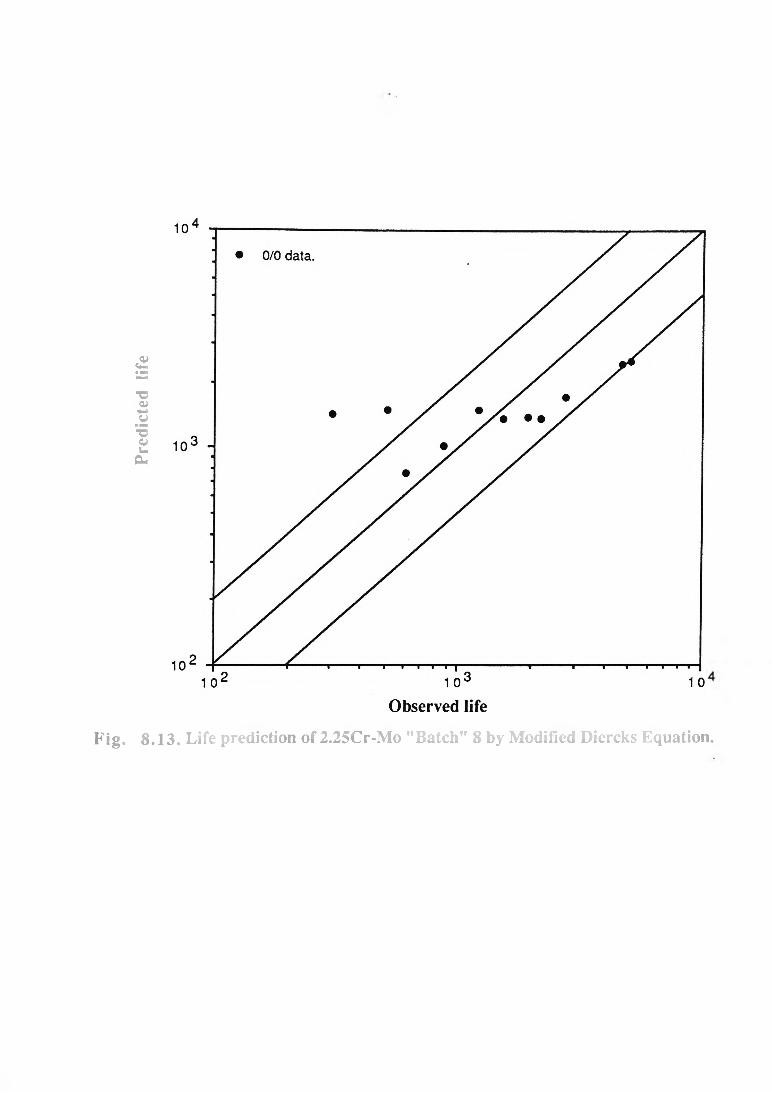
Pre
dict
ed
life
Fig. 8.13. Life prediction of 2.25Cr-Mo ’’Batch” 8 by Modified Diercks Equation.
8.4.5. Life Prediction by Modified Diercks Equation of 9Cr-lMo Steel
8.4.5.1. Batch 1: HTLCF data for 9Cr-lM o steel reported in batch 1 were analysed by
equation 8 3 which is applicable below 104 cycles. At least 90% of the test data points were
predicted in a factor of + x2, as shown in Fig. 8.14.
8.4.5.2. Batch 2: The modified Diercks equation was assessed with the creep-fatigue
data for the 9Cr-lM o steel. At a strain of 0.5%, with 15 minutes tensile hold, the prediction
by the modified Diercks equation was not good. However, as the hold time and temperature
increased, the prediction was found to improve and for 70% of the test data points the
prediction was in a factor of + x2 as shown in Fig. 8.15.
8.5. PREDICTION CAPABILITY AND LIMITATIONS OF MODIFIED
DIERCKS EQUATION
The success of a life prediction method depends upon the spread of the band in which the
observed and predicted data are distributed. In creep-fatigue life prediction, the acceptable
band is + x2 since a high statistical confidence (95%) is maintained with such a factor.
Creep-fatigue life prediction methods do not predict 100% of the test data points in a factor of
+ x2 as pointed out in Chapter 6. Comparison of prediction capability for damage summation
technique (DST), strain range partitioning (SRP) technique and R-5 with modified Diercks
equation (MDE) is provided in Tables 8.2 and 8.3. The percentage of test data points
predicted in a factor of + x2 by three methods for the same data are tabulated below.
Table 8.2. Comparison of the modified Diercks equation with other methods.
Material Batch no Temperature Heat Prediction Prediction Prediction by
Treatment by DST by SRP MDE
lCr-Mo-V 4 565° C N&T 57% 85% 100%
3 600° C N&T 70% 100% 67.5%

Pre
dict
ed
life
Fig. 8.14. Life prediction of 9Cr-lMo “Batch 1” by Modified Diercks Equation.
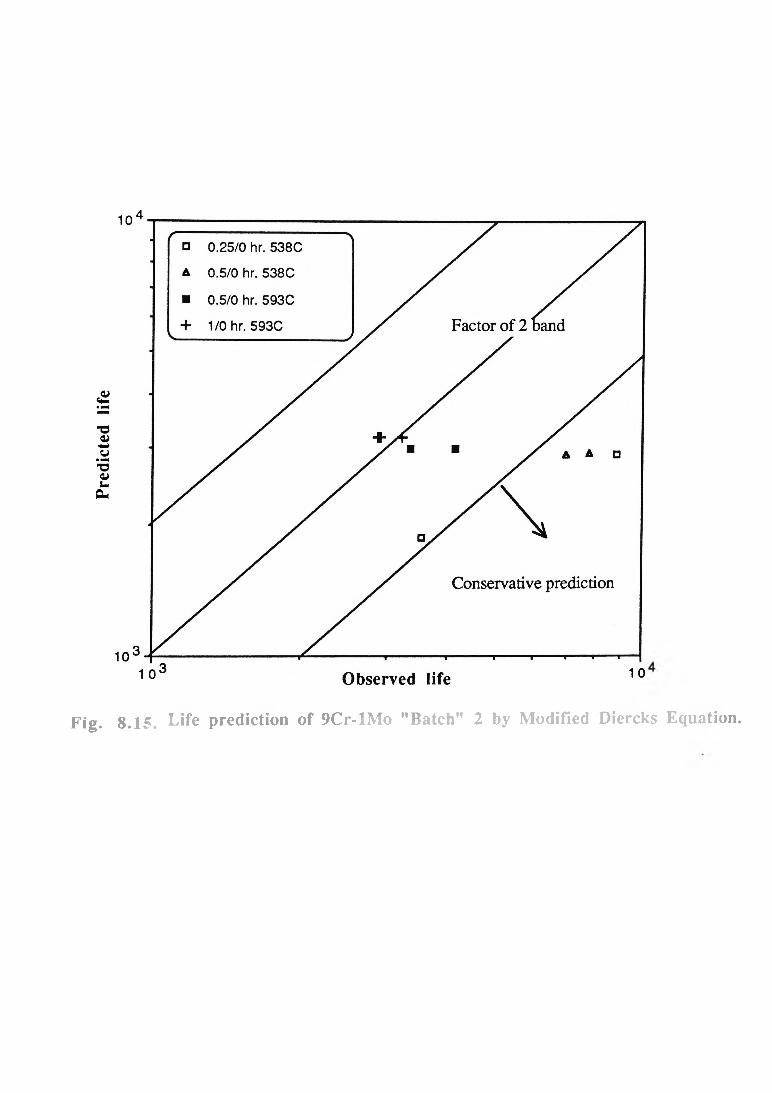
Fig. 8.15. Life prediction of 9Cr-lMo "Batch” 2 by Modified Diercks Equation.

115
5 600° C N&T 0% 100% 100%
Table 8.2. Comparison of prediction capabilities of R-5 and MDE.
Material Batch no Temperature Heat Prediction Prediction
°C Treatment by R-5 by MDE
0.5Cr- 1 550 N&T 68% 94%
Mo-V
lCr-Mo-V 5 550 N&T 50% 68%
At least, 61.5% of test data points were predicted in a factor of + x2 by the modified Diercks
equation. It is a simpler method, and does not require creep-fatigue tests and predicted
comparable lives that of strain range partitioning and damage summation techniques.
Only batch 4 of lCr-Mo-V was tested for different hold times in tension and
compression and this set of data is ideal for assessment of the capability of a method. When
this data set was assessed with all the popular methods of life prediction described in Chapter
6, it was found that no method was adequate (15). However, all the test data points were
predicted in a factor of + x2 by modified Diercks equation and it is a better approach.
The modified Diercks equation, like other methods of life prediction, has some
limitations since it considers both the tension and compression holds equally damaging and
does not account for dwell sensitivity effects. In equation 8.1, a hold time parameter
accounted for the time of hold which was log (1+ hold time), in which only tensile hold times
can be analysed, as the logarithm of a negative quantity becomes infinite.
Also, in equation 8.3 prediction of hold times data was possible only with tensile
hold The modified Diercks equation was inadequate when the test parameters in tension and
compression directions changed. Hence balanced dwell cycles were analysed accounting for
116
the hold times only in tension. Healing effects that resulted from combined cycles or
unbalanced holds were not accounted for in the methods of life prediction discussed in
Chapter 6. Such data were under-predicted by all the methods discussed in Chapter 6.
Amidst these demerits, the modified Diercks equation was assessed with a bank of
data and the life predicted by this method was reasonable, carried out in this section. It did
not require the material parameters determined from complex creep-fatigue tests and the
modifications made are probabilistically for a cycle time and a material dependent parameter.
8 .6 . SUMMARY
The following were concluded:
(1) The modification of Diercks equation proposed in this research did not require any
relative material properties as required by other modifications. A cycle time parameter,
which was a ratio of strain range parameter with material dependent equivalent strain
rate was introduced in this modification.
(2) Material dependent equivalent strain rate was determined from data fitting. For
simplicity, by statistically fitting a set of creep-fatigue data for each low alloy steel, its
value was kept constant for that particular steel in this investigation.
(3) The modified Diercks equation can be applied to any creep-fatigue data with a length of
hold time within a life range below 104 cycles. However, compressive dwells together
with balanced and unbalanced cycles were treated to be as tensile dwells.
(4) The reliability of the modified Diercks equation was compared with other methods of
life prediction and was found better than the other methods.
(5) An approximate creep-fatigue response for low alloy steels can be derived with the
modified Diercks equation.

117
9. RELIABILITY ANALYSIS
A multivariate Diercks equation was modified and it was assessed in Chapter 8 with the
creep-fatigue data compiled in Chapter 4. Creep-fatigue life prediction carried out for low
alloy steels is analysed in this Chapter for statistical reliability. A reliability analysis
determines whether or not a method, such as modified Diercks equation, be extended in the
creep-fatigue life prediction of low alloy steels.
9.1. RELIABILITY ANALYSIS:
The standard error (SE) of estimate has been used to evaluate the accuracy of a life prediction
method (102) statistically and it was expressed in terms of equation 9.1
SE = V 2 (observed life - predicted life)2 / Num (9.1)
In fatigue design, cyclic lives are expressed in logarithmic terms. Hence, equation
9.1 can be represented in logarithmic form in equation 9.2.
SE = V Z(log(Nobserved) - log(Npredicted)2) / Num (9.2)
where N0bserved and Npredicted are observed and predicted lives respectively and Num refers
to the number of tests in a batch.
Equation 9.2 can be further simplified:
SE = V s (log(Nobs/Nprd. ))2 / Num (9.3)
To better understand the magnitude of scatter in life prediction, Saltsman and Halford
(47) proposed SE be represented in terms of "equivalent factor on life" (EF) which is defined
by the antilogarithm of SE.
The data compiled in Chapter 4 were assessed with modified Diercks equation in
Chapter 8 and predicted and observed lives were tabulated in Appendix I which were used to
determine SE and EF for all the batches of the data. The life prediction analysis performed
for the data is tabulated in Tables A4 - A 19 in Appendix I. The SE and EF of various low
alloy steel batches are set out in Table 9.1.

118
Table 9.1. Reliability of modified Diercks equation represented by SE and EF.
Material Temp. Batch % tesits in a factor of SE EF
°C 2 3 4
lCr-Mo-V (N&T) 540 1 85 15 0.055 1.135
1 Cr-Mo-V (N&T) 485 1 75 25 0.065 1.16
1 Cr-Mo-V (N&T) 538 2 50 50 0.1457 1.39
1 Cr-Mo-V (N&T) 483 2 50 50 0.081 1.205
1 Cr-Mo-V (N&T) 550 3 94 6 0.012 1.02
1 Cr-Mo-V (N&T) 565 4 100 0.008 1.01
1.25Cr-Mo (A/R) 550 1 67 33 0.102 1.26
1.25Cr-Mo(N&T) 600 2 100 0.021 1.05
2.25Cr-Mo (A) 540 1 60 20 20/5 0.234 1.71
2.25Cr-Mo(N&T) 540 1 67 33/5 0.058 1.14
2.25Cr-Mo(Q&T) 485 1 67 33 0.0256 1.06
2.25Cr-Mo (A) 538 2 100 0.0435 1.1
2.25Cr-Mo(N&T) 538 2 67 33 0.0136 1.03
2.25Cr-Mo(Q&T) 483 2 33 67 0.1692 1.47
2.25Cr-Mo(N&T) 600 3 67 33 0.005 1.01
2.25Cr-Mo(N&T) 502 4 100 0.0636 1.157
2.25Cr-Mo(N&T) 600 5 100 0.064 1.15
2.25Cr-Mo(N&T) 550 6 88 12 0.0059 1.013
2.25Cr-Mo(N&T) 593 7 91 9 0.055 1.135
2.25Cr-Mo-V 593 8 63.e 18 18 0.0282 1.06
9Cr-lM o (N&T) 550 1 90 10 0.0589 1.145
9Cr-lM o (N&T) 593 2 70 30 0.0625 1.154

119
The SE, standard error and the EF, equivalent factor on life were determined statistically,
when the percentage of test data points were predicted in a factor of 2 ,3 and 4 were presented
in Table 9.1, however, when the factor exceeded 4 it was expressed by percentage test data
points / range of factor.
From the above analysis it is evident that SE and EF are below a factor of 2 for all
batches of data. These values are determined statistically and help in proposing the
applicability of modified Diercks equation as a better method of life prediction under creep-
fatigue for low alloy steels.
9.2. SUMMARY:
In summary, the following conclusion was drawn:
(1) The reliability of Diercks equation, modified in this investigation, was found
better than other methods of life prediction.
120
10. CONCLUSIONS AND RECOMMENDATIONS
The objectives o f the present research "creep-fatigue behaviour and life prediction" were as
follows; 1) compile a data bank for low alloy steels and identify the unspecified details in
the data, 2) determine the trends in the behaviour for low alloy steels, 3) document the
damage mechanisms for titanium alloy IMI 829 and a superalloy MAR M 002, 4) review
phenomenological life prediction methods and examine their capability with the compiled
data, 5) modify Diercks equation and assess its applicability with low alloy steels, and 6)
develop a new life prediction method accounting for the oxidation for the life prediction of
MAR M 002. The following conclusions were drawn from this investigation:
(1) The trends identified in the creep-fatigue behaviour were:
(a) creep-fatigue behaviour o f low alloy steels depended upon the heat treatment
condition and performance for a 2.25Cr-Mo steel under annealed condition was
better than normalized and tempered and quenched and tempered condition,
(b) creep-fatigue life, in general, depended upon composition and improved with
increase in the chromium content, and
(c) alloying elements such as vanadium in a 2.25Cr-Mo steel caused a decrease in the
life.
(2) The trends in life prediction using phenomenological methods were:
(a) no method, such as the damage summation approach, the frequency modified
approach, the strain range partitioning technique, the damage parameter approach,
the damage rate approach, the hysteresis energy approach and the assessment
procedure R-5 was found better than other method,
(b) prediction capability of various methods depended upon the material conditions
such as heat treatment and test temperature employed, and with the increase in
temperature, the prediction capability deteriorated, and
121
(c) the damage summation approach was more suitable at lower temperatures (for
example 485°C) whereas, the strain range partitioning techniques was more
applicable at higher temperatures (for example 600-700°C) for annealed
condition.
(3) A statistical method known as the Diercks equation, was modified and simplified to
extend it to the creep-fatigue life prediction for low alloy steels.
(4) Applicability o f modified Diercks equation was assessed using the compiled creep-
fatigue data bank and it was found to be better than other methods.
(5) The damage features for a titanium alloy IMI 829 and a superalloy MAR M 002, both
tested under high temperature low cycle fatigue, contained oxidation. Oxide banding
was found to dominate in both materials and to cause intrusions and multiple cracking
in both the materials. In the case of MAR M 002, wedge type cracking and y* depletion
were observed. Damage features were documented and described by a five stage
model.
(6) A new empirical life prediction method was developed for the HTLCF life
prediction for MAR M 002 and assessed with available data. The new method predicted
life within one half to two times the experimental life or in a factor of ± x2 for most
HTLCF data.
A list of seven publications resulted from this research is presented at the beginning of this
thesis which demonstrates this area of research in the developmental stage. There is a need
to develop a consensus on several aspects of test and material parameters in the high
temperature low cycle fatigue testing. A standardised code of practise is needed with clear
definitions for parameters such as failure criteria, strain rates, extensometry, specimen
design and temperature and other controls. Wide variability exists in creep-fatigue data
from the same laboratory in test to test and data from different laboratories, these must be
identified and accounted in life prediction. The life prediction methods modified and
developed in this investigation need further work before their use be recommended.

122
REFERENCES
(1) Krempl, E. and Wundt, B. M. (1971) ASTM STP 489 p. 1.
(2) Gangadharan, A. C., Pai, D. H. and Berman, I. (1973) I, Mech. Eng. Paper No.
215.
(3) Cowles, B. A., Sims, D. L., Warren, J. R. and Miner, R.V. Jr. (1980) Trans.
ASME J. Eng. Mater. Tech. 102 p. 356.
(4) Cowles, B. A., Sims, D. L. and Warren, J. R. (1978) NASA Report No. CR
159409.
(5) American Society of Mechanical Engineers (1974) Code case N-47 ASME Boiler
and pressure vessel code.
(6) Coffin, L. F. (1976) International symposium on creep-fatigue interactions, Ed.
Curran, K. M., MPC 3, ASME NY p. 349.
(7) Manson, S. S., Halford, G. R. and Hirschberg, M. H. (1971) NASA report TMX
67838.
(8) Chrzanowski, N. (1976) Int. J. Mech. Science, 18 p. 69.
(9) Majumdar, S. and Maiya, P. S. (1978) ASME/CSME Pressure vessel and piping
conference, PVP PB 028.
(10) Ostergren, W. J. (1976) J. o f Testing and Evaluation, no. (4) p. 327.
(11) Goodall, I. W. and Thomas, D. L. (1990) "An assessment procedure for high
temperature response of structures" R-5, Nuclear Electric Pic., U.K..
(12) Diercks, D. R. and Raskey, D. T. (1976) in ASME Annual winter meeting, p. 33.
(13) Kitagawa, M., Nonaka, I. and Sonoya, K. in Fatigue-90 conference, 3, p. 1537.
(14) Reuchet, J. and Remy, L. (1983) Met. Trans. 14A. p.141.
(15) Priest, R. H. and Ellison, E. G. (1982) Resc. Mechanica Vol. 4.p.l27.
(16) Inoue, T., Igari, T., Okazaki, M. and Tokimasa, K. (1989) Nucl. Engrg. Des.
114, pp.311-21.
(17) Plumbridge, W. J. and Stanley, M. (1986).Int. J. fatigue. 8,(4) p.209.

123
(18) Ellison, E. G., Plumbridge, W. J. and Dean, M. S. (1984) Research Project No.
327, University of Bristol, Department of Mechanical Engineering.
(19) McMahon, C. J. and Coffin, L. F. (1970) Met. Trans. 1A, p. 3443.
(20) Coffin, L. F. (1972) Met. Trans. 3A, p. 1777.
(21) ASM (1978). Metals Handbook, Vol. 1.
(22) Wühler, A. (1958) Z. Bauw, 8 pp. 642 and also in v. 10, (1860) p. 583.
(23) Goodman, J. (1930) Mechanics Applied to Engineering, vol. 1, Ed., Longmans
Green, London.
(24) Basquin, D. H. (1910), Proc. ASTM 10 Part 11 p 625.
(25) Skelton, R. P. (1985) High Temp. Technol. 3, p. 179.
(26) Plumbridge, W. J. and Ellison, E. G. (1991) Fat. Frac. Engng. Mater. Struct. 14,
7, p. 721.
(27) Ashada, Y. and Mitsuhashi, S., (1980) in 4th Int. Conf. Pressure Vessel Tech. 1,
I Mech. Engrs, Paper C 48/80 p 321.
(28) Wareing, J. (1977). Met. Trans.8A, p.711.
(29) Ellis, J. R., Jakub, M. T., Jaske, C. E. and Utah, D. A. (1975) in Structural
Materials for service at elevated temperature in nuclear power generation, ed.
Schaefer, A.O. NY ASME M PC -l,p .213.
(30) . Ellison, E. G. (1992). University of Bristol, Private Communications.
(31) Swindeman, R. W., Farrell, K. and Conway, J. B. (1983) Thermal and
Environmental Effects in fatigue, research design interface, N.Y. ASME PVP 71,
p.121.
(32) Plumbridge, W. J., Priest, R. H. and Ellison, E. G. (1979) Proc. Int. Conf. on
Mech.Behaviour of Materials Cambridge.p.129.
(33) Brinkman, C. R. (1985) International Metals Reviews 30, (5) p.235.
(34) Coffin, L. F. (1974) Met. Trans. 5A p. 1053.

124
(35) Brinkman, C. R., Strizak, J. P., Booker, M. K. and Jaske, C. E. (1976) J. Nucl.
Mater. 62 (2/3) p.181.
(36) Plumbridge, W. J. and Ellison, E. G. (1990) Private Communications.
(37) Wareing, J., Tomkins, B., and Sumner, G. (1973) in Fatigue at elevated
Temperature, ASTM STP 520 p. 123.
(38) Jaske, C. E., Leis, B. N. and Pugh, C. E. (1975) ASME MPC -1, p. 191.
(39) Manson, S. S. (1965) Exp. Mechanics, 5, no. 7, p. 193.
(40) Muralidharan, U. and Manson, S. (1988) J. Testing and Evaluation, 16, no.2,
p. 124.
(41) Hales, R. (1980) Fat. Engng. Mater. Struct., 3 p. 339.
(42) Majumdar, S. (1987).Symposium on Thermal Stress, Material Deformation, and
Thermo-Mechanical fatigue - PVP vol. 123. ASME Book no. G00369. p.31.
(43) Priest, R. H. and Ellison, E. G. (1981) Mat. Sc. and Eng., 49, p. 7.
(44) Antolovitch, S. D., Domas, P. and Strudel, J. L. (1979). Met. Trans. 10A, p 1859.
(45) Sehitoglu, H. and Boismier, D. A.(1990). J. Engrg. Mater. & Techn. 112, p. 63.
(46) Batte, A. D., Thomas, G. and Carlton, R. G. (1982) C.E.G.B. Report
GDCD/PET/M D/17/82 (CEGB Report FWP 97).
(47) Saltsman, J. F. and Halford, G.R. (1979) in Methods for Predicting Material life
in Fatigue ASME MPC ed., W.J. Ostergren and J.R. Whitehead.
(48) Curran, R. M. and Wundt, B. M. (1976) in ASME Symposium on Creep-Fatigue
Interactions, NY ed., R.M. Curran p.203.
(49) Hoffelner, W., Melton, K. N. and Wuthrich, C. (1983) Fatigue Fract. Engeg.
Mater. & Struct. 6 (1) p. 77.
(50) Ellison, E. G. and Paterson, A. J. F. (1976) Proc. Instn. Mech. Engrs. 190 I-III
parts p. 321.
(51) Mann, S. D. (1989) M.S. Thesis, Monash University, Department of Materials
Engineering.
125
(52) Yamaguchi, K., Suzuki, N., Ijima, K., Kanazawa, K. and Nishijima, S. (1986)
Trans. Nat. Research Inst. Metals 28, (2) p.64.
(53) Inoue, T., Ohno, N., Suzuki, A. and Igari, T. (1989) Nucl. Engeg. Des. 114 p.295.
(54) Challenger, K. D. and Vining, P. G. (1983) Mater. Sci. & Engeg. 58 p. 257.
(55) Setoguchi, K., Igari, T. and Yamaguchi, M. (1984) Society of material Science
Japan, 33, 370 p. 862.
(56) Cusolito, R. and Mandorini, V. (1988) Commission of the European
Communities, Boite Postale, 1003, Luxembourg, Report no. EUR No. 8863.
(57) Teranishi, H. and McEvily, A. J. (1981) Fifth International Conference on
Fracture p. 2439.
(58) Plumbridge, W. J. and Ellison, E. G. (1990) Unpublished work carried out for
9Cr-lM o steel under the European Communities.
(59) Gieseke, B. G., Brinkman, C. R. and Maziasz, P. J. (1992) in First International
Symposium on Microstructures and Mechanical Properties o f Aging Materials.
(60) Brinkman, C. R. (1992-93) Private discussions.
(61) Smith, G. V. (1973) ASTM Data Series Publication DS 58 Prepared for the Metals
Properties Council.
(62) Jaske, C. E. and Mindlin, H. (1971) in 2.25Cr-Mo steel in Pressure Vessels and
Piping ASM Ep. 137.
(63) UKHTMTC/LCF/2/86 UK High Temperature Mechanical Testing Committee Jan
86.
(64) Narumoto, A. (1987). Japan -US joint seminar on advanced materials for severe
service applications (1986 Tokyo Japan), Ed. by Iida, K and Me Evily,A.J. p. 219.
(65) Melton, K. N. (1982). Mater.Sc. & Engrg. 55. p.21.
(66) Plumbridge, W. J. and Stanley, M. (1986) in I. Mech. Eng. Paper No. C250/86,
p. 377.
126
(67) Miller, D. A., Priest, R. H. and Ellison, E. G. (1984) High Temp. Mater, and
Processes, 6, (3&4) p. 155.
(68) Lloyd, G. J . and W areing, J. (1981) Metals Technology 804 p.297.
(69) Miner, M. A. (1945) Jr. of Applied Mechanics 12 -3 A p. 159.
(70) Robinson, E. L. (1952) Trans. ASME 74, 5 , p.777- 81.
(71) T aira , S. (1962). Creep in structures, Acad. Press, p. 96.
(72) Coffin, L. F., (1954) Trans. ASME (Series. A) 76, p. 931.
(73) Coffin, L. F. (1976) International symposium on Creep-fatigue interactions, Ed.
K.M. Curran, MPC.3, ASME N.Y. p.349.
(74) Coffin, L. F. Fatigue at high temperature and interpretation, Proceedings of Institute
of Mechanical Engineers. (1974) 9/74, p.188.
(75) Majumdar, S. and Maiya, P. S. (1978) ASME/CSME pressure vessel and piping
conference. PVP. PB 028.
(76) Manson, S. S. and Halford, G. R. (1983) Israel J. o f Tech. 21, p. 29.
(77) Manson, S. S. and Zab, R. (1977) ORNL / Sub 3988/1 Case reserve Western
University, Ohio .
(78) Majumdar, S.and Maiya, P. S. (1976) ANL report 76/58.
(79) Majumdar, S. and Maiya, P. S.(1979) Proc. of 3rd, Int. Conf. on the
mech.behaviour of materials Cambridge 79. 2, p.101.
(80) Morrow, J. (1965) ASTM -STP 378, p. 3.
(81) Kachanov, L. M. ( 1958) Izv Hkad Nank ssr otd Tekh. Nank No.8. p.26.
(82) Chaboche, J. L. Seminaire intemationale sur I' approche Locale de la rupture.
Moret -sur loing (1986) (ONERA TP 53).
(83) Lemaitre, J. and Plumtree, A. (1979) ASME EM (101).p.284.
(84) Becigo, V. and Ragazzoni, S. (1990) in 'Fatigue 90' vol. 3. p. 1541.
(85) Sonoya, K., Nonaka, I. and Kitagawa, M. (1991) The Iron and Steel Institute of
Japan, 31, (12) p.1424.
127
(86) Ellison, E. G. and Walton, D. (1973) I. Mech. Eng. Paper no. C 173.
(87) Kanazawa, K. and Yoshida, S. (1974) I. Mech. Eng. Paper no. C 226.
(88) Day, M. F.and Thomas, G. B. (1978) AGARD Conf. Proc. No. 243. paper 10.
(89) Halford, G. R., Saltsman, J. F. and Hirschberg, M. H. (1977) NASA Tech. Note
TM 73737.
(90) Chaboche, J. L., Policella, H. and Kaczmarek, H. (1978) AGARD Conf. Proc.
No. 243, paper, 4.
(91) Becigo, V., Fossati, C.and Ragazzoni, S. (1987) Low cycle fatigue ASTM STP
942.p.l237.
(92) AGARD CP 343 (1978) Charaterization of low cycle fatigue life by strain range
partitioning technique.
(93) Plumbridge, W. J. (1987). Fatigue and Fract. o f Engrg. Mater. & Struct. 10, (5)
p 385.
(94) Oshida, Y. and Liu, H. W. (1988) in Low Cycle Fatigue ASTM STP 942 Ed
Solomon, Halford, Kaisand and Leis.
(95) Das, G. and Vahldiek, F. W. (1989) in Corrosion and particle erosion at high
temperature, TMS-ASM Joint Symposium p. 531.
(96) Drapier, J. M. and Hirschberg, M. (1979) AGARD AR 130.
(97) Antolovitch, S. D., Liu, S. and Baur, R. (1981). Met Trans. 12A, p, 473.
(98) Wada, Y., Kawakami, Y. and Aoto, K. (1987) in Thermal stress, material
deformation and thermomechanical fatigue, Ed., H. Sehitoglu and S. Y. Zamrik
PVP vol. 123, p. 37.
(99) Aoto, K., Wada, Y. and Komine, R. (1987) same as (98) p. 43.
(100) Yamaguchi, K., Kobayashi, K., Ijima, K. and Nishijima, S., ASME J. Eng.
Mater, and Struc. in press.
(101) Taira. S., Fujino, M. and Ohtani, R. (1979) Fatigue of Engeg. Mater. Struct. 1,
p. 495.
128
(102) Spiegel, M. (1961) in Schaum's outline of theory and problems of statistics'
McGraw Hill Book Co. NY. p. 243.

1
APPENDIX I
In this section the analyses of life prediction for the MAR M 002 by empirical method
developed in Chapter 7 and low alloy steels by the modified Dierck's equation are provided.
The first three Tables (A1-A3) list the experimental and predicted lives for MAR M 002 and
Tables from A4-A19 describe for low alloy steels predicted by Modified Diercks Equation
(M D E ).
Life Prediction for MAR M 002 by the new method
The expression for the life prediction equation has the following form:
N f = [ D° .a / / {(2.(h)n log (l.l- t h )) }a ] . {D c} a .(ABin / £ ) 4 / a} (i-1)
where D° is diffusion coefficient for oxidation, a/ is the final crack size at failure (assumed
10% of gauge diameter), th is the time of hold (in hrs.), t is the test duration under 0/0
condition which is 0.9, 0.25 and 0.28 hrs. at 750 C, 850 C and 1000 C respectively , Dc is
the creep ductility, Ae in and e are inelastic strain range and strain rate respectively. The
exponent a in the above equation was calculated by fitting the data, it depended upon the test
temperature and increased with increase in temperature. The exponent was expressed
empirically with homologus temperature in equation i-2
a = log{1.49 (exp T h ) } (l"2)
where Th is the homologus temperature which is a ratio of test temperature with melting
temperature in absolute scale. It ranged from 0.28 to 0.4 for the test temperature range of
750°c to 1000°C. The symbols in the equation i-1 were assumed as follows:
'h' is the thickness of the oxide layer determined by assuming a parabolic law, whose growth
is represented by the equation.
Various parameters in the equation i-1 were determined as follows;
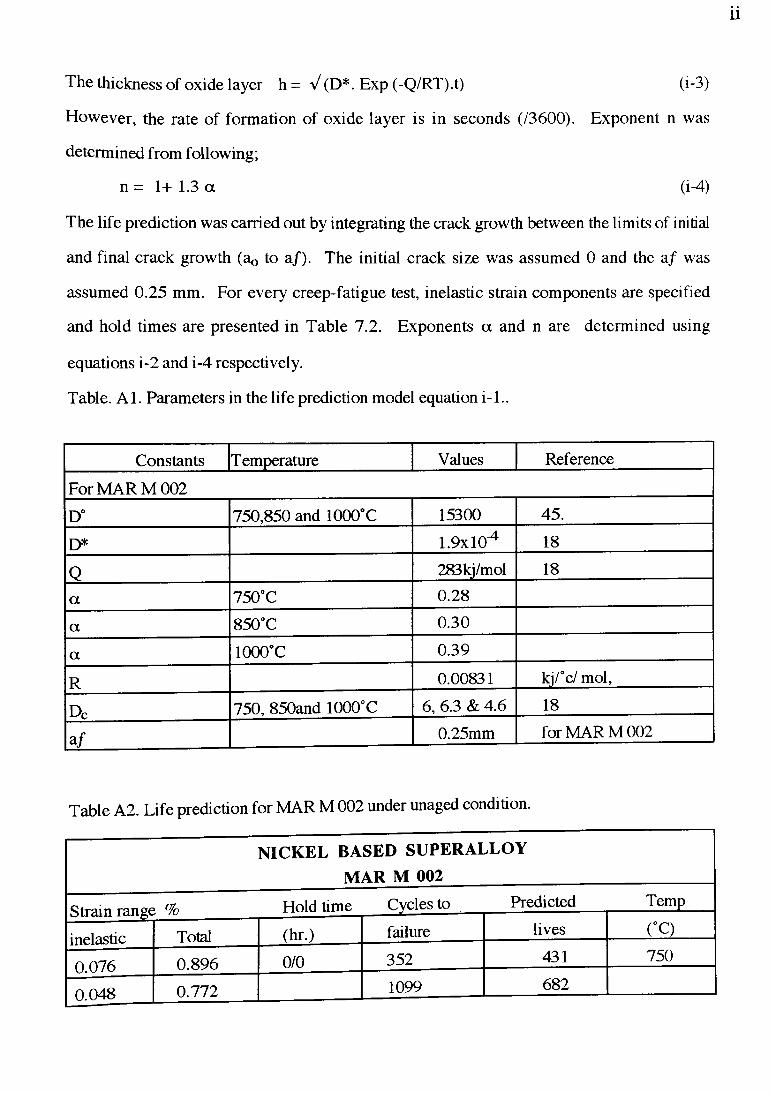
11
The thickness of oxide layer h = V (D*. Exp (-Q/RT).t) (i-3)
However, the rate of formation of oxide layer is in seconds (/3600). Exponent n was
determined from following;
n = 1+ 1.3 a (i-4)
The life prediction was carried out by integrating the crack growth between the limits of initial
and final crack growth (ao to a /). The initial crack size was assumed 0 and the a / was
assumed 0.25 mm. For every creep-fatigue test, inelastic strain components are specified
and hold times are presented in Table 7.2. Exponents a and n are determined using
equations i-2 and i-4 respectively.
Table. A l. Parameters in the life prediction model equation i-1..
Constants Temperature Values Reference
For MAR M 002
D° 750,850 and 1000°C 15300 45.
D* 1.9x10^ 18
Q 283kj/mol 18
a 750°C 0.28
a 850°C 0.30
a 1000°C 0.39
R 0.00831 kj/°c/ mol,
Dc 750, 850and 1000°C 6, 6.3 & 4.6 18
a.f 0.25mm for MAR M 002
Table A2. Life prediction for MAR M 002 under unaged condition.
NICKEL BASED SUPERALLOY MAR M 002
Strain range % Hold time Cycles to Predicted Temp
inelastic Total (hr.) failure lives CC)
0.076 0.896 0/0 352 431 750
0.048 0.772 1099 682

Ill
0.032 0.601 8490 1023
0.178 0.946 94 294 850
0.094 0.799 549 557
0.055 0.587 2590 952
0.411 0.808 127 125 1000
0.256 0.606 160 202
0.117 0.408 835 442
Summary of test results for unaged conditions.0.076 0.896 352 431 750
0.094 0.900 0 / 0.0833 133 276
0.115 0.906 0.0833 / 0 330 584
0.178 0.946 94 294 850
0.219 0.897 0 / 0.0833 28 186
0.133 0.664 0/0.0833 356 307
0.264 0.888 0.0833 / 0 290 423
0.410 0.921 .083/.083 49 127
0.411 0.808 127 125 1000
0.541 0.816 0/0.083 161 73
0.465 0.819 0.083/0 127 252
Table A3. Life prediction of MAR M 002 under aged condition.
Summary of test results for aged conditions.
0.095 0.706 15* 551 850
0.029 0.506 417* 1806
0.331 0.922 0/0.0833 2 123
0.111 0.514 0/0.0833 39* 1008
0.40 0.81 68 129 1000
0.18 0.52 952 287
0.059 0.26 >5420 877
0.38 0.74 0/0.0833 38 104
0.41 0.73 0.083/0 65 286
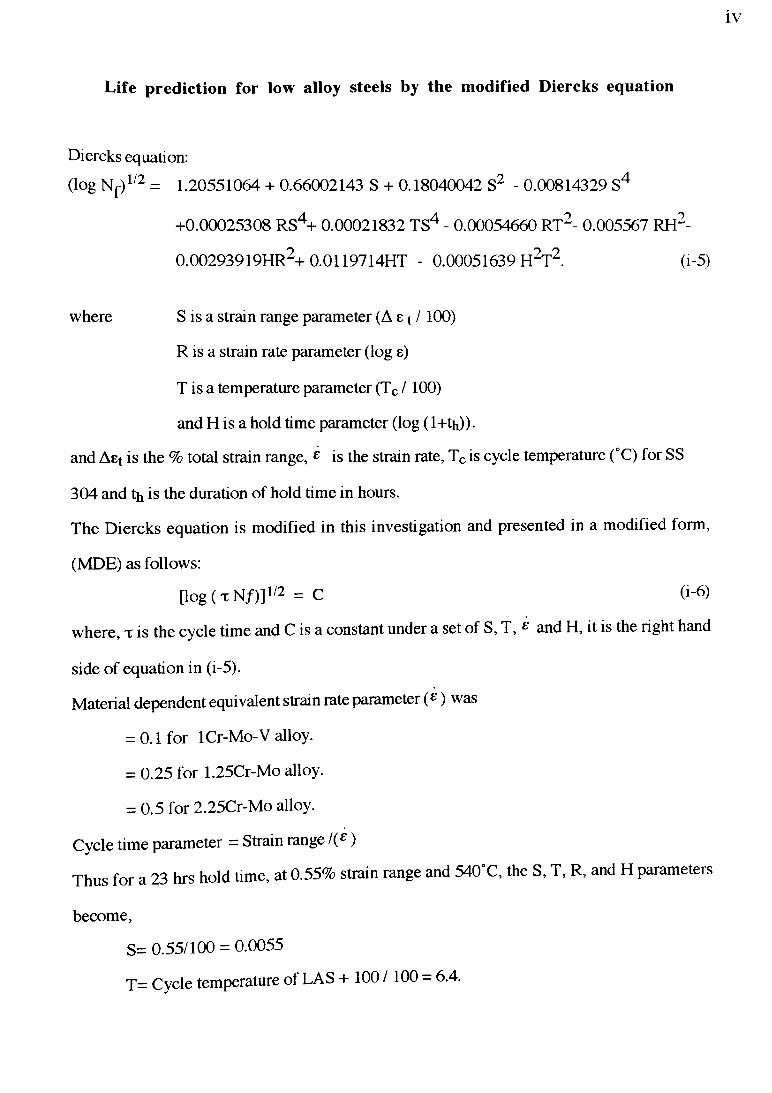
IV
Life prediction for low alloy steels by the modified Diercks equation
Diercks equation:
(log Nf)1/2 = 1.20551064 + 0.66002143 S + 0.18040042 S2 - 0.00814329 S4
+0.00025308 RS4+ 0.00021832 TS4 - 0.00054660 RT2- 0.005567 RH2-
0.00293919HR2+ 0.0119714HT - 0.00051639 H2T2 (i-5)
where S is a strain range parameter (A e t /100)
R is a strain rate parameter (log e)
T is a temperature parameter (Tc /100)
and H is a hold time parameter (log ( 1+th)).
and Aet is the % total strain range, £ is the strain rate, Tc is cycle temperature (°C) for SS
304 and th is the duration of hold time in hours.
The Diercks equation is modified in this investigation and presented in a modified form,
(MDE) as follows:
[log ( x N/)] l^2 = C (i-6)
where, x is the cycle time and C is a constant under a set of S, T, £ and H, it is the right hand
side of equation in (i-5).
Material dependent equivalent strain rate parameter (e ) was
= 0.1 for lCr-Mo-V alloy.
= 0.25 for 1.25Cr-Mo alloy.
= 0.5 for 2.25Cr-Mo alloy.
Cycle time parameter = Strain range l(£ )
Thus for a 23 hrs hold time, at 0.55% strain range and 540°C, the S, T, R, and H parameters
become,
s= 0.55/100 = 0.0055
T= Cycle temperature of LAS + 100 /100 = 6.4.
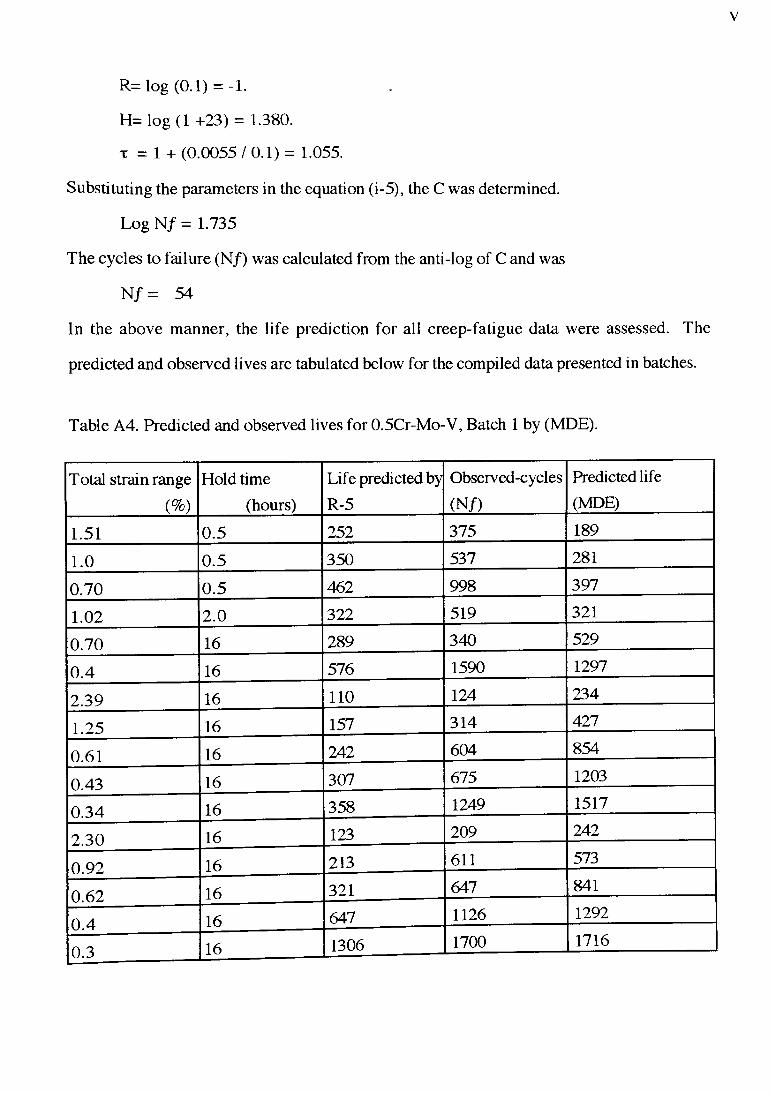
V
R= log (0.1) = -1. ..
H= log (1 +23) = 1.380.
x = 1 + (0 .0055 /0 .1 ) = 1.055.
Substituting the parameters in the equation (i-5), the C was determined.
Log N f = 1.735
The cycles to failure (N/ ) was calculated from the anti-log of C and was
N / = 54
In the above manner, the life prediction for all creep-fatigue data were assessed. The
predicted and observed lives are tabulated below for the compiled data presented in batches.
Table A4. Predicted and observed lives for 0.5Cr-Mo-V, Batch 1 by (MDE).
Total strain range(%)
Hold time(hours)
Life predicted by R-5
Observed-cycles
(Nf)
Predicted life (MDE)
1.51 0.5 252 375 189
1.0 0.5 350 537 281
0.70 0.5 462 998 397
1.02 2.0 322 519 321
0.70 16 289 340 529
0.4 16 576 1590 1297
2.39 16 110 124 234
1.25 16 157 314 427
0.61 16 242 604 854
0.43 16 307 675 1203
0.34 16 358 1249 1517
2.30 16 123 209 242
0.92 16 213 611 573
0.62 16 321 647 841
0.4 16 647 1126 1292
0.3 16 1306 1700 1716
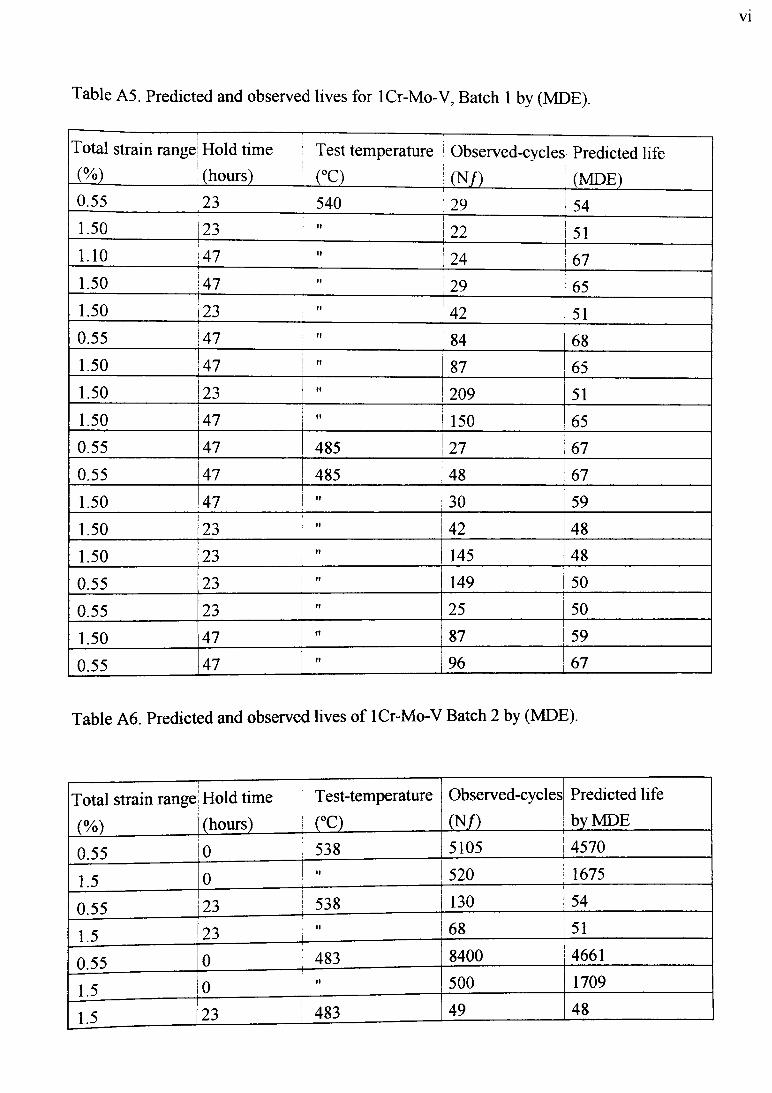
VI
Table A5. Predicted and observed lives for lCr-Mo-V, Batch 1 by (MDE).
Total strain rangej Hold time Test temperature i Observed-cycles Predicted life( % ) (hours) (°C) (N /) (MDE)0.55 23 540 : 29
-------------------- L----------------------------------------------54
1.50 23 tf 22 511.10 47 If « ---------------------------------------------------------------1.50 47 " 29 651.50 23 II 42 510.55 47 u 84 681.50 47 f f 87 651.50 23 ft 209 511.50 47 h 150 650.55 47 485 27 67
0.55 47 485 48 67
1.50 47 » 30 59
1.50 23 f l 42 48
1.50 23 » 145 48
0.55 23 f ! 149 50
0.55 23 ft 25 50
1.50 47 h 87 59
0.55 47 i i 96 67
Table A6. Predicted and observed lives of lCr-Mo-V Batch 2 by (MDE).
Total strain range
(%)
Hold time (hours)
Test-temperature
(°C) .
Observed-cycles
W )
Predicted life by MDE
0.55 0 538 5105 4570
1.5 0 tf 520 1675
0.55 23 538 130 54
1.5 23 tf 68 51
0.55 0 483 8400 4661
1.5 0 ft 500 1709
1.5 ¡23 483 49 48

vii
0.55 47 ! “ 96 610.55 47 ! “ 149 610.55 23 4C 161_________________ 50
Table A7. Predicted and observed lives o f lCr-Mo-V Batch 3 by (MDE).
Inelastic strain
m ___________
Total Strain
(%)
Test-temperature
(°C)
Observed-cycles
(N /)Predicted life by MDE
1.27 1.95 550 208 1490.84 1.5 283 190
0.57 1.2 400 236
1.6 2.14 165 148
2.57 2.7 165 120
2.29 2.54 90 79
0.946 1.6 340 179
1.004 1.67 240 172
1.038 1.72 180 167
2.257 2.5 52 48
0.95 1.62 171 177
0.708 1.35 340 211
1.554 2.22 113 98
2.33 2.54 92 79
1.297 1.98 285 147
1.14 1.81 250 160
2.18 2.33 95 89
0.24 0.83 1460 336
0.24 0.83 1230 336
0.76 1.41 380 202
1.32 2 185 145
1.11 1.78 255 162
0.5 1.13 590 250
0.3 0.9 625 311
0.57 1.2 350 236
1.167 1.84 180 157
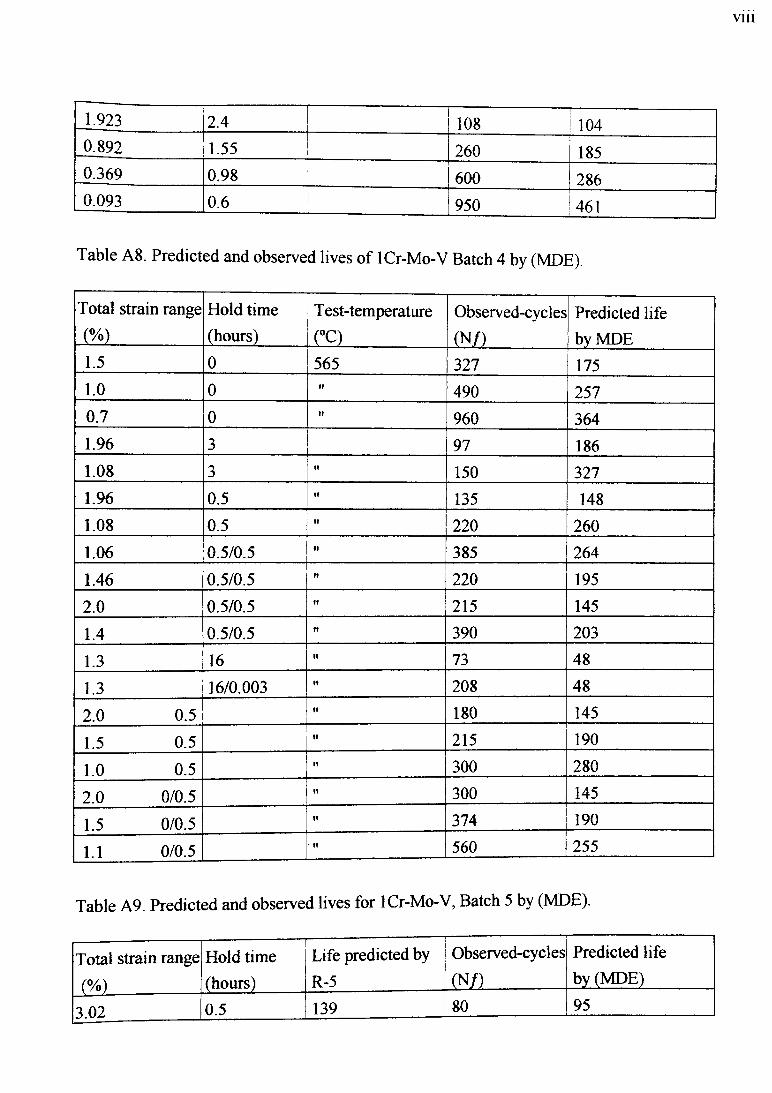
vili
1.923 2.4 108 1040.892 1.55 260 1850.369 0.98 600 2860.093 0.6 950 461
Table A8. Predicted and observed lives o f lCr-Mo-V Batch 4 by (MDE).
Total strain range
(%)
Hold time (hours)
Test-temperature
(°C)Observed-cycles(N /)
Predicted life by MDE
1.5 0 565 327 1751.0 0 » 490 2570.7 0 o 960 3641.96 3 97 1861.08 3 » 150 3271.96 0.5 « 135 1481.08 0.5 « 220 260
1.06 0.5/0.5 « 385 264
1.46 0.5/0.5 » 220 195
2.0 0.5/0.5 it 215 145
1.4 0.5/0.5 « 390 203
1.3 16 it 73 48
1.3 16/0.003 « 208 48
2.0 0.5 « 180 145
1.5 0.5 « 215 190
1.0 0.5 » 300 280
2.0 0/0.5 » 300 145
1.5 0/0.5 « 374 190
1.1 0/0.5 • « 560 255
Table A9. Predicted and observed lives for lCr-Mo-V, Batch 5 by (MDE).
Total strain range
(%)
Hold time (hours)
Life predicted by
R-5
Observed-cycles
J N f l__________
Predicted life by (MDE)
\ / —---- ■----------3.02 0.5 139 80 95
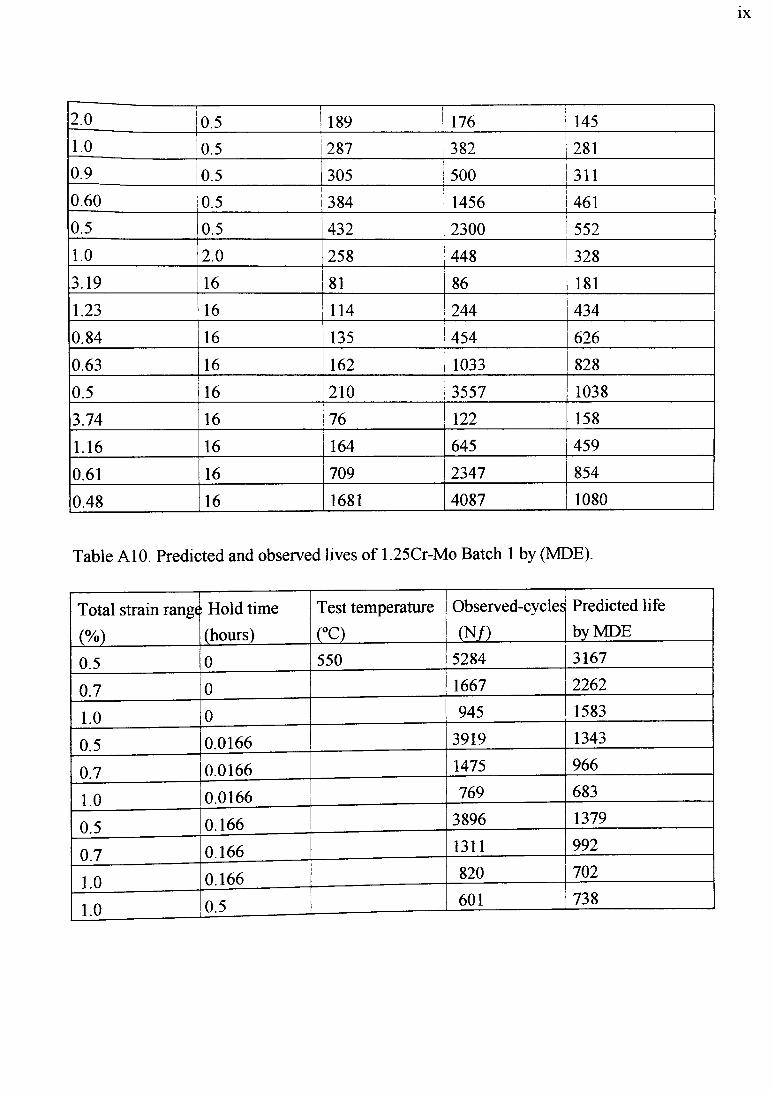
IX
2.0 0.5 189 176 1451.0 0.5 287 382 2810.9 0.5 305 500 | 3110.60 0.5 384
------------------------------------------------------- !1456 461
0.5 0.5 432 2300 5521.0 2.0 258 448 328
3.19 16 81 86 181
1.23 16 114 244 434
0.84 16 135 454 626
0.63 16 162 1033 828
0.5 16 210 3557 1038
3.74 16 76 122 158
1.16 16 164 645 459
0.61 16 709 2347 854
0.48 16 1681 4087 1080
Table A10. Predicted and observed lives of 1.25Cr-Mo Batch 1 by (MDE).
Total strain rang«
(%)
Hold time (hours)
Test temperature
(°C) _
Observed-cycles
(N /)
Predicted life by MDE
0.5 0 550 5284 3167
0.7 0 1667 2262
1.0 0 945 1583
0.5 0.0166 3919 1343
0.7 0.0166 1475 966
1.0 0.0166 769 683
0.5 0.166 3896 1379
0 7 0.166 1311 992
1 0 0.166 820 702
1.0 0.5 601 738

X
Table Al l . Predicted and observed lives of 1.25Cr-Mo Batch2 by (MDE)
Total strain range
(%)
. ; " H-----------------------1--- --------------------- -Hold time Test temperature i Observed-cycles Predicted life (hours) | (°C)_______ 1 (N/ ) by MDE
2.01 0 600 560 7881.52 0 " 760 10290.98 0 »1 1500 15960.62 0 »! 6100 25230.59 0 » 5800 26510.48 0 »» 5000 3259 '2.04 0.03 »» 418 3451.04 n h 871 652
2.05 0.08 h 327 346
0.95 t» »? 772 718
2.04 0.16 h 292 353
1.04 ?» h 605 668
2.03 0.5 »? 230 375
1.04 h h 455 707
2.03 1 »» 195 402
0.99 »! »» 418 792
Table A12. Predicted and observed lives o f 2.25Cr-Mo Batch 1 by (MDE).
Total strain range
(%)
Hold time
(hours)
Test temperature
(°C)
Observed-cycles
W )
Predicted life by MDE
0.55 47 540 67 82
1.50 23 h 141 65
2.30 47 »» 59 86
2.30 23 »» 73 66
1.50 23 h 202 65
1.50 23 »» 50 65
0.55 47 h 13 82
2.3 47 (( 24 86
2.3 23 ?» 43 66

XI
0.55 47 " | 60 821.5 23 M 110 650.55 47 485 23 731.50 23 1! 31 592.3 47 It 15 762.3 23 ft 29 600.55 47 f ! 48 731.50 23 It 77 59
Table A13. Predicted and observed lives o f 2.25Cr-Mo Batch 2 by (MDE).
Total strain rang«
(%)
;Hold time
(hours)
Test-temperature
(°C)
Observed-cycles
m
Predicted life by MDE
0.55 0 538 3655 1497
1.5 0 » 930 549
2.3 0 f f 348 358
0.55 47 H 67 82
0.55 23 II 103 63
1.50 23 ft 13 65
0.55 0 538 2990 1497
1.5 0 « 672 549
2.3 0 ii 281 358
0.55 47 it 13 82
0.55 23 H 32 63
0.55 47 H 60 82
1.5 23 n 13 65
0.55 0 483 7440 1507
1 50 0«1 474 552
2.3 0ft 265 360
0.55 47ft 23 72
0.55 23H 90 58
1.50 23 i i 77 59
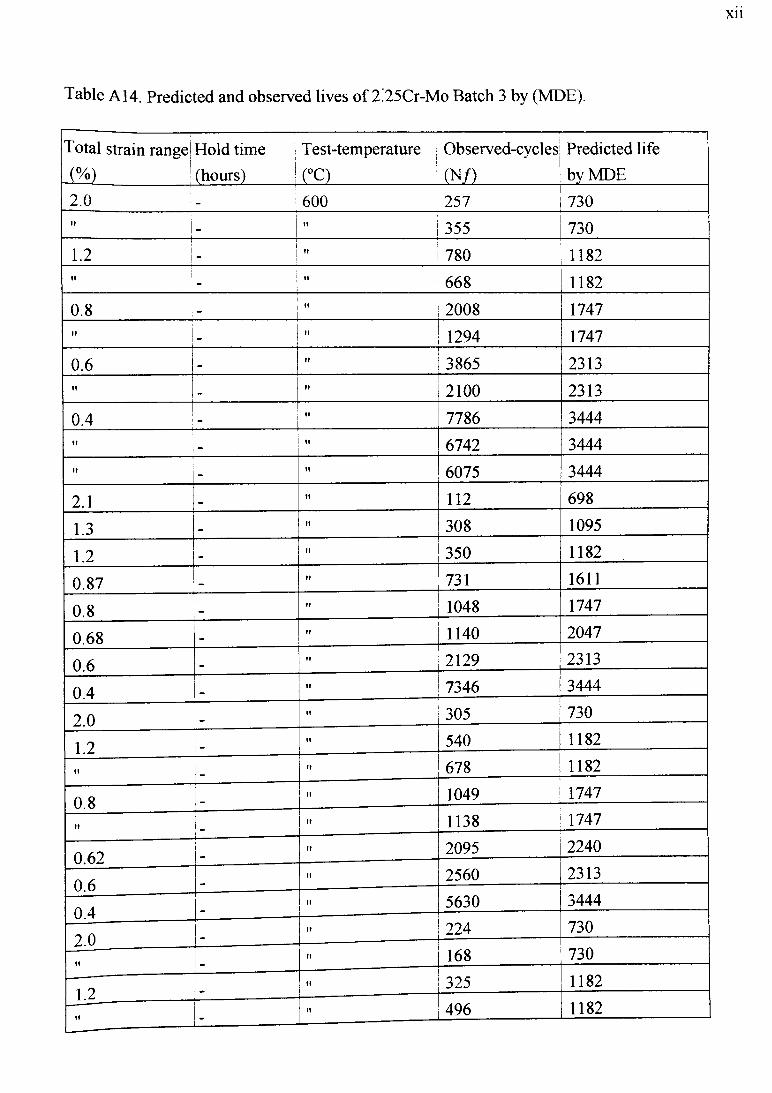
xii
Table A14. Predicted and observed lives of 2.25Cr-Mo Batch 3 by (MDE).
Total strain range
j % ) !
------------------------------ 1-------------------------- 1----------------------- 1----------------------------Hold time Test-temperature Observed-cycles Predicted life(hours) !(°C) | (N/) | by MDE
2.0 |— ------- L--------- j” -̂--1-------------------- 1—--- -̂---------------- 1-- *------------------------- ! 600 ! 257 | 730
» _ " 355 730
1.2 - " j 780 1182ii - " 668 1182
0.8 " 2008 1747II
- " 1294 1747
0.6 _m 3865 2313
i*_
ii 2100 2313
0.4 n 7786 3444II If 6742 3444II ii 6075 3444
2.1 ii 112 698
1.3 ll 308 1095
1.2 ll 350 1182
0.87 n 731 1611
0.8 ll 1048 1747
0.68ll 1140 2047
0.6ll 2129 2313
0.4ii 7346 3444
2.0ll 305 730
1.2ii 540 1182
1» ii 678 1182
0.8it 1049 1747
tt ll 1138 1747
0 62H 2095 2240
0 6ll 2560 2313
0 4ll 5630 3444
2 0ii 224 730
if . ll 168 730
1 2ii 325 1182
II - ll 496 1182
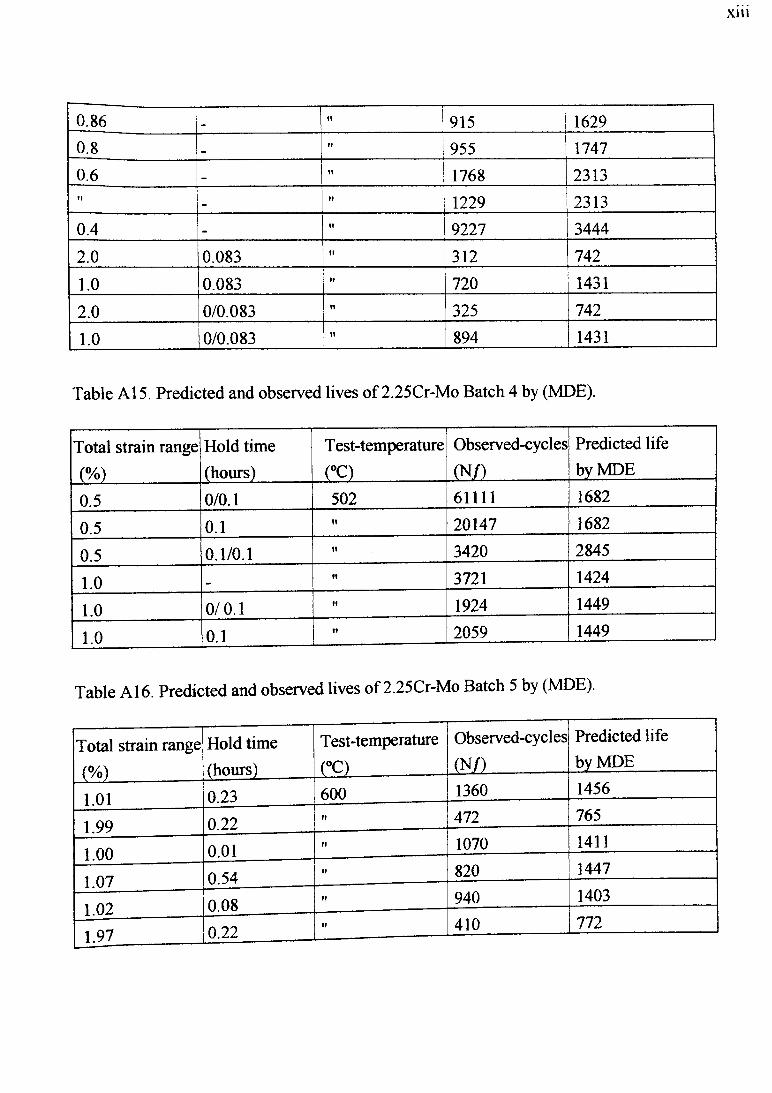
xiii
0.86 t ! 915 1629
0.8 * n 955 | 1747
0.6 II 1768 2313It _ „ 1229 2313
0.4 _ It 9227 3444
2.0 0.083 it 312 742
1.0 0.083 it 720 1431
2.0 0/0.083 i t 325 742
1.0 0/0.083 it 894 1431
Table A15. Predicted and observed lives o f 2.25Cr-Mo Batch 4 by (MDE).
Total strain range
(%)
Hold time (hours)
Test-temperature
(°C)
Observed-cycles
W )
Predicted life by MDE
0.5 0/0.1 502 61111 1682
0.5 0.1 H 20147 1682
0.5 0.1/0.1 ii 3420 2845
1.0 H 3721 1424
1.0 0/ 0.1 ii 1924 1449
1.0 0.1 ii 2059 1449
Table A 16. Predicted and observed lives o f 2.25Cr-Mo Batch 5 by (MDE).
Total strain range
(%)
Hold time (hours)
Test-temperature
( ° C ) __________
Observed-cycles
M Q__________
Predicted life bvM DE
\ ' vj__________ _1 01 0.23 600 1360 1456
1 99 0.22 H 472 765
1 00 0.01 H 1070 1411
1 07 0.54 ii 820 1447
1 02 0.08 ft 940 1403
1.97 0.22H 410 772

XIV
Table A17. Predicted and observed lives of 2.25Cr-Mo Batch 6 by (MDE).
Total strain range' Hold time Test-temperature Observed-cycles1 Predicted life
(%) (hours) I (°c) ; (N /) by MDE
3.20 i 0.016 550 | 234 482
2.15 !" i» 410 689
0.54 II I » 5200 2588
1.05 i t ! " 1520 1356
4.30 II " 200 374
3.20 II II 208 482
2.20 II II 380 675
1.20 II II 150 1193
0.52 II » 6100 2685
1.05 II » 1450 1356
4.25 0.034 II 165 379
3.00 II it 280 512
2.10 I I » 440 707
1.15 II II 1200 1247
0.68 II --------------------------------------- -» 2200 2072
4.1 0.166 II 180 400
3.0 t i » 265 524
2.2 i l » 345 693
1.2 i l II 1070 1225
0.66 i l II 2300 2185
4 0 » » 220 408
3 1 i l II 255 509
2 1 » l i 410 724
1 1n i i 1180 1331
0.60i l II 2750 2397
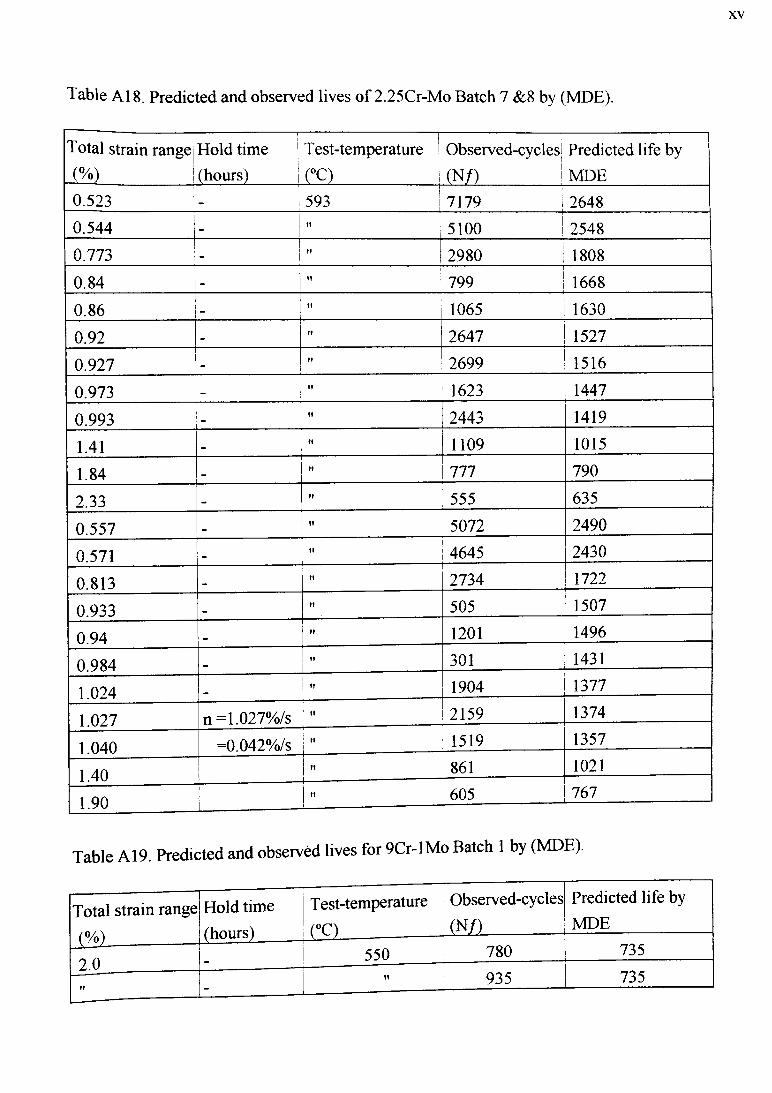
XV
Table A18. Predicted and observed lives of 2.25Cr-Mo Batch 7 &8 by (MDE).
Total strain range
(%)
Hold time Test-temperature (hours) (°C)
Observed-cycles Predicted life by (NO I MDE
0.523 - i 593— ^ ----------------1---------------------------
7179 i 2648
0.544 -It ---------------------- 1 ■ . . .
5100 | 2548
0.773 -tt 2980 1808
0.84 -ft 799 1668
0.86 _II 1065 1630
0.92 _t ! 2647 1527
0.927 -II 2699 1516
0.973 II 1623 1447
0.993 « II 2443 1419
1.41 _II 1109 1015
1.84 _If 111 790
2.33 If 555 635
0.557 t! 5072 2490
0.571 II 4645 2430
0.813 II 2734 1722
0.933 ft 505 1507
0.94 . t l 1201 1496
0.984 II 301 1431
1.024 tt 1904 1377
1.027 n=1.027%/s tt 2159 1374
1.040 =0.042%/s tt 1519 1357
1 40II 861 1021
1.90II 605 767
Table A19. Predicted and observed lives for 9Cr-lMo Batch 1 by (MDE).
Total strain range
(%)
Hold time
(hours)
Test-temperature
m ____________
Observed-cycles
m i __________
Predicted life by MDE
V /v2-------------- -—? 0 550 780 735
tt -tl 935 735

XVI
T 1---------------------------------- -f î —
947 735
1.2 V 1839 1189It M 1852 1189II _ M 1740 1189
0.6 - 11 16960 1400
_ M 13000 1400» - h 10300 1400