Creating Buy-In without a Bailout
Pat LeBlanc, DVM, MS, Diplomate, ACVADirector, Veterinary Teaching HospitalMichigan State UniversityPresident, AAVC
Creating a sense of financial ownership in a VTH
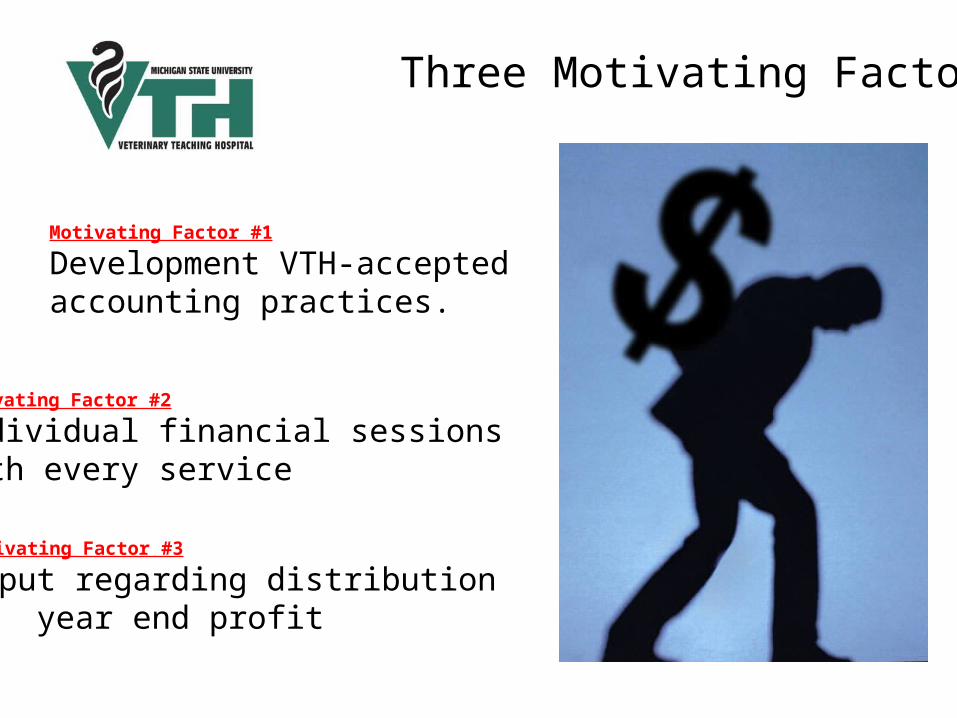
Motivating Factor #1
Development VTH-accepted accounting practices.
Motivating Factor #2
Individual financial sessions with every service
Motivating Factor #3
Input regarding distribution of year end profit
Three Motivating Factors

V
Generally Accepted Accounting Practices VTH Accepted Accounting Practices
=/

Cost accounting is performed on each of the following areas:
DermatologyEmergency Service (Small Animal)Equine Med / SurgeryFood Animal Med / SurgeryGeneral MedicineInternal MedicineOphthalmologyOncologyOrthopedicsSoft Tissue Surgery
AnesthesiaCentral SterilizationClinical PathologyDiagnostic labHospitalizationPharmacyRadiology
Primary Service Support Service

Profit / Loss Calculation for each Section
Motivating Factor #1 - Accepted Accounting Practices
Gross revenues
- Discounts
Net revenues
- Var. Expenses
- Fixed Expenses
Profit or Loss

Profit / Loss Calculation for each Section
Motivating Factor #1 - Accepted Accounting Practices
Gross revenues
- Discounts
Net revenues
- Var. Expenses
- Fixed Expenses
- Overhead
Profit or Loss

Overhead expenses
Motivating Factor #1 - Accepted Accounting Practices
• Three reception areas• Call Center• Purchasing• Laundry• Word Processing• Medical Records• Info Tech department• Business Office
Overhead pool is approx $4M

Overhead expenses
Motivating Factor #1 - Accepted Accounting Practices
3 Overhead pools
Hospital-wide Small animal only Large animal only
Allocation based of sections % of VTH revenue

“Primary Service Profit alone doesn’t accurately
account for what we bring in! It is not the Real Thing”
Motivating Factor #1 - Accepted Accounting Practices

How can we determine the Real Thing?
Motivating Factor #1 - Accepted Accounting Practices

Primary Service Profit+
Their contribution to support service profit
(downstream profits)
=
Real Thing!!
Motivating Factor #1 - Accepted Accounting Practices
Acceptable Real Thing!!

For every $ of revenue a Primary Service generates,
how much profit in each of the
support services does that $ generate?
Motivating Factor #1 - Accepted Accounting Practices

Support Service used by Int. Med
Ratio of Int. Med codes charged to Support Service
Codes charged
Radiology 141 %
Diagnostic lab 45 %
Pharmacy 61.7 %
Clinical Pathology 89 %
Anesthesia 24.8 %
Hospitalization 26 %
Central sterilization 0.4 %
Example: Amount of support service revenue generated by the Internal Medicine Service

Support service revenue
Support service profit margin
(profit margin = Ratio of profit to revenue)
X
=Support
service profitgenerated by the
PRIMARY SERVICE
Motivating Factor #1 - Accepted Accounting Practices

Support Service
Profit Margin
Radiology 52.4%
Diagnostic lab 45.9%
Pharmacy 36.4%
Clinical Pathology
27.5%
Anesthesia 18.9%
Hospitalization - 10.8%
Central sterilization
- 39.3%

Usage Ratio
Radiology 141.0%
Diagnostic Lab 45.0%
Pharmacy 61.7%
Clinical Path 89.0%
Anesthesia 24.8%
Hospitalization 26.0%
Central Sterilization 0.4%
Service Revenue
$352,500
$112,500
$154,250
$222,500
$62,000
$65,000
$1,000
Profit Margin
52.4%
45.9%
36.4%
27.5%
18.9%
-10.8%
-39.3%
Allocated Profit
$184,710
$51,638
$56,147
$61,188
$11,718
-$7,020
-$393
Example: Int. Med revenue of $250,000
Total Allocated Service Section Profit to Internal Medicine for this period: $357,987

Profit of Primary Service
+Portion of
Support service profit
=Total profit contribution
to VTH
Motivating Factor #1 - Accepted Accounting Practices

Individual financial sessions
with each service
Motivating Factor #2 - Shared information

Example of a Primary service section profit
CUMULATIVE THRU Percent3/31/2008 3/31/2007 Change
$998,437.65 $960,827.25 3.9%($8,157.94) ($5,079.25) 60.6%
$990,279.71 $955,748.00 3.6%
$72,906.48 $50,522.73 44.3%
$1,063,186.19 $1,006,270.73 5.7%
$14,505.05 $12,090.48 20.0%$14,505.05 $12,090.48 20.0%
$228,391.66 $186,869.12 22.2%
6,896.04 4,497.34 53.3%87,667.80 65,590.66 33.7%
$322,955.50 $256,957.12 25.7%
$82,411.63 $81,408.78 1.2%43,226.86 57,884.59 -25.3%10,945.12 3,890.18 181.4%
$136,583.61 $143,183.55 -4.6%
$2,537.80 $2,818.74 -10.0%
$41,464.69 $36,988.91 12.1%
$518,046.66 $452,038.80 14.6%
$300,407.65 $289,229.28 3.9%
$818,454.31 $741,268.08 10.4%
$244,731.88 $265,002.65 -7.6%
REVENUE: Primary Service PROFESSIONAL DISCOUNTSTOTAL SERVICE REVENUE:
GENERAL FUND SUBSIDY
NET REVENUE:
EXPENSES:DIRECT:
PP & E EXPENSESSpecial EQUIPEMENT
TOTAL:
PAYROLLSALARIES:
STUDENTFRINGE:
TOTAL:
SUPPLIES INVENTORYSTOCKED SUPPLIESMISCELLANEOUS
TOTAL:
TRAVEL/TRAINING
INTERNAL-DISPOSABLES
TOTAL DIRECT EXP:
INDIRECT:
OVERHEAD
TOTAL EXPENSES:
NET PROFIT/(LOSS):

ANCILLARY SERVICEPROFIT ALLOCATION
RADIOLOGY ANESTHESIAPHARMACYDCPAHCLINICAL PATHOLOGYHOSPITALIZATIONCENTRAL STERILIZATIONTOTAL ALLOCATION:
NET PROFIT/(LOSS)
After Allocations
Primary service section with
allocated Support service section
profits
CUMULATIVE THRU Percent3/31/2008 3/31/2007 Change
$998,437.65 $960,827.25 3.9%($8,157.94) ($5,079.25) 60.6%
$990,279.71 $955,748.00 3.6%
$72,906.48 $50,522.73 44.3%
$1,063,186.19 $1,006,270.73 5.7%
$14,505.05 $12,090.48 20.0%$14,505.05 $12,090.48 20.0%
$228,391.66 $186,869.12 22.2%
6,896.04 4,497.34 53.3%87,667.80 65,590.66 33.7%
$322,955.50 $256,957.12 25.7%
$82,411.63 $81,408.78 1.2%43,226.86 57,884.59 -25.3%10,945.12 3,890.18 181.4%
$136,583.61 $143,183.55 -4.6%
$2,537.80 $2,818.74 -10.0%
$41,464.69 $36,988.91 12.1%
$518,046.66 $452,038.80 14.6%
$300,407.65 $289,229.28 3.9%
$818,454.31 $741,268.08 10.4%
$244,731.88 $265,002.65 -7.6%
REVENUE: Primary Service PROFESSIONAL DISCOUNTSTOTAL SERVICE REVENUE:
GENERAL FUND SUBSIDY
NET REVENUE:
EXPENSES:DIRECT:
PP & E EXPENSESSpecial EQUIPEMENT
TOTAL:
PAYROLLSALARIES:
STUDENTFRINGE:
TOTAL:
SUPPLIES INVENTORYSTOCKED SUPPLIESMISCELLANEOUS
TOTAL:
TRAVEL/TRAINING
INTERNAL-DISPOSABLES
TOTAL DIRECT EXP:
INDIRECT:
OVERHEAD
TOTAL EXPENSES:
NET PROFIT/(LOSS):
$109,776.27 $86,601.18 26.8%38,967.29 34,554.81 12.8%15,856.35 9,961.38 59.2%2,607.88 916.46 184.6%8,871.30 5,486.24 61.7%
(5,425.02) 3,448.27 -257.3%(20,470.37) (19,471.33) -5.1%
$150,183.69 $121,497.01 23.6%
$394,915.57 $386,499.66 2.2%
Motivating Factor #2 - Shared information

CASELOAD thru 03/08 thru 03/07 % changeOffice call 827 868 -4.7%
Recheck off ice call 286 273 4.8%Transfer 90 103 -12.6%N/C recheck 592 399 48.4%
TOTAL: 1,795 1,643 9.3%
Consultations 56 70 -20.0%
Surgeries 631 620 1.8%
Revenue/case $1,079.91 $984.29 9.7%Labor expense/case 352.19 264.63 33.1%Supply expense/case 194.16 185.55 4.6%
Total expense/case 892.53 763.41 16.9%Profit/case 430.66 398.04 8.2%
$1,321,520.00
$1,240,310
$1,104,982$1,112,032
$1,067,785
1342
1422
1332
1430
1454
$0
$200,000
$400,000
$600,000
$800,000
$1,000,000
$1,200,000
$1,400,000
$1,600,000
2002/2003 2003/2004 2004/2005 2005/2006 2006/2007
Rev
enu
e
1260
1280
1300
1320
1340
1360
1380
1400
1420
1440
1460
1480
Cas
elo
ad
Revenue Caseload
Motivating Factor #2 - Shared information

Top expense itemsMotivating Factor #2 - Shared information

Top expense items
Revenue generating procedures
Motivating Factor #2 - Shared information
Top expense items
Revenue generating procedures
Profit ranking
Motivating Factor #2 - Shared information
Top expense items
Revenue generating procedures
Profit rankingTop referring
vet clinics
Motivating Factor #2 - Shared information

Motivating Factor #2 - Shared information
Opportunity to discuss marketing of any or all
parts of the service
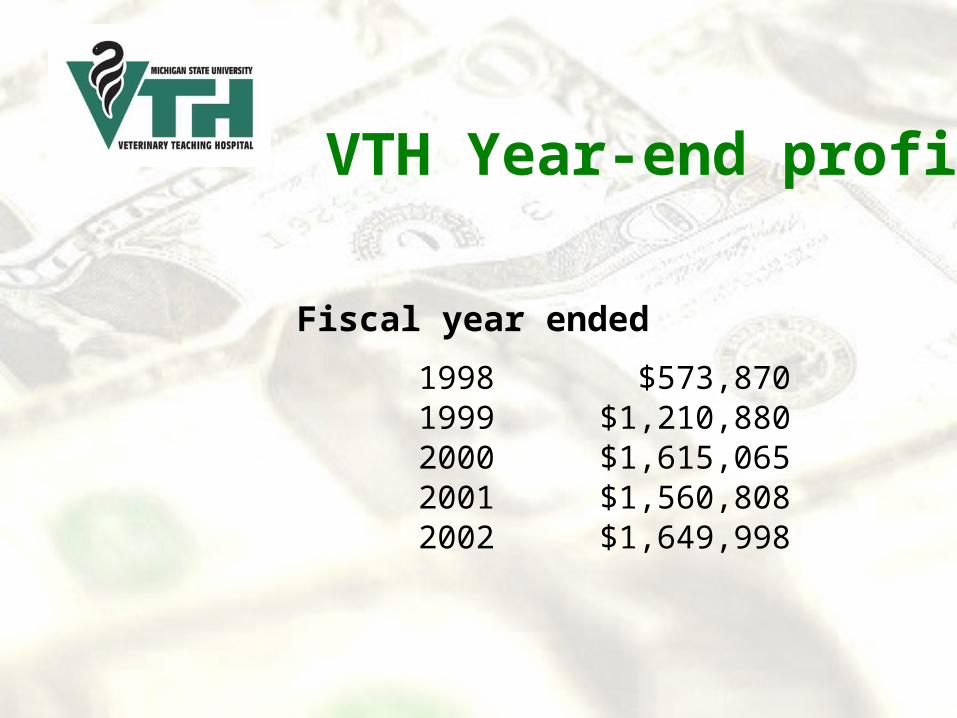
VTH Year-end profit
Fiscal year ended
1998 $573,870 1999 $1,210,880 2000 $1,615,065 2001 $1,560,808 2002 $1,649,998

VTH Year-end profit
Fiscal year ended
2003 $1,822,115 2004 $2,831,260 2005 $3,262,184 2006 $3,358,556 2007 $3,651,602 2008 $3,861,931
Projected 2008 profit of $3,843,368 was only off by $18K
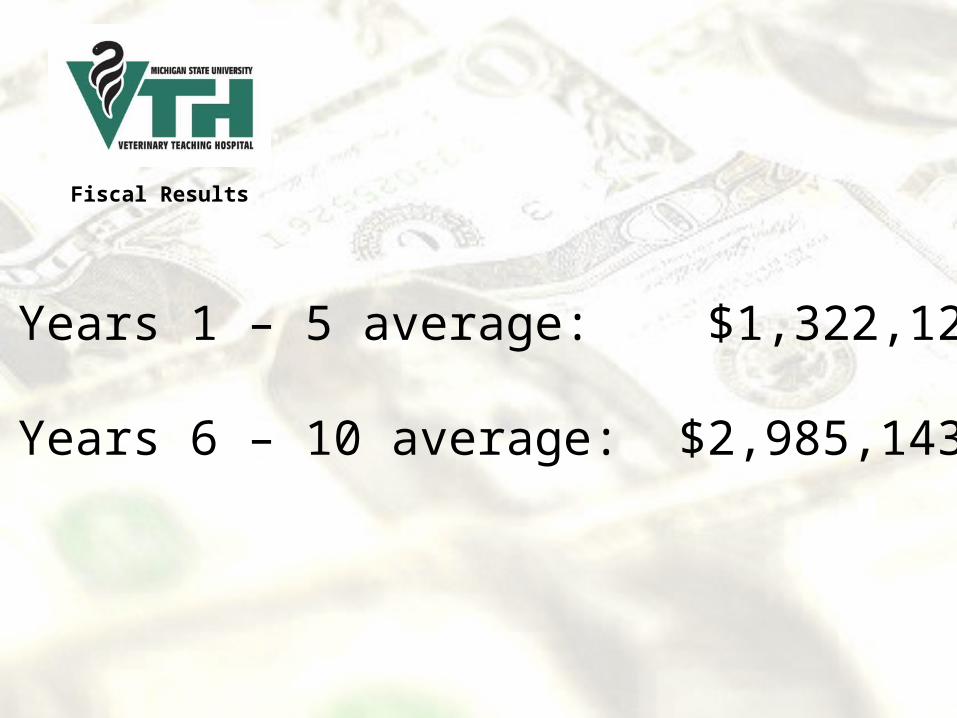
Years 1 – 5 average: $1,322,124
Years 6 – 10 average: $2,985,143
Fiscal Results

Year end profit distribution
approved by:
1. Hospital Management Group
2. Section Chiefs
3. VTH Board
Motivating Factor #3 - Faculty input

Hospital equipment fund 25%Academic departments 75%
Motivating Factor #3 - Faculty input
2008Year End
Distribution of Profit

Increasing number of
departmental faculty are paid
for by VTH profit
Motivating Factor #3 - Faculty input
VTH Profits

Equipment purchases from year end profits
Section Chiefs determine major
equipment purchases (over $5K)
Motivating Factor #3 - Faculty input

Equipment purchases from year end profits
Motivating Factor #3 - Faculty input
Creating Buy-In from
MOST
of the rest of the VTH

Regularly compare current VTH financials with current forecast to
many VTH groups

“Wow, no wonderthe VTH charges
are so high!!!
Up to date VTH financialspresented at:
Monthly Faculty meetingsMonthly Faculty meetings
Monthly “Chat with Pat” sessionsMonthly “Chat with Pat” sessions
Quarterly Town Hall MeetingsQuarterly Town Hall Meetings
Monthly Section Chief MeetingsMonthly Section Chief Meetings
Quarterly VTH Board MeetingsQuarterly VTH Board Meetings

Staff and Benefit Reductions:
Approximately $1M in salary and fringes
Elimination of VTH funded travel expenses
Other Expense Reductions:
Reduction in CareCredit options
Reduction in inventory
Moratorium on Major Equipment purchases for 2009
Expense cuts in past 6 months

Informed employees understand
staff and benefit cuts
Those that don’t either refused to be informed and / or are “rumble
strips”

Always happyAlways Happy
Generally SatisfiedConstant Complainers
Staff Happinessis normally distributed
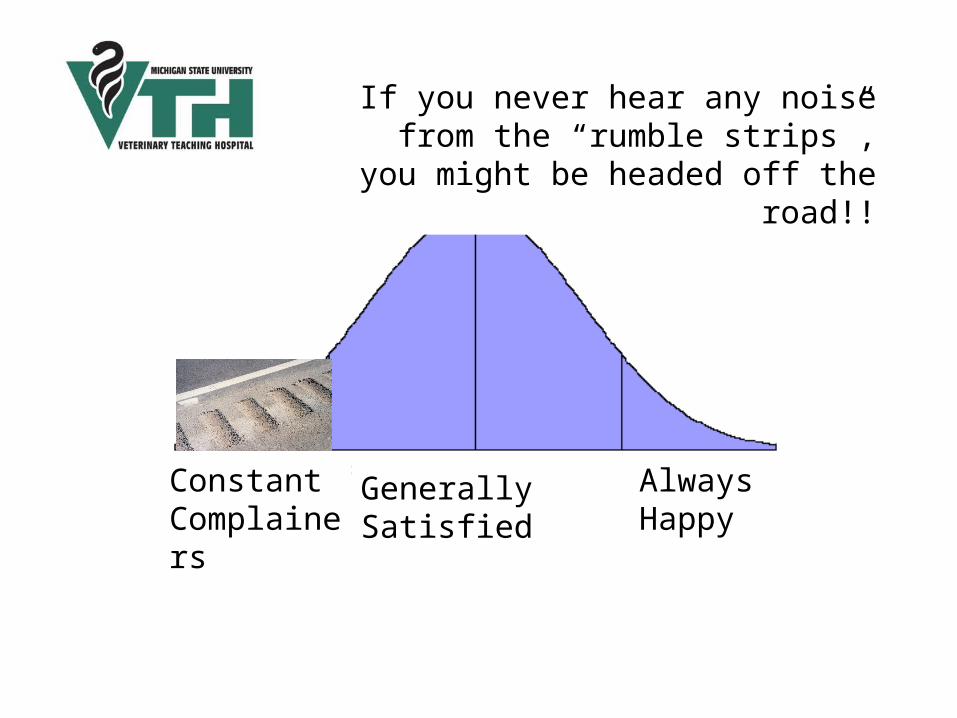
Always happyAlways Happy
Generally SatisfiedConstant Complainers
If you never hear any noise from the “rumble strips”, you might be headed off
the road!!

Summary
Factor 1: Well accepted accounting
system “Real Deal”
Factor 2: Widespread Sharing of information
Factor 3: Faculty involvement for distribution of year end profits
We are far from perfect but at least we are trying to get to the same spot.