Creating a Culture of Transparency-Revenue Reporting.
Creating a culture of Transparency .Conrad Enill.. Mobile 18686200977 June 5&6th 2014
1
The Economics of Resource Economies…by
Conrad Enill. MBA,CUDEFormer Minister in the Ministry of Finance and Minister of Energy and Energy Industries of Trinidad and Tobago.

Agenda
• Energy or Hydrocarbons ……...Revenue Discussion• Finance ….Our efforts at Accountability and the process
that results in our Annual Budgeting .• The Heritage and stabilization Fund as a tool to aid
communication of our diversification efforts.• Some concluding thoughts .
2 Creating a culture of Transparency .Conrad Enill.. Mobile 18686200977 June 5&6th 2014
Introduction How did Trinidad and Tobago with less than 0.5 per cent of theworlds natural gas reserves ,establish itself as a world class gasexport hub driving at one time in its history GDP growth of overeight percent per annum.How did this tiny country become the worlds largest exporter ofthe commodity chemicals methanol and ammonia ?How has the resulting revenue from these investments' affectedthe social and economic policy of Trinidad and Tobago ?Transparency suggests that we must understand what we areengaged in and what is required to continue to grow and developthe sector?
3 Creating a culture of Transparency .Conrad Enill.. Mobile 18686200977 June 5&6th 2014
A resource based economyA resource-based economy is the economy of a country whose gross national product or gross domestic product to a large extent comes from natural resources.
4 Creating a culture of Transparency .Conrad Enill.. Mobile 18686200977 June 5&6th 2014
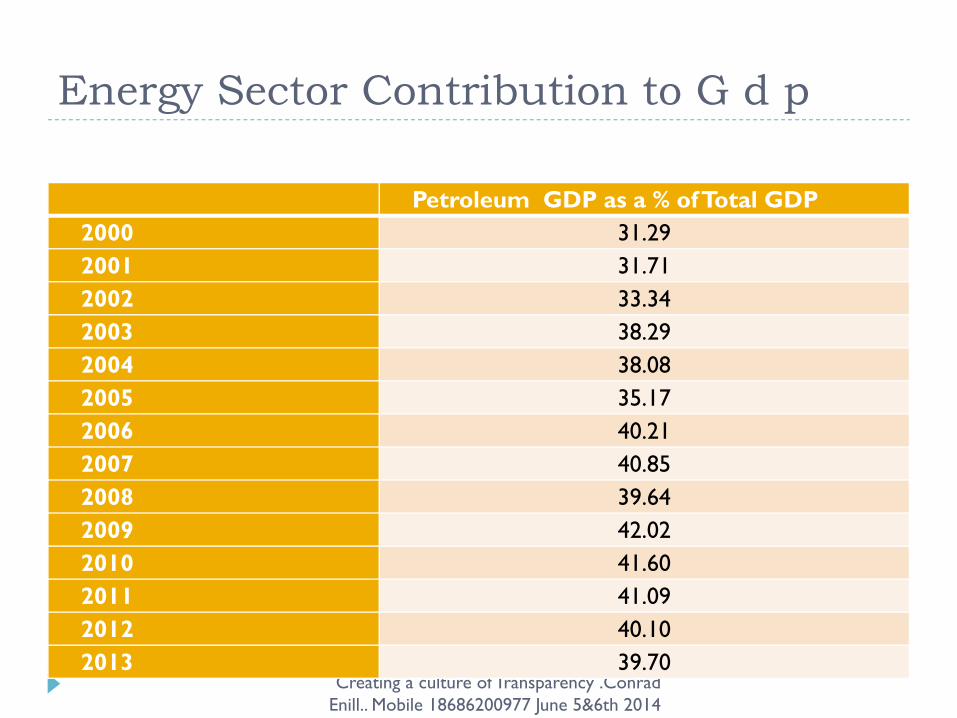
Energy Sector Contribution to G d p
Creating a culture of Transparency .Conrad Enill.. Mobile 18686200977 June 5&6th 2014
5
Petroleum GDP as a % of Total GDP2000 31.292001 31.712002 33.342003 38.292004 38.082005 35.172006 40.212007 40.852008 39.642009 42.022010 41.602011 41.092012 40.102013 39.70

0
50,000
100,000
150,000
200,000
250,000
1908 1918 1928 1938 1948 1958 1968 1978 1988 1998 2008
Daily Average(bopd)
Crude Oil Production 1908 to the 2000
6 Creating a culture of Transparency .Conrad Enill.. Mobile 18686200977 June 5&6th 2014
0
500
1000
1500
2000
2500
3000
3500
4000
4500
1908 1918 1928 1938 1948 1958 1968 1978 1988 1998 2008
mm
scf/d
Production (MMSCF/D)
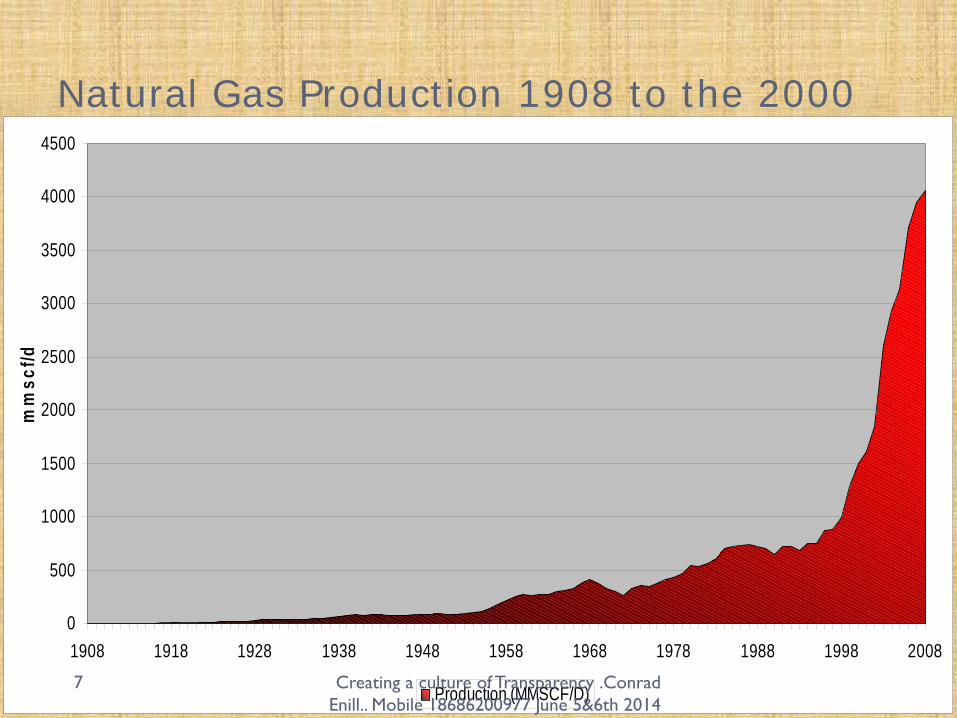
Natural Gas Production 1908 to the 2000
7 Creating a culture of Transparency .Conrad Enill.. Mobile 18686200977 June 5&6th 2014

0
100,000
200,000
300,000
400,000
500,000
600,000
700,000
1908 1918 1928 1938 1948 1958 1968 1978 1988 1998 2008
Total Oil Production (BOE/D) Total Gas Production (BOE/D)
Oil and Natural Gas Production 1908 to the 2000
8 Creating a culture of Transparency .Conrad Enill.. Mobile 18686200977 June 5&6th 2014
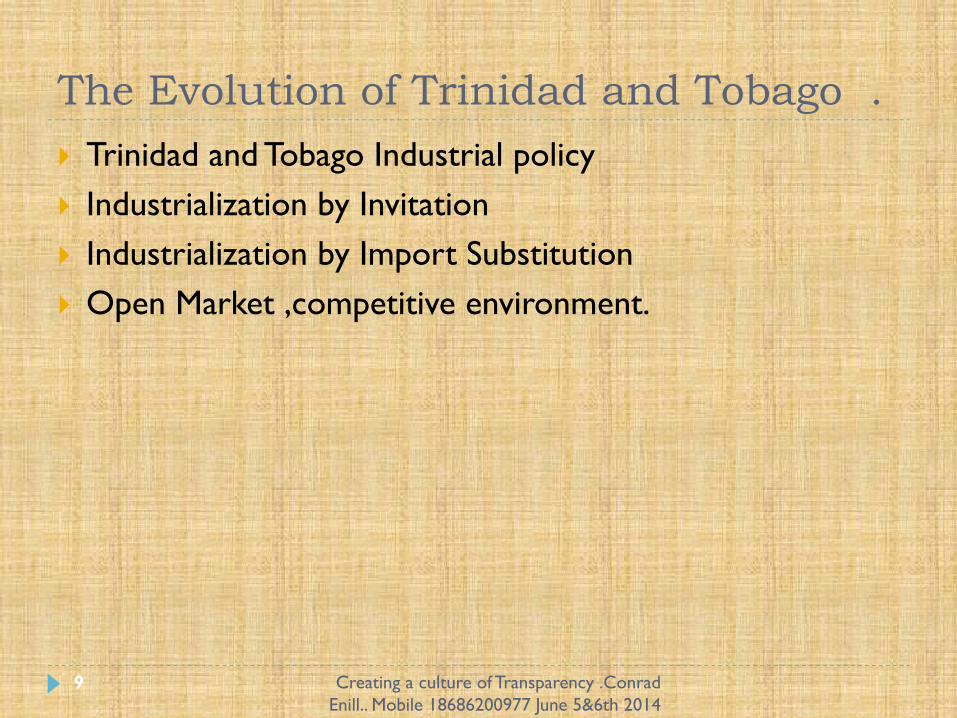
The Evolution of Trinidad and Tobago . Trinidad and Tobago Industrial policy Industrialization by InvitationIndustrialization by Import SubstitutionOpen Market ,competitive environment.
9 Creating a culture of Transparency .Conrad Enill.. Mobile 18686200977 June 5&6th 2014

10 Creating a culture of Transparency .Conrad Enill.. Mobile 18686200977 June 5&6th 2014
The Vision of Trinidad & Tobago Energy Development
“ There have been attempts to persuade us that the simplest andeasiest thing to do would be to sit back, export our oil, export ourgas, do nothing else and just receive the revenues derived fromsuch exports and as it were, lead a life of luxury – at least for somelimited period. This, the Government has completely rejected, for itamounts to putting the entire nation on the dole. Instead, wehave taken what may be the more difficult road and that is,accepting the challenge of entering the world of steel,aluminium, methanol, fertiliser, petrochemicals. We haveaccepted the challenge of using our hydrocarbon resourcesin a very definite industrialisation process”.
-The Late Dr. the Right Honourable Eric E. Williams, 17th January 1976
11 Creating a culture of Transparency .Conrad Enill.. Mobile 18686200977 June 5&6th 2014

Achievements over the years 1908-1938
1908
1908
1918
1918
1928
1928
1938
1938
1908-Commercial Production began
1911-First shipment of oil from Brighton
1913 –Shell Group Enters
1916-Establishment of refineries in Pointe-a-Pierre, Point Fortin and Tabaquite
1937-Labour Unrest led by Tubal Uriah ‘Buzz’ Butler
12 Creating a culture of Transparency .Conrad Enill.. Mobile 18686200977 June 5&6th 2014
1948
1948
1958
1958
1968
1968
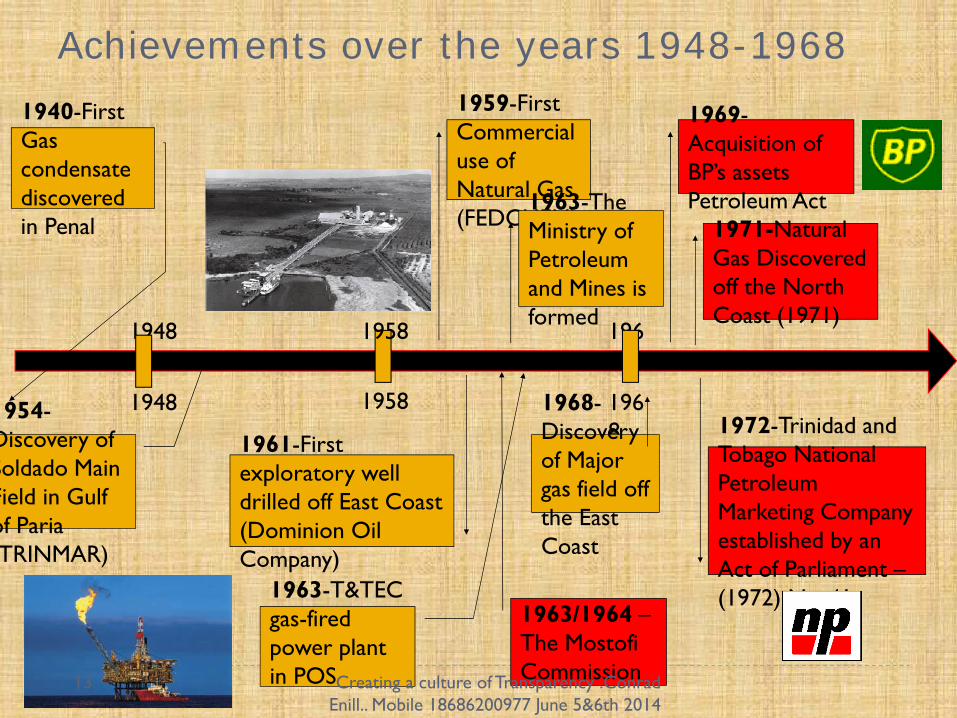
1940-First Gas condensate discovered in Penal
954-Discovery of Soldado Main Field in Gulf of Paria TRINMAR)
1959-First Commercial use of Natural Gas (FEDCHEM)
1961-First exploratory well drilled off East Coast (Dominion Oil Company)
1963-The Ministry of Petroleum and Mines is formed
1968-Discovery of Major gas field off the East Coast
1963/1964 –The Mostofi Commission
1969-Acquisition of BP’s assetsPetroleum Act
1963-T&TEC gas-fired power plant in POS
1971-Natural Gas Discovered off the North Coast (1971)
1972-Trinidad and Tobago National PetroleumMarketing Company established by anAct of Parliament –(1972) No. 41.
Achievements over the years 1948-1968
13 Creating a culture of Transparency .Conrad Enill.. Mobile 18686200977 June 5&6th 2014

1998
1998
1978
1978
1988
1988
2008
2008
1974-Acquisition of ShellCreation of TRINTOC
1974-Emergence of a National Energy SectorPetroleum Taxes Act Tax Reference PriceRefinery Throughput Tax i d d
1975-Establishment of NGC
1979-Establishment of NEC
1977-Commissioning of 24” Cross country gas transmission line
1978-Establishment of the Point Lisas Industrial Estate
1985-GORTT acquires TEXACO
1993-PETROTRIN formed by merging Trintopec and Trintoc
1994-Powergen formed by partial divestment of T&TEC
1996- Signing of Production Sharing Contracts
1996- Natural Gas production exceeds Oil production
Creating a culture of Transparency .Conrad Enill.. Mobile 18686200977 June 5&6th 2014
14
Achievements over the years 1978-2008
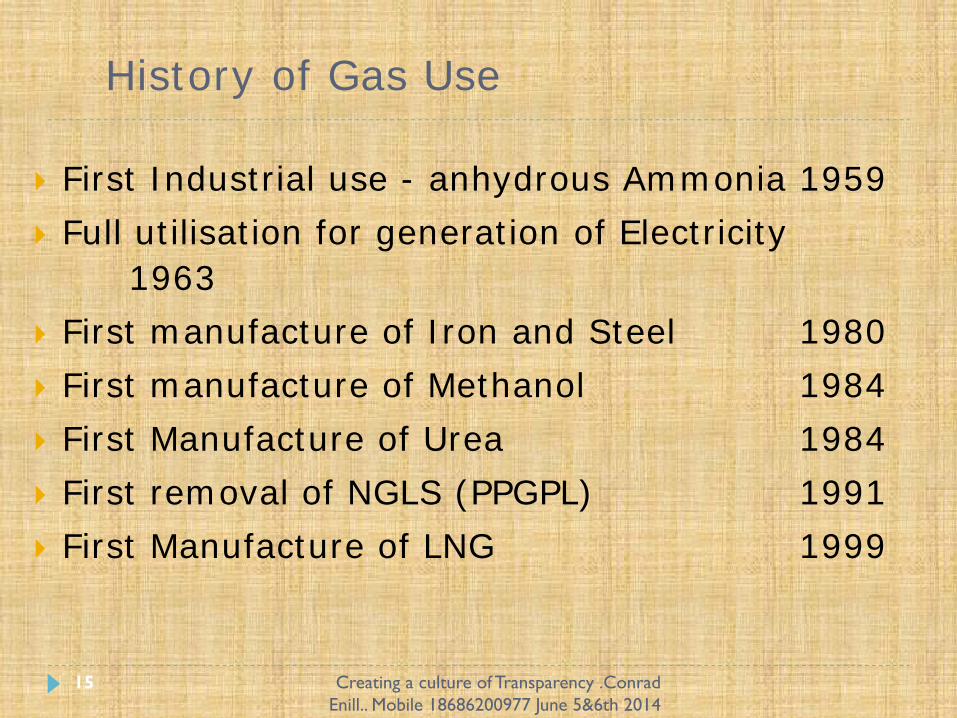
History of Gas Use
First Industrial use - anhydrous Ammonia 1959Full utilisation for generation of Electricity
1963 First manufacture of Iron and Steel 1980First manufacture of Methanol 1984First Manufacture of Urea 1984First removal of NGLS (PPGPL) 1991First Manufacture of LNG 1999
15 Creating a culture of Transparency .Conrad Enill.. Mobile 18686200977 June 5&6th 2014

1959- Yara (FEDCHEM)
1977-Trinidad Nitrogen (TRINGEN)
1980-Mittal Steel (ISCOTT)
1981-PCS Nitrogen I
1984-PCS Nitrogen II –Trinidad and Tobago Methanol Company (TTMC)
1988-Tringen II
1991-Phoenix Park Gas Processsors
1993-Caribbean Methanol Company
1996 – TTMC II PCS Nitrogen III
1997-Petrotrin
1998-PCS Nitrogen IVMethanol IVPt. Lisas Nitrogen
1999- Atlantic LNGISPAT (DRI)Cleveland Cliffs DRI (ISG)Mithanex
2002-Caribbean Nitrogen Company Ltd.ALNG II
2003-ALNG IIIAtlas
2004-N2000International Steel Group (ISG)
2006-Nucor HBI Plant
2005-ALNG IVM5000
Energy-based Operating in Trinidad and Tobago
2008
1958
16 Creating a culture of Transparency .Conrad Enill.. Mobile 18686200977 June 5&6th 2014
17 Creating a culture of Transparency .Conrad Enill.. Mobile 18686200977 June 5&6th 2014

18
Global Position - Ammonia
#1 in Export from a Single Site
10 Plants (5.2 MTPA)
Yara Trinidad
PCS
PLNL
01000200030004000500060007000
1999
2000
2001
2002
2003
2004
2005
2006
2007
'000
tonn
es/y
r
0%
10%
20%
30%
40%
50%
T&T Exports % of World Exports
18 Creating a culture of Transparency .Conrad Enill.. Mobile 18686200977 June 5&6th 2014
19
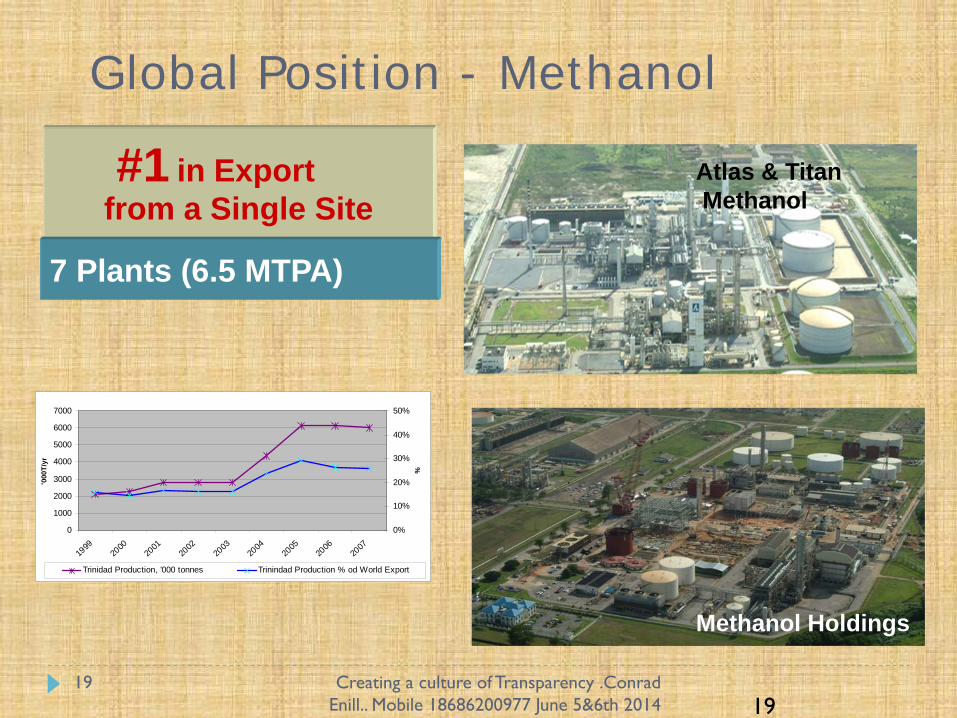
Global Position - Methanol
#1 in Export from a Single Site
7 Plants (6.5 MTPA)
Atlas & TitanMethanol
Methanol Holdings
0
1000
2000
3000
4000
5000
6000
7000
1999
2000
2001
2002
2003
2004
2005
2006
2007
'000
T/yr
0%
10%
20%
30%
40%
50%%
Trinidad Production, '000 tonnes Trinindad Production % od World Export
19 Creating a culture of Transparency .Conrad Enill.. Mobile 18686200977 June 5&6th 2014
20
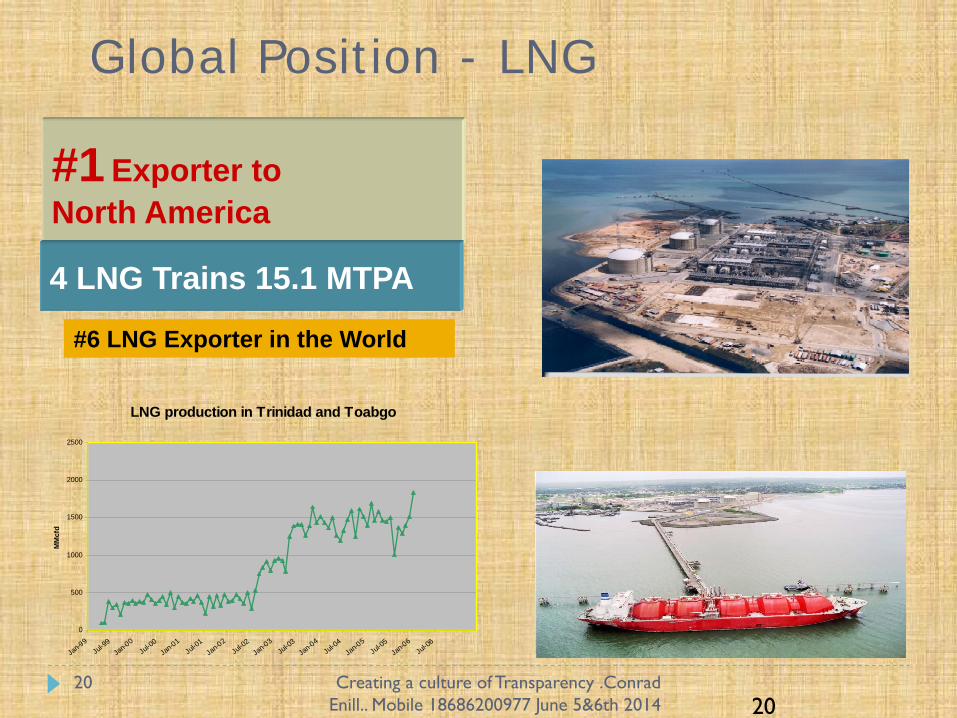
Global Position - LNG
#1 Exporter to North America
4 LNG Trains 15.1 MTPA
#6 LNG Exporter in the World
LNG production in Trinidad and Toabgo
0
500
1000
1500
2000
2500
Jan-99Jul-9
9Jan-00
Jul-00
Jan-01Jul-0
1Jan-02
Jul-02
Jan-03Jul-0
3Jan-04
Jul-04
Jan-05Jul-0
5Jan-06
Jul-06
MM
cfd
20 Creating a culture of Transparency .Conrad Enill.. Mobile 18686200977 June 5&6th 2014

Estimates of Revenue & Expenditure and Public Accounts
Estimates of Revenue and Expenditure
& Public Accounts
21 Creating a culture of Transparency .Conrad Enill.. Mobile 18686200977 June 5&6th 2014

The revenue stream
Interestingly the results of all this activity is reported primarily as Oil Companies within the context of Chapter 75:04.Petrochemical trading companies are classified as other companies and therefore contribute to revenues under other companies.
22 Creating a culture of Transparency .Conrad Enill.. Mobile 18686200977 June 5&6th 2014

Estimates of Revenue Heads of Revenue
1. Taxes on Income and Profits
2. Taxes on Property3. Taxes on Good and
Services4. Taxes on International
Trade5. Other Taxes6. Property Income
Heads of Revenue –contd1. Other Non-Tax Revenue 2. Repayment of Past
Lending3. Capital revenue4. Borrowing
23 Creating a culture of Transparency .Conrad Enill.. Mobile 18686200977 June 5&6th 2014

– The establishment of new regimes for the taxation of income from oil and gas production including a work programme for new exploration activities .(completed)
– Supplemental Petroleum Tax review. (completed)
– Fair Market Value for Gas contracts as opposed to contract price (completed)
– Review of Production sharing Contracts (under consideration)
– Resulting in more equitable distribution to the population of Trinidad and Tobago. (Internationally Competitive )
Energy Taxation Review
24 Creating a culture of Transparency .Conrad Enill.. Mobile 18686200977 June 5&6th 2014
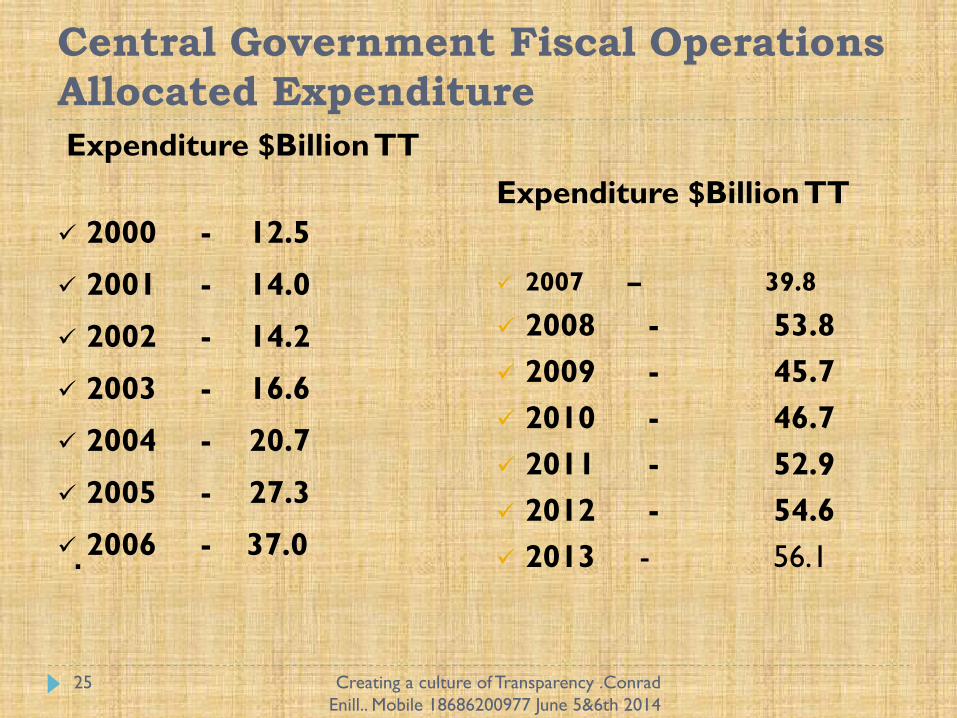
Central Government Fiscal OperationsAllocated ExpenditureExpenditure $Billion TT
2000 - 12.5
2001 - 14.0
2002 - 14.2
2003 - 16.6
2004 - 20.7
2005 - 27.3
2006 - 37.0
Expenditure $Billion TT
2007 – 39.8
2008 - 53.82009 - 45.72010 - 46.72011 - 52.92012 - 54.62013 - 56.1 .
25 Creating a culture of Transparency .Conrad Enill.. Mobile 18686200977 June 5&6th 2014
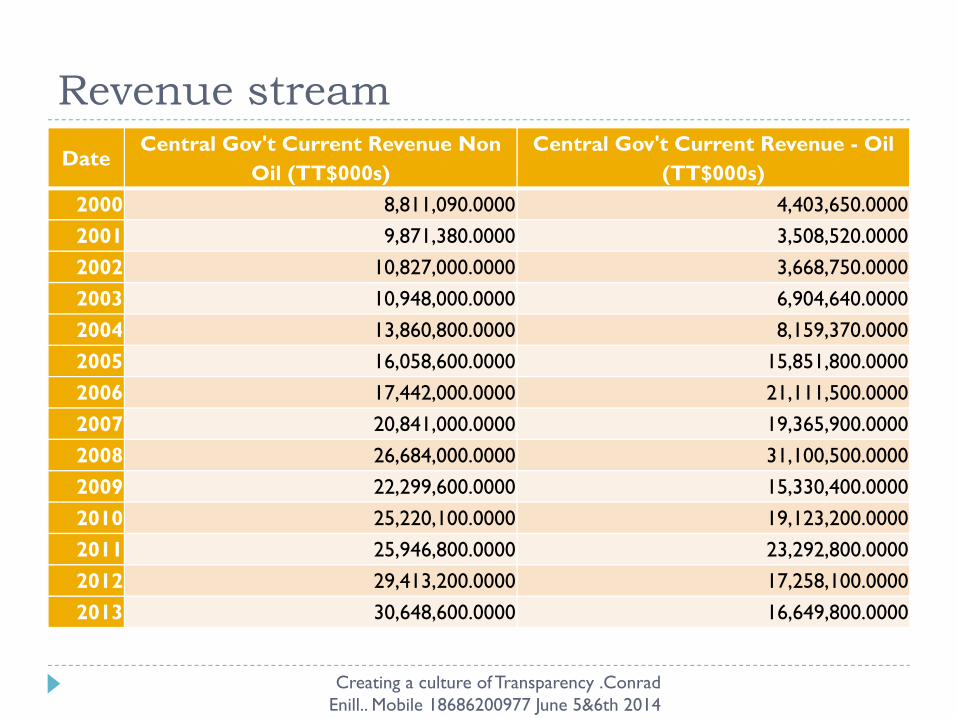
Revenue stream
Creating a culture of Transparency .Conrad Enill.. Mobile 18686200977 June 5&6th 2014
26
DateCentral Gov't Current Revenue Non
Oil (TT$000s)Central Gov't Current Revenue - Oil
(TT$000s)2000 8,811,090.0000 4,403,650.00002001 9,871,380.0000 3,508,520.00002002 10,827,000.0000 3,668,750.00002003 10,948,000.0000 6,904,640.00002004 13,860,800.0000 8,159,370.00002005 16,058,600.0000 15,851,800.00002006 17,442,000.0000 21,111,500.00002007 20,841,000.0000 19,365,900.00002008 26,684,000.0000 31,100,500.00002009 22,299,600.0000 15,330,400.00002010 25,220,100.0000 19,123,200.00002011 25,946,800.0000 23,292,800.00002012 29,413,200.0000 17,258,100.00002013 30,648,600.0000 16,649,800.0000

Finance• Our current reporting regime as evidenced through the
Annual Budgeting Parliamentary Exercise.• Estimates of Revenue and Expenditure and Public
accounts .• The preparation of the National Budget• The Call Circular• The Budget process• The Budget Documents• The Review of the Economy• The Expenditure build up• Estimates of Revenue
27 Creating a culture of Transparency .Conrad Enill.. Mobile 18686200977 June 5&6th 2014

Estimates of Revenue & Expenditure and Public Accounts
Estimates of Revenue and Expenditure
& Public Accounts
28 Creating a culture of Transparency .Conrad Enill.. Mobile 18686200977 June 5&6th 2014

The Preparation of a National Budget.The Call Circular.The Consultations.The Role of the Budget division of the Ministry of Finance.The Stakeholder ConsultationsThe Hard ChoicesThe Budget DeliveryThe ParliamentImplementation
29 Creating a culture of Transparency .Conrad Enill.. Mobile 18686200977 June 5&6th 2014

The Call Circular.Where does its authority come from?
This is required under Section113(1) of the Constitution :113(1).The Minister responsible for finance shall cause tobe prepared and laid before the House of representativesbefore or not later than thirty days after thecommencement of each financial year estimates of therevenue and expenditure of Trinidad and Tobago for thatyear.
30 Creating a culture of Transparency .Conrad Enill.. Mobile 18686200977 June 5&6th 2014

The Call CircularAppendices required for submission.
A. Strategic Plans and Objectives.B .Revenue (including Capital Receipts).C.Recurrent Expenditure-Ministries and
Departments.D.Recurrent Expenditure-Statutory Boards and SimilarBodies and the Tobago House of Assembly.E. Capital Expenditure Programme.F. Directory of Services
31 Creating a culture of Transparency .Conrad Enill.. Mobile 18686200977 June 5&6th 2014
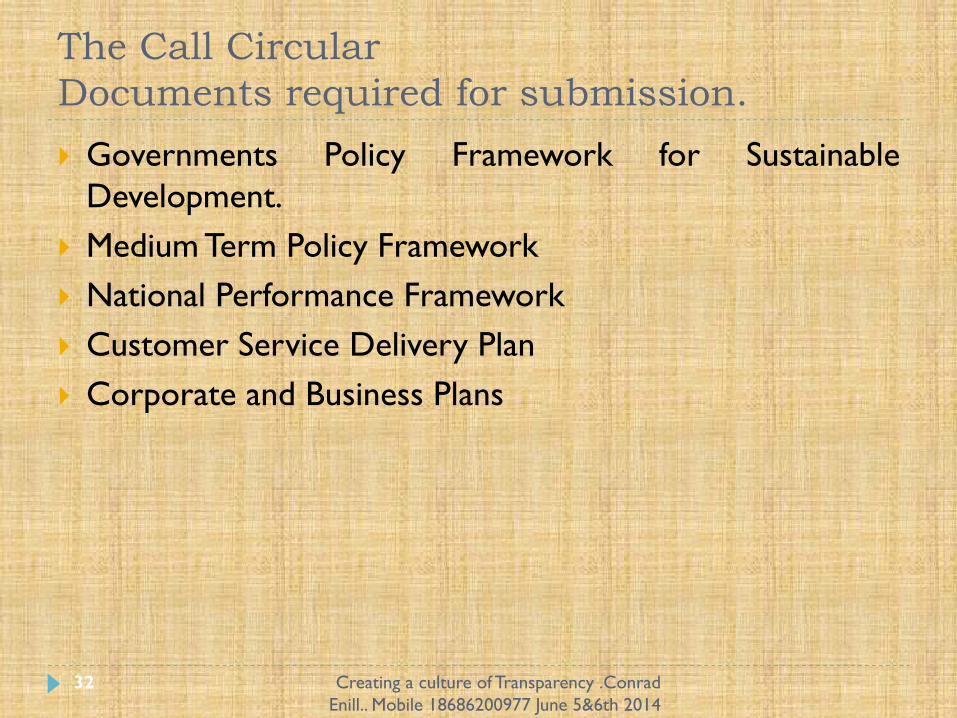
The Call CircularDocuments required for submission.
Governments Policy Framework for SustainableDevelopment.Medium Term Policy FrameworkNational Performance FrameworkCustomer Service Delivery PlanCorporate and Business Plans
32 Creating a culture of Transparency .Conrad Enill.. Mobile 18686200977 June 5&6th 2014

The Budget Process.Consultations with interest groups and stakeholders who have special needs.Review of concerns expressed in the IMF Article Four Consultations. Review of the Auditor Generals Report on the Accounts.
33 Creating a culture of Transparency .Conrad Enill.. Mobile 18686200977 June 5&6th 2014

The Budget DocumentsBudget Statement _Presented by MOFEReview of the EconomyState Enterprises Investment Programme.Social Sector Investment Programme.Public Sector Investment Programme.Public Sector Investment Programme-Tobago.Estimates of ExpenditureEstimates of Revenue
34 Creating a culture of Transparency .Conrad Enill.. Mobile 18686200977 June 5&6th 2014
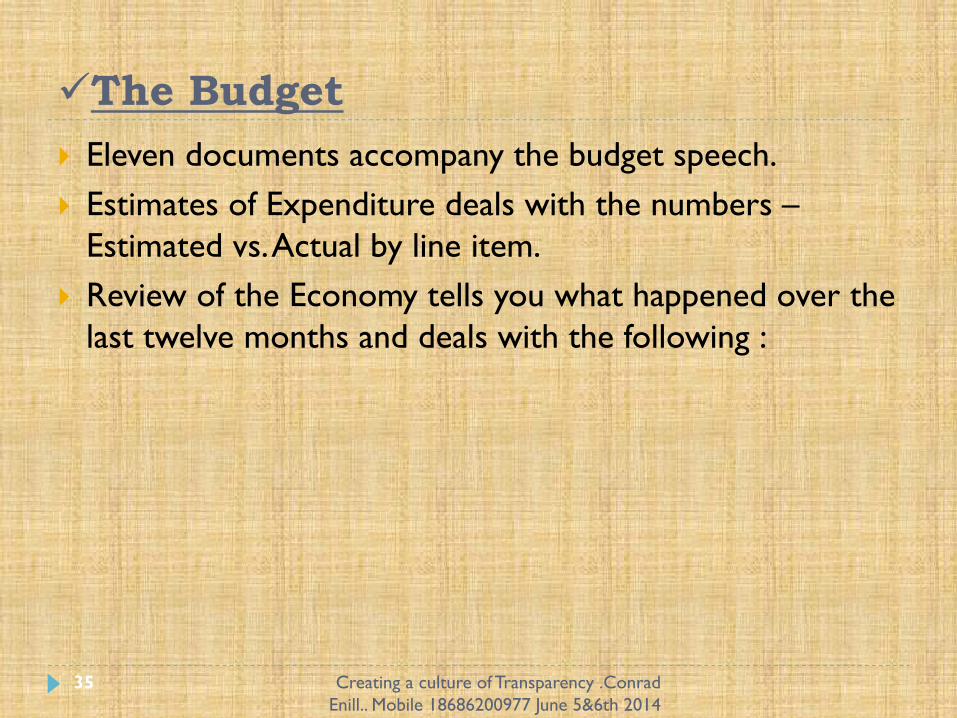
The BudgetEleven documents accompany the budget speech.Estimates of Expenditure deals with the numbers –Estimated vs. Actual by line item.Review of the Economy tells you what happened over the last twelve months and deals with the following :
35 Creating a culture of Transparency .Conrad Enill.. Mobile 18686200977 June 5&6th 2014
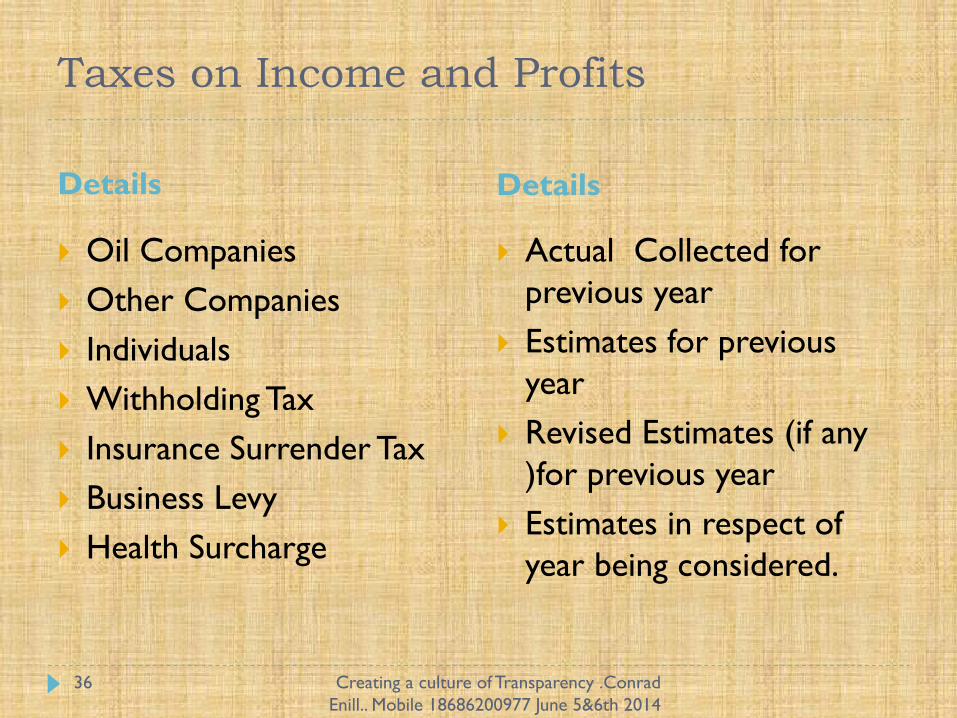
Taxes on Income and Profits
Details Details
Oil Companies Other Companies IndividualsWithholding Tax Insurance Surrender Tax Business LevyHealth Surcharge
Actual Collected for previous yearEstimates for previous yearRevised Estimates (if any )for previous yearEstimates in respect of year being considered.
36 Creating a culture of Transparency .Conrad Enill.. Mobile 18686200977 June 5&6th 2014

Diversification requirement..non oil deficit
Creating a culture of Transparency .Conrad Enill.. Mobile 18686200977 June 5&6th 2014
37
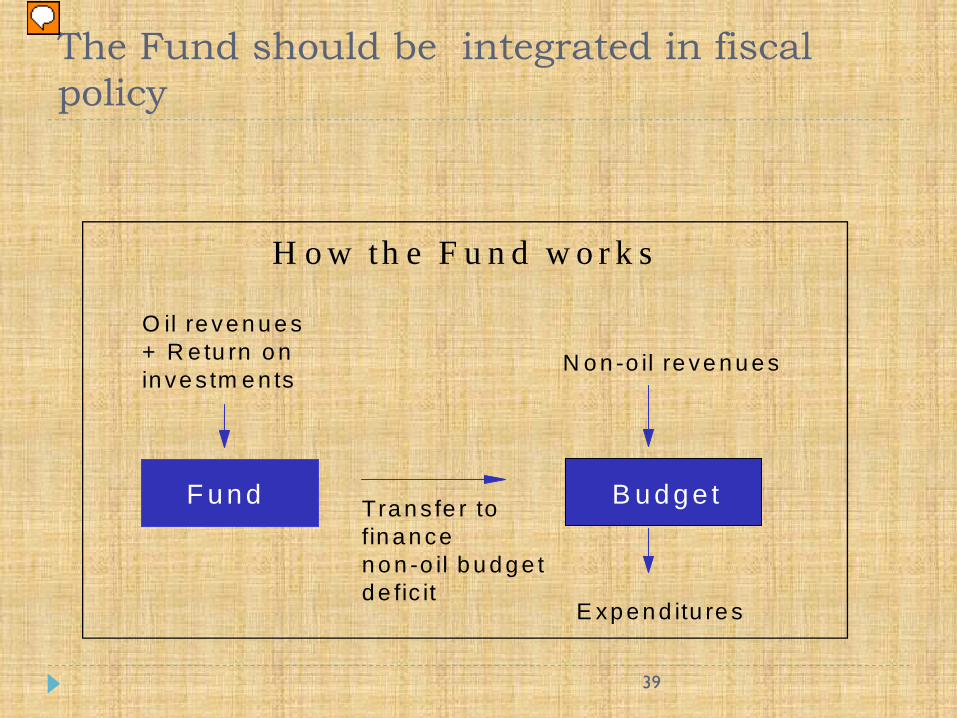
The non oil deficit is the excess of government spending over revenue when petroleum revenues are excluded,Economists believe that it is prudent for a petro state to to maintain a Fuel Wealth .Fuel Wealth is the present discounted value of governments future petroleum revenues. Our response has been the HSF Fund.This fund simply accumulates excess revenues beyond targeted expenditure .Since we are into deficit spending now may be an opportunity to change how this fund is used in Financial Economic Management.

38
Oil stabilisation fundsAbu DhabiAlaskaAlbertaAzerbaijanKazakhstanKuwaitNorwayOman
39
H o w th e F u n d w o r k s
O il re ve n u e s + R e tu rn o n in ve s tm e n ts
N o n -o il re ve n u e s
E xp e n d itu re s
Tra n s fe r to fin a n ce n o n -o il b u d g e t d e fic it
F u n d B u d g e t
The Fund should be integrated in fiscal policy
Concluding thoughts
Creating a culture of Transparency .Conrad Enill.. Mobile 18686200977 June 5&6th 2014
40
The discussion needs to be continued.The communication must begin from the ground up and it must involve more voicesThere must be some clear objectives that can be agreed between government and the population.There must be a review of government expenditure with particular reference to the distribution between investment expenditure and welfare expenditures and a realignment based on sustainability.More discussion on the choices that we are making and the future demands on our resources.

Concluding thoughts
Creating a culture of Transparency .Conrad Enill.. Mobile 18686200977 June 5&6th 2014
41
More discussion on the choices that we are making and the future demands on our resources.
We also need to learn from our successes to date and anchor our future in an understanding of what policy instruments served us well. These are :Fiscal management Resource management Implementing InstitutionsInvestment Education GovernanceTransparency is an integral part of our governance agenda.

INCOME GROUP
CLASSIFICATION(GNP per capita income)*
Low Income $905 or less
Middle Income Lower: $905 - $3595
Upper: $3596 -$11,115
High Income $11,116 or moreTrinidad & Tobago
Trinidad & Tobago is classified as a ‘ Non OECD High Income’ Country.
Source: World Bank, March 2008.
Trinidad & Tobago• GNP per capita at PPP
is US$13,340• Life expectancy at birth is
70 years• Adult illiteracy rate is
98.6% • Average annual growth
(GNP) rate is 4.5%• GDP is US$19.9 billion
Definition – T&T Position
42 Creating a culture of Transparency .Conrad Enill.. Mobile 18686200977 June 5&6th 2014