


1
Cost Allocation Meets Coordination – Module 1
www.nadtc.org
A Mini-Course for Human Services Transportation Providers

2
Meet Your Guest Presenter
Carol Wright KenderdineEasterseals, Inc.Co-Director, NADTC

MAJOR OBJECTIVES: • Person-centered technical
assistance and information• Training• Communication and Outreach• Coordination and partnership• Investment in community
solutions
MISSION: To promote the availability of accessible transportation options that serve the needs of Older Adults, People with Disabilities, Caregivers and Communities.
Photo Credit: Metrolina Association for the Blind, Charlotte, NC
Cost Allocation Course
Session 1 – Basics of cost allocation, demonstrate how to use the model and how to apply it for things like forecasting and setting fares. Session 2 – Illustrate reasons to allocate your costs, how
your fully allocated cost can be a tool for coordination. Session 3 – Determine the difference between pricing,
cost, value and how to communicate these to others.
4

POLL 1
What is the main reason you signed up for this course?

Self-Assessment

Cost Allocation
Financial planning technique All commitment or use of time, money, resources,
administration Estimates operating expenses Does not necessarily set prices for service Does not usually include capital costs
7

Cost Allocation, continued
Logical Defensible Consistent In Writing
www.nadtc.org 8

9
Fares = Cost of Trip
The cost of your ride is the fare charged as the customer boards the vehicle.
What do you think? Type responses in chat box
10
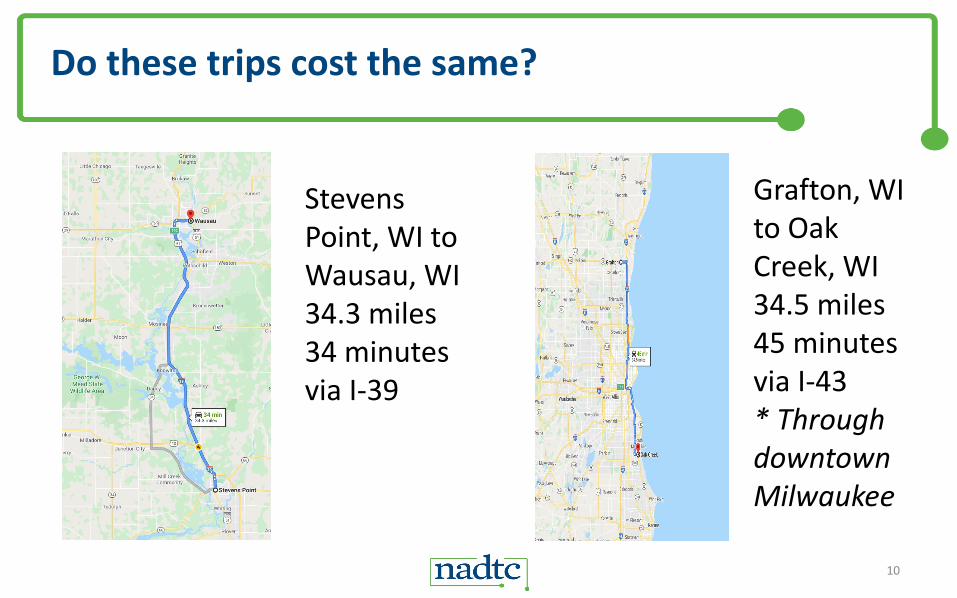
Do these trips cost the same?
Stevens Point, WI to Wausau, WI 34.3 miles 34 minutes via I-39
Grafton, WI to Oak Creek, WI34.5 miles45 minutes via I-43* Through downtown Milwaukee

Chart of Accounts
Complete listing of account titles (revenue and expenses) used by an organization
Tool that ensures all costs are reflected in cost allocation model

Capital vs. Operating Costs
Fixed vs. Variable Costs
Direct vs. Indirect Costs
12
Full Cost Accounting

Capital vs. Operating
Capital Costs – expenses associated with long-term acquisitions and leases of physical assets such as vans, buses, garages and facilities
Operating Costs – expenses consumed in a fiscal year to make the transit system operate (i.e., labor, benefits, materials, insurance, supplies, fuel, maintenance)
Capital Costs + Operating Costs = Total Costs13

14
Fixed vs. Variable Costs
Fixed Costs – those which do not vary with the amount of service provided (administrative salaries)
Variable Costs – those which do change with the amount of service provided(driver’s wages, fuel, maintenance costs)
Fixed Costs + Variable Costs = Total Costs

15
Direct vs. Indirect Costs
Direct Costs – those which can be associated on a one-to-one basis with a given service (driver labor, fuel, maintenance costs)
Indirect Costs – those which support common or joint programs or purposes (shared costs such as utilities and administrative costs)
Direct Costs + Indirect Costs = Total Costs

Cost Allocation of Direct & Indirect Costs
There are no universal rules for classifying a specific cost as direct or indirect.
The “test” is the degree of ease with which a cost can be assigned with a high degree of accuracyand consistency.
www.nadtc.org 16

A Note on Depreciation
In the majority of cases, transit and transportation agencies likely will receive capital assistance through one or more FTA grants (Sections 5307, 5310, 5311) Additionally, it is likely that when human service agencies purchase service from another organization, they may use, in part, revenues derived from federal grants that support client transportation.
17

A Note on Depreciation, continued
Both OMB Circulars A-87 and A-122 specifically exclude the cost of depreciation as an allowable expense under federal awards.
Language in both circulars is identical, reading as follows:The computation of depreciation or use allowances will exclude:• The cost of land• Any portion of the cost of buildings and equipment borne by or
donated by the federal government irrespective of where the title was originally vested or where it presently resides; and
• Any portion of the cost of buildings and equipment contributed by or for the governmental unit, or a related donor organization, in satisfaction of a matching requirement.
18

Listening for Comprehension Slide
_________ Costs are those costs which can be associated on a one-to-one basis with a given service.
Put your answers in the chat box!
www.nadtc.org 19
Cost Allocation Model
Assemble cost and service data Assign cost figures to categories that explain how costs
vary Calculate average unit costs – can be used to determine
specific route or services costs, per mile, hour or per trip basis
20

21
Data Required
12 months actual expense data
Service Data
Vehicle Miles
Vehicle Hours
One-way Passenger Trips
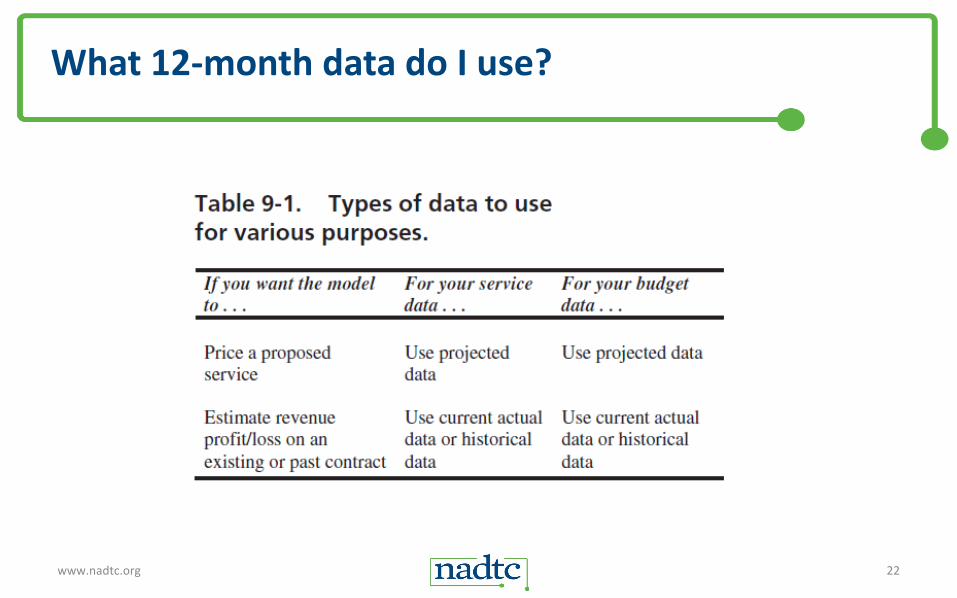
What 12-month data do I use?
www.nadtc.org 22

23
Applying the Unit Cost Model
1. Decide what factors you will use to allocate costs (miles/hours) and directly charge as many expenses as possible to the specific service
2. For each expense item, determine which of the allocation variables best explains the variance in the cost item. (i.e., fuel & maintenance are most closely related to distance traveled – miles while wages would be hours)
3. Divide shared expenses based on how resources are used:
Vehicle miles / Vehicle hours (transit only) % of time spent by staff (multi-service) % of space used (multi-service) Arbitrary but consistent allocation
Generate Unit Cost Rates
Calculate the unit cost factors for your miles-related expenses, your hours-related expenses, and your fixed expenses as a percentage of your total vehicle expenses
Calculate the total cost of any route or service by determining the # of miles traveled and the # of dedicated vehicle hours.
www.nadtc.org 24

Cost Allocation Example
Total Transit Expenses for Agency: $423,500Total Vehicle Miles: 190,000Total Vehicle Hours of Operation: 12,500Total Vehicles Operated by Agency: 6
www.nadtc.org 25
26
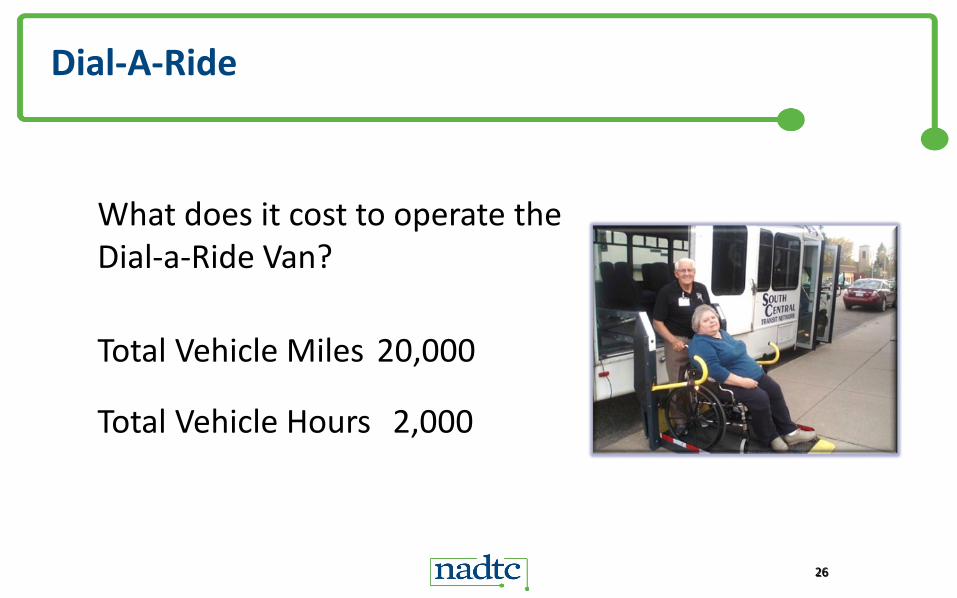
Dial-A-Ride
What does it cost to operate the Dial-a-Ride Van?
Total Vehicle Miles 20,000
Total Vehicle Hours 2,000

27
Cost Allocation – Simple Yet Imprecise Method
Cost per Mile
System Cost per Mile $423,500 / 190,000 = $2.23/mile
Dial-a-Ride Cost $2.23 x 20,000 = $44,600
Cost per Hour
System Cost per Hour $423,500 / 12,500 = $33.88/hour
Dial-a-Ride Cost $33.88 X 2,000 = $67,760
Why is there a difference?

28
Fully Allocated Cost Allocation Model
Unit Cost Model or
Fully Allocated Cost Model
Two most common variables used are:Vehicle milesVehicle hours
29
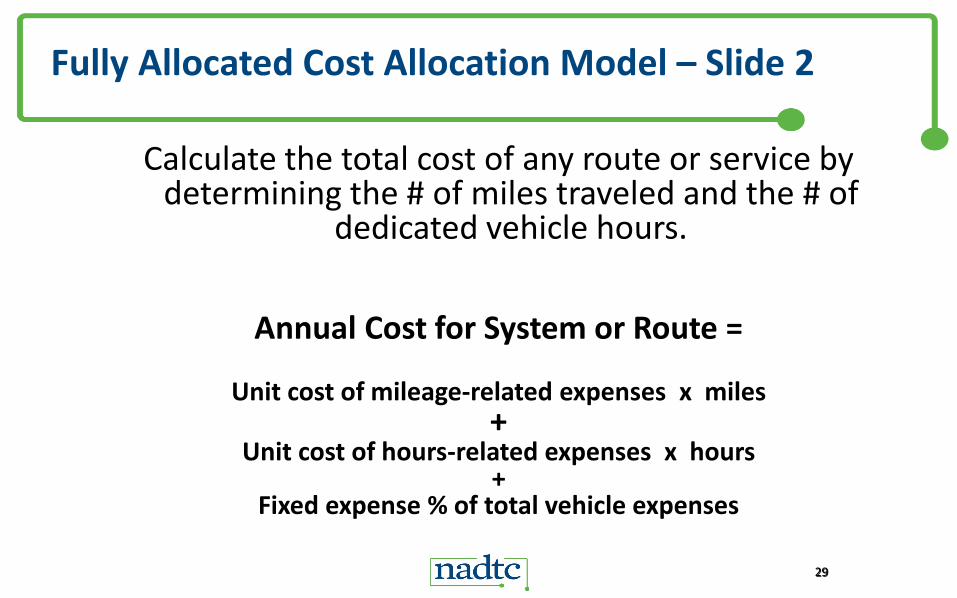
Fully Allocated Cost Allocation Model – Slide 2
Calculate the total cost of any route or service by determining the # of miles traveled and the # of
dedicated vehicle hours.
Annual Cost for System or Route =
Unit cost of mileage-related expenses x miles+
Unit cost of hours-related expenses x hours+
Fixed expense % of total vehicle expenses

Applying the Unit Cost Model – Step 1
1. Decide what factors you will use to allocate costs (miles & hours)
2. For each expense item, determine which of the allocation variables best explains the variance in the cost item. (i.e., fuel & maintenance are most closely related to distance traveled: miles; wages and benefits are most closely related to hours; administrative time and electricity are fixed costs)
www.nadtc.org 30

Assigning Costs by Category
For each expense item, determine which of the allocation variables best explains the variance in the cost item. (i.e., fuel & maintenance are most closely related to distance traveled – miles while wages would be hours)
Expense Account Total Cost
Variable Cost
Vehicle Hours
Variable Cost
Vehicle Miles
Fixed Cost
TransportationDriver Wages & Fringe xFuel & Oil xVehicle Insurance x
Maintenance Mechanic Wages & Fringe xTires, Tubes, & Parts xContracted Maintenance x
DispatchLabor & Fringe xTelephone xComputer/Copier x
AdministrativeSalaries & Fringe xOffice Materials/Supplies xPostage/Newsletter xUtilities x
Total CostsAnnual Operating Statistics
Unit CostsFixed Cost Factor (TFC as % of TVC)Fixed Costs as % of Total Costs

Applying the Unit Cost Model – Step 2
3. Assign expense items to cost factors: Miles, Hours or Fixed
4. Calculate the unit cost factors for your miles-related expenses and your hours-related expenses.
5. Determine the % of your vehicle expenses that are your fixed or overhead costs.
www.nadtc.org 32

Expense Account Total Cost
Variable Cost
Vehicle Hours
Variable Cost
Vehicle Miles Fixed Cost
TransportationDriver Wages & Fringe $220,000 $220,000Fuel & Oil $ 35,000 $ 35,000Vehicle Insurance $ 22,000 $ 22,000
Maintenance Mechanic Wages & Fringe $ 28,000 $ 28,000Tires, Tubes, & Parts $ 18,000 $ 18,000Contracted Maintenance $ 7,000 $ 7,000
DispatchLabor & Fringe $ 20,000 $ 20,000Telephone $ 5,000 $ 5,000Computer/Copier $ 5,000 $ 5,000
AdministrativeSalaries & Fringe $ 40,000 $ 40,000Office Materials/Supplies $ 4,000 $ 4,000Postage/Newsletter $ 7,500 $ 7,500Utilities $ 12,000 $ 12,000
Total Costs $423,500 $240,000 $ 88,000 $ 95,500Annual Operating Statistics 12,500 hrs. 190,000 mi.
Unit Costs $19.20/hr. .46/mile Fixed Cost Factor (TFC as % of TVC) 29%Fixed Costs as % of Total Costs 22 5%
Assigning Costs by Dollar
Individual Routes or Service Calculations
Calculate the total cost of any route or service by determining the number of miles traveled and the number of dedicated vehicle hours.
Unit cost of the mileage-related expenses x miles +Unit cost of hours-related expenses x hours
x fixed vehicle cost % = cost for route or service
www.nadtc.org 34

35
Example 1 Dial-A-Ride Data
Total Transit Expenses for Agency: $423,500
Total Vehicle Miles: 190,000
Total Vehicle Hours of Operation: 12,500
Total Vehicles Operated by Agency: 6
Dial-a-Ride Miles 20,000
Dial-a-Ride Hours 2,000

36
Example 1 Dial-A-Ride
What does it cost to operate the Dial-a-Ride Van?
Total Vehicle Miles 20,000
Total Vehicle Hours 2,000

Applying the Unit Cost Model to Dial-a-Ride Example
Annual Cost for System or Route =Unit Cost of Mileage Related Expenses x Miles +
Unit Cost of Hours-Related Expenses x Hours x Fixed Expense %
Dial-a-RideSystem cost per mile based on miles-related expenses = .46/mile
System cost per hour based on hours-related expenses = $19.20/hr..46 x 20,000 ($9,200) + $19.20 x 2,000 ($38,400)= $47,600 x 1.29
($13,804) = $61,404
www.nadtc.org 37

38
Cost Allocation – Using this Method
Cost per Mile
System Cost per Mile $423,500 / 190,000 = $2.23/mile
Dial-a-Ride Cost $2.23 x 20,000 = $44,600
Cost per Hour
System Cost per Hour $423,500 / 12,500 = $33.88/hour
Dial-a-Ride Cost $33.88 X 2,000 = $67,760

39
Discussion
Why is the cost per hour more accurate than the cost per mile?
www.nadtc.org

Example 2: Volunteer Driver Program
www.nadtc.org 40

POLL 2
Will there be vehicle hour and mile expenses with a volunteer driver program?

POLL 3
Is the cost per mile the reimbursement you give to your volunteer drivers?

Example 2 – Volunteer Driver Program
Total Volunteer Expenses for Agency: $159,750
Total Vehicle Miles: 272,000
Total Vehicle Hours of volunteer time: 3,700
Total Vehicles Operated by Agency: 0
www.nadtc.org 43

Example 2 – Volunteer Driver Program
What does it cost to operate the Volunteer Driver Program?
Total Vehicle Miles 272,000
Total Vehicle Hours3,700
www.nadtc.org 44
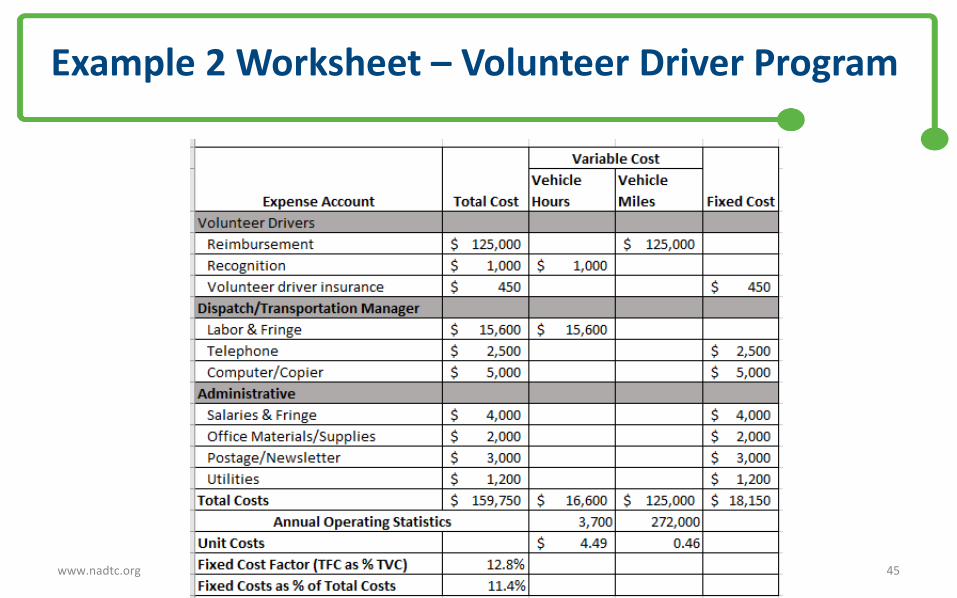
Example 2 Worksheet – Volunteer Driver Program
www.nadtc.org 45

Applying the Cost Model to Example 2: Volunteer Driver Program Step 1
Annual Cost for System or Route =Unit cost of mileage-related expenses x miles
+Unit cost of hours-related expenses x hours
xFixed Cost %
Volunteer Drivers : 272,000 miles & 3,700 hoursSystem Cost per mile based on miles-related expenses = .46
System Cost per hour based on hours-related expenses =$4.49Fixed Cost as % of Vehicle Expenses = 12.8%
www.nadtc.org 46

Applying the Cost Model to Example 2: Volunteer Driver Program Step 2
Annual Cost for System or Route =
Unit cost of mileage-related expenses x miles+
Unit cost of hours-related expenses x hoursx
Fixed Cost %.46 x 272,000 ($125,000) + $4.49 x 3,700 ($16,613) x 12.8% =
$159,739
www.nadtc.org 47
Applying the Model
Model is relatively simple Inclusive of all costs Provide the opportunity to distribute costs among customers
based on actual costs of services received• Agree on approach• Create standardized definition and data collections• Apply standardized chart of accounts• Develop procedure for recording, reporting and analyzing non-financial
data Model is flexible and can be used to analyze various categories of
total costs as needed
48
Evaluating and Updating the Cost Allocation Model
Evaluate your costs at least annually Update if your agency experiences any of these major changes:
• Addition/reduction of modes of service • Merger with another agency • Adoption of a new chart of accounts • Restructure of the agency’s organization • Change in the nature of the transit agency’s operations • Major initiatives that would affect mode or function’s usage of costs • Transition from directly operated to purchased transportation or vice
versa
www.nadtc.org 49

Cost Allocation’s Role in Budgeting/Managing Transit
Forecasting Fare Setting Contract Rate Changes Capitated Rates
www.nadtc.org 50

51
Forecasting Cost Impacts of Service Changes
Requires consideration of variable costs – the costs that will change if the service change is implemented.
(NOTE – Fixed costs will likely not change.)
Cost allocation model is modified to estimate the costs of service changes by omitting the fixed cost factor.
This approach can also be used to estimate the change in costs for service additions. (Again, fixed costs are likely to not change.)

52
Forecasting Cost Impact of Service Changes
Cost Change = (Hours-related expenses x hours of operation) + (Miles-related expenses x miles of operation)
Example: Find the cost of eliminating one route of a fixed-route service that traveled 33,000 miles in 2,400 hours of operation, based on the earlier example expenses:
Cost Change = ($19.20 x 2,400) + ($.46 x 33,000) $61,260 = $46,080 + $15,180

Forecasting
Internally, you should develop a procedure for recording, reporting and analyzing non-financial data in addition to your costs. This could include an overview/review of programs, businesses, and other things that could impact ridership or routes.
Record your assumptions.
www.nadtc.org 53

Setting Fares
Need to Know: Cost per ride per service Federal and state subsidy per ride
Cost per ride minus federal/state subsidy
Small Urban & Rural Transit Center

Setting Fares – cont.
Determine a reasonable (or required) fare recovery
Cost of ride/service x fare recovery %
Small Urban & Rural Transit Center
Setting Fares – cont. 2
County mill available per ride Other local match available per ride
Does not have to be the same for each service provided or
Can be allocated to all rides equally

Fare Recovery Ratio
Fares based on a desired fare recovery ratio
To determine the appropriate fare, multiply the desired ratio (i.e., 15%) by the average cost per trip for the type of service.
Dial-a-Ride cost per year $61,404One-way passenger trips per year 6,532Cost per ride $9.40Fare recovery ratio of 15% = $1.41$7.99/ride covered by subsidies: federal/state & local match

Changing Fares
Process that involves politics as well as economics
Must be well-thought-out
Done infrequently
Be transparent
Results of Fare Increases
Must factor in the amount by which ridership/demand will drop as the fare increases
Different for each transportation system
Factors that influence reaction include: Type and quality of service available from your system Local economic conditions Alternative transportation options (family, friends, self, other
public & private transit operators)

Rate-Setting Models
Requires all costs reported with standard chart of accounts Projected miles & hours Take into account subsidies or income from other
sources than the federal government Compute cost per hour and cost per mile for service Account for other factors that affect pricing
60
Alternate Rate Structures/Fares
Flat Fares – Same rate for all trips regardless of distance traveled, time of day or amount of assistance (in-town transit or anywhere the geographic area of coverage is limited)
Distance-based Fares – Vary according to distance traveled with charges per mile or per zone. (long distance commuter service; rural area to larger hub city for medical and/or shopping)
Small Urban & Rural Transit Center

Alternate Rate Structures/Fares cont
Hourly-rate Fares – Based on cost/hour of service (subscription service)
Service-based Fares – Door-to-door or curb-to-curb vs. bus stops (demand/response vs. fixed route; paratransit vs. fixed route)

Summary
Comprehensive cost accounting system includes all costs incurred and all services rendered. Your process should be reasonable, consistent, and defensible. Understand rides, miles or hours of service in the provision of the contract and get a sense of the actual cost to the organization to deliver those services. Determine your reasons for allocating your costs and be ready to use them in partnering with others, applying for funding, and educating decision makers on your services.
www.nadtc.org 63

Summary, continued
Use Cost Allocation Model for Forecasting, Setting Fares & Contract Rates, and Working with Capitated Rates Understand Factors that go into Setting Fares
www.nadtc.org 64

Self-AssessmentFina l
Session 1 Homework
Prior to Session 2, enter your budget and service numbers for 2019 into the worksheet.
Office hours are available to answer questions outside of the course. Email [email protected] to schedule a block during the times below.• Thursday, October 15 – 8:00 -9:00 CT• Friday, October 16 – 2:00-3:00 pm CT• Tuesday, October 20 – 9:30-10:30 am CT
66

Questions
www.nadtc.org 67
68
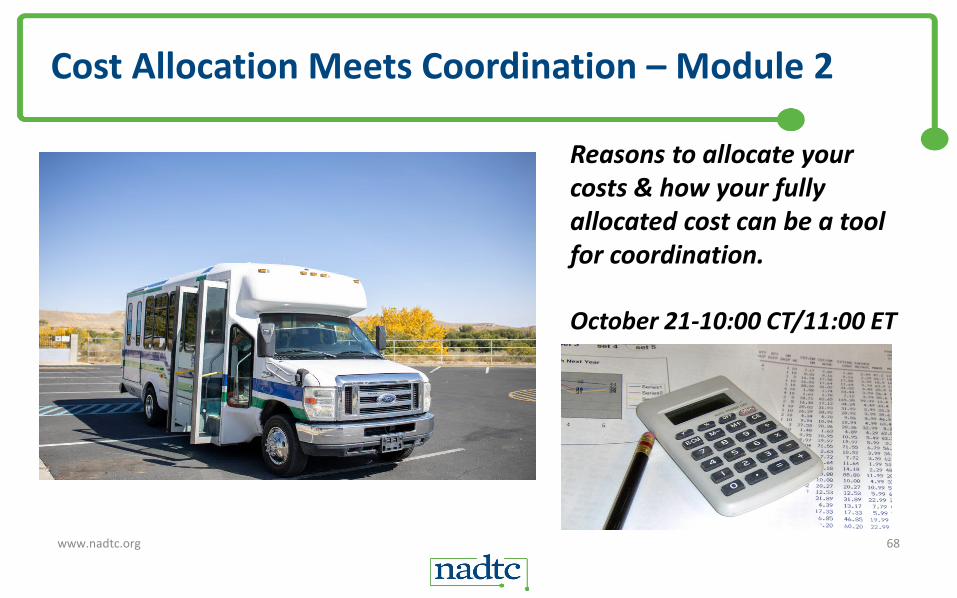
Cost Allocation Meets Coordination – Module 2
Reasons to allocate your costs & how your fully allocated cost can be a tool for coordination.
October 21-10:00 CT/11:00 ET
www.nadtc.org

69
NADTC says…
www.nadtc.org

www.nadtc.orgToll-free # 866.983.3222
![Data-Driven Dynamic Robust Resource Allocation for ... · • Coordination and resource allocation in smart transportation – Smart parking: [Geng and Cassandras, 2013] – Bike](https://static.cupdf.com/doc/110x72/604b38261b348557a57f1b06/data-driven-dynamic-robust-resource-allocation-for-a-coordination-and-resource.jpg)


![Asynchronous Inter-Level Forward-Checking for DisCSPs · coordination, such as distributed resource allocation problems [1], distributed schedul-ing problems [2], sensor networks](https://static.cupdf.com/doc/110x72/5f2c6c9e89a8d01435643760/asynchronous-inter-level-forward-checking-for-discsps-coordination-such-as-distributed.jpg)


