Corporate Venture Capital, Value Creation, and Innovation
Thomas J. Chemmanur*
Elena Loutskina**
and
Xuan Tian***
Current Version: November, 2013
* Professor of Finance, Carroll School of Management, Boston College, Chestnut Hill, MA 02467, Telephone: (617) 552-3980, Email: [email protected]
** Assistant Professor of Finance, Darden School of Business Administration, University of Virginia, Charlottesville, VA 22903, Telephone: (434) 243-4031, Email: [email protected]
*** Assistant Professor of Finance, Kelley School of Business, Indiana University, Bloomington, IN 47405, Telephone: (812) 855-3420, Email: [email protected] We are grateful for comments and suggestions from two anonymous referees, David Hirshleifer (the editor), Brian Broughman, Mara Faccio, Joan Farre-Mensa, Thomas Hellmann, William Kerr, Josh Lerner, Laura Lindsey, Ramana Nanda, Manju Puri, Krishnamurthy Subramanian, Hassan Tehranian, Fei Xie, conference participants at the 2013 Western Finance Association meetings, the 2012 Law and Entrepreneurship Retreat, the 2012 China International Corporate Governance Conference at Tsinghua University, the 2011 NBER Entrepreneurship Workshop, the 2011 inaugural SFS Finance Cavalcade conference, the 2011 FIRS conference, the 2011 Sun Trust FSU Finance Spring Beach Conference, and the 2011 Annual Conference on Entrepreneurship and Innovation at Northwestern University, and seminar participants at Harvard Business School, Indiana University, Boston College, Purdue University, and University of South Florida. We thank Zhong Zhang for his excellent research assistance. We alone are responsible for any errors or omissions.
Corporate Venture Capital, Value Creation, and Innovation
ABSTRACT
We analyze how corporate venture capital (CVC) differs from independent venture capital (IVC)
in nurturing innovation in entrepreneurial firms. We find that CVC-backed firms are more innovative, as
measured by their patenting outcome, although they are younger, riskier, and less profitable than IVC-
backed firms. Our baseline results continue to hold in a propensity-score-matching analysis of IPO firms
and a difference-in-differences analysis of the universe of VC-backed entrepreneurial firms. We present
evidence consistent with two possible underlying mechanisms: CVCs’ greater industry knowledge due to
the technological fit between their parent firms and entrepreneurial firms and CVCs’ greater tolerance for
failure.
Key Words: Innovation, Corporate Venture Capital, Value Creation, Patents, Citations JEL Classification: G24, G23, O31
1
The role of innovation as a critical driver of a nation’s long-term economic growth and
competitive advantage has been well established in the literature since Schumpeter. However, the optimal
organizational form for nurturing innovation by US corporations is still an open question that has been the
subject of an important policy debate in recent years. For example, as Lerner (2012) points out, while
researchers in corporate research laboratories account for two thirds of all US research, it is not obvious
that the current corporate setting is the best organizational form to nurture innovation, perhaps because
large firms provide researchers with too little contingent compensation. On the other hand, he suggests
that, while independent venture capital (IVC) firms have done great things for innovation, they have done
so only in a few targeted industries, are subject to booms and busts (where funds from limited partners are
either in oversupply or very scarce), and are vulnerable to mercurial public markets.1 Lerner (2012)
therefore suggests that perhaps the best way to motivate innovation is a “hybrid” model such as a
corporate venture capital (CVC) program that combines features of corporate research laboratories and
venture-backed start-ups “within a powerful system that consistently and efficiently produces new ideas.”
U.S. corporations started establishing CVC funds as early as the 1960s. Over the years, CVC
investments accounted for on average 7% of the venture capital industry. More recently, the share of CVC
investments has increased significantly, reaching 15% by the end of 2011, according to the National
Venture Capital Association. Corporations view establishing CVC subsidiaries as an effective way to
conduct research and development (R&D) activities externally, and to expose their management to new
technologies and an entrepreneurial way of thinking (Chesbrough, 2002; MacMillan et al., 2008). Not
surprisingly, corporations with CVC subsidiaries enjoy a significant increase in their own innovation
productivity and higher firm values (Dushnitski and Lenox, 2005, 2006). To the best of our knowledge,
however, the effect of CVC financing on the innovation productivity of entrepreneurial firms backed by
them has not been explored. The objective of this paper is to fill this gap in the literature by analyzing the
1 It is also worth noting that the traditional venture capital industry has been shrinking since the financial crisis and that it has underperformed over the previous decade (Harris, Jenkinson, and Kaplan, 2013).
2
relative efficiency of CVCs and IVCs in nurturing innovation by the entrepreneurial firms backed by
them.
The relative ability of CVCs and IVCs in nurturing innovation is ultimately an empirical
question. CVCs may be superior to IVCs in nurturing innovation, because CVC’s unique organizational
and compensation structure may allow them to be more supportive of risky innovative activity. First,
CVC funds are structured as subsidiaries of corporations, unlike IVC funds which are structured as
limited partnerships and are restricted by a contractually enforced 10-year lifespan. This means that CVCs
have longer investment horizons than IVCs. Second, as corporate subsidiaries, CVCs pursue both the
strategic objectives of their parent companies and financial objectives, while IVCs’ sole investment goal
is to achieve high financial returns. Third, the performance-based compensation structure (i.e., 2% of
management fees and 20% of carried interest) enjoyed by IVC fund managers is normally not found in
CVC funds: CVC fund managers are compensated by a fixed salary and corporate bonuses that are tied to
their parent company’s financial performance. The above three differences between CVCs and IVCs,
namely, longer investment horizons, not being purely focused on financial returns, and the lack of purely
performance-driven compensation schemes, may allow CVCs to be more open to experimentation and to
occasional failures in their portfolio firms (necessary for motivating successful innovation) compared to
IVCs. Further, the presence of a corporate parent may provide CVCs with a unique knowledge of the
industry and the technology used by their portfolio firms, which is absent in IVCs. This superior industry
and technology expertise of CVCs may enhance their ability to better use the soft information they
receive about their portfolio firms’ R&D activities, thus allowing them to better assess and nurture these
new ventures’ technologies and products. Taken together, the above factors may allow CVCs to be more
effective than IVCs in nurturing innovation in their portfolio firms.
However, CVCs’ unique organizational structure may also adversely affect their ability to foster
innovation in their portfolio firms compared to IVCs. CVCs are structured as subsidiaries of corporations
and have to procure the amount they invest in their portfolio firms from their corporate parents. This
means that CVCs are subject to centralized resource allocation and associated corporate socialism (Rajan,
3
Zingales, and Servaes, 2000; Scharfstein and Stein, 2000) which may foster mediocrity in R&D activities
(Williamson, 1985; Seru, 2012). In addition, as corporate subsidiaries, CVCs pursue the strategic
objectives of parent companies and their fund managers’ compensation is tied to parent firm financial
performance. Therefore, CVCs may be incentivized to use corporate parents’ deep industry and
technology expertise to exploit, rather than nurture, the entrepreneurial firms they invest in, and hence
impede innovation in these firms.2 In contrast, IVCs may be more efficient in their resource allocation
because they are structured as limited partnerships and have full control over the capital committed by
their limited partners. In addition, IVCs pursue purely financial returns and their fund managers are
compensated based on financial performance. Further, IVCs are known to significantly contribute to
entrepreneurial firms’ development: for example, they professionalize their management teams
(Hellmann and Puri, 2002) and foster collaborative relationships through strategic alliances among their
portfolio firms (Lindsey, 2008). Finally, IVCs also tend to specialize to a great extent (Gompers, Kovner,
and Lerner, 2009) and may thus possess the knowledge necessary to understand the industry specific
innovation process. Overall, their more efficient resource allocation, higher powered compensation
schemes, and specialized industry expertise may make IVCs superior to CVCs in nurturing innovation.
To address our research question, we first examine the innovation output of IPO firms backed by
CVCs versus those backed by IVCs. As has now become standard in the innovation literature (e.g.,
Aghion et al, 2005; Seru, 2012; and Kogan et al, 2012), we use the National Bureau of Economics
Research (NBER) Patent Citation database to construct two measures of innovation output: the number of
patents generated by a firm as our measure of the “quantity” of innovation, and the number of future
citations received per patent as our measure of the impact or “quality” of innovation. We find that CVC-
backed firms produce more patents and patents that are of higher quality. Specifically, as compared to
IVC-backed firms, CVC-backed IPO firms produce 26.9% more patents in the three years before IPO and
these patents receive 17.6% more citations. In the first four years after IPO including the IPO year, CVC-
2 Hellmann (2002) explicitly models a situation in which entrepreneurs seek financing from IVCs instead of CVCs because of their fear of being exploited by CVCs when their start-ups are in potential competition with CVCs’ parent companies in the product market.
4
backed firms produce 44.9% more patents that receive 13.2% more future citations. Our baseline results
are robust to alternative innovation measures (such as patent generality and patent originality) and a
subsample analysis of IPO firms with non-zero patents.
The above baseline results are consistent with two possible interpretations: the superior ability of
CVCs to nurture innovation (a treatment effect) as well as the superior ability of CVCs to identify and
select entrepreneurial firms with higher innovation potential (a selection effect). To disentangle these two
effects, an ideal experiment would be to evaluate the innovation output of entrepreneurial firms under the
random assignment of IVC and CVC investors. Since such an experiment is infeasible to implement, we
use the propensity score matching procedure, which allows us to minimize the difference in observable
characteristics between these two types of firms and thereby to disentangle the treatment effect from a
selection effect to some extent. We match the two types of firms at the IPO year using a wide set of
dimensions known to affect innovation output. Our propensity-score-matching analysis results show that
CVC-backed firms are characterized by an average of 25% higher innovation output pre-IPO and an
average of 45% higher innovation output post-IPO. While we cannot completely rule out the selection
effect, these differences are more likely to be attributable to a treatment effect, i.e., CVCs have a superior
ability to nurture innovation in their entrepreneurial firms.
While the IPO sample allows us to effectively control for a wide set of firm characteristics that
affect innovation, it is potentially subject to survivorship bias and a sample selection problem because
CVCs, compared to IVCs, may take only the most innovative firms public.3 To address this concern, we
examine a sample consisting of the universe of VC-backed entrepreneurial firms. We hand-match the
universe of VC-backed firms from the VentureXpert database to the patent information available from the
United States Patent and Trademark Office (USPTO) based on entrepreneurial firm name and location.
Using this sample we conduct the difference-in-differences (DiD) analysis to examine the effects of the
first round of IVC and CVC investments on entrepreneurial firms’ subsequent innovation output. We find
3 It is important to note that the reason why we focus only on IPO firms in our baseline analysis is due to data limitations: we do not observe private firms’ accounting and ownership information and therefore cannot control for important innovation determinants based on this information.

5
that entrepreneurial firms enjoy a significantly larger long-term increase in innovation output if they
obtain their first financing round from CVCs rather than from IVCs. Specifically, while these two groups
of firms exhibit a similar level of innovation output at the first investment round date, CVC-backed firms
exhibit momentum in their innovation output and outperform IVC-backed firms over 5 years post the first
investment round. We further show that this result is not driven by IPO successes alone, since we find
similar evidence when we split the sample based on their exit outcomes and the current status: firms that
eventually go public (the firms in our baseline sample); firms that are acquired by another company; firms
that are written-off; and firms that are still under active VC investment.
Another potential concern is that our results are due to CVCs investing in more mature firms that
are likely to be more innovative to begin with. To address this concern, we delve deeper into the
characteristics of CVC- versus IVC-backed firms, and show that CVC-backed entrepreneurial firms are in
fact younger and riskier at the VC investment round date. They spend significantly more on R&D than
IVC-backed firms, which is consistent with the greater innovation output of CVC-backed firms. CVC-
backed firms are less profitable in the years immediately after IPO as compared to IVC-backed firms,
although they start catching up in profitability in later years. CVC-backed firms not only receive their first
VC financing but also go public at a younger age than IVC-backed firms.
Finally, we explore two possible underlying economic mechanisms through which CVCs may
better nurture innovation than IVCs. First, we find that entrepreneurial firms that operate close to the
industrial expertise of the CVC’s parent company (i.e., have a better “technological fit” with the parent
firm) are more innovative. This finding is consistent with the superior technological expertise of CVCs
allowing them to better evaluate the quality of the entrepreneurial firm’s R&D projects and to better
advise these entrepreneurial firms. Since an entrepreneurial firm is more likely to establish a strategic
alliance with a CVC parent with which it has a technological fit, this is also consistent with Robinson
(2008), who argues that strategic alliances help overcome incentive problems and are therefore more
conducive to supporting risky innovation. Second, we evaluate the argument made by the existing
theoretical literature that greater tolerance for failure by principals may motivate greater innovative
6
activity by their agents. In their theoretical analysis, Hirshleifer and Thakor (1992) show that, because of
managers’ concern for personal reputation development, punishing managers for early failure results in
firms avoiding socially desirable but risky projects. In a somewhat similar vein, Manso (2011) argues
that, since innovation is a complex activity, the optimal way to motivate innovation is to show tolerance
for failure in the short run and provide rewards for success in the long run. In this context, failure
tolerance may be defined as the extent to which VCs allow entrepreneurial firms additional time to
overcome temporary setbacks or failures in the innovation process. Therefore, following Tian and Wang
(2013), we measure tolerance for failure as the amount of time that venture capitalists allow
entrepreneurial firms to bring their project to fruition before stopping their investment in these firms. We
find that CVCs are more failure tolerant than IVCs and the failure tolerance of VC investors positively
affects the innovation output of portfolio firms. The evidence suggests that greater tolerance for failure is
another important mechanism that allows CVCs to better nurture innovation compared to IVCs.
One limitation of our study is that we cannot conclusively distinguish between situations in which
CVCs have a superior ability to select ventures that are ripe for an improvement in innovation output and
in which they cause higher innovation output in their portfolio firms. However, the findings from our
propensity score matching analysis and our DiD analysis suggest that the difference in innovation output
between CVC- and IVC-backed firms is more likely due to a treatment effect, although we cannot entirely
rule out the possibility that our results are driven, at least partially, by a selection effect as well.
Our paper contributes to the ongoing debate about the optimal organizational form for nurturing
innovation in entrepreneurial firms. One question that arises from our finding that CVCs are better than
IVCs in nurturing innovation is why the two organizational forms co-exist and why the majority of
entrepreneurial firms continue to be funded by IVCs alone. One possible answer to the above question is
that CVCs may be able to better nurture innovation only in firms within certain innovative industries in
which the advantages of CVCs relative to IVCs, namely, better technological fit between the CVC
corporate parent and the entrepreneurial firm and the greater failure tolerance of CVCs, dominate. On the
other hand, for entrepreneurial firms in other industries, the disadvantage of CVCs relative to IVCs,

7
namely, the centralized resource allocation associated with CVCs obtaining funding from their corporate
parents and the potential conflicts of interest between a CVC’s corporate parent and the entrepreneurial
firm, may dominate, making IVCs the preferred source of financing.4
Our empirical findings shed light on the theoretical literature on corporate innovation and the role
of financial intermediaries in fostering innovation. The evidence that CVC-backed firms are more
innovative than IVC-backed firms provides some support for the theories of Aghion and Tirole (1994)
and Fulghieri and Sevilir (2009). These studies identify asymmetric information and moral hazard as key
impediments to internal corporate innovation and categorize circumstances when entrepreneurial firms
funded by CVCs are more innovative than those funded by IVCs. To the extent that we document that
CVCs are more failure tolerant than IVCs, and that the failure tolerance of a CVC is positively related to
the innovation undertaken by firms backed by it, our paper also provides further support for the failure
tolerance hypothesis of Manso (2011). Finally, Hellmann (2002) argues that CVCs may invest in
entrepreneurial firms mainly to benefit the CVC parent. In contrast, our findings indicate that CVC
backing actually benefits the innovation productivity of entrepreneurial firms.
Our paper also extends the existing empirical literature on corporate venture capital. Existing
studies find that CVC-backed firm tend to be either competitors of the CVC’s parent firms or have
technologies complementary to them (Masulis and Nahata, 2009). Further, CVC portfolio firms are more
likely to go public (Gompers and Lerner, 2000, Gompers, 2002), obtain higher valuation at the IPO date
(Ivanov and Xie, 2010), attract more reputable financial market players during the IPO process and have
better post-IPO long-run stock returns (Chemmanur, Loutskina, and Tian, 2011).5 While this literature is
consistent with the notion that the financial markets view CVC-backed firms as superior to IVC-backed
firms in some dimension affecting future cash flows, ours is the first paper that points to a source of this
4 Our industry level analysis discussed in Section 3.1 provides some support for this conjecture. 5 There is also a strategy literature that empirically examines the effect of establishing a CVC program on the parent firm’s innovativeness, value, and M&A transactions, see, e.g., Dushnitsky and Lenox (2005, 2006) and Benson and Ziedonis (2010). Note, however, that none of the above papers study the relation between backing by CVCs and the extent of innovation by the entrepreneurial firm.
8
superiority by explicitly showing that CVC financing increases the innovation productivity of
entrepreneurial firms.
Finally, our paper contributes to the emerging literature exploring the drivers of technological
innovation within firms. Spiegel and Tookes (2008) and Ferreira, Manso, and Silva (2012) link the
private versus public status of firms to the nature and extent of innovations generated by these firms. Seru
(2012) shows that the conglomerate organizational form adversely affects innovation productivity and
attributes this finding to incentive problems faced by inventors who become less productive when
confronted with centralized resource allocation. Hirshleifer, Low, and Teoh (2012) find that
overconfident CEOs invest more in R&D, obtain more patents and patent citations, and achieve higher
innovative efficiency. Other studies evaluate how the institutional and market settings affect firms’
innovation (e.g., Aghion, Van Reenen, and Zingales, 2013; Acharya and Subramanian, 2009; Cornaggia
et al. 2013; He and Tian, 2013; Fang, Tian, and Tice, 2013). Finally, the empirical literature showing that
VCs collectively contribute to technological innovation (e.g., Kortum and Lerner, 2000; Tian and Wang,
2013) is also related to our paper.
1. Institutional comparison of CVCs and IVCs
CVC and IVC funds share the same investment domain and a number of institutional features, but
are characterized by different organizational and corporate structures. First of all, CVCs are typically
stand-alone subsidiaries of non-financial corporations and they invest in new ventures on behalf of their
corporate parents. CVCs enjoy an almost unlimited (at least initially unrestricted) lifespan. In contrast,
IVCs are usually structured as limited partnerships that are subject to a contractually enforced ten year life
(with the option of an extension of at most two years). In addition, CVCs are solely funded by their
corporate parents and are not contractually limited in their ability to draw capital from a parent company
as needed. However, IVCs’ fund-draws are limited by the amount of capital initially committed by their
limited partners. The longer investment horizons and relatively unconstrained capital supply of CVCs
9
allow them to be more open to experimentation and exploration and to invest in long-term innovative
ventures that may not generate immediate financial returns but has a high upside potential.
Second, CVC and IVC funds use different managerial compensation practices and incentive
alignment schemes (Dushnitsky and Shapira, 2008). According to a 2000 survey conducted by Frederic
W. Cook & Co., a vast majority of CVC funds (68% of the respondents) do not enjoy high powered
performance-based compensation schemes (carried interest incentives) that are standard for IVC funds.
Instead, CVC fund managers are typically compensated through a fixed salary and annual bonuses that
are tied to the parent company’s performance, which is traditional in the corporate world. The survey also
indicates that almost none of the CVC funds follow the traditional VC model of requiring employees to
co-invest; they also do not permit voluntary co-investment by CVC fund management members. Overall,
such practices alter CVC fund managers’ incentives and are a double-edged sword in terms of nurturing
innovation in the entrepreneurial firms in which they invest. On the one hand, the lack of high-powered
compensation schemes allow CVC fund managers to be more failure tolerant (Manso, 2011) and therefore
to better nurture innovation. On the other hand, the fact that CVC fund managers’ compensation is tied to
their parent company’s performance may increase their incentives to advance the interests of their
corporate parents at the expense of the entrepreneurial firms they back, which, in turn, may impede
innovation in these firms. In other words, this incentive to help their corporate parent may motivate CVCs
to pursue exploitive rather than nurturing strategies toward entrepreneurial firms.
Third, unlike IVCs whose sole objective is to pursue financial returns, CVCs generally have a
strategic mission to enhance the competitive advantage of their parents by bringing new ideas or
technologies to these parent companies (MacMillan, et al., 2008). Therefore, CVCs pursue both strategic
and financial goals. Consequently, it is common for CVCs to seek commonalities between their corporate
parents and the new ventures they back. A closely linked entrepreneurial firm could take advantage of the
CVC parent company’s manufacturing plants, distribution channels, technology, or brand, and adopt the
CVC parent company’s business practices to build, sell, or service its own products. The corporate parent,
in return, receives a window into new technologies and markets from the entrepreneurial firm and as a
10
result could improve its existing business (MacMillan, et al., 2008). Therefore, the presence of a corporate
parent provides CVCs with a unique knowledge of the industry and the technology used by the
entrepreneurial firms they invest in. Such a technological fit between entrepreneurial firms and CVCs’
corporate parent companies allow CVCs to have superior industry and technology expertise and to have a
better understanding about the entrepreneurial firms’ technologies, which may help to nurture innovation
in these portfolio firms.6 The CVC organizational form may also allow the transfer of soft information
related to innovative projects between the CVC corporate parent and the entrepreneurial firm, a fact that
may be harder to accomplish in the setting of an IVC firm.7
In summary, on the one hand, the unique features of CVCs, namely, the longer investment
horizons, less performance-driven compensation schemes, and industry and technology support from their
parent firms, allow CVCs to provide better technological support and to be more failure tolerant towards
entrepreneurial firms they fund, enabling them to nurture innovation in these firms to a greater extent than
IVCs. On the other hand, CVCs’ need to procure resources from their corporate parents and their focus on
enhancing their parent firm’s performance may hamper their incentives and reduce their efficiency in
nurturing innovation in these entrepreneurial firms.
2. Data and sample selection
2.1 Identifying CVCs
To identify CVC investors, we start with the list of 1,846 VCs that enjoy investments from
corporations as reported by the Thomson VentureXpert database. Using various sources of information
(Factiva, Google, Lexus/Nexus, etc.), we manually identify VCs with a unique corporate parent. We find
that out of 1,846 potential CVC firms: (a) 456 firms that cannot be considered as a CVC since they are
funded by financial companies, partnerships, or multiple corporate parents; (b) 466 are CVC/IVC firms
that have a foreign or unknown parent. This leaves us with 926 distinct CVC firms out of which 562 are
6 Chesbrough (2002) argues that CVCs have a competitive advantage over IVCs due to their superior knowledge of markets and technologies, strong balance sheets, and ability to be a long-term investor. 7 A similar argument has been made by Seru (2012) in the context of decentralized versus centralized organizations.
11
affiliated with publicly traded parent firms. We define an entrepreneurial firm as a CVC-backed firm if it
receives financing from at least one CVC investor.
For each CVC firm in our sample, we find the characteristics of the corporate parent such as
industry, size, etc. Specifically, we match the sample of CVCs to the Compustat database to identify
publicly traded corporate parents and to the Dun & Bradstreet (D&B) database to identify privately held
corporate parents. This matching allows us to identify the primary SIC code for the CVC corporate
parent. We then use these SIC codes in our analysis of whether the technological fit between corporate
parents and entrepreneurial firms contributes to CVCs’ abilities to nurture innovation.
2.2 Baseline sample
We obtain the list of IPO firms that went public between 1980 and 2004. We focus our main
analyses based on a sample of IPO firms because of the lack of private firms’ financial data availability:
we do not observe private firms’ accounting and ownership information and therefore cannot control for
important drivers of innovation for private firms. We obtain the list of IPOs from the Securities Data
Company (SDC) Global New Issues Database.8 In line with other IPOs studies, we eliminate equity
offerings of financial institutions (SIC codes between 6000 and 6999) and regulated utilities, as well as
issues with offer price below $5. The IPO should issue ordinary common shares and should not be a unit
offering, closed-end fund, REIT, or an ADR. Moreover, the issuing firm must be present on the
Compustat annual industrial database for the fiscal year prior to the offering.
We merge this IPO list with VentureXpert to consistently identify VC-backed IPO firms. We find
that 287 IPO firms have venture investments as reported by VentureXpert but are classified as non-VC-
backed in SDC. We consider these firms to be VC-backed. Similarly, 365 firms are classified as VC-
backed in SDC but are not recorded in VentureXpert. We exclude these IPO firms from consideration if
the information on the identity of the investing VCs is unavailable through SDC and VentureXpert. We
8 The sample period ends in 2004 to allow for the availability of three years post-IPO innovation output and of five years post-IPO operating performance in the NBER Patent Citation database and Compustat, respectively.
12
also exclude IPO firms with investments from VCs that we are unable to classify or where the data on
venture investment is inconsistent across two databases. We end up with 2,129 VC-backed IPO firms of
which 462 are CVC-backed.
2.3 Measuring innovation
Following the existing literature (e.g., Kogan et al., 2012; Seru, 2012) we use patent-based
metrics to capture firm innovativeness. While earlier studies use R&D expenditures as a proxy for the
innovation activity, the patent-based measures are better proxies because they capture the actual
innovation output and capture how effectively a firm has used its innovation inputs (both observable and
unobservable). We obtain information on entrepreneurial firm’s patenting from the NBER Patent Citation
database (see Hall, Jaffe, and Trajtenberg (2001) for details). The database provides detailed information
on more than three million patents granted by the USPTO from 1976 to 2006, including patent assignee
names, the number of citations received by each patent, and a patent’s application as well as grant year,
etc. The span of the innovation data limits our ability to expand our IPO sample beyond 2004. We use the
NBER bridge file to Compustat to match patents to IPO firms. This link allows us to consistently evaluate
the innovation activity for IPO firms starting well before they go public.
The NBER patent database is subject to two types of truncation problems. We follow the
innovation literature to correct for the truncation problems. First, patents are recorded in the database only
after they are granted and the lag between patent applications and patent grants is significant (about two
years on average). As we approach the last few years for which there are patent data available (e.g., 2005
and 2006 in the database used in this paper), we observe a smaller number of patent applications that are
eventually granted. This is because many patent applications filed during these years were still under
review and had not been granted until 2006. Following Hall, Jaffe, and Trajtenberg (2001, 2005), we
correct for the truncation bias in patent counts using the “weight factors” computed from the application-
grant empirical distribution. The second type of truncation problem is stemming from citation counts.
Patents tend to receive citations over a long period of time, so the citation counts of more recent patents

13
are significantly downward biased. Following Hall, Jaffe, and Trajtenberg (2001, 2005), the citation
truncation is corrected by estimating the shape of the citation-lag distribution.
It is worth pointing out that the NBER patent database is unlikely to be subject to survivorship
bias. An eventually granted patent application is counted and attributed to the applying firm at the time
when the patent application is submitted even if the firm later gets acquired or goes bankrupt. In addition,
patent citations attribute to a patent but not a firm. Hence, a patent assigned to an acquired or bankrupt
firm can continue to receive citations for many years even after it goes out of existence.
We construct two measures for a firm’s annual innovation output.9 The first measure,
Ln(Patents), is the natural logarithm of annual truncation-adjusted patent count for a firm. Specifically,
this variable counts the number of patent applications filed in that year that is eventually granted.
However, a simple count of patents may not distinguish breakthrough innovations from incremental
technological discoveries.10 Therefore, we construct the second measure, Ln(Citations/Patent), that
intends to capture the importance of patents by counting the number of citations received by each patent
in the subsequent years. To better capture the impact of patents, we exclude self-citations when we
compute citations per patent, but our results are robust to including self-citations. To avoid losing firm-
year observations with zero patents or zero citations per patent, we add one to the actual values when
taking natural logarithm.
It is important to note that using patenting activity to measure corporate innovation is not without
limitations. For example, different industries have various innovation propensity and duration. Young
firms in some industries might abstain from patenting for competitive reasons. Therefore, fewer patents
generated in an industry might not necessarily be reflective of a less innovative industry. However, we
believe that an adequate control for heterogeneity across industries and firms should alleviate this concern
and lead to reasonable inferences that can be applicable across industries and firms.
9 We construct the innovation variables based on the patent application year. As suggested by the innovation literature (e.g., Grilliches, Pakes, and Hall, 1987), the application year is more important than the grant year since it is closer to the time of the actual innovation. 10 Griliches, Pakes, and Hall (1987) show that the distribution of patents’ value is extremely skewed, i.e., most of the value is concentrated in a small number of patents.

14
Table 1 Panel A reports the summary statistics for innovation output of IPO firms based on IPO
firm-year observations. The sample covers three years prior to and four years after the portfolio firm IPO
date. The distribution of patents is right skewed. On average, an entrepreneurial firm has 2.5 patents per
year. If we break down the sample into CVC- and IVC-backed firms, we find that CVC-backed
entrepreneurial firms have a larger number of patents, i.e., an average CVC-backed firm has 4 patents per
year, while an average IVC-backed firm has 1.6 patents. The impact of patents measured by the number
of citations per patent exhibits similar trends. On average, a firm’s patent receives 2.3 citations, and CVC-
backed firms generate patents with a larger impact (3.2 citations per patent) than those filed by IVC-
backed firms (1.8 citations per patent).
2.4 Control variables
Following the innovation literature, we obtain IPO firm financial information from Compustat
and construct a number of firm characteristics that affect firms’ innovation output. These control variables
include firm size (Ln(Total Assets)), profitability (ROA), R&D expenditures (R&D in Total Assets), asset
tangibility (PPE in Total Assets), leverage level (Leverage), capital investment (CE in Total Assets),
product market competition captured by the Herfindahl index based on sales (Herfindahl), growth
opportunities (Tobin’s Q), financial constraints (KZ Index), and firm age at the IPO year (Ln(Age at
IPO)). To mitigate non-linear effects of product market competition on innovation (Aghion et al., 2005),
we also include the squared Herfindal index (Herfindahl Squared) in our baseline regressions.
Table 1 Panel B provides summary statistics of the control variables: the observational unit is an
IPO firm. On average, an IPO firm in our sample has book value of assets of $110 million, ROA of -1%,
R&D-to-asset ratio of 10%, PPE-to-assets ratio of 23%, leverage ratio of 10%, capital expenditure of 8%,
Herfindahl index of 0.25, and Tobin’s Q of 4.3. These VC-backed IPO characteristics are similar to those
reported in other IPO studies.
In Table 2 we compare the maturity (Panel A) and the operating performance (Panel B) of CVC-
and IVC-backed IPO firms. We capture firm maturity by firm age at both the first VC investment year
15
and the IPO year. We measure firm age at the first VC investment year as the number of years between
the firm founding year and the first VC investment year. Similarly, a firm’s age at the IPO year is the
number of years from a firm’s founding year to its IPO year. To compare post-IPO operating
performance, we match CVC- and IVC-backed firms based on IPO year, Fama-French industry, and firm
total assets at IPO year to minimize potential biases. We ensure a unique match of IVC-backed IPO firm
for each CVC-backed IPO firm.
Panel A shows that CVC-backed firms are significantly younger than IVC-backed firms both in
the first VC investment year and in the IPO year. The mean age differences between these two groups of
firms are 3.5 years and 3.8 years at the first VC investment year and the IPO year, respectively. Panel B
shows that CVC-backed firms exhibits significantly poorer operating performance post-IPO (years zero to
year five) than do IVC-backed firms, even after controlling for firm IPO year, industry, and firm size.
CVC-backed IPOs underperform IVC-backed IPOs by 14.4% in terms of ROA and 147.2% in terms of
profit margin in the IPO year. However, CVC-backed IPOs’ profitability improves significantly over four
years post-IPO and their profit margin is statistically insignificant from that of IVC-backed firms in year
five. The evidence suggests that CVC-backed firms quickly catch up with IVC-backed firms in terms of
operating performance. Panel B also shows that CVC-backed firms persistently exhibit higher R&D in
post-IPO years than IVC-backed firms.
The poorer operating performance of CVC-backed firms immediately after IPO may reflect the
fact that they are younger at the time of IPO compared to IVC-backed firms. An alternative explanation
for this finding is that it generally takes a long time for firms to commercialize their innovation output and
enjoy the return from undertaking innovation. Therefore, CVC-backed firms’ higher innovativeness (as
we show in the next section) may not be completely reflected in their current cash flows and hence they
underperform when we use cash-flow-based performance metrics to gauge their operating performance.
16
2.5 Round financing
To understand the characteristics of entrepreneurial firms financed by CVCs and IVCs, we obtain
VC round-by-round investments from VentureXpert. We retrieve information about all entrepreneurial
firms that obtain venture capital financing between 1980 and 2004. We exclude financial firms, firms
with unclassified venture capital investments (e.g., those with foreign VC investors), and those with
missing or inconsistent data. This gives us 24,549 distinct entrepreneurial firms.
VentureXpert provides detailed information on individual financing rounds: the entrepreneurial
firm’s development stage at the first VC investment round, the date the firm was established, the date and
investment amount of each financing round, and the identity of the investing venture capital investors. We
update and fill in the missing observations for the date when the firm was established. We use Jay Ritter’s
database (available at http://bear.cba.ufl.edu/ritter/ipodata.htm) for the subset of firms that go public and
D&B and CorpTech Explore Databases for firms remaining private. We further update and cross-
reference this information with other databases. For example, we fill in the missing values for SIC codes
using Compustat for already public firms and D&B and CorpTech Explore Databases for private firms.
Finally, to be able to effectively control for the quality of IVCs co-investing with CVCs, we
obtain the list of IVCs from VentureXpert. We aggregate this data to the IVC firm level and construct
three reputation measures for each IVC and the financing round date: (a) age of an IVC firm; (b) number
of rounds an IVC firm participated in since 1965; and (c) total dollar amount invested since 1965.
3. Empirical results
The objective of our study is to compare the innovation output of CVC- and IVC-backed firms. In
our baseline analysis, we examine the innovation output of firms going-public pre- and post-IPO and
report the results in Section 3.1. In Section 3.2 we examine firms’ innovation output using propensity-
score-matched pairs of CVC- and IVC-backed IPO firms. In Section 3.3 we extend our baseline analysis
and evaluate the innovation output of all VC-backed firms (as opposed to comparing only firms that
17
eventually went public) in a difference-in-differences setting. In Section 3.4 we explore the investment
patterns of CVCs and IVCs to address alternative interpretations of our main results.
3.1 Baseline findings
We start by examining the innovation output of CVC- and IVC-backed firms prior to IPO. Since
young entrepreneurial firms’ innovation is relatively sporadic, we consider a cumulative innovation over
the three year period prior to the IPO date (see, e.g., Lerner, Sorensen, and Stromberg (2011) for a similar
setting). To evaluate the effect of CVC backing, we use three measures for the degree of CVC
participation: CVC Backing Dummy that equals one if the firm is classified as a CVC-backed IPO and
zero if the firm is classified as an IVC-backed IPO; Number of CVCs that counts the number of CVCs in
an investing VC syndicate; and CVC Share that measures the percentage investment made by the CVCs
within a VC syndicate. We control for a number of firm characteristics shown in the literature that affect a
firm’s innovation output as described in Section 2.4. The control variables are measured as of the
entrepreneurial firm’s IPO year. We include industry and year fixed effects and cluster standard errors at
the lead VC firm level. The observational unit in this analysis is the IPO firm.
Table 3 reports the OLS regression results for pre-IPO innovation output of CVC- and IVC-
backed IPO firms.11 In Panel A, the dependent variable is the total number of patents filed by the IPO firm
in the three years prior to its IPO year. The coefficient estimates of the three CVC backing variables are
all positive and statistically significant, suggesting that CVC backing is associated with a higher level of
innovation output of the firm three years prior to IPO. Economically, based on the coefficient estimate of
CVC Backing Dummy in column (1), a CVC-backed IPO firm generates 26.9% more patents than an IVC-
backed IPO firm in the three years prior to IPO. Based on the coefficient estimate of Number of CVCs
11 In addition to OLS regressions reported in this section, we use a Tobit model that takes into consideration the non-negative as well as censored nature of patent and citation data. We also run a Poisson model and a negative binomial model when the dependent variable is the number of patents to take care of the discrete nature of patent counts. The results are similar in these unreported analyses.
18
reported in column (2), one additional CVC investor in the investing VC syndicate increases the firm’s
number of patents by 15.9% in the three years prior to IPO.
Panel B of Table 3 presents a similar analysis for the patent quality measure. The coefficient
estimates of CVC backing variables are all positive and significant, suggesting that CVC-backed firms
generate patents with higher quality (i.e., larger impact). Based on the coefficient estimate of CVC
Backing Dummy in column (4), patents generated by CVC-backed firms in the three years prior to IPO
receive 17.6% more citations compared to those generated by IVC-backed firms.
We are aware of the possible look-ahead bias introduced by taking the values of control variables
at the firm’s IPO year in the above specifications. Unfortunately, the financial information for IPO firms
prior to going public is not available. We include these variables to control for firm characteristics that
can potentially affect innovation productivity. However, given the above reservations, we do not draw
any inferences based on these control variables’ coefficient estimates. The analysis without controls for
IPO firm characteristics results in both statistically and economically stronger results. For example, after
excluding controls for IPO firm characteristics, the coefficient estimate of CVC Backing Dummy is 0.343
(t-statistics = 4.18) in column (1) in which the dependent variable is patent quantity and the coefficient
estimate of CVC Backing Dummy is 0.227 (t-statistics = 3.18) in column (4) in which the dependent
variable is patent quality.
Table 4 presents the analysis of the post-IPO innovation output of CVC- and IVC-backed firms.
The dependent variables are based on the innovation output over the four-year period post IPO (including
the IPO year). Panel A suggests that CVC-backed firms have higher innovation quantity in the years post
IPO. The results are both economically and statistically significant. The coefficient estimate of CVC
Backing Dummy in column (1) suggests that a CVC-backed firm is able to generate 44.9% more patents
than an IVC-backed firm within the first four years after IPO. One additional CVC investor in the VC
syndicate increases the firm’s number of patents by 21.9% within the first four years after IPO.
In Panel B, we evaluate the impact of CVC backing on the quality of patents generated by the
firms post IPO. The coefficient estimates of CVC-backing variables are all positive and significant,
19
suggesting that CVC-backed IPO firms generate patents with higher quality. Specifically, as reported in
column (4), patents generated by CVC-backed firms within the first four years post IPO receive 13.2%
more citations than those generated by IVC-backed firms.12
In Table 4 we control for a comprehensive set of industry and firm characteristics that may affect
firm innovation output. Consistent with previous literature, we find that firms that are larger (more total
assets), have fewer tangible assets (lower PPE in total assets), have higher growth options (higher Tobin’s
Q), and have lower leverage are more innovative. A larger R&D spending, which can be viewed as a
larger innovation input, is associated with more innovation output. Product market competition,
profitability, and financial constraints do not significantly affect an IPO firm’s innovation output.
To further capture the underlying quality and fundamental nature of innovation output, we follow
Hall, Jaffe, and Trajtenberg (2001) and define two alternative innovation proxies: patent generality and
patent originality. Patents that are cited by a wider array of technology classes of patents are viewed as
having greater generality. We define a patent’s generality score as one minus the Herfindahl index of the
three-digit technology class distribution of all the patents that cite it. The higher a patent’s generality
score, the more the patent is being drawn upon by a diverse array of subsequent patents. Similarly, patents
that cite a wider array of technology classes of patents are viewed as having greater originality. We define
a patent’s originality score as one minus the Herfindahl index of the three-digit technology class
distribution of all the patents it cites. The higher a patent’s originality score, the more the patent draws
upon a diverse array of existing knowledge. We then average the individual patents’ generality and
originality scores at the IPO firm level and compute Generality and Originality, respectively.
Table 5 reports the results of our baseline regressions with the dependent variable replaced by
Generality in Panel A and by Originality in Panel B. Because generality and originality scores are
12 Lerner, Sorensen, and Stromberg (2011) study how private equity investment affects firm innovation by examining patent citations of a sample of LBO firms. They find that patents filed 4 years after the LBO transaction garner 57.4% more citations than those filed in the year of the LBO transaction. We find that patents filed by CVC-backed firms receive 13.2% more citations than those filed by IVC-backed firms in the first 4 years after IPO. While the setting in our paper is different from that in Lerner Sorensen, and Stromberg (2011), the effect of CVC financing on patent citations is generally smaller than those of private equity funds.
20
bounded between 0 and 1, we use a Tobit model to estimate the effect of CVC financing. For IPO firms
that generate no patents in either the three years before or the four years after IPO, their patent generality
and originality scores are undefined and therefore treated as missing. To save space, we suppress the
coefficient estimates of all controls. In both panels, columns (1) – (3) report the results for patents
produced prior to IPO and columns (4) – (6) report the results for patents produced after IPO. In Panel A,
the coefficient estimates of the CVC backing variables are all positive and significant except for that in
column (6), suggesting that patents generated by CVC-backed IPO firms are cited by subsequent patents
that are from a wider array of technology classes than those produced by IVC-backed IPO firms. In Panel
B, the coefficient estimates of the CVC backing variables are all positive and significant at the 1% level.
The evidence indicates that patents generated by CVC-backed IPO firms have a greater originality score.
In an untabulated analysis, we also undertake an industry-by-industry analysis to examine the
industries in which the positive effect of CVC financing on innovation is focused on. Following the
existing innovation literature (e.g., Atanassov, Nanda, and Seru, 2007; Tian and Wang, 2013), we group
our sample firms into four categories based on the technological nature of patents: 1) Pharmaceutical,
medical instrumentation, and chemicals (hereafter Pharmaceutical); 2) Computers, communications, and
electrical (hereafter Computers & electrical); 3) Software programming and internet applications
(hereafter Software); and 4) Other miscellaneous patents (hereafter Low-tech). If a firm has no patents,
we classify it into one of the above four categories on the basis of the type of patents that are most
frequently produced by the firm’s industry. We find that the Pharmaceutical and the Computers &
electrical industries generate a larger number of patents and their patents receive more citations than the
other two groups of industries. We also find that the positive effect of CVC financing on the innovation
output of the entrepreneurial firms are mainly focused in these two groups of industries. CVC-backed
firms, however, do not appear to be more innovative than IVC-backed firms if they are in the other two
groups of industries that are overall less innovative.
Finally, we examine a subsample of IPO firms that generate at least one patent prior to or after
IPO, given the concern that a large number of firms never file a patent in our sample. In an untabulated
21
analysis, we find that our baseline results continue to hold in this subsample. For example, the coefficient
estimate of CVC Backing Dummy is 0.357 (t-statistics = 2.38) in the regression in which the dependent
variable is the total number of patents generated by the IPO firm in the first four years after it goes public.
Overall, the evidence presented above suggests that CVC financing is positively related to the
innovation output of their portfolio firms both prior to and after IPO. CVC-backed IPO firms generate
both a larger number of patents and patents with higher quality compared to IVC-backed firms.
3.2 Propensity-score-matching analysis
While the documented difference in the innovation output between CVC- and IVC-backed firms
appears to be due to the CVCs’ ability to better nurture innovation, our baseline results could also be
attributed to other potential interpretations. One possible interpretation is that CVCs and IVCs might
invest in and/or take to the IPO market radically different types of firms. In other words, CVCs may have
superior selection abilities to identify entrepreneurial firms with high innovation potential to begin with.
To gauge how CVC- and IVC-backed firms differ in their observable characteristics, we report
the univariate comparisons between these two groups of firms in columns (1) – (3) of Table 6 Panel A.
The results suggest that CVC-backed firms are slightly larger, less profitable, spend significantly more on
R&D and have less fixed assets. They come from more concentrated industries and have higher growth
options (Tobin’s Q). Given that the characteristics of these two groups of firms are quite different, a
regression-based analysis is likely to provide us with an inaccurate estimate of CVCs’ impact on the
innovation productivity of entrepreneurial firms. In this section, we compare the innovation output of
CVC- and IVC-backed firms within the propensity-score matched pairs of entrepreneurial firms.
The propensity score matching approach allows us to disentangle the treatment and the selection
effect of CVC financing on the innovation output of entrepreneurial firms based on observable firm
characteristics. The results of our baseline analysis are consistent with both selection and treatment: the
superior ability of CVCs to nurture innovation as well as the superior skill of CVCs to select firms with
higher innovation potential. To disentangle these two effects, an ideal experiment would be to evaluate
22
the innovation of entrepreneurial firms under the random assignment of IVC and CVC investors. While
such an experiment is not feasible to implement, the propensity score matching analysis allows us to
minimize the effect of selection based on observables and is therefore the second-best approach.
We use a nearest neighbor matching implementation of the propensity score matching approach
originally developed by Rosenbaum and Rubin (1983).13 The propensity scores are estimated based on a
probit regression at the IPO firm level with the dependent variable being a binary variable equal to one for
CVC-backed firms and zero for IVC-backed firms. We use a set of control variables measured at the IPO
year as matching dimensions. We incorporate industry and year fixed effects to absorb any time- and
industry- specific heterogeneity not captured by firm characteristics. The probit model is estimated across
1,700 firms containing non-missing data for all of the matching dimension variables. We present the
estimation results in column (1) of Table 6 Panel B, labeled “Pre-Match.” We observe the same
significant differences between CVC- and IVC-backed firm characteristics as those reported in column
(3) in Panel A. The results also show that the specification captures a significant amount of variation in
the choice variable, as indicated by a pseudo-R2 of 16.1% and a p-value from the Ȥ2 test of the overall
model fitness well below 0.01.
We then use the propensity score (i.e., the predicted probability) from the “Pre-Match” probit
regression and perform a nearest-neighbor propensity score matching with replacement. Since the number
of IVC-backed firms significantly exceeds the number of CVC-backed firms, we use three nearest
neighboring IVC-backed firms that come from the same industry-year IPO group as our main control
group firms.
We conduct diagnostic tests to assess the accuracy of the matching procedure. First, we report the
univariate comparison between CVC- and IVC-backed firms for the matched pairs and report the results
in columns (4) and (5) of Panel A. We observe statistically insignificant differences between IVC- and
CVC-backed firms across all but one characteristic. Next, we re-run the probit model restricted to the
matched sample and reported the results in column (2) of Panel B, labeled “Post-Match”. The magnitude 13 Smith and Todd (2005) offer a discussion of matching procedures and recommendations.
23
of the probit regression coefficients decline dramatically. None of the industry and year dummies is
statistically significant in the “Post-Match” column whereas a majority of them are statistically significant
in the “Pre-Match” column. In addition, the pseudo-R2 drops dramatically from 16.1% prior to the
matching to 1.3% post the matching, and a Ȥ2 test for the overall model fitness shows that we cannot
reject the null hypothesis that all of the coefficient estimates of independent variables are zero (with a p-
value of 0.99). In both diagnostic tests, the only dimension of the CVC-backed firms that we cannot
match well with IVC-backed firms is the ROA. We observe that even after the match CVC-backed firms
are less profitable than IVC-backed firms. However, CVC-backed firms’ being at earlier stages of their
development and therefore being less profitable only biases our innovation analysis against our finding a
treatment effect of CVC financing. Thus, the matching process removes meaningful differences along
observable dimensions between these two groups of firms.
Table 7 reports the innovation output analysis using the propensity-score-matched pairs of IPO
firms. We report a wide set of results for different numbers of nearest neighbors used and different
limitations on the pool of control firms (year, industry, or industry-year). Panel A reports the quality of
innovation output. We find that, even after we non-parametrically control for firm characteristics (using
propensity score matching), CVC-backed IPO firms still have a higher innovation output both pre- and
post-IPO. The CVC-backed firms obtain 25 ~ 40% more patents pre-IPO and 38 ~ 60% more patents
post-IPO. We report the innovation quality results in Panel B. CVC-backed firms also tend to generate
better quality patents pre-IPO and about the same quality of patents post-IPO than IVC-backed firms.
In summary, the findings from our propensity score matching analysis suggest that CVC-backed
firms are more innovative. One caution is that, because the lack of pre-IPO financial variables does not
allow us to match CVC- and IVC-backed firms based on pre-treatment (before the firms receive the 1st
round VC financing) firm characteristics, we cannot fully eliminate superior CVC selection ability as an
alternative explanation for our results. However, given the natural bias of entrepreneurs against CVC
investors due to potential conflicts of interest (Hellmann, 2002), and the fact that CVCs tend to co-invest
with IVCs who typically lead the investment syndicate, we find that our results are unlikely to be entirely
24
driven by CVCs’ superior selection ability. Overall, our propensity-score analysis suggests that there is a
significant treatment effect of CVC backing on innovation by entrepreneurial firms backed by them.
3.3 The Difference-in-differences approach
A reasonable concern regarding the analysis so far is that our study only focuses on the sample of
entrepreneurial firms that eventually go public. It is possible that our results are driven by the fact that,
compared to IVCs, CVCs are more likely to bring their most innovative firms public. It is also possible
that our analysis based on the sample of IPO firms introduces survivorship bias issues. Therefore,
drawing conclusions solely based on an analysis of IPO firms could be misleading.
To address these concerns, we now implement our analysis of innovation intensity based on the
entire universe of VC-backed entrepreneurial firms from VentureXpert during our sample period. We
classify these firms based on their exit outcomes and current investment status into one of four categories:
firms that eventually go public; firms that are acquired by another company; firms that are written-off by
the VC investors; and firms that are still under active VC investment.14 We hand collect patent
information from the USPTO (available at http://www.uspto.gov/) and manually match it to these
entrepreneurial firms based on firm name and geographic location. For brevity, we only report results
based on patent counts. Our analysis of patent citations produces qualitatively similar results.
Table 8 Panel A reports the univariate comparisons of patent counts of CVC- and IVC-backed
firms. In column (1), the sample includes all VC-backed entrepreneurial firms. We find that CVC-backed
firms on average generate 0.6 more patents. The differences are statistically significant at the 1% level. In
columns (2) - (5), we break down the sample based on the exit outcomes of entrepreneurial firms.
Specifically, we report the results of firms that eventually go public in column (2), firms that are acquired
14 VentureXpert does not mark all written-down firms as write-offs. Therefore, in addition to the write-offs marked by VentureXpert, we classify a firm as a write-off if it did not receive any financing within a 10-year span after its very last venture financing round, based on the fact that venture partnerships require investment liquidation within 10 years from the inception of the fund in the majority of the cases. For robustness, we consider an alternative cut-off for classifying write-off firms if the entrepreneurial firm did not receive any follow-on financing within a 5-year span after its very last financing round. Our results are robust to either classification.
25
by another company in column (3), firms that are written-off in column (4), and firms still under active
VC investment in column (5). We observe that, regardless of the firms’ exit outcomes and current status,
CVC-backed firms generate a larger number of patents than IVC-backed firms.
Similar to our main analysis that is based on a sample of IPO firms, our study based on the
sample of all VC-backed entrepreneurial firms is also subject to the concern that the results are due to
CVCs’ superior selection ability. We explore the difference-in-differences (DiD) analysis around the first
VC investment year that mitigates this concern to a significant extent. Specifically, we construct a panel
data set that captures entrepreneurial firms’ annual innovation output around the first VC investment year
and estimate the following regression:
tiits
istis
s
stisti FirmYearCVCAfterAfterInnovation ,
5
1,
5
1,, HJE ���u� ¦¦
where stiAfter , is a dummy variable that equals one if year t is s years after the first investment round in
firm i, and zero otherwise. CVCi is a dummy variable that equals one if the first investment round is CVC-
backed and zero otherwise. The coefficient estimates of ȕs reflect the changes in portfolio firms’
innovation output since the first VC investment round. The coefficients of interest are Ȗs, which capture
the incremental innovation output associated with CVC backing in the years after the first investment
round. The sample covers a five year period for each entrepreneurial firm starting from the date of the
first financing round. The specification controls for time-invariant heterogeneity across CVC- and IVC-
backed firms via the firm fixed effects. The calendar year fixed effect capture the aggregate changes in
patenting rates in the U.S. economy. We cluster standard errors by the first investment round year.
Table 8 Panel B reports the results of our DiD analysis based on the firm’s exit type. Column (1)
includes all portfolio firms, column (2) reports the results for firms that eventually go public, column (3)
reports the results for acquired firms, column (4) reports the results for written-off firms, and column (5)
reports the results for firms still under active VC investment. We find that Ȗs are all positive and
significant two years after the first investment round in column (1). CVC-backed entrepreneurial firms
exhibit a substantially larger jump in innovation output compared to IVC-backed firms after the first CVC
26
(IVC) investment year. More interestingly, the innovation output of CVC- and IVC-backed firms are
similar during the first financing round year as Ȗ1 is insignificant in all columns. However, CVC-backed
firms seem to quickly gain momentum and increasingly outperform IVC-backed firms in subsequent
years. The magnitudes of Ȗs coefficients are monotonically increasing from Ȗ2 and are statistically
significant. We find a similar finding for entrepreneurial firms that go public, that are acquired, and that
are still under active VC investment. The only exception is the written-off firms in column (4), for which
CVC- and IVC-backed firms do not exhibit any significant differences in innovation output after the first
investment round.
Finally, we present the innovation dynamics that summarize the above findings graphically in
Figure 1. Panel A shows the number of patents for CVC- and IVC-backed firms over an eleven-year
period centered on the first CVC (IVC) investment round year, and Panel B depicts the citations per
patent over the same period. We observe that the two lines representing the innovation output are trending
closely in parallel in the five years leading up to the first CVC (IVC) round year. However, after the first
VC investment round, these two lines start to diverge with the line representing CVC-backed firms well
above the one representing IVC-backed firms.
Overall, the evidence presented in this section suggests that CVC-backed entrepreneurial firms
exhibit a substantially larger jump in innovation output compared to IVC-backed firms after the first CVC
(IVC) investment year.
3.4 Investment patterns
In the above analysis for the entire sample of VC-backed entrepreneurial firms, we attempt to
eliminate portfolio firm heterogeneity using the full set of entrepreneurial firm fixed effects. To further
ensure that our results are not driven by CVCs strategically investing in more mature firms that are
capable of producing more (and better quality) patents, in this section we analyze whether CVCs indeed
invest in more mature firms at the financing round date.
27
Table 9 reports the results of a probit analysis that uses VC round-by-round investments data. The
observation unit is a financing round. The dependent variable is a dummy that equals one for financing
rounds backed by CVCs and zero for financing rounds backed by IVCs. The independent variables can be
classified into three categories. First, we analyze individual firm-round characteristics such as
entrepreneurial firm age at the round date, round number, total amount received by the firm this round,
and total amount of prior investment. These variables reflect the maturity of the firm.
Second, we control for entrepreneurial firms’ industry characteristics. Since we do not observe
balance-sheet data for portfolio firms, we measure their industry characteristics using aggregate variables
for firms that are already publicly traded. Specifically, based on an entrepreneurial firm’s SIC code, we
construct industry-wide variables by averaging the characteristics of public firms in the same industry in
the year prior to the financing round. These industry-wide variables include capital expenditures and
R&D that are likely to capture the growth option features of the industry; sales growth over the three
years prior to the financing round that reflects past industry growth; equal-weighted industry portfolio
return over the six months prior to the financing round date that captures the effect of hot versus cold
industries; the beta of the industry portfolio over the 36 months prior to the financing-round date that
capture the systematic risk of the entrepreneurial firm; and the industry Herfindahl index and the market
share of the largest firm in the industry based on prior-year sales that evaluate the degree of competition
faced by the entrepreneurial firm. These variables allow us to compare the industry characteristics of
CVC- versus IVC-backed firms.
Finally, we control for the reputation of IVCs who invest in the entrepreneurial firm prior to the
round considered using three proxies: VC age, total number of rounds the VC has invested, and total
amount the VC has invested by the financing round date.
Table 9 reports our results with the industry characteristics being constructed based on the 2-digit
SIC industry definition.15 First, we find that CVCs tend to invest in younger firms at earlier rounds: the
15 We find similar results when we construct the industry characteristics based on 3-digit SIC, 4-digit SIC, or Fama-French industry definition.
28
coefficient estimates of firm age and round number are negative and significant at the 1% level. CVCs
also invest in firms that require significantly larger investments (those with smaller prior investment).
Second, CVCs provide funding to more capital and R&D intensive firms than IVCs. The positive and
significant coefficient estimate of industry beta suggests that CVC-backed firms come from riskier
industries. These industries also tend to be more competitive as the coefficient estimates of the Herfindahl
index and market share of the largest firm in the industry are negative.
In summary, we find that CVC-backed firms are more innovative than IVC-backed firms.
Although we cannot entirely rule out a selection effect, our evidence obtained from a propensity-score
matching analysis of CVC- versus IVC-backed IPO firms and the DiD analysis of all VC-backed
entrepreneurial firms suggests that these findings are more likely due to a treatment effect, i.e., CVCs
appear to have a better ability to nurture innovation in their portfolio firms.
4. Possible mechanisms
Our analysis so far shows that CVC-backed firms are more innovative than IVC-backed firms
although they are younger, riskier, and less profitable. The next natural question is what the economic
mechanisms are that allow CVCs to better nurture innovation as compared to IVCs. In this section, we
examine two potential mechanisms: (a) the technological fit between CVCs’ parent companies and the
entrepreneurial firms backed by them, motivated by the theories of Robinson (2008) and Fulghieri and
Sevilir (2009); and (b) tolerance for failure, motivated by the theory of Manso (2011).
4.1 Technological fit
Fulghieri and Sevilir (2009) argue that under certain circumstances firms move from internal to
external organization of projects to increase the speed of product innovation and to obtain a competitive
advantage with respect to rival firms in their industry. Similarly, Robinson (2008) shows that firms would
prefer to implement “long-shot” projects through strategic alliances rather that internally organized
projects. He shows that strategic alliances help overcome the incentive problems associated with

29
implementing these projects. By extension, entrepreneurial firms that are in close proximity to the
technological expertise of the CVC corporate parent may obtain significant advantages in pursuing risky,
long-shot innovation. Furthermore, as we argued in the introduction, CVCs that operate in the same
technological space with their entrepreneurial firms possess superior industry and technology expertise,
so that such CVCs are better able to develop and nurture new ventures’ technologies and product market
prospects compared to CVCs without such a “technological fit” (and also compared to IVCs).
In this section, we empirically study whether the technological fit between the CVC’s parent
company and the entrepreneurial firm is an underlying economic mechanism. Specifically, we examine
whether a technological fit contributes to the superior innovation output of CVC-backed entrepreneurial
firms. We define a technological fit dummy that equals one if the CVC parent company and the
entrepreneurial firm share the same Fama-French industry, and zero otherwise.16 We expect that CVC-
backed entrepreneurial firms with a technological fit to be more innovative than both CVC-backed firms
without a technological fit and IVC-backed firms.
Table 10 presents the result of our analysis. In Panel A we repeat our baseline regressions but
split the CVC-backing dummy into two dummy variables: CVC w/ technological fit is a dummy that
equals one if an entrepreneurial firm is backed by a CVC and the firm has a technological fit with at least
one CVC parent company and zero otherwise. Similarly, CVC w/o technological fit is a dummy equal to
one if an entrepreneurial firm is backed by a CVC and the firm does not have a technological fit with any
of the CVC parents and zero otherwise. The omitted group is IVC-backed entrepreneurial firms. Thus, the
coefficients of these two dummies represent respective CVCs’ effects on innovation output of CVC-
backed firms relative to IVC-backed firms. We report pre- and post-IPO innovation output in columns (1)
and (2), respectively. For brevity, we suppress the coefficient estimates of all control variables.
16 Our results are robust to alternative definitions of technological fit, i.e., technological fit is defined as the match when both the CVC’s parent firm and the entrepreneurial firm are in the same 2-digit SIC or 3-digit SIC code. One concern is that Robinson (2008) argues that strategic alliances are used to pursue related diversification rather than to extend activity in the same line of business. To address this concern, we exclude the set of CVC-backed firms with “technological fit” if these entrepreneurial firms share the same 4-digic SIC code with CVC parent, and we find similar results.
30
The coefficient estimates of CVC w/ technologic fit, ȕ1, are significantly higher than those of CVC
w/o technologic fit, ȕ2, in both the pre- and post-IPO innovation output regressions. The results suggest
that entrepreneurial firms with technological fit with a CVC’s corporate parent generate 44.4% (62.2%)
more patents than IVC-backed firm pre-IPO (post-IPO). While the CVC-backed portfolio firms that do
not have a technological fit with CVC corporate parent do not generate higher innovation output than
IVC-backed firms pre-IPO, they do exhibit a 31% higher innovation output than IVC-backed firms post-
IPO. The differences in magnitudes between ȕ1 and ȕ2 are statistically significant, suggesting that
entrepreneurial firms backed by CVCs with technological fit are more innovative than firms backed by
CVCs without technological fit.
We extend our analysis and examine the effect of technological fit on the innovation output using
a DiD analysis within the pairs of propensity-score-matched IPO firms and report the results in Panel B of
Table 10. The panel reports both the pre- and post-IPO innovation output results. In columns (1) – (3) of
Panel B we compare the pre- and post-IPO innovation output of IVC-backed firms to that of CVC-backed
firms with a technological fit to a CVC’s corporate parent. Columns (4) - (6) conduct a similar analysis
between IVC-backed firms and CVC-backed firms without a technological fit. Column (7) reports the
DiD estimates. For robustness, we present results based on different matching firm selection criteria. The
DiD estimates are generally positive and statistically significant. This result is consistent with our
findings reported in Panel A that technological fit enhances the innovation output of entrepreneurial firms
and is a possible economic mechanism through which CVCs better nurture innovation.
4.2 Tolerance for failure
The second possible mechanism responsible for CVCs’ superiority in nurturing innovation over
IVCs may be their ability to better understand the nature of the innovation process and hence their greater
tolerance for the failure associated with innovation activities. Motivating and nurturing innovation is a
complex and challenging task in most organizations, because the innovation process tends to be long,
risky, and unpredictable (Holmstrom, 1989). In a principal-agent setting, Manso (2011) argues that the
31
innovation process requires considerable experimentation on the part of the innovator, and thus incurs a
greater chance of failure.17 As a result, a significant amount of failure tolerance on the part of VC
investors is required to induce the optimal amount of innovation effort on the part of entrepreneurs.
As discussed in Section 1, a number of institutional features of CVCs may allow them to be more
failure tolerant than IVCs. First, CVC funds have a much longer investment horizon, which may be
necessary for nurturing innovation processes that are very long. Second, while IVCs pursue purely
financial returns, CVCs pursue both financial returns and strategic (non-financial) benefits for their
corporate parent companies. Finally, CVC fund managers are compensated through a fixed salary and
corporate bonuses, and hence their compensation is not as sensitive to performance as IVC fund
managers’. Taken together, these institutional features may allow CVCs to be more failure tolerant than
IVCs.
We first examine whether CVCs are indeed more failure tolerant than IVCs. Following Tian and
Wang (2013), we construct the failure tolerance measure by using the CVC (IVC)’s average investment
duration (in years) in their eventually failed ventures over the past 10 years. This measure captures a VC
investor’s attitude towards failure by gauging her willingness to continue investing in an under-
performing entrepreneurial firm before she “pulls the plug” (i.e., stops investing).18
Since this is a general test for VCs’ attitude towards failure, we examine all VC firms covered by
VentureXpert with non-missing values of failure tolerance in our sample period. In Panel A of Table 11,
we report the univariate comparisons of failure tolerance between CVCs and IVCs. The mean difference
in the failure tolerance measure between these two types of VCs is statistically significant at the 1% level,
suggesting that CVCs on average tend to wait two more months than IVCs before liquidating their
underperforming ventures. We observe a similar pattern when we compare the median values of failure
tolerance.
17 In a controlled laboratory experiment, Ederer and Manso (2012) show that the combination of tolerance for early failure and reward for long-term success (which parallels to a larger degree to the compensation structure enjoyed by CVCs compared to that received by IVCs) is the optimal compensation scheme for motivating innovation. 18 See Tian and Wang (2013) for a detailed discussion on the rationale and construction of these VC failure tolerance measures.
32
In Panel B of Table 11, we examine whether CVCs are more failure tolerant in a multivariate
regression framework. The dependent variable is VC failure tolerance and the main variable of interest is
CVC dummy that equals one for CVCs and zero for IVCs. Following Tian and Wang (2013), we control
for VC’s past successful investment experience (Past IPO Exit), VC’s expertise in certain industries
measured by its industry concentration (Industry Expertise), VC’s expertise in certain development stages
of venture (Stage Expertise), and proxies for VC’s reputation (Ln(VC Age), Ln(Past No. of Firms), and
Ln(Past Fundraising)) in the regressions. The observational unit is VC firm-year in this analysis. The
coefficient estimates of CVC dummy are all positive and significant. This finding suggests that CVCs are
indeed more failure tolerant than IVCs.
We then link this finding to our innovation output analysis. Similar to our analysis testing the
technological fit mechanism, we examine whether the innovation output differences between propensity-
score-matched pairs of CVC- and IVC-backed firms can be explained by the difference in failure
tolerance of their respective VC investors. Given that the failure tolerance measure is continuous rather
than dichotomous as in the case of our technological fit analysis, we implement the analysis by running
the following regressions:
Ln(InnovationCVC) – Ln(InnovationMatched IVC) =
= ȕ(Failure ToleranceCVC - Failure ToleranceIVC) + į’Controls + İ
where InnovationCVC - InnovationMatched IVC is the difference in the innovation output between a CVC-
backed IPO firm and the average innovation output of the set of IVC-backed IPO firms that are
propensity-score-matched to each CVC-backed firm. Failure ToleranceCVC - Failure ToleranceIVC is the
difference in failure tolerance between the respective sets of VCs investing in a CVC-backed firm and its
matching IVC-backed firms.19 If the difference in failure tolerance between the investors in the CVC- and
IVC-backed firms explains the difference in the innovation output of these respective types of firms, then
we expect the coefficient estimate of ȕ to be positive and significant. If, however, the tolerance for failure
19 If an entrepreneurial firm is financed by a VC syndicate that consists of multiple VC investors, we calculate the weighted average of the investing VCs’ failure tolerance, with the weight of each VC being the investment made by that VC firm as a fraction of the total VC investment received by the portfolio firm.
33
is not a mechanism that contributes to CVCs’ greater ability to nurture innovation, then ȕ should be equal
to zero.
Similar to our baseline regressions, we control for two sets of IPO firm characteristics measured
at the IPO year: one set is associated with the CVC-backed firm and the other set reflects the average
characteristics of propensity-score-matched IVC-backed firms. For example, for the three nearest
neighbors propensity-score-matched firms we average the financial characteristics across these three IVC-
backed firms and use the resulting averages a s control variables.
Panel C of Table 11 reports our regression results. For brevity, we only report the ȕ coefficient
estimates and suppress the control variable coefficients. Irrespective of the nearest neighbor restrictions
imposed in our propensity-score-matching procedure, we find that the coefficient estimates of ȕ are
positive and significant both pre- and post-IPO. The evidence suggests that the difference in failure
tolerance between CVCs and IVCs is able to explain the difference in the innovation output of their
entrepreneurial firms.20
Finally, in an untabulated analysis, we include the VC failure tolerance variable in the OLS
baseline regressions within CVC- backed firms and the propensity-scored-matched IVC-backed firms for
the innovation output of firms pre- and post-IPO. This test allows us to check whether CVC financing still
has a direct (residual) effect on innovation after controlling for failure tolerance. We find that, while the
coefficient estimates on VC failure tolerance variable in these regressions are all positive and significant,
the coefficient estimates on CVC financing variable are also still positive and significant at the 1% level.
However, the magnitudes of the coefficient estimates on CVC financing variable are reduced quite
substantially (for example, the coefficient estimate on CVC Backing Dummy is reduced to 0.171 when
pre-IPO patent count is the dependent variable) once we include the VC failure tolerance variable,
suggesting that the effect of CVC financing on innovation by entrepreneurial firms is at least partly
mediated through failure tolerance.
20 In untabulated tests, we augment our baseline regression analysis reported in Tables 3 and 4 with the failure tolerance measure, and find that failure tolerance has a positive effect on the innovation output of the entrepreneurial firms, while CVC backing variables continue to be positive and significant.

34
Taken together, our results presented in Section 4 suggest that there are two possible underlying
economic mechanisms through which CVCs nurture innovation to a greater extent than IVCs: The
technological fit between CVCs’ parent firms and the entrepreneurial firms backed by them and greater
failure tolerance by CVCs.
5. Conclusion
In this paper, we analyze how CVCs differ from IVCs in nurturing innovation in the
entrepreneurial firms backed by them. We find that CVC-backed firms achieve a higher degree of
innovation output, as measured by their patenting, although these firms are younger, riskier, and less
profitable. While our baseline results are based on entrepreneurial firms that eventually go public, we
come to similar conclusions based on our analysis of the entire universe of VC-backed entrepreneurial
firms, suggesting that our results are not driven by CVCs bringing their most innovative firms public.
While we cannot rule out the existence of a selection effect, we present a number of empirical tests
suggesting that our results are unlikely to be entirely driven by the better selection ability on the part of
CVCs. Instead, the results of our propensity-score matching and difference-in-differences analyses
suggest that there is a significant treatment effect of CVC financing on innovation. Our analysis reveals
two possible mechanisms through which CVCs are able to better nurture innovation: the technological fit
between CVCs’ parent firms and the entrepreneurial firms backed by them and the greater failure
tolerance by CVCs relative to IVCs.
35
References
Acharya, V., and K. Subramanian. 2009. Bankruptcy Codes and Innovation. Review of Financial Studies 22: 4949-4988.
Aghion, P., J. Van Reenen, and L. Zingales. 2013. Innovation and Institutional Ownership. American Economic Review 103: 277-304.
Aghion, P., N. Bloom, R. Blundell, R. Griffith, and P. Howitt. 2005. Competition and Innovation: An Inverted U Relationship. Quarterly Journal of Economics 120: 701-728.
Aghion, P., and J. Tirole. 1994. On the Management of Innovation. Quarterly Journal of Economics 109: 1185-1209.
Atanassov, J., V. Nanda, and A. Seru. 2007. Finance and Innovation: The Case of Publicly Traded Firms. Working Paper, University of Oregon.
Azoulay, P., J. G. Zivin, and G. Manso. 2011. Incentives and Creativity: Evidence from the Academic Life Science. RAND Journal of Economics 42: 527-554.
Benson, D., and R. Ziedonis. 2010. Corporate Venture Capital and the Return to Acquiring Portfolio Companies. Journal of Financial Economics 98: 478-499.
Chemmanur, T., E. Loutskina, and X. Tian. 2011. Differences in Financial Market Responses to Backing by Corporate versus Independent Venture Capitalists. Working Paper, Boston College.
Chesbrough, H. W. 2002. Making Sense of Corporate Venture Capital. Harvard Business Review March: 4-11.
Cornaggia, J., Y. Mao, X. Tian, and B. Wolfe. 2013. Does Banking Competition Affect Innovation? Journal of Financial Economics forthcoming.
Dushnitsky, G., and M. Lenox. 2005. When Do Incumbents Learn from Entrepreneurial Ventures? Research Policy 34: 615-639.
Dushnitsky, G., and M. Lenox. 2006. When Does Corporate Venture Capital Investment Create Firm Value? Journal of Business Venturing 21: 753-772.
Dushnitsky, G. and Z.B. Shapira. 2010. Entrepreneurial Finance Meets Corporate Reality: Comparing Investment Practices and Performing of Corporate and Independent Venture Capitalists. Strategic Management Journal 31: 990-1017.
Ederer, F., and G. Manso. 2012. Is Pay-for-Performance Detrimental to Innovation? Management Science, forthcoming.
Fama, E., and K. French. 1997. Industry Costs of Equity. Journal of Financial Economics 43: 153-193. Fang, V., X. Tian, and S. Tice. 2013. Does Stock Liquidity Enhance or Impede Firm Innovation. Journal
of Finance, forthcoming. Ferreira, D., G. Manso, and A. Silva. 2012. Incentives to Innovate and The Decision to Go Public or
Private. Review of Financial Studies, forthcoming. Fulghieri, P., and M. Sevilir. 2009. Organization and Financing of Innovation, and the Choice between
Corporate and Independent Venture Capital. Journal of Financial and Quantitative Analysis 44, pp.1291-1321
Gompers, P. 2002. Corporations and the Financing of Innovation: The Corporate Venturing Experience. in P. Gompers (editor), The Atlanta Federal Reserve Bank Conference Volume.
Gompers, P., and J. Lerner. 2000. The Determinants of Corporate Venture Capital Success: Organizational Structure, Incentives, and Complementarities. in R. Morck (editor), Concentrated Ownership, University of Chicago Press.
36
Gompers, P., A. Kovner and J. Lerner. 2009. Specialization and Success: Evidence from Venture Capital. Journal of Economics & Management Strategy 18: 817-845.
Griliches, Z., B. Hall, and A. Pakes. 1987. The Value of Patents as Indicators of Inventive Activity. In Dasgupta and Stoneman (eds.), Economic Policy and Technological Performance, Cambridge: Cambridge University Press.
Hall, B., A. Jaffe, and M. Trajtenberg. 2001. The NBER Patent Citations Data File: Lessons, Insights and Methodological Tools. Working Paper 8498, NBER.
Hall, B., A. Jaffe, and M. Trajtenberg. 2005. Market Value and Patent Citations. RAND Journal of Economics 36: 16-38.
Harris, R. S., T. Jenkinson and S. N. Kaplan. 2013. Private Equity Performance: What Do We Know? Journal of Finance, forthcoming.
He, J., and X. Tian. 2013. The Dark Side of Analyst Coverage: The Case of Innovation. Journal of Financial Economics 109: 856-878.
Hellmann, T. 2002. A Theory of Strategic Venture Investing. Journal of Financial Economics 64: 285-314.
Hellmann, T., and M. Puri. 2002. Venture Capital and the Professionalization of Start-up Firms: Empirical Evidence. Journal of Finance 57: 169-1973
Hirshleifer, D., A. Low, and S. H. Teoh. 2012. Are Overconfident CEOs Better Innovators?. Journal of Finance 67: 1457-1498.
Hirshleifer, D. and A. Thakor. 1992. Managerial Conservatism, Project Choice, and Debt. Review of Financial Studies 5: 437-470.
Holmstrom, B. 1989. Agency Costs and Innovation. Journal of Economic Behavior and Organization 12: 305-327.
Ivanov, V., and F. Xie. 2010. Do Corporate Venture Capitalists Add Value to Start-up Firms? Evidence from IPOs and Acquisitions of VC-Backed Companies. Financial Management 39: 129-152.
Kogan, L., D. Papanikalaou, A. Seru, and N. Stoffman. 2012. Technological Innovation and Growth. Working Paper, MIT.
Kortum, S., and J. Lerner. 2000. Assessing Contribution of Venture Capital to Innovation. RAND Journal of Economics 31: 674-692.
Lerner, J. 2012. The Architecture of Innovation: The Economics of Creative Organizations. Harvard Business Review Press, Cambridge.
Lerner, J., M. Sorensen, and P. Stromberg. 2011. Private Equity and Long-run Investment: The Case of Innovation. Journal of Finance 66: 445-477.
Lindsey, L. 2008. Blurring Firm Boundaries: The Role of Venture Capital in Strategic Alliances. Journal of Finance 63: 1137-1168.
MacMillan, I., E. Roberts, V. Livada and A. Wang. 2008. Corporate Venture Capital (CVC) Seeking Innovation and Strategic Growth: Recent patterns in CVC mission, structure, and investment.” National Institute of Standards and Technology, U.S. Department of Commerce.
Manso, G. 2011. Motivating Innovation. Journal of Finance 66: 1823-1860. Masulis, R., and R. Nahata. 2009. Financial Contracting with Strategic Investors: Evidence from
Corporate Venture Capital Backed IPOs. Journal of Financial Intermediation 18: 599-631. Rajan, R.; H. Servaes and L. Zingales. 2000. The Cost of Diversity: The Diversification Discount and
Inefficient Investment. Journal of Finance 55: 35-80.
37
Robinson, David. 2008. Strategic Alliances and the Boundaries of the Firm. Review of Financial Studies 21: 649-681.
Rosenbaum, P. and D. Rubin. 1983. The Central Role of the Propensity Score in Observational Studies for Causal Effects. Biometrika 70: 41-55.
Scharfstein, D. and J. Stein. 2000. The Dark Side of Internal Capital Markets: Divisional Rent-Seeking and Inefficient Investment. Journal of Finance 55: 2537-2564.
Seru, A. 2012. Firm Boundaries Matters: Evidence from Conglomerates and R&D Activity. Journal of Financial Economics, forthcoming.
Solow, R. 1957. Technological Change and the Aggregate Production Function. Review of Economics and Statistics 39: 312-320.
Spiegel, M., and H. Tookes. 2008. Dynamic Competition, Innovation and Strategic Financing. Working Paper, Yale University.
Smith, J. and P. Todd. 2005. Does Matching Overcome LaLonde’s Critique of Nonexperimental Estimators? Journal of Econometrics 125, 305-353.
Tian, X., and T. Wang. 2013. Tolerance for Failure and Corporate Innovation. Review of Financial Studies, forthcoming.
Williams O. 1985. The Economic Institutions of Capitalism. The Free Press, London.
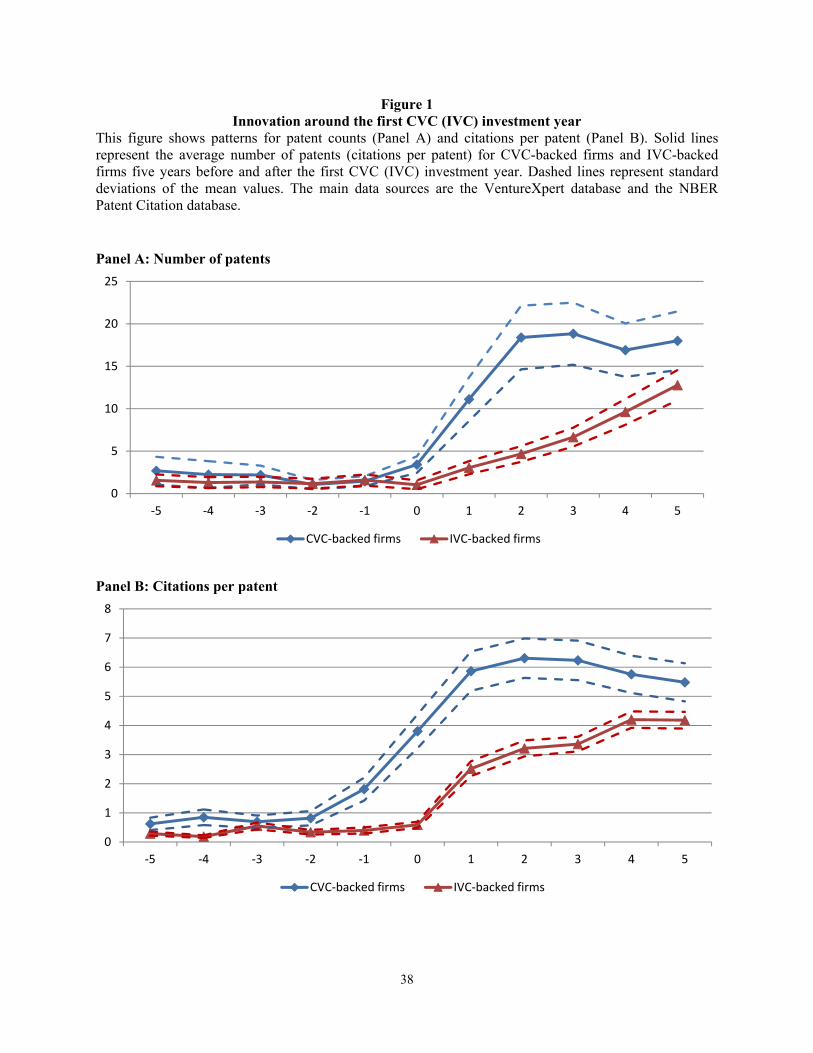
38
Figure 1 Innovation around the first CVC (IVC) investment year
This figure shows patterns for patent counts (Panel A) and citations per patent (Panel B). Solid lines represent the average number of patents (citations per patent) for CVC-backed firms and IVC-backed firms five years before and after the first CVC (IVC) investment year. Dashed lines represent standard deviations of the mean values. The main data sources are the VentureXpert database and the NBER Patent Citation database. Panel A: Number of patents
Panel B: Citations per patent
0
5
10
15
20
25
Ͳ5 Ͳ4 Ͳ3 Ͳ2 Ͳ1 0 1 2 3 4 5
CVCͲbacked�firms IVCͲbacked�firms
0
1
2
3
4
5
6
7
8
Ͳ5 Ͳ4 Ͳ3 Ͳ2 Ͳ1 0 1 2 3 4 5
CVCͲbacked�firms IVCͲbacked�firms

39
Table 1 Summary statistics
This table reports the descriptive statistics for the sample of individual investments by CVCs and IVCs from 1980 to 2004. Panel A presents the summary statistics for firms’ innovation output. The observation unit in Panel A is IPO firm-year. Panel B presents the summary statistics for other control variables. The unit of observation in Panel B is IPO firm. The main data sources are the Thomson VentureXpert database, the NBER Patent Citation database, and Compustat. Panel A: IPO firm’s innovation productivity (observation unit: IPO firm-year) Mean S. D. N Patents: Full Sample 2.48 14.45 9,425 Patents : CVC-Backed Firms 4.02 18.49 3,314 Patents : IVC-Backed Firms 1.64 11.61 6,111 Citations/Patent: Full Sample 2.28 9.30 9,425 Citations/Patent: CVC-Backed Firms 3.20 10.97 3,314 Citations/Patent: IVC-Backed Firms 1.78 8.21 6,111
Panel B: Control variables (observation unit: IPO firm)
Mean S.D. P25 Median P75 N Assets (Million) 110.06 240.75 16.25 54.03 101.93 1,859 ROA -0.01 0.27 -0.16 0.07 0.16 1,859 R&D in Total Assets 0.10 0.13 0.00 0.07 0.14 1,859 PPE in Total Assets 0.23 0.25 0.08 0.15 0.29 1,859 Leverage 0.10 0.18 0.01 0.02 0.12 1,859 CE in Total Assets 0.08 0.09 0.02 0.05 0.09 1,859 HHI of Industry Sales 0.25 0.33 0.02 0.11 0.37 1,859 Tobin’s Q 4.28 6.51 1.85 2.77 4.30 1,859 KZ Index -20.95 49.70 -18.83 -6.37 -0.62 1,859
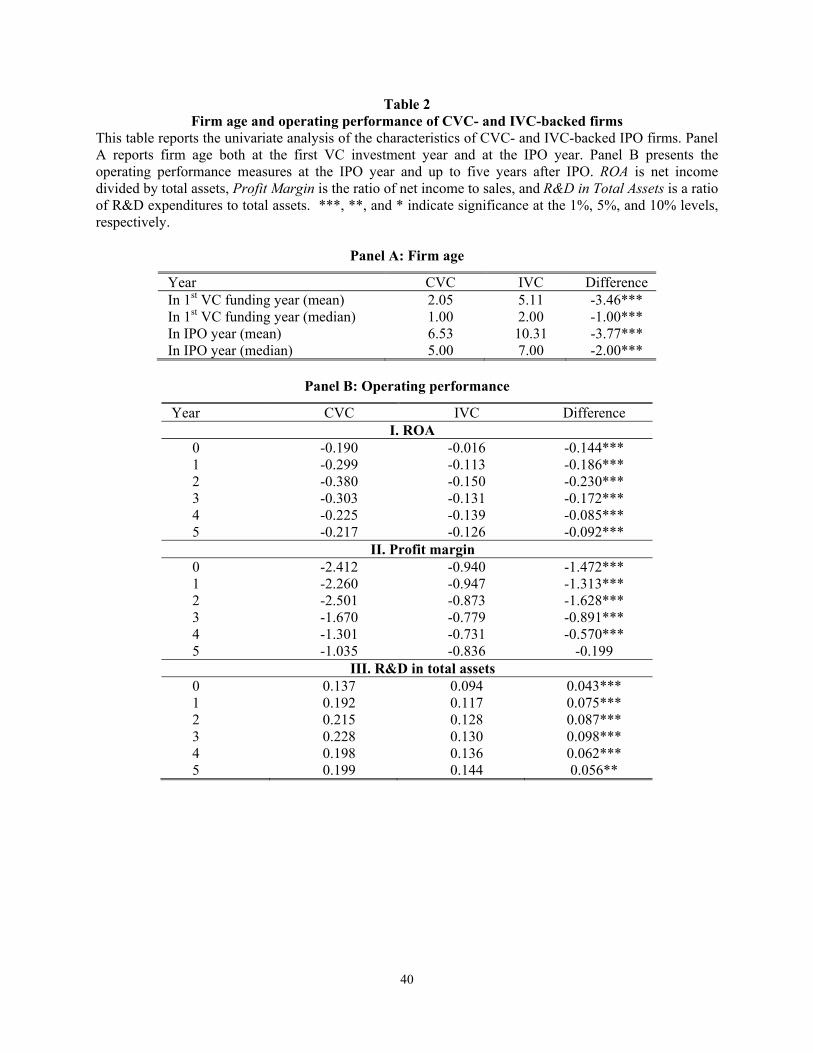
40
Table 2 Firm age and operating performance of CVC- and IVC-backed firms
This table reports the univariate analysis of the characteristics of CVC- and IVC-backed IPO firms. Panel A reports firm age both at the first VC investment year and at the IPO year. Panel B presents the operating performance measures at the IPO year and up to five years after IPO. ROA is net income divided by total assets, Profit Margin is the ratio of net income to sales, and R&D in Total Assets is a ratio of R&D expenditures to total assets. ***, **, and * indicate significance at the 1%, 5%, and 10% levels, respectively.
Panel A: Firm age
Year CVC IVC Difference In 1st VC funding year (mean) 2.05 5.11 -3.46*** In 1st VC funding year (median) 1.00 2.00 -1.00*** In IPO year (mean) 6.53 10.31 -3.77*** In IPO year (median) 5.00 7.00 -2.00***
Panel B: Operating performance
Year CVC IVC Difference I. ROA
0 -0.190 -0.016 -0.144*** 1 -0.299 -0.113 -0.186*** 2 -0.380 -0.150 -0.230*** 3 -0.303 -0.131 -0.172*** 4 -0.225 -0.139 -0.085*** 5 -0.217 -0.126 -0.092***
II. Profit margin 0 -2.412 -0.940 -1.472*** 1 -2.260 -0.947 -1.313*** 2 -2.501 -0.873 -1.628*** 3 -1.670 -0.779 -0.891*** 4 -1.301 -0.731 -0.570*** 5 -1.035 -0.836 -0.199
III. R&D in total assets 0 0.137 0.094 0.043*** 1 0.192 0.117 0.075*** 2 0.215 0.128 0.087*** 3 0.228 0.130 0.098*** 4 0.198 0.136 0.062*** 5 0.199 0.144 0.056**

41
Table 3 Pre-IPO innovation productivity of CVC- and IVC-backed IPO firms
This table reports the results of pre-IPO innovation analysis. The dependent variable is the natural logarithm of the total number of patents generated three years prior to the IPO in Panel A and the natural logarithm of the number of citations per patent for the patents generated three years prior to the IPO in Panel B. The main variables of interest are CVC backing dummy, the number of CVCs, and CVC share in the total VC investment. The set of control variables includes the natural logarithm of firm assets, return on assets, R&D scaled by firm assets, PPE scaled by firm assets, firm leverage, capital expenditure scaled by firm assets, the HHI of industry sales index, the HHI squared, Tobin’s Q, the KZ index, and the natural logarithm of firm age at the IPO year. The unit of observation is IPO firm. Robust t-statistics are reported in parentheses. ***, **, and * indicate significance at 1%, 5%, and 10% levels, respectively. Panel A: Ln(patents) Panel B: Ln(citations/patent) (1) (2) (3) (4) (5) (6) CVC Backing Dummy 0.269*** 0.176** (3.02) (2.21) Number of CVCs 0.159*** 0.066* (2.91) (1.75) CVC Share 0.618** 0.471** (2.17) (2.09)
Ln(Total Assets) 0.201*** 0.192*** 0.212*** 0.060* 0.060* 0.067** (4.72) (4.59) (5.04) (1.82) (1.83) (2.03) ROA 0.061 0.085 0.015 -0.055 -0.068 -0.080 (0.34) (0.47) (0.08) (0.38) (0.47) (0.55) R&D in Total Assets 1.564*** 1.569*** 1.577*** 0.348 0.346 0.359 (2.78) (2.78) (2.76) (1.12) (1.11) (1.14) PPE in Total Assets -0.136 -0.153 -0.129 -0.148 -0.151 -0.143 (1.03) (1.15) (0.97) (1.24) (1.26) (1.20) Leverage -0.286 -0.249 -0.325 -0.394** -0.397** -0.415** (1.18) (1.03) (1.33) (2.33) (2.34) (2.46) CE in Total Assets 0.044 0.058 0.033 0.361 0.369 0.352 (0.14) (0.18) (0.10) (1.18) (1.21) (1.15) HHI -0.261 -0.254 -0.315 -0.168 -0.176 -0.205 (0.80) (0.78) (0.96) (0.54) (0.57) (0.66) HHI2 0.165 0.158 0.204 0.007 0.009 0.036 (0.53) (0.51) (0.65) (0.03) (0.03) (0.13) Tobin’s Q 0.016** 0.016** 0.016** 0.014* 0.014* 0.014* (2.08) (2.08) (2.04) (1.88) (1.93) (1.87) KZ Index -0.004 -0.004 -0.003 0.004 0.004 0.004 (0.39) (0.44) (0.34) (0.52) (0.51) (0.57) Ln(Age at IPO) -0.021 -0.020 -0.022 0.011 0.010 0.011 (0.56) (0.53) (0.58) (0.31) (0.29) (0.24) Year fixed effects Yes Yes Yes Yes Yes Yes Industry fixed effects Yes Yes Yes Yes Yes Yes Observations 1,834 1,834 1,834 1,834 1,834 1,834 R2 0.26 0.26 0.25 0.16 0.16 0.16
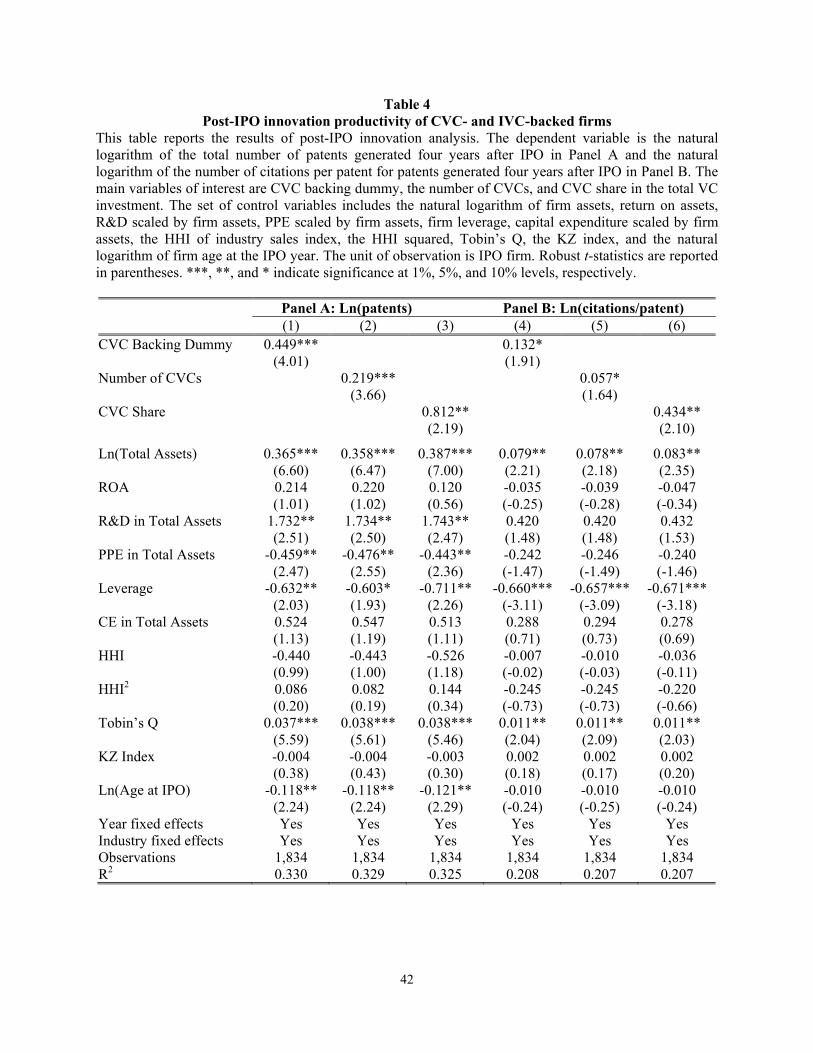
42
Table 4 Post-IPO innovation productivity of CVC- and IVC-backed firms
This table reports the results of post-IPO innovation analysis. The dependent variable is the natural logarithm of the total number of patents generated four years after IPO in Panel A and the natural logarithm of the number of citations per patent for patents generated four years after IPO in Panel B. The main variables of interest are CVC backing dummy, the number of CVCs, and CVC share in the total VC investment. The set of control variables includes the natural logarithm of firm assets, return on assets, R&D scaled by firm assets, PPE scaled by firm assets, firm leverage, capital expenditure scaled by firm assets, the HHI of industry sales index, the HHI squared, Tobin’s Q, the KZ index, and the natural logarithm of firm age at the IPO year. The unit of observation is IPO firm. Robust t-statistics are reported in parentheses. ***, **, and * indicate significance at 1%, 5%, and 10% levels, respectively. Panel A: Ln(patents) Panel B: Ln(citations/patent) (1) (2) (3) (4) (5) (6) CVC Backing Dummy 0.449*** 0.132* (4.01) (1.91) Number of CVCs 0.219*** 0.057* (3.66) (1.64) CVC Share 0.812** 0.434** (2.19) (2.10)
Ln(Total Assets) 0.365*** 0.358*** 0.387*** 0.079** 0.078** 0.083** (6.60) (6.47) (7.00) (2.21) (2.18) (2.35) ROA 0.214 0.220 0.120 -0.035 -0.039 -0.047 (1.01) (1.02) (0.56) (-0.25) (-0.28) (-0.34) R&D in Total Assets 1.732** 1.734** 1.743** 0.420 0.420 0.432 (2.51) (2.50) (2.47) (1.48) (1.48) (1.53) PPE in Total Assets -0.459** -0.476** -0.443** -0.242 -0.246 -0.240 (2.47) (2.55) (2.36) (-1.47) (-1.49) (-1.46) Leverage -0.632** -0.603* -0.711** -0.660*** -0.657*** -0.671*** (2.03) (1.93) (2.26) (-3.11) (-3.09) (-3.18) CE in Total Assets 0.524 0.547 0.513 0.288 0.294 0.278 (1.13) (1.19) (1.11) (0.71) (0.73) (0.69) HHI -0.440 -0.443 -0.526 -0.007 -0.010 -0.036 (0.99) (1.00) (1.18) (-0.02) (-0.03) (-0.11) HHI2 0.086 0.082 0.144 -0.245 -0.245 -0.220 (0.20) (0.19) (0.34) (-0.73) (-0.73) (-0.66) Tobin’s Q 0.037*** 0.038*** 0.038*** 0.011** 0.011** 0.011** (5.59) (5.61) (5.46) (2.04) (2.09) (2.03) KZ Index -0.004 -0.004 -0.003 0.002 0.002 0.002 (0.38) (0.43) (0.30) (0.18) (0.17) (0.20) Ln(Age at IPO) -0.118** -0.118** -0.121** -0.010 -0.010 -0.010 (2.24) (2.24) (2.29) (-0.24) (-0.25) (-0.24) Year fixed effects Yes Yes Yes Yes Yes Yes Industry fixed effects Yes Yes Yes Yes Yes Yes Observations 1,834 1,834 1,834 1,834 1,834 1,834 R2 0.330 0.329 0.325 0.208 0.207 0.207
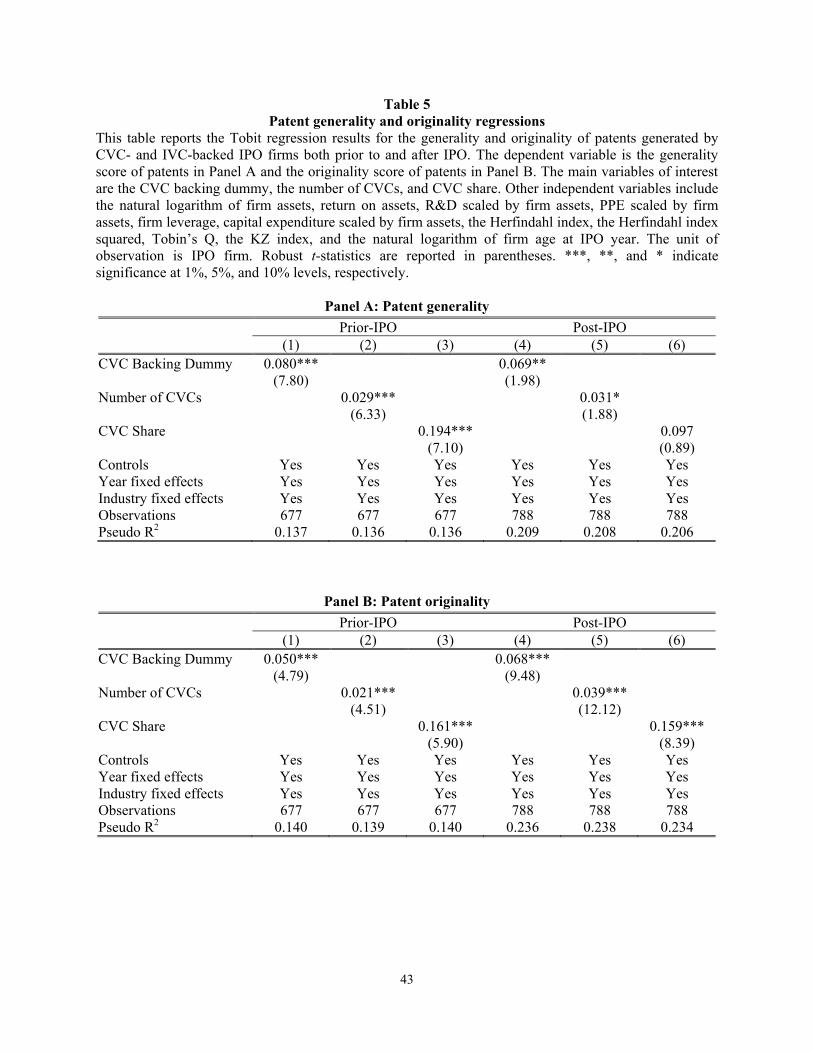
43
Table 5 Patent generality and originality regressions
This table reports the Tobit regression results for the generality and originality of patents generated by CVC- and IVC-backed IPO firms both prior to and after IPO. The dependent variable is the generality score of patents in Panel A and the originality score of patents in Panel B. The main variables of interest are the CVC backing dummy, the number of CVCs, and CVC share. Other independent variables include the natural logarithm of firm assets, return on assets, R&D scaled by firm assets, PPE scaled by firm assets, firm leverage, capital expenditure scaled by firm assets, the Herfindahl index, the Herfindahl index squared, Tobin’s Q, the KZ index, and the natural logarithm of firm age at IPO year. The unit of observation is IPO firm. Robust t-statistics are reported in parentheses. ***, **, and * indicate significance at 1%, 5%, and 10% levels, respectively.
Panel A: Patent generality Prior-IPO Post-IPO (1) (2) (3) (4) (5) (6) CVC Backing Dummy 0.080*** 0.069** (7.80) (1.98) Number of CVCs 0.029*** 0.031* (6.33) (1.88) CVC Share 0.194*** 0.097 (7.10) (0.89) Controls Yes Yes Yes Yes Yes Yes Year fixed effects Yes Yes Yes Yes Yes Yes Industry fixed effects Yes Yes Yes Yes Yes Yes Observations 677 677 677 788 788 788 Pseudo R2 0.137 0.136 0.136 0.209 0.208 0.206
Panel B: Patent originality Prior-IPO Post-IPO (1) (2) (3) (4) (5) (6) CVC Backing Dummy 0.050*** 0.068*** (4.79) (9.48) Number of CVCs 0.021*** 0.039*** (4.51) (12.12) CVC Share 0.161*** 0.159*** (5.90) (8.39) Controls Yes Yes Yes Yes Yes Yes Year fixed effects Yes Yes Yes Yes Yes Yes Industry fixed effects Yes Yes Yes Yes Yes Yes Observations 677 677 677 788 788 788 Pseudo R2 0.140 0.139 0.140 0.236 0.238 0.234
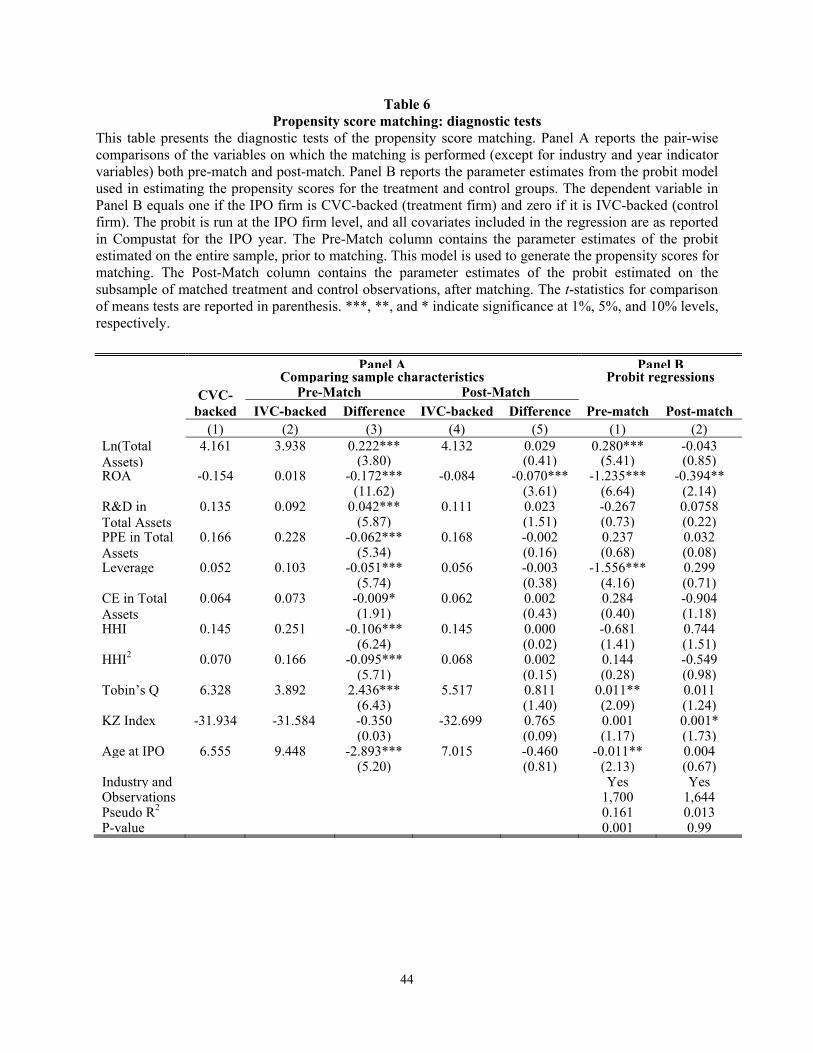
44
Table 6 Propensity score matching: diagnostic tests
This table presents the diagnostic tests of the propensity score matching. Panel A reports the pair-wise comparisons of the variables on which the matching is performed (except for industry and year indicator variables) both pre-match and post-match. Panel B reports the parameter estimates from the probit model used in estimating the propensity scores for the treatment and control groups. The dependent variable in Panel B equals one if the IPO firm is CVC-backed (treatment firm) and zero if it is IVC-backed (control firm). The probit is run at the IPO firm level, and all covariates included in the regression are as reported in Compustat for the IPO year. The Pre-Match column contains the parameter estimates of the probit estimated on the entire sample, prior to matching. This model is used to generate the propensity scores for matching. The Post-Match column contains the parameter estimates of the probit estimated on the subsample of matched treatment and control observations, after matching. The t-statistics for comparison of means tests are reported in parenthesis. ***, **, and * indicate significance at 1%, 5%, and 10% levels, respectively.
Panel A Panel B
Comparing sample characteristics Probit regressionsCVC-
backed Pre-Match Post-Match
Pre-match Post-match IVC-backed Difference IVC-backed Difference (1) (2) (3) (4) (5) (1) (2)
Ln(Total Assets)
4.161 3.938 0.222*** 4.132 0.029 0.280*** -0.043 (3.80) (0.41) (5.41) (0.85)
ROA -0.154 0.018 -0.172*** -0.084 -0.070*** -1.235*** -0.394** (11.62) (3.61) (6.64) (2.14)R&D in Total Assets
0.135 0.092 0.042*** 0.111 0.023 -0.267 0.0758 (5.87) (1.51) (0.73) (0.22)
PPE in Total Assets
0.166 0.228 -0.062*** 0.168 -0.002 0.237 0.032 (5.34) (0.16) (0.68) (0.08)
Leverage 0.052 0.103 -0.051*** 0.056 -0.003 -1.556*** 0.299 (5.74) (0.38) (4.16) (0.71)CE in Total Assets
0.064 0.073 -0.009* 0.062 0.002 0.284 -0.904 (1.91) (0.43) (0.40) (1.18)
HHI 0.145 0.251 -0.106*** 0.145 0.000 -0.681 0.744 (6.24) (0.02) (1.41) (1.51)HHI2 0.070 0.166 -0.095*** 0.068 0.002 0.144 -0.549 (5.71) (0.15) (0.28) (0.98)Tobin’s Q 6.328 3.892 2.436*** 5.517 0.811 0.011** 0.011 (6.43) (1.40) (2.09) (1.24)KZ Index -31.934 -31.584 -0.350 -32.699 0.765 0.001 0.001* (0.03) (0.09) (1.17) (1.73)Age at IPO 6.555 9.448 -2.893*** 7.015 -0.460 -0.011** 0.004 (5.20) (0.81) (2.13) (0.67)Industry and Yes YesObservations 1,700 1,644Pseudo R2 0.161 0.013P-value 0.001 0.99
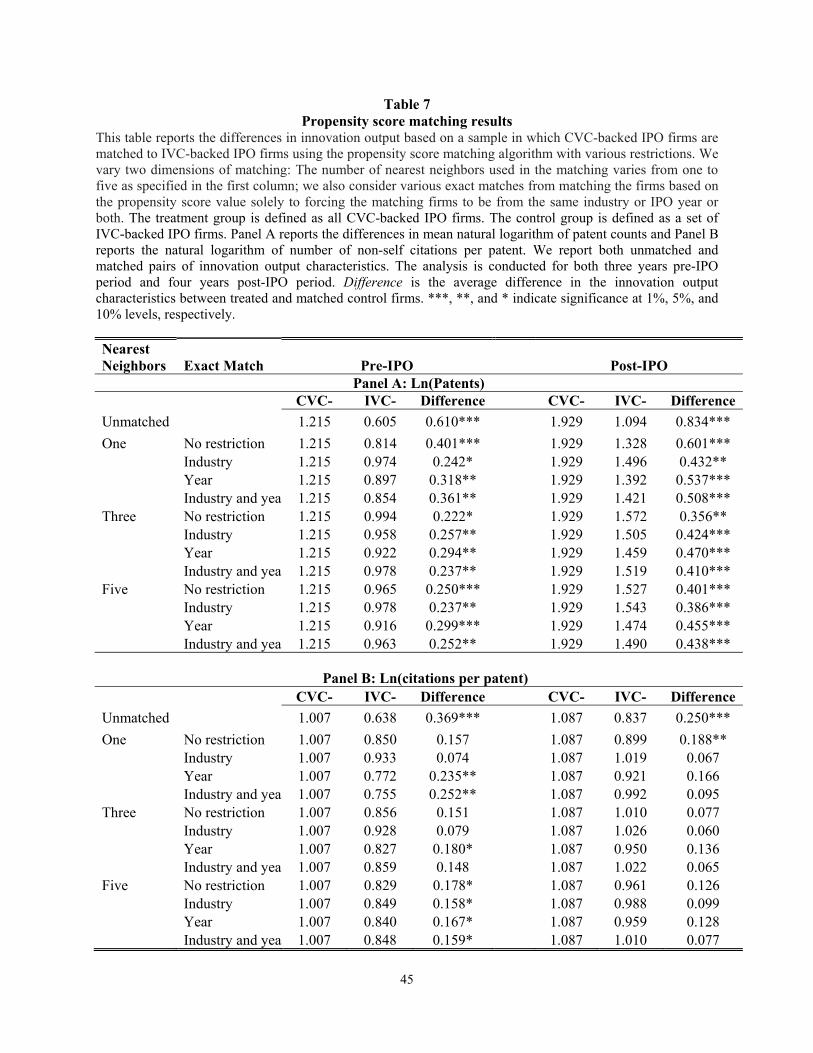
45
Table 7 Propensity score matching results
This table reports the differences in innovation output based on a sample in which CVC-backed IPO firms are matched to IVC-backed IPO firms using the propensity score matching algorithm with various restrictions. We vary two dimensions of matching: The number of nearest neighbors used in the matching varies from one to five as specified in the first column; we also consider various exact matches from matching the firms based on the propensity score value solely to forcing the matching firms to be from the same industry or IPO year or both. The treatment group is defined as all CVC-backed IPO firms. The control group is defined as a set of IVC-backed IPO firms. Panel A reports the differences in mean natural logarithm of patent counts and Panel B reports the natural logarithm of number of non-self citations per patent. We report both unmatched and matched pairs of innovation output characteristics. The analysis is conducted for both three years pre-IPO period and four years post-IPO period. Difference is the average difference in the innovation output characteristics between treated and matched control firms. ***, **, and * indicate significance at 1%, 5%, and 10% levels, respectively. Nearest Neighbors Exact Match Pre-IPO Post-IPO
Panel A: Ln(Patents) CVC- IVC- Difference CVC- IVC- Difference
Unmatched 1.215 0.605 0.610*** 1.929 1.094 0.834*** One No restriction 1.215 0.814 0.401*** 1.929 1.328 0.601***
Industry 1.215 0.974 0.242* 1.929 1.496 0.432** Year 1.215 0.897 0.318** 1.929 1.392 0.537*** Industry and year 1.215 0.854 0.361** 1.929 1.421 0.508***
Three No restriction 1.215 0.994 0.222* 1.929 1.572 0.356** Industry 1.215 0.958 0.257** 1.929 1.505 0.424*** Year 1.215 0.922 0.294** 1.929 1.459 0.470*** Industry and year 1.215 0.978 0.237** 1.929 1.519 0.410***
Five No restriction 1.215 0.965 0.250*** 1.929 1.527 0.401*** Industry 1.215 0.978 0.237** 1.929 1.543 0.386*** Year 1.215 0.916 0.299*** 1.929 1.474 0.455*** Industry and year 1.215 0.963 0.252** 1.929 1.490 0.438***
Panel B: Ln(citations per patent)
CVC- IVC- Difference CVC- IVC- DifferenceUnmatched 1.007 0.638 0.369*** 1.087 0.837 0.250*** One No restriction 1.007 0.850 0.157 1.087 0.899 0.188**
Industry 1.007 0.933 0.074 1.087 1.019 0.067 Year 1.007 0.772 0.235** 1.087 0.921 0.166 Industry and year 1.007 0.755 0.252** 1.087 0.992 0.095
Three No restriction 1.007 0.856 0.151 1.087 1.010 0.077 Industry 1.007 0.928 0.079 1.087 1.026 0.060 Year 1.007 0.827 0.180* 1.087 0.950 0.136 Industry and year 1.007 0.859 0.148 1.087 1.022 0.065
Five No restriction 1.007 0.829 0.178* 1.087 0.961 0.126 Industry 1.007 0.849 0.158* 1.087 0.988 0.099 Year 1.007 0.840 0.167* 1.087 0.959 0.128
Industry and year 1.007 0.848 0.159* 1.087 1.010 0.077
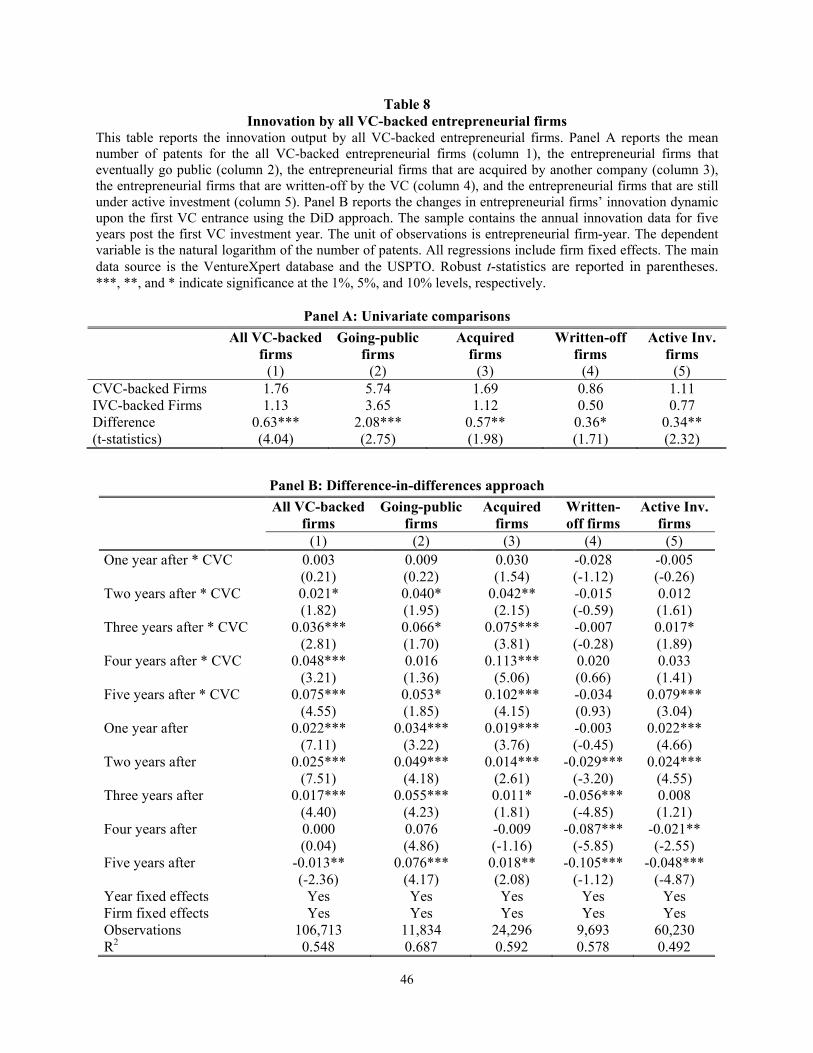
46
Table 8 Innovation by all VC-backed entrepreneurial firms
This table reports the innovation output by all VC-backed entrepreneurial firms. Panel A reports the mean number of patents for the all VC-backed entrepreneurial firms (column 1), the entrepreneurial firms that eventually go public (column 2), the entrepreneurial firms that are acquired by another company (column 3), the entrepreneurial firms that are written-off by the VC (column 4), and the entrepreneurial firms that are still under active investment (column 5). Panel B reports the changes in entrepreneurial firms’ innovation dynamic upon the first VC entrance using the DiD approach. The sample contains the annual innovation data for five years post the first VC investment year. The unit of observations is entrepreneurial firm-year. The dependent variable is the natural logarithm of the number of patents. All regressions include firm fixed effects. The main data source is the VentureXpert database and the USPTO. Robust t-statistics are reported in parentheses. ***, **, and * indicate significance at the 1%, 5%, and 10% levels, respectively.
Panel A: Univariate comparisons
All VC-backed firms
(1)
Going-public firms
(2)
Acquired firms
(3)
Written-off firms
(4)
Active Inv. firms
(5) CVC-backed Firms 1.76 5.74 1.69 0.86 1.11 IVC-backed Firms 1.13 3.65 1.12 0.50 0.77 Difference 0.63*** 2.08*** 0.57** 0.36* 0.34** (t-statistics) (4.04) (2.75) (1.98) (1.71) (2.32)
Panel B: Difference-in-differences approach All VC-backed
firms Going-public
firms Acquired
firms Written-off firms
Active Inv. firms
(1) (2) (3) (4) (5) One year after * CVC 0.003 0.009 0.030 -0.028 -0.005 (0.21) (0.22) (1.54) (-1.12) (-0.26) Two years after * CVC 0.021* 0.040* 0.042** -0.015 0.012 (1.82) (1.95) (2.15) (-0.59) (1.61) Three years after * CVC 0.036*** 0.066* 0.075*** -0.007 0.017* (2.81) (1.70) (3.81) (-0.28) (1.89) Four years after * CVC 0.048*** 0.016 0.113*** 0.020 0.033 (3.21) (1.36) (5.06) (0.66) (1.41) Five years after * CVC 0.075*** 0.053* 0.102*** -0.034 0.079*** (4.55) (1.85) (4.15) (0.93) (3.04) One year after 0.022*** 0.034*** 0.019*** -0.003 0.022*** (7.11) (3.22) (3.76) (-0.45) (4.66) Two years after 0.025*** 0.049*** 0.014*** -0.029*** 0.024*** (7.51) (4.18) (2.61) (-3.20) (4.55) Three years after 0.017*** 0.055*** 0.011* -0.056*** 0.008 (4.40) (4.23) (1.81) (-4.85) (1.21) Four years after 0.000 0.076 -0.009 -0.087*** -0.021** (0.04) (4.86) (-1.16) (-5.85) (-2.55) Five years after -0.013** 0.076*** 0.018** -0.105*** -0.048***
(-2.36) (4.17) (2.08) (-1.12) (-4.87) Year fixed effects Yes Yes Yes Yes Yes Firm fixed effects Yes Yes Yes Yes Yes Observations 106,713 11,834 24,296 9,693 60,230 R2 0.548 0.687 0.592 0.578 0.492
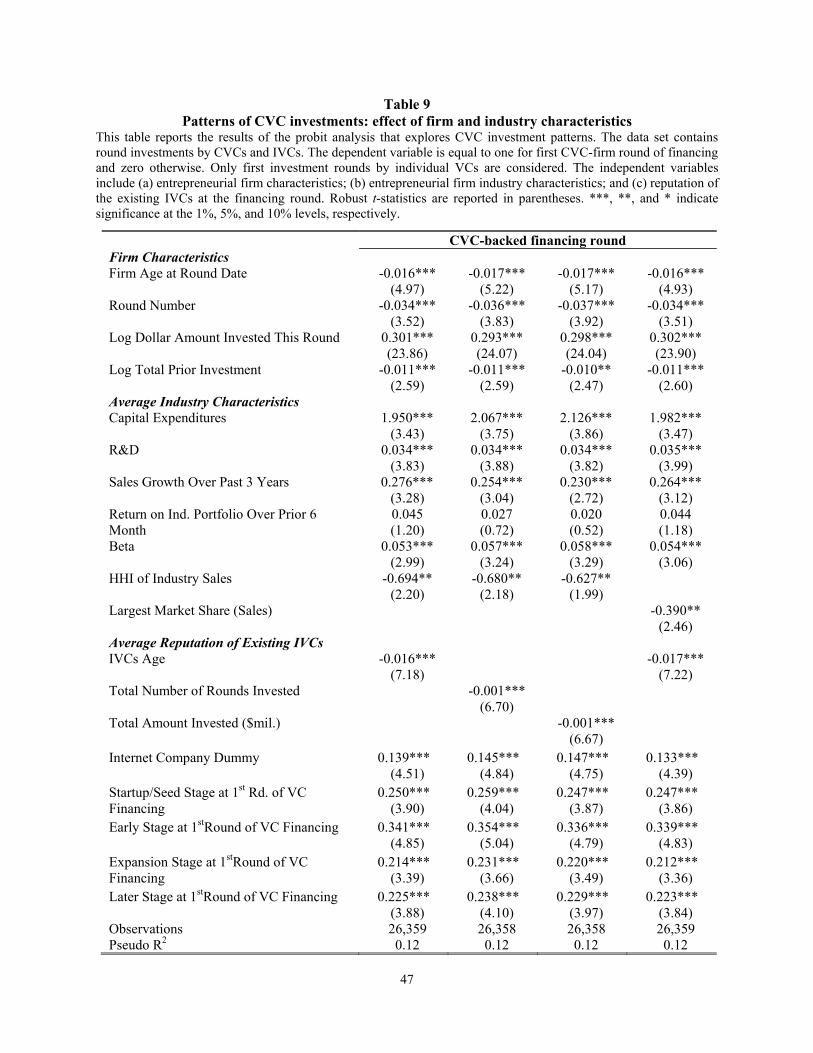
47
Table 9 Patterns of CVC investments: effect of firm and industry characteristics
This table reports the results of the probit analysis that explores CVC investment patterns. The data set contains round investments by CVCs and IVCs. The dependent variable is equal to one for first CVC-firm round of financing and zero otherwise. Only first investment rounds by individual VCs are considered. The independent variables include (a) entrepreneurial firm characteristics; (b) entrepreneurial firm industry characteristics; and (c) reputation of the existing IVCs at the financing round. Robust t-statistics are reported in parentheses. ***, **, and * indicate significance at the 1%, 5%, and 10% levels, respectively.
CVC-backed financing round Firm Characteristics Firm Age at Round Date -0.016*** -0.017*** -0.017*** -0.016***
(4.97) (5.22) (5.17) (4.93) Round Number -0.034*** -0.036*** -0.037*** -0.034***
(3.52) (3.83) (3.92) (3.51) Log Dollar Amount Invested This Round 0.301*** 0.293*** 0.298*** 0.302***
(23.86) (24.07) (24.04) (23.90) Log Total Prior Investment -0.011*** -0.011*** -0.010** -0.011***
(2.59) (2.59) (2.47) (2.60) Average Industry Characteristics Capital Expenditures 1.950*** 2.067*** 2.126*** 1.982***
(3.43) (3.75) (3.86) (3.47) R&D 0.034*** 0.034*** 0.034*** 0.035***
(3.83) (3.88) (3.82) (3.99) Sales Growth Over Past 3 Years 0.276*** 0.254*** 0.230*** 0.264***
(3.28) (3.04) (2.72) (3.12) Return on Ind. Portfolio Over Prior 6 Month
0.045 0.027 0.020 0.044 (1.20) (0.72) (0.52) (1.18)
Beta 0.053*** 0.057*** 0.058*** 0.054*** (2.99) (3.24) (3.29) (3.06)
HHI of Industry Sales -0.694** -0.680** -0.627** (2.20) (2.18) (1.99)
Largest Market Share (Sales) -0.390** (2.46)
Average Reputation of Existing IVCs IVCs Age -0.016*** -0.017***
(7.18) (7.22) Total Number of Rounds Invested -0.001***
(6.70) Total Amount Invested ($mil.) -0.001***
(6.67) Internet Company Dummy 0.139*** 0.145*** 0.147*** 0.133***
(4.51) (4.84) (4.75) (4.39) Startup/Seed Stage at 1st Rd. of VC Financing
0.250*** 0.259*** 0.247*** 0.247*** (3.90) (4.04) (3.87) (3.86)
Early Stage at 1stRound of VC Financing 0.341*** 0.354*** 0.336*** 0.339*** (4.85) (5.04) (4.79) (4.83)
Expansion Stage at 1stRound of VC Financing
0.214*** 0.231*** 0.220*** 0.212*** (3.39) (3.66) (3.49) (3.36)
Later Stage at 1stRound of VC Financing 0.225*** 0.238*** 0.229*** 0.223*** (3.88) (4.10) (3.97) (3.84)
Observations 26,359 26,358 26,358 26,359 Pseudo R2 0.12 0.12 0.12 0.12

48
Table 10 Mechanisms through which CVCs nurture innovation: technological fit
This table reports the analysis of the effect of technological fit between entrepreneurial firm and CVC’s corporate parent on the pre-IPO and post-IPO innovation output of the entrepreneurial firms. Panel A reports the results of the regression analysis in which the dependent variables are the natural logarithm of the total number of patents generated three years prior to IPO in column (1) and the natural logarithm of the total number of patents generated four years after IPO in column (2). The set of control variables is the same as those in Table 3. Robust t-statistics are reported in parentheses. Panel B presents the results of the DiD analysis that uses the propensity score matching methodology to match each CVC-backed IPO firm with three nearest neighbor IVC-backed IPO firms. ***, **, and * indicate significance at 1%, 5%, and 10% levels, respectively.
Panel A: Regression analysis Pre-IPO Ln(Patents)
(1) Post-IPO Ln(Patents)
(2) CVC w/ technological fit ȕ1 0.444*** 0.622*** (3.34) (3.83) CVC w/o technological fit ȕ2 0.147 0.310** (1.50) (2.48) Other Control Variables Yes Yes Year fixed effects Yes Yes Industry fixed effects Yes Yes F-statistics (ȕ1 = ȕ2) 4.00** 2.97* Observations 1,834 1,834 R2 0.269 0.337
Panel B: DiD analysis within propensity-score-matched pairs Pre-IPO Ln(Patents)
Exact Match Technological fit No Technological fit Treated
(1) Controls
(2) Difference
(3) Treated
(4) Controls
(5) Difference
(6) DiD (7)
Unmatched 1.336 0.605 0.730*** 1.124 0.605 0.518*** 0.212** (6.93) (5.24) (2.03) No restriction 1.336 1.098 0.238*** 1.124 1.014 0.109 0.128 (2.66) (1.49) (1.57) Industry 1.336 1.069 0.266*** 1.124 0.973 0.151* 0.116 (3.04) (1.83) (1.36) Year 1.336 0.974 0.362*** 1.124 0.982 0.142 0.220** (4.26) (1.61) (2.26) Industry and year 1.336 1.082 0.253*** 1.124 0.999 0.125* 0.129* (2.92) (1.82) (1.71)
Post-IPO Ln(Patents) Exact Match Technological fit No Technological fit
Treated Controls Difference Treated Controls Difference DiD Unmatched 2.139 1.094 1.044*** 1.768 1.094 0.674*** 0.370*** (6.93) (5.07) (2.61) No restriction 2.139 1.726 0.413** 1.768 1.555 0.213** 0.200 (2.10) (1.99) (1.26) Industry 2.139 1.597 0.542*** 1.768 1.535 0.234** 0.309** (2.85) (2.13) (1.99) Year 2.139 1.565 0.573*** 1.768 1.478 0.291** 0.283* (3.00) (2.53) (1.79) Industry and year 2.139 1.615 0.523*** 1.768 1.545 0.224** 0.300* (2.73) (2.08) (1.93)
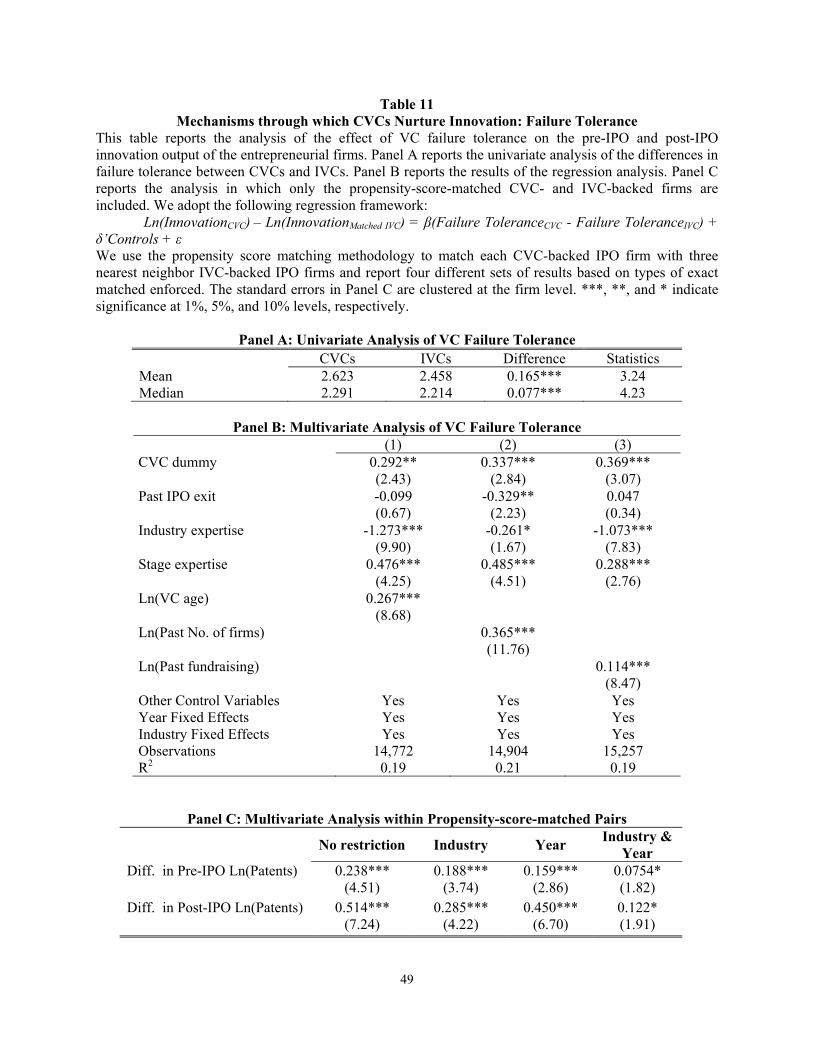
49
Table 11 Mechanisms through which CVCs Nurture Innovation: Failure Tolerance
This table reports the analysis of the effect of VC failure tolerance on the pre-IPO and post-IPO innovation output of the entrepreneurial firms. Panel A reports the univariate analysis of the differences in failure tolerance between CVCs and IVCs. Panel B reports the results of the regression analysis. Panel C reports the analysis in which only the propensity-score-matched CVC- and IVC-backed firms are included. We adopt the following regression framework:
Ln(InnovationCVC) – Ln(InnovationMatched IVC) = ȕ(Failure ToleranceCVC - Failure ToleranceIVC) + į’Controls + İ We use the propensity score matching methodology to match each CVC-backed IPO firm with three nearest neighbor IVC-backed IPO firms and report four different sets of results based on types of exact matched enforced. The standard errors in Panel C are clustered at the firm level. ***, **, and * indicate significance at 1%, 5%, and 10% levels, respectively.
Panel A: Univariate Analysis of VC Failure Tolerance CVCs IVCs Difference Statistics Mean 2.623 2.458 0.165*** 3.24 Median 2.291 2.214 0.077*** 4.23
Panel B: Multivariate Analysis of VC Failure Tolerance
(1) (2) (3) CVC dummy 0.292** 0.337*** 0.369*** (2.43) (2.84) (3.07) Past IPO exit -0.099 -0.329** 0.047 (0.67) (2.23) (0.34) Industry expertise -1.273*** -0.261* -1.073*** (9.90) (1.67) (7.83) Stage expertise 0.476*** 0.485*** 0.288*** (4.25) (4.51) (2.76) Ln(VC age) 0.267*** (8.68) Ln(Past No. of firms) 0.365*** (11.76) Ln(Past fundraising) 0.114*** (8.47) Other Control Variables Yes Yes Yes Year Fixed Effects Yes Yes Yes Industry Fixed Effects Yes Yes Yes Observations 14,772 14,904 15,257 R2 0.19 0.21 0.19
Panel C: Multivariate Analysis within Propensity-score-matched Pairs
No restriction Industry Year Industry & Year
Diff. in Pre-IPO Ln(Patents) 0.238*** 0.188*** 0.159*** 0.0754* (4.51) (3.74) (2.86) (1.82)
Diff. in Post-IPO Ln(Patents) 0.514*** 0.285*** 0.450*** 0.122* (7.24) (4.22) (6.70) (1.91)