Copyright
by
Tao Li
2004
The Dissertation Committee for Tao Li
Certifies that this is the approved version of the following dissertation:
OS-aware Architecture for Improving Microprocessor
Performance and Energy Efficiency
Committee:
Lizy K. John, Supervisor
Jacob A. Abraham
Douglas C. Burger
Tess J. Moon
Nur A. Touba

OS-aware Architecture for Improving Microprocessor
Performance and Energy Efficiency
by
Tao Li, B.S.E, M.S.E.
Dissertation
Presented to the Faculty of the Graduate School of
The University of Texas at Austin
in Partial Fulfillment
of the Requirements
for the Degree of
Doctor of Philosophy
The University of Texas at Austin
August 2004
Dedication
To my wife Lan
and
my parents

Acknowledgements
In my research, I have received assistance from many people.
First, I would like to thank my advisor, Dr. Lizy John for her support, advice,
guidance, and good wishes. Lizy has had a profound influence not only as my graduate
advisor in Austin, but also on my life. Her availability at all times including weekends,
dedication towards work and family, professional integrity, and pursuit of perfection
helped me become a better individual. Lizy has made it her responsibility to make sure
that I, as well as all of her other students, have had the financial support we need to
accomplish our goals. I am grateful to her for the freedom and flexibility she gave me
throughout my Ph. D. study.
My gratitude goes to the committee members (in alphabetical order), Dr. Jacob
Abraham, Dr. Doug Burger, Dr. Tess Moon, and Dr. Nur Touba, for their invaluable
comments, productive suggestions, and the time for reading the draft of my thesis.
Dr. Vijay Narayanan, and Dr. Anand Sivasubramaniam at Department of
Computer Science and Engineering, the Pennsylvania State University have contributed
several distinctive insights to my research.
I would like to thank the students (past and current) at the Laboratory for
Computer Architecture (LCA) – Ramesh Radhakrishnan , Deepu Talla, Ravi Bhargava,
Juan Rubio, Madhavi Valluri, Rob Bell, Yue Luo, Shiwen Hu, Byeong Kil Lee, Saket
v

Kumar, Sriram Sambamurthy, and Aashish Phansalkar. They have contributed to my
research by providing valuable comments on drafts of my paper submissions and useful
feedback at practice talks.
Rob Bell, a doctoral candidate in Computer Engineering, provided useful
suggestions and feedback on drafts of papers through many fruitful discussions.
Sudhanva Gurumurthi, a graduate student at Department of Computer Science
and Engineering, the Pennsylvania State University has helped me with the SoftWatt
tools.
Dr. Zhao Zhang (Iowa State University), Dr. Zhichun Zhu (University of Illinois
at Chicago), and Xiaodong Zhang (College of William & Mary) have helped me with
setting up a database workload used for this research.
During the course of my research, I have submitted several papers to peer-
reviewed conferences. The anonymous reviewers have provided valuable insights,
pointers to literature, and criticisms that I have used to make my research stronger.
Thanks to Linda, Shirley, Debi, Melanie, and other administrative assistants who
worked in Computer Engineering in the past years.
I would like to thank my parents, my parents-in-law, and friends who have had a
tremendous influence on my life.
Last, but not least, my wife Lan Luo, has endured the several years of my
graduate career with more cheer than I could have expected. She is my best friend and the
source of my strength. I am grateful to her consistent love, trust, inspiration, and support.
This is not something I could have accomplished alone.
TAO LI
The University of Texas at Austin
August 2004
vi

OS-aware Architecture for Improving Microprocessor
Performance and Energy Efficiency
Publication No._____________
Tao Li, Ph. D.
The University of Texas at Austin, 2004
Supervisor: Lizy John
The Operating System (OS) which manages both hardware and software
resources, constitutes a major component of today’s complex systems implemented with
high-end and general-purpose microprocessors, memory hierarchy and heterogeneous I/O
devices. Modern and emerging applications (e.g., database, web servers and file/e-mail
workloads) exercise the OS significantly. However, microprocessor designs and
(performance/power) optimizations have largely ignored the impact of OS. This
dissertation characterizes the OS activity in emerging applications execution and
demonstrates the necessity, advantages, and benefits of integrating OS component in
processor architecture design.
It is essential to understand the characteristics of today’s emerging workloads in
order to design efficient architectures for them. Given the facts that modern and emerging
applications involve system activities significantly, this research uses complete system
evaluation. These evaluations result in several system performance and power
optimizations targeting for emerging applications that have heavier OS activity.
vii

The OS dissipates a significant portion of total power in many modern application
executions. Therefore, modeling OS power is imperative for accurate software power
evaluation, as well as power management (e.g. dynamic thermal control and equal energy
scheduling). This research characterizes the power behavior of a modern, commercial OS
across a wide spectrum of applications to understand OS energy profiles and then
proposed various models to cost-effectively estimate its run-time energy dissipation.
To reduce software power, hardware can provide resources that closely match the
needs of the software. However, with exception-driven and intermittent execution in
nature, it becomes difficult to accurately predict and adapt processor resources in a timely
fashion for OS power savings without significant performance degradation. This
dissertation proposes a methodology that permits precise processor adaptations for the
operating system with low overhead.
Low power has been considered as an important issue in instruction cache (I-
cache) designs. This research goes beyond previous work to explore the opportunities to
design energy-efficient I-cache by exploiting the interactions of hardware-OS-
applications. This dissertation presents two techniques (OS-aware cache way lookup and
OS-aware cache set drowsy mode) to reduce the dynamic and the static power
consumption of I-cache. The proposed mechanisms require minimal hardware
modification and addition.
The OS component affects the control flow transfer in the execution environment
because the exception-driven, intermittent invocation of OS code significantly increases
the misprediction in both user and kernel code. This indicates that to improve
microprocessor performance, adapting branch prediction hardware for OS has become
very important now. This research proposes two OS-aware branch prediction techniques
to alleviate this destructive impact.
viii

Table of Contents
List of Tables ........................................................................................................ xii
List of Figures ...................................................................................................... xiii
Chapter 1: Introduction ...........................................................................................1 1.1 Processor Architecture Design: the New Challenges ...............................1
1.1.1 Emerging Applications .................................................................1 1.1.2 Power Dissipation .........................................................................2
1.2 Arena for Architecture Design and Optimization.....................................3 1.3 OS Cycle and Power Dissipation..............................................................4
1.3.1 Traditional and Technical Workloads...........................................4 1.3.2 Modern and Emerging Applications.............................................5
1.4 The Problems and Proposed Solutions .....................................................6 1.5 Thesis Statement .......................................................................................6 1.6 Contributions.............................................................................................7 1.7 Organization............................................................................................10
Chapter 2: Experimental Methodology.................................................................11 2.1 Framework ..............................................................................................11
2.1.1 SimOS.........................................................................................11 2.1.2 SoftWatt ......................................................................................12
2.2 Benchmarks.............................................................................................13 2.3 Simulated Microprocessor and System Configuration ...........................14
Chapter 3: Characterizing OS Activity: A Case Study of SPECjvm98................16 3.1 Motivation...............................................................................................16 3.2 Kernel Activity Of SPECjvm98..............................................................17 3.3 Cache and Memory Performance............................................................28 3.4 ILP Issues................................................................................................33 3.5 Summary .................................................................................................36
ix

Chapter 4: Run-time OS Power Estimation ..........................................................38 4.1 Software Power Estimation Techniques .................................................38
4.1.1 Instruction Level Power Modeling .............................................38 4.1.2 Characterization-based Macro-modeling....................................40 4.1.3 Performance Counter-based Run-time Power Estimation ..........41 4.1.4 Cycle-accurate Architectural Level Simulation..........................42
4.2 Challenges in OS Power Modeling.........................................................43 4.3 Routine Level OS Power Characterization .............................................44
4.3.1 Power Behavior of OS Routines .................................................45 4.3.2 Energy-Performance Correlation ................................................47
4.4 Routine Level OS Power Model .............................................................49 4.5 Run-time OS Power Modeling................................................................52 4.6 Summary .................................................................................................55
Chapter 5: OS Power Saving ................................................................................57 5.1 Program Phases and IPC Variance .........................................................57 5.2 Sampling based Adaptation: Challenges for OS.....................................60 5.3 The Proposed Solution: OS-aware Routine based Adaptation ...............65 5.4 Power Savings and Performance Evaluation ..........................................70 5.5 Related Work ..........................................................................................74 5.6 Summary .................................................................................................75
Chapter 6: OS-aware Low Power Instruction Cache............................................76 6.1 Motivation...............................................................................................76 6.2 User/OS I-Cache Accesses Characterization ..........................................78 6.3 OS-aware I-Cache Tuning ......................................................................83
6.3.1 OS-aware Cache Way Lookup....................................................83 6.3.2 OS-aware Cache Set Drowsy Mode ...........................................86
6.4 Power and Performance Evaluation........................................................93 6.5 Related Work ..........................................................................................95 6.6 Summary .................................................................................................97
x
Chapter 7: OS-aware Branch Prediction...............................................................99 7.1 Motivation...............................................................................................99 7.2 Characterizations of OS Branches ........................................................101
7.2.1 Context Switch Profile and Branch Distribution ......................102 7.2.2 OS Branch Execution Profile....................................................104 7.2.3 Characteristics of OS Branches ................................................106
7.2.3.1 Weakly Biased Branches ..............................................106 7.2.3.2 How Correlated are Kernel Branches? .........................108 7.2.3.3 Impact of Intermittent Kernel Execution ......................109 7.2.3.4 Characterization of User/OS Aliasing ..........................110
7.3 Alleviating Impact of User/OS Interference .........................................112 7.3.1 Split BHSR Predictor................................................................113 7.3.2 Split Predictor ...........................................................................113 7.3.3 Integrating with Other Predictors..............................................115
7.4 Performance Evaluation........................................................................120 7.5 Discussion .............................................................................................123 7.6 Related Work ........................................................................................125 7.7 Summary ...............................................................................................127
Chapter 8: Conclusions and Future Work...........................................................128 8.1 Conclusions...........................................................................................129 8.2 Future Work ..........................................................................................133
Appendices...........................................................................................................135
Bibliography ........................................................................................................139
Vita 148
xi

List of Tables
Table 2.1: Benchmarks.......................................................................................13
Table 2.2: System Configuration .......................................................................14
Table 3.1: Execution Time Percentages (with JIT compiler) ............................22
Table 3.2: OS Characterization of SPECjvm98 (JIT compiler, s1 dataset) .......24
Table 3.3: OS Characterization of SPECjvm98 (contd.) ...................................25
Table 3.4: OS Characterization of SPECjvm98 (JIT compiler, s100 dataset) ...26
Table 3.5: OS Characterization of SPECjvm98 (interpreter, s100 dataset).......27
Table 3.6: Memory Stall Time Percentages (with JIT compiler).......................28
Table 4.1: Hardware Counter Schemes..............................................................54
Table 5.1: OS IPC and Power ............................................................................59
Table 6.1: I-Cache Accesses Categorized by User/OS Residency ....................81
Table 6.2: % of I-Cache Accesses to Drowsy Sets and Average Number of
Reinstated Drowsy Sets ....................................................................90
Table 6.3: % of I-Cache Accesses to Drowsy Sets and Average Number of
Reinstated Drowsy Sets using Access-Based Classification ............93
Table 6.4: Normalized Leakage Power and Run-time Increase.........................95
Table 7.1: Complete System Branch Execution Statistics ...............................102
Table 7.2: OS Routine Branch Characterization..............................................106
Table 7.3: Characterization of Branch Aliasing...............................................111
Table 7.4: Characterization of Misprediction due to Branch Aliasing ............112
Table 7.5: A Comparison of Several Branch De-aliasing Schemes.................116
Table 7.6a: Misprediction Reduction by Introducing OS-aware Prediction......118
Table 7.6b: OS-aware Prediction: Breakdown of Misprediction Reduction .....119
xii
List of Figures
Figure 1.1: Software Technology Evolution: Emerging Applications..................2
Figure 1.2: Power Density of Intel Microprocessors [63].....................................3
Figure 1.3: Arena for Architecture Design and Optimization...............................4
Figure 1.4: OS Activities in Two Emerging Workloads .......................................5
Figure 1.5: OS Cycles and Power..........................................................................5
Figure 2.1: Simulation Flow Chart......................................................................12
Figure 3.1: Execution Profile of SPECjvm98 (JIT compiler, s1 dataset) ...........18
Figure 3.2: Execution Profile of SPECjvm98 (interpreter, s1 dataset) ...............19
Figure 3.3: Execution Profile of SPECjvm98 (JIT compiler, s100 dataset) .......20
Figure 3.4: Execution Profile of SPECjvm98 (interpreter, s100 dataset) ...........21
Figure 3.5: Impact of Cache Capacity and Line Size..........................................30
Figure 3.6: Memory Stall Time in Kernel and User............................................32
Figure 3.7: ILP Speedup (JIT).............................................................................34
Figure 3.8: IPC Breakdown for 4-issue and 8-issue Superscalar Processors ......35
Figure 4.1: Average and Standard Deviations of OS Routines Power................45
Figure 4.2: Routine Level Energy Distributions in OS .......................................47
Figure 4.3: Correlation between OS Routines Power and IPC ...........................48
Figure 4.4: Breakdown of Power Dissipation of OS Routines............................48
Figure 4.5: Model Estimation Accuracy (Routine Average Power) ...................50
Figure 4.6: Estimation Accuracy (IPC Correlated Routine Average Power)......51
Figure 4.7: Model Estimation Accuracy (OS Average Power)...........................51
Figure 4.8: OS Power Estimations (Single Power/IPC Correlation Model) .......52
Figure 4.9: A Comparison of Run-time Per-routine based Estimation Error......53
xiii
Figure 4.10: A Comparison of Different Hardware Counter Schemes .................55
Figure 5.1: IPC Variation in the SPECjvm98 Benchmark jess ...........................57
Figure 5.2: Sampling Window ............................................................................61
Figure 5.3: FMS used in Sampling based Adaptation.........................................61
Figure 5.4: Implications of Sampling Window Sizes..........................................63
Figure 5.5: Average Duration of OS Services.....................................................64
Figure 5.6: Accumulative OS Energy vs. OS Service Duration..........................65
Figure 5.7: Routine based OS-aware Adaptation ................................................66
Figure 5.8: Effectiveness of Energy×Delay Tradeoffs is Program Dependent ...67
Figure 5.9: Energy×Delay of Different OS Services...........................................68
Figure 5.10: Routine Based Energy×Delay Ranking of Different Modes ............69
Figure 5.11: The Baseline Microarchitecture........................................................71
Figure 5.12: Normalized Power ............................................................................72
Figure 5.13: Normalized IPC ................................................................................73
Figure 5.14: Normalized Energy×Delay ...............................................................73
Figure 6.1: I-Cache Power Breakdown: User vs. OS..........................................77
Figure 6.2: User/OS Instruction Blocks Residency.............................................79
Figure 6.3: User and OS I-Cache Accesses.........................................................82
Figure 6.4: Hardware Modification/Addition Required to Implement OS-aware
Cache Way Lookup...........................................................................84
Figure 6.5: I-Cache Way Accesses Reduction ....................................................86
Figure 6.6: Implementation of OS-aware Cache Set Drowsy Mode...................88
Figure 6.7: % of I-cache Sets can be put into Drowsy State by Using Leakage
Control Illustrated in Figure 6.6........................................................89
xiv

Figure 6.8: The 2-bit Counter and Finite State Machine to Implement User/OS
Access-biased Classification.............................................................91
Figure 6.9: % of I-cache Sets put into Drowsy State by using User/OS Access-
biased Classification .........................................................................92
Figure 6.10: % of I-Cache Dynamic Power Savings by Incorporating OS-aware
Cache Way Lookup...........................................................................94
Figure 7.1: Impact of User/OS Execution on Branch Prediction ......................100
Figure 7.2: Average Number of Executed Branches (User vs. Kernel) ............103
Figure 7.3: Executed Branches in User and OS Contexts .................................103
Figure 7.4: Where do the OS Dynamic Branches Come from? ........................104
Figure 7.5: User and OS Branch Directions......................................................107
Figure 7.6: Branch Correlation in OS Code ......................................................109
Figure 7.7: Impact of User/Kernel Inference ....................................................110
Figure 7.8: Gshare with Split BHSR .................................................................113
Figure 7.9: Split Gshare Predictor .....................................................................114
Figure 7.10: K-BHT Size Trade-off ....................................................................115
Figure 7.11: Integrating with Other Predictors....................................................117
Figure 7.12: IPC Improvement of OS-aware Predictors .....................................121
Figure 7.13: Impact of OS-aware Split BHSR Predictor ....................................123
Figure 7.14: Impact OS-aware Split Predictor ....................................................124
xv

Chapter 1: Introduction
Advances in VLSI technology enable architects to design more and more
powerful microprocessors and computer systems. However, emerging computer
applications and software technology evolutions constantly challenge hardware design.
Additionally, today’s high-complexity design has already raised many critical issues,
such as the increasingly constrained power budget.
The Operating System (OS) which manages both hardware and software
resources, constitutes a major component of today’s complex systems implemented with
high-end and general-purpose microprocessors, memory hierarchy and heterogeneous I/O
devices. Modern and emerging applications (e.g., database, web servers and file/e-mail
workloads) exercise the OS significantly. However, microprocessor designs and
(performance/power) optimizations have largely ignored the impacts of OS. This chapter
describes (1) the necessity for considering OS component in processor architecture
design, and (2) the objectives and contributions of this dissertation.
1.1 PROCESSOR ARCHITECTURE DESIGN: THE NEW CHALLENGES
Microprocessor performance has been drastically improved during past three
decades. Today’s high performance processors integrate millions of transistors and
operate at Giga Hertz frequency. Despite of the performance achievement, processor
architecture designs still face challenges.
1.1.1 Emerging Applications
Historically, microprocessor architecture designs have been largely driven by the
traditional and technical workloads, such as applications from the science and
engineering computation domains. As software technologies evolve, new computer
1

applications and programming paradigms (as shown in Figure 1.1) are constantly
emerging. Therefore, current and future generation of microprocessors have to handle a
wide range of applications.
Applications
File/e-mailServer
DatabaseInternet& Web
MultimediaJava .NET, C#
Bio-informatics
E-commerce
Networking
SecurityCommercial
GraphicsMulti-
threaded
Scientific Engineering
ApplicationsApplications
File/e-mailServer
DatabaseInternet& Web
MultimediaJava .NET, C#
Bio-informatics
E-commerce
Networking
SecurityCommercial
GraphicsMulti-
threaded
Scientific Engineering
Figure 1.1: Software Technology Evolution: Emerging Applications
1.1.2 Power Dissipation
The high-complexity microprocessor design driven by the quest for greater
performance has resulted in many critical issues, such as longer verification time, less
scalability etc. Among those, the increasingly constrained power budget has become a big
concern. Figure 1.2 shows the power trend of the mainstream processors from Intel. One
can see that when moving from one generation to the next, the microprocessor power
density increases exponentially. The microprocessor power budget impacts many issues,
such as the cost of cooling and packaging, circuit reliability, battery-life time and the
utility cost for operating sever farms and data center. Therefore, today’s and future
processor designs have to manage and minimize power dissipation.
2

Figure 1.2: Power Density of Intel Microprocessors [63]
1.2 ARENA FOR ARCHITECTURE DESIGN AND OPTIMIZATION
It has been well known that in order to deliver high performance and efficiency,
both hardware and software in a computing system need to be tightly collaborated.
Processor architecture design and optimization have been largely driven by the
application component. For instance, the SIMD extensions are designed to accelerate
multimedia applications execution. In the past, researchers have also found that compilers
can affect architecture design. For example, the explicit instruction and data parallelisms
identified by the compiler analysis can be packed and exposed to the VLIW architecture,
eliminating the hardware complexity for exploiting ILP at runtime. Recently, there has
been much research effort on characterizing the behavior of emerging applications (such
as database, OLTP, web/file/e-mail servers) and new programming paradigms (such as
Java, multithreading) to understand their impacts on the underlying hardware design.
Researchers have found that modern and emerging applications can behave differently
compared with the traditional and technical workloads: the execution of modern and
emerging workloads may involve heavier OS activities. This dissertation focuses on
3

understanding and exploiting the interactions between architecture and OS to achieve
higher performance and better energy efficient microprocessor design.
Architecture
Application
Architecture
Application Compiler
OSOS--aware Architectureaware Architecture
architecturecompiler
Architecture
Application
Architecture
Application
Architecture
Application Compiler
Architecture
Application Compiler
Architecture
Application Compiler
OSOS--aware Architectureaware Architecture
architecturecompiler
OSOS--aware Architectureaware ArchitectureOSOS--aware Architectureaware Architecture
architecturecompiler
architecturecompiler
OSOSOSOSapplicationapplicationapplicationapplication
Figure 1.3: Arena for Architecture Design and Optimization
1.3 OS CYCLE AND POWER DISSIPATION
To motivate the necessity of considering the OS component in architecture
design, this dissertation characterizes the OS activity during different program execution.
Using a cycle accurate full-system simulation environment, the total machine cycles can
be broken down into those spent on user application execution and those spent on the OS
execution. The user part can be further subdivided into the time spent on user instruction
execution and the time stalled on pipeline and memory accesses. The OS portion further
contains time spent on kernel synchronization.
1.3.1 Traditional and Technical Workloads
Technical workloads such as SPECInt95 are profiled. Overall, the SPECInt95
benchmarks spend less than 1% of their execution time in OS. The impacts of OS on the
traditional and technical workloads execution can be ignored due to its insignificance.
4
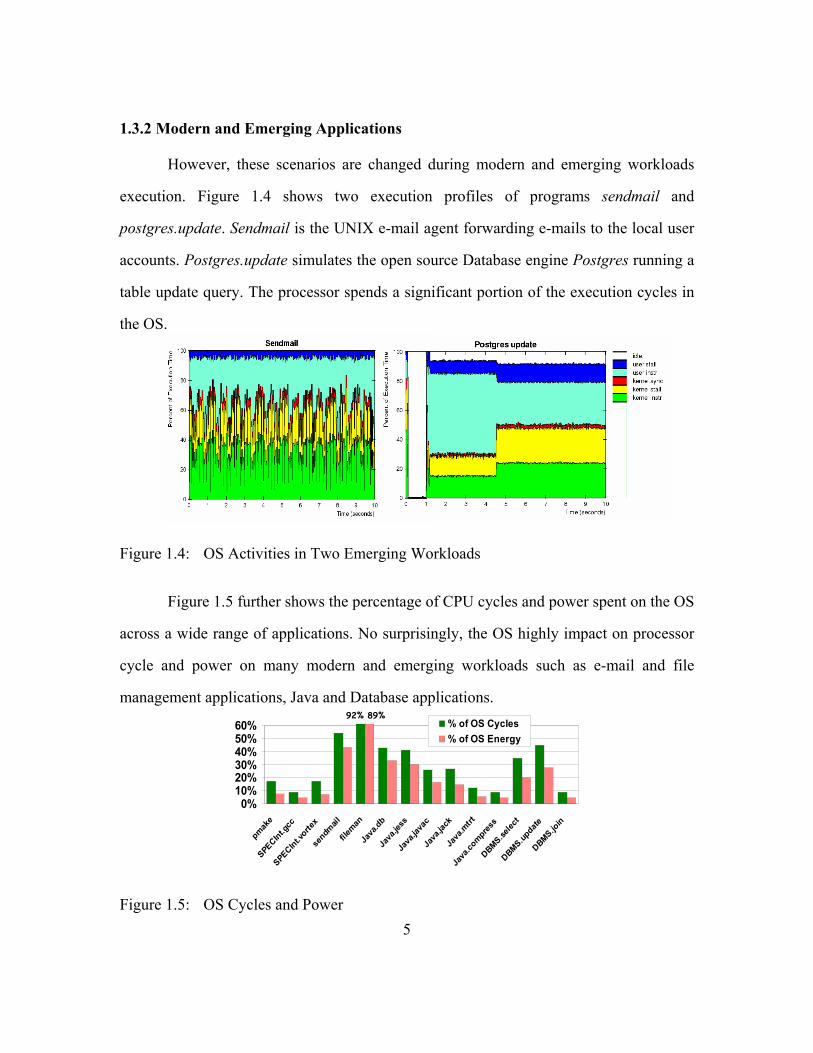
1.3.2 Modern and Emerging Applications
However, these scenarios are changed during modern and emerging workloads
execution. Figure 1.4 shows two execution profiles of programs sendmail and
postgres.update. Sendmail is the UNIX e-mail agent forwarding e-mails to the local user
accounts. Postgres.update simulates the open source Database engine Postgres running a
table update query. The processor spends a significant portion of the execution cycles in
the OS.
Figure 1.4: OS Activities in Two Emerging Workloads
Figure 1.5 further shows the percentage of CPU cycles and power spent on the OS
across a wide range of applications. No surprisingly, the OS highly impact on processor
cycle and power on many modern and emerging workloads such as e-mail and file
management applications, Java and Database applications.
0%10%20%30%40%50%60%
pmake
SPECInt.g
cc
SPECInt.vorte
x
sendm
ail
fileman
Java
.db
Java
.jess
Java
.java
c
Java
.jack
Java
.mtrt
Java
.compr
ess
DBMS.selec
t
DBMS.update
DBMS.join
% of OS Cycles% of OS Ener
92% 89%
gy
Figure 1.5: OS Cycles and Power 5

1.4 THE PROBLEMS AND PROPOSED SOLUTIONS
The evidence of the significant OS activity on many modern and emerging
applications execution plus the trend that the importance of OS is continuously growing
in modern computer systems due to the increasing demands on system administration
clearly indicate the necessity for good collaboration between the architecture design and
the OS.
Unfortunately, processor architecture design has paid less attention to the needs of
the OS. The existing mechanisms such as context switch, dual mode execution, precise
exception handling, and virtual memory protection all guarantee correctness but not
efficiency. The OS is designed to manage both hardware and software resources in a
system. Should architecture design be more OS-friendly? What are the benefits of doing
that? Those are the questions that this dissertation tries to answer.
There are primarily three problems:
• The OS activity in emerging applications execution and the implications of OS
execution on processor performance and power dissipation are not well
understood.
• Low power processor architecture designs have not considered the interactions of
hardware, application, and OS.
• Conventional processor microarchitecture designs have not paid attention to the
effect of OS. Performance degrades due to the interference between user
applications and OS.
1.5 THESIS STATEMENT
Many modern and emerging workloads execution invoke heavy OS activities.
Microprocessor designs that incorporate the OS-aware architectural components can
6

improve the performance and energy efficiency of modern and emerging applications
execution.
1.6 CONTRIBUTIONS
This dissertation makes several contributions to the characterization of OS
activity in modern and emerging workloads, implications of OS execution, power
behavior of OS, and explicit hardware support for exploiting the interactions of OS and
computer architecture to improve processor performance and energy efficiency. The
summary of the contributions is listed below.
1. There is abundant variety among applications running on today’s computer
systems. However, the using of user-only technical workloads has dominantly
driven evaluating architectural designs/optimizations. It is essential to understand
the characteristics of today’s emerging workloads in order to design efficient
architectures for them. Given the facts that modern and emerging applications
involve system activities significantly, this research uses complete system
evaluation to understand the workloads behavior and interactions of hardware,
applications and OS.
2. The increasing constraints on power consumption in today’s computing systems
point to the need for power modeling and estimation for all components of a
system. The OS constitutes a major software component and dissipates a
significant portion of total power in many modern application executions.
Therefore, modeling OS power is imperative for accurate software power
evaluation, as well as power management (e.g. dynamic thermal control and equal
energy scheduling). This dissertation characterizes the power behavior of a
modern, commercial OS across a wide spectrum of applications to understand OS
energy profiles and then proposed various models to cost-effectively estimate its 7

run-time energy dissipation. The proposed models rely on a few simple
parameters and have various degrees of complexity and accuracy. Compared with
cycle-accurate full-system simulation, the model can predict cumulative OS
energy to within 1% accuracy for a set of benchmark programs evaluated on a
high-end superscalar microprocessor.
3. To reduce software power, hardware can provide resources that closely match the
needs of the software. However, with exception-driven and intermittent execution
in nature, it becomes difficult to accurately predict and adapt processor resources
in a timely fashion for OS power savings without significant performance
degradation. This dissertation proposes a methodology that permits precise
processor adaptations for the operating system with low overhead. Compared with
existing techniques, this scheme has the following advantages: (1) The proposed
adaptation scheme guarantees the timely and fine-grained resolution required to
capture the exception-driven, short-lived OS activity; (2) The adaptation
techniques eliminate significant portion of adaptation overhead; (3) The
adaptation scheme has the capability to select the optimal configuration for
different OS code, yielding more attractive power and performance trade-off; (4)
This scheme is orthogonal to and can be integrated with existing scheme proposed
for user-only applications.
4. Low power has been considered as an important issue in instruction cache (I-
cache) designs. Several studies have shown that the I-cache can be tuned to
reduce power. These techniques, however, exclusively focus on user-level
applications. This study goes beyond previous work to explore the opportunities
to design energy-efficient I-cache by considering the interactions of hardware-
application-OS. This dissertation presents two techniques (OS-aware cache way
8
lookup and OS-aware cache set drowsy mode) to reduce the dynamic and the
static power consumption of I-cache. The proposed OS-aware cache way lookup
reduces the number of parallel tag comparisons and data array read-outs for cache
accesses to save dynamic I-cache power in a given operation mode. The proposed
OS-aware cache set drowsy mode puts I-cache regions that are only heavily used
by another operation mode to reduce leakage power. The proposed mechanisms
require minimal hardware modification and addition. Simulation based
experiments show that with no or negligible impact on performance, applying OS-
aware tuning techniques yields significant dynamic and static power savings
across the experimented applications.
5. For current high performance microprocessors, the delivered ILP and pipelining
performance is critically dependent on being able to accurately predict the control
(branch) flow in the program. The OS component affects the control flow transfer
in the execution environment because the exception-driven, intermittent
invocation of OS code significantly increases the misprediction in both user and
kernel code. This dissertation proposes two OS-aware branch prediction
techniques to alleviate this destructive impact. Incorporating OS-aware techniques
with existing branch prediction mechanisms yields up to 34%, 23%, 27% and 9%
prediction accuracy improvement on four state-of-the-art branch predictors. The
integrated OS-aware predictors consume equivalent or even less hardware
resource. These advantages are valuable in the light of power and clock frequency
constraints in future microprocessor and branch predictor designs.
9

1.7 ORGANIZATION
Chapter 2 presents the performance evaluation methodology used in this
dissertation. A detailed description of the tools, benchmarks, evaluation environment, and
performance measures is presented.
Chapter 3 presents a case study of emerging workloads and OS activity
characterization.
Chapter 4 characterizes the power behavior of OS and proposes the model and
methodology for run-time OS power modeling.
Chapter 5 proposes the routine based OS-aware microprocessor resource
adaptation for OS power savings. Compared with sampling based mechanism, the
proposed solution allow microprocessor to adapt its resource to complex software like OS
in a timely and accurately fashion without paying high adaptation overhead.
Chapter 6 investigates the low power instruction cache design by incorporating
the OS-aware design philosophy.
Chapter 7 characterizes the impact of OS on the microprocessor control flow
prediction mechanism, one of the performance critical issues for today’s wide issue and
highly speculative microprocessor. The hardware solutions, which can significant
improve the prediction accuracy due to the exception driven and non-deterministic OS
execution, are then proposed.
Chapter 8 concludes the dissertation by summarizing the contributions and
suggesting future opportunities.
10

Chapter 2: Experimental Methodology
The experimental results in this dissertation are obtained by detailed simulation of
a complete system. This chapter discusses the simulation tools and process. The baseline
microarchitecture and benchmark programs are also explained.
2.1 FRAMEWORK
This dissertation uses software-based simulation framework.
2.1.1 SimOS
The experimental platform used to perform this study is SimOS [28][71], a
complete simulation environment that models hardware components with enough detail
to boot and run a full-blown commercial OS. In this dissertation, the SimOS version that
runs the Silicon Graphics IRIX5.3 operating system was used.
SimOS includes multiple processor simulators (Embra, Mipsy, and MXS) that
model the CPU at different levels of detail [28]. This research uses the fastest CPU
simulator, Embra [85] to boot the OS and perform initialization, and then uses Mipsy and
MXS, the detailed CPU models of SimOS to conduct performance measurements (as
shown in Figure 2.1). For the large and complex workloads, the booting and initialization
phase may cause the execution of several tens of billions of instructions [72].
SimOS has a checkpointing ability which allows the hardware execution status
(e.g. contents of register file, main memory and I/O devices) to be saved as a set of files
(dubbed as a checkpoint), and simulation may resume from the checkpoint. This feature
allows us to conduct multiple runs from identical initial status. To ensure that SimOS
accurately simulates a complete execution of each workload, annotations are used to
allow SimOS to automatically invoke a studied workload after a checkpoint is restored
and to exit simulation as soon as the execution completes and OS prompt is returned.
11

This techniques, which avoid the need of interactive input to control the simulation after
it begins and before it completes, make each run complete, accurate, and comparable.
SPECint95
SimOSEmbra
Annotation
Machine Architecture
Booting OSSetting run-time system Mounting disk
Workload
Warming-up file cacheProfiling execution Positioning applications
Executing applicationsDumping simulation result
Checkpoint
SimOSMipsy
SimOSMXS
SPECjvm98
Figure 2.1: Simulation Flow Chart
The performance results presented in this study are generated by Mipsy and MXS,
the detailed CPU models of SimOS. Mipsy models a simple, single-issue pipelined
processor with one-cycle result latency and one-cycle repeat rate [28]. Although Mipsy is
not an effective model from the perspective of detailed processor performance
investigations, it does provide valuable information such as TLB activities, instruction
counts, and detailed memory system behavior. In this study, Mipsy is used to generate the
basic characterization knowledge and memory system behavior of studied workloads.
2.1.2 SoftWatt
The complete system power simulator SoftWatt [25], which models the power
dissipation of the CPU, memory hierarchy and a low-power disk subsystem is used to
investigate the power behavior of OS. The SoftWatt tool, built on top of the SimOS
12
infrastructure [28], uses validated energy models similar to other low-level power
simulators like Wattch [13]. By leveraging the SimOS cycle-accurate and full-system
simulation capability, SoftWatt captures power dissipation of both applications and OS
running on a detailed system model.
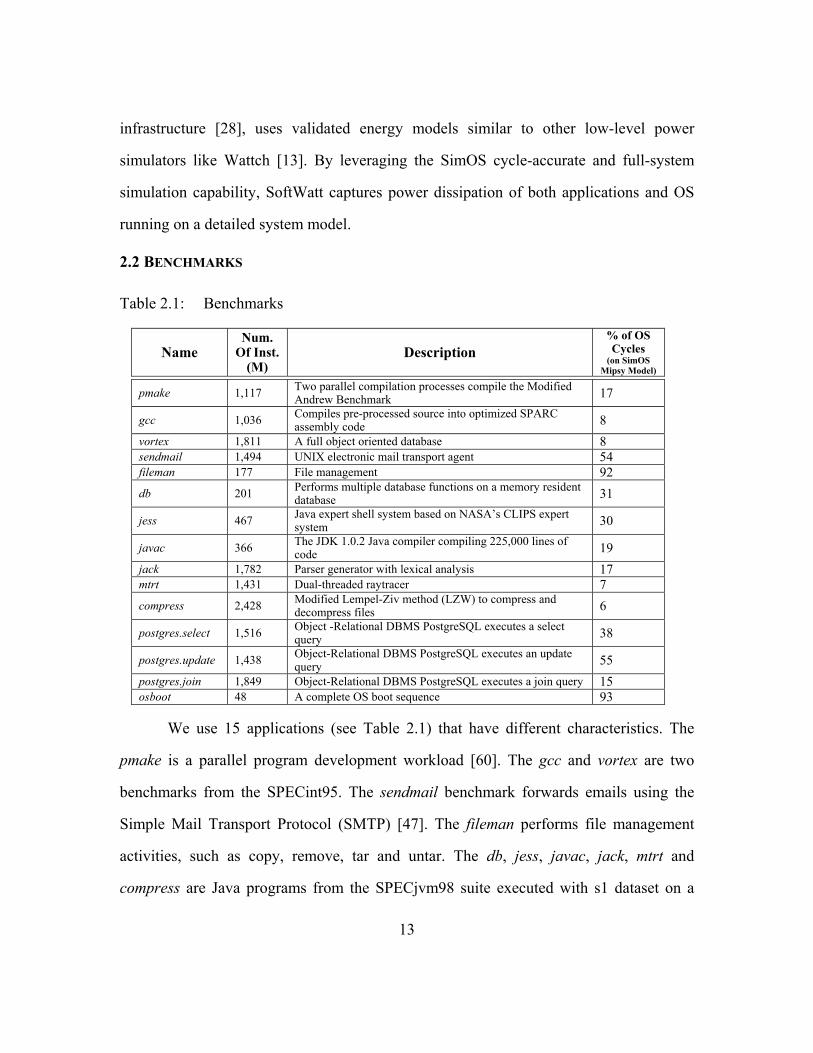
2.2 BENCHMARKS
Table 2.1: Benchmarks
Name Num.
Of Inst. (M)
Description % of OS Cycles
(on SimOS Mipsy Model)
pmake 1,117 Two parallel compilation processes compile the Modified Andrew Benchmark 17
gcc 1,036 Compiles pre-processed source into optimized SPARC assembly code 8
vortex 1,811 A full object oriented database 8 sendmail 1,494 UNIX electronic mail transport agent 54 fileman 177 File management 92 db 201 Performs multiple database functions on a memory resident
database 31
jess 467 Java expert shell system based on NASA’s CLIPS expert system 30
javac 366 The JDK 1.0.2 Java compiler compiling 225,000 lines of code 19
jack 1,782 Parser generator with lexical analysis 17 mtrt 1,431 Dual-threaded raytracer 7 compress 2,428 Modified Lempel-Ziv method (LZW) to compress and
decompress files 6
postgres.select 1,516 Object -Relational DBMS PostgreSQL executes a select query 38
postgres.update 1,438 Object-Relational DBMS PostgreSQL executes an update query 55
postgres.join 1,849 Object-Relational DBMS PostgreSQL executes a join query 15 osboot 48 A complete OS boot sequence 93
We use 15 applications (see Table 2.1) that have different characteristics. The
pmake is a parallel program development workload [60]. The gcc and vortex are two
benchmarks from the SPECint95. The sendmail benchmark forwards emails using the
Simple Mail Transport Protocol (SMTP) [47]. The fileman performs file management
activities, such as copy, remove, tar and untar. The db, jess, javac, jack, mtrt and
compress are Java programs from the SPECjvm98 suite executed with s1 dataset on a
13
Sun Java virtual machine [35]. We also use three benchmarks that run on a relational
database management system (DBMS) engine- PostgreSQL [67]. The database is
populated with relational tables for the TPC-C benchmark [83]. The postgres.select
performs a sequential table scan of a table with 1 million rows and a selectivity of 3%.
The postgres.update updates to a field of a 300,000 row table and the postgres.join
executes a nested loop join query involving two tables of sizes 11MB and 24KB. The
osboot executes a complete OS booting sequence form the root disk image and then
generates a shell.
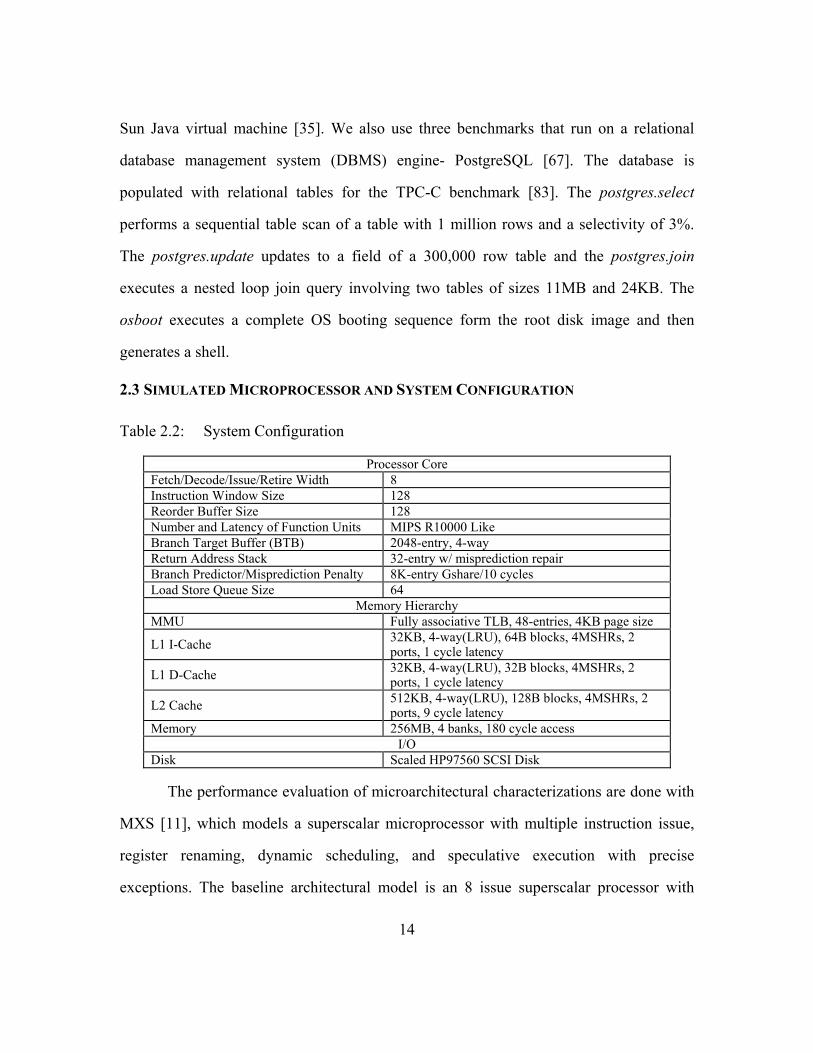
2.3 SIMULATED MICROPROCESSOR AND SYSTEM CONFIGURATION
Table 2.2: System Configuration
Processor Core Fetch/Decode/Issue/Retire Width 8 Instruction Window Size 128 Reorder Buffer Size 128 Number and Latency of Function Units MIPS R10000 Like Branch Target Buffer (BTB) 2048-entry, 4-way Return Address Stack 32-entry w/ misprediction repair Branch Predictor/Misprediction Penalty 8K-entry Gshare/10 cycles Load Store Queue Size 64
Memory Hierarchy MMU Fully associative TLB, 48-entries, 4KB page size
L1 I-Cache 32KB, 4-way(LRU), 64B blocks, 4MSHRs, 2 ports, 1 cycle latency
L1 D-Cache 32KB, 4-way(LRU), 32B blocks, 4MSHRs, 2 ports, 1 cycle latency
L2 Cache 512KB, 4-way(LRU), 128B blocks, 4MSHRs, 2 ports, 9 cycle latency
Memory 256MB, 4 banks, 180 cycle access I/O
Disk Scaled HP97560 SCSI Disk
The performance evaluation of microarchitectural characterizations are done with
MXS [11], which models a superscalar microprocessor with multiple instruction issue,
register renaming, dynamic scheduling, and speculative execution with precise
exceptions. The baseline architectural model is an 8 issue superscalar processor with
14

MIPS R10000 [57][89] instruction latencies. Unlike the MIPS R10000, our processor
model has a 128-entry instruction window, a 128-entry reorder buffer and a 64-entry
load/store buffer. Additionally, all functional units can handle any type of instructions.
Branch prediction is implemented as an 8192-entry table Gshare predictor. Indirect
branches and call/return are handled by a 2048-entry BTAC (branch target address cache)
and a 32-entry RAS (return address stack) respectively. By default, the branch prediction
algorithm allows fetch unit to fetch through up to 4 unresolved branches.
The memory subsystem consists of a split L1 instruction and data cache, a unified
L2 cache, and main memory. The L1 instruction cache is 32KB, and has a cache line size
of 64-bytes. The L1 data cache is 32KB, and has 32-byte lines. The L2 cache is 512KB
with 128-byte lines. A hit in the L1 cache can be serviced in one cycle, while a hit in the
L2 cache is serviced in 10 cycles. All caches are 4-way associative, with LRU
replacement and write back write miss allocation policies and have four miss status
handling registers (MSHR). Main memory consists of 256 MB DRAM with a 180-cycle
access time. Our simulated machine also includes a validated HP disk model and a single
console device. The described architecture is simulated cycle by cycle. The instruction
and data accesses of both applications and OS are modeled.
15
Chapter 3: Characterizing OS Activity: A Case Study of SPECjvm98
Complete system simulation to understand the influence of architecture and OS
on application execution has been identified to be crucial for systems design. This
problem is particularly interesting in the context of modern and emerging workloads. To
investigate these issues, this chapter uses complete system simulation of the emerging
SPECjvm98 benchmarks on the SimOS simulation platform.
3.1 MOTIVATION
It is becoming increasingly clear [7][28][71][72] that accurate performance
analysis requires an examination of complete system - architecture and OS - behavior.
While complete system simulation has been used to study several workloads [7][71][72],
it has not been used in the context of emerging Java programs. A Java Virtual Machine
(JVM) environment can be significantly different from that required to support traditional
C or FORTRAN based code. The major differences are due to: 1) object-oriented
execution with frequent use of virtual method calls (dynamic binding), dynamic object
allocation and garbage collection; 2) dynamic linking and loading of classes; 3) program-
level multithreading and consequent synchronization overheads; and 4) software
interpretation or dynamic compilation of byte-codes. These differences can affect the
behavior of the OS kernel in a different manner than conventional applications. For
instance, dynamic linking and loading of classes can result in higher file and I/O
activities, while dynamic object allocation and garbage collection would require more
memory management operations. Similarly, multithreading can influence the
synchronization behavior in the kernel.
This chapter presents results from an in-depth look at complete system profiling
of the SPECjvm98 benchmarks, focusing on the OS activity. Of the different JVM
16

implementation styles [29][18][42][78][55], this chapter focuses on two popular
techniques - interpretation and Just-In-Time (JIT) compilation. Interpretation [29] of the
portable Java byte codes was the first approach that was used, and is, perhaps, the easiest
to implement. In contrast, JIT compilers [18][42][78], which represent the state-of-the-
art, translate the byte-codes to machine native code at runtime (using sophisticated
techniques) for direct execution.
The rest of this chapter is organized as follows. Section 3.2 presents the execution
time and detailed statistics for the user and kernel activities in these workloads. Section
3.3 investigates cache and memory performance. Section 3.4 explores the ILP issues.
Finally, section 3.5 summarizes the contributions and implications of this work.
3.2 KERNEL ACTIVITY OF SPECJVM98
Figure 3.1 and 3.2 show the execution time profile of the SPECjvm98
benchmarks for JIT compiler and interpreter modes of execution on s1 input dataset (The
results on s100 dataset are shown in Figure 3.3 and 3.4). The measured period includes
time for loading the program, verifying the class files, compiling on the fly by JIT
compiler and executing native instruction stream on simulated hardware. The profile is
presented in terms of the time spent in executing user instructions, stalls incurred during
the execution of these instructions (due to memory and pipeline stalls), the time spent in
kernel instructions, the stalls due to these kernel instructions, synchronization operations
within the kernel and any remaining idle times.
Figure 3.2 shows that compress and mtrt have flat and steady execution profile. In
these workloads, the bulk of execution time is made up by steady state execution region
that consists of a single outer loop or a set of loops iterating on a given data size. In
contrast, jess, db and javac make heavy but erratic use of kernel services, which makes
their execution behaviors irregular. Additionally, we observe negligible (less that 3%) 17

synchronization time in all of the SPECjvm98 benchmarks' execution. This is partially
due to some Java runtime library functions are designed to be thread safe, therefore, are
synchronized.
idle user stall user instr kernel sync kernel stall kernel instr
|
0.0|
2.5|
5.0|
7.5|
10.0|
12.5
|0
|20
|40
|60
|80
|100 | | | |
||
||
||
Time (seconds)
Perc
ent of E
xecu
tion T
ime
201 compress idle user stall user instr kernel sync kernel stall kernel instr
|
0.0|
0.5|
1.0|
1.5|
2.0|
2.5
|0
|20|40
|60
|80
|100 | | |
||
||
||
Time (seconds)
Perc
ent of E
xecu
tion T
ime
202 jess
idle user stall user instr kernel sync kernel stall kernel instr
|
0.00|
0.25|
0.50|
0.75|
1.00
|0
|20
|40
|60
|80
|100 | | |
||
||
||
Time (seconds)
Perc
ent of E
xecu
tion T
ime
209 db idle user stall user instr kernel sync kernel stall kernel instr
|
0.00|
0.25|
0.50|
0.75|
1.00|
1.25|
1.50|
1.75|
2.00
|0
|20
|40
|60
|80
|100 | | |
||
||
||
Time (seconds)
Perc
ent of E
xecu
tion T
ime
213 javac
idle user stall user instr kernel sync kernel stall kernel instr
|
0|
1|
2|
3|
4|
5|
6|
7|
8
|0
|20
|40
|60
|80|100 | | | |
||
||
||
Time (seconds)
Perc
ent of E
xecu
tion T
ime
227 mtrt idle user stall user instr kernel sync kernel stall kernel instr
|
0.0|
2.5|
5.0|
7.5|
10.0
|0
|20
|40
|60
|80
|100 | |
||
||
||
Time (seconds)
Perc
ent of E
xecu
tion T
ime
228 jack
| | | | |
| | | | | | | |
| | | | | | | |
The execution time of each workload is separated into the time spent in user, kernel, and idle (idle) modes on the SimOS Mipsy CPU model. User and kernel modes are further subdivided into instruction execution (user instr, kernel instr), memory stall (user stall, kernel stall), and synchronization (kernel sync, only for kernel mode).
Figure 3.1: Execution Profile of SPECjvm98 (JIT compiler, s1 dataset)
18

idle user stall user instr kernel sync kernel stall kernel instr
|
0.0|
0.5|
1.0|
1.5|
2.0|
2.5|
3.0
|0
|20
|40
|60
|80
|100 | | | |
||
||
||| | |
Time (seconds)
Perc
ent of E
xecu
tion T
ime
202 jess nojit
idle user stall user instr kernel sync kernel stall kernel instr
|
0.00|
0.25|
0.50|
0.75|
1.00
|0
|20
|40
|60
|80
|100 | |
||
||
||| | |
Time (seconds)
Pe
rce
nt
of
Exe
cutio
n T
ime
209 db nojit idle user stall user instr kernel sync kernel stall kernel instr
|
0.00|
0.25|
0.50|
0.75|
1.00|
1.25|
1.50|
1.75
|0
|20
|40
|60
|80
|100 | | | | |
||
||
||| | |
Time (seconds)
Perc
ent of E
xecu
tion T
ime
213 javac nojit
idle user stall user instr kernel sync kernel stall kernel instr
|
0.0|
2.5|
5.0|
7.5|
10.0|
12.5
|0
|20
|40
|60
|80
|100 | |
||
||
||| | | |
Time (seconds)
Perc
ent of E
xecu
tion T
ime
227 mtrt nojit idle user stall user instr kernel sync kernel stall kernel instr
|
0.0|
2.5|
5.0|
7.5|
10.0|
12.5
|0
|20
|40
|60
|80
|100 | | |
||
||
||| | |
Time (seconds)
Pe
rce
nt
of
Exe
cutio
n T
ime
228 jack nojit
The execution time of each workload is separated into the time spent in user, kernel, and idle (idle) modes on the SimOS Mipsy CPU model. User and kernel modes are further subdivided into instruction execution (user instr, kernel instr), memory stall (user stall, kernel stall), and synchronization (kernel sync, only for kernel mode).
Figure 3.2: Execution Profile of SPECjvm98 (interpreter, s1 dataset)
19

The execution time of each workload is separated into the time spent in user, kernel, and idle (idle) modes on the SimOS Mipsy CPU model. User and kernel modes are further subdivided into instruction execution (user instr, kernel instr), memory stall (user stall, kernel stall), and synchronization (kernel sync, only for kernel mode).
Figure 3.3: Execution Profile of SPECjvm98 (JIT compiler, s100 dataset)
20

The execution time of each workload is separated into the time spent in user, kernel, and idle (idle) modes on the SimOS Mipsy CPU model. User and kernel modes are further subdivided into instruction execution (user instr, kernel instr), memory stall (user stall, kernel stall), and synchronization (kernel sync, only for kernel mode).
Figure 3.4: Execution Profile of SPECjvm98 (interpreter, s100 dataset)
21

Table 3.1 summarizes the breakdown of execution time spent in kernel, user and
idle for each SPECjvm98 benchmark on three different input datasets. For the small input
dataset s1, the kernel activity is seen to constitute 6% (compress) to 31% (db) of the
overall execution time. On the average, the SPECjvm98 programs spend 17% of their
execution time in kernel. This fact implies that ignoring kernel instructions in
SPECjvm98 workloads study may not represent complete and accurate execution
behavior.
Table 3.1: Execution Time Percentages (with JIT compiler)
Benchmarks Input User User Inst.
User Stall Kernel Kernel
Inst. Kernel Stall
Kernel Sync. Idle
S1 92.25 87.13 5.12 6.06 4.67 1.20 0.19 1.69
S10 83.57 78.50 5.07 5.44 4.31 0.97 0.16 10.99 compress
S100 92.81 87.19 5.62 4.30 3.78 0.49 0.03 2.89 S1 61.95 51.49 10.46 30.28 21.71 6.50 2.07 7.77
S10 79.10 70.70 8.40 16.99 13.61 2.66 0.72 3.91 jess
S100 84.95 73.63 11.32 14.90 14.19 0.66 0.05 0.15 S1 52.07 44.19 7.88 30.91 20.12 8.23 2.56 17.02
S10 79.08 70.45 8.63 15.89 12.69 2.45 0.75 5.03 db
S100 87.10 77.50 9.60 12.64 11.91 0.69 0.04 0.26 S1 71.18 62.08 9.10 18.56 12.17 5.13 1.26 10.26
S10 73.06 62.50 10.56 11.99 9.89 1.82 0.28 14.95 javac
S100 84.31 70.92 13.39 14.92 13.85 1.03 0.04 0.77 S1 89.99 81.23 8.76 7.27 5.08 1.87 0.32 2.74
S10 91.98 82.50 9.48 6.71 5.37 1.18 0.16 1.31 mtrt
S100 91.22 80.34 10.88 8.60 7.86 0.71 0.03 0.18 S1 80.53 70.34 10.19 17.36 13.31 3.46 0.59 2.11
S10 81.47 71.34 10.13 17.27 13.46 3.30 0.51 1.26 jack
S100 82.94 72.51 10.43 16.90 13.51 2.96 0.43 0.16
An interesting observation is the fact that idle times (due to file reads) can be seen
with the smaller data sets. As mentioned earlier, idle times are due to disk activity when
the operation misses in the file cache. In most applications, the operation is invoked
repeatedly to the same files/blocks leading to a higher hit percentage in the file cache
22
while using the s100 data sets. As a result, we observed that the percentage of kernel time
spent in the read call goes up as compared to the smaller data sets.
The above execution profiling reveals kernel behavior on the execution of
SPECjvm98 workloads at a coarse level. We further decompose kernel time at service
level and characterize the corresponding kernel routines for this behavior. SimOS uses a
set of state machines and annotations to track the current kernel processes, such as page
fault routine, interrupt hander, disk driver, or hardware exception [28][72]. This allows us
to attribute kernel execution time to the specific service performed.
Tables 3.2 and 3.3 further break down the kernel activities (on s1 dataset and with
JIT compiler) into specific services. These tables give the number of invocation of these
services, the number of cycles spent in executing each routine on the average, a break
down of these cycles between actual instruction execution, stalls and synchronization.
The memory cycles per instruction (MCPI) while executing each of these services is also
given together with its breakdown into instruction and data portions. The read or write
kernel service may involve disk accesses and subsequent copying of data between file
caches and user data structures. It should be noted that the time spent in disk accesses is
not accounted for within the read or write kernel calls, but will figure as idle times in the
execution profile (because the process is blocked on I/O activity). So the read and write
overheads are mainly due to memory copy operations. utlb fault reloads the TLB for user
addresses. demand_zero is a block clear operation occurs when the OS allocates a page
for data. (The page has to be zeroed out before being used.) The read system calls is
responsible for transferring data from kernel address space to application address space.
Clock and vfault are clock interrupt and page fault handler respectively.
23

Table 3.2: OS Characterization of SPECjvm98 (JIT compiler, s1 dataset)
Ben
ch.
Serv
ice
%K
erne
l
Num
.
Cyc
les
%Ex
ec
%St
all
%Sy
nc
MC
PI
d-M
CPI
i-MC
PI
utlb 52.48% 6283123 13.15 99 1 0 0.01 0.01 0 read 18.23% 5884 4875.49 58 34 8 0.53 0.34 0.19 demand_zero 12.13% 2818 6774.88 44 53 3 1.13 0.99 0.14 clock 2.27% 1299 2750.31 40 57 3 1.4 1.05 0.36 cacheflush 1.96% 1573 1960.03 52 44 4 0.81 0.34 0.48 open 1.72% 190 14265.09 56 30 14 0.43 0.15 0.28 vfault 1.25% 975 2016.53 70 23 8 0.3 0.08 0.22
compress
execve 1.12% 12 146681 55 34 11 0.52 0.31 0.21 read 41.42% 20368 3487.03 67 23 11 0.3 0.04 0.26 utlb 22.91% 2884313 13.62 95 5 0 0.05 0.05 0 BSD 10.90% 28911 646.24 85 11 4 0.13 0.03 0.1 demand_zero 5.26% 1276 7065.17 42 55 3 1.24 1.02 0.22 open 3.03% 327 15882.84 55 31 14 0.46 0.18 0.27 cacheflush 2.90% 2368 2099.78 49 47 3 0.93 0.45 0.48 tlb_miss 1.66% 24510 115.89 76 23 1 0.29 0.11 0.18 write 1.45% 126 19770.29 55 26 19 0.35 0.09 0.26 vfault 1.15% 974 2019.95 69 23 7 0.3 0.08 0.23
jess
execve 1.02% 12 145632.8 56 34 11 0.51 0.31 0.2 read 41.41% 8580 3598.14 66 24 10 0.32 0.08 0.25 utlb 10.17% 564866 13.42 94 6 0 0.06 0.06 0 demand_zero 8.75% 945 6902.83 42 54 3 1.19 1 0.19 write 4.96% 218 16971.67 59 23 19 0.3 0.05 0.24 BSD 4.70% 5604 624.97 85 10 5 0.12 0.02 0.1 cacheflush 4.24% 1583 1996.56 52 45 4 0.84 0.36 0.48 open 3.60% 189 14200.4 56 29 14 0.42 0.15 0.28 tlb_miss 3.04% 20455 110.85 81 18 1 0.22 0.09 0.12 vfault 2.62% 969 2019.38 70 23 8 0.3 0.08 0.23 execve 2.34% 12 145520.3 56 33 11 0.51 0.31 0.2 COW_fault 2.04% 146 10435.04 41 56 3 1.3 1.16 0.14 exit 1.41% 11 95447.45 56 31 12 0.46 0.28 0.18 fork 1.14% 25 34015.16 49 39 12 0.65 0.43 0.22
db
du_poll 1.02% 1038 735.42 64 12 25 0.13 0.01 0.13 utlb 53.69% 14147861 13.71 95 5 0 0.06 0.05 0 read 26.73% 23013 4196.86 55 36 9 0.57 0.1 0.47 BSD 7.83% 34562 818.12 67 30 3 0.43 0.13 0.3 demand_zero 2.71% 1353 7230.78 41 56 3 1.29 1.03 0.25 cacheflush 1.21% 2039 2143.02 50 47 3 0.91 0.43 0.48 clock 1.06% 1040 3668.18 29 68 2 2.21 0.91 1.3
jack
tlb_miss 1.05% 31643 120.19 77 22 1 0.27 0.1 0.17
24

Table 3.3: OS Characterization of SPECjvm98 (contd.)
Ben
ch.
Serv
ice
%K
erne
l
Num
.
Cyc
les
%Ex
ec
%St
all
%Sy
nc
MC
PI
d-M
CPI
i-MC
PI
read 28.28% 6029 3733.47 66 24 10 0.33 0.1 0.23 utlb 21.15% 1227572 13.71 94 6 0 0.07 0.07 0 demand_zero 11.26% 1280 7000.35 42 55 3 1.22 1 0.21 open 6.15% 315 15543.07 59 25 16 0.34 0.12 0.23 cacheflush 5.61% 2042 2185.23 50 46 3 0.89 0.45 0.44 tlb_miss 3.21% 21413 119.44 75 24 1 0.32 0.11 0.21 xstat 2.48% 119 16573.25 63 22 15 0.28 0.13 0.16 vfault 2.47% 980 2010.19 70 23 8 0.3 0.07 0.23 execve 2.21% 12 146486.2 55 34 11 0.52 0.32 0.2 COW_fault 1.91% 146 10389.38 41 56 3 1.28 1.15 0.13 brk 1.59% 240 5275.11 44 42 14 0.75 0.23 0.52 exit 1.45% 11 104609.7 56 31 12 0.46 0.29 0.17 close 1.43% 287 3976.12 44 43 12 0.77 0.24 0.54 write 1.40% 81 13803.63 58 25 17 0.33 0.05 0.28
javac
fork 1.09% 25 34618.28 48 40 12 0.67 0.44 0.23 utlb 41.36% 3473933 13.9 93 7 0 0.07 0.07 0 read 19.54% 6081 3750.62 65 25 10 0.34 0.1 0.24 demand_zero 13.68% 2141 7458.19 40 57 3 1.34 1.08 0.26 cacheflush 2.94% 1688 2035.74 51 45 4 0.85 0.38 0.47 clock 2.81% 803 4077.04 27 71 2 2.58 1.23 1.35 open 2.57% 207 14497.26 55 31 14 0.44 0.15 0.29 tlb_miss 2.12% 16569 149.47 69 29 2 0.4 0.14 0.27 vfault 1.74% 1018 1989.27 70 23 8 0.3 0.07 0.23
mtrt
execve 1.51% 12 146549.1 55 34 11 0.52 0.31 0.21
In the execution profile graphs, we see that the bulk of the time is spent in
executing user instructions. This is particularly true for compress. While I/O (read) is
needed for these benchmarks, subsequent executions are dominated by user operations.
These operations are mainly compute intensive with substantial spatial and temporal
locality (as can be seen in the lower user stalls compared to other applications in Table
3.1). This locality also results in high TLB hit rates making the TLB handler (utlb)
invocation infrequent.
25

Table 3.4: OS Characterization of SPECjvm98 (JIT compiler, s100 dataset)
Ben
ch.
Serv
ice
%K
erne
l
Num
.
Cyc
les
%Ex
ec
%St
all
%Sy
nc
MC
PI
d-M
CPI
i-MC
PI
utlb 80.85 8.64E+07 13 99 1 0 0.01 0.01 0 read 9.51 6317 21140 39 58 3 1.42 1.32 0.1 clock 3.41 16328 2934 37 60 3 1.56 1.07 0.49 demand_zero 2.33 4807 6813 44 53 3 1.13 1 0.13
compress
other 3.90 -- -- -- -- -- -- -- -- utlb 95.10 3.69E+08 13 98 2 0 0.02 0.02 0 clock 1.48 17342 4396 26 72 2 2.77 1.44 1.33 read 1.40 20889 3474 67 22 11 0.3 0.04 0.26 j
ess
other 2.02 -- -- -- -- -- -- -- -- utlb 94.17 5.60E+08 13 97 3 0 0.03 0.03 0 clock 1.95 31439 4917 23 75 2 3.21 1.64 1.57 read 1.44 30048 3804 61 29 10 0.41 0.1 0.31 d
b
other 2.44 -- -- -- -- -- -- -- -- utlb 91.39 4.71E+08 13 96 4 0 0.04 0.04 0 DBL_FAULT 3.82 2812267 94 90 10 0 0.11 0.07 0.04 clock 1.60 23302 4786 23 74 3 3.1 1.41 1.69 read 1.0 10652 6386 48 46 6 0.89 0.41 0.48 j
avac
other 2.19 -- -- -- -- -- -- -- -- utlb 93.41 1.61E+08 13 95 5 0 0.05 0.05 0 clock 2.45 13745 4222 26 71 3 2.64 1.26 1.38 read 1.19 7403 3804 64 26 10 0.36 0.11 0.25 m
trt
other 2.95 -- -- -- -- -- -- -- -- utlb 63.13 2.38E+08 13 95 5 0 0.05 0.05 0 read 25.21 296866 4401 52 40 8 0.67 0.09 0.58 BSD 9.32 585482 825 67 30 3 0.44 0.14 0.3 clock 1.09 15332 3686 30 68 2 2.2 0.92 1.28 j
ack
other 1.25 -- -- -- -- -- -- -- --
In benchmarks db, jess and javac, one can observe spikes in the kernel activity in
the execution. The spikes are introduced by the file activities that can be attributed to
both the application behavior (loading of files) as well as the JVM characteristics. Most
of the time spent in these spikes (read) is in memory stalls. Other kernel routines such as
demand_zero that is used to initialize new pages before allocation, and the process clock
interrupt (clock) routines also contribute to the stalls. In addition to the spikes, we also
see a relatively uniform presence of kernel instructions during the course of execution. As
26

evident from Tables 3.2 and 3.3, this is due to the handling of TLB misses and processing
memory copy & clear operations. OS kernel characterizations of SPECjvm98 workloads
on s100 dataset (with both JIT compiler and an interpreter) are shown in Table 3.4 and
3.5 respectively.
Table 3.5: OS Characterization of SPECjvm98 (interpreter, s100 dataset)
Ben
ch.
Serv
ice
%K
erne
l
Num
.
Cyc
les
%Ex
ec
%St
all
%Sy
nc
MC
PI
d-M
CPI
i-MC
PI
utlb 73.46 1.39E+08 13 98 2 0 0.02 0.02 0 clock 13.64 152657 2245 49 48 3 0.94 0.67 0.27 read 5.32 6324 21119 39 58 3 1.42 1.32 0.10 runqproc 3.20 1 80269930 54 43 3 0.76 0.35 0.41 timein 1.15 9336 3107 54 36 10 0.60 0.30 0.30 demand_zero 1.02 3767 6786 44 53 3 1.12 0.99 0.13 c
ompress
other 2.21 -- -- -- -- -- -- -- -- utlb 94.20 4.17E+08 13 99 1 0 0.01 0.01 0 clock 2.38 38068 3656 31 67 2 2.14 1.13 1.01 read 1.30 20896 3625 65 25 10 0.35 0.04 0.31 j
ess
other 2.12 -- -- -- -- -- -- -- -- utlb 96.64 1.38E+09 13 98 2 0 0.02 0.02 0 clock 1.21 56665 4008 28 70 2 2.44 1.33 1.11 d
b
other 2.15 -- -- -- -- -- -- -- -- utlb 93.67 5.53E+08 14 96 4 0 0.04 0.04 0 clock 1.82 36676 3972 28 70 2 2.40 1.21 1.19 DBL_FAULT 1.76 1487739 95 91 9 0 0.10 0.07 0.03
javac
other 2.75 -- -- -- -- -- -- -- -- utlb 83.04 7.95E+07 17 77 23 0 0.29 0.29 0 clock 9.13 47562 3096 36 61 3 1.66 1.06 0.6 read 1.77 7410 3848 63 27 10 0.38 0.11 0.27 runqproc 1.75 1 28216870 47 50 3 0.99 0.41 0.58 demand_zero 1.0 2173 7375 40 57 3 1.31 1.09 0.22
mtrt
other 3.31 -- -- -- -- -- -- -- -- utlb 70.21 3.51E+08 14 95 5 0 0.05 0.05 0 read 20.30 296873 4672 49 43 8 0.77 0.09 0.68 BSD 7.48 585470 872 63 33 4 0.52 0.21 0.31 clock 1.08 21211 3495 31 66 3 2.03 0.85 1.18 j
ack
other 0.93 -- -- -- -- -- -- -- --
27

3.3 CACHE AND MEMORY PERFORMANCE
Table 3.6 shows the percentages of memory stall time spent for data and
instruction for each workload. For completeness, we show data in both user and kernel
modes on different datasets. For example, in user mode (with s100 dataset), data stall
time dominates the total memory stall in compress (99%), db (98%), mtrt (81%), and
javac (80%). Jack is the only application which demonstrate uniform distribution
between data and instruction stall time (56%/44%). In kernel, a significant fraction of the
OS time spends waiting for data in compress, jess, db, and javac. Mtrt has approximately
equal instruction and data stall time. Jack, on the other hand, has more instruction stall
than data stall.
Table 3.6: Memory Stall Time Percentages (with JIT compiler)
User Stall Kernel Stall Benchmarks Input Data
(%) Inst. (%)
Data (%)
Inst. (%)
S1 94% 6% 69% 31% S10 95% 5% 68% 32% compress S100 99% 1% 82% 18% S1 48% 52% 38% 62% S10 71% 29% 45% 55% jess S100 75% 25% 71% 29% S1 45% 55% 45% 55% S10 86% 14% 44% 56% db S100 98% 2% 73% 28% S1 53% 47% 52% 48% S10 74% 26% 58% 42% javac S100 80% 20% 76% 24% S1 82% 18% 59% 41% S10 82% 18% 63% 37% mtrt S100 81% 19% 78% 22% S1 56% 44% 40% 60% S10 55% 45% 41% 59% jack S100 56% 44% 36% 65%
Note that the use of simplistic Mipsy processor model necessarily introduces
variance in the results compared with using out of order superscalar model MXS.
28

However, the much faster Mipsy model allows the simulation of complex SPECjvm98
benchmarks with large input size to be completed within acceptable simulation time.
Previous study [8] shows that the overall performance improvements of the superscalar
model apply to both user and kernel code and is preferable to increase kernel execution
time. So, we expect an increased kernel execution fraction on the more complex out of
order superscalar model.
We examine how cache miss behavior changes as cache size increases by
changing the L1 data and instruction cache from 4KB to 512KB and L2 unified cache
form 64KB to 4MB (as shown in Figure 3.5). All caches are two-way set associative
caches with LRU replacement policy. Cache miss behavior is presented as cache misses
per 100 non-idle instructions. The miss number includes cache misses occur in both
kernel and user modes.
The performance of L1 data cache when varying the configuration from 4KB to
512KB is summarized in Figure 3.5 (a). The number of L1 data cache misses is higher in
javac, jess, and mtrt than that of the other benchmarks. Another observation is that for all
of the SPECjvm98 workloads, cache misses decrease drastically as cache size increases
from 4KB to 32KB. L1 data cache misses continue to decrease further as the cache size is
increased up to 512KB. This suggests that even larger L1 caches could be beneficial for
most of the SPECjvm98 workloads.
Figure 3.5 (b) presents instruction misses for SPECjvm98 workloads. The
benchmarks jack, jess, javac and db have higher miss number due to the larger instruction
footprint caused by frequent branches to runtime libraries as well as OS calls. Compress,
and mtrt show fewer misses. In these workloads, either a single or a set of tight loops
work through a given data set, consuming the bulk of computation time while
constituting a small instruction footprint. Figure 3.5 (b) shows that instruction related L1
29

cache misses can be nearly satisfied by a 256KB L1 instruction cache and a larger/set
associative instruction cache would not be as beneficial for the instruction cache
performance as for the performance of data caches.
compress jess db javac mpeg mtrt jack
compress jess db javac mpeg mtrt jack
compress jess db javac mpeg mtrt jack compress jess db javac mpeg mtrt jack
L1 Data Cache
128k
256k
128k
64k
32k
16k
8k4k
256k
512k
128k
64k
16k
8k4k
512k
256k64
k32
k16
k8k
4k
128k32k
4k
4k8k
16k
32k
64k
128k
256k
512k 8k
16k
512k
4k8k
16k
32k
64k
128k
256k
512k
32k
64k
128k
512k
256k
4k8k
16k
32k
64k
256k
512k
0.0
0.5
1.0
1.5
2.0
2.5
3.0
Mis
ses
on 1
00 N
on-Id
le In
stru
ctio
ns
User Misses L1 Inst. Cache
128k
256k
128k
64k
32k
16k
8k4k
256k
512k
128k
64k 16
k8k
4k
512k
256k64
k32
k16
k8k
4k
128k
32k
4k
4k8k
16k
32k
64k
128k
256k
512k 8k
16k
512k
4k8k
16k
32k
64k
128k
256k
512k 32
k64
k12
8k51
2k25
6k
4k8k
16k
32k
64k
256k
512k
0.0
0.5
1.0
1.5
2.0
2.5
3.0
3.5
4.0
Mis
ses
on 1
00 N
on-Id
le In
stru
ctio
ns
User Misses
L2 Cache
4M
2M1M 4M4M
2M1M
512k
256k
128k
64k
4M2M
1M 1M
64k
4M 4M
256k
64k
128k2M
512k
512k
64k
64k
128k
256k
512k
1M2M
4M12
8k25
6k
64k
128k 2M
256k
512k
128k
1M
512k
256k
64k
128k
512k
256k
1M2M
0.0
0.2
0.4
0.6
0.8
1.0
1.2
1.4
1.6
1.8
Mis
ses
on 1
00 N
on-Id
le In
stru
ctio
ns
User Misses
0
0.02
0.04
0.06
0.08
0.1
0.12
0.14
0.16
0.18
0.2
Mis
ses
on 1
00 n
on-id
le u
ser i
nstr
uctio
ns
InstructionData
0
0.1
0.2
0.3
0.4
0.5
0.6
Mis
ses
on 1
00 n
on-id
le k
erne
l ins
truc
tions Instruction
Data
compress jess db javac mpeg mtrt jack
(d)
(a) (b)
(c)
(e)
3.5 4.5
Kernel Misses Kernel Misses
Kernel Misses
Figure 3.5: Impact of Cache Capacity and Line Size
30
Overall L2 cache misses, as shown in Figure 3.5 (c), decrease by 51% as L2 cache
size increases from 64KB to 128KB, and by another 52%, as the size is increased further
to 256KB. Both L1 instruction cache and L2 cache miss behaviors follow the rule of
thumb that doubling of the cache size gives about half the benefit seen with the previous
doubling. The instruction stream can be effectively cached while the data accesses are
more difficult to absorb, because the data footprint is much larger than the instruction
footprint for most of SPECjvm98 benchmarks.
To investigate the impact on cache performance by increasing line sizes while
keeping cache size constant, we model a 1MB 2-way associative L2 cache with line sizes
varying from 32 bytes to 256 bytes.
Figure 3.5 (d) and (e) show the L2 cache performance with increasing line size in
user and kernel mode respectively. As the Figure 3.5 (d) and (e) shows, SPECjvm98
workloads are able to take the advantage of larger L2 cache block sizes. However, the
performance benefit for larger block sizes is highly dependent on the block size and
branching behavior of the particular application. Compress and mtrt obviously realizes
more instruction cache miss rate improvement due to their looping characteristic and
sequential accessing nature. In contrast, jess, db, javac and jack workloads exhibit more
random branching patterns and their codes are more likely to traverse decision trees than
perform tight iterative loops. Additionally, many SPECjvm98 workloads compute across
arrays of data. Hence, large block sizes improve data misses behavior in compress and
mtrt. For example, mtrt workload almost reduces 40% of L2 miss in user mode when the
line size is increased from 32 bytes to 64 bytes. These Figures also show that the
efficiency of reducing instruction related L2 cache misses is not as effective as that for
data misses. In jess, db, javac and jack, L2 instruction misses become stable when cache
line size is increased from 64 bytes to 256 bytes.
31

For kernel codes, the conclusions from the previous line size discussion still held.
Another observation is operating system kernel experiences higher instruction and data
miss than user application. Symbolic codes like OS, where processors read linked lists
and often use complex data structures with indirection have low spatial locality .
0
0.05
0.10
0.15
0.20
0.25
0.30
0.35
0.40
0.45
0.50
0.55
0.60
Mem
ory
cycl
es p
er in
stru
ctio
n (M
CP
I)
com
pr-
K
com
pr-
U
jess
-K
jess
-U
db
-K
db
-U
java
c-K
java
c-U
m pe g-K
mp
eg
-U mtr
t-K m
trt-
U jack
-K
jack
-U
0
0.05
0.10
0.15
0.20
0.25
0.30
0.35
0.40
0.45
0.50
0.55
0.60
Mem
ory
cycl
es p
er in
stru
ctio
n (M
CP
I)
com
pr-
K
com
pr-
U
jess
-K
jess
-U
db
-K
db
-U
java
c-K
java
c-U
m pe g-K
mp
eg
-U
mtr
t-K
mtr
t-U
jack
-K
jack
-U
L2-I L1-I L2-D L1-D
(b) intr (a) jit
L2-I L1-I L2-D L1-D
Figure 3.6: Memory Stall Time in Kernel and User
Figure 3.6 shows the memory stall time expressed as memory stall time per
instruction (MCPI). The stall time is shown separately for the both the kernel (-K) and
user (-U) modes (with s100 dataset) and is also decomposed into instruction (-I) and data
(-D) stalls. Further, the stalls are shown as that occurring due to L1 or L2 caches. For
both the JIT compiler and interpreter modes of execution, it is observed that the kernel
routines can experience much higher MCPI than user code for 3 of the benchmarks,
indicating the worse memory system behavior of the kernel. Fortunately, the kernel
portion forms a maximum of only 17% of the overall execution time among all the
SPECjvm98 benchmarks and this mitigates the impact on overall MCPI. It can also be
observed from Figure 3.6 that the MCPI in the user mode is less for the interpreter mode
as compared to the JIT mode. The bursty writes during dynamic compilation and the
additional non-memory instructions executed while interpreting the bytecodes result in
32

this behavior. It is also observed that the stalls due to data references are more significant
than that due to the instruction accesses. The MCPI due to L2 cache accesses is quite
small for the compress that exhibit a significant data locality. The other SPECjvm98
benchmarks can, however, benefit from stall reduction techniques employed for the L2
cache.
3.4 ILP ISSUES
This section analyzes the impact of ILP techniques on SPECjvm98 suite by
executing the complete workload on the detailed superscalar CPU simulator MXS. The
effectiveness of microarchitectural features such as wide issuing and retirement are
studied. Due to the large slowdown of MXS CPU simulator, we use the reduced data size
s1 as the data input in this section. Just as before, we model instruction and data accesses
in both application and OS.
Figure 3.7 illustrates the kernel, user, and aggregate execution speedup for a
single pipelined (SP), a four-issue superscalar (SS) and an eight-issue superscalar
microprocessor (normalized to the corresponding execution time on the SP system). The
eight-issue SS uses more aggressive hardware to exploit ILP. Its instruction window and
reorder buffer can hold 128 instructions, the load/store queue can hold 64 instructions,
and the branch prediction table has 2048 entries. Furthermore, its L1 caches support up to
four cache accesses per cycle. To focus the study on the performance of the CPU, there
are no other differences in the memory subsystem.
Figure 3.7 shows that microarchitectural techniques to exploit ILP reduce the
execution time of all SPECjvm98 workloads on the four-issue SS. The total ILP speedup
(in JIT mode), nevertheless, shows a wide variation (from 1.66x in jess to 2.05x in mtrt).
The average ILP speedup for the original applications is 1.81x (for user and kernel
integrated). We see that kernel speedup (average 1.44x) on an ILP processor is somewhat 33

lower than that of the speedup for user code (average 2.14x). When the issue width is
increased from four to eight, we observe a factor of less than 1.2x on performance
improvement for all of SPECjvm98 applications. Compared with the 1.6x (in SPECInt95)
and 2.4x (in SPECfp95) performance gains obtained from wider issuing and retirement
[59], the results suggest that aggressive ILP techniques are less efficient for SPECjvm98
applications than for workloads such as SPEC95. Several features of SPECjvm98
workloads help explain this poor speedup: The stack based ISA results in tight
dependencies between instructions. Also, the execution of SPEC Java workloads, which
involve JIT compiler, runtime libraries and OS, tends to contain more branches to
runtime library routines, OS calls, and exceptions. The benchmark db has a significant
idle component in the s1 data set, which causes the aggregate IPC to be low although
both kernel and user code individually exploit reasonable ILP.
c o m p r e je s s d b j a va c m t r t j a c k c o m p r e j e s s d b ja va c m t r t j a c k c o m p r e je s s d b ja va c m t r t j a c k0
0 . 5
1
1 . 5
2
2 . 5
3
S P : S i m p le P i p e l i n e d , S S : S u p e r s c a l a r
ILP
Sp
ee
du
p
S P4 - Is s u e S S8 - Is s u e S S
Total
Kernel User
Figure 3.7: ILP Speedup (JIT)
To give a more detailed insight, we breakdown the ideal IPC into actual IPC
achieved, IPC lost on instruction and data cache stall, and IPC lost on pipeline stall. We
use the classification techniques described in [72][59] to attribute graduation unit stall
time to different categories: a data cache stall happens when the graduation unit is stalled
by a load or store which has an outstanding miss in data cache. If the entire instruction
34

window is empty and the fetch unit is stalled on an instruction cache miss, an instruction
cache stall is recorded. Other stalls, which are normally caused by pipeline dependencies,
are attributed to pipeline stall. Figure 3.8 shows the breakdown of IPCs on four-issue and
eight-issue superscalar processors.
compress jess db javac mpeg mtrt jack0
0.5
1
1.5
2
2.5
3
3.5
4
IPC
compress jess db javac mpeg mtrt jack
0
1
2
3
4
5
6
7
8
IPC
D Cache Stall
I Cache Stall
Pipeline Stall
Actua
TKUTKUTKUTKUTKUTKUTKU TKUTKUTKUTKUTKUTKUTKU
l IPC
Figure 3.8: IPC Breakdown for 4-issue and 8-issue Superscalar Processors
(T: Total; K: Kernel; U: User, with s1 dataset and JIT compiler)
On four-issue superscalar microprocessor, one can see jess, db, javac and jack lost
more IPC on instruction cache stall. This is partially due to high indirect branch
frequency which tends to interrupt control flow. All studied applications show some IPC
loss on data cache stall. The data cache stall time includes misses for byte-codes during
compilation by the JIT compiler and those during the actual execution of compiled code
on a given data set. Figure 3.8 shows that a significant amount of IPC is lost due to
pipeline stalls and the IPC loss in pipeline stall on an eight-issue processor is more
significant than that of four-issue processor. This fact implies that the more aggressive
and complex ILP hardware may not achieve the desired performance gains on
SPECjvm98 due to the inherent ILP limitation of these applications. All applications
show limited increase in instruction cache IPC stall and data cache IPC stall on eight-
issue processor.
35

3.5 SUMMARY
This chapter has provided insights into the interaction of the emerging Java
workloads with the underlying system (both hardware and OS). The major findings from
this chapter are:
• The kernel activity of SPECjvm98 applications constitutes up to 17% of the
execution time in the large (s100) data set and up to 31% in the small (s1) data
set. Generally, the JIT compiler mode consumes a larger portion of kernel
services during execution.
• The SPECjvm98 benchmarks spend most of their time in executing instructions in
the user mode and spend less than 10% of the time in stall cycles during the user
execution. The kernel stall mode in all SPECjvm98 benchmarks, except jack that
has a significantly higher file activity, is small. However, the MCPI of the kernel
execution is found to be much higher than that of the user mode.
• The kernel activity in the SPECjvm98 benchmarks is mainly due to the invocation
of the utlb, read and demand_zero service routines. It is also observed that the
dynamic class-loading behavior influences the kernel activity more significantly
for smaller datasets (s1 and s10) and increases the contribution of the read service
routine.
• The average ILP speedup on a four-issue superscalar processor for the
SPECjvm98 benchmarks executed in the JIT compiler mode was found to be 1.81
times. Further it is found that the speedup of the kernel routines (average 1.44
times) is lower than that of the speedup of the user code (average 2.14 times).
• Aggressive ILP techniques such as wider issue and retirement are less effective
for SPECjvm98 benchmarks than for SPEC95. We observe that the performance
improvement for SPECjvm98, when moving from 4 issue to 8 issue width is 1.2
36

times as compared to the 1.6 times and 2.4 times performance gains achieved by
the SPECint95 and SPECfp95 benchmarks, respectively. The pipeline stalls due
to dependencies are the major impediment to achieving higher speedup with
increase in ILP issue width. Also, the SPECjvm98 workloads, which involve the
dynamic compiler, runtime libraries and the OS, tend to contain more control
transfers to runtime library routines and OS services.
37

Chapter 4: Run-time OS Power Estimation
This chapter characterizes the power behavior of a commercial OS across a wide
spectrum of applications to understand OS energy profiles and then proposes various
models to cost-effectively estimate its run-time energy dissipation. The proposed models
rely on a few simple parameters and have various degrees of complexity and accuracy.
Therefore, the models can estimate run-time OS power for run-time dynamic thermal and
energy management.
This chapter is organized as follows: Section 4.1 introduces software power
estimation techniques. Section 4.2 describes the challenges in OS power modeling.
Section 4.3 provides routine level OS power characterization. Section 4.4 proposes the
routine based OS power models and evaluates their estimation accuracies. Section 4.5
discusses the issues of applying the proposed model to run-time power estimation.
Finally, Section 4.6 concludes with some final remarks and comments.
4.1 SOFTWARE POWER ESTIMATION TECHNIQUES
In microprocessor-based systems, one can model power dissipation as a function
of the software (instructions) being executed on the underlying hardware platforms.
Software power estimation techniques from past literature can be sorted into the
following four categories:
4.1.1 Instruction Level Power Modeling
The instruction level power modeling [82] has been proposed to evaluate the
power dissipation of a given piece of software. The basic idea is to explicitly associate
the consumed power with individual instruction execution. An instruction level software
power model can be generally described as:
38

∑∑∑ +×+×=k
kjiji
jiii
i SNONBE )()( ,,
, (1),
where is the base energy cost to process the individual instruction .
reflects the dissipated power due to the circuit switching between each pair of
consecutively executed instructions . The term accounts for other energy
overhead due to the k-types of inter-instruction effects, such as write buffer stalls and
cache misses. For a given program, its overall energy cost,
iB i jiO ,
),( ji kS
E , can then be calculated by multiplying the and the O with the dynamic instances of the individual instruction
( ) and the instruction pair ( ) correspondingly.
iB ji,
iN ,iN j
To get and , an exhaustive power characterization of the entire ISA
(Instruction Set Architecture) and an inter-instruction effects measurement for any
possible instruction pairs have to be conducted. For example, for the Intel IA-32 ISA [32]
with 331 unique instructions, the number of possible instruction pairs need to be
measured are 109,561 ( 331 ), which makes the instruction level power characterization
effort non-trivial.
iB jiO ,
2
To compute power dissipation, the above methodology favors an off-line analysis
of the complete trace of the program. Although it is feasible to produce and store
complete instruction traces for the simple and embedded software, the volumes of
complete instruction traces from large applications would easily overwhelm the disk
space. Additionally, without significantly merging, approximation and therefore paying the cost of accuracy lost, it is infeasible to fit all the and into a small (hardware)
table for a live, just-in-time power estimation, a feature which is imperative to support many run-time power management. One solution is to store the and into a
software-based table and uses a dedicated software trap to trigger table lookup and then
compute power consumption. Unfortunately, this scheme can also significantly dilate the
iB jiO ,
iB jiO ,
39

execution time of an estimated program, due to the overhead of the software trap handler
and its invocations at individual instruction (or instruction sequence) granularity.
Therefore, run-time instruction level power modeling is intrusive and computation
intensive.
4.1.2 Characterization-based Macro-modeling
Instead of evaluating power at instruction level, software function level macro-
modeling techniques [79][68] treat application functions or sub-routines as “black boxes”
and construct macro-models that correlate power with a set of characteristics of interest.
Such power characteristics of interest can be obtained and collected by using a low-level
energy simulation framework [81]. Under this philosophy, a software function or sub-
routine’s power template can be represented by a linear formula with respective to the n
power interest metrics [ as: ],...,, 21 nccc
jj
j cwP ×= ∑ (2),
where are the macro-modeling coefficients to be determined.
Regression analysis is then applied to identify the optimal [ with the least
mean square fitting error based on a set of known input and output pairs.
],...,,[ 21 nwww
],...,, 21 nwww
The key issue on the above macro-modeling is how to choose [ , which
can effectively capture the power characteristics of a given software sub-routine under
various circumstances. In [79], Tan et al. suggested the use of algorithm complexity and
trace-based basic-block correlation information as the power metrics. These techniques
are proposed for embedded software and targeted for embedded processors. It should be
noticed that while embedded software like the DSP kernels have more intensive and
regular looping patterns, the operating systems which are designed to manage both
software and hardware systems can lead to far more complicated and unpredictable
],...,, 21 nccc
40

control flow [46][47] that can not be easily captured by a naive metric such as algorithm
complexity. The trace-based basic-block correlation analysis is more suitable for
processors that execute instruction in order [58]. The data dependency and speculative
execution effects have a more significant impact and greater variation in the case of wide-
issue and deeply pipelined superscalar processors. For example, even for exactly the
same input data set, speculative execution along the wrong path followed by a
mispredicted branch will cause more energy dissipation compared with the scenario that
has the correctly predicted control flow [52].
On the other hand, the use of basic-block correlation metric relies on storing
complete control flow graph (CFG) for each software sub-routine and counting the
number of each correlated path whenever that sub-routine is invoked. Like instruction
level power modeling, this macro-modeling technique necessitates off-line trace analysis
because finding basic-blocks and counting correlated paths will be computation intensive
and intrusive to the estimated software execution when they are applied to the on-line
power estimation. The feature of just-in-time power modeling necessitates the use of
simpler metrics.
4.1.3 Performance Counter-based Run-time Power Estimation
Run-time software power estimation [34][9] derives an estimate of live power
dissipation by leveraging the existing processor hardware and an analytical power model
of the target microprocessor. The idea is that the amount of power dissipated on software
execution is appropriate to the amount of accesses and switching activities within
processor units. Most modern microprocessors have already embedded programmable
event counters [12] to monitor microarchitectural events for the performance
measurement purpose. Heuristics can be chosen from the available counters to infer
41

power relevant events and further feed to an analytical processor power model to
calculate the power.
Joseph et al. [34] showed that the performance counters can be quite useful in
providing good power estimation for programs as they run. Considering about 12
performance measures, they estimated power within 2% of the actual power. However, in
general and for a given processor, the availability of heuristics is limited by the types of
the performance counters and the number of events that can be measured simultaneously.
For example, the Alpha 21264 has only 9 performance counters and the Intel Pentium III
processor can only simultaneously observe 2 out of the 77 total events. OS and many
large software are non-deterministic in nature and their behavior can vary significantly
over time and different runs [2]. Therefore, random sampling of counters with different
configured event types does not apply to the on-line OS energy profiling. On the other
hand, due to the “black box” power modeling approaches taken in [34][9], fine-grained
(e.g. function level) power distribution, which provides insight into the software power
behavior, is not available. Meanwhile, due to the observed drastic phase changes during
application execution [74], the accuracy of using a simpler, flat model to track the run-
time software power behavior is largely unknown.
4.1.4 Cycle-accurate Architectural Level Simulation
It has been widely accepted that circuit and gate level simulations are infeasible to
evaluate power consumption of large software executing on complex computing systems.
A complementary set of approaches is based on the use of cycle-accurate architectural
level power simulators [13][88][25]. Architectural level power simulations have been
shown to be applicable to modern superscalar processor (with deep pipelines, out-of-
order and speculative execution). However, cycle-accurate simulation causes simulation
speed to be extremely slow, preventing the efficiency of the design space searching. This 42

is especially true when simulating large and complex applications using detailed
processor models. Because of that, simulation based power model can not be used to
support run-time software power estimation.
Moreover, most of the existing architectural level power simulators (e.g. Wattch
[13] and SimplePower [88]) do not include the effect of the OS in their software power
analysis. The OS execution can either be invoked explicitly (e.g. system calls) or
implicitly (e.g. paging and faults handling) and the occurrence of the OS execution can be
either synchronous (e.g. timer interrupt) or asynchronous (e.g. scheduling). Therefore, the
power dissipation of OS due to its run-time, exception-driven and non-deterministic
nature can not be completely captured without using a power-aware, timing-accurate and
full-system simulation framework. In [25][80][17], such full-system energy simulators
are developed and the necessity of simulating OS energy is quantified. Detailed and full-
system simulation further suffers from potentially long run times when simulating
complete system activities using complicated processor, memory and I/O device
modules.
4.2 CHALLENGES IN OS POWER MODELING
For an OS power estimation technique to be applicable to run-time thermal/power
management, it must have the following properties:
• High fidelity and fast speed: The model should be able to estimate the OS energy
dissipation accurately. Power estimation should avoid the extremely slow cycle
by cycle full-system simulation as much as possible.
• Run-time estimation capability, non-intrusive and low overhead: The model
should support on-the-fly OS power estimation. The run-time power estimation
overhead should be low to avoid disturbing the normal OS execution.
43

• Simplicity, availability and generality: The model should only rely on a few
power metrics of interest that is widely available across different hardware
platforms.
This dissertation explores techniques to efficiently estimate OS power dissipation
while providing the above valuable features. The observation is that in a given computing
system, OS is a commonly used software layer exercised by all applications. OS power
dissipation is usually dominated by a set of limited but heavily invoked kernel service
routines. Just as instructions are the fundamental units of software execution, the OS
service routines can be though as the fundamental unit of OS execution. Provided that the
most frequently invoked OS service routines have the similar or predictable power
dissipation behavior across various benchmarks, one can evaluate the power
characteristics of these OS routines and use such information to derive the aggregated OS
power consumption across various applications. OS routine based power characterization
and estimation thus avoid the computationally expensive full-system simulation for each
estimated application.
4.3 ROUTINE LEVEL OS POWER CHARACTERIZATION
The complete system power simulator SoftWatt [25], which models the power
dissipation of the CPU, memory hierarchy and a low-power disk subsystem, is used to
investigate the power behavior of OS. The simulated microprocessor and system
configurations can be found in Table 2.2. The CPU model runs at 900 MHz on 2.0 V
supply voltage and uses 0.18 micron processing technology. The disk model is a SCSI
HP97560 incorporated with low power feature.
For the OS power modeling and estimation, the experimented benchmarks (as
shown in Table 2.1) are partitioned into two groups, namely, profiling and test. The
profiling group (pmake, gcc, vortex, javac, jack, mtrt, compress, postgres.join, db.s10, 44

jess.s10, javac.s10, jack.s10, mtrt.s10, compress.s10) is used to generate data needed to
build the models. The test group (sendmail, fileman, db, jess, postgres.select,
postgres.update, osboot) is used to examine the accuracy of the proposed models. The
test group was selected to contain some of the programs that contain significant OS
activity.
4.3.1 Power Behavior of OS Routines
The average power and its standard deviation for each OS routine across different
benchmarks are measured. As shown in Figure 4.1, these OS routines are classified into
interrupts, process and inter-process control, file system and miscellaneous services (see
Appendix A for more information).
0102030405060
utlbpfault
vfault
COW_fault
demand_zero
simscsi_in
tr
if_etin
tr
du_pollclock
Avg.
Powe
r (W
)
0246810121416
Std.
Dev.
(%)
Avg. Power (W) Std. Dev.(%)
0102030405060
exit
fork
getp
id
getu
idala
rm pipe
getg
id
exec
ve
sigre
turn
getso
cknam
e
getd
omain
name
setre
uidsp
rocpr
ctl
ksiga
ction
sigpr
ocm
ask
BSDsetp
grp
sigsu
spen
d
getco
ntext
setco
ntext
Avg
. Pow
er (W
)
024681012
Std
. Dev
. (%
)Avg. Power (W) Std. Dev.(%)
(a) Interrupts (b) Process and Inter-process Control
0102030405060
readwriteopen
closeunlin
klse
ek
acce
ss dupioctl
fcntl
getdents
xstat
lxstat
fxstat
Avg.
Pow
er (W
)
024681012
Std.
Dev
. (%
)
Avg. Power (W) Std. Dev.(%)
0
10
20
30
4050
60
brksyssgi
utssysulim
itmmap
mprotectmsync
getrlimit
cacheflush
waitsys
timein
time
Avg.
Powe
r (W)
024681012141618
Std.
Dev.
(%)Avg. Power (W)
Std. Dev.(%)
(c) File System (d) Miscellaneous Services
Figure 4.1: Average and Standard Deviations of OS Routines Power
(Standard deviations indicated on the right side y-axis in each graph)
45

One can see that there can be a great variance in power consumption between
different OS routines. For example, while the power dissipation on the OS copy-on-write
fault handler COW_fault is as high as 54W, the setreuid routine (set real and effective
user id) only consumes 14W of power. This implies that estimating the energy cost of
various OS calls without resorting to detailed simulation will cause measurable error.
Each OS service involves specific instruction processing across various units of
the processor, which results in circuit activity that is characteristic of each OS service and
can vary with OS services. Memory access intensive OS routines, such as vfault,
COW_fault, demand_zero, cacheflush show higher power consumption than computation
intensive services, such as utlb and clock. Some I/O interrupts (simscsi_intr and if_etintr),
process scheduling (getcontext), file I/O (fcntl, lseek and getdents) show higher standard
derivation in power consumption because their execution is largely dependent on system
status. On the other hand, OS routines such as utlb, utssys and cacheflush perform certain
amount of work in each invocation, resulting in negligible power consumption variation.
Figure 4.2 further reveals the run-time routine-level OS energy distribution across
different benchmarks. The x-axis indicates the serial numbers of unique OS service
routines and the y-axis shows the percentage of run-time OS energy dissipated by that
specific OS routine. In this study, a total number of 186 OS service routines were
identified. Figure 4.2 shows that different benchmarks invoke different OS services and
hence show different energy distribution patterns. For example, on benchmarks filename,
db, jess and postgres.select, the OS energy dissipation is dominated by a small fraction of
highly invoked service routines while on benchmarks sendmail, postgres.update and
osboot, OS energy consumption is contributed by a wide range of service routines. The
above observation, combined with the fact that individual routine shows different power
behavior, implies that: (1) overall, the OS power behavior can vary from one application
46

to another; (2) the use of single “average OS power” number across various applications
will lead to significant estimation errors.
sendmail
0%
2%
4%
6%
8%
10%
12%
1 100 199Unique OS Service Routine
Serial No.
% in
Tot
al
Diss
ipat
ed E
nerg
y fileman
0%
10%
20%
30%
40%
50%
1 100 199Unique OS Service Routine
Serial No.
% in
Tot
al D
issi
pate
d En
ergy
db
0%
10%
20%
30%
40%
50%
1 100 199Unique OS Service Routine
Serial No.
% in
Tot
al D
issi
pate
d En
ergy
jess
0%
10%
20%
30%
40%
1 100Unique OS Service Routine
Serial No.
% in
Tot
al D
issi
pate
d En
ergy
199
postgres.select
0%
10%
20%
30%
40%
50%
60%
1 100 199Unique OS Service Routine
Serial No.
% in
Tot
al
Diss
ipat
ed E
nerg
y postgres.update
0%
10%
20%
1 100 199Unique OS Service Routine
Serial No.
% in
Tot
al
Diss
ipat
ed E
nerg
y osboot
0%
10%
20%
1 100Unique OS Service Routine
Serial No.%
in T
otal
Dis
sipa
ted
Ener
gy
199
Figure 4.2: Routine Level Energy Distributions in OS
4.3.2 Energy-Performance Correlation
Figure 4.3 further shows how a set of OS routine’s power varies on different
profiling benchmarks. In the cases of utlb and cacheflush, the OS power varies in a very
restricted range. However, on simscsi_intr, the OS routine power can span with in a range
from 8W to 59W. Interestingly, we observe that OS routine’s power is strongly correlated
with its performance. We investigate the use of IPC (Instructions per Cycle) as the metric
to characterize the performance of modern processors, as pointed out in [61]. Valluri [84]
and Chen [17] also had observed a similar correlation.
The explanation for this correlation lies in the fact that in a complex, high
performance superscalar processor, a dominant portion of the power is consumed by
circuits used to exploit the ILP. The pie chart in Figure 4.4 shows how various
components in the CPU and memory systems contribute to the total OS routine power.
47

Data-path and pipeline structures, which support multiple issue and out-of-order
execution, are found to consume 50% of total power on the examined OS routines. Figure
4.4 shows that clock is the second largest power consuming component: the capacitive
load to the clock network switches on every clock tick, causing significant power
consumption.
0.9 0.95 1 1.05 1.127
28
29
30
31
32
33
IPC
Ave
rage
Pow
er(W
att)
utlb
1 1.1 1.2 1.3 1.4 1.530
35
40
45
50
55
IPC
Ave
rag
e P
ow
er(W
att)
cacheflush
0 0.5 1 1.5 20
10
20
30
40
50
60
70
IPC
Ave
rage
Pow
er(W
att)
simscsi_intr
0 0.5 1 1.5 20
10
20
30
40
50
60
IPC
Ave
rage
Pow
er(W
att)
demand_zero
0 0.5 1 1.5 20
10
20
30
40
50
60
70
IPC
Ave
rage
Pow
er(W
att)
read
0 0.5 1 1.5 20
10
20
30
40
50
60
IPC
Ave
rage
Pow
er(W
att)
lseek
Figure 4.3: Correlation between OS Routines Power and IPC
Clock34%
L-1 Cache14%
L-2 Cache
1%
Memory1%
Datapath &
Pipeline50%
Figure 4.4: Breakdown of Power Dissipation of OS Routines
48

The energy consumed in data-path during execution usually depends on the
number of instructions that flow through. The ILP performance measured by IPC,
certainly impacts circuit switching activities in those microprocessor components and can
result in significant variation in power. High IPC reflects the scenario in which most of
the processor structures are busy. On the other hand, main pipeline stalls or bubbles,
which lead to low IPC and can be easily clock gated, will drastically reduce power
dissipation. For a given piece of code, similar IPC usually indicates similar circuit
switching activities and therefore, similar power consumption.
The above correlation implies that one can use a simple linear regression model
01 kIPCkP +×= (3),
to track the OS routine power showing different performance. Appendix A lists the
regression model parameters ( and the regression model fitting errors for the
examined OS routines.
), 01 kk
4.4 ROUTINE LEVEL OS POWER MODEL
This section presents routine level profiling based energy estimation models. The
objective is to provide simple and easily computable techniques that can be used for run-
time energy estimation of operating system software.
Energy consumption of a given piece of software can be estimated as: ,
where P is the average power and T is the execution time of that program. If average
power of different OS routines can be determined, it can be used to compute the OS
energy. A routine level OS energy estimation model can be represented as:
TPE ×=
)( ,_,_ iroutineos
iiroutineosOS TPE ×= ∑ (4),
where is the power of the iiroutineosP ,_ th OS routine invocation and T is the
execution time of that invocation.
iroutineos ,_
49

The can be computed in many ways. It can be an average power based
on all invocations of that routine in the programs (as shown in Figure 4.2). Figure 4.5
illustrates the accuracy of this estimation model. The profiling based average power
values at the routine level are found to yield estimation errors within 5% in 6 out of the 7
test benchmarks. On benchmark fileman, however, this scheme can underestimate the OS
power by as much as 32%.
iroutineosP ,_
-32%
-30% -20% -10% 0%
sendmail
fileman
db
jess
postgres.select
postgres.update
osboot
Estimation Error (%)
Figure 4.5: Model Estimation Accuracy (Routine Average Power)
Exploiting the interesting observation presented in section 4.3.2 on the correlation
between IPC and OS routine average power, this research investigates the potential of
this correlation in estimating energy consumption of programs based on IPC. This
approach is similar to the one used in [34], where approximately a dozen performance
counters are used to estimate power. However, the model proposed here only utilizes 2
pieces of information, namely, instruction count and cycles. Also, it uses a profiling
approach by which information based on some benchmarks can be used to predict the
energy of a different application. To investigate the usefulness of this approach, we use
per-routine based OS power models built on profiling benchmarks (Appendix A) to
50

estimate OS power on the test benchmarks. The accuracy of the energy estimation is
within 1% (as illustrated in Figure 4.6).
-2%
-1%
0%
1%
2%
send
filem
an db jess
post
gres
.selec
t
post
gres
.upd
ate
osbo
ot
Estim
atio
n Er
ror (
%)
Figure 4.6: Estimation Accuracy (IPC Correlated Routine Average Power)
If instead of routine-based estimation, a flat average is used, the errors are high.
This approach is also used to estimate energy of OS execution on the test programs. Not
surprisingly, Figure 4.7 illustrates that there is 20% to 50% error if energy is estimated
with a flat average OS power for all programs. Therefore, the paradigm of blindly
treating the OS as monolithic software is unlikely to yield highly accurate estimation.
-50% -40% -30% -20% -10% 0%
sendmail
fileman
db
jess
postgres.select
postgres.update
osboot
Estimation Error (%)
Figure 4.7: Model Estimation Accuracy (OS Average Power)
51

4.5 RUN-TIME OS POWER MODELING
As discussed in section 4.2, live power estimation is valuable for run-time power
management and optimizations. The proposed routine level power estimation technique
characterizes the power behavior of each OS routine at profiling stage and uses that
information to compute the run-time power dissipation. The overhead of estimation is the
computation needed for a first order linear processing of the IPC at OS routine
boundaries, which is low.
The linear regression model parameters can be stored in a smaller look-up table
and the OS can dynamically compute power and energy at run-time. If the routine of
interest is not found in the table, a single performance correlated average power
number can be used. The maximum error that could occur by using such an approach
is shown in Figure 4.8. Generally, the OS power correlates well with IPC and the
cumulative power estimation error using the power model is seen to
yield errors less than 10%.
OSP
01 osOS kIPCkP +×=
0.8 0.9 1.0 1.1 1.2 1.3 1.4 1.520
25
30
35
40
45
50
IPC
Ave
rage
Pow
er(W
att) P= 36.7 × IPC - 5.95
-15%
-10%
-5%
0%
5%
10%
15%
send
mai
l
filem
an db
jess
post
gres
.sel
ect
post
gres
.upd
ate
osbo
ot
Estim
atio
n Er
ror (
%)
(a) Regression Model: 01 kIPCkP osOS +×= (b) Estimation Errors
Figure 4.8: OS Power Estimations (Single Power/IPC Correlation Model)
52

In some cases, cumulative (average) power estimation is insufficient and power
has to be modeled and estimated on a fine-grained basis. Generating accurate and fine
grained power estimation of an OS on a given system is important to computer architects
as well as OS developers who need insight into machine’s power efficiency to tune their
code.
(a) Single Regression Model (b) Routine based Regression Models
Names of OS Service Routines1:utlb 2:pfault 3:vfault 4:COW_fault 5:demand_zero 6:timein 7:simscsi_intr 8:if_etintr 9:du_poll 10:clock 11:fchmod 12:exit 13:fork 14:read 15:write 16:open 17:close 18:unlink 19:time 20:brk 21:lseek 22:getpid 23:getuid 24:alarm 25:access 26:syssgi 27:dup 28:pipe 29:getgid 30:ioctl 31:utssys 32:execve 33:fcntl 34:ulimit 35:getdents 36:sigreturn 37:getsockname 38:getdomainname 39:setreuid 40:sproc 41:prctl 42:mmap 43:mprotect 44:msync 45:BSDsetpgrp 46:getrlimit 47:cacheflush 48:xstat 49:lxstat 50:fxstat 51:ksigaction 52:sigprocmask 53:sigsuspend 54:getcontext 55:setcontext 56:waitsys 57:setrlimit
Figure 4.9: A Comparison of Run-time Per-routine based Estimation Error
To evaluate the run-time suitability of the proposed routine level power modeling
approach, this chapter performed a comparative study of the flat and routine level power
modeling schemes in terms of per-module accuracy. As it can be seen, routine level
modeling (Figure 4.9b) consistently produces results that are less than 6% away from the
exact, cycle-accurate values, while the flat model (Figure 4.9a) scheme can generate up to
178% error in some cases. Modeling power behavior at OS service routine level
drastically reduces the run-time estimation error, implying the good power tracking
ability of this model. On the other hand, building single model for the whole operating 53

system, although achieves acceptable cumulative power estimation accuracy, can lead to
measurable estimation error when applied to track the fin-grained run-time power
behavior. This fact implies that the “black box” power modeling approaches taken in
[34][9] are unlikely to be effective for run-time power tracking.
As described earlier, many hardware platforms have restrictions on the member of
counters that can be configured simultaneously to count events. Therefore, a good power
model should rely on minimal number of hardware event counters but must still maintain
high accuracy. Table 4.1 lists energy accounting mechanisms [9] that rely on 2, 3, 5, and
7 types of counters respectively. For example, the 5-CS uses 5 hardware counters,
namely, cycles, graduated instructions, L1 data cache accesses, L2 data cache accesses
and main memory references to build regression power model and evaluate power.
Table 4.1: Hardware Counter Schemes
Schemes Events 2-CS 3-CS 5-CS 7-CS
Cycles + + + + Graduated + + + + L1-D Cache + + + L1-I Cache Accesses + L2-D Cache + + L2-I Cache Accesses + Main Memory + +
Figure 4.10 compares the estimation accuracy of the proposed routine level OS
power model that uses 2 counters (RL 2-CS) with flat modeling schemes that rely on
more hardware counters. While the 3-CS, 5-CS and 7-CS outperform the 2-CS scheme in
some cases in terms of accuracy, they show unpredictable behavior, depending on the
benchmarks. The RL 2-CS scheme is the only one that offers consistent low error. One
can see that the RL 2-CS model outperforms the flat regression models that use more
54

hardware counters, indicating the benefit of combining hardware and software knowledge
in energy modeling.
-15
-10
-5
0
5
10
15
sendmail
fileman
db jess
postgres.select
postgres.update
osbootEs
timat
ion
Erro
r (%
) 2-CS3-CS5-CS7-CSRL 2-CS
Figure 4.10: A Comparison of Different Hardware Counter Schemes
The proposed technique requires initial energy profiling of OS routines, which
necessitate a full-system power-aware simulator such as SoftWatt [25]. However, the
models described in this paper are independent of the actual method used to profiling. If
sophisticated data acquisition based measurements are available, the measurement
method can be used. The OS routine level power characterization is computation
intensive. However, the power estimation does not require power simulation once that
information is built, making it outperform other simulation-based approaches in terms of
efficiency. The scheme also needs run-time measurement of cycles and IPC. All high-end
microprocessors provide these counters and hence obtaining the information is not a
problem, making it generally applicable to all hardware platforms. The run-time OS
power estimation involves a first order linear operation on a single power metric,
reducing estimation overhead.
4.6 SUMMARY
Modern computer systems are characterized by the presence of high performance,
general-purpose processors and software (OS and user applications) running on it. Power
55

modeling is increasingly becoming a critical issue during system designs, as well as run-
time power/performance optimizations.
This chapter proposes power models for the OS, a major power consumer in many
modern application executions. The proposed models rely on a few metrics of interest for
power evaluation. Profiling of several Java, Database, file/e-mail workloads illustrated a
strong correlation between IPC and OS routine power. Exploiting this correlation, we
built a model to estimate energy consumption of OS activity. Profiling done on one set of
programs is used to estimate energy of another set of programs and yields a high
accuracy within 1%. The proposed routine level power model not only offers superior
accuracy when compared to a simpler, flat OS power model, but also provides per-
routine estimation errors of less than 6% when applied to track the run-time OS energy
profile.
The integrated OS performance/power characterization not only leads to efficient
power estimation for OS-intensive applications but also provides hint to reduce OS power
consumption. Having known the routine based power dissipation behavior, hardware can
be adapted for power minimization. For example, to save power, the size of a banked
instruction window or reorder buffer can be dynamically reconfigured when OS routines
with low IPC are detected. In another scenario, dynamic voltage scaling or frequency
throttling can be applied to the OS code that performs intensive I/O when the processor
ILP dose not really matter.
56

Chapter 5: OS Power Saving
This chapter advocates a routine based OS-aware microprocessor resource
adaptation mechanism to save run-time OS power. This approach permits precise
hardware reconfigurations for the OS with low overhead and allows fine-grained
performance/power tuning at microarchitectural level.
5.1 PROGRAM PHASES AND IPC VARIANCE
This chapter explores the adaptation of processor resources to reduce OS power
on today’s high-performance superscalar processors, which exploit aggressive hardware
design to maximize performance across a wide range of targeted applications. It has been
observed that program’s computational requirement, generally measured by the
instruction per cycle (IPC), varies during its execution [3]. By tuning processor resources
to be appropriate to the actual needs of the program, significant power savings can be
achieved with minimal impact on performance. Figure 5.1 illustrates the IPC variation
over time for jess, a SPECjvm98 Java benchmark [35] running on an 8-issue superscalar
processor. The benchmark’s IPC varies from as low as nearly zero to as high as five,
indicating the significant discrepancy in computational requirement during its execution.
0123456
0.00 0.07 0.13 0.20 0.26Execution Time (seconds)
IPC
Figure 5.1: IPC Variation in the SPECjvm98 Benchmark jess
57

One factor that contributes to the widely varying IPC is the frequent OS activity:
the ILP in the OS has been found to be much lower than user applications
[70][38][45][17]. The nature of OS code limits the available instruction level parallelism.
For example, to maximize the amount of time the peripheral has to clear the interrupt
before the processor executes the interrupt return sequence, the OS usually uses a
serializing instruction between a LOAD/STORE and an IRET (interrupt return
instruction) to force a LOAD before the IRET. In another scenario, the OS uses caches to
speed up reads, but it requires synchronous disk I/O for operations that modify files. A
serializing instruction requires that all other instructions in the pipeline complete before it
executes. Moreover, many architectures treat privilege instructions, such as move to/from
special register, TLB management, explicit cache operations, and interrupt/exception
return, as serialization instructions. Processor switches mode to OS upon handing an
exception or interrupt or upon handling a TRAP instruction (usually used to implement
all system calls by OS), which all raises an exception. To handle precise exceptions, the
processor pipeline must drain before OS code execution can begin. Serializing
instructions, interrupts and privilege level changes may spend considerable cycles in
execution, forcing the decoder to wait and increasing the resource stalls, limiting the
available ILP. The OS IPC is much lower than the user IPC, implying that the OS does
not exploit the superscalar capabilities provided by the wide-issue, aggressive processor
as efficiently as user code does.
Today’s high-performance microprocessor designs attempt to push the
performance envelope by employing aggressive out-of-order execution mechanisms [61].
As a result, in a complex, high performance superscalar processor, circuits used to exploit
the ILP consume a dominant portion of the power [64][84]. The ILP performance
measured by IPC, certainly impacts circuit switching activities in those microprocessor
58

components and can result in significant variation in power. High IPC reflects the
scenario in which most of the processor structures are busy. On the other hand, main
pipeline stalls or bubbles, which lead to low IPC and can be easily clock gated, will
drastically reduce power dissipation.
Table 5.1: OS IPC and Power
1-issue 2-issue 4-issue 6-issue 8-issue IPC 0.88 1.09 1.15 1.19 1.21
Power (W) 6.4 12.2 21.7 31.1 42.8
To reduce power, hardware can be dynamically adapted to provide appropriate
resource to the program’s computational demand. Table 5.1 shows the OS IPC and power
consumption (average over all benchmarks) on 8-issue, 6-issue, 4-issue, 2-issue, and 1-
issue machines respectively. It can be seen that by reducing processor resources, the 4-
issue machine saves 49% of power with a performance loss of only 5%. The OS IPC does
not scale well with the increasing superscalar capability, making it ideal candidate for
resource adaptation. Given the assumption that the OS execution can be timely and
accurately detected, significant power savings can be achieved (with tolerable
performance penalty) by catering appropriate processor computational resource that
matches the OS requirement.
Current adaptation techniques [5][64][20][33] rely on periodic sampling to match
program computational requirement with processor resources. However, research in this
chapter shows that resource adaptation based on sampling window becomes less efficient
when applied to the exception-driven and short-lived OS execution [47]. Moreover, for
large and sophisticated programs like OS, a naïve sampling scheme does not guarantee
the optimal solution when both energy and performance are under consideration.
Therefore, this chapter advocates a routine based OS-aware microprocessor resource
adaptation scheme. The rationale is that although modern operating systems are large
59

sophisticated software, their complexities are hidden behind a relatively simple interface -
a set of OS kernel service routines, which provides a common interface to exercise the
OS. The power and performance knowledge of different OS routines can be characterized
then exposed to the hardware to finely tune the power/performance knob of the OS at
run-time.
The proposed innovative technique ensures that processor resources match to the
computational demands of the OS in a timely and optimal fashion yet with low overhead.
Compared with existing techniques, the proposed scheme has the following advantages:
(1) OS-aware resource adaptation guarantees the timely and fine-grained resolution
required to capture the exception-driven, short-lived OS activity. (2) Adapting processor
resources only at OS routine boundaries largely eliminates reconfiguration latency. (3)
Routine based adaptation selects the optimal configuration for individual routine,
yielding more attractive power and performance trade-off. (4) Aggressive optimizations
can be safely applied to certain OS routines to further save energy without degrading
performance.
This chapter is organized as follows: section 5.2 presents a based line sampling-
adaptation scheme and demonstrates the challenges in sampling OS activity. Section 5.3
proposes the routine based OS-aware microarchitecture adaptation scheme and discusses
its benefits. Section 5.4 presents performance and energy-efficiency evaluation results.
Section 5.5 discusses related work. Section 5.6 concludes with some final remarks.
5.2 SAMPLING BASED ADAPTATION: CHALLENGES FOR OS
In prior research, the run-time periodic sampling of measurable metrics (e.g., IPC)
has ubiquitously been used to estimate program computational demand and to guide the
adaptations. In the sampling based techniques, program execution cycles are partitioned
into fixed period intervals as in Figure 5.2. The duration of each interval is called a 60

sampling window. The performance metric, such as IPC, is measured within a sampling
window to estimate the program computation demand for the next execution interval
window. At the boundaries of each sampling window, adaptation decisions are made.
Cycles
SamplingWindow
IPC (Inst. Per Cycle)
Adaptation
A B C D E F CyclesCycles
SamplingWindow
IPC (Inst. Per Cycle)
Adaptation
A B C D E F
Figure 5.2: Sampling Window
Current sampling-adaptation approaches [5][33] use a finite state machine (FSM)
to specify the transitions between different configurations. For example, Figure 5.3 shows
a FSM for transitioning between the normal mode (8-issue) and the low power modes (6,
4, 2 and 1-issue) described in Section 5.3. The enabling (ExI) and disabling conditions
(DxI) and the IPC thresholds are set and extended according to the one proposed by
Bahar et al. [5]. For example, the enabling conditions for entering the 4-issue mode are
E4I or !D4I&!E2I or E4I&!E2I&!E1I respectively. In this chapter, this adaptation technique
is considered as the baseline scheme. 1: !E6I&!E4I&!E2I&!E1I 2: E6I&!E4I&!E2I&!E1I 3: !D6I&!E4I 4: E4I 5: !D4I&!E2I 6: E2I 7: !D2I&!E1I 8: E1I 9: !D1I 10: D6I 11: D4I
2issue
1issue
8issue
4issue
6issue
1
2
3
4
8
5
6
7 9
16
15
14
13
10
11
12
12: D2I
E6I : IPC<4.5 D6I : IPC>5.0 13: D1I E4I : IPC<3.0 D4I : IPC>3.2 14: E4I&!E2I&!E1I E2I : IPC<1.5 D2I : IPC>1.8 15: E2I&!E1I E1I : IPC<0.5 D1I : IPC>0.8 16: E1I
Figure 5.3: FMS used in Sampling based Adaptation
(Trigger Conditions and Thresholds are set and extended according to [5])
61
At run-time, the estimated program IPC within the previous sampling window
serves as the input of FMS to choose the configurations for the current interval, as shown
in Figure 5.2. The basic premise of this sampling algorithm is that past program behavior
indicates its future needs. The sampling window period (T ) determines the finest
granularity at which program phase changes can be resolved. Generally, T has to be
small enough to capture the changes of program behavior.
s
s
In practice, accomplishing an adaptation can cause performance penalty (latency
marked as T in Figure 5.4). In the superscalar processor design, IW, LSQ and ROB are
implemented with partitioned structure [20]. A reconfiguration has to guarantee that there
are no instructions left on the partitions that will be deactivated. Additional care must be
taken in resizing the ROB and LSQ because of their circular FIFO like structure [64].
Due to these restrictions, whenever an adaptation decision is made, the dispatch unit
stops pumping instructions into the IW, LSQ and ROB until all existing instructions are
drained out from the partitions to be turned off. This pipeline flushing like action can take
a non-trivial amount of time, depending on the number of instructions already in pipeline
and the cycles for them to complete [33]. Moreover, compared with single mode only
execution, adaptations introduce extra latency due to pipeline warm-ups after the
reconfigurations. As shown in Figure 5, reducing sampling window period (
a
sh TT << )
offers capability to capture fine-grained phase changes in execution. However, the
aggregated adaptation overhead can be prohibitive. This fact prevents the use of small
sampling window without significantly slowing down program execution. In [64], a
sampling window of 2048 cycles is set. In [33], an even larger resizing period is chosen
for the entire program hotspot, which could take several million cycles.
62

OS UserUser OS User
User User UserOS OS User
sampling window
smaller samplingwindow
I II IIITa
Ts
Th
Figure 5.4: Implications of Sampling Window Sizes
At run-time, user and OS execution appear alternately within the sampling
windows, as shown in Figure 5.4. The IPC discrepancy between user and OS indicates
the different computational requirement when the user/OS context switches. When
program phase shifts (e.g., due to user/OS interactions), the prior interval becomes a poor
estimate for the next.
In the traditional and performance-centric OS design, highly optimized
lightweight routines (e.g., faults and interrupt handlers) are usually implemented in order
to keep the cycles down. Figure 5.5 characterizes the average duration in cycles of
individual OS service (Note that the y-axis uses logarithmic scale). One can see that
many OS service routines show short-lived execution period. Theoretically, given a
sampling interval of T , in order to accurately capture the phase shift caused by an OS
service and exploit the adapted configuration for at least another sampling interval, the
duration of that OS service T should be at least cycles, i.e. T .
s
osd sT2 sosd T2≥
Figure 5.5 shows that there are only 16 OS routines satisfy the above condition on
the duration ( 4096 cycles) required by the 2048 cycles sampling interval, a commonly
used window granularity to avoid the costly reconfiguration overhead. Figure 5.6 further
illustrates how OS service routines with different duration contribute to the total OS
energy dissipation (Note that the x-axis uses logarithmic scale). It is observed that even
though some OS services are very efficiently implemented from the execution cycle
≥
63

viewpoint, those lightweight OS services can have significant impact on the total OS
energy. For example, on benchmark postgres.update, the OS service routines with
duration less than 4096 cycles draw 50% of the OS energy. As described earlier, a
sampling window which is larger than 2048 cycles can not guarantee to resolve these OS
activity and adapt processor resource timely to reduce that portion of OS energy (shown
on the left side of the dotted line in Figure 5.6).
1 10 100 1,000 10,000 100,000
utlb
pfault
vfault
COW_fault
demand_zero
timein
simscsi_intr
if_etintr
du_poll
clock
syscall
exit
fork
read
write
open
close
unlink
Duration (in Cycles)
4,096
1 10 100 1,000 10,000 100,000
time
brk
lseek
getpid
getuid
alarm
access
dup
pipe
getgid
ioctl
utssys
execve
fcntl
getdents
sigreturn
tsockname
sproc
Duration (in Cycles)
4,096
1 10 100 1,000 10,000 100,000
prctl
mmap
mprotect
msync
getrlimit
cacheflush
fchmod
sysinfo
xstat
lxstat
fxstat
ksigaction
sigprocmask
sigsuspend
getcontext
setcontext
waitsys
Duration (in Cycles)
4,096
Figure 5.5: Average Duration of OS Services
(x-Error Bars Show the Maximum and Minimum Cycles)
64
To summarize, a long window interval does not provide the opportunity to switch
mode when the program phases change due to the exception-driven, non-deterministic
and short-live nature of user/OS interactions. On the other hand, the fine-grained
switching required by the brief OS invocations makes it difficult to amortize the
performance degradation due to the frequent adaptations. To reconfigure processor
resource for the short-lived OS activity without rising costly adaptation overhead, this
chapter proposes a routine based OS-aware processor adaptation mechanism targeting on
the run-time OS power savings, as described in the next section.

0%10%20%30%40%50%60%70%80%90%
100%
10 100 1,000 10,000 100,000Duration of OS Services (in Cycles)
Acc
umul
ativ
e O
S En
ergy
pmakegccvortexsendmailfilemandb
4,096 0%10%20%30%40%50%60%70%80%90%
100%
10 100 1,000 10,000 100,000Duration of OS Services (in Cycles)
Acc
umul
ativ
e O
S En
ergy
jessjavacjackpostgres.selectpostgres.updateosboot
4,096
Figure 5.6: Accumulative OS Energy vs. OS Service Duration
5.3 THE PROPOSED SOLUTION: OS-AWARE ROUTINE BASED ADAPTATION
Routine based OS-aware adaptation dedicates to reconfigure processor upon the
OS execution. Modern microprocessors and OS provide two separate modes of operation:
user mode and privileged mode. Processor executes user processes in user mode.
Whenever the OS is invoked, the hardware switches to privileged mode. The OS always
switches back to user mode before passing control to a user program. The current
machine execution mode is stored in the Processor Status Register (PSR). Therefore,
separating out OS execution can easily be done at run-time by looking the PSR.
Processor adaptations occur only at the boundaries of the user/OS context switches, as
shown by Figure 5.7. Today, almost all high-performance, out-of-order machines support
precise exception to ensure the correctness of program execution. The OS invocations,
either explicitly (e.g. system calls and I/O interrupts) or implicitly (e.g. fault handling)
are treated as exceptions on these processors. Upon receiving an exception, the processor
completes all previous instructions (specified in program order) and then flushes the
pipeline [27]. At this point, a reconfiguration can be made with zero latency because
there is no instruction left in the pipeline and the partitioned hardware structures.
Similarly, when the processor returns from an OS service, another adaptation happens 65

immediately by restoring the processor to the mode prior to the user/OS context switch.
The processor then fetches the instructions from the user applications and continuously
executes using that mode.
disablesampling
User User UserOS OS User
disablesampling
User UserOS OS User
sampling window
dilated sampling windowAdaptationoverhead
I II IIITa
Ts
OS Routine-basedOptimal Adaptations
Adaptations withMinimum Overhead
Figure 5.7: Routine based OS-aware Adaptation
Therefore, routine based OS-aware adaptation is capable of capturing all OS
activity timely and accurately, while retaining a zero adaptation overhead in the OS.
Separating OS activity out of the regular sampling interval creates the “dilated” sampling
window (as shown in Figure 5.7), diminishing the number of reconfigurations and the
total execution cycles of the user program. Moreover, this technique prevents
pathological IPC degradations arising from erroneously matching processor
configurations catered for OS to user program’s requirement (as shown in Figure 5.7,
window II and III). This is critical since user program after the context switched from OS
generally requires the full issuing capabilities of the machine to operate on new data and
working set.
As described earlier, processor resource adaptation saves power and is detrimental
to performance. The goal of such adaptation is to reduce power with the minimum
performance lost. The Energy-Delay product (EDP) is a reasonable metric to evaluate
energy efficiency, namely, the goal of achieving high performance while minimizing
energy consumption. However, due to the different characteristics of programs, a solution
that is good for one program may not turn out to be the optimal one for another program.
66

For example, as illustrated in Figure 5.8, given the power budget (Powerth),
Energy×Delay Tradeoff-1 (T1) works better than Energy×Delay Tradeoff-2 (T2) does on
program 1 (Perf11>Perf12). However, the observation does not hold on program 2
(Perf21<Perf22).
Performance
Pow
er
Program1(T1)Program1(T2)Program2(T1)Program2(T2)
Perf 11
Perf 21
Perf 22
Perf 12
Power th
Figure 5.8: Effectiveness of Energy×Delay Tradeoffs is Program Dependent
Individual OS routine performs specific functionality and can exhibit vast
variation in computational requirement. A configuration that is good for one routine code
may not turn out to be optimal for another. For example, Figure 5.9 shows the
Energy×Delay (normalized with 8-issue mode) of different OS service routines (clock,
COW_fault and read) running on different modes. Clock processes timer interrupt.
COW_fault performs page level copy-on-write operations and read transfers data from
OS file cache to the user address space. Figure 5.9 leads to a number of interesting
observations. In general, the 8-issue mode is not energy efficient by showing the highest
Energy×Delay on all of the three OS routines. The application of the 1-issue, 2-issue, 4-
issue and 6-issue modes yields better trade-off between power and performance. More
interesting, the optimal configuration (with the lowest Energy×Delay value) changes,
depending on the OS routines. For example, on the 1-issue mode, the clock shows its best
Energy×Delay scenario (0.3), while the COW_fault yields an Energy×Delay value of 0.8.
67

0
0.2
0.4
0.6
0.8
1
clock COW_fault read
Nor
mal
ized
Ene
rgy-
Del
ay P
rodu
ct 1-issue2-issue4-issue6-issue8-issue
Figure 5.9: Energy×Delay of Different OS Services
Figure 5.10 further shows the Energy×Delay ranking of different modes across a
wider range of the OS routines we characterized. In Figure 5.10, Energy×Delay values of
all modes (i.e., 1i, 2i, 4i and 6i) are ranked on the per OS service basis. We omit the 8-
issue because it always shows the highest Energy×Delay value.
The heterogeneous Energy×Delay behavior of various OS routines makes a
unified adaptation for the whole OS less attractive. However, it provides an avenue to
finely tune the OS power/performance knob: the per-OS routine based optimal
configuration can be exposed to and exploited by the hardware to achieve a better OS
Energy×Delay trade-off. In practice, a simple profile-driven methodology [53] can be
used for finding the optimal configuration for individual routine in a pre-characterization
stage. At run-time, the hardware selectively applies the pre-characterized, optimal
configuration to individual OS routine instantaneously, eliminating a search of the
configuration space. The optimal adaptation solution can be encoded into each routine
with ISA extension. A performance degradation tolerance setting that specifies how
aggressively to tradeoff additional delay for lower energy can be used to guide
configuration selection.
68

1i 2i 4i 6iutlb
pfaultvfault
COW_faultdemand_zero
timeinsimscsi_intr
if_etintrdu_poll
clocksyscall
exitforkread
writeopenclose
unlink
1i 2i 4i 6itimebrk
lseekgetpidgetuidalarmaccess
duppipe
getgidioctl
utssysexecve
fcntlgetdents
sigreturngetsockname
sproc
1i 2i 4i 6iprctl
mmapmprotect
msyncgetrlimit
cacheflushfchmodsysinfo
xstatlxstatfxstat
ksigactionsigprocmask
sigsuspendgetcontextsetcontext
waitsys
E-D Product: < < <
Figure 5.10: Routine Based Energy×Delay Ranking of Different Modes
Having known the nature and functionality of an OS invocation, one can apply
Energy×Delay optimizations even more aggressively. This chapter considers the
following two optimizations (dubbed as OS-aware SDPT w/AO in section 5.4):
• Resizing Register File
Modern superscalar machines exploit register renaming and use large register file
to eliminate false dependencies between instructions. In many hand-tuned and highly
optimized OS routines, however, the true dependencies dominate. In these scenarios, the
size of the physical register file can be reduced to save more power. Specifically, we
observe that disabling half of the physical registers for OS routines utlb, timein, clock,
close, brk, alarm, dup, pipe, ioctl, utsys, prctl, and msync saves 5% - 7% of the processor
power with no performance loss [49]. Generally, the additional complexity for resizing a
register file greatly diminishes the likelihood to do so [20]. The proposed routine based
OS-aware adaptation scheme can safely and efficiently resize the register file because it
guarantees that no physical register is mapped whenever a resizing occurs at the user/OS
context switch boundaries.
69

• OS-aware Control Flow Speculation
Control flow speculation has been widely adopted in today's microprocessor
design to exploit the ILP in programs. Nevertheless, the fetches and subsequent
processing of misspeculated instructions will waste more energy and cycles [52]. It has
been observed that the conventional branch predictors can frequently mispredict the
control flow transfers in the exception-driven and short-lived OS execution [46]. In [47],
Li et al. propose an OS-aware control flow speculation scheme which allocates dedicated
branch prediction resource to the OS to improve its branch prediction accuracy. In this
study, we integrate an OS-aware hybrid predictor [47] with the proposed processor
adaptation scheme to further optimize its energy efficiency in the light of the exception-
driven and non-deterministic OS execution.
5.4 POWER SAVINGS AND PERFORMANCE EVALUATION
In this study, we use the complete system power simulator SoftWatt [25]. Figure
5.11 depicts the superscalar microarchitecture that I consider for this study. The baseline
machine considered for this study is an aggressive, 8-issue superscalar processor. To
reduce its power consumption, the processor can be reconfigured to the 6-issue, 4-issue,
2-issue and 1-issue modes by reducing its computational capacity. Previous studies
[5][64][20] observe that power consumption of a high-performance superscalar machine
is largely determined by the instruction issue width and the scale of major
microarchitectural structures, such as: instruction window (IW), reorder buffer (ROB)
and load store queue (LSQ). Therefore, in 6-issue mode, we limit the instruction fetch,
decode, issue and retire width to be 6 and disable 1/4 of the IW, ROB and LSQ entries. In
the 4-issue, 2-issue and 1-issue modes, I restrict the issue width to be 4, 2, and 1 and
disable 1/2, 3/4, and 7/8 of the above resources (i.e., IW, ROB and LSQ) respectively.
70

I-Cache Fetch Decode/Rename/Dispatch
Inst
ruct
ion
Win
dow
Load StoreQueue
FU1
FU2
FUm Reo
rder
Buf
fer
D-Cache
RegisterFile
BranchPrediction
Figure 5.11: The Baseline Microarchitecture
(Run-time Energy×Delay Optimizations are made in the Shaded Components)
This section presents power savings as well as performance evaluations of the
proposed technique and the baseline adaptation mechanism (described in section 5.2) on
the OS execution. The schemes we compare are: (1) a baseline adaptation scheme with a
2048-cycle sampling window (ADPT with sw=2048); (2) a baseline adaptation scheme
with a fine-grained 128-cycle sampling window (ADPT with sw=128); (3) the routine
based OS-aware adaptation (OS-aware ADPT); (4) the routine based OS-aware
adaptation with aggressive optimizations (OS-aware ADPT w/ AO, see section 5.3).
Figure 5.12 shows the average power of the experimented workloads on different
schemes. Figure 5.13 and Figure 5.14 show the performance (IPC) and Energy×Delay
metric on the same scenario. All values are normalized with respect to the baseline 8-
issue machine without implementing any adaptation.
Figure 5.12 shows that compared with the coarse-grained sampling technique
(ADPT with sw=2048), the OS-aware ADPT can reduce power more aggressively by
being able to accurately capture the exception-driven, short-lived OS activity and match
them with appropriate resources in a timely fashion. For the same reason, scheme using
fine-grained sampling window (ADPT with sw=128) is also observed to achieve good
power savings. The OS-aware ADPT w/ AO has a double-fold impact on power savings:
71

reducing the size of register file drops power while the improved control flow speculation
tends to increase power because the pipeline flushing stalls happen less frequently.
Intuitively, optimizations such as OS-aware control-flow speculation could increase per-
cycle processor power. Nevertheless, it reduces program execution cycles and the total
clock power, on which both the processor and software energy largely depends.
Therefore, overall it will benefit the targeted program Energy×Delay metric that we try to
optimize. Moreover, as can be seen in the Figure 5.12, one factor does not dominate
another one by showing drastic changes in power compared with the OS-aware ADPT
scheme.
0
0.2
0.4
0.6
pmakegcc
vortex
sendmail
fileman db
jessjavac jack
postgres.selec
t
postgres.update
osboot
AVG
Norm
alize
d Po
wer ADPT (sw=2048) ADPT (sw=128)
OS-aware ADPT OS-aware ADPT w/ AO
Figure 5.12: Normalized Power
(ADPT with sw=2048 is sampling-based adaptation with 2048-cycle window, ADPT with sw=128 is sampling based adaptation with 128-cycle window, OS-aware ADPT is OS routine based adaptation, and OS-aware ADPT w/ AO is OS routine based adaptation with aggressive optimizations)
Looking at Figure 5.13, one can see that the performance of OS-aware ADPT is
competitive with that of the ADPT (sw=2048), despite that the ADPT (sw=2048) favors
the OS performance by overestimating its computational requirement due to the
interference of the higher user IPC. Figure 5.13 also shows that using fine-grained
window sampling scheme (ADPT with sw=128) measurably degrades performance due
to the aggregated adaptation overhead. As described earlier, the OS-aware ADPT does 72

not incur adaptation overheads in OS. The use of the optimal solution for individual
routine further eliminates the unnecessary adaptations within a routine, leading to a better
performance than the existing fine-grained adaptation scheme. Another observation from
Figure 5.13 is that the OS-aware ADPT w/ AO further increases performance by reducing
the time spent on processing wrong-path instructions. Note that the y-axis begins at 70%
normalized IPC in Figure 5.13.
0.7
0.8
0.9
1
pmakegcc
vortex
sendmail
fileman db
jessjavac jack
postgres.selec
t
postgres.update
osboot
AVG
Norm
aliz
ed IP
C
ADPT (sw=2048) ADPT (sw=128)OS-aware ADPT OS-aware ADPT w/ AO
Figure 5.13: Normalized IPC
0
0.2
0.4
0.6
0.8
pmakegcc
vortex
sendmail
fileman db
jessjavac jack
postgres.selec
t
postgres.update
osboot
AVG
Norm
aliz
ed E
nerg
y.De
lay ADPT (sw=2048) ADPT (sw=128)
OS-aware ADPT OS-aware ADPT w/ AO
Figure 5.14: Normalized Energy×Delay
73

The results shown in Figure 5.14 indicate the OS-aware ADPT retains
performance while reducing power by showing the desirable characteristics when both
performance and energy are under consideration. The OS-aware ADPT w/ AO further
improves the OS Energy×Delay behavior, implying that although the aggressive
optimizations such as resizing register file may yield unbalanced machine for many user
applications, they produce more energy savings when judiciously applied to certain OS
routines.
5.5 RELATED WORK
Previous research [10] employs the OS to reduce power at system level. Recently,
the energy behavior of embedded, real-time operating systems has been studied in
[8][80][81][19]. In [25][17], a full- system energy simulator is developed and the
necessity of simulating OS energy is quantified. There have been plentiful research
[5][64][20][33][52][14][82][76] focusing on reducing the runtime software (mostly, user
applications) power consumption. So far, techniques for run-time software power savings
exclusively focus on the user-only applications. Among those, microarchitecture level
power management [5][64][20] has been demonstrated to be an attractive solution for the
fine-grained program Energy×Delay optimization. It has been observed that by allocating
appropriate microarchitectural resource required by the actual program, significant power
saving can be achieved with a tolerable performance lost. In [5], Bahar et al. exploit IPC
variations in program to reduce power. By varying processor fetch and execution rates,
Marculescu et al. [53] study power-performance trade-off based on a profile-driven
methodology. In [64][20], the authors propose mechanisms for independently monitoring
and adapting multiple microarchitectural structures in one system.
74

5.6 SUMMARY
Modern applications spend a significant proportion of their execution time within
the operating system, making OS a major power consumer. To save power, hardware can
provide resources that closely match the needs of the software. However, with exception-
driven and intermittent execution in nature, it becomes difficult to accurately predict and
adapt processor resources in a timely fashion. The novel approach proposed in this
chapter permits precise hardware reconfigurations for the OS with low overhead and
allows fine-grained performance/power tuning at microarchitectural level. This scheme is
orthogonal to and can be integrated with existing techniques proposed for user-only
applications to further enhance their efficiency in the light of the prevalent, OS-intensive
and emerging workloads. With the increasing impact of the leakage power, routine
customized aggressive adaptation tends to save more power by safely turning off more
transistors. The proposed scheme can be exploited in mobile computing systems for
energy saving, as well as in conventional systems for dynamic thermal management.
75

Chapter 6: OS-aware Low Power Instruction Cache
Low power has been considered as an important issue in instruction cache (I-
cache) designs. This chapter low power I-cache design techniques by exploiting the
interactions of hardware-application-OS. The proposed mechanisms require minimal
hardware modification and addition.
6.1 MOTIVATION
Caches account for a sizeable fraction of the total power consumption of
microprocessors. High performance cache accesses dissipate significant dynamic power
due to charging and discharging highly capacitive bit lines and sense amps [36].
Moreover, on-chip caches constitute a significant portion of the transistor budget of
current microprocessors. With the continued scaling down of threshold voltages, static
power due to leakage current in caches grows rapidly. Clearly, with the increasingly
constrained power budget of today’s high performance microprocessors, low power has
been considered as an important issue in cache designs. This chapter focuses on
techniques to reduce both dynamic and static power of instruction cache (I-cache).
In general, processor I-cache is designed to accommodate a wide range of
applications. Nevertheless, it has been observed that the performance of a given I-cache
architecture is largely determined by the behavior of the application using that cache
[95][69]. To reduce power, previous studies [4][6][20][30][31][41][65][66][86][43][94]
[23][37] proposed adapting I-cache to the need of application’s demand. These
techniques, however, exclusively focus on user-level applications, even though there is
evidence that many system workloads often involve heavy use of the OS
[51][70][47][50]. For example, on the average, the OS accounts for 30% of total I-cache
(32KB, 4-way set associative and 32-byte cache line) power across the experimented
76

workloads (as shown in Figure 6.1). Therefore, it is necessary to consider the OS for I-
cache power modeling and optimization.
0
20
40
60
80
100
pmake
gccvo
rtex
sendm
ail
fileman db
jess
javac jac
kmtrt
compres
s
postgre
s.sele
ct
postgre
s.upd
ate
postgre
s.join
osboot
AVERAGE
% o
f L1
I-Cac
he P
ower
User OS
Figure 6.1: I-Cache Power Breakdown: User vs. OS
Adhering to this philosophy, this chapter explores the opportunities to design low
power I-cache by considering the interactions of application-OS-hardware. It starts from
characterizing user and OS I-cache access behavior to identify power saving
opportunities. It is observed that in a system that frequently invokes OS activity,
instruction blocks from user applications and OS often interleave and co-exist within I-
cache that is shared by all processes.
To ensure proper operation and protect the OS from errant users, modern
processors and operating systems provide two separate modes of operation: user mode
and privileged mode. Processor executes user processes in user mode. Whenever the OS
is invoked (by a trap or an interrupt/exception), the hardware switches to privileged
mode. The OS always switches back to user mode before passing control to a user
program.
The semantics of dual mode operation provides opportunities to save the dynamic
power of I-cache access: without affecting the performance and the correctness of
program execution, I-cache lookups for user applications can bypass caches lines that
77

store OS code and vice-versa. Therefore, the number of parallel tag comparisons and data
array read-outs needed to fulfill a set-associative I-cache access can be reduced, implying
less dynamic power dissipation per access. Moreover, It is found that a significant
fraction of I-cache regions are only heavily accessed in one operation mode. This
characteristic can be exploited to reduce I-cache leakage power: when processor executes
in one mode, cache regions that are only frequently accessed in another mode can be put
into lower power state.
To explore these power saving opportunities, this chapter proposes two OS-aware
tuning techniques - OS-aware cache way lookup and OS-aware cache set drowsy mode -
to improve the I-cache energy efficiency for system workloads. With very simple
hardware modification and addition, OS-aware I-cache tuning exhibits promising
dynamic and static power reduction. More attractively, the OS-aware tuning yields no or
negligible impacts on performance. Since system performance is sensitive to that of the
OS, the proposed techniques preserve merits especially valuable for the energy-efficient,
high performance server processor I-cache designs.
The rest of this chapter is organized as follows: Section 6.2 characterizes user
applications and OS I-cache access behavior to identify power saving opportunities.
Section 6.3 proposes two OS-aware tuning techniques to improve I-cache energy
efficiency. Section 6.4 evaluates the impact of proposed techniques on power and
performance. Section 6.5 discusses related work. Section 6.6 concludes with some final
remarks.
6.2 USER/OS I-CACHE ACCESSES CHARACTERIZATION
During system workload execution, instructions from user applications and OS
are fetched into I-cache and exercise on the processor alternately, as shown in Figure
6.2(a). Among multiple processes that must all share the same I-cache, instruction blocks 78

from the OS co-exist with those from user processes. Previous studies analyzed the
impact of inter-mingling of user and OS instructions in the I-cache and found that
interferences between the two degrade performance. The interest of this characterization,
however, is to identify the power saving opportunities.
User
OS
User
User
OS … …. …. ….
… …. …. ….
Cache Set 0
Cache Set 1
Cache Set i
Cache Set i+1
Cache Set n-1
Tag Data Array
Tag Data Array
Tag Data Array
Tag Data Array
Tag Data Array
Tag Data Array
Tag Data Array
Tag Data Array
Tag Data Array
Tag Data Array
Tag Data Array
Tag Data Array
Tag Data Array
Tag Data Array
Tag Data Array
Tag Data Array
Tag Data Array
Tag Data Array
Tag Data Array
Tag Data Array
(a) Dynamically Executed Inst. Stream
on Processor
(b) User/OS Instruction Blocks Residency in I-Cache (4-Way)
User(2)+OS(2)
User(0)+OS(4)
User(4)+OS(0)
User(1)+OS(3)
User(3)+OS(1)
Figure 6.2: User/OS Instruction Blocks Residency
(Assuming a 4-way I-Cache)
To achieve low miss rates, modern microprocessors employ set-associative I-
Caches. In a system that frequently invokes OS, there is a high possibility that user and
OS code simultaneously reside within the same cache set. As illustrated in Figure 6.2(b),
in a 4-way set-associative I-cache, based on user/OS instruction block residency, cache
sets can be classified as: (1) user code occupies all of the four cache lines
(User(4)+OS(0)); (2) user occupies three cache lines and OS resides in one cache line
(User(3)+OS(1)); (3) user and OS each occupy two cache lines (User(2)+OS(2)); (4)
user resides in one cache line and OS occupies three cache lines (User(1)+OS(3)); and
(5) OS dominates all of the four cache lines (User(0)+OS(4)).
79

To protect OS from malfunctioning programs, modern processor architectures
support user and privileged mode operations. Processor executes user applications in user
mode and OS instructions can only be exercised in privileged mode. At any time,
processor runs in one of the two modes. Therefore, OS instructions in I-cache will not be
selected when processor runs in user mode and vice versa. The semantic of dual-mode
operation implies opportunities to save the dynamic power of set-associative I-cache
accesses: when processor runs in one mode, the number of parallel cache way lookups
can be reduced by filtering out accesses to cache lines holding instruction blocks that are
only executed in another mode. For example, to access cache sets in the User(2)+OS(2)
category, processor really needs to only perform two parallel cache way lookups.
Similarly, in the OS mode, if the processor is aware of user/OS instruction block
residency, 75% of parallel cache way lookups can be reduced when the processor
accesses cache sets in the User(3)+OS(1) category.
To evaluate the opportunities to reduce cache way lookups by exploiting the
information of user/OS cache blocks residency within cache sets, the frequencies of I-
cache accesses to each cache set category during program execution are counted. The
results are summarized in Table 6.1.
Not surprisingly, during system workload execution, a significant fraction of I-
cache accesses encounters cache sets in which both user and OS instruction blocks reside
(marked with categories II, III, and IV in Table 6.1). On benchmarks gcc and vortex, user
mode dominates execution cycles. Still, more than 25% of I-cache references access
cache sets in categories II, III, and IV. Interestingly, on benchmark compress, 97% of I-
cache accesses encounter OS cache lines, even though OS accounts for only 6% of
program execution time. This is because compress has small I-cache footprint and a few
most frequently accessed cache sets (hot-spot) are mapped by codes from both user and
80

kernel spaces. On benchmarks fileman and osboot where OS mode dominates, there are
still 35% and 16% of I-cache references that touch user blocks. Table 6.1 shows that on
the average, 56% of program I-cache references access cache sets in categories II, III and
IV, indicating there are abundant opportunities to reduce the number of parallel cache
way lookups (and associated dynamic power) by incorporating user/OS operation mode
in I-cache designs.
Table 6.1: I-Cache Accesses Categorized by User/OS Residency
% of I-Cache Accesses I II III IV V Benchmarks
User(4) +OS(0)
User(3) +OS(1)
User(2) +OS(2)
User(1) +OS(3)
User(0) +OS(4)
pmake 33 26 25 11 5gcc 73 17 7 2 1vortex 72 20 6 1 0sendmail 1 8 28 33 30fileman 0 0 2 33 65db 19 17 28 27 10jess 32 21 23 20 5javac 32 22 24 18 4jack 26 34 26 14 1mtrt 27 17 11 44 1compress 2 8 25 64 1postgres.select 25 27 21 22 4postgres.update 28 19 17 20 17postgres.join 55 18 13 12 1osboot 0 2 4 9 84AVERAGE 28 17 17 22 16
Previous research [23][37] found that during program execution, not all cache
regions are accessed frequently. To save energy, the less frequently accessed cache
regions can be put into lower power state with tolerable performance loss. The dual-mode
operation provides yet another opportunity: if cache regions are heavily accessed by
processor in only one operation mode, then those cache regions can be put into lower
power state when the processor runs in another mode. To identify cache regions heavily
accessed only in one of the two operation modes, the characterization shown in Table 6.1
81

is further broken down into user and OS parts. The results are shown by Figure 6.3 (a)
and (b).
020406080
100
pmake
gcc
vorte
x
sendmail
fileman db
jess
javac jac
kmtrt
compres
s
postgres
.selec
t
postgres
.update
postgres
.join
osboot
AVERAGE
% o
f L1
I-Cac
he A
cces
sV: User(0)+OS(4)IV: User(1)+OS(3)III: User(2)+OS(2)II: User(3)+OS(1)I: User(4)+OS(0)
(a) User I-Cache Accesses
020406080
100
pmake
gcc
vorte
x
sendmail
fileman db
jess
javac jac
kmtrt
compres
s
postgres
.selec
t
postgres
.update
postgres
.join
osboot
AVERAGE
% o
f L1
I-Cac
he A
cces
s
V: User(0)+OS(4)IV: User(1)+OS(3)III: User(2)+OS(2)II: User(3)+OS(1)I: User(4)+OS(0)
(b) OS I-Cache Accesses
Figure 6.3: User and OS I-Cache Accesses
Figure 6.3 (a) and (b) show both user and OS access cache sets in categories II, III
and IV frequently. Interestingly, it is found find that cache sets in the category
User(4)+OS(0) are heavily accessed only in user mode. In contrast, cache sets in the
category User(0)+OS(4) are heavily accessed in OS mode but they are rarely accessed in
user mode. On the average, only 0.08% of user I-cache accesses touch cache sets in the
category User(0)+OS(4). The percentile of OS I-cache accesses that encounter cache sets
in the category User(4)+OS(0) is merely 0.11%. The above characterization implies that
during user execution, cache sets in the category User(0)+OS(4) can be put into lower
82

power state. On the other hand, when processor runs in OS, cache sets in the category
User(4)+OS(0) can remain in lower power state.
To summarize, in this section, the user/OS I-cache accesses are categorized by the
user/OS residency. It is found that dual-mode operation opens additional opportunities to
save processor I-cache power. These opportunities to achieve low power are exploited in
the following sections.
6.3 OS-AWARE I-CACHE TUNING
This section proposes two simple mechanisms to improve I-cache energy
efficiency for system workloads.
6.3.1 OS-aware Cache Way Lookup
In a set associative cache, the number of parallel cache way lookups largely
determines the dynamic power of a cache access. A conventional 4-way set associative
cache requires four tag comparisons and four data array read-outs for a cache access.
Nevertheless, during user execution, performing tag comparisons and data array read-outs
for OS cache blocks are unnecessary and waste extra dynamic power. Therefore,
processor operation mode can be integrated with I-cache design to reduce the number of
parallel cache way lookups (and hence dynamic power) on cache accesses.
Figure 6.4 illustrates architectural modifications to support OS-aware cache way
lookup. A bit called cache way mode bit is attached with each cache line. With the cache
way mode bit (e.g., 0 for OS and 1 for user), it is able to differentiate between cache
block stores instructions on behalf of the OS, and of one that stores instructions on behalf
of the user applications. When a cache line is uploaded to I-cache the first time, its cache
way mode bit is generated, depending on the processor operation mode. The cache way
mode bit will keep unchanged unless the associated cache line is replaced. The current
83

machine execution mode in processor status register (PSR) is used to compare with cache
way mode bit to decide whether a cache way needs to be accessed in a given operation
mode. The results of comparisons are used to generate enable signals (assuming active
low) to circuitry such as tag and data array access logic, tag comparators, data array sense
amps and output drivers. As can be seen from Figure 6.4, the hardware modification and
addition needed to support OS-aware cache way lookup is simple.
Cac
he w
ay m
ode
bit Tag Data
execution mode bit
Cache line ( way 0)Cache line ( way 1)Cache line ( way 2)Cache line ( way 3)
Way selcection logic
Hit/Miss
Data
Address (Tag)
Enable signals for tagcomparators, data arraysense amps and outputdrivers
Cache Set
Enable signals for tag anddata array access
Processor Status Register (PSR)
Figure 6.4: Hardware Modification/Addition Required to Implement OS-aware Cache Way Lookup
The generation of above enable signals is not in the critical path of I-cache access
because once generated, they remain unchanged (due to the one-to-one hard-wired
mapping between each cache way mode bit and each cache block) unless a cache line
replacement (due to a cache miss) occurs or the processor switches mode. When a cache
miss occurs, the requested cache line is retrieved from the next level of memory
hierarchy and is immediately forwarded to processor for execution. The corresponding
cache mode bit needs to be accessed and then updated. The latency to access and update
cache way mode bit array and regenerate cache way access enable signals can be
overlapped with processor execution. Similarly, the latency of regenerating cache way
84

access enable signals due to processor mode changes can be easily hidden as well due to
the inherent cost and the low frequency of user/OS context switches.
Note that the correctness of OS-aware cache way lookup is ensured by the dual-
mode operation semantic and the precise exception handling mechanism. Processor
switches mode to OS upon handing an exception or interrupt or upon handling a TRAP
instruction (usually used to implement all system calls by OS), which all raises an
exception. To handle precise exceptions, the processor pipeline must drain before OS
code execution can begin. To return the processor to user/unprivileged mode, most
architectures use a privileged instruction (return-from-exception) that performs this step
in an atomic manner. Therefore, even on processors with out-of-order and speculative
execution, instructions from user and OS will not be fetched from I-cache and executed
in pipeline simultaneously.
For some systems, there could be certain circumstances where user-defined signal
handlers were performed within the OS. Also, it is possible that certain runtime
actions/exceptions of user code, may be trapped by the hardware, given to the OS, and
the OS executes the user code in OS mode. For user code that dedicatedly runs in OS
mode, OS-aware cache way lookups treat it as if it was OS code. However, for user code
that can run in both user and OS mode, additional attention is required to ensure
correctness. For example, a special purpose register (1 bit) can be added to enable/disable
OS-aware cache way lookup by gating the cache way lookup enable signals. An
instruction writes to that special purpose register to set (or reset) OS-aware cache way
lookup. Two such instructions are placed at the boundaries of the above code region so
that OS-aware cache way lookups are disabled before the code region execution starts
and are resumed after the code region execution completes. During the above code region
execution, full cache way lookups are required and no power saving is achieved. Because
85

this situation happens infrequently, its impact on performance as well as energy saving is
negligible.
The reduction of cache way accesses on a 4-way set-associative I-cache by
employing OS-aware cache way lookup is measured, as shown in Figure 6.5. The results
are shown for user, OS and the aggregated cache accesses on each benchmark. On
benchmarks gcc and vortex where the OS frequently accesses cache sets in the category
User(3)+OS(1), OS-aware cache way lookup reduces the number of cache way accesses
in OS significantly. On the other hand, the number of cache way lookups during the user
execution on benchmark sendmail is largely reduced due to its high access frequencies to
cache sets in the categories User(1)+OS(3) and User(2)+OS(2). On the average, the
proposed technique reduces cache way lookups in user, OS and aggregated I-cache
accesses by 34%, 35% and 35% respectively, implying significant I-cache dynamic
power saving.
01020304050607080
pmake
gccvo
rtex
sendm
ail
fileman db
jess
javac jac
kmtrt
compres
s
postgre
s.sele
ct
postgre
s.upd
ate
postgre
s.join
osboot
AVERAGE% o
f Red
uced
I-C
ache
Way
Acc
ess
UserOSOverall
Figure 6.5: I-Cache Way Accesses Reduction
6.3.2 OS-aware Cache Set Drowsy Mode
Caches comprise a large portion of the on-chip transistor budget. Due to CMOS
technology scaling, static power due to leakage current is gaining in importance in I-
86

cache power dissipation. For example, Agarwal et al. [1] report that leakage energy
accounts for 30% of L1 cache energy for a 0.13-micro process technology. In a 0.07
micron process, ITRS predicts leakage may constitute as much as 50% of total power
budget. These make efforts at leakage control essential to maintain control of I-cache
power on current and next generations of processors.
To reduce cache leakage power, researchers [37][96] have proposed turning off
the unlikely used cache lines using gated-Vdd technique [65]. While the gated-Vdd
technique is efficient in saving leakage, the disconnected cache line loses its state and
needs to be fetched from L2 cache, causing performance penalty and dynamic power
consumption due to an extra L2 access. Alternatively, cache lines can be put into a low-
leakage drowsy mode to save power by exploiting the short-channel effects on dynamic
voltage scaling [23]. Unlike the gated-Vdd, in drowsy mode, the information in the cache
line is preserved. However, the cache line in drowsy mode must be reinstated to a high-
power mode before its contents can be accessed. The performance penalty of accessing a
drowsy cache line is an extra cycle to restore the full voltage for that cache line.
Recent studies show that state-preserving drowsy cache techniques are preferable
for leakage control in L1 caches where high performance is a must. Since system
performance is sensitive to that of the OS, our objective here is to reduce power yet
preserve high performance. Therefore, in this chapter, We explore the opportunity of
integrating OS-aware cache tuning with a state-preserving, leakage control mechanism.
The rationale is to put cache regions that heavily accessed in only one operation mode
into drowsy state when processor runs in another mode. A key issue is to classify or
identify which cache regions are “hot” in one operation mode but stay “cool” in another
operation mode.
87

The user/OS I-cache accesses on system workloads show that the intra-cache set
user/OS residency can be used as proximity for the above classification. During OS
execution, cache sets in the category User(4)+OS(0) are infrequency accessed and can be
put into drowsy state. Similarly, during user mode execution, cache sets in the category
User(0)+OS(4) can remain in drowsy state.
Cac
he w
ay m
ode
bit
drw
!drw
Vdd Low(0.3V)
Vdd (1V)
worldline
power supply
word lineCache line (Way 0)
power supply
word lineCache line (Way 1)
power supply
word lineCache line (Way 2)
power supply
word lineCache line (Way 3)
worldline gate
drowsy bit
voltagecontroller
Processor Status Register (PSR)execution mode bit
Cache Set
set / wake-up
Figure 6.6: Implementation of OS-aware Cache Set Drowsy Mode
Figure 6.6 illustrates the control circuitry to implement OS-aware cache set
drowsy mode. To control memory cells leakage power, the circuit technique proposed in
[23] is used. A drowsy bit is used to control the supply voltages to the memory cells
within a cache set. For a 0.07 micron process with normal supply voltage (Vdd) of 1.0V,
the threshold voltage (Vdd Low) needed to preserve the state of memory cells is about
0.3V [23]. Depending on the state of the drowsy bit, all cache lines within a cache set can
be put into either the high power active state or the low leakage drowsy state.
In Figure 6.6, if all cache way mode bits within a cache set are identical (e.g.,
0000 or 1111) and they are different with the current processor mode, the whole cache set
is put into drowsy mode. This control logic puts cache sets in the category
User(4)+OS(0) to drowsy mode during OS execution. When context switches back to
88
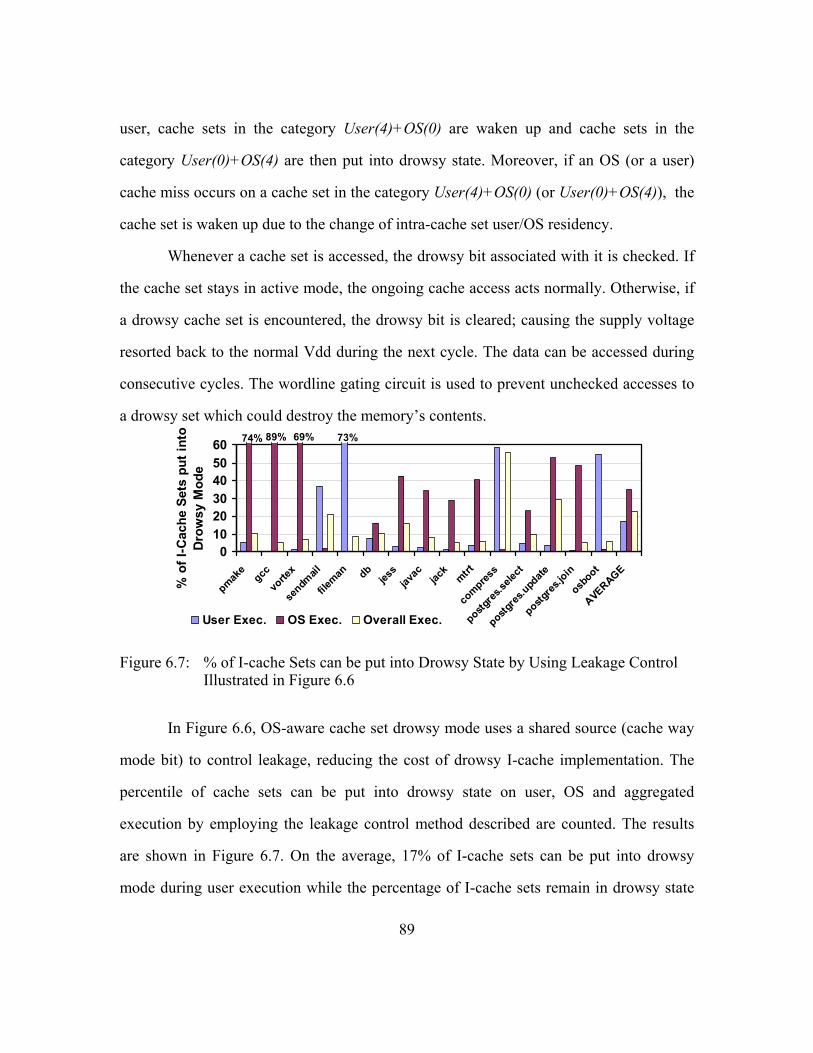
user, cache sets in the category User(4)+OS(0) are waken up and cache sets in the
category User(0)+OS(4) are then put into drowsy state. Moreover, if an OS (or a user)
cache miss occurs on a cache set in the category User(4)+OS(0) (or User(0)+OS(4)), the
cache set is waken up due to the change of intra-cache set user/OS residency.
Whenever a cache set is accessed, the drowsy bit associated with it is checked. If
the cache set stays in active mode, the ongoing cache access acts normally. Otherwise, if
a drowsy cache set is encountered, the drowsy bit is cleared; causing the supply voltage
resorted back to the normal Vdd during the next cycle. The data can be accessed during
consecutive cycles. The wordline gating circuit is used to prevent unchecked accesses to
a drowsy set which could destroy the memory’s contents.
0102030405060
pmake
gccvo
rtex
sendm
ail
fileman db
jess
javac jac
kmtrt
compres
s
postgre
s.sele
ct
postgre
s.upd
ate
postgre
s.join
osboot
AVERAGE
% o
f I-C
ache
Set
s pu
t int
oD
row
sy M
ode
User Exec. OS Exec. Overall Exec.
74% 89% 69% 73%
Figure 6.7: % of I-cache Sets can be put into Drowsy State by Using Leakage Control Illustrated in Figure 6.6
In Figure 6.6, OS-aware cache set drowsy mode uses a shared source (cache way
mode bit) to control leakage, reducing the cost of drowsy I-cache implementation. The
percentile of cache sets can be put into drowsy state on user, OS and aggregated
execution by employing the leakage control method described are counted. The results
are shown in Figure 6.7. On the average, 17% of I-cache sets can be put into drowsy
mode during user execution while the percentage of I-cache sets remain in drowsy state
89

during OS execution is 35%. Overall, 22% of I-cache sets can be put into drowsy mode
during program execution. On most benchmarks, It is observed that larger fraction of
cache regions can remain in drowsy mode during OS execution. This is because that
although OS is large and sophisticated software, OS execution is usually dominated by a
small fraction of highly invoked service routines [50]. Therefore, a sizeable fraction of
the I-cache is not accessed by the OS during its execution.
Table 6.2: % of I-Cache Accesses to Drowsy Sets and Average Number of Reinstated Drowsy Sets
Benchmarks % of User Accesses to Drowsy Sets (in the category User(0)+OS(4))
Avg. Num. of Drowsy Sets Reinstated in User
% of OS Accesses to Drowsy Sets (in the category User(4)+OS(0))
Avg. Num. of Drowsy Sets Reinstated in OS
pmake 0.01 0.18 0.10 0.16 gcc 0.00 0.01 0.21 0.04 vortex 0.00 0.00 0.05 0.01 sendmail 0.15 1.40 0.01 0.10 fileman 0.22 0.92 0.00 0.01 db 0.05 0.10 0.09 0.09 jess 0.04 0.04 0.09 0.04 javac 0.02 0.04 0.14 0.07 jack 0.01 0.01 0.28 0.06 mtrt 0.00 0.02 0.11 0.03 compress 0.00 0.01 0.03 0.01 postgres.select 0.04 0.15 0.23 0.26 postgres.update 0.20 0.30 0.20 0.33 postgres.join 0.01 0.03 0.08 0.04 osboot 0.47 2.17 0.00 0.11
As described earlier, an extra cycle is needed to access cache sets in drowsy
mode, implying a performance penalty. To effectively save power while maintaining high
performance, both the number of accesses to the drowsy sets and the number of drowsy
cache sets reinstated to the high power mode should be small. Table 6.2 summarizes the
percentage of I-cache accesses to the drowsy sets and the average number of drowsy sets
that are waken-up. The data are shown for both user and OS execution. As can be seen
from Table 6.2, the possibilities to access a drowsy cache set in both operation modes are
90
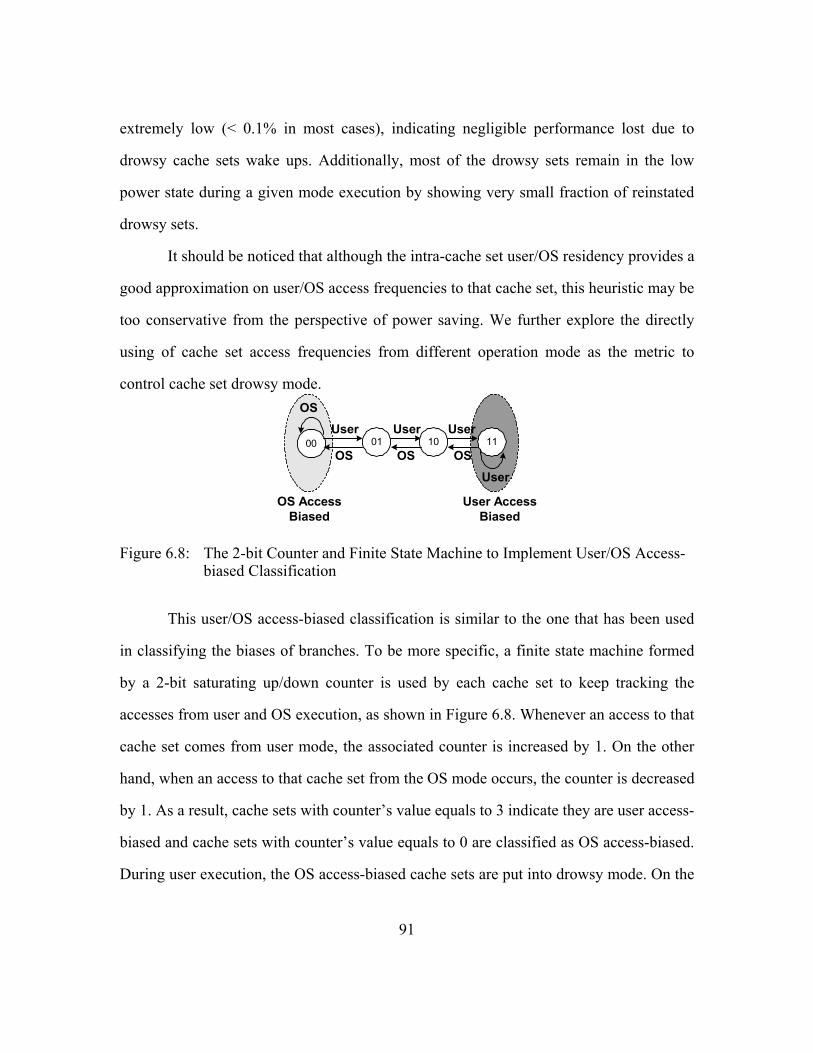
extremely low (< 0.1% in most cases), indicating negligible performance lost due to
drowsy cache sets wake ups. Additionally, most of the drowsy sets remain in the low
power state during a given mode execution by showing very small fraction of reinstated
drowsy sets.
It should be noticed that although the intra-cache set user/OS residency provides a
good approximation on user/OS access frequencies to that cache set, this heuristic may be
too conservative from the perspective of power saving. We further explore the directly
using of cache set access frequencies from different operation mode as the metric to
control cache set drowsy mode.
00 01 1110
OS
User
UserUserUser
OSOSOS
OS AccessBiased
User AccessBiased
Figure 6.8: The 2-bit Counter and Finite State Machine to Implement User/OS Access-biased Classification
This user/OS access-biased classification is similar to the one that has been used
in classifying the biases of branches. To be more specific, a finite state machine formed
by a 2-bit saturating up/down counter is used by each cache set to keep tracking the
accesses from user and OS execution, as shown in Figure 6.8. Whenever an access to that
cache set comes from user mode, the associated counter is increased by 1. On the other
hand, when an access to that cache set from the OS mode occurs, the counter is decreased
by 1. As a result, cache sets with counter’s value equals to 3 indicate they are user access-
biased and cache sets with counter’s value equals to 0 are classified as OS access-biased.
During user execution, the OS access-biased cache sets are put into drowsy mode. On the
91

other hand, when processor runs in OS, the user access-biased cache sets are put into
drowsy mode.
020406080
100
pmake
gccvo
rtex
sendm
ail
fileman db
jess
javac jac
kmtrt
compres
s
postgre
s.sele
ct
postgre
s.upd
ate
postgre
s.join
osboot
AVERAGE
% o
f I-C
ache
Set
s pu
t int
oD
row
sy M
ode
User Exec. OS Exec. Overall Exec.
Figure 6.9: % of I-cache Sets put into Drowsy State by using User/OS Access-biased Classification
Figure 6.9 shows the percentile of cache sets can be put into drowsy state on user,
OS and aggregated execution by employing the less restricted user/OS access-biased
leakage control mechanism. One can see that the access-based classification has the
capability of putting more cache sets into drowsy state. This is because access-based
scheme can identify all cache sets that can be classified by the residency-based scheme.
Additionally, access-based scheme captures more scenarios. For example, it could be
possible that a cache set has both user and OS blocks reside in it but are accessed
frequently only in one operation mode. On the average, 29% of I-cache sets can be put
into drowsy mode during user execution while the percentage of I-cache sets can be put
into drowsy state during OS execution is 71%. Overall, 42% of I-cache sets can remain in
the drowsy state during program execution.
92
Table 6.3 further summarizes the percentage of I-cache accesses to the drowsy
sets and the average number of drowsy sets that are waken-up by using the access-based
classification. As can be seen, both numbers are higher than the residency-based
classification but are still low enough to incur observable performance degradation.

Table 6.3: % of I-Cache Accesses to Drowsy Sets and Average Number of Reinstated Drowsy Sets using Access-Based Classification
Benchmarks % of User Accesses to Drowsy Sets (User(0)+OS(4))
Avg. Num. of Drowsy Sets Reinstated in User
% of OS Accesses to Drowsy Sets (User(4)+OS(0))
Avg. Num. of Drowsy Sets Reinstated in OS
pmake 0.06 1.06 0.69 1.07 gcc 0.05 0.17 0.81 0.16 vortex 0.03 0.04 0.32 0.04 sendmail 0.44 4.13 0.50 4.14 fileman 3.05 12.79 0.34 11.15 db 0.69 1.33 1.31 1.30 jess 0.68 0.70 1.44 0.67 javac 0.26 0.58 1.18 0.57 jack 0.26 0.28 1.26 0.26 mtrt 0.07 0.25 0.98 0.25 compress 0.15 0.54 2.59 0.53 postgres.select 0.24 0.82 0.70 0.82 postgres.update 0.45 0.67 0.41 0.68 postgres.join 0.04 0.20 0.42 0.21 osboot 1.18 5.45 0.11 5.42
6.4 POWER AND PERFORMANCE EVALUATION
This section provides results showing the I-cache power savings as well as the
performance impact due to the proposed OS-aware I-cache tuning. By default, the power
and performance numbers are normalized to the base line I-cache and machine
configuration. In the simulation, the energy overhead due to hardware modification and
addition to implement the proposed OS-aware tuning is also accounted.
Figure 6.10 shows the normalized I-cache dynamic power after employing the
OS-aware cache way lookup scheme. On the average, the OS-aware cache way lookup
can save 29% and 30% of I-cache dynamic power on user and OS execution respectively.
The aggregated dynamic power saving of this technique is 30%. Looking at Figure 6.5
and Figure 6.10, one can see that dynamic power saving is largely correlated with the
reduced cache way accesses. It should be noticed that this 30% of dynamic power saving
is achieved without any impact on performance. This feature is especially valuable for the
93

OS since system performance is sensitive to that of the OS and the processor energy
overhead caused by performance degradation can easily offset the benefit of power
saving in I-cache.
0.00.20.40.60.81.0
pmake
gccvo
rtex
sendm
ail
fileman db
jess
javac jac
kmtrt
compres
s
postgre
s.sele
ct
postgre
s.upd
ate
postgre
s.join
osboot
AVERAGE
Nor
mal
ized
I-C
ache
Dyn
amic
Pow
er
UserOSOverall
Figure 6.10: % of I-Cache Dynamic Power Savings by Incorporating OS-aware Cache Way Lookup
Table 6.4 summarizes the I-cache leakage power savings as well as the run-time
increases due to the OS-aware cache leakage control. One can see that both policies (i.e.,
residency-based and access-based) lead to a significant leakage power reduction. The
residency-based drowsy mode scheme is more conservative, resulting in 5% - 50% of
leakage power saving on the experimented applications. Access-based drowsy mode
scheme, on the other hand, yields greater leakage power reduction by putting larger
fraction of cache regions in to drowsy state, resulting in an average of 37% of overall
leakage power reduction.
Table 6.4 also shows that both OS-aware cache set drowsy policies incur
negligible (<1% in most case) run-time increase. This is because: (1) the cost of wrongly-
putting a cache set into drowsy mode that is accessed thereafter is relatively small, and
(2) using the proposed cache set drowsy policies makes the possibilities of accessing
drowsy cache sets become extremely low. Therefore, the proposed leakage control
94

techniques again preserve merits especially valuable for designing the power efficient,
high performance server processor I-cache targeting on modern and commercial
applications that heavily invoke OS activities.
Table 6.4: Normalized Leakage Power and Run-time Increase
(Using the OS-aware Cache Set Drowsy Mode)
Residency-based Access-based Normalized
Leakage Power Increased Execution
Cycle Normalized
Leakage Power Increased Execution
Cycle User OS Over-
all User OS Over-all User OS Over-
all User OS Over-all
pmake 0.96 0.34 0.90 0.03% 0.19% 0.04% 0.89 0.21 0.84 0.15% 1.15% 0.23% gcc 1.00 0.20 0.95 0.02% 0.32% 0.04% 0.98 0.12 0.93 0.09% 1.22% 0.15% vortex 0.99 0.38 0.94 0.03% 0.11% 0.04% 0.97 0.14 0.90 0.08% 0.84% 0.14% sendmail 0.67 0.98 0.82 0.21% 0.05% 0.14% 0.41 0.70 0.55 0.71% 1.23% 0.95% fileman 0.35 1.00 0.93 0.45% 0.04% 0.09% 0.24 0.89 0.81 4.95% 0.47% 0.98% db 0.93 0.85 0.91 0.12% 0.23% 0.16% 0.72 0.40 0.61 1.06% 2.48% 1.54% jess 0.97 0.62 0.86 0.09% 0.12% 0.10% 0.81 0.30 0.65 0.97% 2.05% 1.31% javac 0.98 0.69 0.93 0.07% 0.19% 0.09% 0.87 0.25 0.76 0.61% 1.97% 0.85% jack 0.99 0.74 0.95 0.03% 0.36% 0.08% 0.90 0.21 0.79 0.45% 2.08% 0.72% mtrt 0.97 0.64 0.95 0.02% 0.24% 0.03% 0.92 0.20 0.88 0.11% 1.42% 0.19% compress 0.47 0.99 0.50 0.05% 0.09% 0.05% 0.45 0.70 0.46 0.42% 4.09% 0.61% postgres.select 0.96 0.79 0.92 0.07% 0.35% 0.14% 0.85 0.26 0.70 0.24% 0.70% 0.36%
postgres.update 0.97 0.53 0.74 0.49% 0.33% 0.41% 0.90 0.20 0.53 0.99% 0.65% 0.81%
postgres.join 0.99 0.56 0.95 0.05% 0.13% 0.06% 0.97 0.13 0.89 0.12% 0.76% 0.18%
osboot 0.52 0.99 0.95 0.98% 0.03% 0.11% 0.30 0.82 0.78 2.46% 0.34% 0.52% AVERAGE 0.85 0.69 0.80 0.18% 0.19% 0.18% 0.75 0.37 0.63 0.89% 1.43% 1.05%
6.5 RELATED WORK
A great deal of research work in the architecture community has focused on
reducing power in caches. Selective cache ways [4] reduce cache access energy by
turning off unneeded ways in a set-associative cache. Recently, Zhang [95] proposed a
reconfigurable cache architecture using way concatenation to adapt cache associativity
for embedded applications. To use these techniques, the designers have to determine the
95

appropriate configurations for a given program by exhaustively searching all possible
configurations. The caches are reconfigured for the entire program execution.
Researchers have proposed several cache lookup variations to reduce set-
associative cache access energy. Phased-lookup cache [26] uses a two-phase lookup,
where all tag arrays are accessed in the first phase, but then only the one hit data way is
accessed in the second phase. The employing of phased-lookup cache results in less data-
way access energy at the expense of longer access time.
Way prediction [31][66] speculatively selects a way to access initially, and only
access the other arrays if that initial array did not result in a match. To support way
prediction, processor branch prediction mechanism has to be extended. Adding way-
prediction to the branch prediction mechanism may affect the processor cycle time
because the branch prediction access is often on one of the critical path. Way prediction
scheme incurs a performance penalty by spending an extra cycle to access the other ways
when a prediction fails. Moreover, way predicting of all I-cache accesses is non-trivial. In
[66], Powell reported that even an elegant way predictor could make no prediction for a
sizable fraction of I-cache accesses. Compared with way prediction, the proposed OS-
aware cache way lookups do not cause performance degradation and is easier to
implement because no predictor is involved. Moreover, way prediction still needs full tag
comparisons to verify the correctness of a prediction.
In [43], Lee et al. proposed region-based caching by re-organizing the first level
cache to more efficiently exploit memory region (stack, global, heap) reference
characteristics produced by programming language semantics. In [40], Kim et al.
investigated ways of splitting the cache into several smaller units, each of which is a
cache by itself (called a sub-cache). However, implementing region-based caching or
96

sub-caching scheme requires substantial amount of modifications to be made in cache
and other structures (e.g. TLB).
Approaches for reducing static power consumption of caches by turning off cache
lines using the gated-Vdd technique have been described in [37][96]. The drawback of
this approach is that the state of the cache line is lost when it is turned off and reloading it
from the L2 cache has a significant impact on performance.
In [94], the using of compiler to insert power mode instructions to control cache
leakage power was proposed. However, this approach requires the re-compilation of
program source code, which is not generally applicable to the OS as well as many
commercial applications. To reduce leakage energy dissipation, Yang [87] proposed a
dynamically resizing I-cache. Compared with resizable cache, the proposed OS-aware
cache tuning reduces power while still utilizing the full cache capacity. The drowsy
instruction cache [39] uses dynamic voltage scaling and cache sub-bank prediction to
achieve leakage power reduction. Like way prediction, a misprediction on cache sub-
bank incurs a performance penalty. When applied to large, set-associative cache, an
aggressive cache sub-bank predictor yields mediocre prediction accuracies [39]. The area
as well as power overhead of the memory sub-bank prediction buffers, which yield better
prediction accuracies, can be significant.
6.6 SUMMARY
This chapter explores the opportunities of employing the three subsystems –
application, OS and hardware – to improve I-cache energy efficiency. It starts from
characterizing user/OS I-cache accesses on system workloads to identify power saving
opportunities due to dual-mode operation. Two simple OS-aware techniques
incorporating processor operation mode are proposed to improve I-cache energy
efficiency on system workloads. The proposed OS-aware cache way lookup reduces the 97

number of parallel tag comparisons and data array read-outs for cache accesses and saves
dynamic power. Integrating with a state preserving, leakage control mechanism, OS-
aware tuning effectively reduces static power, which is gaining in importance due to
CMOS technology scaling. Unlike other proposed schemes, OS-aware tuning achieves
both dynamic and static power savings but requires minimal hardware modification and
addition.
98

Chapter 7: OS-aware Branch Prediction
Chapter 3 demonstrates that many modern applications result in a significant OS
activity. The OS execution can affect architectural states. This chapter focuses on one
specific issue that has long been considered as an important issue for performance
optimization of state-of-the-art processors - control flow prediction.
Detailed characterization shows that the exception-driven, intermittent invocation
of OS code and the user/OS branch history interference increase the misprediction in both
user and kernel code.
Two simple OS-aware control flow prediction philosophies are proposed in this
chapter to alleviate the destructive impact of user/OS branch interference.
7.1 MOTIVATION
Current high performance processors provision aggressive support for ILP and
have deep pipelines to keep cycle times low. The delivered ILP and pipelining
performance is critically dependent on being able to accurately predict the control
(branch) flow in the program, so that the processor can execute more useful instructions
and avoid stalling/squashing the pipeline.
Branch predictors for control flow prediction have been studied extensively with
user-level programs [90][92][73][56]. The OS affects control flow predictability by
introducing the additional user/OS branch aliasing in branch predictor tables. It is
observed that user/OS execution can significantly increase the mispredictions in each part
(Figure 7.1). For example, as shown in Figure 7.1a, kernel code nearly doubles the
misprediction rates in 7 out of 13 of our benchmarks in a Gshare predictor. On the other
hand, the interferences of user code significantly increase the OS misprediction rates on
all benchmarks, as shown in Figure 7.1b. 99

02468
1012
db(1
6k)
db(6
4k)
jess
(16k
)
jess
(64k
)
java
c(16
k)
java
c(64
k)
jack
(16k
)
jack
(64k
)
mtrt
(16k
)
mtrt
(64k
)
com
pres
s(16
k)
com
pres
s(64
k)
gcc(
16k)
gcc(
64k)
vorte
x(16
k)
vorte
x(64
k)
send
mai
l(16k
)
send
mai
l(64k
)
post
gres
.sel
ect(1
6k)
post
gres
.sel
ect(6
4k)
post
gres
.upd
ate(
16k)
post
gres
.upd
ate(
64k)
post
gres
.join
(16k
)
post
gres
.join
(64k
)
Benchmark(Gshare Predictor Size)
Mis
pred
ictio
n R
ate
(%) Extra Caused by OS Execution
User Only
(a) User
02468
101214
db(1
6k)
db(6
4k)
jess
(16k
)
jess
(64k
)
java
c(16
k)
java
c(64
k)
jack
(16k
)
jack
(64k
)
mtrt
(16k
)
mtrt
(64k
)
com
pres
s(16
k)
com
pres
s(64
k)
gcc(
16k)
gcc(
64k)
vorte
x(16
k)
vorte
x(64
k)
send
mai
l(16k
)
send
mai
l(64k
)
post
gres
.sel
ect(1
6k)
post
gres
.sel
ect(6
4k)
post
gres
.upd
ate(
16k)
post
gres
.upd
ate(
64k)
post
gres
.join
(16k
)
post
gres
.join
(64k
)
Benchmark(Gshare Predictor Size)
Mis
pred
ictio
n R
ate
(%)
Extra Caused by User ExecutionOS Only
(b) OS
Figure 7.1: Impact of User/OS Execution on Branch Prediction
Branch aliasing characterization shows that user/OS aliasing contributes to up to
24% of all misprediction and 46% of aliasing misprediction in the benchmarks studied in
this chapter. There are numerous branch predictors that have been proposed to address
different situations [91][54][22][77][44][16][56][21]. These prediction mechanisms have
paid less attention to the OS requirements and no particular scheme was proposed on
tuning control flow prediction hardware for the OS.
This chapter investigates what causes the execution of a spectrum of applications
with significant OS involvement to give worse branch prediction in the user and kernel
modes by characterizing their execution using complete system simulation. This
investigation shows that the interference between the branches in the user and kernel
modes is leading to this poor performance. User and kernel branches have different
100

characteristics (such as the direction bias) that cause the history information used by the
predictors - and shared by both the user and kernel - to become polluted. Such pollution
would not have happened if we had a separate predictor for each mode.
These observations motivate to separate out branch prediction logic for user and
kernel modes. This approach can be easily integrated into existing prediction schemes
without significantly complicating the logic.
The rest of this chapter is organized as follows. Section 7.2 characterizes kernel
branch behavior in different applications. The effect of user/OS branch aliasing or
interference is also quantified. Section 7.3 introduces OS-aware prediction designed
specifically to reduce user/OS branch aliasing. Section 7.4 evaluates the improvement
contributed by the OS-aware philosophies to various branch prediction strategies. Section
7.5 revisits the efficiency of OS-aware branch prediction. Section 7.6 discusses the
related work. Finally, conclusions are provided in Section 7.7.
7.2 CHARACTERIZATIONS OF OS BRANCHES
In this section, simulation of complete system activity is used to characterize OS
branch execution and evaluate its impact on branch predictability. Table 7.1 summarizes
the complete system branch execution statistics of each studied benchmark.
As illustrated in Table 7.1, the kernel portion of dynamic branch instances can be
found to constitute a significant part in these applications. On the average, kernel
branches, which include loops, error/bound checking, and other routine conditionals,
constitute 27% of branch sites and 30% of dynamic branch instances in benchmark
executions. Branches are more frequent in OS (than in user mode) [70] because it has to
be designed to handle all possible situations (i.e., abundant error and bound checking).
Further, the OS functions are performed not just for one process/application but also for
the system as a whole (other daemons, periodic book-keeping duties etc.). 101

Table 7.1: Complete System Branch Execution Statistics
Conditional Branch Statistics User OS Benchmarks
# of Context Switches between User/OS
Static Sites
Dynamic Instances
Static Sites
Dynamic Instances
db 935,783 33,957 13,147,512 6,016 19,742,706 jess 4,852,221 38,654 35,986,299 6,037 28,266,026 javac 2,039,387 38,815 34,766,245 6,070 20,807,714 jack 23,530,133 40,640 210,722,195 6,142 40,451,532 mtrt 5,949,357 36,629 195,674,102 6,099 23,343,298 compress 11,819,663 33,907 406,427,219 6,081 26,101,839 gcc 4,975,087 13,570 138,915,436 4,696 13,845,466 vortex 21,486,430 4,108 133,545,812 1,189 11,976,141 pmake 1,018,543 11,651 122,460,692 5,273 33,821,182 sendmail 1,438,961 4,516 139,259,991 5,553 75,069,918 postgres.select 5,632,788 8,417 107,228,678 6,201 93,551,585 postgres.update 6,385,224 8,144 83,362,599 6,325 149,084,522 postgres.join 5,858,258 8,606 220,730,099 6,099 72,657,859
7.2.1 Context Switch Profile and Branch Distribution
During the execution, branch instructions from user and OS code get interspersed.
OS is activated either voluntarily by a system call from the application, or from a call by
some other application, or implicitly by some underlying periodic/asynchronous
(timer/device interrupt) mechanism. The inter-mingling of user and kernel branches can
affect their behavior, compared to the execution when they were isolated from each other.
Figure 7.2 shows the average number of executed branches in each mode per context
invocation on the studied benchmarks. In all benchmarks except db and postgres.update1,
OS exercises fewer branches than user code in each visit to that mode.
We tracked the distribution of the number of executed branches for each context
switch and the profiling results for a 5,000 context switch sample of benchmark jack are
shown in Figure 7.3 for user and kernel code separately. Comparing Figure 7.3a and 7.3b,
one can see that the user contexts can execute far more branches than the OS contexts do.
102
1 For benchmarks db and postgres.update, OS service read and write, which consists of far more branch instructions, dominates OS execution, causing higher average number of executed branches in OS.

Further analysis indicates that most of these OS contexts are caused by exception driven
OS routines (e.g. TLB miss and page fault) that execute very few branches. The
distributions in Figure 7.3 for the kernel are a cause for concern since it indicates the
possibility that the branch history may be not accurate for correct predictions (with
interference from user mode branches). On the other hand, the user branch distribution
suggests that this problem may not be as severe for the user mode. Kernel invocations are
more short-lived, while user execution has reasonable time quanta to work with and build
history.
0
100
200
300
dbjess
javac jack mtrt
compre
ss gccvo
rtex
pmake
send
postg
res.selec
t
postg
res.upd
ate
postgr
es.jo
inAVG
Aver
age
Num
ber o
f Ex
ecut
ed B
ranc
hes OS
User
Figure 7.2: Average Number of Executed Branches (User vs. Kernel)
user
1
10
100
1000
0 1000 2000 3000 4000 5000
User Context Serial No.
Num
ber o
f Exe
cute
d B
ranc
hes
(a)
OS
1
10
100
1000
0 1000 2000 3000 4000 5000
OS Context Serial No.
Num
ber o
f Exe
cute
d B
ranc
hes
(b)
Figure 7.3: Executed Branches in User and OS Contexts
103

7.2.2 OS Branch Execution Profile
We next examine what are the dominant kernel branches, and how their
performance can be affected by the user code executing between OS operations. The pie
chart of Figure 7.4 shows the percentage of OS branches (the average of all the
experimented benchmarks) executed in the different services. The result of individual
benchmark can be found in Appendix B. The top five components include: OS
scheduling (scheduling); TLB miss (TLB miss); idle looping (idle); performing file and
I/O services (I/O & file system), and paging (paging).
Miscellaneous5%
I/O & file system5%
Synchronization3%
Idle6%
Paging5%
Exception handling
1%
System calls1%
TLB miss18%
Scheduling56%
Figure 7.4: Where do the OS Dynamic Branches Come from?
These results show that we really need to focus mainly on the TLB handler (it is
done in software on the given MIPS platform to facilitate the use of flexible page table
structure and simplify the handling of sparse address spaces.) and the scheduler. Further,
it should be noted that other services such as file system, synchronization etc., are
directly invoked by the user code. Hence, their behavior (including that for branches) is
influenced by the current state of the invoking application and the parameters of the call.
So one would not like to associate the term “interference” for such services. On the other
104

hand, TLB handling and scheduler invocations are not necessarily voluntary. It is useful
to understand how the branches in these OS subsystems are invoked and whether history
would have any bearing on their behavior for predictability – so that we can better
understand if the predictability of these branches would be affected by the user code
getting in-between.
Table 7.2 further shows the OS routine based branch distribution. The utlb is the
OS TLB miss handler. The checkRunq routine performs scheduling (picking the next
process to run). The idle does idle looping. Explicit system calls from user code are
handled by syscall. The io_splock routine manipulates I/O spin locks to ensure that all
operations to a particular I/O device are synchronized. The exception_ip12 is the OS
general exception handler. The bcopy is a memory copy routine used for paging and
buffer copying in OS. The mrlock routine gets the states of locks and semaphores. Table
7.2 gives further evidence of the significance of the TLB handling and scheduler
subsystems on the overall branches within the OS. Though utlb and checkRunq both have
high dynamic branch instances, the number of actual branch sites is quite small. We
briefly go over these routines below identifying the branches in these routines and their
anticipated behavior qualitatively.
The utlb handler has only 1 branch, and the reason for its high dynamic instance is
because this routine is invoked frequently. The utlb routine is invoked directly by the
hardware which is the only entity that can invoke this operation. On the other hand, the
scheduler (checkRunq) is invoked from several places. First, this operation is needed for
scheduling decisions (by consulting the ready queue) whenever the time quantum expires
(triggered by timer interrupt), when I/O device activity completes (there are usually
priority boosts and rescheduling may be needed) and idle looping, or even voluntarily
during blocking (making semaphore, I/O requests etc.) or other process state change
105

activities (such as termination). Consequently, it is to be noted that, while utlb
invocations are only the consequence of application behavior, the scheduler actions are
invoked from all over the OS and are invoked either asynchronously (by hardware
events) or voluntarily due to system load/behavior. In all, it is found there are more than
23 events that can cause checkRunq to be invoked.
Table 7.2: OS Routine Branch Characterization
OS Routine % Dynamic Branches
Active Branch
Sites utlb 38.7 1checkRunq 34.2 6idle 3.89 3syscall 2.8 14io splock 2.38 5exception ip12 2.08 6bcopy 1.5 6mrlock 1.17 8vsema 0.65 5uiomove 0.6 10findchunk 0.48 8blkclr 0.48 1ufget 0.48 8mrunlock 0.45 3copyout 0.42 3getff 0.42 7psema 0.42 6
7.2.3 Characteristics of OS Branches
This subsection investigates specific properties of OS branches and their
architectural implications.
7.2.3.1 Weakly Biased Branches
106
It is well known that branches often have biased behavior and many branches are
either usually “taken” or usually “not taken”. The conventional branch history table
(BHT) counters exploit this behavior to predict future outcomes of that branch. However,
when branches showing different biases are mapped into the same entry of the predictor

table, aliased branches update BHT counters with different directions, leading to aliasing
mispredictions.
We measure branch direction distribution in order to gain more insight on bias
behavior of the user and OS branches. Figure 7.5 shows the result based on the average of
all benchmarks. The result of individual benchmark can be found in Appendix C. The
branch sites are categorized into 100% “taken” (always-taken), 0% “taken” (always-not-
taken) and groups between them. For example, the marker “70%-79%” on X-axis implies
that branch sites that fall into this category have a possibility of 70% to 79% to be
“taken”.
25.4
13.7 13.4
4.21.8
23.9
19.9
30.4
0
5
10
15
20
25
30
always-take
n (100%)
90%-99%
80%-89%
70%-79%
60%-69%
50%-59%
40%-49%
30%-39%
20%-29%
10%-19%1%-9%
always-not-taken (0
%)
Branch Direction
% o
f Dyn
amic
Bran
ches AVG-user
AVG-OS
Figure 7.5: User and OS Branch Directions
The results show that user and OS branches behave differently in terms of the bias
or direction distribution. For example, on benchmark jack, 46% of dynamic branches in
kernel are “always taken” while their counterparts in user code are only 15%. On the
other hand, 18% of dynamic branches in kernel are “always not taken” and that number
in user mode can be as high as 42%. This implies that even when the strongly biased user
and kernel branches are mapped into the same BHT counter, it is likely that they will lead
to aliasing misprediction.
107
Another interesting observation is that while the dominant portion of branch sites
is strongly biased (i.e. always taken or always not taken) in user code, a significant
number of branches are weakly biased in OS code. More precisely, it is observed that
13.4% of dynamic branches that contribute to the weakly biased (with the category of
40%-49%) branches shown in Figure 7.5, come from a wide range of 22 kernel service
routines. The weakly biased OS branches showing interleaved directions are also found
on other benchmarks, as shown in Appendix C. Among these is the checkRunq routine
that is frequently invoked. This routine checks through queues to find out if a
rescheduling decision needs to be made. Intuitively, it can be hypothesized that the
execution characteristics of such a routine are more a function of the load on the system
more than anything else. Even when the load does not change very much during the
course of this execution, there are bursts of I/O, synchronization activity and other events
that can exercise the checkRunq differently, causing its branch to vary direction. Weakly
biased branches can be a problem to many branch predictors, which rely on the persistent
history and saturated 2-bit counter for accurate branch prediction.
7.2.3.2 How Correlated are Kernel Branches?
I observe that many OS branches are very correlated and hence benefit from two-
level predictors that exploit global history correlation. It should be noted that the utlb
routine has a single branch that is nearly always taken. While static predictors would
suffice for this branch, previous history is also a very good indicator for this particular
branch that accounts for a large portion of the kernel’s dynamic branches. Further, OS
exception handlers frequently use binary decision trees to classify and dispatch vectored
interrupts from the trap entry point to the specific fault handler. Figure 7.6a shows an
example use of such a structure in the general exception handler exception_ip12 OS code.
This handler dispatches an exception to the corresponding kernel processing routine 108

based on the value of the exception vector. The binary decision tree based branch
sequence of this handler is given in Figure 7.6b. It can be observed that the branches in
the OS routine inttrap will be correlated with a NNT branching sequence while the
branches in systrap will be correlated with a NNNT branching sequence. Hence Gshare
[54] and GAg [90] predictors work extremely well with these branches.
0x80007dd4: <exception_ip12> andi $k0,$k0,0x7c li $k1,124 beq $k0,$k1,0x80007d0c <handle_vced> li $k1,56 beq $k0,$k1,0x80007cec <handle_vcei> li $k1,32 beqz $k0,0x800080f0 <inttrap> sw $at,-24524($zero) beq $k0,$k1,0x80008770 <systrap> li $at,8 beq $k0,$at,0x80007e78 <kmiss> li $at,12 beq $k0,$at,0x80007e78 <kmiss> li $at,92 beq $k0,$at,0x80007e60 <exception_ip12+8c> li $at,36 bne $k0,$at,0x80008274 <longway> mfc0 $k0,$12 andi $k0,$k0,0x18 bnez $k0,0x80008274 <longway> mfc0 $k0,$13 bgez $k0,0x80007e48 <exception_ip12+74> . . . jr $at
beq
handle_vcedbeq
handle_vceibeqz
inttrapbeq
beq
beq
beq
bne
bnez
systrap
kmiss
kmiss
exception_ip12+8c
longway
longwaybgez
exception_ip12+74...
T
T
T
T
T
T
T
T
N
N
N
N
N
N
N
N
N
N
T
T
NNT
NNNT
(a) OS Assembly Code to Perform General Exception Handling
(b) Binary Decision Tree based Branching Sequence Corresponding to Code Shown in (a)
Figure 7.6: Branch Correlation in OS Code
7.2.3.3 Impact of Intermittent Kernel Execution
Even strongly biased OS branches can experience mispredictions due to the user
code interference. An example for this can be obtained from the utlb routine from the OS.
Since the utlb handler needs to be very efficient, this code is usually written in assembly
and is hand-optimized. There are exactly 13 instructions in this routine, with the bulk of
the instructions used to read the page table entry from the memory system and load it into
the TLB. There is exactly 1 branch within this code that is strongly taken. But intervening
user code interference can result in mispredictions in even such strongly biased branches.
109
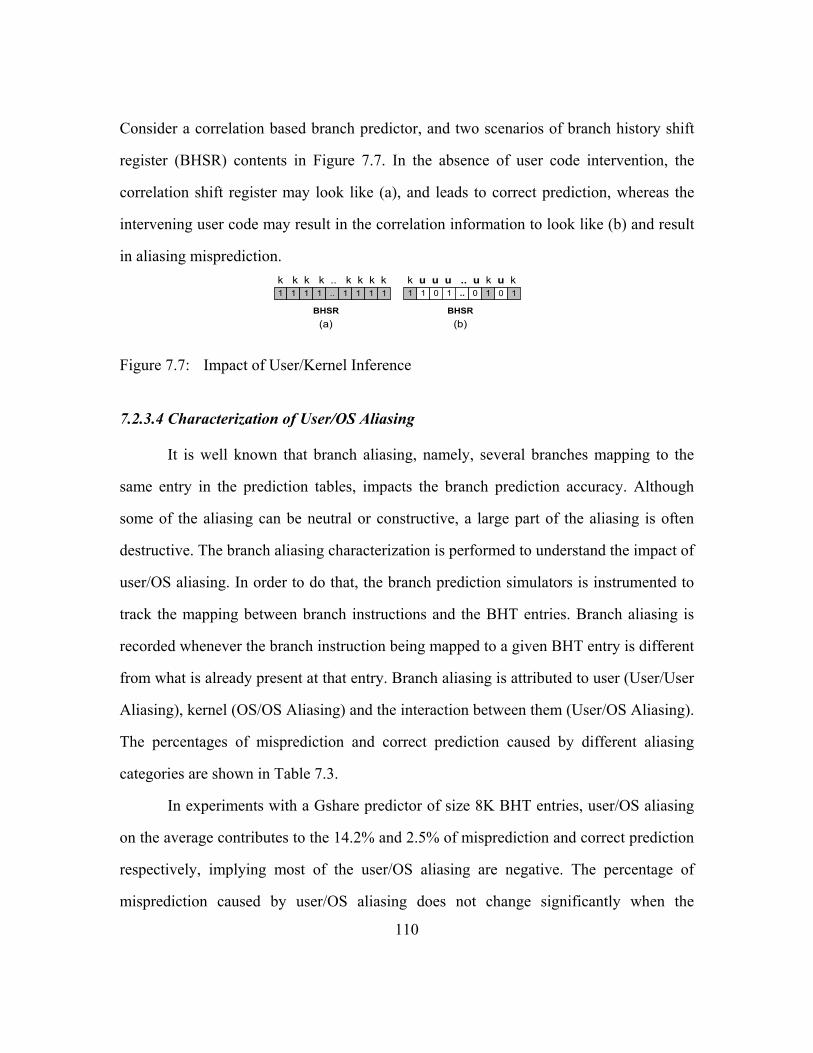
Consider a correlation based branch predictor, and two scenarios of branch history shift
register (BHSR) contents in Figure 7.7. In the absence of user code intervention, the
correlation shift register may look like (a), and leads to correct prediction, whereas the
intervening user code may result in the correlation information to look like (b) and result
in aliasing misprediction.
BHSR
k k k k .. k k k k
BHSR
1 ..1 10k u u u .. u k u k
0 11 1 1 1 .. 1 1 1 1 0 1
(a) (b)
Figure 7.7: Impact of User/Kernel Inference
7.2.3.4 Characterization of User/OS Aliasing
It is well known that branch aliasing, namely, several branches mapping to the
same entry in the prediction tables, impacts the branch prediction accuracy. Although
some of the aliasing can be neutral or constructive, a large part of the aliasing is often
destructive. The branch aliasing characterization is performed to understand the impact of
user/OS aliasing. In order to do that, the branch prediction simulators is instrumented to
track the mapping between branch instructions and the BHT entries. Branch aliasing is
recorded whenever the branch instruction being mapped to a given BHT entry is different
from what is already present at that entry. Branch aliasing is attributed to user (User/User
Aliasing), kernel (OS/OS Aliasing) and the interaction between them (User/OS Aliasing).
The percentages of misprediction and correct prediction caused by different aliasing
categories are shown in Table 7.3.
In experiments with a Gshare predictor of size 8K BHT entries, user/OS aliasing
on the average contributes to the 14.2% and 2.5% of misprediction and correct prediction
respectively, implying most of the user/OS aliasing are negative. The percentage of
misprediction caused by user/OS aliasing does not change significantly when the
110

predictor size is increased from 8K entries to 64K entries. This indicates that just
increasing the capacity of the branch predictor will not effectively solve the user/OS
aliasing problem.
Table 7.3: Characterization of Branch Aliasing
(8K BHT Eentries Gshare, MR: Misprediction Rate)
Benchmarks Metric OS/OS Aliasing
User/User Aliasing
User/OS Aliasing
% of Misprediction 6.2 28.2 19.4 db (MR=4.8%) % of Correct Prediction 1.4 2.7 2.1
% of Misprediction 3.3 37.3 20.1 jess (MR=8.8%) % of Correct Prediction 1.4 6.5 3.9
% of Misprediction 3.1 34.7 16.4 javac (MR=7.1%) % of Correct Prediction 0.7 5.2 2.4
% of Misprediction 1.3 35.7 18.8 jack (MR=8%) % of Correct Prediction 0.6 7.9 4.7
% of Misprediction 1.3 23.5 10.2 mtrt (MR=4%) % of Correct Prediction 0.2 3.8 1.1
% of Misprediction 0.7 12.0 2.5 compress (MR=3.1%) % of Correct Prediction 0.1 4.7 0.2
% of Misprediction 0.3 41.5 6.2 gcc (MR=10.2%) % of Correct Prediction 0.1 10.5 1.9
% of Misprediction 0.1 39.4 11.7 vortex (MR=7.8%) % of Correct Prediction 0 11.8 3.8
% of Misprediction 3.6 25.1 9.4 pmake (MR=6.6%) % of Correct Prediction 0.5 4.6 1
% of Misprediction 22.2 9 23.7 sendmail (MR=9.3%) % of Correct Prediction 3.8 1.7 2.9
% of Misprediction 7.4 16 19.7 postgres.select (MR=3.1%) % of Correct Prediction 0.9 2.4 2.2
% of Misprediction 7.8 18.4 22.4 postgres.update (MR=5.7%) % of Correct Prediction 1.7 3.3 3.8
% of Misprediction 1.1 15 4.5 postgres.join (MR=5.6%) % of Correct Prediction 0.2 5.3 1.1
111
The user/user aliasing that many previous studies have evaluated is still important
as the results observed from Table 7.3 indicate. However, user/OS aliasing is also a big
source for mispredictions. Table 7.4 characterizes the impact of branch aliasing on
misprediction in user and OS component. With an 8K BHT entry Gshare, approximately
22-62% of mispredictions in OS code are found to be from user/OS aliasing, suggesting
that it is essential to protect kernel branch predictors from interference from user code.

Table 7.4: Characterization of Misprediction due to Branch Aliasing
(8K BHT Entries Gshare, MR: Misprediction Rate)
Benchmarks OS/OS Aliasing
User/User Aliasing
User/OS Aliasing MR%
User -- 39.0 13.5 8.6db OS 22.3 -- 34.9 2.3User -- 47.3 12.8 12.3jess OS 15.5 -- 47.7 4.3User -- 42.0 10.0 9.3javac OS 17.9 -- 47.0 3.5User -- 43.9 11.6 7.8jack OS 6.9 -- 50.4 9.4User -- 26.6 5.8 3.9mtrt OS 11.5 -- 44.0 4.7User -- 12.5 1.3 3.1compress OS 16.8 -- 32.0 2.1User -- 43.6 3.3 10.6gcc OS 6.7 -- 62 5.8User -- 44.7 6.6 7.5vortex OS 1 -- 49.5 11.3User -- 28.8 5.4 7.2pmake OS 28 -- 36.2 4.3User -- 19.9 26.2 6.3sendmail OS 40.5 -- 21.6 14.9User -- 26.7 16.5 3.5postgres.select OS 18.4 -- 24.5 2.6User -- 29.3 17.9 9.6postgres.update OS 21 -- 29.9 3.5User -- 16.1 2.4 7postgres.join OS 16.2 -- 33.5 1.6
7.3 ALLEVIATING IMPACT OF USER/OS INTERFERENCE
It is clear from the prior sections that user and kernel code possess different
branch behavior, often resulting in conflicts in unified structures that capture branch
history. In subsections 7.3.1 and 7.3.2, two philosophies that aim to alleviate the
destructive impact of OS branch execution on branch predictability are presented.
112
During the initial period of a context switch, both user and kernel history patterns
coexist in history capturing structures. In Gshare and any correlation based predictor, this
can happen in shift registers (BHSRs) that capture correlation between branches and/or
branch history tables (BHTs). One solution is to use separate shift registers to
individually keep track of branch correlation and another solution is to use separate
BHTs.

7.3.1 Split BHSR Predictor
The OS-aware techniques are illustrated in the context of a Gshare predictor, but
it can be applied to other correlation-based predictors as well. A Gshare predictor with
split correlation history shift registers (i.e. split BHSR predictor) is illustrated in Figure
7.8. The split BHSR predictor functions exactly the same as a conventional Gshare
predictor except that two dedicated BHSRs (i.e., U-BHSR for user and K-BHSR for
kernel) are used to gather branch correlation patterns and to generate BHT indexing. By
using K-BHSR for kernel branches, the split BHSR predictor overcomes the loss of
branch history patterns in kernel mode. Meanwhile, the split BHSR predictor
dynamically switches between BHSRs when a context switch occurs, preventing the BHT
indexing ambiguity during the initial stages of a context switch.
K-BHSR
branch address
XOR
i bits
i bits
i bits
..
..
BHT of 2i Entriespr
edic
tion
execution mode bit
U-BHSR
...
Processor Status Register
Figure 7.8: Gshare with Split BHSR
7.3.2 Split Predictor
The proposed split BHSR predictor aims to preserve accurate BHT counter
indexing during a context switch. However, user/OS aliasing can still occur when user
and kernel branches have the same XORed global history pattern, but opposite biases.
Due to their different branch bias distribution, user and kernel branches can update BHT 113

counters in different manners. To reduce the destructive user/OS branch aliasing in BHT,
we propose the use of split BHT for each, which yields split predictor, as shown in Figure
7.9. This predictor eliminates the destructive user/OS aliasing by using separate
correlation and history information for user mode and kernel mode. It is also observed
that when branch history tables are split into user and kernel parts, the kernel BHT can be
smaller than the user BHT because of the fewer active branch sites in kernel (as shown in
Table 7.1).
K-BHSR
XOR
i bits K-BHT of 2i Entries
execution mode bit
branch addressi bits
XOR
...
..j bits
j bits
U-BHSR
pred
ictio
n
...U-BHT of 2j Entries
Processor Status Register
..
Figure 7.9: Split Gshare Predictor
In this study, we only consider the design space in which the proposed schemes
are cost-effective than the baseline model. Therefore, we allocate U-BHT with half size
of that used by conventional Gshare predictor for user code and allocate a smaller K-BHT
for kernel code. To understand performance trade-off on K-BHT sizes, we simulate the
split Gshare schemes that have varied K-BHT sizes, i.e., 1K, 2K, 4K and equivalent to
that of U-BHT. Figure 7.10 shows misprediction rates (average number of benchmarks)
yielded by split Gshare predictors with different K-BHT sizes. Note that in Figure 7.10,
the misprediction rates on conventional Gshare are also shown for illustration. The value
114

x shown on X-axis is the predictor size of conventional Gshare. The size of
corresponding split OS-Gshare is x/2+K-BHT-size.
Figure 7.10 shows that resource constrained split Gshare with 1K K-BHT causes
higher misprediction rates than its conventional Gshare counterpart with large BHT
configuration. The 2K K-BHT configuration outperforms Gshare. Further increasing K-
BHT beyond 2K does not gain significant performance improvement. Therefore, we kept
the user BHT at half the size of the original Gshare and allocate kernel BHT with a fixed
size of 2K entry in our experiment.
0
1
2
3
4
5
6
7
8k 16k 32k 64k 128k 256k 512k
Number of BHT Entries
Mis
pred
ictio
n R
ate
(%)
Gshare1/2 Gshare + 1K K-BHT1/2 Gshare + 2K K-BHT1/2 Gshare + 4K K-BHTHalf-Half Splitting
Figure 7.10: K-BHT Size Trade-off
7.3.3 Integrating with Other Predictors
115
Splitting user and kernel prediction resources is a technique suggested by the
characterization study, not necessarily a particular predictor. We surveyed literature to
identify branch predictors, which may be poised to handle branches with the
characteristics unveiled in the earlier sections. Although not targeted for OS-user branch
interference, Multi-Hybrid [22], Agree [77] and Bi-Mode schemes [44] do contain
mechanisms tailored for branches with heterogeneous characteristics and/or de-aliasing.
Table 7.5 summarizes these schemes, and the additional cost used for branch de-aliasing.

The sizes of all the predictors are normalized to Gshare to give an indication of the
associated area cost.
Table 7.5: A Comparison of Several Branch De-aliasing Schemes
Predictor Description of feature to exploit heterogeneous branches or De-aliasing
Additional Branch
De-aliasing Hardware
Predictor Size
Normalized to Gshare (8k-256k)
Gshare [54]
Consists of one correlation shift register (BHSR) and one BHT. BHSR is XORed with branch address bits of a branch address to index BHT entry. The XORing helps to reduce aliasing effects.
0 1
Multi-Hybrid 1, 2 [22]
Consists of multiple single-scheme components: simple 2-bit (2bc), GAs, Gshare, Pshare and always taken predictor. Use of simple 2-bit predictors (2bc) and static predictors as components of the multi-hybrid predictor provides quick warm up after a context switch.
5×2K predictor selection counters in BTB
1.04-2.25
Agree [77]
Converts instances of destructive aliasing into either constructive or neutral aliasing by attaching each branch with a biasing bit that predicts the most likely outcome of that branch.
2K biasing bits in BTB 1-1.13
Bi-Mode [44]
Uses separate history tables for taken and not-taken branches, and a selection branch history table. This classification helps to alleviate destructive aliasing while keeping the harmless aliasing together.
the third BHT for dynamic bias selection
1.5
OS-aware split BHSR predictor [this research]
OS-aware Gshare predictor uses separate shift registers (U-BHSR and K-BHSR) for capturing path history patterns. 1 shift register 1
OS aware split predictor [this research]
OS-aware Gshare predictor that uses separate branch history tables for user and kernels. Kernel-BHT is 2K and User-BHT is 50% of Gshare.
consumes less BHT resource than Gshare
0.51-1
1. The simulated Multi-Hybrid does not include AVG predictor [15] because it needs source recompilation which often is difficult for commercial and complicated software like OS. 2. As indicated by [22], we allocate half of the total budget for Gshare, a quarter of the total budget for Pshare, and 1/8 for 2bc and Gas respectively. The priority ordering of the component predictors is 2bc, GAs, Gshare, Pshare and always taken scheme.
As shown in Figure 7.11, all these predictors contain a Gshare predictor or a
Gshare indexing [22][77][44]. To integrate the proposed techniques, we simply replace
the conventional Gshare component used in the above predictors with the proposed OS-
aware split-BHSR Gshare predictor and split Gshare predictor.
Table 7.6a shows the average (of the 13 studied benchmarks) misprediction rates
of each baseline predictor and the percentage of misprediction reduction by incorporating
the OS-aware techniques proposed in this paper. Table 7.6b further illustrates the
116

breakdown of the misprediction reduction in user and OS parts, for each individual
benchmark.
branch address
XOR
..
BHT
BHSR
...BTB
biasin
g bit
agree/disagree
pred
ictio
n
(b) Agree
Predictor Selection Counters BTB
pred
ictio
n
branch address
XOR
..BHSR
...
BHT
branch address
...
BHT
1
Priority Encoderbranch address
... ... ...
...
...
...
...
BHSR..
BHT
branch address
XOR ...
BHSRs
BHT
...
2bc (1/8)
GAs (1/8)
Gshare (1/2)
Pshare (1/4)
Always taken (0)
(a) Multi-Hybrid
branch address
XOR
..
Direction BHT (T)
BHSR
pred
iction
...
...
...
Choice BHT
Direction BHT (NT)
(c) Bi-Mode
Replace with OS-aware Gshare
Figure 7.11: Integrating with Other Predictors
As described in subsection 7.4.1, split BHSR predictor only separates the branch
history shift registers. The partitioning of the BHT for user or OS happens dynamically.
The resource available for the code is not less than that in the baseline. Hence, split
BHSR predictor is never inferior to the baseline. Split predictor is at times worse than the
baseline. In split predictor, the partitioning of the BHT between user and kernel code is
done statically. Both the user and kernel BHTs are smaller than the unified BHT in the
baseline configuration. In the configurations studied in this paper, the user BHT is only
50% of the baseline BHT, and the K-BHT is fixed at 2K in all cases. Hence, the overall
size of the philosophy 2 BHT is not much greater than 50% of the BHT in the baseline. A
2K K-BHT is seen to be sufficient to capture all history patterns in the OS code and
except in postgres.update, the mispredictions in OS code goes down. For the user part,
117

the small size of the U-BHT (4K BHT entries) can detrimentally affect the performance
on benchmarks compress, gcc, pmake, postgres.select and postgres.join.
Table 7.6a: Misprediction Reduction by Introducing OS-aware Prediction
Schemes Size (Number of BHT entries, not including de-aliasing overhead)
8k 16k 32k 64k 128k 256k14.03 12.35 10.89 9.64 8.66 8
Gshare+OS-aware Split BHSR Predictor % of Misprediction Reduction 31% 32% 31% 29%
Gshare+OS-aware Split Predictor % of Misprediction Reduction 20% 24% 22% 20% Multi-Hybrid Misprediction(in %) 10.87 9.53 8.58 7.66 6.96 6.3
21% 22% 23% 23% 22% 22% Multi-Hybrid+OS-aware Split Predictor % of Misprediction Reduction 13%
Metric
Misprediction(in %) Gshare
33% 34%
17% 15%
Multi-Hybrid+OS-aware Split BHSR Predictor % of Misprediction Reduction
12% 13% 11% 10% 8%
Agree Misprediction(in %) 12.59 11.41 10.46 9.66 9.13 8.78
% of Misprediction Reduction 27% 27% 27% 26% 25% 24%
Agree+OS-aware Split Predictor % of Misprediction Reduction 19% 20% 20% 19% Bi-Mode Misprediction(in %) 7.7 6.95 6.42 6.07 Bi-Mode+OS-aware Split BHSR Predictor % of Misprediction Reduction 10% 9% 9% 9% 9% 9%
4% 2% 1% 1% 0% 0%
On the average, with a 32K BHT entry Gshare, incorporating OS-aware split
BHSR predictor and split predictor reduces 34% and 22% of the misprediction. OS-aware
predictions also reduce the misprediction of Multi-Hybrid, Agree and Bi-Mode
predictors. For instance, compared with the 32K BHT entry baseline predictors, OS-
aware Multi-Hybrid, Agree and Bi-Mode predictors yield up to 23%, 27% and 9%
prediction accuracy improvement respectively, implying that OS-aware predictions still
provide significant improvements on some of the most powerful predictors.
As shown in Table 7.6a and Table 7.6b, split BHSR predictor outperforms split
predictor on most of the de-aliasing predictors examined. Considering overall
performance, in more than half the cases, the performance gain due to the elimination of
user/OS aliasing by split predictor outweighs the performance loss due to individually
using smaller prediction tables for each part. More precisely, for example, the OS-aware
Agree+OS-aware Split BHSR Predicor
22% 22% 5.79 5.57
% of Misprediction Reduction Bi-Mode+OS-aware Split Predictor
118

split p predictor reduces 22% of misprediction on a conventional Agree predictor of 32K
BHT entries, using only 18K entries BHT consisting of a 16K entries U-BHT and a 2k
entries K-BHT.
Table 7.6b: OS-aware Prediction: Breakdown of Misprediction Reduction
Gshare + OS-aware
Multi-Hybrid + OS-aware
Agree +OS-aware
Bi-Mode + OS-aware
Split BHSR
Predictor
Split Predictor
Split BHSR
Predictor
Split Predictor
Split BHSR
Predictor
Split Predictor
Split BHSR
Predictor
Split Predictor
23% 20% 15% 21% 17% 9% 8% OS 8% 7% 11% 15% 7% 7% 10% db Full-System 28% 14% 20% 16% 8% 8% User 39% 31% 34% 27% 13% 8% OS 52% 42% 12% 36% 13% 20% jess Full-System 42% 34% 28% 23% 29% 13% 10% User 28% 19% 20% 13% 24% 4% OS 40% 36% 10% 20% 42% 41% javac Full-System 30% 22% 18% 14% 27% 21% 8% User 57% 47% 47% 39% 51% 42% 21% 13% OS 79% 82% 29% 49% 64% 70% 43% 53% jack
61% 53% 46% 40% 53% 46% 23% 17% 15% 27% 19% 20% 11% 7% 4%
OS 59% 15% 23% 49% 48% 19% 27% mtrt Full-System 31% 19% 22% 15% 8% 6% User 11% -27% 7% -30% 3% 2% OS 43% 29% 7% 12% 8% 13% compress Full-System 12% -25% 10% 1% 3% 3% User 16% 2% 10% -1% 12% -1% OS 46% 55% 3% 26% 62% 68% 31% gcc Full-System 18% 5% 10% 0% 15% 7% 10% User 76% 63% 71% 48% 73% 65% 35% 28% OS 96% 97% 30% 54% 98% 99% 67% 77% vortex
78% 68% 70% 48% 78% 72% 37% 31% -6% 4% -11% 6% -7% 4% -6%
OS pmake
% of Misprediction Reduction for Different Schemes (8K BHT Entries)
Benchmarks
28% User 28%
19% 16% 31% 25%
15% 44% 36%
17% 8% 9% 18%
6%
Full-System 27% User 60%
20% 25% 10% -3%
11% 19% 7% -29%
2% 10% 14%
1%
Full-System 8% User 11% 2% 2% 8% 7% 13% 3% 8%
-4% 4% -8% 6% -5% 4% -4% User 5% 3% 1% 0% 3% 1% OS 5% 1% 3% 2% 2% 2% Full-System 5% 1% 2% 0% 2% 2% User 47% 12% 50% 48% 36% OS 27% 8% 17% 29% 14% 13% postgres.select
30% 35% 16% 40% 40% -14% User 35% 30% 25% 25% 23% 21%
14% -10% 6% 6% 9% 5% 5% postgres.update Full-System 27% 17% 19% 22% 16% 15% User 12% -6% 8% -1% -6% 3% -6% OS 15% 26% 35% 44% 26% Full-System 14% -4% 9%
8% Full-System 2% 2%
0% 3% sendmail 3% 2%
56% 45% -34% 22% 26%
45% 26% Full-System 25% 24%
17% OS 14% 17%
10% 42% 32% 34% postgres.join
0% 12% -3% 4% -5%
119

7.4 PERFORMANCE EVALUATION
The benefits of integrating the above predictors with OS-aware predictions on a
dynamically scheduled superscalar processor are evaluated using a full-system simulator
that captures OS behavior as well. The SimOS MXS model [11], which simulates a
superscalar microprocessor with multiple instruction issue, register renaming, dynamic
scheduling, and speculative execution with precise exceptions, is used. The simulated
architectural model is an 8-issue superscalar processor with instruction latencies as in the
MIPS R10000 [89]. By default, the branch prediction algorithm allows fetch unit to fetch
through up to 4 unresolved branches. In the model, a misprediction will cause a 10-cycle
penalty. BHSR is speculatively updated and later corrected after a misprediction. BHT
counter update takes place in order at instruction commit time.
Figure 7.12 shows the IPC performance for this scenario. Since instruction counts
are the same, IPC improvement is indicative of execution cycle improvement. Results are
depicted for the 13 evaluated programs. Comparison of predictors integrating OS-aware
prediction techniques with Gshare, Multi-Hybrid, Agree and Bi-Mode predictors is
presented. The scale of Y-axis is varied for each benchmark due to their differences in
IPC. Split BHSR predictors improve IPC performance on all of the benchmarks for all of
the four types of base predictors. This benefit is particularly substantial in those programs
where user/OS aliasing is significant, such as jess, jack, vortex, and postgres.update (as
was illustrated in Figure 7.1). The same trend can be observed in programs such as javac
and db. For those programs where the impact of user/OS aliasing on misprediction is less
significant (for instance, compress and pmake), the integration of OS-aware techniques
show only limited improvement.
120

db
1.5
1.55
1.6
1.65
1.7
32K BHT Entries
IPC
jess
1.3
1.35
1.4
1.45
1.5
1.55
1.6
32K BHT Entries
IPC
javac
1.5
1.55
1.6
1.65
1.7
32K BHT Entries
IPC
GshareGshare+Split BHSR PredictorGshare+Split PredictorMulti-HybridMulti-Hybrid+Split BHSR PredictorMulti-Hybrid+Split PredictorAgreeAgree+Split BHSR PredictorAgree+Split PredictorBi-ModeBi-Mode+Split BHSR PredictorBi-Mode+Split Predictor
jack
1.4
1.45
1.5
1.55
1.6
32K BHT Entries
IPC
mtrt
1.8
1.85
1.9
1.95
2
32K BHT Entries
IPC
compress
1.7
1.75
1.8
1.85
1.9
32K BHT Entries
IPC
GshareGshare+Split BHSR PredictorGshare+Split PredictorMulti-HybridMulti-Hybrid+Split BHSR PredictorMulti-Hybrid+ Split PredictorAgreeAgree+Split BHSR PredictorAgree+ Split PredictorBi-ModeBi-Mode+Split BHSR PredictorBi-Mode+ Split Predictor
gcc
1.2
1.25
1.3
1.35
1.4
1.45
1.5
32K BHT Entries
IPC
vortex
1.5
1.55
1.6
1.65
1.7
1.75
1.8
32K BHT Entries
IPC
pmake
1.5
1.55
1.6
1.65
1.7
1.75
1.8
32K BHT Entries IP
C
GshareGshare+Split BHSR PredictorGshare+Split PredictorMulti-HybridMulti-Hybrid+Split BHSR PredictorMulti-Hybrid+ Split PredictorAgreeAgree+Split BHSR PredictorAgree+ Split PredictorBi-ModeBi-Mode+Split BHSR PredictorBi-Mode+ Split Predictor
sendmail
1.3
1.35
1.4
1.45
1.5
32K BHT Entries
IPC
postgres.select
1.2
1.25
1.3
1.35
1.4
32K BHT Entries
IPC
postgres.update
1.1
1.15
1.2
1.25
1.3
32K BHT Entries
IPC
GshareGshare+Split BHSR PredictorGshare+Split PredictorMulti-HybridMulti-Hybrid+Split BHSR PredictorMulti-Hybrid+ Split PredictorAgreeAgree+Split BHSR PredictorAgree+ Split PredictorBi-ModeBi-Mode+Split BHSR PredictorBi-Mode+ Split Predictor
postgres.join
1.5
1.55
1.6
1.65
1.7
32K BHT Entries
IPC
GshareGshare+Split BHSR PredictorGshare+Split PredictorMulti-HybridMulti-Hybrid+Split BHSR PredictorMulti-Hybrid+ Split PredictorAgreeAgree+Split BHSR PredictorAgree+ Split PredictorBi-ModeBi-Mode+Split BHSR PredictorBi-Mode+ Split Predictor
Figure 7.12: IPC Improvement of OS-aware Predictors
Integration of split predictor results in improvement in many cases, even though
the predictor size is not much more than 50% of the baseline predictor. In most of the
cases in Gshare, Multi-Hybrid and Agree predictors, despite the small size, split predictor
still results in improvement. In the case of the Bi-Mode predictors, split predictor-
121

integrated case is inferior to the baseline for 5 of 13 benchmarks. However, if one
compares them to a baseline that is comparable in size (i.e., 16K BHT entries), OS-aware
split predictor with 18K BHT entries (16K U-BHT + 2K K-BHT) outperforms 16K BHT
entries baseline predictor in all cases, resulting up to 10% of IPC speedup [48].
Compared with a Gshare predictor, the two proposed techniques – split BHSR
predictor and split predictor yield up to 8% and 7% of IPC improvement respectively.
This improvement is a result of the removal of aliasing mispredictions. The integration of
OS-aware prediction into Multi-Hybrid predictor yields up to 5% of IPC gain. As
described earlier, Multi-Hybrid allocates the largest prediction resource to its Gshare
component and its overall prediction accuracy is more impacted by Gshare than any other
predictor. Hence, the replacement of the conventional Gshare with the proposed OS-
aware Gshare predictors improves performance.
By introducing OS-aware philosophies on the Agree predictor, up to 7% of IPC
improvement can be achieved. The performance of Agree predictor is largely dependent
on branch biases and possibility of identifying the biased behavior the first time the
branch is introduced into the BTB. If the branch does not show strongly biased behavior,
there is still frequent aliasing between instances of a branch that do not comply with the
biasing bit and instances which do comply with the biasing bit. Once we incorporate OS-
aware policies into the Agree predictor, the filtering out of the visible portion of weakly
biased kernel branches leads more U-BHT entries to reach “agree” status.
The IPC improvement of OS-aware Bi-Mode is marginal (1%), but it should be
noted that the OS-aware Bi-Mode consumes only equivalent or less resource to achieve
this performance enhancement. Thus, OS-aware prediction leads to the same performance
with less hardware.
122

The results shown in Figure 7.12 also indicate that the combination of the OS-
aware prediction and a simple predictor (for instance, Gshare) can outperform
sophisticated predictors (e.g., Multi-Hybrid and Agree) with larger size configuration.
Current and next generation microprocessors are becoming increasingly sensitive
to branch prediction accuracy due to the use of deeper pipelines and wider issue
microarchitecture. The proposed techniques are expected to yield more ILP performance
benefit on aggressive implementations with higher misprediction penalties.
7.5 DISCUSSION
02468
1012
db(1
6k)
db(6
4k)
jess
(16k
)
jess
(64k
)
java
c(16
k)
java
c(64
k)
jack
(16k
)
jack
(64k
)
mtrt
(16k
)
mtrt
(64k
)
com
pres
s(16
k)
com
pres
s(64
k)
gcc(
16k)
gcc(
64k)
vorte
x(16
k)
vorte
x(64
k)
send
mai
l(16k
)
send
mai
l(64k
)
post
gres
.sel
ect(1
6k)
post
gres
.sel
ect(6
4k)
post
gres
.upd
ate(
16k)
post
gres
.upd
ate(
64k)
post
gres
.join
(16k
)
post
gres
.join
(64k
)
Benchmark(Gshare Predictor Size)
Mis
pred
ictio
n R
ate
(%) Eliminated by Split BHSR Predictor
Extra Caused by OS ExecutionUser Only
02468
101214
db(1
6k)
db(6
4k)
jess
(16k
)
jess
(64k
)
java
c(16
k)
java
c(64
k)
jack
(16k
)
jack
(64k
)
mtrt
(16k
)
mtrt
(64k
)
com
pres
s(16
k)
com
pres
s(64
k)
gcc(
16k)
gcc(
64k)
vorte
x(16
k)
vorte
x(64
k)
send
mai
l(16k
)
send
mai
l(64k
)
post
gres
.sel
ect(1
6k)
post
gres
.sel
ect(6
4k)
post
gres
.upd
ate(
16k)
post
gres
.upd
ate(
64k)
post
gres
.join
(16k
)
post
gres
.join
(64k
)
Benchmark(Gshare Predictor Size)
Mis
pred
ictio
n R
ate
(%)
Eliminated by Split BHSR PredictorExtra Caused by User ExecutionOS Only
(a) User
(b) OS
Figure 7.13: Impact of OS-aware Split BHSR Predictor
We motivated the research in this chapter using Figure 7.1, which showed that
kernel interference increases user misprediction from 1.1x to 6x (with an average of
2.1x). Similarly, it is observed that user interference increases OS misprediction from
123

1.3x to 129x (with an average of 13x). In this subsection, we revisit this characterization
in the presence of the OS-aware prediction.
Figure 7.13 illustrates the impact of user/OS execution on branch prediction after
OS-aware split BHSR predictor is integrated with Gshare. Compared with Figure 7.1,
OS-aware split BHSR predictor significantly reduces the negative impact of user/OS
interference on branch prediction, resulting in the drop of mispredictions from 2.1x to
1.2x and from 13x to 2x in user and OS space respectively.
02468
1012
db(1
6k)
db(6
4k)
jess
(16k
)
jess
(64k
)
java
c(16
k)
java
c(64
k)
jack
(16k
)
jack
(64k
)
mtrt
(16k
)
mtrt
(64k
)
com
pres
s(16
k)
com
pres
s(64
k)
gcc(
16k)
gcc(
64k)
vorte
x(16
k)
vorte
x(64
k)
send
mai
l(16k
)
send
mai
l(64k
)
post
gres
.sel
ect(1
6k)
post
gres
.sel
ect(6
4k)
post
gres
.upd
ate(
16k)
post
gres
.upd
ate(
64k)
post
gres
.join
(16k
)
post
gres
.join
(64k
)
Benchmark(Gshare Predictor Size)
Mis
pred
ictio
n R
ate
(%) Eliminated by Split Predictor
Extra Caused by Less (50%) U-BHTUser Only
02468
10121416
db(1
6k)
db(6
4k)
jess
(16k
)
jess
(64k
)
java
c(16
k)
java
c(64
k)
jack
(16k
)
jack
(64k
)
mtrt
(16k
)
mtrt
(64k
)
com
pres
s(16
k)
com
pres
s(64
k)
gcc(
16k)
gcc(
64k)
vorte
x(16
k)
vorte
x(64
k)
send
mai
l(16k
)
send
mai
l(64k
)
post
gres
.sel
ect(1
6k)
post
gres
.sel
ect(6
4k)
post
gres
.upd
ate(
16k)
post
gres
.upd
ate(
64k)
post
gres
.join
(16k
)
post
gres
.join
(64k
)
Benchmark(Gshare Predictor Size)
Mis
pred
ictio
n R
ate
(%)
Eliminated by Split PredictorExtra Caused by Fixed 2K K-BHTOS Only
(a) User
(b) OS
Figure 7.14: Impact OS-aware Split Predictor
Similarly, Figure 7.14 revisits the impact of user/OS on branch misprediction
after an OS-aware split predictor is integrated. Compared with Figure 7.1, OS-aware split
predictor cost-effectively reduces the negative impact of kernel code on branch
misprediction in user part. The misprediction reduction by OS interference removal
outweighs the extra misprediction caused by using less (50%) BHT resource on all 124

benchmarks except compress and pmake. In the OS part, the fixed size 2K K-BHT still
outperforms the performance of a unified 16K BHT on benchmarks jess, javac, jack,
mtrt, gcc, vortex and postgres.join.
7.6 RELATED WORK
There have been limited studies on the impact of OS activity on branch predictors.
Flushing branch prediction tables (i.e., BHT, BHSRs) at a given interval of instructions
have been used to model the effects of context switch in user-code-only simulation by
several research studies [62][22]. However, periodic flushing has been found to
inaccurately estimate user/kernel branch interactions [24] because a short switch does not
necessarily flush the branch history state and such a methodology can unfairly penalize
predictors with large table sizes. The negative impact of kernel branches on branch
prediction has been reported in [24]. However, little research has been done on hardware
optimization to alleviate the destructive user/kernel branch aliasing problem.
Past research has shown that destructive branch aliasing can seriously deteriorate
the performance of branch predictors [92][73][24]. To address the aliasing problem,
Gshare [54] uses “exclusive or” (XOR) of the global history with the low-order address
bits of a branch to form a more randomized BHT index, leading it to be one of the best
single-scheme predictors.
There have been several other proposals to reduce aliasing problems
[16][22[56][77][44]. Evers and Patt propose Multi-Hybrid predictor [22] and show that it
is more accurate than classic two-component hybrid predictors [54] in the presence of
context switch. Multi-Hybrid uses more than two single-scheme predictors and associates
a predictor selection counter with each single-scheme predictor to keep track of the most
accurate component predictor for each branch. A priority encoding mechanism is used to
select the appropriate prediction. Using predictors with short training time (e.g., static 125

predictor, 2bc) to assist the otherwise more accurate predictors (e.g., Gshare, GAs) during
their warm-up phases, Multi-Hybrid maintains high prediction accuracy after a loss of
branch histories due to context switches.
The Agree predictor [77] converts instances of destructive aliasing into either
constructive or neutral aliasing by attaching each branch with a biasing bit that predicts
the most likely outcome of that branch. The 2-bit BHT counter is then interpreted as
whether or not the branch will go in the direction indicated by the biasing bit. The idea
behind the Agree predictor is that most branches are highly biased. If the behavior can be
captured by biasing bits, those branches using the same BHT entry are more likely to
update the counter in the same direction - towards the “agree” state, which will not result
in mispredictions.
In Agree predictor, the biasing bit is determined by the direction of that branch
when it is initially introduced into the branch target buffer (BTB). The Bi-Mode predictor
[44] proposed by Lee and Mudge uses a dedicated choice BHT to dynamically determine
the “taken” or “not-taken” bias. The Bi-Mode predictor splits the conventional BHT table
into two parts; one is a “taken” direction BHT and the other is a “not-taken” direction
BHT. The direction BHTs are indexed by the branch address XORed with the global
history. When a branch is encountered, both direction BHTs make predictions and a
choice BHT entry pointed by branch address is used to choose the final prediction. Later,
only the direction BHT chosen by the choice BHT is updated. As a result of this scheme,
branch predictions stored in a direction BHT will have the same bias. Thus, this
classification helps to alleviate destructive aliasing while keeping the harmless aliasing
together.
There are other branch de-aliasing techniques which trade conflict and capacity
aliasing by introducing multiple BHT banks [56] or use a branch filtering mechanism
126

[16]. Usually, most of existing branch de-aliasing schemes consume extra resources due
to the additional overhead used for branch de-aliasing, such as multiple component
predictor and predictor selection counter table in Multi-Hybrid, biasing bit table in agree
predictor and choice BHT in Bi-Mode predictor.
7.7 SUMMARY
Control flow prediction is one of the key issues in the design of high performance
processors. It is extremely important that processor hardware, software and the operating
system collaborate with each other to deliver high performance. The operating system
affects control flow predictability by introducing the additional user/OS branch aliasing
in predictor hardware. Compared to the branches in user code, the OS branches are
usually invoked by the exception-driven and intermittently executed kernel routines and
may have different biased behavior caused by performing operations not common in user
mode. Thus, when interacted with user branches, the OS branches increase misprediction
significantly.
The proposed OS-aware prediction is a technique that advocates orchestrating
branch correlation information and/or branch history information for user and kernel
branches individually. The proposed OS-aware prediction can be incorporated into any
other predictor, ranging from a naïve Gshare to the more sophisticated Multi-Hybrid,
Agree and Bi-Mode predictors, to further improve prediction accuracy. More precisely,
on the 32K BHT entry predictors, incorporating OS-aware strategies into previously
proposed Gshare, Multi-Hybrid, Agree and Bi-Mode predictors yields up to 34%, 23%,
27% and 9% prediction accuracy improvement and up to 8%, 5%, 7% and 1% execution
speedup respectively.
127
Chapter 8: Conclusions and Future Work
It is a very exciting time to do research in computer architecture area because
VLSI technology continues to provide increasing numbers of transistors and clock speeds
to allow computer architects to build even more powerful microprocessors and computer
systems than those we have seen today.
However, as software technologies evolve, new computer applications and
programming paradigms are constantly emerging to challenge the traditional hardware
designs. Moreover, the high-complexity design driven by the quest for greater
performance has resulted in many critical issues, such as higher power dissipation.
Therefore, there are at least two challenges in high performance microprocessor design:
(1) How to maximize performance across different applications, and (2) How to mange
power dissipation.
It has been proved that in order to achieve higher performance and better energy
efficiency, software behavior and characteristics should be carefully considered during
hardware design. Adhering to this philosophy, previous work extensively exploited the
interactions of applications-compilers-hardware. The Operating System (OS) is a major
software component of today’s complex systems. Nevertheless, its effects on hardware
have largely been ignored.
This dissertation advocates the incorporation of OS component in processor
hardware design. This is particularly interesting because modern and emerging
applications tend to invoke heavier OS activity than traditional and technical workloads.
This trend is likely to continue in the near future and it is very important to consider the
OS not only for performance evaluations, but also when attempting to optimize the
performance and power of hardware.
128

This dissertation demonstrates that with minimal and simple hardware
modifications or additions, OS-aware design philosophy can cost-effectively achieve
higher performance and better energy efficiency.
8.1 CONCLUSIONS
This dissertation makes important contributions to several key areas:
• Complete system, emerging workloads and OS characterization
There is abundant variety among applications running on today’s computer
systems. However, the using of user-only technical workloads has dominantly
driven evaluating architectural designs/optimizations. It is essential to understand
the characteristics of today’s emerging workloads in order to design efficient
architectures for them. Given the facts that emerging and commercial applications
involve system activities significantly, it is nature to consider the using of
complete system evaluation. This dissertation conducts research on full-system
workload characterization to understand the implications of emerging and system
workloads from the system perspective. By exploring interactions of architecture,
applications, OS and managed run-time environments, this dissertation proposes
several system performance and power optimizations targeting for emerging
workloads.
• Run-time OS power estimation
Power modeling is increasingly becoming a critical issue during system designs,
as well as run-time power/performance optimizations. The OS constitutes a major
software component and dissipates a significant portion of total power in many
modern application executions. Therefore, modeling OS power is imperative for
accurate software power evaluation, as well as power management (e.g. dynamic
thermal control and equal energy scheduling) in the light of emerging workload 129

execution. This dissertation conducts research to characterize the power behavior
of a modern, commercial OS across a wide spectrum of applications to understand
OS energy profiles and then proposed various models to cost-effectively estimate
its run-time energy dissipation. Profiling of several Java, Database, file/e-mail
workloads illustrated a strong correlation between IPC and OS routine power.
Exploiting this correlation, we built a model to estimate energy consumption of
OS activity. The proposed models rely on a few simple parameters and have
various degrees of complexity and accuracy. Compared with cycle-accurate full-
system simulation, the model can predict cumulative OS energy to within 1%
accuracy for a set of benchmark programs evaluated on a high-end superscalar
microprocessor. The proposed routine level power model not only offers superior
accuracy when compared to a simpler, flat OS power model, but also provides
per-routine estimation errors of less than 6% when applied to track the run-time
OS energy profile. The integrated OS performance/power characterization not
only leads to efficient power estimation for OS-intensive applications but also
provides hint to reduce OS power consumption. Having known the routine based
power dissipation behavior, hardware can be adapted for power minimization.
• OS power saving
To reduce OS power, hardware can provide resources that closely match the
needs of the OS. However, with exception-driven and intermittent execution in
nature, it becomes difficult to accurately predict and adapt processor resources in
a timely fashion for OS power savings without significant performance
degradation. The OS-aware routine based microprocessor resource adaptation
proposed in this dissertation permits precise hardware reconfigurations for the OS
with low overhead and allows fine-grained performance/power tuning at
130

microarchitectural level. Compared with sampling based techniques, this scheme
has the following advantages: (1) The proposed adaptation scheme guarantees the
timely and fine-grained resolution required to capture the exception-driven, short-
lived OS activity; (2) The adaptation techniques eliminate significant portion of
adaptation overhead; (3) The adaptation scheme has the capability to select the
optimal configuration for different OS code, yielding more attractive power and
performance trade-off; (4) This scheme is orthogonal to and can be integrated
with existing scheme proposed for user-only applications. With the increasing
impact of the leakage power, routine customized aggressive adaptation tends to
save more power by safely turning off more transistors. The proposed scheme can
be exploited in mobile computing systems for energy saving, as well as in
conventional systems for dynamic thermal management.
• OS-aware low power I-cache
Low power has been considered as an important issue in instruction cache (I-
cache) designs. Several studies have shown that the I-cache can be tuned to
reduce power. These techniques, however, exclusively focus on user-level
applications. This study goes beyond previous work to explore the opportunities
of employing the three subsystems – application, OS and hardware – to improve
I-cache energy efficiency. User/OS I-cache accesses on system workloads are
characterized to identify power saving opportunities due to dual-mode operation.
Two techniques, OS-aware cache way lookup and OS-aware cache set drowsy
mode, are proposed to reduce the dynamic and the static power consumption of I-
cache. The OS-aware cache way lookup reduces the number of parallel tag
comparisons and data array read-outs for cache accesses and saves dynamic
power. Integrating with a state-preserving, leakage control mechanism, OS-aware
131

tuning effectively reduces static power, which is gaining in importance due to
CMOS technology scaling. Unlike other proposed schemes, OS-aware tuning
achieves both dynamic and static power savings but require minimal hardware
modification and addition. Simulation based experiments show that with no or
negligible impact on performance, applying OS-aware tuning techniques to a 32
KB, 4-way set-associative I-cache yields significant dynamic and static power
savings across the experimented applications. The proposed techniques can be
implanted into sever processor I-caches mostly targeting on OS-intensive
commercial applications.
• OS-aware control flow prediction
Control flow prediction is one of the key issues in the design of high performance
processors. It is extremely important that processor hardware, software and the
OS collaborate with each other to deliver high performance. The OS affects
control flow predictability by introducing the additional user/OS branch aliasing
in predictor hardware. Compared to the branches in user code, the OS branches
are usually invoked by the exception-driven and intermittently executed kernel
routines and may have different biased behavior caused by performing operations
not common in user mode. Thus, when interacted with user branches, the OS
branches increase misprediction significantly. Current branch predictors have paid
less attention to the OS requirements and therefore, do not contain mechanisms to
specifically alleviate the user/OS aliasing. This dissertation proposes OS-aware
branch prediction designed to reduce user/OS branch aliasing without adding
extra hardware for branch de-aliasing. The proposed OS-aware prediction can be
incorporated into any other predictor, ranging from a naïve Gshare to the more
sophisticated Multi-Hybrid, Agree and Bi-Mode predictors, to further improve
132

prediction accuracy. Simulation results also show that the combination of the OS-
aware prediction and a simple predictor (for instance, Gshare) can outperform
sophisticated predictors (e.g., Multi-Hybrid and Agree) with larger size
configuration. OS-aware techniques provide opportunities for catering user and
kernel branches with differently tuned structures. For example, compared with a
conventional design, the OS-aware split predictor requires access to only one of
the smaller prediction tables for a given branch instruction mode (kernel or user),
which can result in energy savings and low-latency access. These advantages are
valuable in the light of power and clock frequency constraints in emerging
processor and branch predictor designs.
8.2 FUTURE WORK
• OS-aware / OS-friendly computer architecture
In the near future, I am interested in the extending of my thesis work to design the
OS-aware and OS friendly architecture to improve the system performance and
energy efficiency on emerging application execution. For example, I intend to
look at how OS-aware architecture can help with other performance critical
microarchitecture designs, such as value prediction, register file, and data caches.
I would also like to extend the emerging workload oriented microarchitecture
optimizations from superscalar paradigm to CMP and SMT systems. I believe
there is significant room to improve system performance, energy-efficiency,
quality of service, and security by providing OS-friendly, emerging application-
oriented architecture.
• Software power models supporting run-time energy and thermal
management
133

As a natural extension of the research on OS power modeling, I intend to look
how general software knowledge with various granularities can be combined with
simple, run-time hardware metrics to produce efficient power estimation, a first
step toward run-time, system wide energy and thermal management. I would like
to further extend the SoftWatt full-system power estimation framework co-
developed with my collaborators to support CMP and SMT architecture. I also
plan to do research on reactive system for power savings by exploiting the
behaviors of human-computer interactions.
• Adaptable computer and system architecture for heterogeneous applications,
OS and run-time environments
The long-term research plan is to design and develop techniques to support
systems that automatically analyze heterogeneous workloads, extra workload
feature from applications, and dynamically respond to the changes in application
demands by reconfiguring its components to match application needs. The
systems can accommodate the needs of different application categories with a
uniform design, instead of the current practice of optimizing the system for a
particular application class. I intend to achieve this goal by applying an integrated
hardware-software approach, including adaptable hardware microarchitecture,
lightweight operating system and managed run-time supports, innovative
middleware, intelligent compiler and programming environments. I believe that
adaptability will enhance the technical efficiency of the system, its ease of use,
and its commercial viability by accommodating a large set of commercial and
high performance computing workloads.
134

Appendices
Appendix A: Power Characterization of OS Routines (ε: Regression Model Fitting Error)
Interrupts IPC Power Regression Model
P = k1×IPC+k0OS
Services Avg.
Cycles Avg. Std. Dev. (%)
Avg. (W)
Std. Dev.(%) k1 k0 ε
Comment
utlb 13 0.92 0 28 0.1 23.6 6.2 0.17% TLB miss handler pfault 1,100 1.16 19 40 6.2 32.8 1.9 0.48% protection fault vfault 971 1.43 11 47 3.4 23.9 12.9 4.89% virtual memory fault COW_fault 2,574 1.65 8 54 2.6 32.1 1.1 0.19% copy-on-write fault demand_zero 1,939 1.54 16 44 4.5 27.6 1.5 0.40% zero fill page faults simscsi_intr 993 0.98 37 35 12.6 33.9 1.3 1.94% SCSI disk I/O interrupt if_etintr 241 1.38 51 42 15.0 29.4 1.1 1.57% Ethernet interrupt du_poll 481 0.95 26 35 9.3 35.7 0.8 5.04% input/output multiplexing clock 2,457 0.53 26 20 9.5 36.4 0.6 2.68% clock interrupts
Process and Interprocess Control IPC Power Regression Model
P = k1×IPC+k0OS
Services Avg.
Cycles Avg. Std. Dev. (%)
Avg. (W)
Std. Dev.(%) k1 k0 ε
Comment
exit 63,492 1.08 12 39 4.3 36.0 0.6 0.42% terminate a process fork 16,154 1.28 6 45 2.3 36.5 -1.7 0.99% create a new process
getpid 226 1.51 23 48 7.7 33.6 -2.7 0.75% return the process ID of the calling process
getuid 248 1.34 5 42 1.8 33.6 -3.1 0.17% return the real user ID of the calling process
alarm 594 0.77 9 26 2.9 32.8 0.6 0.14% set a process alarm clock pipe 4,188 0.71 11 25 3.8 35.4 0.4 0.50% create an interprocess channel
getgid 240 1.41 21 43 6.5 30.5 0.4 0.10% return the real group ID of the calling process
execve 64,401 1.23 4 43 1.2 31.0 4.6 0.20% execute a file sigreturn 924 1.17 7 39 2.4 34.5 -1.4 0.56% returns from a signal handler getsockname 1,137 0.74 10 25 3.1 32.4 1.2 0.57% get socket name
getdomainname 590 0.70 18 22 5.6 31.2 0.3 0.04% get name of current NIS domain
setreuid 1,455 0.43 6 14 2.2 34.7 -0.9 0.08% set real and effective user ID's
sproc 51,775 1.24 4 41 0.1 15.7 21.1 0.12% create a new share group process
prctl 813 0.48 12 15 3.8 31.8 -0.2 0.89% operations on a process
ksigaction 624 1.17 7 38 2.3 32.8 0.1 0.70% used to implement all type signal routines
sigprocmask 364 1.46 29 47 9.2 31.4 0.9 0.03% alter and return previous state of the blocked signals
BSDsetpgrp 2,565 0.41 4 15 1.6 35.4 0.3 0.55% set process group ID
sigsuspend 9,901 0.30 15 11 5.0 33.7 0.7 0.94% release blocked signals and wait for interrupt
getcontext 679 1.38 31 43 9.6 30.6 0.2 0.19% get current user context setcontext 1,025 0.97 14 32 4.5 33.1 0.1 0.48% set current user context
135

File System IPC Power Regression Model
P = k ×1 IPC+k0OS
Services Avg.
Cycles Avg. Std. Dev. (%)
Avg. (W)
Std. Dev.(%) k1 k0 ε
Comment
read 2,614 1.36 19 45 6.1 29.6 4.7 4.53% read file write 9,344 0.91 9 33 3.2 34.3 1.5 1.27% write file
open 8,626 0.97 10 35 3.5 34.3 1.2 0.41% opens a file, serial port or command pipeline
close 2,131 0.77 21 27 6.5 30.4 3.9 2.61% close an open channel unlink 8,904 1.00 7 36 2.0 30.0 5.5 0.11% remove a link to a file lseek 536 1.01 22 33 7.3 33.1 -0.5 2.49% move read/write file pointer
access 6,547 1.11 18 39 5.9 33.3 1.7 0.57% determine accessibility of a file
dup 1,074 0.74 18 25 5.7 32.4 1.2 0.56% duplicate an open file descriptor
ioctl 5,230 0.51 3 18 1.0 32.5 1.1 0.52% perform a variety of control functions on devices
fcntl 613 1.39 25 45 8.3 33.2 -0.9 0.95% file and descriptor control
getdents 5391 1.00 35 34 11.3 32.4 1.8 0.58% read directory entries and put in a file system independent format
xstat 5,990 1.22 14 43 4.8 35.0 0 0.85% obtain file attributes
lxstat 3,517 1.52 3 53 1.0 34.9 -0.2 0.20% obtain symbolic link file attributes
fxstat 1,293 0.85 18 28 5.4 30.5 2.0 2.01% obtain information about an open file known by the file descriptor
Miscellaneous Services IPC Power Regression Model
P = k ×1 IPC+k0OS
Services Avg.
Cycles Avg. Std. Dev. (%)
Avg. (W)
Std. Dev.(%) k1 k0 ε
Comment
brk 2,974 0.80 18 30 6.3 35.8 1.1 1.03% change data segment space allocation
syssgi 2,377 1.06 3 37 1.0 34.4 0.3 0.29% system interface specific to SGI
utssys 1,833 0.47 2 16 0.5 31.9 0.7 0.22% set/get system's hostname ulimit 364 1.08 52 34 15.9 30.4 1.0 0.02% get and set user limits mmap 7,311 0.74 12 26 4.2 34.5 0.6 1.08% map pages of memory
1,703 0.99 3 35 1.1 35.3 0.3 0.50% set protection of memory mapping
msync 23,107 0.61 3 23 0.1 36.8 0 0.36% synchronize memory with physical storage
getrlimit 1,045 0.42 2 14 0.2 18.0 6.1 0.42% control maximum system resource consumption
cacheflush 867 1.22 2 41 0.8 33.4 0.1 0.41% flush contents of instruction and/or data cache
waitsys 3,338 0.63 65 22 1.9 32.7 1.4 0.55% underlying system call for all wait-like calls
timein 1,185 0.65 15 23 5.0 34.3 0.4 2.89% set timer time 478 0.97 7 32 2.3 33.2 -0.6 0.85% count elapsed time
mprotect
136

Appendix B: Breakdown of Dynamic OS Branches based on Services
db
TLB missSchedulingI/O & file systemIdleSynchronizationPagingSystem callsException handlingMiscellaneous
jess
TLB missSchedulingI/O & file systemIdleSynchronizationPagingSystem callsException handlingMiscellaneous
javac
TLB missSchedulingI/O & file systemIdleSynchronizationPagingSystem callsException handlingMiscellaneous
jack
TLB missSchedulingI/O & file systemIdleSynchronizationPagingSystem callsException handlingMiscellaneous
mtrt
TLB missSchedulingI/O & file systemIdleSynchronizationPagingSystem callsException handlingMiscellaneous
compress
TLB missSchedulingI/O & file systemIdleSynchronizationPagingSystem callsException handlingMiscellaneous
gcc
TLB missSchedulingI/O & file systemIdleSynchronizationPagingSystem callsException handlingMiscellaneous
vortex
TLB missSchedulingI/O & file systemIdleSynchronizationPagingSystem callsException handlingMiscellaneous
pmake
TLB missSchedulingI/O & file systemIdleSynchronizationPagingSystem callsException handlingMiscellaneous
sendmail
TLB missSchedulingI/O & file systemIdleSynchronizationBuffer CopyingSystem callsException handlingMiscellaneous
postgres.select
TLB missSchedulingI/O & file systemIdleSynchronizationPagingSystem callsException handlingMiscellaneous
postgres.update
TLB missSchedulingI/O & file systemIdleSynchronizationPagingSystem callsException handlingMiscellaneous
postgres.join
TLB missSchedulingI/O & file systemIdleSynchronizationPagingSystem callsException handlingMiscellaneous
137

Appendix C: Illustration of Weakly Biased Branches in OS
21.2
17.0 16.8 16.1
1.24.9
19.0
28.8
0
5
10
15
20
25
30
always
-take
n (10
0%)
90%-99%
80%-89%
70%-79%
60%-69%
50%-59%
40%-49%
30%-39%
20%-29%
10%-19%1%
-9%
always
-not-ta
ken (
0%)
Branch Direction
% o
f Dyn
amic
Bran
ches db-user
db-OS21.5
26.2
13.5 12.4
19.8
2.83.4
25.9
0
5
10
15
20
25
30
always
-take
n (10
0%)
90%-99%
80%-89%
70%-79%
60%-69%
50%-59%
40%-49%
30%-39%
20%-29%
10%-19%
1%-9%
always
-not-ta
ken (
0%)
Branch Direction
% o
f Dyn
amic
Bra
nche
s jess-userjess-OS
17.1 17.021.0 17.6
3.32.6
27.3
21.0
0
5
10
15
20
25
30
always
-take
n (10
0%)
90%-99%
80%-89%
70%-79%
60%-69%
50%-59%
40%-49%
30%-39%
20%-29%
10%-19%
1%-9%
always
-not-ta
ken (
0%)
Branch Direction
% o
f Dyn
amic
Bra
nche
s javac-userjavac-OS
42.346.2
9.5 8.8
1.8 0.9
14.7 17.5
0
5
10
15
20
25
30
always
-take
n (10
0%)
90%-99%
80%-89%
70%-79%
60%-69%
50%-59%
40%-49%
30%-39%
20%-29%
10%-19%
1%-9%
always
-not-ta
ken (
0%)
Branch Direction
% o
f Dyn
amic
Bran
ches jack-user
jack-OS
28.1
15.3 15.1
17.9
6.1 7.3
23.224.1
0
5
10
15
20
25
30
always
-take
n (10
0%)
90%-99%
80%-89%
70%-79%
60%-69%
50%-59%
40%-49%
30%-39%
20%-29%
10%-19%1%
-9%
always-no
t-take
n (0%)
Branch Direction
% o
f Dyn
amic
Bran
ches mtrt-user
mtrt-OS
7.6
71.935.3
13.5 13.4
0.92.9
21.3
0
5
10
15
20
25
30
always
-take
n (10
0%)
90%-99%
80%-89%
70%-79%
60%-69%
50%-59%
40%-49%
30%-39%
20%-29%
10%-19%
1%-9%
alway
s-not-ta
ken (
0%)
Branch Direction
% o
f Dyn
amic
Bra
nche
s compress-usercompress-OS
35.2
15.6 15.5
7.01.75.7
31.5
23.8
0
5
10
15
20
25
30
always
-take
n (10
0%)
90%-99%
80%-89%
70%-79%
60%-69%
50%-59%
40%-49%
30%-39%
20%-29%
10%-19%
1%-9%
always
-not-ta
ken (
0%)
Branch Direction
% o
f Dyn
amic
Bra
nche
s gcc-usergcc-OS
35.3
0.90.4 0.0
36.0
0.0 0.9
87.8
0
5
10
15
20
25
30
always
-take
n (10
0%)
90%-99%
80%-89%
70%-79%
60%-69%
50%-59%
40%-49%
30%-39%
20%-29%
10%-19%
1%-9%
always
-not-ta
ken (
0%)
Branch Direction
% o
f Dyn
amic
Bra
nche
s vortex-uservortex-OS 24.0
17.1 17.2
3.82.2
11.9
27.7
18.8
0
5
10
15
20
25
30
always
-take
n (10
0%)
90%-99%
80%-89%
70%-79%
60%-69%
50%-59%
40%-49%
30%-39%
20%-29%
10%-19%
1%-9%
always
-not-ta
ken (
0%)
Branch Direction
% o
f Dyn
amic
Bra
nche
s pmake-userpmake-OS
24.1
3.0 1.75.11.1
4.3
27.2
19.1
05
10
15202530
354045
always
-take
n (10
0%)
90%-99%
80%-89%
70%-79%
60%-69%
50%-59%
40%-49%
30%-39%
20%-29%
10%-19%
1%-9%
always
-not-ta
ken (
0%)
Branch Direction
% o
f Dyn
amic
Bra
nche
s sendmail-usersendmail-OS
45.8
16.9 16.9
1.30.0
25.9
8.4
17.0
0
5
10
15
20
25
30
alway
s-tak
en (10
0%)
90%-99%
80%-89%
70%-79%
60%-69%
50%-59%
40%-49%
30%-39%
20%-29%
10%-19%
1%-9%
always
-not-ta
ken (
0%)
Branch Direction
% o
f Dyn
amic
Bra
nche
s postgres.select-userpostgres.select-OS
33.4
18.4 17.7
4.01.8
20.9
7.8
17.3
0
5
10
15
20
25
30
always
-take
n (10
0%)
90%-99%
80%-89%
70%-79%
60%-69%
50%-59%
40%-49%
30%-39%
20%-29%
10%-19%
1%-9%
always
-not-ta
ken (
0%)
Branch Direction
% o
f Dyn
amic
Bra
nche
s postgres.update-userpostgres.update-OS
28.4
20.8 20.8
13.8
0.2
13.6
26.7
19.4
0
5
10
15
20
25
30
always
-take
n (10
0%)
90%-99%
80%-89%
70%-79%
60%-69%
50%-59%
40%-49%
30%-39%
20%-29%
10%-19%
1%-9%
always
-not-ta
ken (
0%)
Branch Direction
% o
f Dyn
amic
Bran
ches
postgres.join-userpostgres.join-OS
138

Bibliography
[1] A. Agarwal, H. Li, and K. Roy, DRG-Cache: A Data Retention Gated-Ground Cache for Low Power, In Proceedings of the International Design Automation Conference, 2002.
[2] A. R. Alameldeen and D. A. Wood, Variability in Architectural Simulations of Multi-threaded Workloads, In Proceedings of the International Symposium on High Performance Computer Architecture, 2003.
[3] D.H. Albonesi, Dynamic IPC/Clock Rate Optimization, In Proceedings of International Symposium on Computer Architecture, 1998.
[4] D. H. Albonesi, Selective Cache Ways: On-Demand Cache Resource Allocation, Journal of Instruction Level Parallelism, May 2000.
[5] R. I. Bahar and S. Manne, Power and Energy Reduction Via Pipeline Balancing, In Proceedings of the International Symposium on Computer Architecture, 2001.
[6] R. Balasubramonian, D. Albonesi, A. Buyuktosunoglu, and S. Dwarkadas, Memory Hierarchy Reconfiguration for Energy and Performance in General-Purpose Processor Architectures, In Proceedings of the International Symposium on Microarchitecture, 2000.
[7] L. A. Barroso, K. Gharachorloo, and E. Bugnion, Memory System Characterization of Commercial Workloads, In Proceedings of the 25th Annual International Symposium on Computer Architecture, pages 3-14, 1998.
[8] K Baynes, C. Collins, E. Fiterman, B. Ganesh, P. Lohout, C. Smit, T. B. Zhang and B. Jacob, The Performance and Energy Consumption of Three Embedded Real-Time Operating Systems, In Proceedings of the International Conference on Compilers, Architecture and Synthesis for Embedded Systems, 2001.
[9] F. Bellosa, The Benefits of Event-driven Energy Accounting in Power-sensitive Systems, In Proceedings of 9th ACM SIGOPS European Workshop, 2000.
[10] L. Benini, A. Bogliolo, S. Cavallucci and B. Ricco, Monitoring System Activity for OS-directed Dynamic Power Management, In Proceedings of the International Symposium on Low Power Electronics and Design, 1998.
[11] J. Bennett and M. Flynn, Performance Factors for Superscalar Processors, Technical Report CSL-TR-95-661, Computer Systems Laboratory, Stanford University, Feb. 1995.
139

[12] R. Berrendorf and B. Mohr, PCL - The Performance Counter Library Version 2.2, http://www.fz-juelich.de/zam/PCL/, Jan. 2003.
[13] D. Brooks, V. Tiwari and M. Martonosi, Wattch: A Framework for Architectural-level Power Analysis and Optimizations, In Proceedings of the International Symposium on Computer Architecture, 2000.
[14] D. Brooks and M. Martonosi, Dynamic Thermal Management for High-Performance Microprocessors, In Proceedings of the International Symposium on High Performance Computer Architecture, 2001.
[15] P. Chang and U. Banerjee, Profile-guided Multi-heuristic Branch Prediction, In Proceedings of the International Conference on Parallel Processing, 1995
[16] P. -Y. Chang, M. Evers, and Y. Patt, Improving Branch Prediction Accuracy by Reducing Pattern History Table Interference, In Proceedings of International Conference on Parallel Architectures and Compilation Techniques, pages 48-57, 1996
[17] J. W. Chen, M. Dubois and P. Stenström, Integrating Complete-System and User-level Performance/Power Simulators: The SimWattch Approach, In Proceedings of International Symposium on Performance Analysis of Systems and Software, 2003.
[18] T. Cramer, R. Friedman, T. Miller, D. Seberger, R. Wilson and M. Wolczko, Compiling Java Just-In-Time, IEEE Micro, vol. 17, pages 36-43, May 1997.
[19] R. P. Dick, G. Lakshminarayana, A. Raghunathan, and N. K Jha, Power Analysis of Embedded Operating Systems, In Proceedings of the Design Automation Conference, June 2000.
[20] S. Dropsho, A. Buyuktosunoglu, R. Balasubramonian, D. H. Albonesi, S. Dwarkadas, G. Semeraro, G. Magklis and M. L. Scott, Integrating Adaptive On-Chip Storage Structures for Reduced Dynamic Power, In Proceedings of the International Conference on Parallel Architectures and Compilation Techniques, 2002.
[21] A. N. Eden and T. Mudge, The YAGS Branch Prediction Scheme, In Proceedings of the 31st Annual ACM/IEEE International Symposium on Microarchitecture, pages 69 - 77, 1998
[22] M. Evers, P. Y. Chang and Y. N. Patt, Using Hybrid Branch Predictors to Improve Branch Prediction Accuracy in the Presence of Context Switches, In Proceedings of the 23rd Annual International Symposium on Computer Architecture, pages 3-11, 1996
140
[23] K. Flautner, N. S. Kim, S. Martin, D. Blaauw and T. Mudge, Drowsy Caches: Simple Techniques for Reducing Leakage Power, In Proceedings of the International Symposium on Computer Architecture, 2002.
[24] N. Gloy, C. Young, J. B. Chen and M. D. Smith, An Analysis of Dynamic Branch Prediction Schemes on System Workloads, In Proceedings of the 23rd Annual International Symposium on Computer Architecture, pages 12-21, 1996
[25] S. Gurumurthi, A. Sivasubramaniam, M. J. Irwin, N. Vijaykrishnan, M. Kandemir, T. Li and L. K. John, Using Complete Machine Simulation for Software Power Estimation: The SoftWatt Approach, In Proceedings of the International Symposium on High Performance Computer Architecture, 2002.
[26] A. Hasegawa, I.Kawasaki, K.Yamada, S.Yoshioka, S. Kawasaki, and P. Biswas, SH3: High Code Density, Low Power, IEEE Micro, Dec. 1995.
[27] J. L. Hennessy and David A. Patterson, Computer Architecture: A Quantitative Approach, Morgan Kaufman Publishers, 1996
[28] S. A. Herrod, Using Complete Machine Simulation to Understand Computer System Behavior, Ph.D. Thesis, Stanford University, Feb. 1998.
[29] C.-H. A. Hsieh, J. C. Gyllenhaal and W. W. Hwu, Java Bytecode to Native Code Translation: the Caffeine Prototype and Preliminary Results, In Proceedings of the 29th International Symposium on Microarchitecture, pages 90-97, 1996.
[30] M. Huang, J. Renau, S. M. Yoo, and J. Torrellas, L1 Data Cache Decomposition for Energy Efficiency, In Proceedings of the International Symposium on Low Power Electronics and Design, 2001.
[31] K. Inoue, T. Ishihara, and K. Murakami, Way-Predictive Set-Associative Cache for High Performance and Low Energy Consumption, In Proceedings of the International Symposium on Low Power Electronics and Design, 1999.
[32] Intel Pentium 4 Processors - Manuals, Intel Corporation, 2002.
[33] A. Iyer and D. Marculescu, Microarchitecture Level Power Management, IEEE Transactions on Very Large Scale Integration Systems, Vol. 10, No. 3, 2002.
[34] R. Joseph and M. Martonosi, Run-Time Power Estimation in High Performance Microprocessors, In Proceeding of the International Symposium on Low Power Electronic Device, 2001.
[35] SPEC Jvm98 Benchmarks, http://www.spec.org/osg/jvm98/
141

[36] M. B. Kamble and K. Ghose, Energy-Efficiency of VLSI Caches: A Comparative Study, In Proceedings of the IEEE 10th International Conference on VLSI Design, 1997.
[37] S. Kaxiras, Z. G. Hu and M. Martonosi, Cache Decay: Exploiting Generational Behavior to Reduce Cache Leakage Power, In Proceedings of the International Symposium on Computer Architecture, 2001.
[38] K. Keeton, D. A. Patterson, Y. Q. He, R. C. Raphael and W. E. Baker, Performance Characterization of a Quad Pentium Pro SMP using OLTP Workloads, In Proceedings of the International Symposium on Computer Architecture, 1998.
[39] N. S. Kim, K. Flautner, D. Blaauw, and T. Mudge, Drowsy Instruction Caches, In Proceedings of the International Symposium on Microarchitecture, 2002.
[40] S. Kim, N. Vijaykrishnan, M. Kandemir, A. Sivasubramaniam and M. J. Irwin, Partitioned Instruction Cache Architecture for Energy Efficiency, ACM Transactions on Embedded Computing Systems, Vol. 2, Issue 2, May 2003.
[41] J. Kin, M. Gupta and W. H. Mangione-Smith, The Filter Cache: An Energy Efficient Memory Structure, In Proceedings of the International Symposium on Microarchitecture, 1997.
[42] A. Krall, Efficient JavaVM Just-In-Time Compilation, In Proceedings of the International Conference on Parallel Architectures and Compilation Techniques, pages 54-61, 1998.
[43] H.-H. S. Lee, G. S. Tyson, Region-Based Caching: An Energy-Delay Efficient Memory Architecture for Embedded Processors, In Proceedings of the International Conference on Compilers, Architecture and Synthesis for Embedded Systems, 2000.
[44] C.-C. Lee, I.-C. K. Chen, and T. Mudge, The Bi-Mode Branch Predictor, In Proceedings of the 30th Annual IEEE/ACM International Symposium on Microarchitecture, pages 4 - 13, 1997
[45] T. Li, L. John, N. Vijaykrishnan, A. Sivasubramaniam, J. Sabarinathan, and A. Murthy, Using Complete System Simulation to Characterize SPECjvm98 Benchmarks, In Proceedings of the International Conference on Supercomputing (ICS), 2000.
[46] T. Li and L. K. John, Understanding Control Flow Transfer and its Predictability in Java Processing, In Proceedings of International Symposium on Performance Analysis of Systems and Software, 2001.
142

[47] T. Li, L. John, A. Sivasubramaniam, N. Vijaykrishnan and J. Rubio, Understanding and Improving Operating System Effects in Control Flow Prediction, In Proceedings of the International Conference on Architectural Support for Programming Languages and Operating Systems, page 68-80, 2002
[48] T. Li, L. K. John, A. Sivasubramaniam, N.Vijaykrishnan and J. Rubio, Understanding and Improving Operating System Effects in Control Flow Prediction, Technical Report, Department of Electrical and Computer Engineering, University of Texas at Austin, June 2002. http://www.ece.utexas.edu/projects/ece/lca/ps/tao-TR-june-2002.pdf
[49] T. Li and L. K. John, Routine based OS-aware Microprocessor Resource Adaptation for Run-time Operating System Power Saving, In Proceedings of the International Symposium on Low Power Electronics and Design, 2003.
[50] T. Li and L. K. John, Run-time Modeling and Estimation of Operating System Power Consumption, In Proceedings of the International Conference on Measurement and Modeling of Computer Systems, 2003.
[51] Y. Luo, P. Seshadri, J. Rubio, L. K. John and A. Mericas, A Case Study of 3 Internet Server Benchmarks on 3 Superscalar Machines, IEEE Computer, Feb. 2003.
[52] S. Manne, A. Klauser and D. Grunwald, Pipeline Gating: Speculation Control for Energy Reduction, In Proceedings of the International Symposium on Computer Architecture, 1998.
[53] D. Marculescu, Profile-Driven Code Execution for Low Power Dissipation, In Proceedings of the International Symposium of Low Power Electronics and Design, 2000.
[54] S. McFarling, Combining Branch Predictors, WRL Technical Note TN-36, Digital Equipment Corporation, June 1993
[55] H. McGhan and M. O'Connor, PicoJava: A Direct Execution Engine for Java Bytecode , IEEE Computer, pages 22-30, Oct. 1998.
[56] P. Michaud, A. Seznec and R. Uhlig, Trading Conflict and Capacity Aliasing in Conditional Branch Predictors, In Proceedings of the 24th International Symposium on Computer Architecture, pages 292 - 303, 1997
[57] MIPS Technologies, Incorporated, R10000 Microprocessor Product Overview, MIPS Open RISC Technology, Oct. 1994.
143
[58] D. Ofelt and J. L. Hennessy, Efficient Performance Prediction for Modern Microprocessors, In Proceedings of the International Conference on Measurement and Modeling of Computer Systems, 2000.
[59] K. Olukotun, B.A. Nayfeh, L. Hammond, K. Wilson and K.-Y. Chang, The Case for a Single-Chip Multiprocessor, In Proceedings of the 7th International Conference on Architectural Support for Programming Languages and Operating Systems, pages 1-4, 1996
[60] J. Ousterhout, Why aren’t Operating Systems Getting Faster as Fast as Hardware?, In Proceedings of the Summer 1990 USENIX Conference, pages 247-256, 1990
[61] S. Palacharla, N. P. Jouppi and J. E. Smith, Quantifying the Complexity of Superscalar Processors, CS-TR-1996-1328, University of Wisconsin, Nov. 1996.
[62] C. Perleberg and A. Smith, Branch Target Buffer Design and Optimization, IEEE Transactions on Computers, 42(4): 396-412, 1993
[63] F. Pollack, Slides from talk, “New Microarchitecture Challenges in the Coming Generations of CMOS Process Technologies,” University of Texas Computer Architecture Seminar Series, April 2000.
[64] D. Ponomarev, G. Kucuk and K. Ghose, Reducing Power Requirements of Instruction Scheduling through Dynamic Allocation of Multiple Data-path Resources, In Proceedings of the International Symposium on Microarchitecture, 2002.
[65] M. Powell, S. H. Yang, B. Falsafi, K. Roy, and T. N. Vijaykumar, Gated-Vdd: A Circuit Technique to Reduce Leakage in Deep-Submicron Cache Memories, In Proceedings of the International Symposium on Low Power Electronics and Design, 2000.
[66] M. Powell, A. Agarwal, T. N. Vijaykumar, B. Falsafi, and K. Roy, Reducing Set-Associative Cache Energy via Way-Prediction and Selective Direct-Mapping, In Proceedings of the International Symposium on Microarchitecture, 2001.
[67] "PostgreSQL", http://www.us.postgresql.org/
[68] G. Qu, N. Kawabe, K. Usami and M. Potkonjak, Function-Level Power Estimation Methodology for Microprocessors, In Proceedings of the Design Automation Conference, 2000.
[69] P. Ranganathan, S. Adve and N.P. Jouppi, Reconfigurable Caches and their Application to Media Processing, In Proceedings of the International Symposium on Computer Architecture, 2000.
144
[70] J. A. Redstone, S. J. Eggers and H. M. Levy, An Analysis of Operating System Behavior on a Simultaneous Multithreaded Architecture, In Proceedings of the 9th International Conference on Architectural Support for Programming Languages and Operating Systems, pages 245-256, 2000
[71] M. Rosenblum, S. A. Herrod, E. Witchel, and A. Gupta, Complete Computer System Simulation: the SimOS Approach, IEEE Parallel and Distributed Technology: Systems and Applications, vol.3, no.4, pages 34-43, Winter 1995.
[72] M. Rosenblum, E. Bugnion, S. A.Herrod, E. Witchel, and A. Gupta, The Impact of Architectural Trends on Operating System Performance, In Proceedings of the 15th ACM Symposium on Operating System Principles, pages 285-298, 1995.
[73] S. Sechrest, C-C. Lee, and T. Mudge, Correlation and Aliasing in Dynamic Branch Predictors, In Proceedings of the 23rd Annual International Symposium on Computer Architecture, pages. 22-32. 1996
[74] T. Sherwood, E. Perelman, G. Hamerly and B. Calder, Automatically Characterizing Large Scale Program Behavior, In Proceedings of the International Conference on Architectural Support for Programming Languages and Operating Systems, 2002.
[75] SIA. International Technology Roadmap for Semiconductors, 2001.
[76] A. Sinha, A. Wang, and A. P. Chandrakasan, Algorithmic Transforms for Efficient Energy Scalable Computation, In Proceedings of the International Symposium on Low Power Electronics and Design, 2000.
[77] E. Sprangle, R. S. Chappell, M. Alsup and Y. N. Patt, The Agree Predictor: A Mechanism for Reducing Negative Branch History Interference, In Proceedings of the 24th Annual International Symposium on Computer Architecture, pages 284-291, 1997
[78] A. Adl-Tabatabai, M. Cierniak, G. Lueh, V. M. Parakh and J. M. Stichnoth, Fast Effective Code Generation in a Just-In-Time Java Compiler, In Proceedings of Conference on Programming Language Design and Implementation, pages 280-290, 1998.
[79] T. K. Tan, A. Raghunathan, G. Lakshminarayana and N. K. Jha, High-level Software Energy Macro-modeling, In Proceedings of the Design Automation Conference, 2001.
[80] T. K. Tan, A. Raghunathan and N. Jha, Embedded Operating System Energy Analysis and Macro-modeling, In Proceedings of the International Conference on Computer Design, 2002.
145

[81] T. K. Tan, A. Raghunathan and N. Jha, EMSIM: An Energy Simulation Framework for an Embedded Operating System, In the Proceedings of the International Conference on Circuits and Systems, 2002.
[82] V. Tiwari, S. Malik, A. Wolfe and M. T. C. Lee, Instruction Level Power Analysis and Optimization of Software, Journal of VLSI Signal Processing, 1-18, 1996.
[83] Transaction Processing Council, The TPC-C Benchmark, http://www.tpc.org/tpcc/
[84] M. Valluri and L. K. John, Is Compiling for Performance == Compiling for Power?, In Proceedings of the 5th Annual Workshop on Interaction between Compilers and Computer Architectures, 2001.
[85] E. Witchel and M. Rosenblum, Embra: Fast and Flexible Machine Simulation, In Proceedings of ACM SIGMETRICS '96: Conference on Measurement and Modeling of Computer Systems, 1996.
[86] J. Yang and R. Gupta, Energy Efficient Frequent Value Data Cache Design, In Proceedings of the International Symposium on Microarchitecture, 2002.
[87] S. H. Yang, M. Powell, B. Falsafi and T. N. Vijay, Exploiting Choice in Resizable Cache Design to Optimize Deep-submicron Processor Energy-delay, In Proceedings of the International Symposium on High-Performance Computer Architecture, 2002.
[88] W. Ye, N. Vijaykrishnan, M. Kandermir and M. J. Irwin, The Design and Use of SimplePower: A Cycle-accurate Energy Estimation Tool, In Proceedings of Design Automation Conference, 2000.
[89] K. C. Yeager, MIPS R10000, IEEE Micro, vol.16, no.1, pages 28-40, Apr. 1996.
[90] T. Yeh and Y. N. Patt, Two-Level Adaptive Branch Prediction, In Proceeding of 24th International Symposium on Microarchitecture, pages. 51-61, 1991
[91] T.-Y. Yeh, and Y. N. Patt, A Comparison of Dynamic Branch Predictors that Use Two Levels of Branch History, In Proceedings of the 20th Annual International Symposium on Computer Architecture, pages 257-266, 1993
[92] C. Young, C. Gloy and M. D. Smith, A Comparative Analysis of Schemes for Correlated Branch Prediction, In Proceedings of the 22nd Annual International Symposium on Computer Architecture, pages 276-286, 1995
[93] H. Zeng, X. B. Fan, C. Ellis, A. Lebeck and A. Vahdat, ECOSystem: Managing Energy as a First Class Operating System Resource, In the Proceedings of the
146

International Symposium on Architecture Support for Program Language and Operating System, 2002.
[94] W. Zhang, J. S. Hu, V. Degalahal, M. Kandemir, N. Vijaykrishnan, M. J. Irwin, Compiler-Directed Instruction Cache Leakage Optimization, In Proceedings of the International symposium on Microarchitecture, 2002.
[95] C. Zhang, F. Vahid and W. Najjar, A Highly Configurable Cache Architecture for Embedded Systems, In Proceedings of the International Symposium on Computer Architecture, 2003.
[96] H. Y. Zhou, M. C. Toburen, E. Rotenberg and T. M. Conte, Adaptive Mode Control: a Static Power-Efficient Cache Design, In Proceedings of the International Conference on Parallel Architectures and Compilation Techniques, 2001.
147

Vita
Tao Li was born in Beijing, China, on June 25, 1972, as the son of Zhixin Li and
Yunhua Qi. After completing his high school education at School of Institute 602 in
Jingdezhen, China, he entered the Department of Computer Science and Technology,
Northwestern Polytechnic University in Xi’an, China in September 1989. He received the
degree of Bachelor of Science in Computer Science and Engineering from Northwestern
Polytechnic University in July 1993. He joined the graduate program for Computer
Science and Engineering at Beijing Institute of Data Processing Technology, Beijing,
China in September 1993 and obtained the degree of Master of Science in Computer
Engineering in May 1996. From June 1996 to August 1998, he was a researcher at
Beijing Institute of Data Processing Technology. In September 1998, he entered the
Ph.D. program in Computer Engineering at The University of Texas at Austin. He will
join the Department of Electrical and Computer Engineering, University of Florida as an
assistant professor in Fall 2004. He is a student member of IEEE, IEEE Computer
Society, ACM, and ACM SIGARCH.
Permanent address: Room 101, Suite 1007, Institute of 602
Jingdezhen, Jiangxi. China 333001
This dissertation was typed by the author.
148