Copyright © 2010 The Nielsen Company. Confidential and proprietary.
Rob Prosser
Copyright © 2010 The Nielsen Company. Confidential and proprietary.
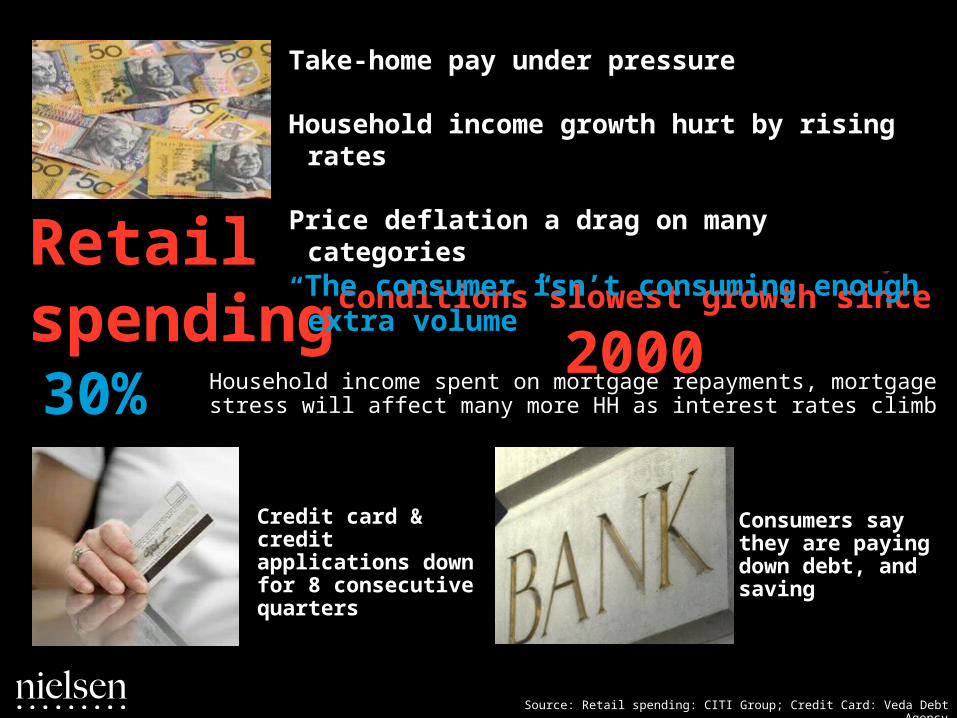
conditions slowest growth since 2000Retail spending
Take-home pay under pressure
Household income growth hurt by rising rates
Price deflation a drag on many categories“The consumer isn’t consuming enough extra
volume”
30% Household income spent on mortgage repayments, mortgage stress will affect many more HH as interest rates climb
Consumers say they are paying down debt, and saving
Credit card & credit applications down for 8 consecutive quarters
Source: Retail spending: CITI Group; Credit Card: Veda Debt Agency

Copyright © 2010 The Nielsen Company. Confidential and proprietary.
FLATQ1
Q2
Q3
2.8%
1.3%
1.9%2010 YTD(UNIT GROWTH 1.3%)
Source: Nielsen Scantrack

Copyright © 2010 The Nielsen Company. Confidential and proprietary.
Pharmacy
Convenience
Liquor
2010 YTD Source: Nielsen Scantrack
+5.0%Units +2.9%
+0.3%Units -1.8%
-0.3%Units -2.4%

Copyright © 2010 The Nielsen Company. Confidential and proprietary.
Household Goods
Clothing/ Apparel
Dept. Stores
+0.6%
Newspaper/ Books
Restaurants/ Cafés/ Takeaways
-0.9%
-0.6%
+2.8%
+11.4%2010 YTD Source: ABS
Copyright © 2010 The Nielsen Company. Confidential and proprietary.Source: Nielsen Global Consumer Confidence Survey
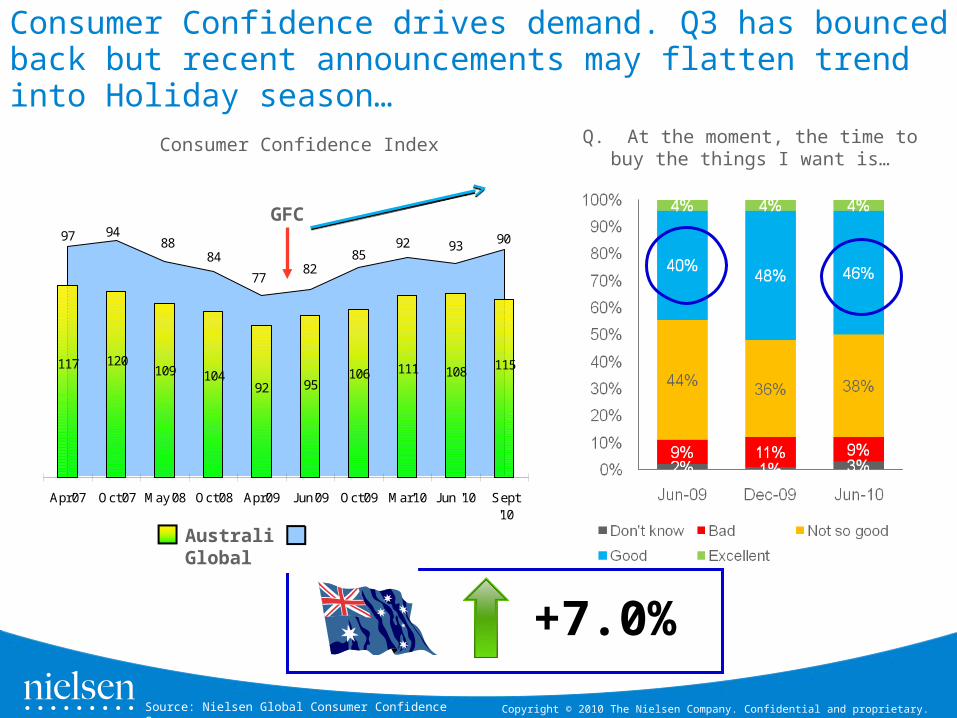
Consumer Confidence drives demand. Q3 has bounced back but recent announcements may flatten trend into Holiday season…
GFC
Consumer Confidence Index Q. At the moment, the time to buy the things I want is…
+7.0%
117 120109 104
92 95106 111 108 115
92 909385
8277
8488
9497
Apr'07 Oct'07 May'08 Oct'08 Apr'09 Jun'09 Oct'09 Mar'10 Jun '10 Sept'10
Aus GlobalAustralia Global

Copyright © 2010 The Nielsen Company. Confidential and proprietary.
Within key European markets we see the UK experiencing continued low levels of consumer sentiment.
Source: Nielsen Global Consumer Confidence Survey

Copyright © 2010 The Nielsen Company. Confidential and proprietary.
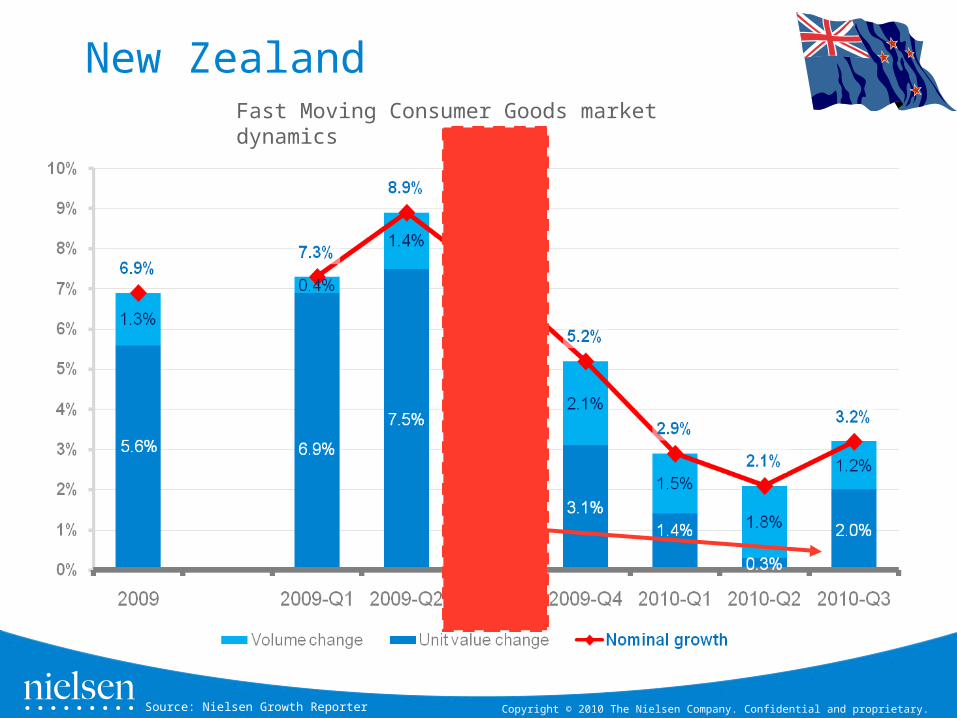
Fast Moving Consumer Goods market dynamics
Nominal growth-% change in value sales: Unit value change-% change in the average retail price per unit in the total basket (Val/ Vol):Volume change-% change in purchased volume (quantity) of products.
Australia
Copyright © 2010 The Nielsen Company. Confidential and proprietary.
Copyright © 2010 The Nielsen Company. Confidential and proprietary.
New ZealandFast Moving Consumer Goods market dynamics
Source: Nielsen Growth Reporter
Copyright © 2010 The Nielsen Company. Confidential and proprietary.
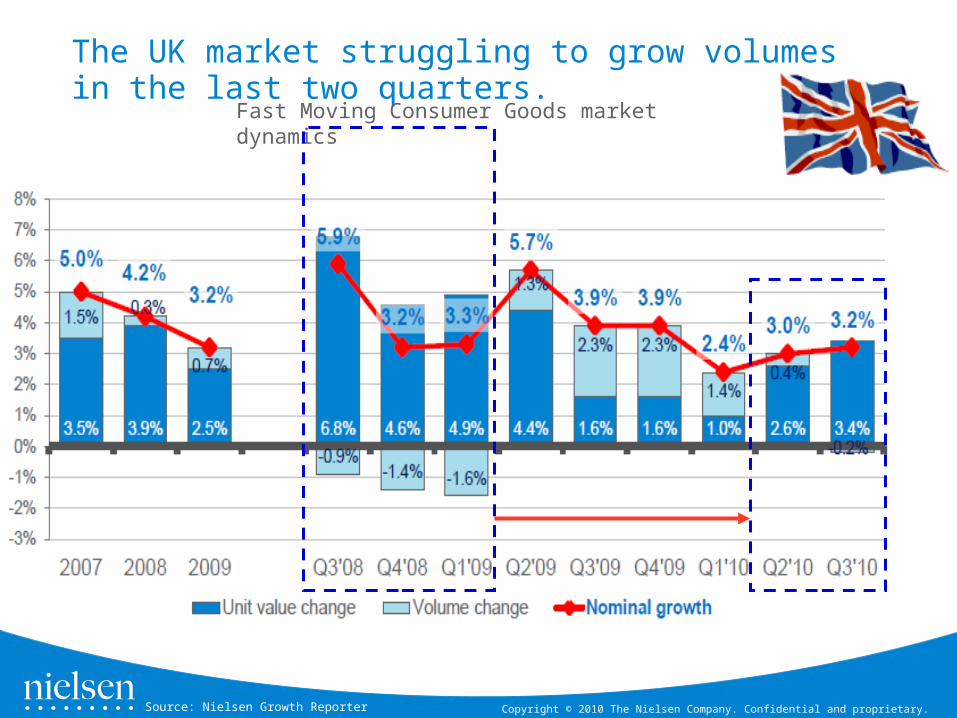
The UK market struggling to grow volumes in the last two quarters.
Fast Moving Consumer Goods market dynamics
Source: Nielsen Growth Reporter

Copyright © 2010 The Nielsen Company. Confidential and proprietary.
The US market, pulling all the levers, but failing to grow consumption and value growth.
Fast Moving Consumer Goods market dynamics
Source: Nielsen Growth Reporter

Copyright © 2010 The Nielsen Company. Confidential and proprietary.
China showing a strong recovery through 2010, with strong increases in consumption.
Fast Moving Consumer Goods market dynamics
Source: Nielsen Growth Reporter

Copyright © 2010 The Nielsen Company. Confidential and proprietary.

Copyright © 2010 The Nielsen Company. Confidential and proprietary.
How have Shopping habits changed? The Supermarket is increasingly becoming a big convenience store…
Source: Nielsen Homescan
• Average Shopper repertoire now sits at 4 stores/ week!
• Grocery basket values down 5% year on year– Driven by reduction in items above $10, and an– increase in items below $5
• Significant price compression
• Growth in ALDI usage
• Private Label penetration at 100% of Australian Households
• In NZ more than half of all grocery purchases are made on promotion– Australia is rising from the mid-thirties
Source: Nielsen HomeScan; Nielsen Scantrack

Copyright © 2010 The Nielsen Company. Confidential and proprietary.
Rapid change in the name of the Shopper is the new mantra
• Nationally consistent pricing• Focus on special offers and discounts• Massive ‘Fresh Food’ emphasis• Increased media spend• Sustainability, Insurance… …and the list goes on
Copyright © 2010 The Nielsen Company. Confidential and proprietary.
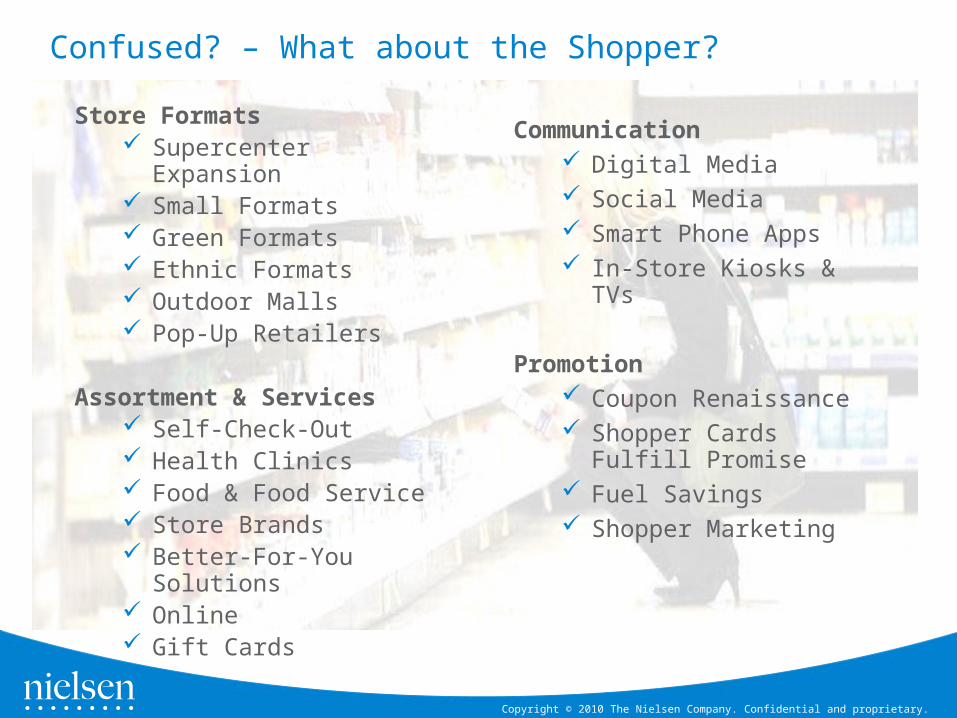
Store Formats Supercenter Expansion Small Formats Green Formats Ethnic Formats Outdoor Malls Pop-Up Retailers
Assortment & Services Self-Check-Out Health Clinics Food & Food Service Store Brands Better-For-You Solutions Online Gift Cards
Communication Digital Media Social Media Smart Phone Apps In-Store Kiosks & TVs
Promotion Coupon Renaissance Shopper Cards Fulfill
Promise Fuel Savings Shopper Marketing
Confused? – What about the Shopper?

Copyright © 2010 The Nielsen Company. Confidential and proprietary.
Source: Shopper Trends Survey Base: Q8a Which of these have you shopped at in in the Past 12 Months? All respondents n=1979
& Large Discount Stores
Majors retailers are increasingly substitutable – Spot the difference!
Expected to have a greater impact in the future as
Australian shoppers learn where this type of retailer fits
in within their repertoire of stores and start to have
greater access to the stores

Copyright © 2010 The Nielsen Company. Confidential and proprietary.
Ranking of derived importance
Store differentiation attributes: 2010
Globally consumers rank the most important attributes similarly. If it’s all about price…
TOP FIVE Easy to quickly find what I
need Always have what I want in
stock High quality fresh food Pleasant store environment Has high quality brands
21st Low prices
“Provides Private label as a good alternative”
Ranks above priceSource: Nielsen State of Play ’10 (JJ)
Copyright © 2010 The Nielsen Company. Confidential and proprietary.
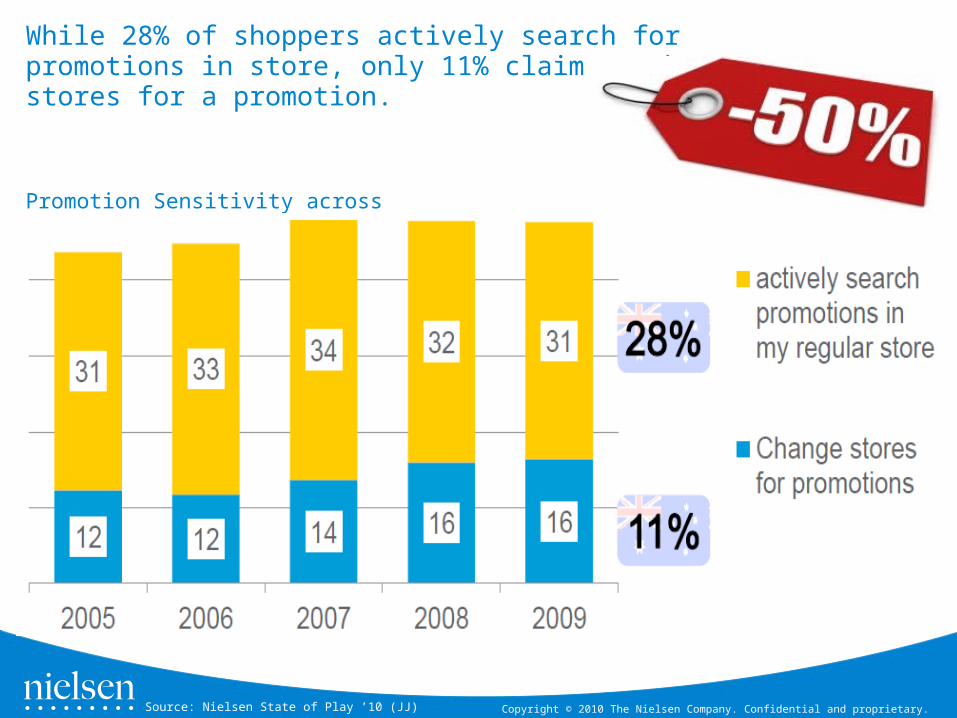
While 28% of shoppers actively search for promotions in store, only 11% claim to change stores for a promotion.
Promotion Sensitivity across Europe
Source: Nielsen State of Play ’10 (JJ)

Copyright © 2010 The Nielsen Company. Confidential and proprietary.
Share of Claimed Shopper Visits (% of all visits)
Others2%
Farmers markets1%Asian Grocers
1%
Other Supermarkets2%
Delicatessens2%
Corner Store 2%
Convenience store 3%
Aldi4%
Fish shop/Butcher5%
IGA9%
Fruit & Veg Stores10%
Bakeries10%
Coles21%
Woolworths/Safeway
28%
Increasingly, alternative channels are an important part of shoppers’ repertoire as they search for fresh, new and ‘value’.
Source: Shopper Trends Survey, Floor space to fresh: Macquarie Equities
Floor space allocated to Fresh
33%UP 13%
30%UP 12%
Copyright © 2010 The Nielsen Company. Confidential and proprietary.
27
27
13
36
42
21
23
21
33
33
17
37
14
13
27
8
12
19
15
16
13
9
3
11
5
7
3
1
0
15
15
11
12
26
93
Coles
Woolworths/Safeway
IGA
Aldi
Large DiscountStores
Other supermarkets
Main Top Up Emergency Meal Petrol Special Event
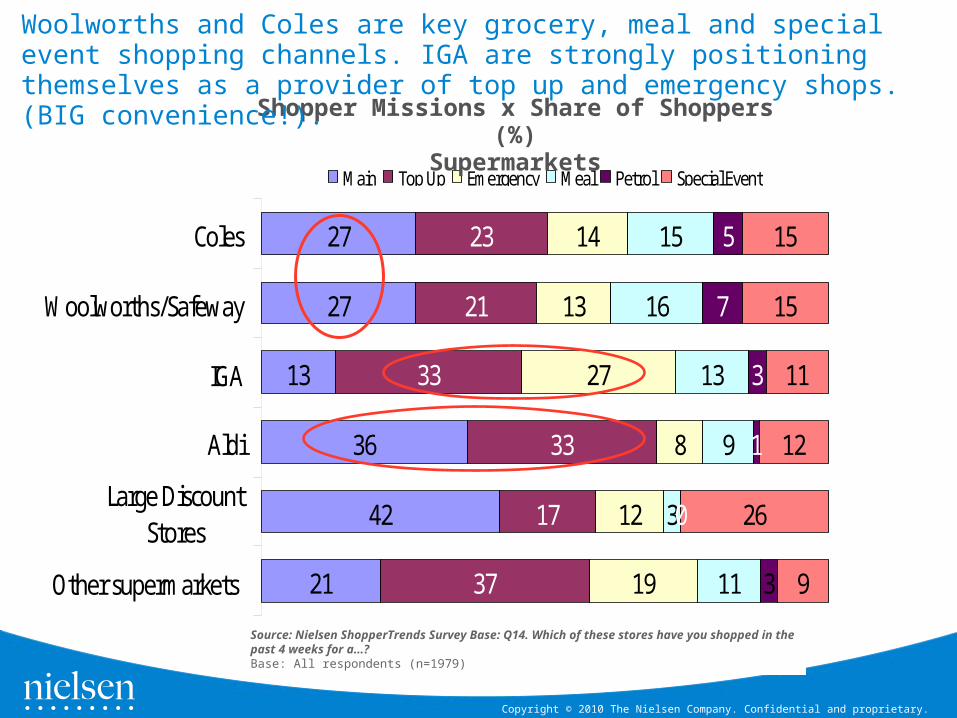
Shopper Missions x Share of Shoppers (%)Supermarkets
Woolworths and Coles are key grocery, meal and special event shopping channels. IGA are strongly positioning themselves as a provider of top up and emergency shops. (BIG convenience!).
Source: Nielsen ShopperTrends Survey Base: Q14. Which of these stores have you shopped in the past 4 weeks for a…? Base: All respondents (n=1979)

Copyright © 2010 The Nielsen Company. Confidential and proprietary.
Copyright © 2010 The Nielsen Company. Confidential and proprietary.
What we do know …
• Retail Brands will keep on growing in search of margin
• Growth will neither slow down nor speed up = By-product of modern retail
• Retail Brands are not a product of economic panic
• Retail Brands are not a quick win
• Retail Brands have limited contribution to retailer equity
• Retail Brands will coexist with brands
• Price is not the irresistible differentiator • Retail Brands win more on value than on price
• Retail Brands are not for low budget shoppers (actually the contrary)
Copyright © 2010 The Nielsen Company. Confidential and proprietary.
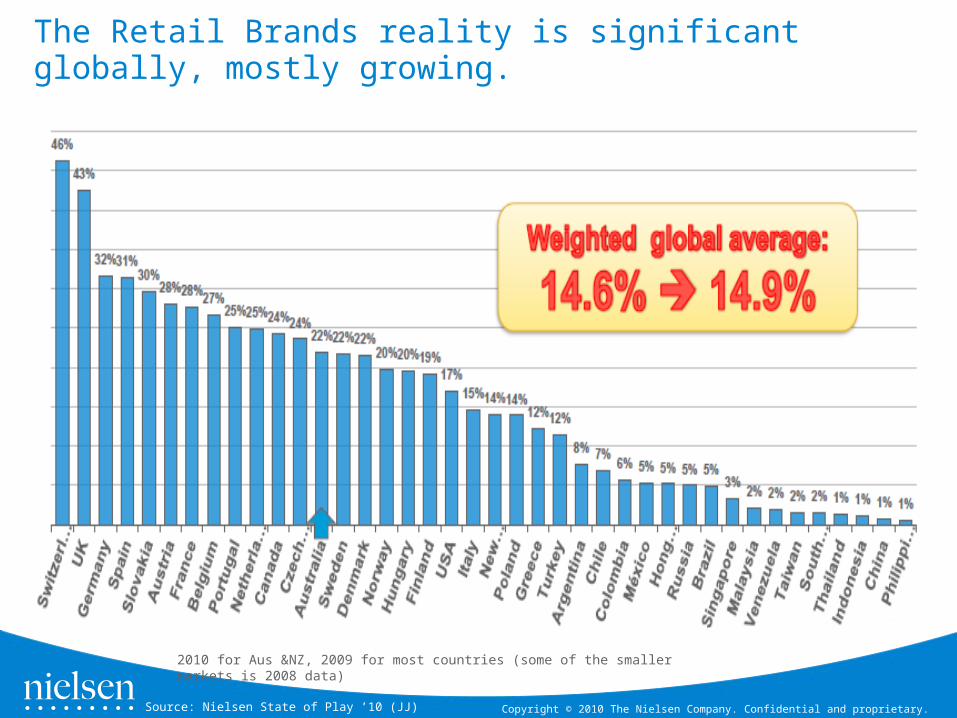
The Retail Brands reality is significant globally, mostly growing.
2010 for Aus &NZ, 2009 for most countries (some of the smaller markets is 2008 data)
Source: Nielsen State of Play ’10 (JJ)

Copyright © 2010 The Nielsen Company. Confidential and proprietary.
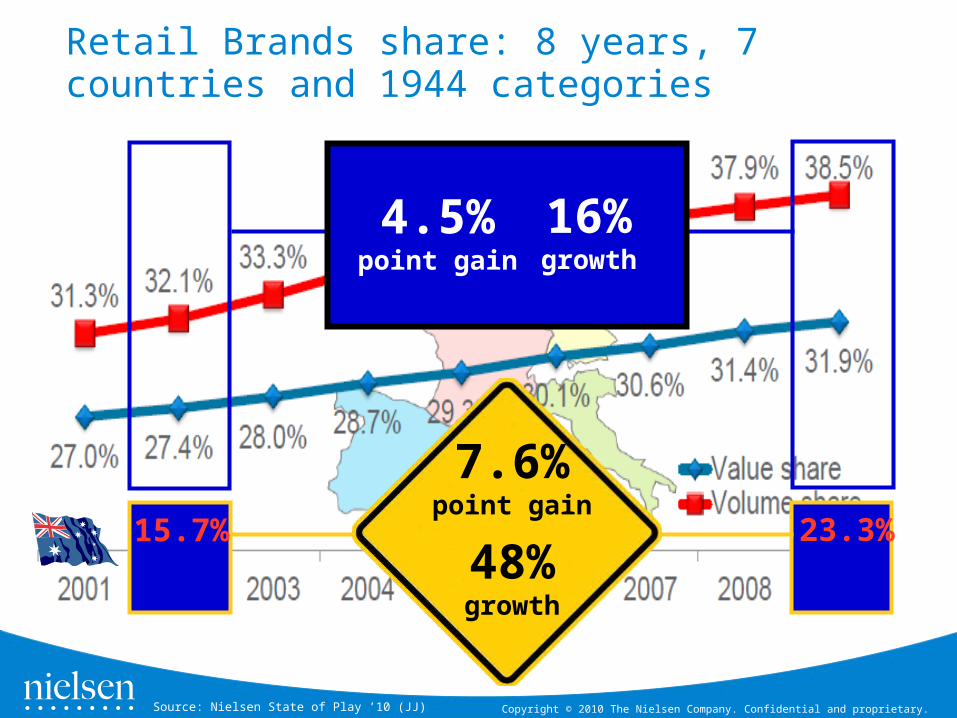
Retail Brands share: 8 years, 7 countries and 1944 categories
Source: Nielsen State of Play ’10 (JJ)
Copyright © 2010 The Nielsen Company. Confidential and proprietary.
Retail Brands share: 8 years, 7 countries and 1944 categories
7.6%point gain
48%growth
4.5%point gain
16%growth
15.7% 23.3%
Source: Nielsen State of Play ’10 (JJ)

Copyright © 2010 The Nielsen Company. Confidential and proprietary.
The faster you increase your store density per million population, the more you grow your share of trade, or do you?
ShareOf
Trade
More Stores
Source: Nielsen State of Play ’10 (JJ)
Copyright © 2010 The Nielsen Company. Confidential and proprietary.
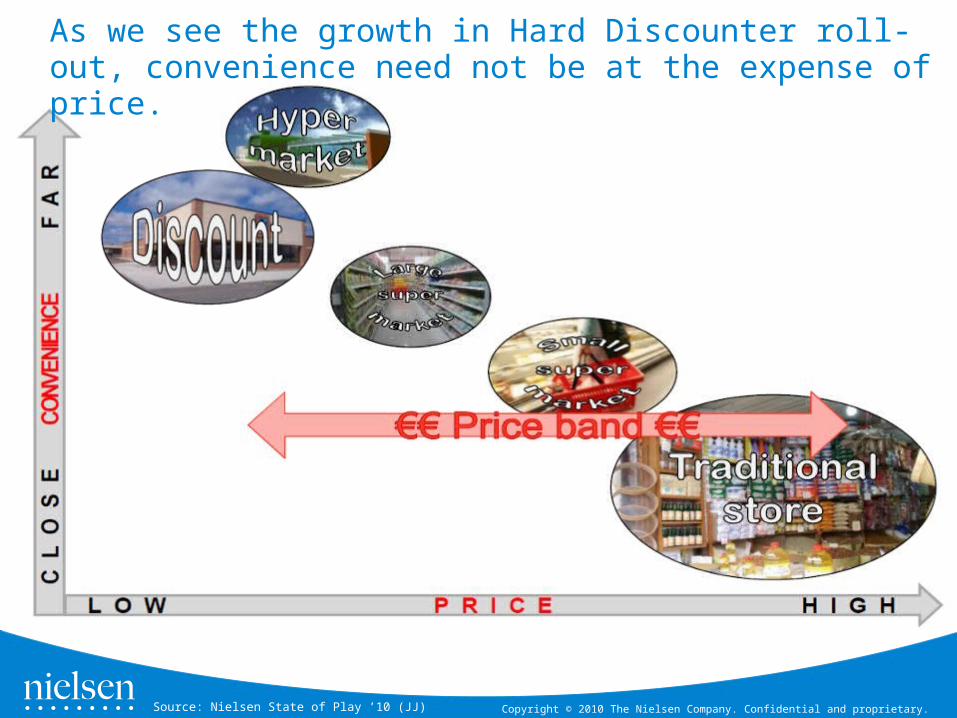
As we see the growth in Hard Discounter roll-out, convenience need not be at the expense of price.
Source: Nielsen State of Play ’10 (JJ)

Copyright © 2010 The Nielsen Company. Confidential and proprietary.
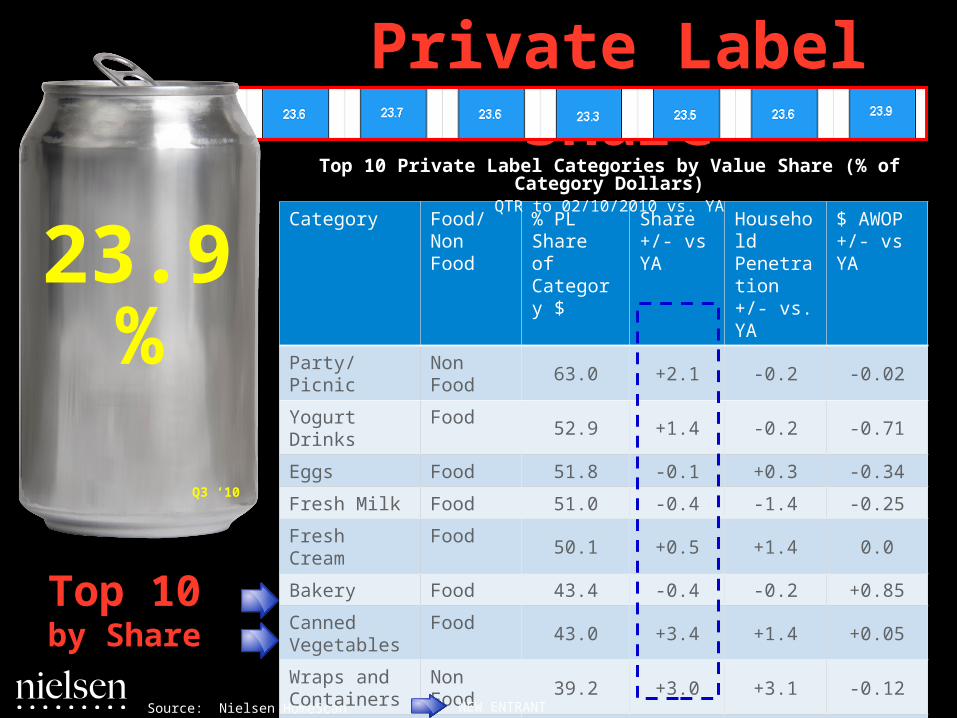
Private Label Share
23.9%
Q3 ‘10
Source: Nielsen HomeScan
Copyright © 2010 The Nielsen Company. Confidential and proprietary.
Private Label Share
23.9%
Q3 ‘10
Category Food/ Non Food
% PL Share of Category $
Share +/- vs YA
Household Penetration +/- vs. YA
$ AWOP +/- vs YA
Party/Picnic Non Food 63.0 +2.1 -0.2 -0.02
Yogurt Drinks Food 52.9 +1.4 -0.2 -0.71
Eggs Food 51.8 -0.1 +0.3 -0.34
Fresh Milk Food 51.0 -0.4 -1.4 -0.25
Fresh Cream Food 50.1 +0.5 +1.4 0.0
Bakery Food 43.4 -0.4 -0.2 +0.85
Canned Vegetables
Food43.0 +3.4 +1.4 +0.05
Wraps and Containers
Non Food39.2 +3.0 +3.1 -0.12
Canned Fruit Food 37.7 +2.1 +0.1 -0.34
Oils Food 36.1 +0.5 -0.1 -0.21
Top 10 Private Label Categories by Value Share (% of Category Dollars)QTR to 02/10/2010 vs. YA
Source: Nielsen HomeScan
Top 10by Share
NEW ENTRANT

Copyright © 2010 The Nielsen Company. Confidential and proprietary.
Private Label Share
23.9%
Q3 ‘10
Top 10 Private Label Categories by Actual Value ChangeQTR to 02/10/2010 vs. YA
Source: Nielsen HomeScan
CategoryFood/ Non Food
% PL Share of Category $
Share +/- vs YA
Household Penetration +/- vs. YA
$ AWOP +/- vs YA
Bakery Food 43.4 -0.4 -0.2 +0.8
Toilet Paper/Towels
Non Food
20.6 +4.6 +8.0 +0.1
Pet Food and Care
Non Food
21.4 0.6 -0.5 +1.4
Seafood Food 27.3 +4.8 +2.5 +0.7
Ice Cream Food 15.8 +2.5 +3.7 +0.1
Frozen Fish Food 19.9 +1.4 +2.5 +0.5
Frozen Meals Food 18.4 +0.3 +0.9 +0.9
Biscuits Food 18.3 +0.9 +3.0 0.0
Soup Food 12 +3.1 +3.9 +0.5
Confectionery Food 15.8 +0.1 +0.7 +0.2
Top 10by $ change
NEW ENTRANT

Copyright © 2010 The Nielsen Company. Confidential and proprietary.
Key Takeouts…
• Australian retail is at it’s most competitive for more than a decade. Driven by– Resurgent Coles / Growth of ALDI / Changing ethnographies
• All majors now have a relentless focus on the Shopper– Customer centricity is the new mantra– Retailers are restructuring business units to cope
• Current retailer strategies have had mixed results– Increasing uncertainty as to how to differentiate the offer– ‘Tit for tat’ marketing has amplified - stagnant share growth– ALDI continues to baffle the majors – how to compete? Is PL the answer?
• Blurring of channels is an increasing reality– Driving cross channel visitation up– Driving baskets down– Impacting loyalty to specific banners
• Next 12 months will be even more intensive as ALDI ramps up expansion, Coles open more than 100 new / refurbished stores and price discounting intensifies and what constitutes Convenience is continually re-stated…

Copyright © 2010 The Nielsen Company. Confidential and proprietary.
fromThe Nielsen Team
and
Good Trading

Appendix

Copyright © 2010 The Nielsen Company. Confidential and proprietary.
PL share has of Supermarkets has increased in the latest QTR, with growth seen in spend of $3.42 compared to QTR last year

Copyright © 2010 The Nielsen Company. Confidential and proprietary.
Trend ed R etailer S ha re of P LR etai le r % S hare - To ta l Pr iva te Labe l
S ource: Nielsen Hom esc an® (Aust ra lia) - Issue # 441052
Coles Group has seen an increase in retailer share in the latest QTR and IGA remains stable
Q3 2010 Nielsen Private Label Report
Copyright © 2010 The Nielsen Company. Confidential and proprietary.
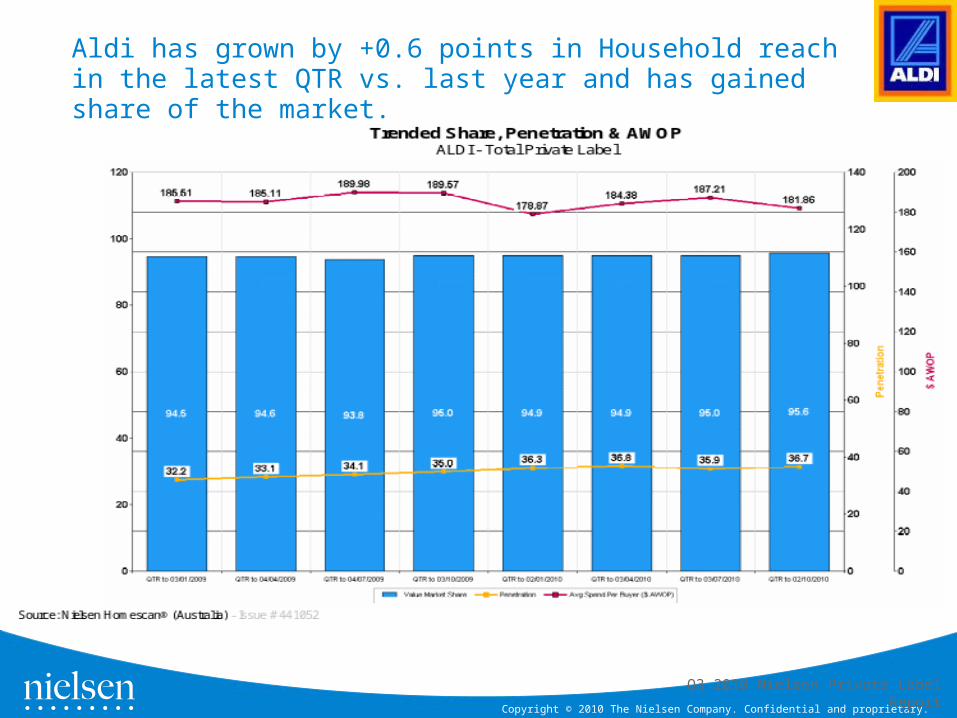
Aldi has grown by +0.6 points in Household reach in the latest QTR vs. last year and has gained share of the market.
Q3 2010 Nielsen Private Label Report

Copyright © 2010 The Nielsen Company. Confidential and proprietary.
The share of PL in Coles grew by +0.5points vs. last year. Driven by increase in spend in the latest QTR, penetration was also in growth
Q3 2010 Nielsen Private Label Report

Copyright © 2010 The Nielsen Company. Confidential and proprietary.
Woolworths has gained share of PL vs. QTR YA, this has been due to increase in households buying in WW coupled with increasing spend
Q3 2010 Nielsen Private Label Report
Copyright © 2010 The Nielsen Company. Confidential and proprietary.
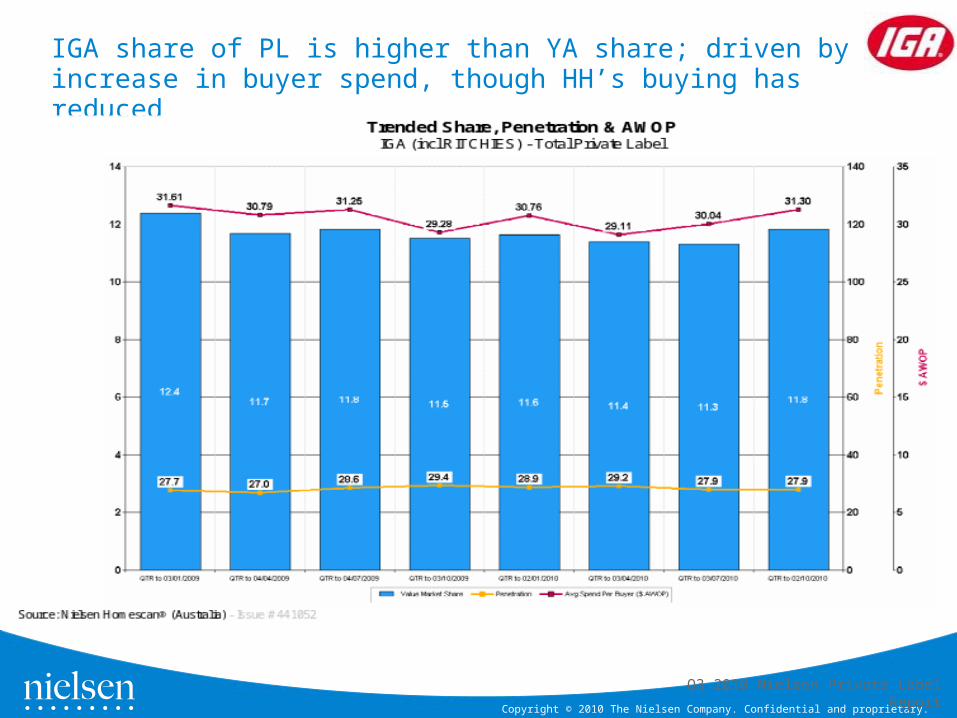
IGA share of PL is higher than YA share; driven by increase in buyer spend, though HH’s buying has reduced
Q3 2010 Nielsen Private Label Report
Copyright © 2010 The Nielsen Company. Confidential and proprietary.
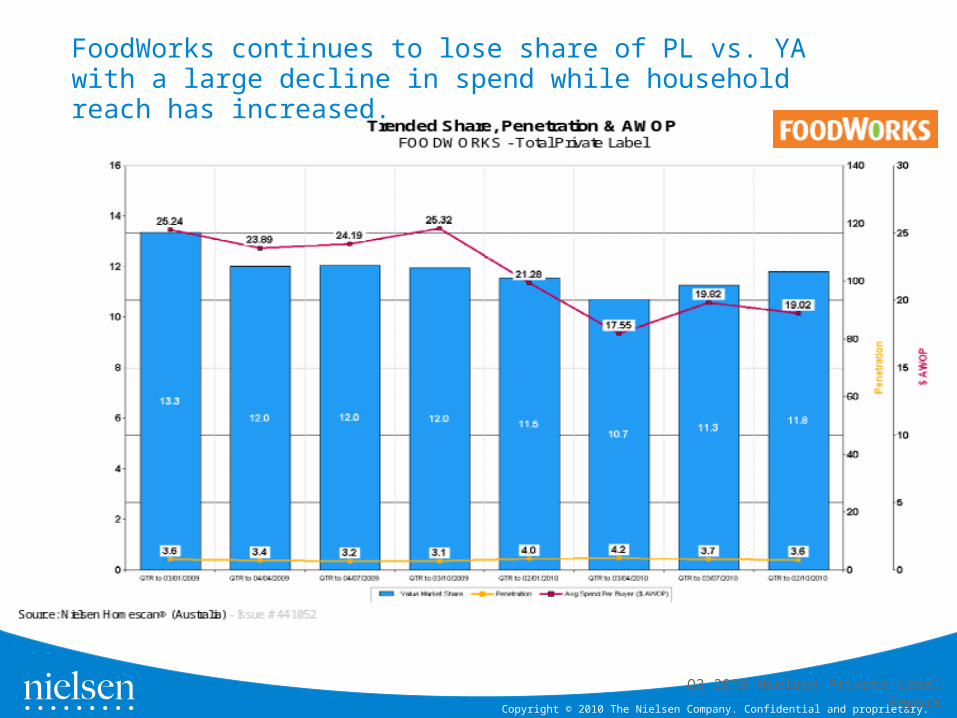
FoodWorks continues to lose share of PL vs. YA with a large decline in spend while household reach has increased.
Q3 2010 Nielsen Private Label Report
Copyright © 2010 The Nielsen Company. Confidential and proprietary.
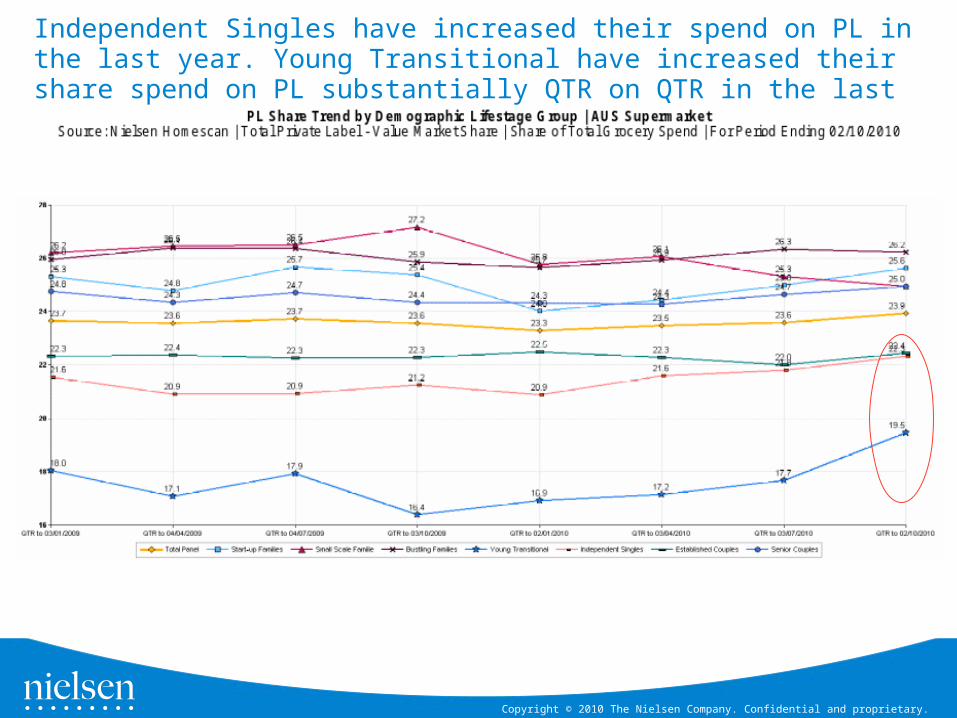
Independent Singles have increased their spend on PL in the last year. Young Transitional have increased their share spend on PL substantially QTR on QTR in the last year.

Copyright © 2010 The Nielsen Company. Confidential and proprietary.
Market Share of Discounters in Europe


![[2011] eParticipation in Administrative Procedures - Alexander Prosser](https://static.cupdf.com/doc/110x72/555a4614d8b42ae1398b5189/2011-eparticipation-in-administrative-procedures-alexander-prosser.jpg)