
CONJOINT ANALYSIS OF BREADED CATFISH NUGGETS: CONSUMER
PREFERENCES FOR PRICE, PRODUCT COLOR, COOKING METHOD,
AND COUNTRY OF ORIGIN
Except where reference is made to the work of others, the work described in this thesis is
my own or was done in collaboration with my advisory committee. This thesis does not
include proprietary or classified information.
___________________________
Jessica Irene Hill
Certificate of Approval:
________________________ ______________________
Deacue Fields Robert G. Nelson, Chair
Associate Professor Professor
Agricultural Economics Agricultural Economics
_________________________ _______________________
Daniel Butler Joe F. Pittman
Associate Professor Interim Dean
Marketing Graduate School

CONJOINT ANALYSIS OF BREADED CATFISH NUGGETS: CONSUMER
PREFERENCES FOR PRICE, PRODUCT COLOR, COOKING METHOD,
AND COUNTRY OF ORIGIN
Jessica Irene Hill
A thesis
Submitted to
the Graduate Faculty of
Auburn University
in Partial Fulfillment of the
Requirements for the
Degree of
Master of Science
Auburn, Alabama
May 10, 2008

iii
CONJOINT ANALYSIS OF BREADED CATFISH NUGGETS: CONSUMER
PREFERENCES FOR PRICE, PRODUCT COLOR, COOKING METHOD,
AND COUNTRY OF ORIGIN
Jessica Irene Hill
Permission is granted to Auburn University to make copies of this thesis at its discretion,
upon request of individuals or institutions and at their expense. The author reserves all
publication rights.
____________________________
Signature of Author
____________________________
Date of Graduation

iv
THESIS ABSTRACT
CONJOINT ANALYSIS OF BREADED CATFISH NUGGETS: CONSUMER
PREFERENCES FOR PRICE, PRODUCT COLOR, COOKING METHOD,
AND COUNTRY OF ORIGIN
Jessica I. Hill
Master of Science, May 10, 2008
(B.S., Auburn University, 2006)
41 Typed Pages
Directed by Robert G. Nelson
The catfish nugget is the residual product that results when the belly flap is cut
away the fillet to produce the shank fillet. Nuggets are a lower-valued portion of the
catfish because of their high fat content, higher potential for an off-flavor, and the black
membrane covering one side of the nugget. A new product, marinated, breaded catfish
nuggets, was developed to ameliorate these negative attributes. This conjoint study was
designed to evaluate consumers‟ preferences for four attributes of catfish nuggets: price
($1.49/lb., $4.59/lb., and $7.49/lb.); color of breading (light, medium, and dark); country
of origin (U.S. and China); and cooking method (oven baked and deep fried).
v
An in-store survey was conducted in grocery stores in eight cities in three states:
Alabama, Georgia, and Florida that included using a 7-point intention-to-buy scale.
Participants evaluated 12 different photographs of catfish nuggets that included
information about various levels of the attributes. 614 usable surveys were collected. The
data was analyzed to determine individual preferences using conjoint analysis. Cluster
analysis, based on similar preferences, was used to group respondents into the following
three segments: the price sensitive segment preferring the low price, country of origin
being U.S. as preferred country, and color of breading being dark as the preferred color.
A multinomial logit model was used to identify significant demographic variables that
influenced membership in the segments. These included age, ethnicity, and education.

vi
Journal of Agricultural and Applied Economics
Microsoft Word 2007; Microsoft Excel; Conjoint Designer; Conjoint Analyzer; SAS;
Limdep; Adobe Photoshop

vii
TABLE OF CONTENTS
LIST OF TABLES ........................................................................................................... viii
INTRODUCTION ...............................................................................................................1
LITERATURE REVIEW ....................................................................................................3
METHODOLOGY AND MATERIALS .............................................................................5
EXPERIMENTAL DESIGN AND DATA COLLECTION ...............................................8
RESULTS ..........................................................................................................................13
CONCLUSIONS................................................................................................................22
REFERENCES ..................................................................................................................23
APPENDIX A. Information Letter ...................................................................................26
APPENDIX B. Survey Instrument ....................................................................................27
APPENDIX C. Panel ........................................................................................................31
APPENDIX D. Rating Results for Alternative Names .....................................................32
APPENDIX E. Chart of Respondents‟ First Choice for Names .......................................33

viii
LIST OF TABLES
Table 1. Distribution of Preferred Levels .........................................................................14
Table 2. Preference Coefficients, Relative Importance, Adjusted R2, and Demographics
for Segments and Overall Sample......................................................................................17
Table 3. Percent of Respondents Who Specified the Level as Their First Choice ...........18
Table 4. Marginal Probabilities by Consumer Segment ...................................................19
1
CONJOINT ANALYSIS OF BREADED CATFISH NUGGETS: CONSUMER
PREFERENCES FOR PRICE, PRODUCT COLOR, COOKING METHOD,
AND COUNTRY OF ORIGIN
Introduction
The nugget portion of the catfish has not been a popular product among
consumers. The nugget has a negative image among consumers which contribute to a
low profit margin for catfish processors. The nugget has several drawbacks that
contribute to the negative image perceived by consumers. The nugget is made from the
belly flap that is cut away from the fillet of the catfish. It has a higher concentration of
fat than other forms of the catfish (fillets, steaks, and whole dressed) and therefore is
more likely to retain off-flavors. There is also a black membrane covering one side of the
nugget that gives it an unappetizing appearance. The membrane, high fat content and
potential for off-flavor have all contributed to the unappealing image with consumers.
To offset these drawbacks, a new product was developed to improve the nugget:
a marinated, breaded catfish nugget that comes in four distinct flavors (Szechwan,
Poblano, Buffalo, and Lemon Pepper). A test taste was done to evaluate participants‟
preference for the four different samples of nuggets in terms of flavor, appearance,
texture, off-flavor perception and overall acceptability (Woods-Williams et al., 2007).

2
The taste test, as well as meetings and phone conversations with catfish
processors, suggested that information on additional attributes would be needed to
successfully market this product. Several attributes were determined to be important for
evaluation: price, color of breading, country of origin, and cooking method. There were
several additional attributes identified as well. Flavor was considered as an attribute to
include in the survey, with four levels: Lemon Pepper, Szechwan, Poblano, and Buffalo.
However, a taste test provided information on flavor preferences, so there was no need to
include this attribute. Size was considered, which would include three levels: small,
medium, and large. However, size was not included in the survey because the food
technologist, Woods-Williams‟ standard size for the nuggets is one to one and half ounce.
Also, it takes additional processing on both the food technologist and processors to vary
the size. Labeling was also an attribute considered. Some fish contain omega-3 fatty
acids which are considered a good fat that contributes to healthy hearts. There were two
levels: with labeling indicating high in omega-3 fatty acids or no label. However, after
discussions with food technologists, it was discovered that catfish have low omega-3
fatty acids and to get a substantial amount, catfish would have to be fed omega-3 fatty
acids. Another labeling considered was farm-raised or wild caught. However,
conversations with processors revealed that they only processed farm-raised catfish. The
objective of this study was to determine consumers‟ preferences for various levels of
these attributes for catfish nuggets and to identify any segments that might differentiate
the market. This information would add value to the nugget and help processors improve
the marketability of the nugget.

3
Literature Review
Numerous conjoint studies have been conducted on food products in the past
several years. One of the more recent studies involved of analysis consumer preferences
for mandarin attributes (Campbell et. al, 2006). Conjoint analysis was used to determine
the variety of mandarin and other attributes that consumers prefer when purchasing the
fruit. Attributes considered were price, packaging, and type of mandarin, shelf life, and
Vitamin C labeling. An in-store survey was conducted in several grocery stores and
participants were asked to rate pictures of the fruit on a 7-point intention-to-buy scale.
This study made use of cluster analysis and multinomial logit modeling. In the study six
segments were identified.
Another study similar to the mandarin study was about the fruit quality
characteristics for Satsumas that are important to consumers (Campbell et al., 2004). A
conjoint study was developed to determine preferences for price, color, size, blemishes,
seediness, production region label and organic production. In this study there was a
price-sensitive segment characterized by strongly preferring the lowest price. The study
also examined color as an attribute.
Two studies on consumer preferences for peanut products were conducted in
Haiti. The first one dealt with the preferences for roasted peanut products. Nelson et al.
(2005) conducted a conjoint analysis to determine consumer preferences for roasted
peanuts, including the processed form, country of origin, and price. In this study, all of
the segments placed the highest relative importance on price, but in Segment II second
highest relative importance was placed on country of origin. The other study was done
on peanut butter products in Haiti (Nelson, et al, 2003) to determine consumer

4
preferences for form, country of origin, and price. Again, price was the most important
attribute to the consumers. However, in Segment II, there was again a clear indication
that origin plays a role in consumer preferences, with 27% relative importance.
There are two methods used to code consumer preferences: rank order and
interval rating. The rank order method allows respondents to ambiguously rank all
hypothetical product choices, which provides a non-metric ordering of a respondent‟s
preferences (Harrison et al., 2002). The interval rating method allows respondents to
express order, indifference, and intensity, a feature that allows both metric and non-
metric properties of utility to be expressed (Harrison et al., 2002). If rank order is the
method of choice than the dependent variable is ordinal, and models such as logit or
probit are appropriate to use. However, other researchers argue that the ordered probit or
logit model is best suited for conjoint estimations because interval rating are measured as
discrete variables (Harrison et al., 2002). In Harrison, Stringer, and Prinyawiwatkul‟s
(2002) study on added-value products from crawfish, a two-limit probit model and
ordered probit model were used to determine the part-worth estimates (or preference
coefficients) and address the methodological issues.
In a study of consumer preferences for added-value products from crawfish an
exploratory survey conducted in 10 grocery stores in south Louisiana discovered that
common product forms were breaded nuggets, fish and crab patties and shrimp poppers
(Harrison et al., 2002). The authors discovered four attributes that were important,
including price, product form, packaging, and reheating method. They also discovered
that there was little estimation differences between the two-limit probit model and the
ordered probit model. All the part-worths‟ estimates in both models were significant
5
except for microwave reheating and package size, and all the signs were consistent in
both models (Harrison et al., 2002). The magnitudes of the standardized two-limit probit
model were also very similar to the ordered probit models. This indicates that the partial
effects on the estimated utility functions are consistent across both models (Harrison et
al., 2002).Ward‟s method was used for the cluster analysis revealing three segments.
Segments I and II preferred the nugget form baked. In Segment III, they preferred the
nugget form microwave.
A conjoint analysis was conducted by Alberto Manalo (1990) on the importance
of apple attributes. The research was to determine the attributes that consumers desire
when purchasing apples. Manalo took a random sample of 208 respondents that were
interviewed in a shopping mall. Respondents were asked to evaluate the following
attributes of apples during the survey: size, color, flavor, crispiness, and price. The
conjoint study consisted of 18 stimulus cards where each card displayed a combination of
the attributes. The respondents were asked to rank the cards from 1 to 18, indicating
highest and lowest preference. Effects coding was used to code the attributes‟ levels.
Manalo states that using effects coding allows for easier explanation of the part-worths
and interpretation of the conjoint analysis results. Ordinary Least Squares was used to
estimate the part-worths. The study revealed that consumers placed the highest
importance on crispiness, followed by size, color, flavor, and finally price per pound.
Methodology and Materials
Conjoint analysis is a multivariate technique developed specifically to understand
how respondents develop preferences for any type of product (Hair et al., 2006). It is
6
based on the simple premise that consumers evaluate the value of a product by combining
the separate amounts of value provided by each attribute (Hair et al., 2006). By
evaluating the respondent‟s rating for the combined features (attributes) for the product,
the individual preference scores for each feature can be deduced.
Conjoint analysis is a technique widely used to measure consumers‟ trade-offs
between competing products. It has been very useful in the marketing world to determine
consumers‟ preferences for products. The advances made in conjoint analysis have
created a powerful tool to predict consumers‟ preferences for product features.
The first step in a conjoint study is to determine the design. In a conjoint analysis,
the features that are most important to the evaluation of the product must be determined.
When determining the number of features to include in the conjoint analysis, it is
important to keep in mind that respondents will only devote a limited time to the process,
so it is important to select the fewest features that are critical to the product, while still
being able to obtain the information needed to estimate the respondents‟ utility functions.
In this conjoint study of catfish nuggets, the features evaluated were price, color of
breading, country of origin, and cooking method. From information received from food
technologists, catfish processors, and past conjoint studies, these four factors were
identified as the key characteristics that consumers would use to evaluate this product.
Each feature will have two or more levels.
When the features and their levels are determined, the information is entered into
the Bretton-Clark (1990) Conjoint Designer program. Conjoint Designer will produce a
set of designs with a certain number of cards in each design. Each design will consist of
cards displaying at least one of every feature identified and at least one of its levels for

7
that feature. Therefore, there would be a set number of cards with the features: price and
one of its specified levels, color of breading and one of its specified levels, country of
origin and one of its specified levels, and cooking method and one of its specified levels.
Conjoint Designer will randomize the cards to reduce any bias in the study. When
choosing one of the designs produced by Conjoint Designer, it is best to choose the
smallest complete design, which is the design with the least number of cards.
As stated, there were four features to be evaluated in this conjoint study of catfish
nuggets. One of the features is price. Price is a factor included in many conjoint studies
because it represents a distinct component of value for many products or services being
studied (Hair et al., 2006). Price is an important factor to a consumer‟s decision making
process. There were three price levels determined for this study: $1.49/lb., $4.59/lb., and
$7.49/lb.
The color of the breading may also be a determining factor for consumers. A
taste test for catfish nuggets was conducted by Kristin Woods-Williams, food
technologist with the Alabama Cooperative Extension System. The test suggested that
respondents associated the color of the breading with cooking quality. Some respondents
believed that the darker color nuggets suggested over-cooking, while others thought the
lighter color nuggets suggested undercooking. Therefore, three color levels were included
in the conjoint study; medium to golden brown, dark brown and light brown.
Following several recent food-related scares over products from other countries,
there has been an increasing concern among consumers to know where their food
products originated. The recent food scare from China has highlighted this issue among
catfish consumers. After several conversations with catfish processors, it was discovered

8
that some processors deal with imported catfish products. Therefore, country of origin
was determined to be an important factor to be evaluated in this study. There are two
levels: imported products from China and domestic products from United States. China
was chosen as the source of imported product because channel catfish are raised there.
This decision was made before the reports of tainted food products being imported from
China.
The fourth and final feature is cooking method. In the past several years there has
been a push by the food industry to provide healthier alternatives for certain food
products because of consumers‟ increasing concern with healthier eating. Also, because
if the product was introduced into the Alabama‟s school system, it would have to be in
the baked form because the schools no longer fry. That is why two different cooking
methods, oven baked and deep fried, are included in the study to be evaluated by
respondents.
Experimental Design and Data Collection
There were four attributes, two with three levels and two with two levels, so the
required combinations to be evaluated would have been 36 combinations (3 x 3 x 2 x 2).
However, to minimize participants‟ fatigue, Conjoint Designer was used to reduce that
number of combinations to nine. There were three more combinations added to the design
as holdout cards, increasing the total number of combinations to 12, and increasing the
degrees of freedom in the model to be estimated. Conjoint Designer does this by using
orthogonal rays, which is a highly efficient technique that reduces the size of the task
necessary to estimate the respondent‟s preference (utility) function (Bretton-Clark, 1990).

9
Several photographs of cooked, breaded catfish nuggets were taken with a digital
camera. The photographs were examined to determine which batch of nuggets best
represented the medium to golden brown color desired. This photograph was chosen as
the archetypal batch of nuggets.
Once the archetypal nugget photograph was chosen, the photograph was copied
into Adobe‟s Photoshop 7 (Adobe Systems Inc., Seattle, Washington). After the
archetypal („medium color”) photograph was copied into Adobe‟s Photoshop, the hue,
saturation, and light values were adjusted to achieve the light and dark extremes of the
medium color. The “light color” was achieved by adjusting the hue to +7, the saturation
to +9, and the light to +15 of the original photo which were all normalized to zero. The
“dark color” was achieved by adjusting the hue to -5, the saturation to -15 and the light to
-15 of the original photo which were all normalized to zero.
There were 12 panels, each displaying a picture with three lines of text describing
attributes‟ levels. There were 3 sets of posters that were rotated as displays for the in-
store surveys. Each poster had two sides, the front side displayed panels A through F
and the back side displayed panels G through L. The attributes‟ levels were randomized
three times using Conjoint Designer to reduce order bias, thus creating the three sets of
posters. These kinds of props make the task more interesting to the respondent, provide
easier and potentially less ambiguous ways of conveying information, and hence allow a
greater number of attributes to be included in the full-profile method (Green and
Srinivasan, 1990).
The in-store surveys were administered in 12 grocery stores in eight cities in
Alabama, Georgia, and Florida. The eight cities included were Opelika, Auburn,

10
Luverne, Troy, Montgomery, and Prattville, all located in Alabama, as well as,
Columbus, Georgia and Apalachicola, Florida. The grocery store chains visited were The
Kroger Company (3), Bruno‟s (1), Piggly Wiggly (5), Southern Family Foods (2), and
Food World (1).
A display was set up in each store either near the frozen meat section or near the
entrance. There was a different set of posters taken to each store on different days with
the time spent in each store ranging from four to eight hours. Several grocery stores were
revisited, at a different date and with a different set of posters. Dummy coding was used
to code the grocery stores. The posters were set up on a table six feet in length. Panels A
through F stood on one side and Panels G through L stood on the opposite side, with the
backs facing each other or on occasion the posters were standing side by side with the
edges touching. Either way, respondents were allowed to take the survey starting at any
panel of their choosing as long as the panel they were evaluating corresponded to the
panel they marked on the survey. The respondents were asked to rate each stimulus on a
rating scale of 1 to 7, where 1 meant that the respondent definitely would not buy the
product and 7 meant that the respondent definitely would buy the product, as presented in
the photograph. Participants could mark anywhere between 1 and 7, and their mark was
later measured to the nearest tenth of a decimal place. Following Institutional Review
Board guidelines respondents were allowed to opt out of the survey without penalty at
any time during the survey, although fewer than about 1% did so.
The survey also consisted of seven questions about catfish nuggets usage and six
questions concerning demographics. The usage questions included: awareness of catfish
nuggets (yes or no), previous consumption of catfish nuggets (yes or no), previous

11
purchaser of catfish nuggets (yes or no), if yes would purchase them again, purchasing
frequency, location of purchase (grocery, fish market, or other), and how many pounds
per purchase on average. The last question that was included in the usage questions
asked participants to rate ten alternative names for catfish nuggets on a scale of 1(least
appealing name) to 7 (most appealing name). The questions about demographics were
year of birth, gender, ethnic group, years of education completed, and number of people
in the household and their age group, and income bracket. A total of 663 surveys were
administered, however only 614 of those surveys were usable.
Ordinary Least Squares was used to estimate each respondent‟s preference
coefficients (part-worths) each feature‟s level and one level for each feature is dropped to
avoid singularity. The following model specification was used:
Rj = β1 + β2 (P1) + β3 (P3) + β4 (C1) + β5 (C3) + β6 (O1) + β7 (CM2) + Ej [1]
where, Rj denotes rating value assigned by respondent j on the 7-point scale; P1 =
$1.49/lb. price level; P3 = $7.49/lb. price level; C1 = light color breading; C3 = dark
color breading; O1 = China as country of origin, and CM2 = oven baked as cooking
method.
The independent variables were effects coded. Effects coding is an alternative to
dummy coding in which the effects are uncorrelated with the intercept (Bech and Gryd-
Hansen, 2005). The reference level in effects coding is assigned a -1, as opposed to
dummy coding where the reference level is assigned 0. In effects coding: if the level is
present a 1 is assigned. The reference level is not present and is assigned a -1 and 0 (if a
third level is present) if otherwise (Bech and Gryd-Hansen, 2005). The reference profile
for this study was medium colored breaded catfish nuggets that are oven baked, the

12
country of origin is United States, and the price is $4.59/lb.
The estimated preference coefficients obtained through ordinary least squares
regression are used to determine each respondent‟s relative importance of each attribute.
The relative importance is calculated in the following way:
R.I.i = (rangei * 100)/ ∑i (ranges) [2]
where, R.I.i is the relative importance for feature i. The range is calculated by taking the
difference between the highest and lowest coefficient for each feature and then summing
the ranges across all of the features. The results are interpreted as the percentage of
importance the consumer placed on each attribute when expressing his/her intention to
buy.
Cluster analysis was used to group respondents with similar preference
coefficients into clusters. PROC FASTCLUS was used to perform a disjoint cluster
analysis on the basis of Euclidean distances computed from these preference coefficients
(SAS User‟s Guide: Statistics, 1985). FASTCLUS initially develops cluster seeds that
are the means of the clusters, and from there temporary clusters are developed and
observations are assigned to the clusters with the nearest seeds. Whenever an observation
is assigned, the cluster seeds are updated with the new cluster mean. Once all the cluster
seeds are assigned, they are replaced with cluster means. Then the final clusters are
formed by assigning the observations to the nearest seed. In this study 30 initial clusters
were created to determine the presence of outliers. Clusters with less than three
observations were classified as outliers. PROC CANDISC was used to produce plots of
all clusters by using the first and second canonical variables as the axes. Then
FASTCLUS was run again to assign the outliers to the nearest seed. Three clusters were

13
subjectively chosen based on the ability to clearly discern the outer edges of the clusters
and each respondent was assigned a cluster number (1, 2, or 3).
Multinomial logit modeling allows us to provide a physical description of the
clusters‟ members based on the demographic and usage information. Initially, clusters
were created by grouping similar preference coefficients, but logit analysis allows us to
identify membership probability. The cluster numbers are the dependent variable run
against all the demographic and usage variables. The results from the model give us the
likelihood of cluster membership based on demographic and usage information.
Results
The relative importance placed on each attribute for the 614 respondents are
country of origin which accounted for 30% of the decision buying process, followed by
the color of the breading with almost 28%, then 27% for price, and cooking method
accounted for the final 14% of the decision buying process.
Table 1 shows the distribution of preferred levels for each attribute. By preferred,
it is meant that the respondent had a greater utility for one level over the other levels. Of
the 614 respondents, nearly 54% preferred the price level $1.49 per pound, 49% preferred
the medium colored breading, and 79% preferred U.S. catfish nuggets and almost 58%
preferred oven baked catfish nuggets.

14
Price per lb. Level Percentage
$1.49 54.40
$4.59 25.16
$7.49 20.44
Breading Color Level Percentage
Light 24.76
Medium 49.02
Dark 26.22
Country of Origin Level Percentage
China 20.93
U.S. 79.07
Cooking Method Level Percentage
Deep Fried 42.26
Oven Baked 57.74
Table 1. Distribution of Preferred Levels
In segmenting the market, we need to understand who the respondents are (based
on demographic information) that chose the particular products described. Three
consumer segments were identified by cluster analysis. Table 2 presents the three
segments identified and the average preference coefficients and average values for
demographics by segment and for the overall sample. The first segment was identified as
the price-sensitive segment because they placed the highest relative importance (42%) on
price. Segment I‟s large, positive preference coefficient for the lowest price that a
product with this price indicates that would increase the base rating by 1.13 on the 7-
point scale, or 29% (Campbell et al., 2004). Conversely, a price of $7.49, received a
large, negative average preference coefficient of -1.11 which would decrease the base
rating by 28%. Table 3 represents the percentage of respondents‟ who chose each level
as their first choice for each of the three segments. In Segment I, 85% of the
respondents‟ first choice was the $1.49 per pound price.

15
In Segment I, color of breading followed price with a relative importance of 25%,
and with the largest preference coefficient being placed on the medium color choice for
breading. However, consumers‟ preferences for this attribute were not as strong as for
price. Respondents in Segment I assigned the medium color breading an average
preference coefficient of 0.26. Respondents in this segment exhibited a negative
preference for the dark breading. Dark breading received an average preference
coefficient of -0.29, indicating that the base rating would decrease by 7% if the nugget
breading was dark. The relative importance of cooking method for Segment I was 18%.
Sixty-seven percent of respondents chose oven baked nuggets as their first choice,
however 33% chose deep fried as their first choice for cooking method. Therefore, there
are still a considerable number of Segment I‟s respondents that would choose deep fried
nuggets.
Segment II was represented as the segment that strongly preferred the country of
origin for catfish nuggets to be the U.S. This segment had the highest percentage of
whites (only 34% were non-white), they were significantly older (47 vs. 44 overall), and
had a significantly higher income range of $35,000 to $49,999 vs. $25,000 to $34,999 per
year for the overall. They assigned a relative importance of 53% to country of origin;
therefore over half of their buying decision was based on country of origin. The
consumers in this segment clearly felt very strongly about the country of origin: the U.S.
received an average preference coefficient of 1.57, indicating that if the nuggets‟ origin
was the U.S. then the base rating would increase by 44% and if the origin was China then
the base rating would decrease by 44%. Ninety-nine percent of the respondents in
Segment II preferred U.S. as the country of origin. Both price and color of breading only

16
had relative importance of 18% each. Consumers in Segment II preferred the price of
$1.49 which received an average preference coefficient of 0.12, and 50% of these
respondents chose this price as their first choice. The medium colored breading average
preference coefficient was 0.18 and 47% of respondents chose this as their first choice.
The average preference coefficient for oven baked was 0.06, increasing the average rating
by only 2%.
Segment III‟s highest relative importance (46%) was placed on color of breading.
Consumers in this segment preferred the dark color breading, as indicated by an average
preference coefficient of 0.67. More importantly, consumers had a very strong negative
preference for light color breading; the average preference coefficient was -1.15. Fully
93% of the respondents preferred dark or medium breading while, only 7% preferred
light breading. Segment III was the only segment to show a preference for the high price
($7.49/lb.). One reason for this could be that this segment associated a higher price with
a better quality product. Respondents did not exhibit strong preferences for either
country of origin or cooking method although, they preferred U.S. products and the oven
baked cooking method. There were some interesting demographic characteristics for this
segment. They had the highest percentage of non-white respondents (67%), they were
significantly younger in age (41 vs. 44 overall), they had significantly lower income
ranges, 4.46 versus 4.93 per year for the overall. Therefore, if the respondents could have
chosen between the ranges of $25,000 to $35,000, then they would have marked towards
the low end of $25,000. The respondents in Segment III also had significantly less
education (13 years vs. 14 years overall).

17
Attributes and Levels Segment I Segment II Segment III Overall
N 204 249 161 614
Market Share (%) 33.2 40.6 26.2 100.0
Intercept (base rating) 3.91b
3.58c* 4.18
a* 3.85
Price/lb.
$1.49 1.13a* 0.12
b* -0.12
c0.39
$ 4.59 -0.02a
0.02a
-0.01a
0.00
$7.49 -1.11c* -0.14
b* 0.13
a* -0.39
Relative Importance (%) 42.2a* 18.0
c* 23.4
b* 27.4
Color of Breading
Light 0.02a* 0.10
a* -1.15
b* -0.25
Medium 0.26b
0.18b* 0.48
a* 0.28
Dark -0.29b* -0.28
b* 0.67
a* -0.03
Relative Importance (%) 25.0b
18.6c* 46.0
a* 27.9
Country of Origin
U.S. 0.22b* 1.57
a* 0.07
c* 0.73
China -0.22b* -1.57
c* -0.07
a* -0.73
Relative Importance (%) 14.7b* 53.1
a* 14.5
b* 30.3
Cooking Method
Oven Baked 0.30a* 0.06
b0.03
b* 0.13
Deep Fried -0.30b* -0.06
b-0.03
b* -0.13
Relative Importance (%) 18.0a* 10.4
b* 16.1
a14.4
Adjusted R2
0.54 0.69* 0.39* 0.56
Survey Store, City
Piggly Wiggly, Opelika 7 8 9 8
Kroger, Auburn 14 10 8 11
Bruno's, Auburn 3 1 1 2
Piggly Wiggly, Columbus 12 12 23* 15
Piggly Wiggly, Apalachicola 7 8 7 7
Southern Family Foods, Luverne 2 4 6 3
Piggly Wiggly, Troy 9 8 11 9
Southern Family Foods, Troy 4 5 3 4
Piggly Wiggly, Montgomery 5 1* 3 3
Piggly Wiggly, Opelika 3 2 6 4
Kroger, Opelika 18 20 7* 16
Food World, Prattville 4 7 6 6
Kroger, Auburn 10 13 9 11
Ever heard of nuggets (% yes) 85a
88a
88a
87
Ever eaten nuggets (% yes) 74a
77a
77a
76
Ever bought nuggets (% yes) 54a
58a
60a
57
Age (years) 42.90b
47.10a* 41.48
b* 44.23
Gender (% female) 66a
70a
73a
69
Ethinicity (% non-white) 51b
34c* 67
a* 48
Education (years) 14.36a
14.25a
13.11b* 13.99
Income range (5 = $35-$50,000/year) 4.86ab
5.28a* 4.46
b* 4.93
Family age structure (no. of persons)
Babies (<4 years) 0.21 0.16 0.20 0.19
Small Kids (4 to 8 years) 0.19 0.20 0.21 0.20
Preteens (9 to 12 years) 0.19 0.17 0.16 0.17
Teens (13 to 18 years) 0.37 0.30 0.39 0.35
Young Adults (19 to 25 years) 0.42 0.33 0.42 0.38
Adults (26 to 35 years) 0.35 0.27 0.34 0.31
Middle Age (36 to 50 years) 0.64 0.57 0.72 0.63
Preretirement Age (51 to 65 years) 0.52 0.61 0.37* 0.52
Retirement Age (>65 years) 0.17 0.22 0.13 0.18
a,b,cMeans with different letters indicates significance.
and overall sample.
Table 2. Preference Coefficients, relative importance, adjusted R2, and demographics for segments
* Significantly different (p < .10) from overall sample in a two-tail t test.

18
Segment I Segment II Segment III
85 50 32
12 31 32
2 20 35
29 39 7
50 47 40
21 14 53
71 99 57
29 1 43
67 55 52
33 45 48
Cooking Method
Oven Baked
Deep Fried
U.S.
China
Table 3. Percent of respondents who specified the level as their first choice.
Price/lb.
Attributes and Levels
Color of Breading
Country of Origin
Dark
Light
Medium
$1.49
$ 4.59
$7.49

19
Demographics play an important role in understanding the segments identified.
The marginal effects from the multinomial logit model indicate the probability of
membership in a particular segment based on demographic information. Table 4 shows
the marginal probabilities of membership by segment. In segment I, which represented
33% of the market, ethnicity and education were significant. The interpretations of these
marginal effects are that if the consumer is non-white, then their probability of being in
Segment I increase by about 9%; if they have one more year of education than average
then their probability of being included in Segment I increase by about 2%.
Table 4. Marginal probabilities by consumer segement with respect to the vector of demographic variables (computed at the means)z.
Variable Coefficient p value Coefficient p value Coefficient p value
Intercept -0.2745 0.14 0.2519 0.18 0.0226 0.89
Survey Store (% of segment)
Store 1 0.1622 0.10 -0.1466 0.16 -0.0156 0.86
Store 2 0.2126 0.19 -0.1152 0.55 -0.0974 0.56
Store 3 -0.0515 0.58 0.0138 0.89 0.0378 0.61
Store 4 0.0565 0.60 -0.0618 0.57 0.0052 0.95
Store 5 -0.0219 0.88 -0.0904 0.51 0.1123 0.28
Store 6 0.0617 0.54 -0.0271 0.79 -0.0346 0.68
Store 7 0.0589 0.64 -0.0040 0.97 -0.0549 0.63
Store 8 0.3300 0.03 -0.3436 0.10 0.0136 0.92
Store 9 0.0001 1.00 -0.1184 0.42 0.1183 0.26
Store 10 0.1233 0.20 0.0656 0.50 -0.1888 0.04
Store 11 0.0262 0.82 -0.0171 0.88 -0.0091 0.93
Store 12 0.0171 0.87 0.0087 0.93 -0.0258 0.77
Previous knowledge of catfish nuggets (1=yes) 0.0567 0.49 -0.1057 0.23 0.0490 0.52
Ever eaten catfish nuggets (1=yes) -0.0389 0.59 0.0566 0.46 -0.0178 0.78
Ever purchase catfish nuggets (1=yes) 0.0295 0.59 -0.0727 0.21 0.0431 0.38
Age (years) -0.0020 0.30 0.0037 0.07 -0.0017 0.32
Gender (1=female) -0.0684 0.14 0.0153 0.75 0.0531 0.22
Ethnicity (1=non-white) 0.0902 0.09 -0.2506 0.00 0.1604 0.00
Education (years) 0.0175 0.02 -0.0029 0.69 -0.0145 0.05
Income range -0.0182 0.11 0.0090 0.44 0.0092 0.36
Age structure of family (no. of persons in household)
Babies (<4 years) 0.0356 0.42 0.0073 0.88 -0.0429 0.27
Small Kids (4 to 8 years) -0.0408 0.37 0.0433 0.36 -0.0026 0.95
Preteens (9 to 12 years) -0.0030 0.95 0.0516 0.30 -0.0487 0.26
Teens (13 to 18 years) 0.0330 0.31 -0.0170 0.63 -0.0160 0.57
Young Adults (19 to 25 years) 0.0125 0.67 -0.0199 0.54 0.0074 0.78
Adults (26 to 35 years) 0.0602 0.14 -0.0524 0.24 -0.0078 0.83
Middle Age (36 to 50 years) 0.0382 0.27 -0.0478 0.20 0.0096 0.75
Preretirement Age (51 to 65 years) 0.0663 0.06 -0.0076 0.84 -0.0587 0.09
Retirement Age (>65 years) 0.0596 0.28 -0.0197 0.73 -0.0399 0.44zMultinomial logit model likelihood ratio statistic significant at p < 0.01.
Marginal Probabilities of membership in each segment
Prob [Segment I] Prob [Segment II] Prob [Segment III]

20
The information from Table 2 and Table 4 give a good indication of the
consumers‟ make-up in segment I. Therefore, the customer profile for segment I that was
price sensitive are black females that receive at least 2 years of education beyond
completion of high school and have an income range of $35,000 to $49,999 per year as
indicated in Table 2. In the multinomial logit model, out of the 204 members assigned to
Segment I, only 73 were correctly predicted or 36%. The other 93 members (46%) were
incorrectly assigned to Segment II and 38 (19%) were incorrectly assigned to Segment
III.
Segment II (41% market share) was represented by U.S. being the preferred
country of origin. It is interesting that there is a segment based on country of origin due
to the fact that during the dates (end of June to beginning of August) the survey was
conducted, news outlets were reporting information about contaminated food products
imported from China. So the results could possibly reflect the media attention. The
demographic variables of age and ethnicity were significant variables in Table 4. The
marginal probability of a consumer being assigned to Segment II increased by 0.37%
when the consumer‟s age increased by one year. A non-white respondent had a
decreased probability of membership in Segment II by 25%. This information is
supported by the average demographics in Table 2. A consumer that was on average
around 47 years of age and a white female with an income range $35,000 to $49,999 per
year preferred oven-baked, medium color breaded catfish nuggets from the U.S. at
$1.49/lb. The preference coefficient for cooking method was not strong nor significantly
different from the overall, however it is important to note that to market to this specific
customer profile, they would prefer an oven baked nugget (0.06) compared to a deep

21
fried nugget (-0.06). The multinomial logit model correctly predicted 170 of the 249
members or 68%. There were 36 members (14%) incorrectly assigned to Segment I and
43 (17%) were incorrectly assigned to Segment III.
Segment III was identified as preferring the dark color breading and represented
26% of the market. As mentioned they had a strong negative preference for light color
breading so in order to market to this segment it is important to note that a medium or
dark breading would be the best product profile. A medium color breading would
increase the base rating by 11% and a dark color breading would increase the base rating
by 16%. The multinomial logit model revealed that both ethnicity and education were
significant. The interpretation is that if you are non-white, it increases your probability of
being assigned to Segment III by 16%. If the consumer receives one more year of
education than average then their membership in Segment III would decrease by 1%.
This is supported by Table 2 where the customer profile is a black female, average age of
41 years, and about 13 years of education in the income range of $25,000 to $34,999 per
year.
A consumer in this segment prefers the higher price of $7.49, which represents
23% of the relative importance. The price of $7.49 would increase the average base
rating by 3%. So it is possible that consumers in Segment III would be willing to pay a
higher price for darker breaded nuggets. The preference coefficients for origin and
cooking method are not very strong but it is important to note that the consumers prefer
U.S. nuggets that are oven baked. It would increase the average base rating by about 1%
for both attributes. In the multinomial logit model, out of the 161 members assigned to
segment III, 65 were correctly predicted or 40%. The other 41 members (25%) were

22
incorrectly assigned to Segment I and 55 (34%) were incorrectly assigned to Segment II.
Conclusions
This conjoint study suggested that there is market potential for catfish nuggets and
that consumers do have strong preferences for certain attributes in catfish nuggets. The
cluster analysis revealed valuable information that could not have been detected from the
conjoint study alone. Through cluster analysis, three segments were identified: Segment
I represented the price sensitive, Segment II represented the U.S. as country of origin, and
Segment III represented the dark color breading. It was interesting to find out that there
was some preference for the highest price, $7.49, (in Segment III) which indicates that if
a dark breaded nugget was introduced into this particular market then consumers might
be willing to pay the higher price. This is unusual since the lower prices are usually
preferred. We also discovered that cooking method did not influence buying intentions
as strongly as originally thought.
The marginal probabilities allowed for more descriptive profiles of the segments
based on demographics, independent of preference coefficients. This information allows
marketers to determine the customer profiles and target these segments with a specific
product. It is easier to identify a customer that she is likely to be an older white female
that prefers catfish nuggets from U.S. when you have the additional demographic
information. This information offers something that is observable and measurable. This
information can then be given to catfish processors so that they have a better
understanding of what kind of catfish nuggets to develop and who to sell the nuggets to.
23
References
Baker, G.A. “Consumer Preferences for Food Safety Attributes in Fresh Apples: Market
Segments, Consumer Characteristics, and Marketing Opportunities.” Journal of
Agricultural and Resource Economics 24(July 1999):80-97.
Ballard, L. Personal Communication. Harvest Select, August 2006.
Bech, M. and Gryd-Hansen, D. “Effects Coding In Discrete Choice Experiments.”
Health Economics 14(2005):1079-1083.
Bretton-Clark. Conjoint Designer. New Jersey: Bretton-Clark, 1990.
Bretton-Clark. Conjoint Analyzer. New Jersey: Bretton-Clark, 1992.
Campbell, B.L., Nelson, R.G., Ebel, R.C., Dozier, W.A., Adrian, J.L., and Hockema,
B.R. “Fruit Characteristics That Affect Consumer Preferences for Satsuma
Mandarins.” HortScience 39(December 2004):1664-1669.
Campbell, B.L., Nelson, R.G., Ebel, R.C., and Dozier, W.A. “Mandarin Attributes
Preferred by Consumers in Grocery Stores.” HortScience 41(June 2006):664-670
Green, P.E. and Srinivasan, V. “Conjoint Analysis in Marketing: New Developments
with Implications for Research and Practice.” Journal of Marketing 54(October
1990):3-19.
Hair, J.F., Black, W.C., Babin, B.J., Anderson, R.E., and Tatham, R.L. Multivariate
Data Analysis. New Jersey: Pearson Prentice Hall, 2006.
Harrison, R.W., Stringer, T., and Prinyawiwatkul, W. “An Analysis of Consumer
Preferences for Value-Added Seafood Products Derived from Crawfish.”
Agriculture and Resource Economics Review 31(October 2002):157-170.
24
Huang, C. and Fu, J. “Conjoint Analysis of Consumer Preferences and Evaluations of a
Processed Meat.” Journal of International Foods and Agribusiness 7(June
1995):35-53.
Manalo, A. “Assessing the Importance of Apple Attributes: An Agricultural Application
of Conjoint Analysis.” Northeastern Journal of Agricultural and Resource
Economics 19(October 1990):118-124.
Nelson, R.G., Jolly, C.M., Hinds, M.J., Donis, J., and Prophete, E. “Consumer
Preferences for Peanut Butter (Mamba) Products in Haiti: A Conjoint Analysis.”
Peanut Science 30(2003):99-103.
Nelson, R.G., Jolly, C.M., Hinds, M.J., Donis, J., and Prophete, E. “Conjoint Analysis of
Consumer Preferences for Roasted Peanut Products in Haiti.” International
Journal of Consumer Studies 29(May 2005):208-215.
SAS Institute Inc. SAS User‟s Guide: Statistics, 5th
edition. SAS Institute Inc., Cary,
N.C. 1985.
Silvia, J.L., and Dean, S. Processed Catfish: Product Forms, Packaging, Yields and
Product Mix. Washington, DC: U.S. Department of Agriculture, Southern
Regional Aquaculture Center, Publication No. 184, 2001.
Taylor, T.O. Personal Communication. SouthFresh Farms, August 2006.
Wilson, T. Personal Communication. American Pride, August 2006.
Woods-Williams, K. Personal Communication. Alabama Cooperative Extension
System, Clark County Office, May 2007.

25
Woods-Williams, K.L., Nelson, R.G., Weese, S.J., Whitis, G.N., and Campbell, E.R.
“Sensory Evaluation of Four Flavor Profiles Applied to the Nugget Portion of the
Catfish.” Published Abstract, Annual Meeting, Institute of Food Technologists,
Chicago, IL. July 29, 2007.

26
APPENDIX A
INFORMATION LETTER

27
APPENDIX B
SURVEY INSTRUMENT
Auburn University is conducting a survey to better understand consumer
preferences for catfish nuggets. We would greatly appreciate it if you would
take a few minutes to answer some questions about your preferences for the
catfish nuggets on display. Your participation here today will help improve the
kinds of catfish products available to you in the future.
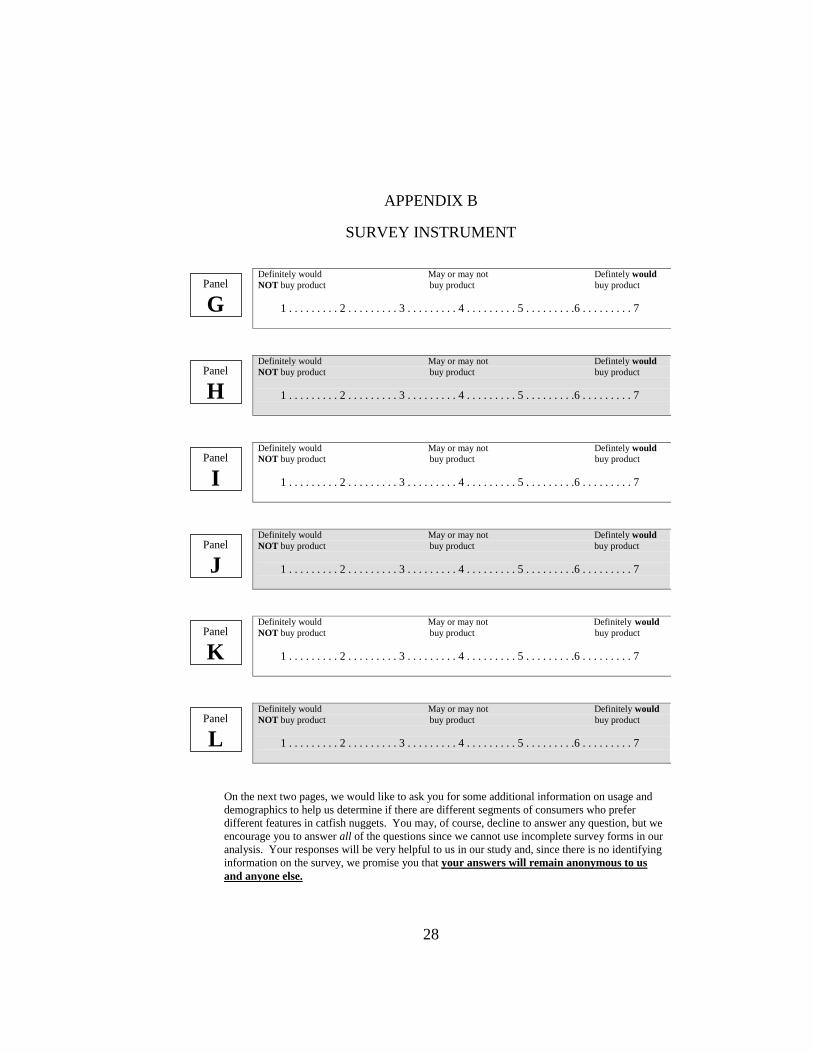
Product Profile Ratings – Catfish Nuggets Please look at each of the 12 panels of breaded
catfish nuggets. For each panel, place a mark anywhere on the line between 1 and 7 to indicate
how willing you would be to purchase the product from the frozen-food section at that price, and
then prepare it as described in the panel. A response of 1 would indicate that you are definitely
not willing to buy that product, while a response of 7 would indicate that you are very willing to
buy that product. In your evaluation, please consider all of the following: color of the cooked
product, price per pound in the frozen form, cooking method and origin of product.
Definitely would May or may not Defintely would
NOT buy product buy product buy product
1 . . . . . . . . . 2 . . . . . . . . . 3 . . . . . . . . . 4 . . . . . . . . . 5 . . . . . . . . .6 . . . . . . . . . 7
Definitely would May or may not Defintely would
NOT buy product buy product buy product
1 . . . . . . . . . 2 . . . . . . . . . 3 . . . . . . . . . 4 . . . . . . . . . 5 . . . . . . . . .6 . . . . . . . . . 7
Definitely would May or may not Defintely would
NOT buy product buy product buy product
1 . . . . . . . . . 2 . . . . . . . . . 3 . . . . . . . . . 4 . . . . . . . . . 5 . . . . . . . . .6 . . . . . . . . . 7
Definitely would May or may not Defintely would
NOT buy product buy product buy product
1 . . . . . . . . . 2 . . . . . . . . . 3 . . . . . . . . . 4 . . . . . . . . . 5 . . . . . . . . .6 . . . . . . . . . 7
Definitely would May or may not Defintely would
NOT buy product buy product buy product
1 . . . . . . . . . 2 . . . . . . . . . 3 . . . . . . . . . 4 . . . . . . . . . 5 . . . . . . . . .6 . . . . . . . . . 7
Definitely would May or may not Defintely would
NOT buy product buy product buy product
1 . . . . . . . . . 2 . . . . . . . . . 3 . . . . . . . . . 4 . . . . . . . . . 5 . . . . . . . . .6 . . . . . . . . . 7
Panel
A
Panel
B
Panel
C
Panel
D
Panel
E
Panel
F
28
APPENDIX B
SURVEY INSTRUMENT
Definitely would May or may not Defintely would
NOT buy product buy product buy product
1 . . . . . . . . . 2 . . . . . . . . . 3 . . . . . . . . . 4 . . . . . . . . . 5 . . . . . . . . .6 . . . . . . . . . 7
Definitely would May or may not Defintely would
NOT buy product buy product buy product
1 . . . . . . . . . 2 . . . . . . . . . 3 . . . . . . . . . 4 . . . . . . . . . 5 . . . . . . . . .6 . . . . . . . . . 7
Definitely would May or may not Defintely would
NOT buy product buy product buy product
1 . . . . . . . . . 2 . . . . . . . . . 3 . . . . . . . . . 4 . . . . . . . . . 5 . . . . . . . . .6 . . . . . . . . . 7
Definitely would May or may not Defintely would
NOT buy product buy product buy product
1 . . . . . . . . . 2 . . . . . . . . . 3 . . . . . . . . . 4 . . . . . . . . . 5 . . . . . . . . .6 . . . . . . . . . 7
Definitely would May or may not Definitely would
NOT buy product buy product buy product
1 . . . . . . . . . 2 . . . . . . . . . 3 . . . . . . . . . 4 . . . . . . . . . 5 . . . . . . . . .6 . . . . . . . . . 7
Definitely would May or may not Definitely would
NOT buy product buy product buy product
1 . . . . . . . . . 2 . . . . . . . . . 3 . . . . . . . . . 4 . . . . . . . . . 5 . . . . . . . . .6 . . . . . . . . . 7
On the next two pages, we would like to ask you for some additional information on usage and
demographics to help us determine if there are different segments of consumers who prefer
different features in catfish nuggets. You may, of course, decline to answer any question, but we
encourage you to answer all of the questions since we cannot use incomplete survey forms in our
analysis. Your responses will be very helpful to us in our study and, since there is no identifying
information on the survey, we promise you that your answers will remain anonymous to us
and anyone else.
Panel
G
Panel
H
Panel
I
Panel
J
Panel
K
Panel
L

29
APPENDIX B
SURVEY INSTRUMENT
Demographic Information
8. In what year were you born? _________
9. What is your gender? female male
10. What is your ethnic group? Asian Black Hispanic
Multiracial Native American White Other
11. How many years of education have you completed?
(e.g. 12 years = high school degree) _______years
12. Counting yourself, how many people in your household are in the following age groups?
(please write in the number of persons in each age group)
____ less than 4 years old _____ 13 to 18 years old ____ 36 to 50 years old
____ 4 to 8 years old _____ 19 to 25 years old ____ 51 to 65 years old
____ 9 to 12 years old _____ 26 to 35 years old ____ 66 years or more
13. What was the approximate income of your household in 2006 before taxes?
Less than $10,000 per year $50,000 to 74,999 per year
$10,000 to 14,999 per year $75,000 to 99,000 per year
$15,000 to 24,999 per year $100,000 to 149,999 per year
$25,000 to 34,999 per year $150,000 to 199,999 per year
$35,000 to 49, 999 per year more than $200,000 per year
Thank you so much for your
participation!

30
APPENDIX B
SURVEY INSTRUMENT
Usage Information
1. Have you ever heard of catfish nuggets? Yes No
2. Have you ever eaten catfish nuggets? Yes No
3. Have you ever purchased catfish nuggets? Yes Would you purchase them again?____
No If never purchased, skip to question 7
4. How often do you buy catfish nuggets? Number of times per year ________
5. Where do you buy most of your catfish nuggets?
grocery store fish market other ____________
6. How many pounds of catfish nuggets do you buy each time, on average? _________
7. We are considering several other names for catfish nuggets. Of the names on the following
list, we would like to know how appealing you find each name. Please rate your preference
for each name by placing a mark on the scale from 1 to 7, where 1 indicates “Least
appealing” and 7 indicates “Most appealing.”
Least appealing __ Most appealing
Catfish nuggets 1 . . . . . . . . . 2 . . . . . . . . . 3 . . . . . . . . . 4 . . . . . . . . . 5 . . . . . . . . .6 . . . . . . . . . 7
Catfish tenders 1 . . . . . . . . . 2 . . . . . . . . . 3 . . . . . . . . . 4 . . . . . . . . . 5 . . . . . . . . .6 . . . . . . . . . 7
Catfish selects 1 . . . . . . . . . 2 . . . . . . . . . 3 . . . . . . . . . 4 . . . . . . . . . 5 . . . . . . . . .6 . . . . . . . . . 7
Catfish wedges 1 . . . . . . . . . 2 . . . . . . . . . 3 . . . . . . . . . 4 . . . . . . . . . 5 . . . . . . . . .6 . . . . . . . . . 7
Catfish strips 1 . . . . . . . . . 2 . . . . . . . . . 3 . . . . . . . . . 4 . . . . . . . . . 5 . . . . . . . . .6 . . . . . . . . . 7
Catfish fins 1 . . . . . . . . . 2 . . . . . . . . . 3 . . . . . . . . . 4 . . . . . . . . . 5 . . . . . . . . .6 . . . . . . . . . 7
Catfish poppers 1 . . . . . . . . . 2 . . . . . . . . . 3 . . . . . . . . . 4 . . . . . . . . . 5 . . . . . . . . .6 . . . . . . . . . 7
Catfish nibblers 1 . . . . . . . . . 2 . . . . . . . . . 3 . . . . . . . . . 4 . . . . . . . . . 5 . . . . . . . . .6 . . . . . . . . . 7
Catfish planks 1 . . . . . . . . . 2 . . . . . . . . . 3 . . . . . . . . . 4 . . . . . . . . . 5 . . . . . . . . .6 . . . . . . . . . 7
Catfish wings 1 . . . . . . . . . 2 . . . . . . . . . 3 . . . . . . . . . 4 . . . . . . . . . 5 . . . . . . . . .6 . . . . . . . . . 7

31
APPENDIX C
PANEL
Cooking Method: Deep Fry
Product of: USA
Price/lb (frozen): $4.59

32
APPENDIX D
RATING RESULTS FOR ALTERNATIVE NAMES
Name Nibblers Poppers Tenders Selects Wings Strips Wedges Planks Fins Nuggets
Count 538 538 538 538 538 538 538 538 538 538
Rating
Frequnecy 1 135 126 56 112 303 74 214 276 367 32
2 84 73 32 60 92 45 97 78 77 18
3 69 61 37 50 38 36 78 55 23 35
4 77 71 65 80 43 81 50 38 22 55
5 66 82 85 68 21 80 36 31 14 69
6 44 65 119 74 21 99 23 24 12 102
7 63 60 144 94 20 123 40 36 23 227
Average Rating 3.42 3.61 4.87 3.96 2.10 4.53 2.65 2.39 1.80 5.43
Please rate each of the following names from 1 (least appealing) to 7 (most appealing).

33
APPENDIX E
CHART OF RESPONDENTS‟ FIRST FOR NAMES
Percentage of Respondents' First Choice For Alternative Names for
Catfish Nuggets
0
10
20
30
40
50
60
70
Nuggets Tenders Strips Selects Poppers Nibblers Planks Wedges Wings Fins
Alternative Names
Pe
rce
nta
ge o
f R
esp
on
de
nts