AFWAL-TR-88-4262
COMPRESSIVE PROPERTIES OF HIGH PERFORMANCE L
POLYMERIC FIBERS
Scott A. Fawaz, 2?4' Lt, USAFAir Force Institute of TechnologyWright-Patterson Air Force Base, OH 45433
Anthony N. PalazottoAir Force Institute of TechnologyWright-Patterson Air Force Base, OH 45433
Chyi-Shan WangUniversity of Dayton Research InstituteDayton, OH 45469
March 1989
Interim Report for the Period April 1988 - December 1988
Approved for Public Release; Distribution Unlimited
MATERIALS LABORATORYAIR FORCE WRIGHT AERONAUTICAL LABORATORIESAIR FORCE SYSTEMS COMMANDWRIGHT-PATTERSON AIR FORCE BASE, OHIO 45433-6533
BEST AVAILABLE COPYaC)o *AA o
NOTICE
WHEN GOVERNMENT DRAWINGS, SPECIFICATIONS, OR OTHER DATA ARE USED FOR ANYPURPOSE OTHER THAN IN CONNECTION WITH A DEFINITELY GOVERNMENT-RELATEDPROCUREMENT, THE UNITED STATES GOVERNMENT INCURS NO RESPONSIBILITY OR ANYOBLIGATION WHATSOEVER. THE FACT THAT THE GOVERNMENT MAY HAVE FORMULATED OR INANY WAY SUPPLIED THE SAID DRAWINGS, SPECIFICATIONS, OR OTHER DATA, IS NOT TOBE REGARDED BY IMPLICATION, OR OTHERWISE IN ANY MANNER CONSTRUED, AS LICENSINGTHE HOLDER, OR ANY OTHER PERSON OR CORPORATION; OR AS CONVEYING ANY RIGHTS ORPERMISSION TO MANUFACTURE, USE, OR SELL ANY PATENTED INVENTION THAT MAY IN ANYWAY BE RELATED THERETO.
THIS TECHNICAL REPORT HAS BEEN REVIEWED AND IS APPROVED FOR PUBLICATION.
WALTER WADE ADAMS R. C. EVERS, Acting ChiefProject Scientist Polymer BranchNonmetallic Materials Division Nonmetallic Materials Division
FOR THE COMMANDER
MERRILL L. MINGES, DirectorNonmetallic Materials Division
IF YOUR ADDRESS HAS CHANGED, IF YOU WISH TO BE REMOVED FROM OUR MAILINGLIST, OR IF THE ADDRESSEE IS NO LONGER EMPLOYED BY YOUR ORGANIZATION PLEASENOTIFY WRDG /1,LBP WRIGHT-PATTERSON AFB, OH 45433-6533 TO HELP MAINTAINA CURRENT MAILING LIST.
COPIES OF THIS REPORT SHOULD NOT BE RETURNED UNLESS RETURN IS REQUIRED BYSECURITY CONSIDERATIONS, CONTRACTUAL OBLIGATIONS, OR NOTICE ON A SPECIFICDOCUMENT.
UNCLASSIFIEDSECURITY CLASSIFICATION OF THIS PAGE
Form ApprovedREPORT DOCUMENTATION PAGE OMB No. 0704-0188
la. REPORT SECURITY CLASSIFICATION lb. RESTRICTIVE MARKINGS
UNCLASSIFIED2a. SECURITY CLASSIFICATION AUTHORITY 3. DISTRIBUTION /AVAILABILITY OF REPORT
Approved for public release;2b. DECLASSIFICATION/DOWNGRADING SCHEDULE distribution unlimited"4. PERFORMING ORGANIZATION REPORT NUMBER(S) 5. MONITORING ORGANIZATION REPORT NUMBER(S)
AFWAL-TR-88- 4262
6a. NAME OF PERFORMING ORGANIZATION 6b. OFFICE SYMBOL 7a. NAME OF MONITORING ORGANIZATION(If applicable) Wright Research and Development Center
School of Engineering AFIT/EN WRDC/1LBP6c. ADDRESS (City, State, and ZIP Code) 7b. ADDRESS(City, State, and ZIP Code)
Air Force Institute of Technology Wright-Patterson AFB, OH 45433-6533Wright Patterson AFB, OH 45433
8a. NAME OF FUNDING/SPONSORING 8b. OFFICE SYMBOL 9. PROCUREMENT INSTRUMENT IDENTIFICATION NUMBERORGANIZATION (If applicable)
Materials Laboratory MLBP C F33615-87-C-52418c. ADDRESS (City, State, and ZIP Code) 10. SOURCE OF FUNDING NUMBERS.Wright Research and Development Center PROGRAM PROJECT TASK WORK UNITWright Patterson AFB, Ohio 45433 ELEMENT NO. NO. NO. ACCESSION NO.
6110 2F 2303 Q3 I 0711. TITLE (Include Security Classification)
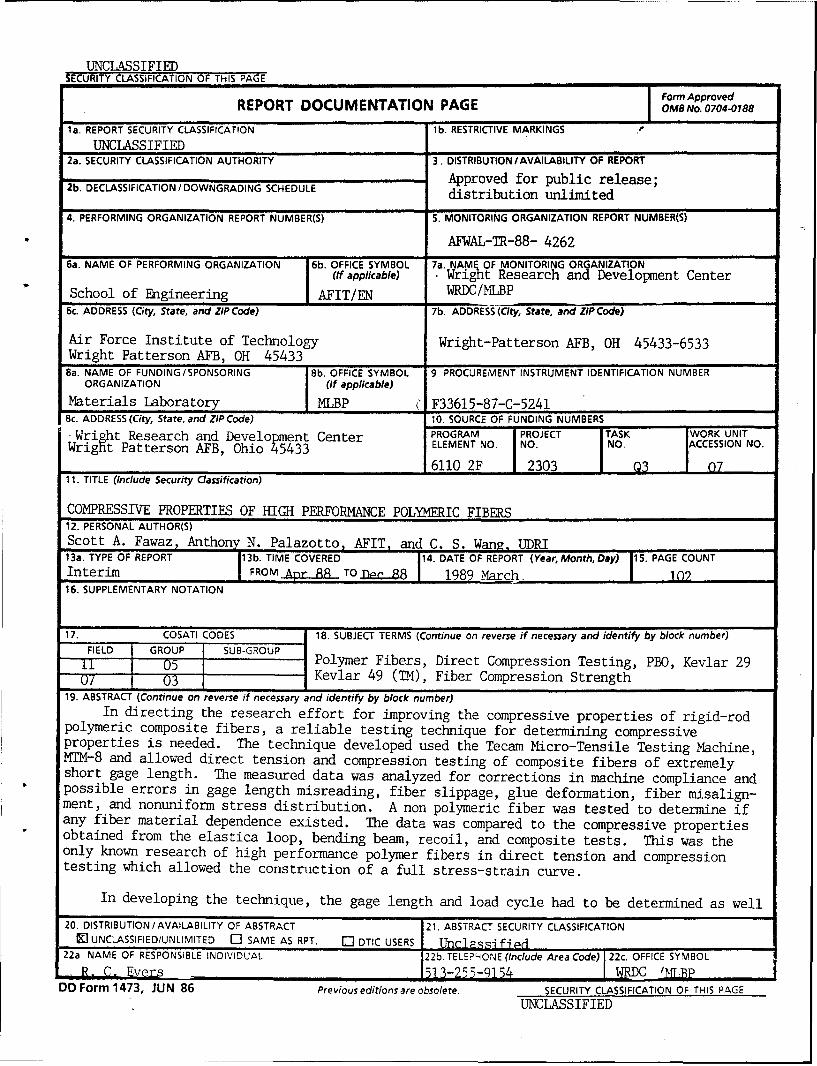
COMPRESSIVE PROPERTIES OF HIGH PERFORMANCE POLYMERIC FIBERS12. PERSONAL AUTHOR(S)Scott A. Fawaz, Anthon N. Palazotto, AFIT. and C. S. Wang, UDRI13a. TYPE OF REPORT 13b. TIME COVERED 14. DATE OF REPORT (Year, Month, Day) 15. PAGE COUNTInterim I FROM Ap fL TO Dec- 1989 March. 10216. SUPPLEMENTARY NOTATION
17. COSATI CODES 18. SUBJECT TERMS (Continue on reverse if necessary and identify by block number)FIELD GROUP SUB-GROUP
ii 05 Polymer Fibers, Direct Compression Testing, PBO, Kevlar 29" 0/ 03 Kevlar 49 (TM), Fiber Compression Strength
19. ABSTRACT (Continue on reverse if necessary and identify by block number)In directing the research effort for improving the compressive properties of rigid-rod
polymeric composite fibers, a reliable testing technique for determining compressiveproperties is needed. The technique developed used the Tecam Micro-Tensile Testing Machine,MTM-8 and allowed direct tension and compression testing of composite fibers of extremelyshort gage length. The measured data was analyzed for corrections in machine compliance andpossible errors in gage length misreading, fiber slippage, glue deformation, fiber misalign-ment, and nonuniform stress distribution. A non polymeric fiber was tested to determine ifany fiber material dependence existed. The data was compared to the compressive propertiesobtained from the elastica loop, bending beam, recoil, and composite tests. This was theonly known research of high performance polymer fibers in direct tension and compressiontesting which allowed the construction of a full stress-strain curve.
In developing the technique, the gage length and load cycle had to be determined as well
20. DISTRIBUTION/AVAILABILITY OF ABSTRACT 21. ABSTRACT SECURITY CLASSIFICATION[] UNCLASSIFIED/UNLIMITED 0 SAME AS RPT. C DTIC USERS Uncjasqjfi •d
22a. NAME OF RESPONSIBLE INDIVIDUAL 22b. TELEPHONE (Include Area Code) 22c. OFFICE SYMBOL
.R.. Ees - WRDC ITDD Form 1473, JUN 86 Previous editions are obsolete. SECURITY CLASSIFICATION OF THIS PAGE
UNCLASSIFIED
19. as mounting the fiber without damage. The gage length used had to limit the possibilitiesof Euler Buckling and nonuniform stress distribution across the cross-sectioR of the fiber.
The stress relationships covering both tension and compression were constructed for,'oly (p-phenylene benzobisoxazole), PBO, Kevlar 29 (TM), determined for the first threeIfibers, however, the compressive strength of the carbon fiber was out of the range of thenachine. The apparent tensile and compressive moduli were gate length dependent, as the,age length decreased; the moduli decreased. The corrected tensile and compressive moduli;ere obtained from machine compliance curves.
FOREWARD
This report was sponsored by the Polymer Branch, Nonmetallic Materials Division.
The work was initiated as partial fulfillment of a Master of Science degree by
2'P Lt Scott A. Fawaz through the Air Force Institute of Technology. The co-authors were:
Anthony N. Palazotto, Air Force Institute of Technology; and Chyi-Shan Wang, University
of Dayton Research Institute.
This report covers research conducted from April 1988 to November 1988.
The authors express their appreciation to Kenneth Lindsey, of UDRI, whose
extensive knowledge of the micro-tensile testing machine made the study possible. Also,
the continual support of Bill Click, Jacque Henes, and Lisa Denny for laboratory and
computer resource support.
11i
TABLE OF CONTENTS
SECTION PAGE
I. Introduction 1
II. Background 3
A. Elastica Loop Test 3
B. Bending Beam Test 3
C. Recoil Test 6
D. Composite Test 6
E. Direct Compression 7
1. Euler Buckling Analysis 7
2. Stress Distribution Effects 9
III. Experimental 10
A. Fibers Tested 10
B. Equipment 10
C. Euler Buckling Limits 12
D. Stress Distribution Limits 14
E. Test Procedure 14
1. Machine Configuration 15
IV. Results 18
A. Poly(p-phenylene benzobisoxazole), PBO 18
B. Kevlar 29TM 43
C. Kevlar 49Th 54D. Carbon 64
V
SECTION PAGE
V. Discussion 74
A. Error Possibilities 74
B. Comparison to Elastica Loop, Bending Beam, Recoil,
Composite Tests 78
VI. Conclusions 80
VII. Future Work 83
References 84
Appendix A: Test Apparatus and Procedure 86
Appendix B: PBO Morphology 91
vi
LIST OF ILLUSTRATIONS
FIGURE PAGE
1 Elastica Loop Test 4
2 Bending Beam Test 5
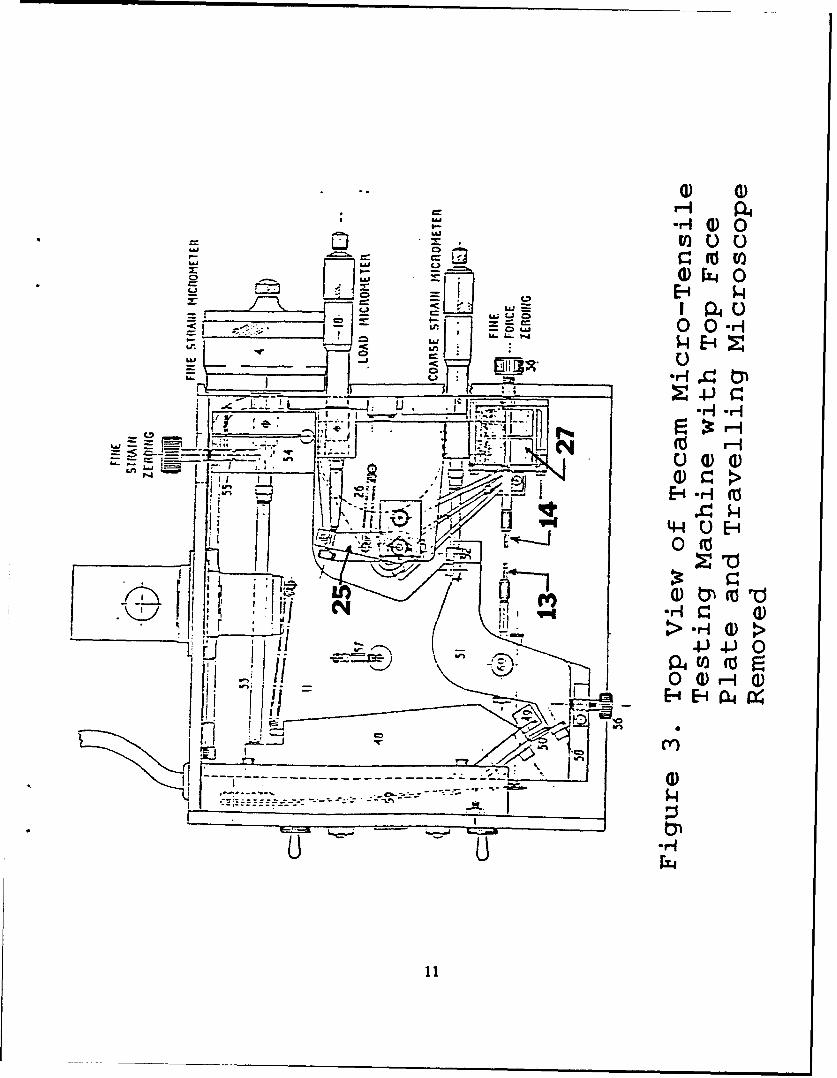
3 Top View of Tecarn Micro-Tensile Testing Machine 11
4 PBO 8A Tension Tests 19
5 PBO 8A Tension Tests 20
6 Machine Compliance Curve for PBO 8A: Tension Tests 23
7 PBO 8A Tension Tests 25
8 Variation of Average Apparent Tensile Modulus
with Aspect Ratio for PBO 8A 26
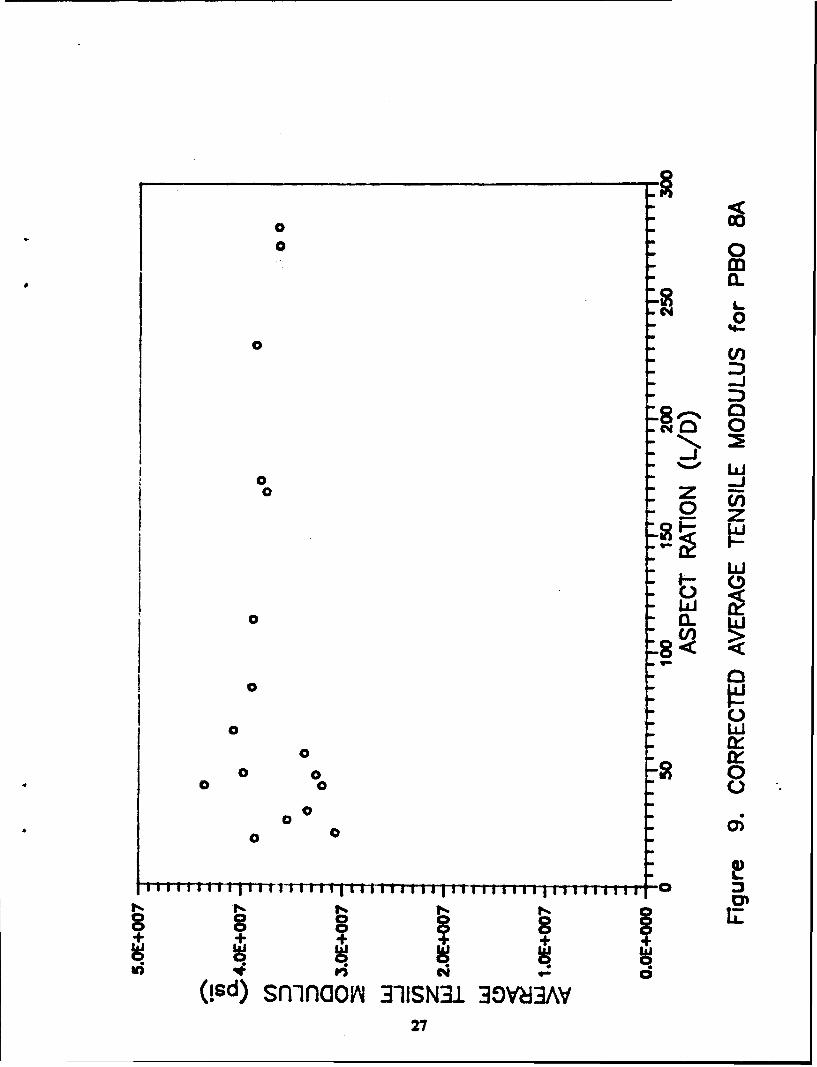
9 Corrected Average Tensile Modulus for PBO 8A 27
10 Spring System Model 29
11 PBO 8A Tension/Compression Test 32
12 Effects of Euler Buckling and Stress Distribution on Compressive
Properties for PBO 8A 33
13 Compression Tests PBO 8A 35
14 Variation of Modulus of Elasticity with Aspect Ratio for PBO 8A 36
15 Machine Compliance Curve for PBO 8A: Compression Tests 37
16 Misreading the Gage Length Diagram 39
17 Kevlar 29T Tension Tests 44
18 Kevlar 29T" Tension/Compression Tests 45
19 Variation of Average Apparent Tensile Modulus with
Aspect Ratio for Kevlar 29"' 46
20 Machine Compliance Curve for Kevlar 29"' Tension Tests 47
21 Corrected Average Tensile Modulus for Kevlar 29T' 49
vii
LIST OF ILLUSTRATIONS (CONTINUED)
SECTION PAGE
22 Machine Compliance Curve for Kevlar 29T' Compression Tests 51
23 Variation of Modulus of Elasticity with Aspect Ratio for Kevlar 29' 53
24 Kevlar 49T" Tension Tests 55
25 Kevlar 49T' Tension/Compression Tests 56
26 Variation of Average Apparent Tensile Modulus with
Aspect Ratio for Kevlar 49' 57
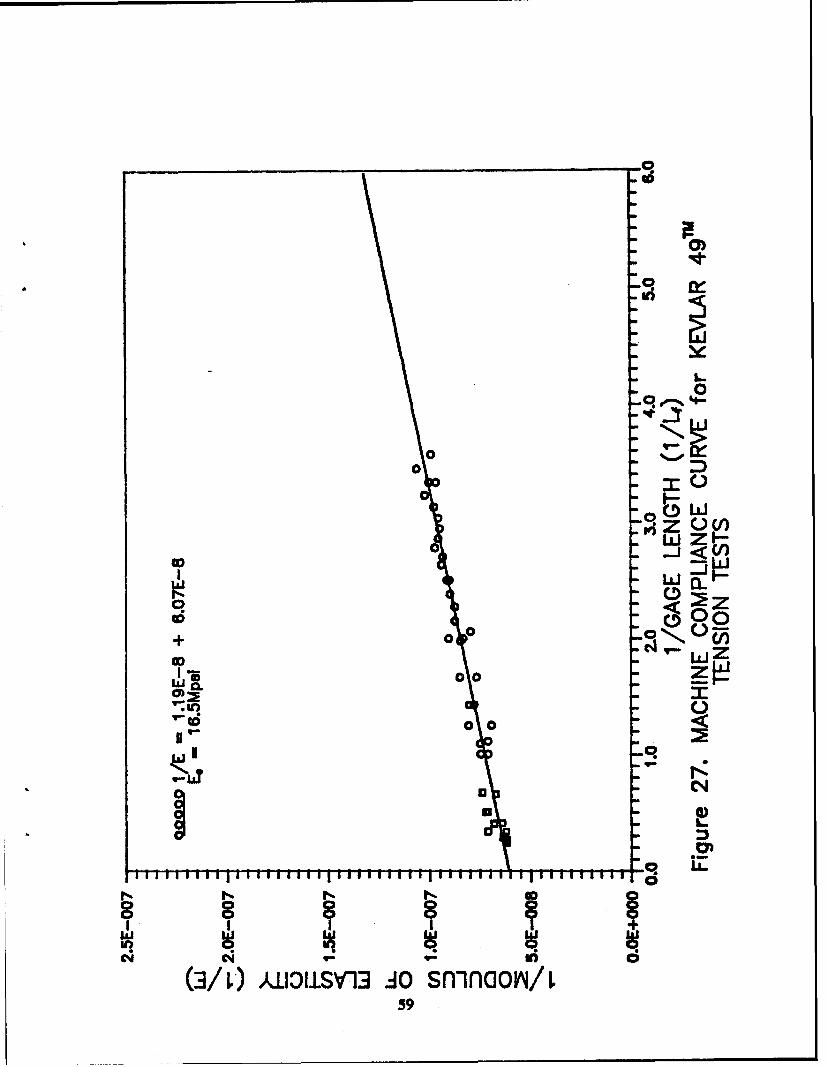
27 Machine Compliance Curve for Kevlar 49" Tension Tests 59
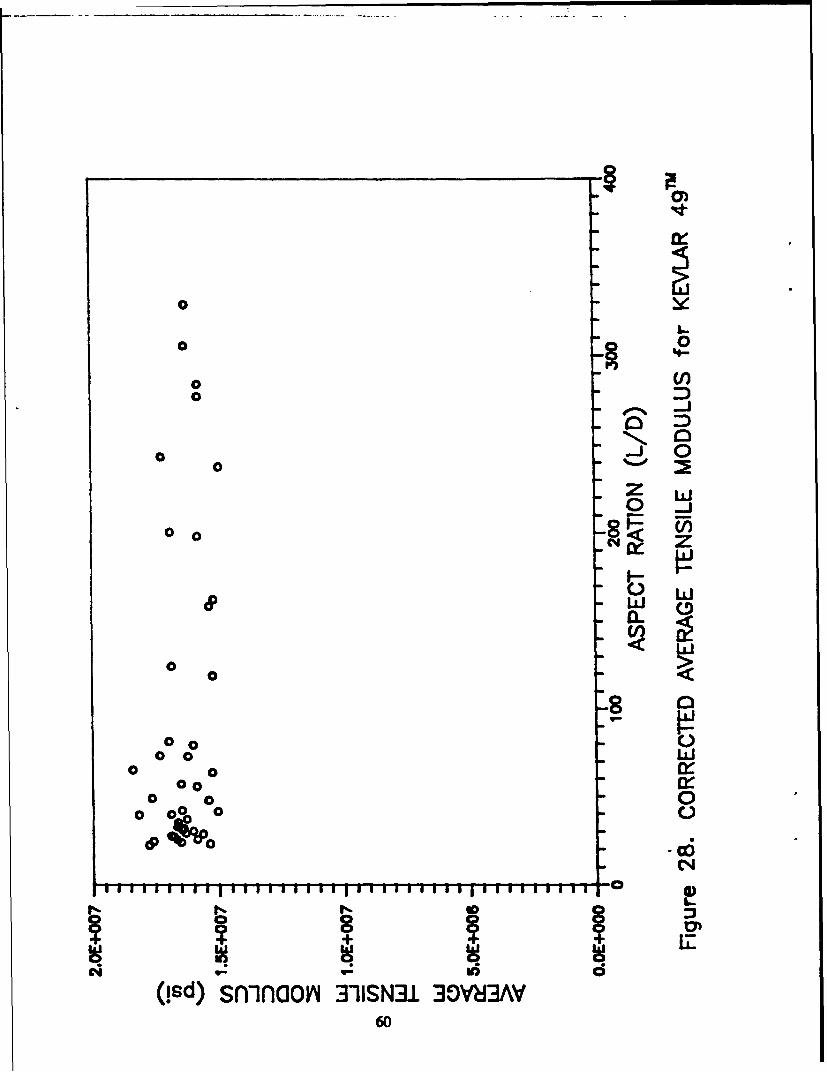
28 Corrected Average Tensile Modulus for Kevlar 497" 60
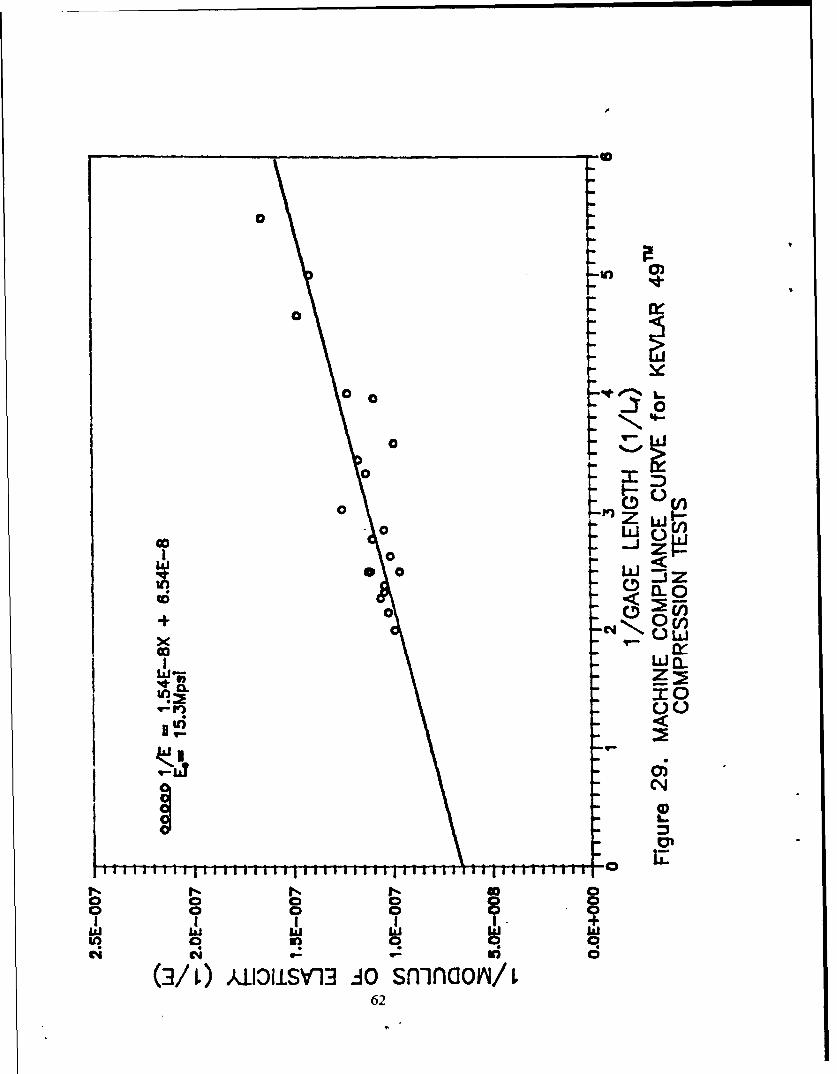
29 Machine Compliance Curve for Kevlar 49" Compression Tests 62
30 Carbon Tension Tests 65
31 Carbon Tension/Compression Tests 66
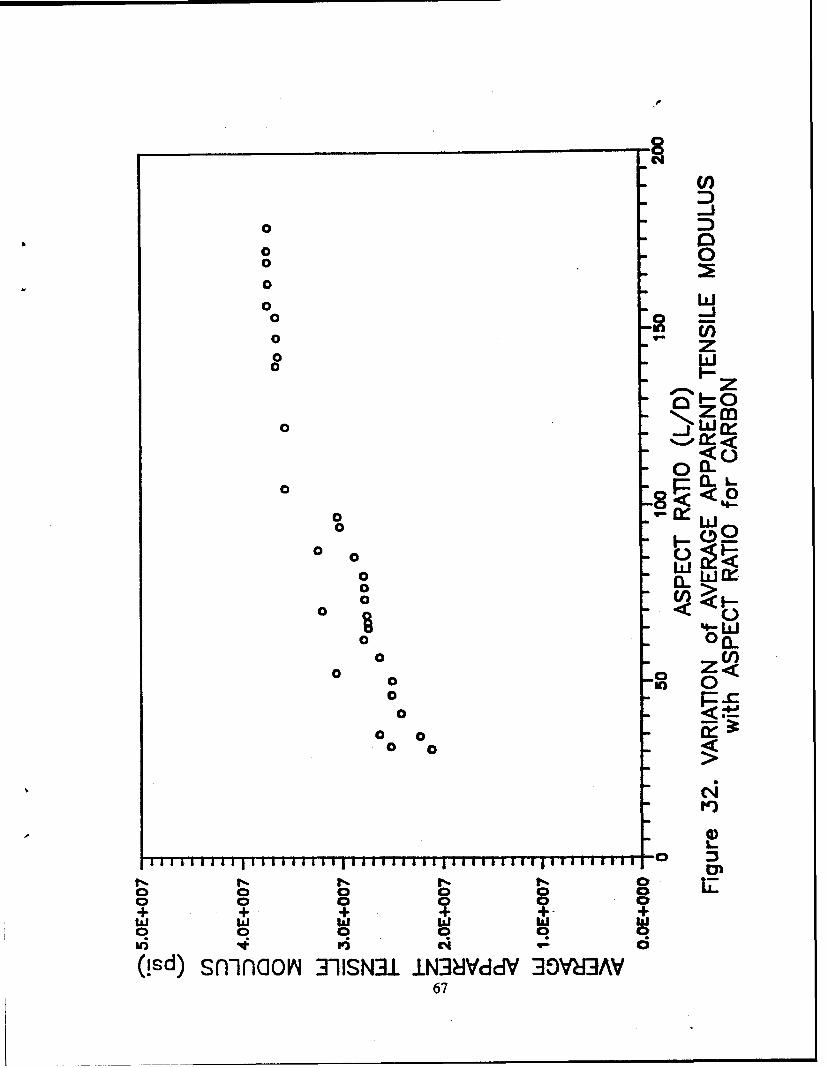
32 Variation of Average Apparent Tensile Modulus with
Aspect Ratio for Carbon 67
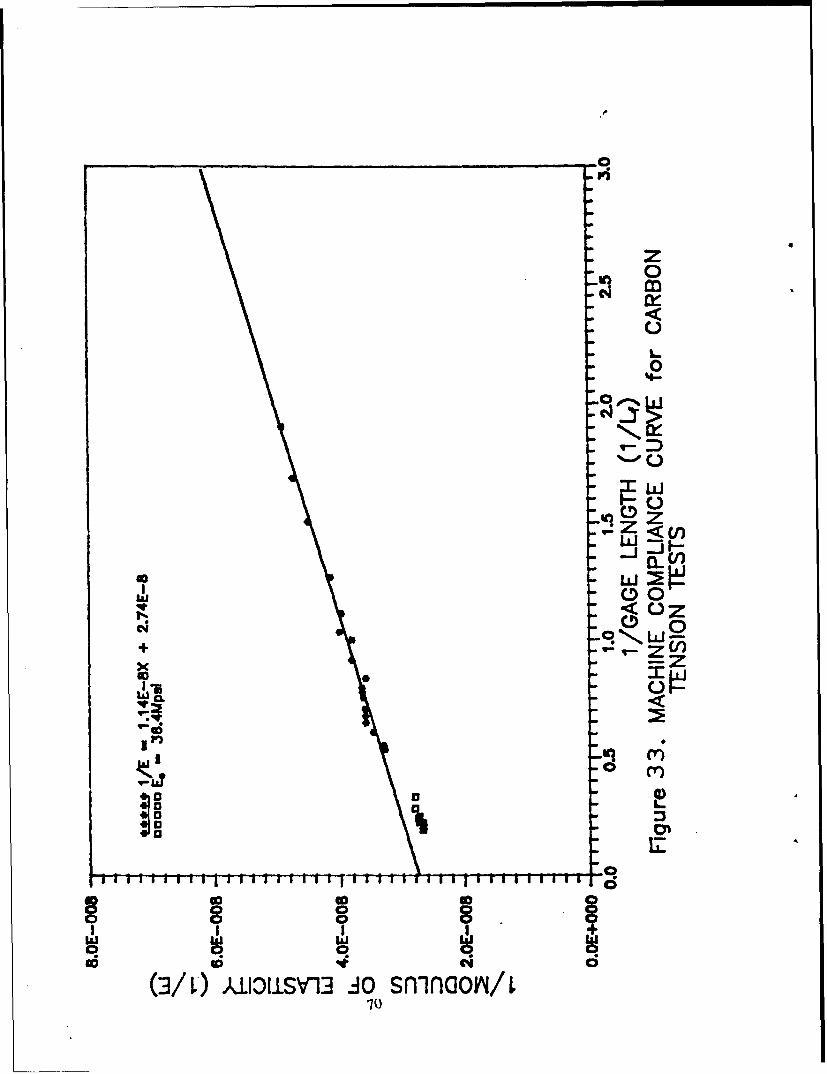
33 Machine Compliance Curve for Carbon Tension Tests 70
34 Corrected Average Tensile Modulus for Carbon 71
35 Machine Compliance Curve for Carbon Compression Tests 72
36 Fiber Microstructure 75
37 Picture of Tecam Micro-Tensile Machine 87
38 Picture of Fiber Anvils 88
39 Fiber Processing Diagram 92
VIii
LIST OF TABLES
TABLE PAGE
I. Minimum Gage Length to Avoid Euler Buckling 13
II. Gage Length Operating Range 14
III. Number of Tension and Compression Test 17
IV. Tensile Modulus Variation with Gage Length for PBO 8A 21
V. Compressive Modulus Variation with Gage Length for PBO 8A 38
VI. Tensile Modulus Variation with Gage Length for Kevlar 29TM 48
VII. Compressive Modulus Variation with Gage Length for Kevlar 29TM 52
VIII. Tensile Modulus Variation with Gage Length for Kevlar 49TM 58
IX. Compressive Modulus Variation with Gage Length for Kevlar 49" 63
X. Tensile Modulus Variation with Gage Length for Carbon 68
XI. Variation of Compressive Modulus with Gage Length for Carbon 73
XII. Comparison of Compressive Properties from Various Techniques 79
ix
SECTION I
INTRODUCTION
Rigid rod aromatic heterocyclic polymers have shown superior thermal and
thermal/oxidative stability compared to current metal systems (1: 135;20). They can be
processed into fibers with nearly perfect uniaxial orientation resulting in excellent tensile
properties compared to the state-of-the-art. These fibers are titled high performance fibers
because their axial tensile properties are an order of magnitude larger than common textile
fibers (15:1). Due to their excellent tensile properties, these fibers are promising
candidates for structural applications when used in composites. Their relatively low density
elicits potential applications in ultra-light weight structures such as a space station. This
new class of electrically nonconductive fibers will have the greatest impact on military
weapon systems such as the cruise missile and stealth aircraft. Presently, carbon fibers are
the most widely used, but as the tensile properties of the rigid rod polymers approach those
of the carbon based fibers; the above mentioned benefits will promote widespread use of
the rigid rod polymeric fibers. Carbon fibers, which are 99% or more carbon, are not
polymeric fibers even though they are synthesized from a polymeric precursor. The
polymeric fibers have one significant deficiency; their compressive properties are an order
of magnitude lower than required for operational use.
An extensive research effort has been directed toward improving fiber compressive
strength (1;10;12;20;21). To precisely characterize the fiber compressive properties and
provide direction for the research effort, a reliable testing technique must be developed.
Manufacturing fiber embedded composites from the experimental fibers provides the most
reliable data. However, in many cases sufficient quantities of the experimental fiber aren't
available to manufacture enough test specimens to completely characterize the composite.
Many attempts have been made to test a single fiber; such as the loop, bending beam, and
recoil tests. Unfortunately none of the above three tests yield results consistent with the
1
composite data (see Background).
The inability of the loop, bending beam, and recoil tests to adequately determine
the compressive strength and modulus have motivated the search for a more reliable testing
technique. In this study, the fiber axial compressive properties are determined by directly
compressing a single fiber. The Tecam Micro-Tensile Testing Machine was originally
designed to test specimens in tension; however, with a slight modification, the ability to
measure compressive strength, percent strain, and modulus from direct compression seemed
promising. Results were compared with those from the other three test methods mentioned.
2
SECTION II
BACKGROUND
A. Elastica Loop Test
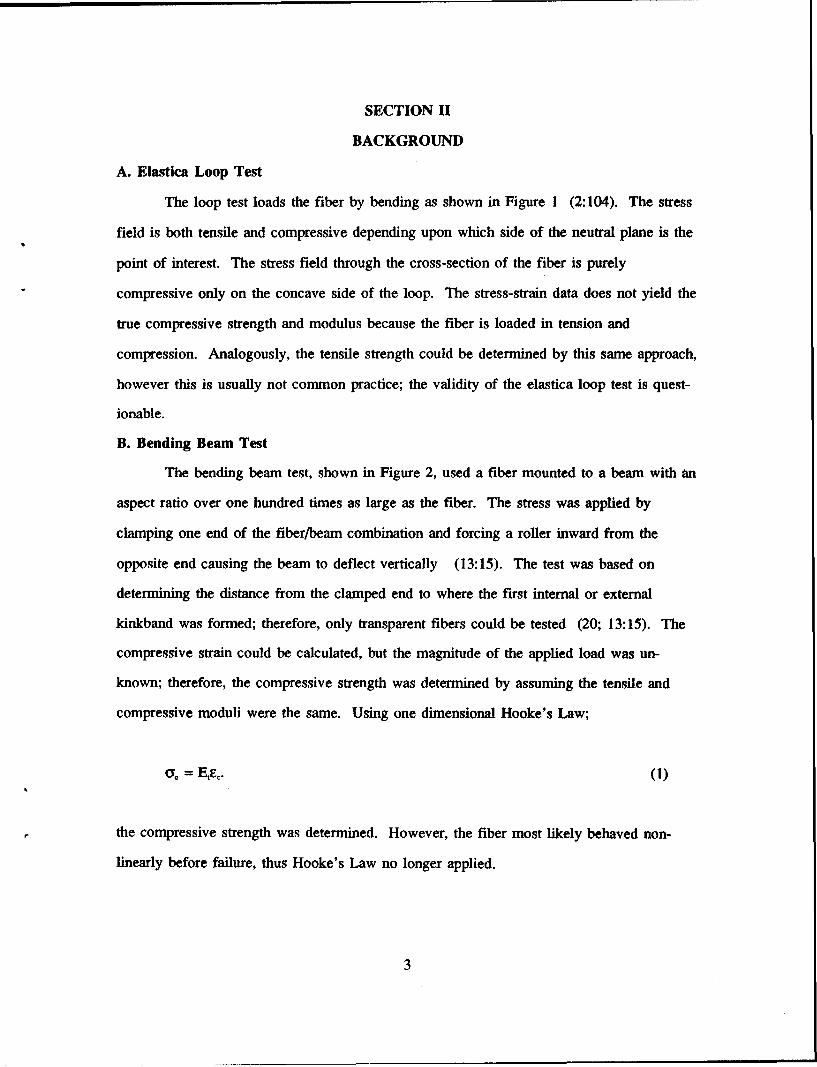
The loop test loads the fiber by bending as shown in Figure 1 (2:104). The stress
field is both tensile and compressive depending upon which side of the neutral plane is the
point of interest. The stress field through the cross-section of the fiber is purely
compressive only on the concave side of the loop. The stress-strain data does not yield the
true compressive strength and modulus because the fiber is loaded in tension and
compression. Analogously, the tensile strength could be determined by this same approach,
however this is usually not common practice; the validity of the elastica loop test is quest-
ionable.
B. Bending Beam Test
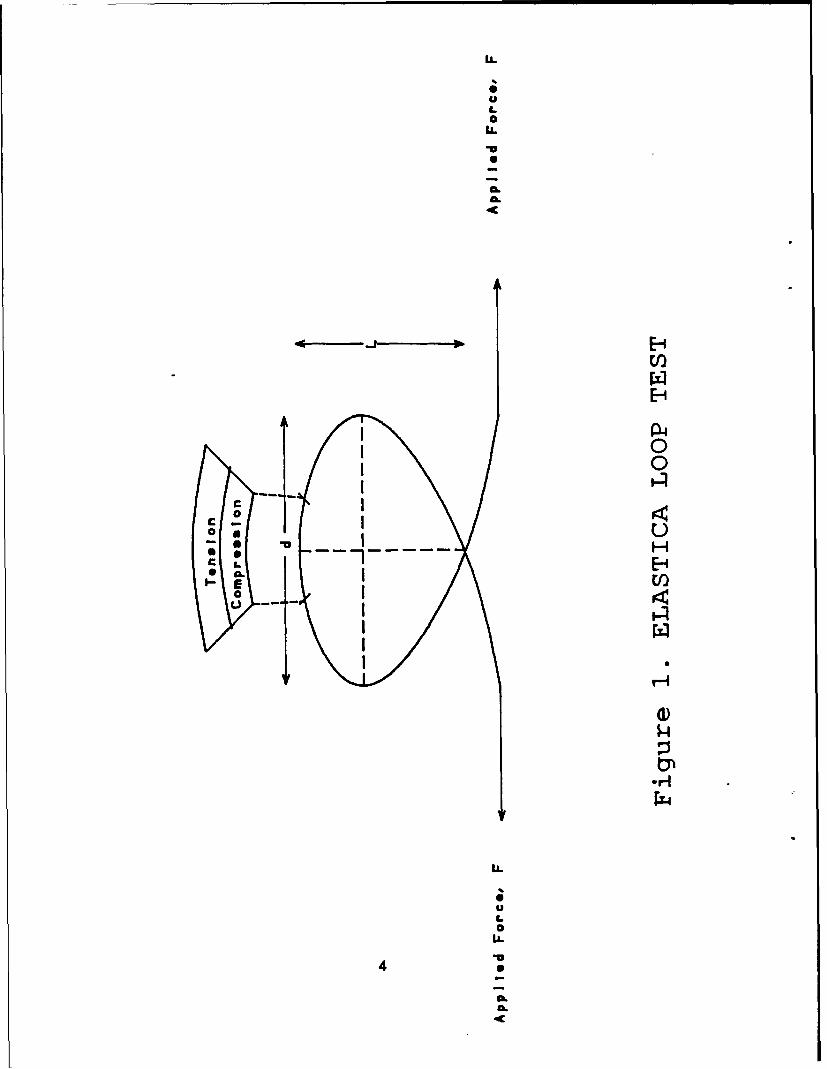
The bending beam test, shown in Figure 2, used a fiber mounted to a beam with an
aspect ratio over one hundred times as large as the fiber. The stress was applied by
clamping one end of the fiber/beam combination and forcing a roller inward from the
opposite end causing the beam to deflect vertically (13:15). The test was based on
determining the distance from the clamped end to where the first internal or external
kinkband was formed; therefore, only transparent fibers could be tested (20; 13:15). The
compressive strain could be calculated, but the magnitude of the applied load was un-
known; therefore, the compressive strength was determined by assuming the tensile and
compressive moduli were the same. Using one dimensional Hooke's Law;
o= E,e€. (1)
the compressive strength was determined. However, the fiber most likely behaved non-
linearly before failure, thus Hooke's Law no longer applied.
3
U.
LU
LL
00
LIL
LU)
00
CC
1 6
U'E-.
46X
CL-
202
C. Recoil Test
The recoil test dynamically loaded the fiber in compression; thus a linear stress-
strain behavior was forced (3:853). A monofilament fiber is loaded in tension to
apredetermined load then cut with an electric arc at the midpoint of the fiber. The fiber
recoils as the stress wave propagates from the cut to the sample holders. The fiber
continues to recoil until it reaches the clamped end. Because the clamped end forms a
rigid boundary, the kinetic energy of the fiber is transformed back into strain energy and
the compressive stress propagates back down the length of the fiber. The magnitude of the
stress wave in compression and tension are equal but opposite in direction; therefore,
compressive failure will occur first in a fiber whose compressive strength is lower than its
tensile. By selectively controlling the tensile failure stress, a threshold stress for
observation of recoil compressive damage could be determined; thus, a measure for fiber
compressive strength obtained (3:855). The stress-strain behavior was forced to be linear
due to the high stress wave velocity causing an extremely high strain rate. In addition, the
fiber was assumed to recoil longitudinally only forcing the stress wave to propagate
similarly. Since the recoil occurs so rapidly, the nature of the wave propagation can't be
determined. The fiber may recoil longitudinally, laterally, or some combination of both;
therefore, the derivations used to determine the compressive strength must account for this
lateral motion which they do not. The compressive strength could be determined, but the
compressive modulus could not since the material strain was unknown.
D. Composite Test
The composite tests provide the most accurate data since the fibers experience stress
and strain as they would in the operational environment. However, many experimental
fibers are not processed in sufficient quantities to manufacture enough composite coupons
to thoroughly characterize the fiber.
6
E. Direct Compression Testing
Using the MTM-8, the fiber was tested in direct compression eliminating the
problems inherent in the above three tests. The main advantage of direct compression
testing was the entire stress-strain curve was obtained from zero load to fracture.
Specifically, fiber behavior during the linear and non-linear regions was illustrated; thus, the
compressive modulus and fracture point were determined. The technique was based on
loading a one-dimensional bar with a clamped/simple support boundary condition. The
only assumption made was one-dimensional Hooke's Law applied. The possibility of a
three dimensional stress field due to the anisotropy of the fiber is discussed later. The
fibers are highly anisotropic, but exhibit linear behavior in the elastic region of the stress-
strain curve in tension tests; therefore, were expected to behave similarly in compression.
The compressive modulus and strength are of prime concern since no testing has
been accomplished which reliably determined these two quantities. Failure of the specimen
is characterized by kinkband formation in the fiber. Kinkbands are produced when the
fiber experiences compressive stress. The formation of kinkbands was not dependent on
the load condition, whether direct compression or combined loading, but formed as a result
of compressive deformation as seen by Allen and DeTeresa (2:853, 13:8).
1. Euler Buckling Analysis
On the macroscopic level, if the specimen was loaded in direct compression the
problem was much simpler since the only concern was to reduce the chance of Euler
Buckling and the effects of a non-uniform stress distribution (4:1-4). Euler Buckling was
derived for a linear elastic prismatic column which followed Hooke's Law. Polymeric
fibers are extremely anisotropic, but in studying the buckling phenomenon the effects of the
anisotropy were neglected in order to obtain a rough estimate of when Euler Buckling
might occur. Euler Buckling, assuming a linear elastic prismatic column, occurred when
the fiber became unstable due to an increase in its total potential energy. Increasing the
compressive load drove the fiber towards its bifurcation point, a point which marked the
7
intersection of two energy equilibrium paths. Prior to the bifurcation point, there was only
one equilibrium path, the primary path; after the bifurcation point there was a secondary
path, the adjacent or alternate equilibrium paths. The secondary path was simply a state
where the fiber was just as inclined to exist as the primary path. With the possibility of
being on either paths, the primary or adjacent, the instability of the fiber was created.
When the fiber became unstable, the displacements become non-linear and the stress-strain
curves showed this nonlinearity. Therefore, the avoidance of the instability, Euler
Buckling, was advantageous to restrict the complexity of the problem. The most accurate
method of determining the compressive strength was to load the fiber in direct
compression; thus, forcing one dimensional constitutive relations. The one dimensionality
of the problem was desired to reduce the complexity of the constitutive relations; the
difference was having one stress resultant to characterize as opposed to three. At present,
no method is available to deal with the out of plane stress components of the three dimen-
sional problem using the current test equipment. The formation of kinkbands didn't depend
on the type of loading; however, if a combined loading technique were used, the
complexity increases manyfold due to the three dimensionality, and was avoided. As a
general rule, Euler Buckling could be avoided if an aspect ratio of 10 or less was
maintained since the critical buckling load, the load at which the instability was reached,
was a function of the geometry of the fiber by the follow equation (6:22);
P,, = 4n EI/L (2)
where
E = Tensile Modulus of ElasticityI = Area Moment of Inertia for a Linear MaterialL = Fiber Gage Length
8
This is the general Euler Buckling equation for an isotropic material with a clamped simply
supported boundary condition. If Euler Buckling occurred, kinkbands were created at the
buckling point; however, the source of creation whether buckling or direct compression was
difficult to discern. Kinkbands caused by buckling were of no concern here since the
critical load that caused buckling was not necessarily the compressive strength of the fiber.
2. Stress Distribution Effects
The stress distribution across the cross-section of the fiber was effected by how the
fiber was mounted in the testing machine. St. Venant's Principle for isotropic, perfect
cylinders states that:
the strains that are produced in a body by the application toa small part of its surface of a system of forces staticallyequivalent to zero force and zero couple are of negligiblemagnitude at distances which are large compared with thelinear dimensions of the part. (4:495)
In practice, an aspect ratio larger than ten yielded negligible end effects. However for an
anisotropic material this was not the case. However, based on Horgan's results for tensile
loading of anisotropic ultra high modulus polyethylene, he showed for anisotropic materials
the aspect ratio was determined by the following relationship:
1,/d = (EJG) (3)
where I = fiber gage length, d = fiber diameter, E, = tensile modulus, G = shear modulus
(4:496,497; 14).
The Euler Buckling gage lengths were the upper bound; whereas, the gage lengths
from the stress distribution effects were the lower bound. In this study, Eq (2) and (3)
serve as guidelines for selecting the appropriate gage length.
9
SECTION III
EXPERIMENTAL
The MTM-8 is a completely mechanical and optical system; thus the errors
associated with electronic equipment were not present; i.e. electronic drift, noise, and
environmental interference. Displacements were read on the one hundred Angstrom level
having a possible error of 0.1% (19:1). A complete description of the MTM-8 is located
in Appendix A. The ability to load a fiber in direct compression did not depend on the
fiber geometric or material properties. Since the machine compliance was constant, fiber
independence was quantitatively proven by comparing the machine compliance of various
fibers? If the machine was fiber dependent, the machine compliance would have to be
determined for every fiber tested; definitely a labor intensive task that may be prohibitive if
a large quantity of fibers are tested.
A. Fibers Tested
Four fibers were thoroughly tested. Poly(p-phenylene benzobisoxazole), PBO,
fibers obtained from Dow Chemical Company were dry jet/wet spun and heat treated at
600'C (21). Two other fibers were Kevlar 2 9'T and Kevlar 49' which were commercial
fibers from E. I. duPont de Nemours and Company, Incorporated. The fourth fiber tested
was an experimental vapor grown carbon fiber courtesy of Applied Sciences Federated.
B. Equipment
The MTM-8, top view shown in Figure 3, uses a series of micrometers, torsion
bars, and levers to load the fiber in either direct tension or compression. Load is applied
to the fiber by rotating the load micrometer, 18, which applied a moment to the torque rod
system, 26, via a lever, 25. Rotation of the torque rod caused the right anvil, 13, to
translate either inward or outward for direct compression or tension, respectively. When
looking through the telescope, movement of the right anvil moved the left mirror, 27,
forcing the mirror reflections to split. The image splitting is used to measure displacement,
10
69-- -i(1) 00C:)
-44 0r
00a.~._ _ _ _ _ _
0__ _0
_ _ _7 t~-~
~l,oft
a) z
U! *~-=~~ -'44 ] Jfl <il -~ U)(a
i~r a)l=> a) - --
4~ 4P 0
0 a)
1NO
realigning the images via the displacement micrometer, 4, yielded fiber displacement in
hundreds Angstroms. The MTM-8 allowed both the load and displacement to be recorded
during testing. Details of machine operation can also be found in Appendix A. The fiber
was glued to the left then the right anvil, sample holder, using 1,5 diphenylcarbohydrazide,
a thermoplastic polymer. In the current application, the behavior of the thermoplastic was
not changed by melting it in its powdered form then letting it solidify, which was necessary
when mounting the fiber (5:455). However, since the fiber was glued to the anvils, the
possibility of fiber slippage and glue deformation must also be investigated. If the fiber
was not aligned properly the glue could be remelted and fiber realigned since the left anvil
had three-dimensional transnational freedom. When mounting the fiber the alignment was
very critical, as the repositioning iterations increased the accuracy of the results decreases.
Due to the frailty of the fiber, the fiber could be easily damaged during repositioning. The
details of mounting the fiber in the MTM-8 are included in Appendix A.
C. Euler Buckling Limits
Euler Buckling during a test would signal the test was a failure, and none of the
data could be used because the stress-strain curve would be nonlinear in the region which
was usually expected to be linear. The nonlinearity would occur due to the large
displacements present when the potential energy of the fiber moved from the primary to
secondary equilibrium paths. If buckling did occur much was learned about how the fiber
was mounted. If the fiber ends mounted in the anvils were parallel, which was checked
with the traveling microscope, the buckling must have been caused by a misalignment of
the anvils themselves, either laterally or vertically. If a lateral misalignment exists, a
moment was produced due to the eccentricity of the load in relation to the longitudinal axes
of the fiber. If a vertical misalignment was present, a transverse shear force was created.
Having the moment or transverse shear force present resulted in a combined loading
condition and a three dimensional problem. Furthermore, the combined loading drove the
critical buckling load down forcing the fiber to fail prematurely.
12
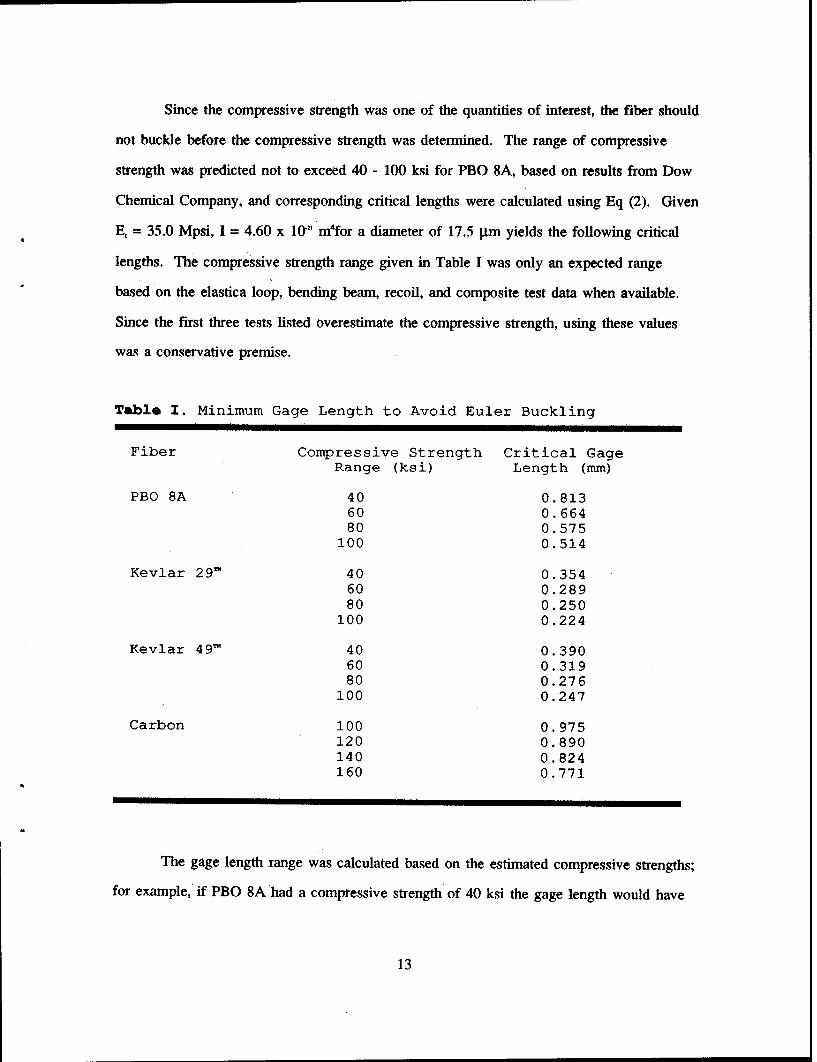
Since the compressive strength was one of the quantities of interest, the fiber should
not buckle before the compressive strength was determined. The range of compressive
strength was predicted not to exceed 40 - 100 ksi for PBO 8A, based on results from Dow
Chemical Company, and corresponding critical lengths were calculated using Eq (2). Given
E, = 35.0 Mpsi, I = 4.60 x 1102 m4for a diameter of 17.5 gim yields the following critical
lengths. The compressive strength range given in Table I was only an expected range
based on the elastica loop, bending beam, recoil, and composite test data when available.
Since the first three tests listed overestimate the compressive strength, using these values
was a conservative premise.
Table I. Minimum Gage Length to Avoid Euler Buckling
Fiber Compressive Strength Critical GageRange (ksi) Length (mm)
PBO 8A 40 0.81360 0.66480 0.575
100 0.514
Kevlar 29' 40 0.35460 0.28980 0.250
100 0.224
Kevlar 49T' 40 0.39060 0.31980 0.276
100 0.247
Carbon 100 0.975120 0.890140 0.824160 0.771
The gage length range was calculated based on the estimated compressive strengths;
for example, if PBO 8A had a compressive strength of 40 ksi the gage length would have
13
to be less than 0.813 mm in order to load the fiber to failure without causing Euler
Buckling.
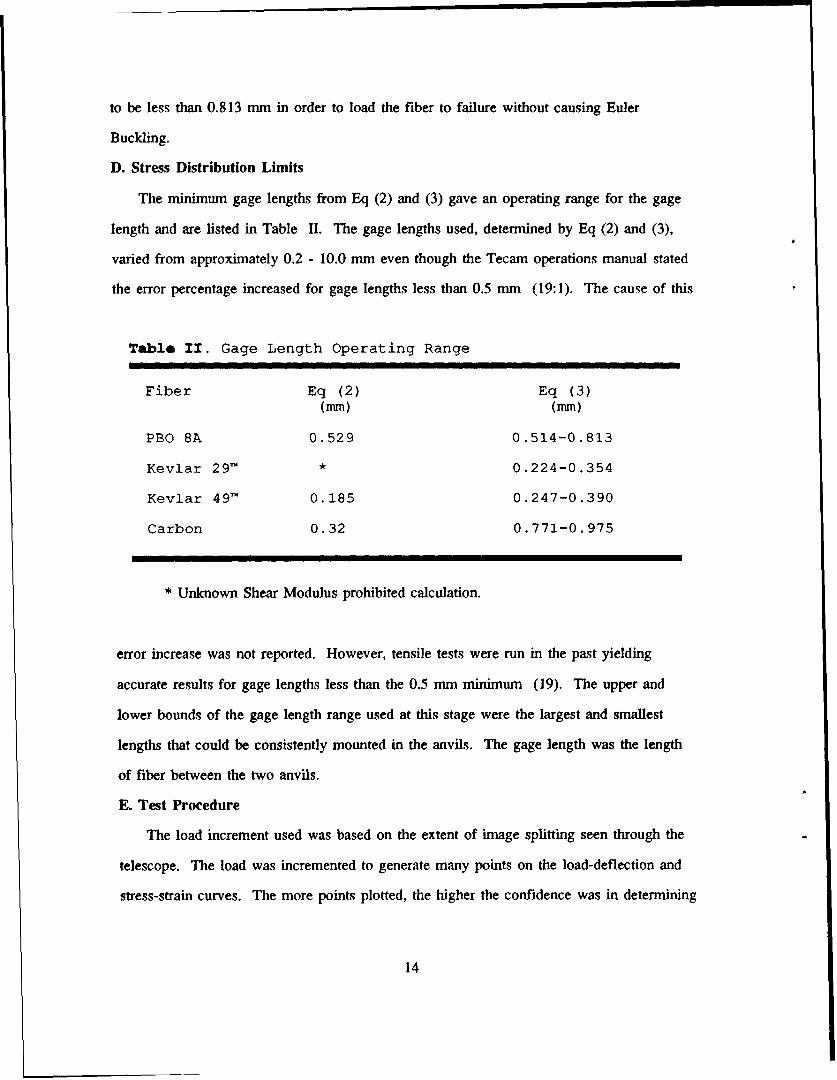
D. Stress Distribution Limits
The minimum gage lengths from Eq (2) and (3) gave an operating range for the gage
length and are listed in Table II. The gage lengths used, determined by Eq (2) and (3),
varied from approximately 0.2 - 10.0 mm even though the Tecam operations manual stated
the error percentage increased for gage lengths less than 0.5 mm (19:1). The cause of this
Table II. Gage Length Operating Range
Fiber Eq (2) Eq (3)
(mm) (mm)
PBO 8A 0.529 0.514-0.813
Kevlar 29T' * 0.224-0.354
Kevlar 49Th 0.185 0.247-0.390
Carbon 0.32 0.771-0.975
* Unknown Shear Modulus prohibited calculation.
error increase was not reported. However, tensile tests were run in the past yielding
accurate results for gage lengths less than the 0.5 mm minimum (19). The upper and
lower bounds of the gage length range used at this stage were the largest and smallest
lengths that could be consistently mounted in the anvils. The gage length was the length
of fiber between the two anvils.
E. Test Procedure
The load increment used was based on the extent of image splitting seen through the
telescope. The load was incremented to generate many points on the load-deflection and
stress-strain curves. The more points plotted, the higher the confidence was in determining
14
the behavior of the fiber. The load was proportional to the displacement; therefore, larger
loads caused larger displacements resulting in a wider image split. The wider the split, the
easier the realignment of the images. If a small load increment was used, the split was
indistinguishably small, resulting in improperly realigning the images causing a misreading
of the displacement. The images are not very distinct, when viewed separately they
become even more blurred. When realigning the images, the image created by the right
mirror can be realigned on the left, center, or right side of the image created by the left
mirror. The difference between realigning at one of the three locations was
indistinguishable when viewing the images, but could create a difference in measured
displacements up to 200A. The error could be decreased to range from zero to twenty
angstroms by consistently realigning the images at one of the three positions for the entire
test, thus promoting repeatability. All of the tests in this study had image realignment at
the left position. If misalignment was present, it was not noticeable using the relatively
low power microscope and magnifying glass. With the diameters of the fibers ranging
from 12.0 - 35.3 gtm misalignment of the same order of magnitude as the diameters could
be present and go undetected. The load increment used varied from 0.01 - 1.Og depending
on the fiber being tested and adequate image splitting.
1. Machine Configuration
The first objective was to determining if the compressive modulus was the same as
the tensile. The configuration of the MTM-8 had to be changed to allow for testing in
both compression and tension. This was done by changing the zero of the load micrometer
from zero to seven; thus, from zero to seven grams was compressive and seven to fifteen
grams was tensile loading. As many as ten tests were completed, cycling the load to
obtain many values of the moduli for one fiber. As long as the onset of plastic
deformation was not reached, one fiber could go through many load cycles. Plastic
deformation was not prevented in any way; however, the onset of plastic deformation was
avoided by first finding the load which initiated plastic behavior. This load was determined
15
by running one load cycle per fiber and gradually increasing the load increment for every
fiber tested until the stress-strain relation became nonlinear. Since the number of load
cycles for any one fiber was less than ten, no fatigue behavior was considered. The fiber
was loaded in either tension or compression, unloaded to zero, loaded in the opposite
direction, then unloaded again to zero. The load increment used for tension was generally
larger than those for compression since in compression Euler Buckling had to be avoided.
The second objective was to determine compressive failure behavior, and was
accomplished by loading the fiber from zero load to failure. Fiber failure was identified
when the mirror images could no longer be realigned due to excessive deformation.
Excessive deformation could result from Euler Buckling or massive kinkband formation. If
the cause was Euler Buckling, the test results were discarded; kinkband formation was the
failure mechanism of interest, not Euler Buckling. Once the load causing compressive yield
was determined for a given fiber, other fibers of the same type were tested numerous times
without significant error in the moduli as long as the compressive yield point was not
exceeded. Due to the time consuming mounting procedure, each fiber was tested as many
times as possible to generate the most data possible.
As illustrated in Table III below, forty PBO fibers were tested in compression to
determine repeatability of compressive strength and modulus and machine compliance.
Another thirty-six tests were run in tension to determine repeatability of the tensile
modulus, machine compliance, and the possibility of error due to misreading the gage
length. An experimental vapor grown carbon based fiber developed by Applied Sciences
Federated Was tested twenty times in compression and fifty-two in tension. Kevlar 29TM and
Kevlar 49' were tested 24 and 52, and 43 and 50 in compression and tension; respectively.
The number of tests completed depended on how quickly the general trend of the data
appeared and how high was level of confidence of the results. The tensile tests were used
to develop this confidence level since the MTM-8 had proven to work in tension; therefore,
if any errors in the modulus were present, they could possibly be
16
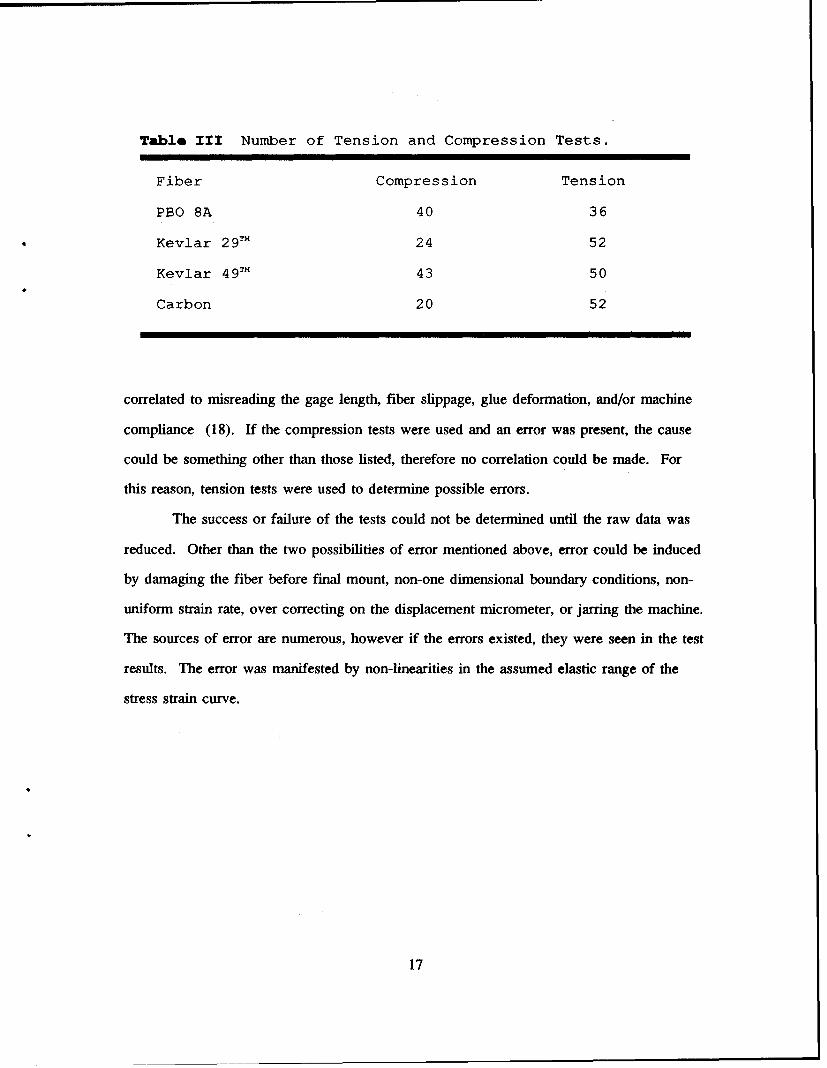
Table III Number of Tension and Compression Tests.
Fiber Compression Tension
PBO 8A 40 36
Kevlar 29TM 24 52
Kevlar 49TM 43 50
Carbon 20 52
correlated to misreading the gage length, fiber slippage, glue deformation, and/or machine
compliance (18). If the compression tests were used and an error was present, the cause
could be something other than those listed, therefore no correlation could be made. For
this reason, tension tests were used to determine possible errors.
The success or failure of the tests could not be determined until the raw data was
reduced. Other than the two possibilities of error mentioned above, error could be induced
by damaging the fiber before final mount, non-one dimensional boundary conditions, non-
uniform strain rate, over correcting on the displacement micrometer, or jarring the machine.
The sources of error are numerous, however if the errors existed, they were seen in the test
results. The error was manifested by non-linearities in the assumed elastic range of the
stress strain curve.
17
SECTION IV
RESULTS
A. PBO 8A
The tensile modulus was the only tensile property of interest for all the fibers tested
and was used for comparison to the compressive modulus. In the tension stress-strain
curves, the last data point of each curve was not the tensile strength, but only the last load
increment used to determine the tensile modulus. The repeatiblity of measuring the tensile
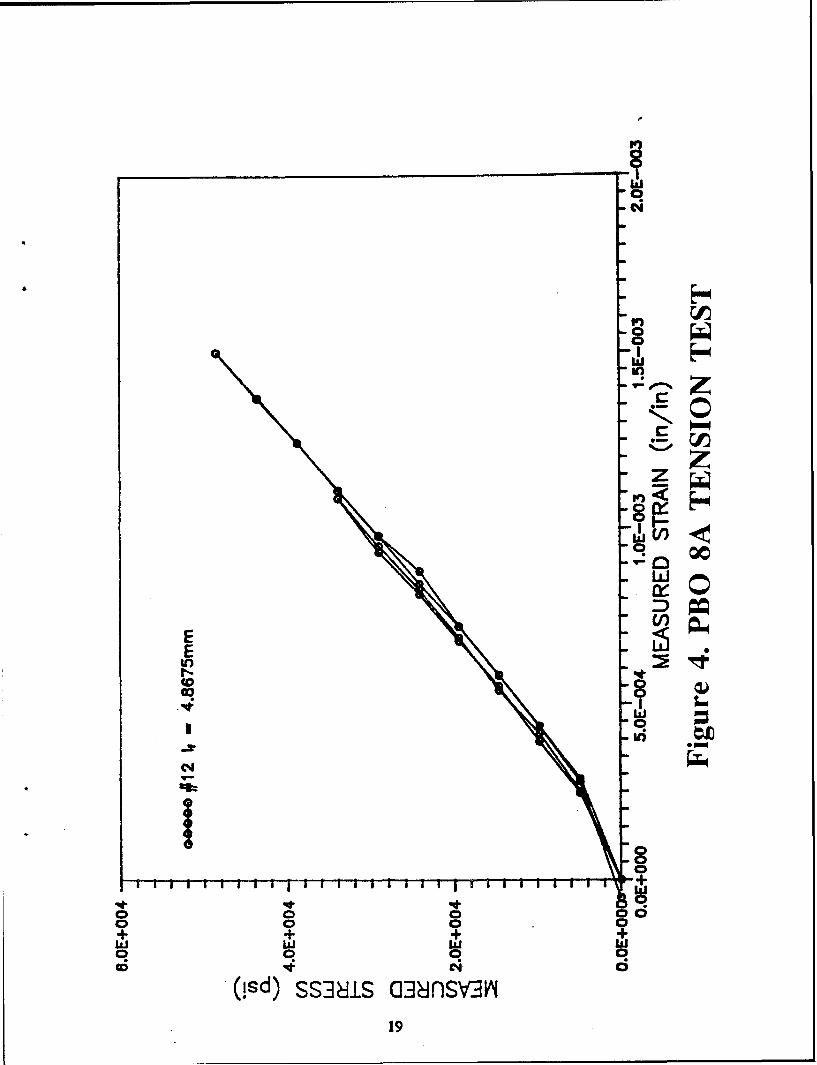
modulus is illustrated in Figure 4 which showed negligible variation of modulus during the
successive load cycles. If the tensile modulus was determined by the slope between two
consecutive data points on the stress-strain curve, the accuracy of the tensile modulus
decreased. The tensile modulus determined between any two consecutive points may vary
considerably, but if it was determined from the entire data set it did not vary outside the
limits of an experimental error of 5%. The average apparent tensile modulus for all the
PBO 8A fibers are listed in Table IV. The measured stress-strain data was used to
determine the average apparent tensile modulus and was not corrected for any possible
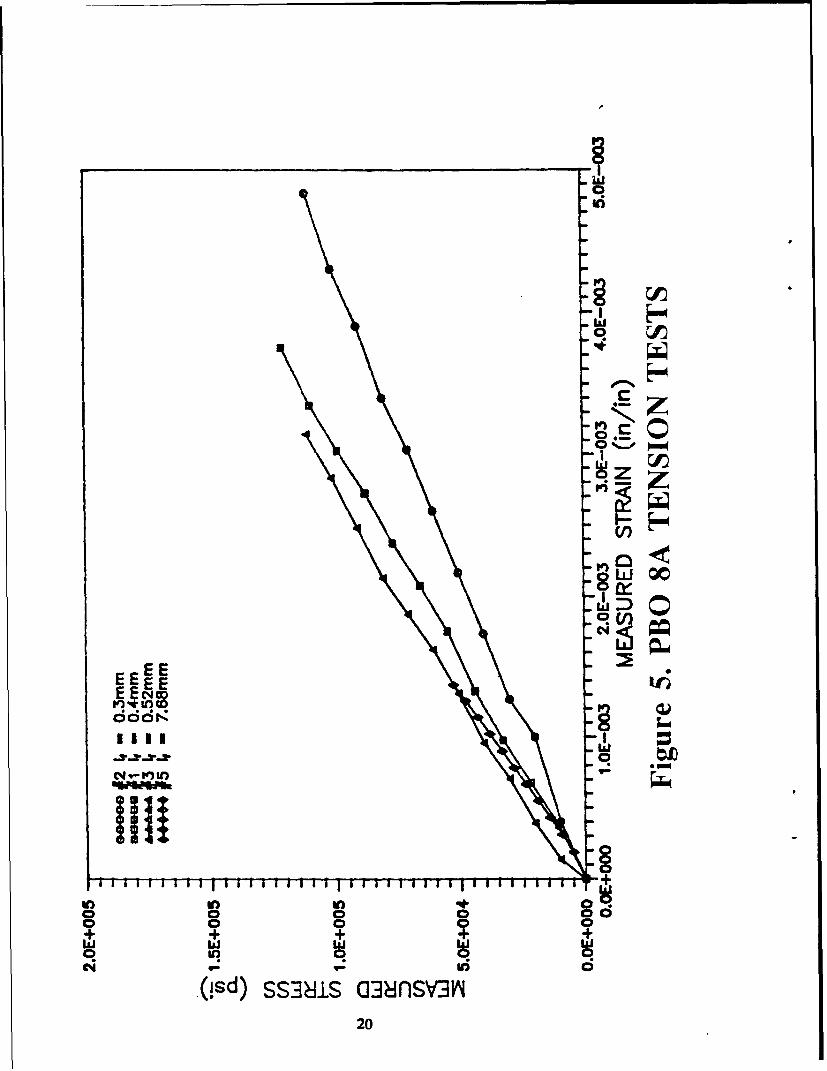
errors at this stage. Figure 5 illustrated typical stress-strain relationships measured for PBO
fibers with gage lengths between 0.3 - 7.68 mm. The apparent tensile modulus was found
to increase, as seen by the increasing slope, with the gage length. The modulus of
elasticity being a material property should not vary with the geometry of the specimen;
however, these moduli were not corrected for the compliance of the machine, thus the
variation. The method used to determine the machine compliance was derived from the
one dimensional Hooke's Law as follows:
T, = EE (4)
where (Y, is stress (force/unit area), E is modulus of elasticity (force/unit area), and F is
strain (length/length). Now substituting the strain-displacement relation:
18
P
I
C4-
Iif)
(00
0 00
(!sd) SS3ýAS (3Nsv0v
19
Eli0y
E E
IN rn LO
00 0W+ +I0*t
.(isd) SS38iS Q138nsv3ri20
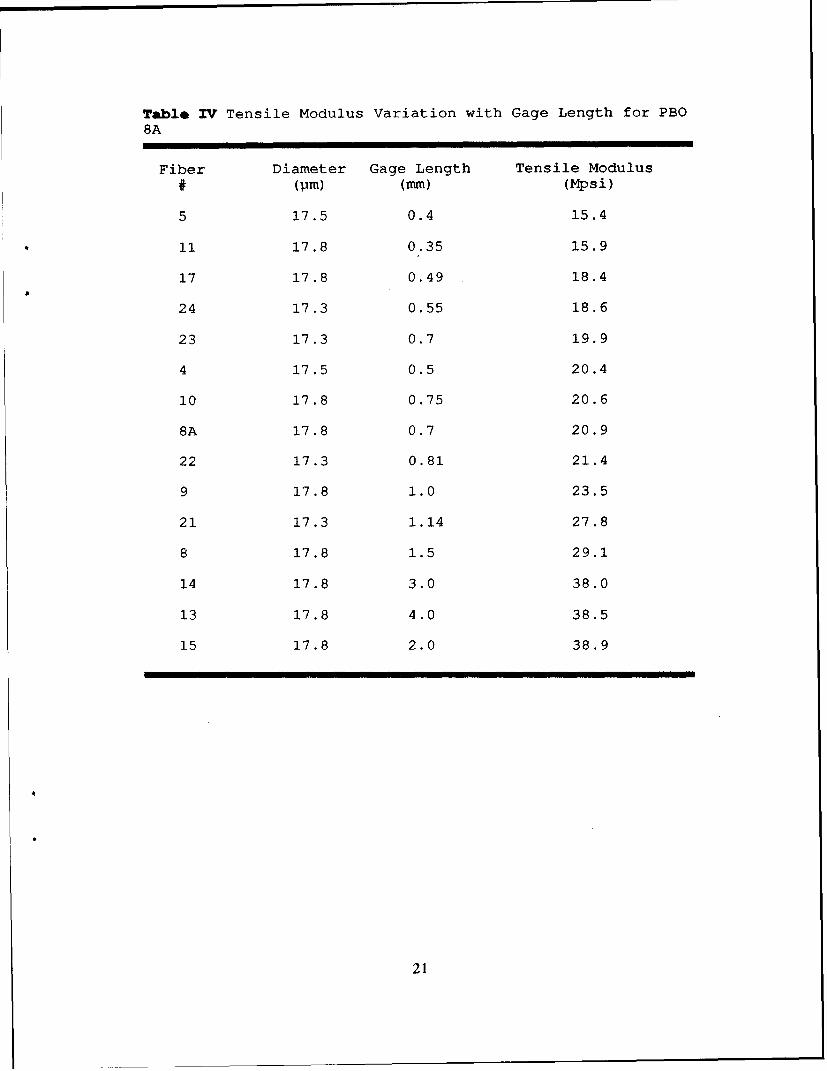
Table IV Tensile Modulus Variation with Gage Length for PBO8A
Fiber Diameter Gage Length Tensile Modulus
# (pm) (mm) (Mpsi)
5 17.5 0.4 15.4
11 17.8 0.35 15.9
17 17.8 0.49 18.4
24 17.3 0.55 18.6
23 17.3 0.7 19.9
4 17.5 0.5 20.4
10 17.8 0.75 20.6
8A 17.8 0.7 20.9
22 17.3 0.81 21.4
9 17.8 1.0 23.5
21 17.3 1.14 27.8
8 17.8 1.5 29.1
14 17.8 3.0 38.0
13 17.8 4.0 38.5
15 17.8 2.0 38.9
21
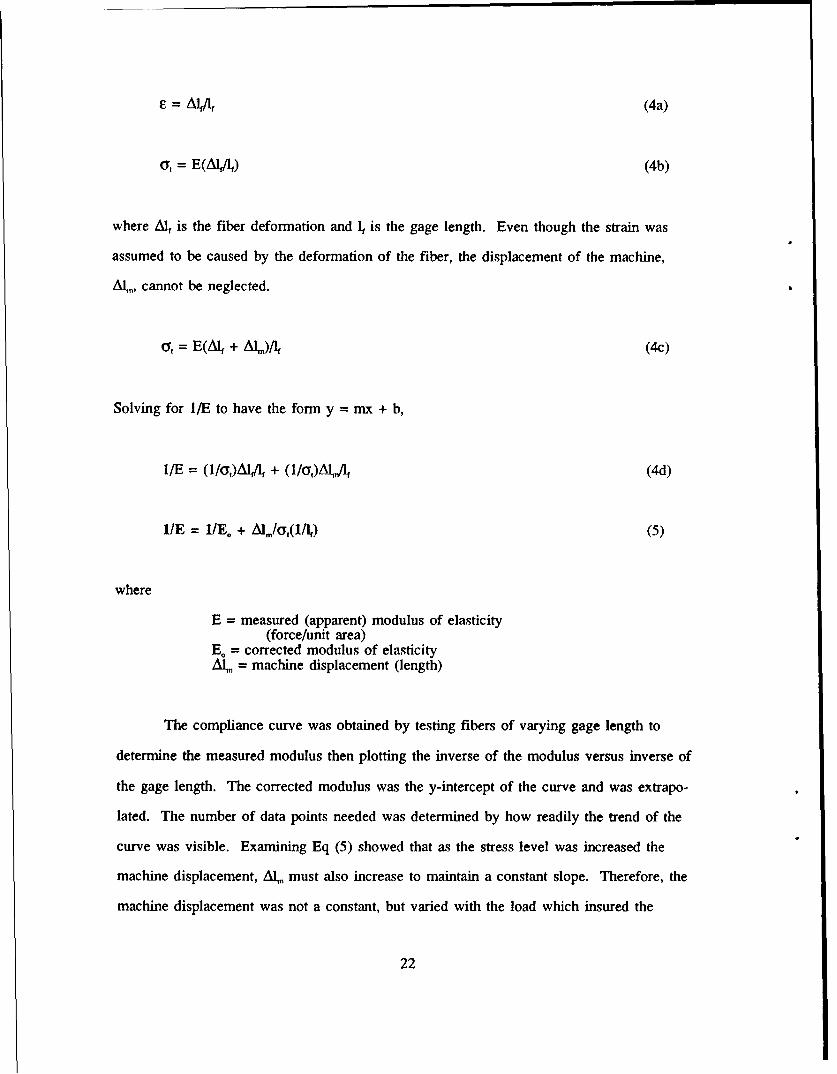
F= AI 1 (4a)
q, = E(AI1) (4b)
where Al1 is the fiber deformation and I4 is the gage length. Even though the strain was
assumed to be caused by the deformation of the fiber, the displacement of the machine,
AI,,, cannot be neglected.
q, = E(A4 + Aj/4 (4c)
Solving for I/E to have the form y = mx + b,
I/E = (1/Y,)AlI + (l/OA)AL, (4d)
1IE = 1/E. + AIu/O,(1/I4) (5)
where
E = measured (apparent) modulus of elasticity(force/unit area)
E= corrected modulus of elasticityAl. = machine displacement (length)
The compliance curve was obtained by testing fibers of varying gage length to
determine the measured modulus then plotting the inverse of the modulus versus inverse of
the gage length. The corrected modulus was the y-intercept of the curve and was extrapo-
lated. The number of data points needed was determined by how readily the trend of the
curve was visible. Examining Eq (5) showed that as the stress level was increased the
machine displacement, Al, must also increase to maintain a constant slope. Therefore, the
machine displacement was not a constant, but varied with the load which insured the
22
000~
00
E u
coa4 ZV)
-z00
1. 0
0 0L 0 8 0
Ia i hi hW)J 0
(!sd/~I~)LOIVJ~OSlfG~ lS3/23c
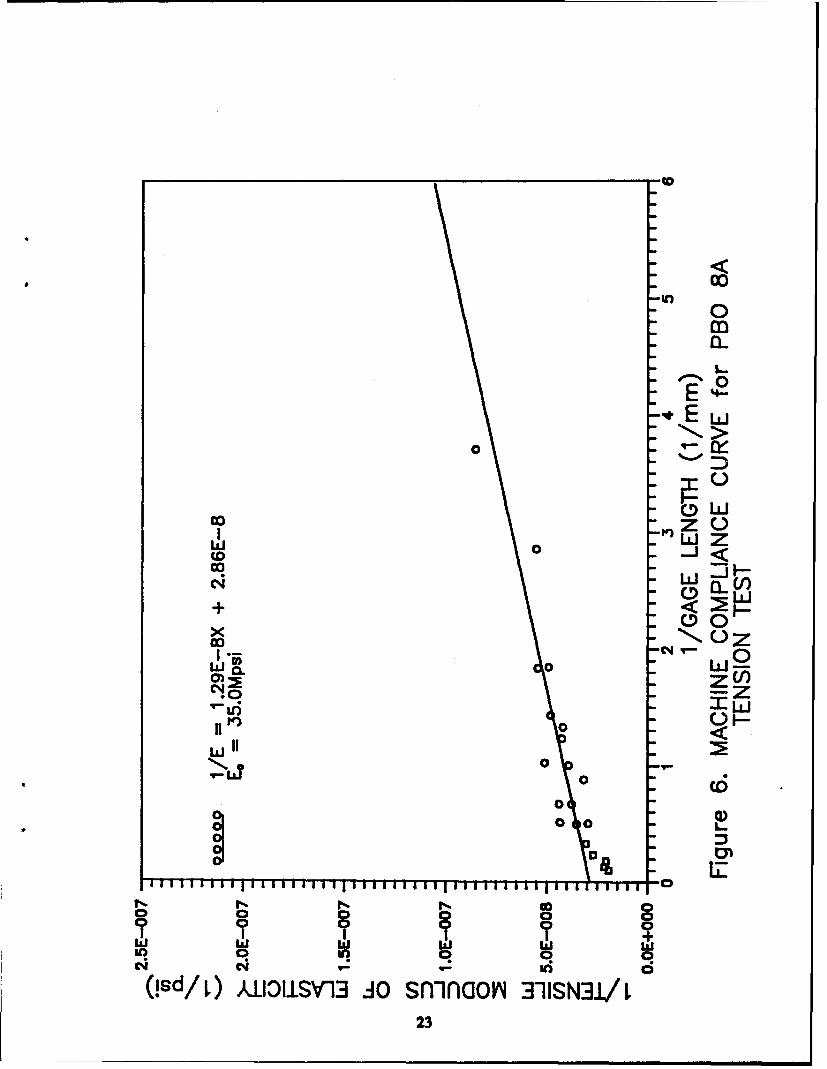
machine compliance, Aldjc, was constant throughout the load cycle for a given fiber. Based
on Eq (5), no dependence on any fiber material properties was present. The machine
compliance for the tension tests was plotted using linear regression and shown in Figure 6.
The corrected modulus for PBO 8A was 35.0 Mpsi and the machine compliance, AlJaY was
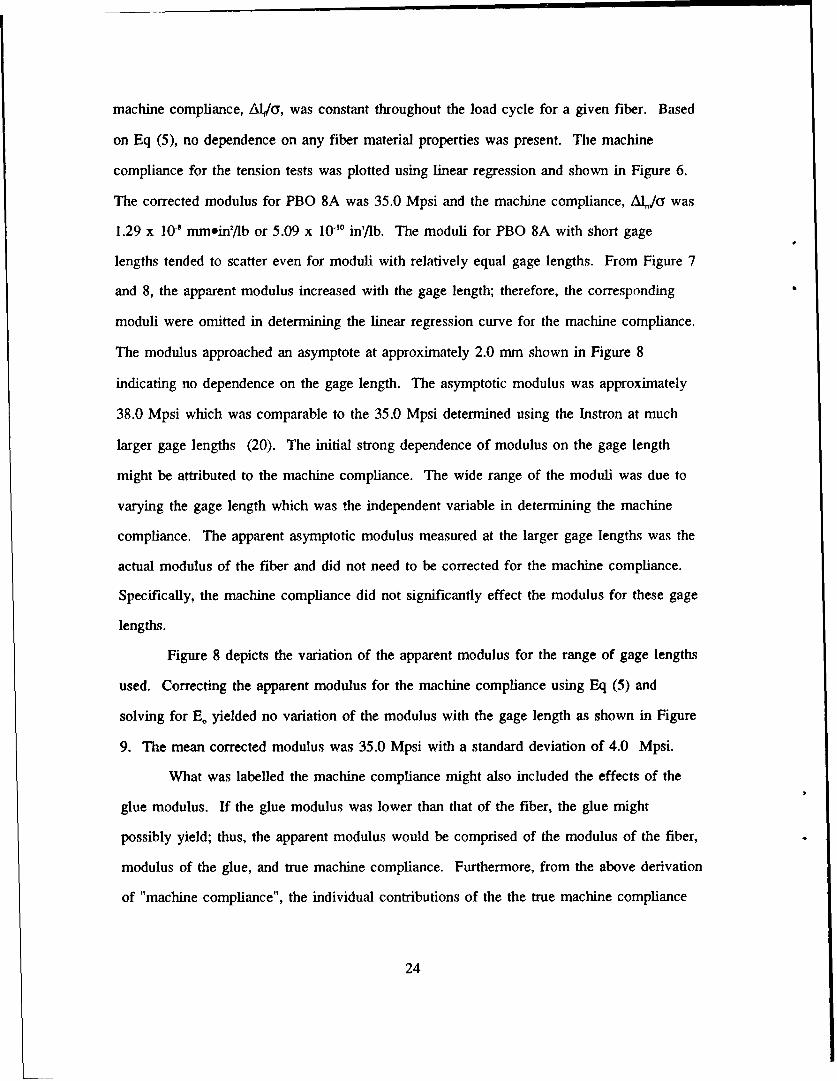
1.29 x 10' mmoin'/lb or 5.09 x 10"'° in'/lb. The moduli for PBO 8A with short gage
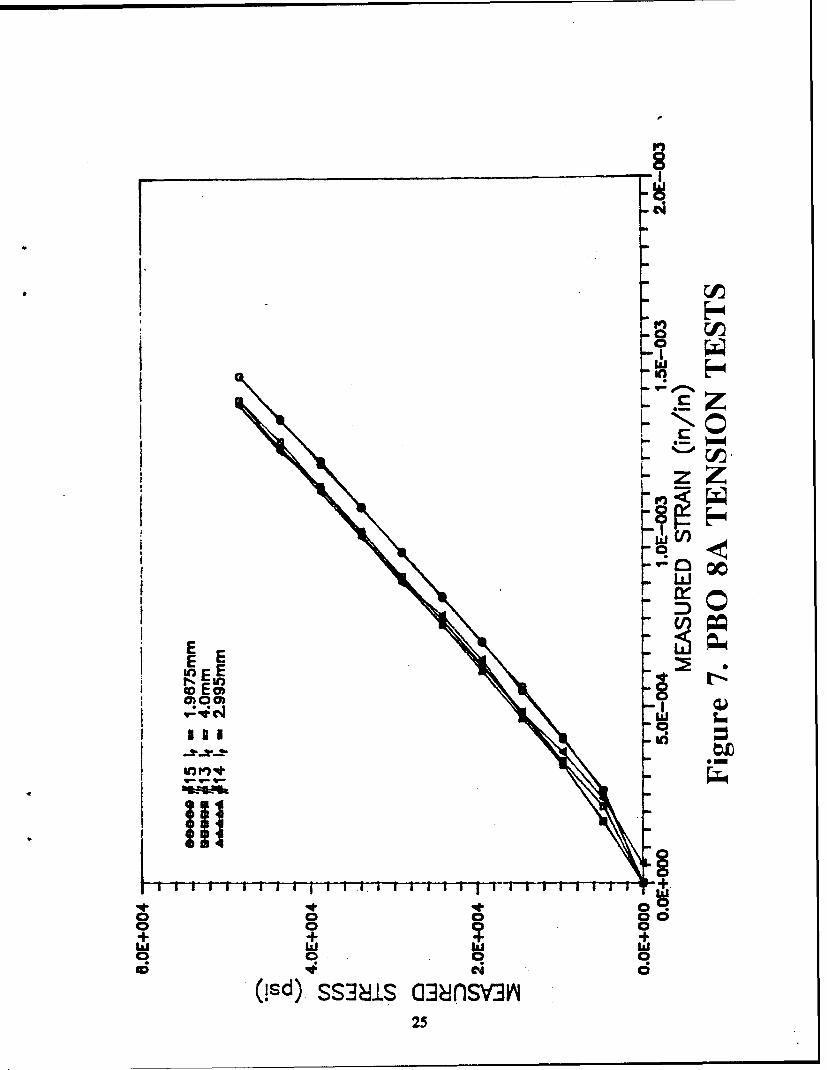
lengths tended to scatter even for moduli with relatively equal gage lengths. From Figure 7
and 8, the apparent modulus increased with the gage length; therefore, the corresponding
moduli were omitted in determining the linear regression curve for the machine compliance.
The modulus approached an asymptote at approximately 2.0 mm shown in Figure 8
indicating no dependence on the gage length. The asymptotic modulus was approximately
38.0 Mpsi which was comparable to the 35.0 Mpsi determined using the Instron at much
larger gage lengths (20). The initial strong dependence of modulus on the gage length
might be attributed to the machine compliance. The wide range of the moduli was due to
varying the gage length which was the independent variable in determining the machine
compliance. The apparent asymptotic modulus measured at the larger gage lengths was the
actual modulus of the fiber and did not need to be corrected for the machine compliance.
Specifically, the machine compliance did not significantly effect the modulus for these gage
lengths.
Figure 8 depicts the variation of the apparent modulus for the range of gage lengths
used. Correcting the apparent modulus for the machine compliance using Eq (5) and
solving for E. yielded no variation of the modulus with the gage length as shown in Figure
9. The mean corrected modulus was 35.0 Mpsi with a standard deviation of 4.0 Mpsi.
What was labelled the machine compliance might also included the effects of the
glue modulus. If the glue modulus was lower than that of the fiber, the glue might
possibly yield; thus, the apparent modulus would be comprised of the modulus of the fiber,
modulus of the glue, and true machine compliance. Furthermore, from the above derivation
of "machine compliance", the individual contributions of the the true machine compliance
24
L
-W V
*w
Eo
I L ZI
A Dll
00
li q-
1.555511111111511111151115151 -4.4. 4.4 C25
0 U1)
-j
0 LL0
08 Z-IJ
Hu 0WOO
<H-
L 00
0 0)
000
0 z
00000Q
+
(!sd) sfliflOVN J1ISN3J. iN38JVddV 30WDIAV26
00
z n
0 zf
-J
0'a 0
00 0z
1Li
0!d smaN iiN3130NA
0 27
and glue modulus could not be separated. As a result, the "machine compliance" contained
the true machine compliance in addition to the possible but indeterminable effects of the
glue. Heretofor, "machine compliance" is defined as the conglomeration of the above
factors. Substituting c5, = P/A, where P is load, into Eq (5), where the machine compliance
was only proportional to the load and dependent on the cross-sectional area.
l/E = l/Eo + (ALJP)(A/l1 ) (6)
Plotting the inverse of the apparent modulus versus the inverse of the aspect ratio did not
change the corrected modulus or machine compliance. Since the modulus of elasticity is a
material property, it should be constant regardless of any changes in sample geometry. As
seen from Eq (6), the machine compliance, the term premultiplying the inverse of the
aspect ratio, was also independent of variation in sample geometry.
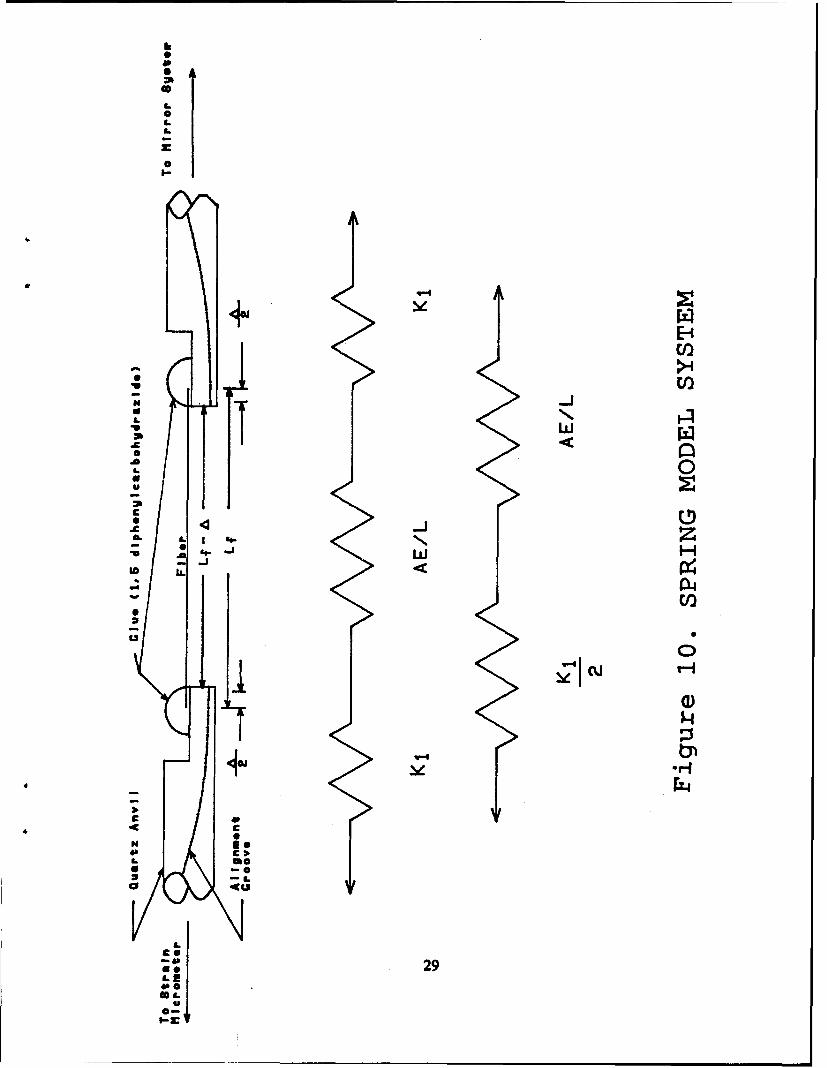
Another approach to determine the machine compliance was to model the fiber-glue
system as three elastic springs connected in series, shown in Figure 10. The premise of the
analysis was the glue beads anchoring the fiber to the anvil and true machine compliance
would act as springs in addition to the spring stiffness of the fiber. In order to determine
the latter, the former must be determined and can be done through the following derivation.
The displacement of a uniaxially loaded bar can be defined as
8 = PL/AE (7a)
where8 = displacement (units of length)P = uniaxial load (units of force)L = length (units of length)A = cross-sectional area (units of length2)E = modulus of elasticity (units of force/length2)
28
ILL0
0
I--
C;Sc
co If
0
000
OLi
Solving for P/8 yields
P/6 = AE/L (7b)
Eq (7b) is of the form
F = -kx (7c)
which is the force, F, required to displace a linear, elastic spring a distance of x. The right
hand side of Eq (7b) and k, in Eq (7c) represent the stiffness of the fiber and machine
compliance; respectively. Assuming the stiffness of the system is dominated by the
machine compliance for fibers of extremely short gage length, and conversely, dominated
by the stiffness of the fiber for fibers of large gage length; the contribution of one
individual spring connected in series within a system of springs is determined by dividing
the product springs by their sum as follows;
l/X = 2/k, + L/AE (7e)
where I/X is the equivalent stiffness of the system which is k, for short or AE/L for long
fibers. Solving for X and substituting the appropriate system stiffnes yields
k1i2 = (kAE/2L)/(kt/2 + AE/L) = AE/L (8)
If the modulus of elasticity and tensile stress of Eq (5) were represented in terms of load
and displacement Eq (8) is obtained. The significance was that both approaches to
determine the machine compliance generated the same solution.
30
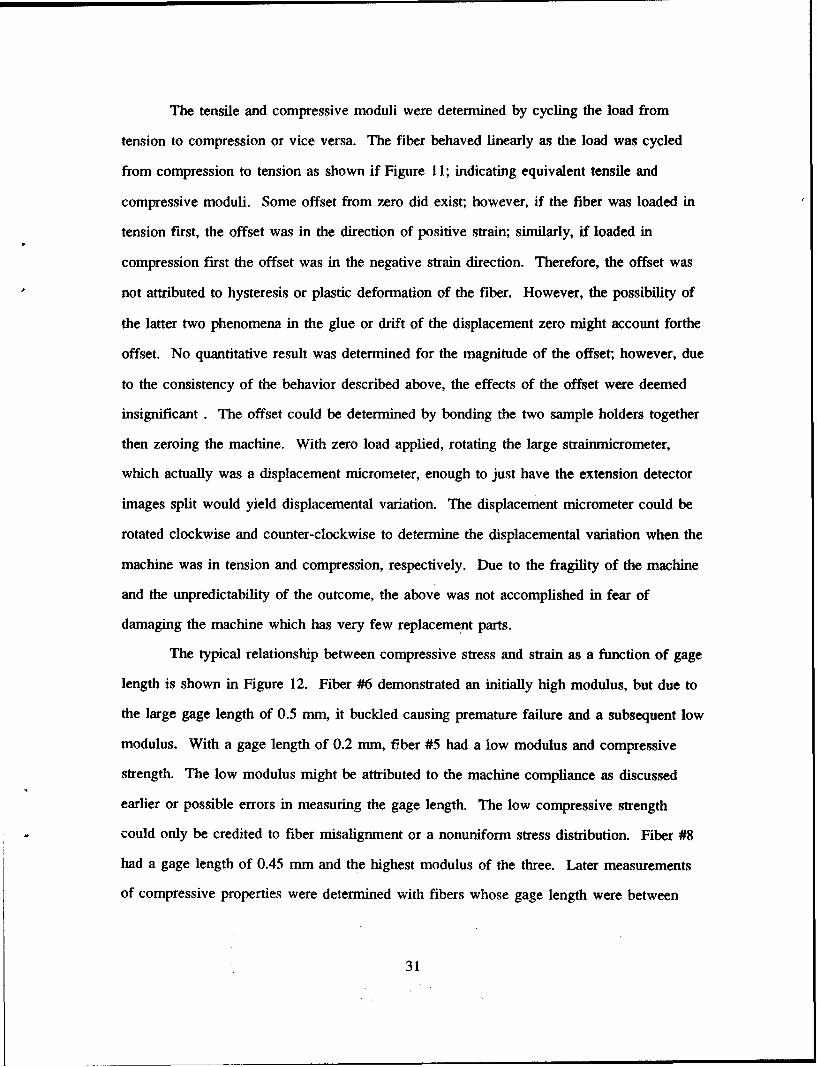
The tensile and compressive moduli were determined by cycling the load from
tension to compression or vice versa. The fiber behaved linearly as the load was cycled
from compression to tension as shown if Figure 11; indicating equivalent tensile and
compressive moduli. Some offset from zero did exist; however, if the fiber was loaded in
tension first, the offset was in the direction of positive strain; similarly, if loaded in
compression first the offset was in the negative strain direction. Therefore, the offset was
not attributed to hysteresis or plastic deformation of the fiber. However, the possibility of
the latter two phenomena in the glue or drift of the displacement zero might account forthe
offset. No quantitative result was determined for the magnitude of the offset; however, due
to the consistency of the behavior described above, the effects of the offset were deemed
insignificant. The offset could be determined by bonding the two sample holders together
then zeroing the machine. With zero load applied, rotating the large strainmicrometer,
which actually was a displacement micrometer, enough to just have the extension detector
images split would yield displacemental variation. The displacement micrometer could be
rotated clockwise and counter-clockwise to determine the displacemental variation when the
machine was in tension and compression, respectively. Due to the fragility of the machine
and the unpredictability of the outcome, the above was not accomplished in fear of
damaging the machine which has very few replacement parts.
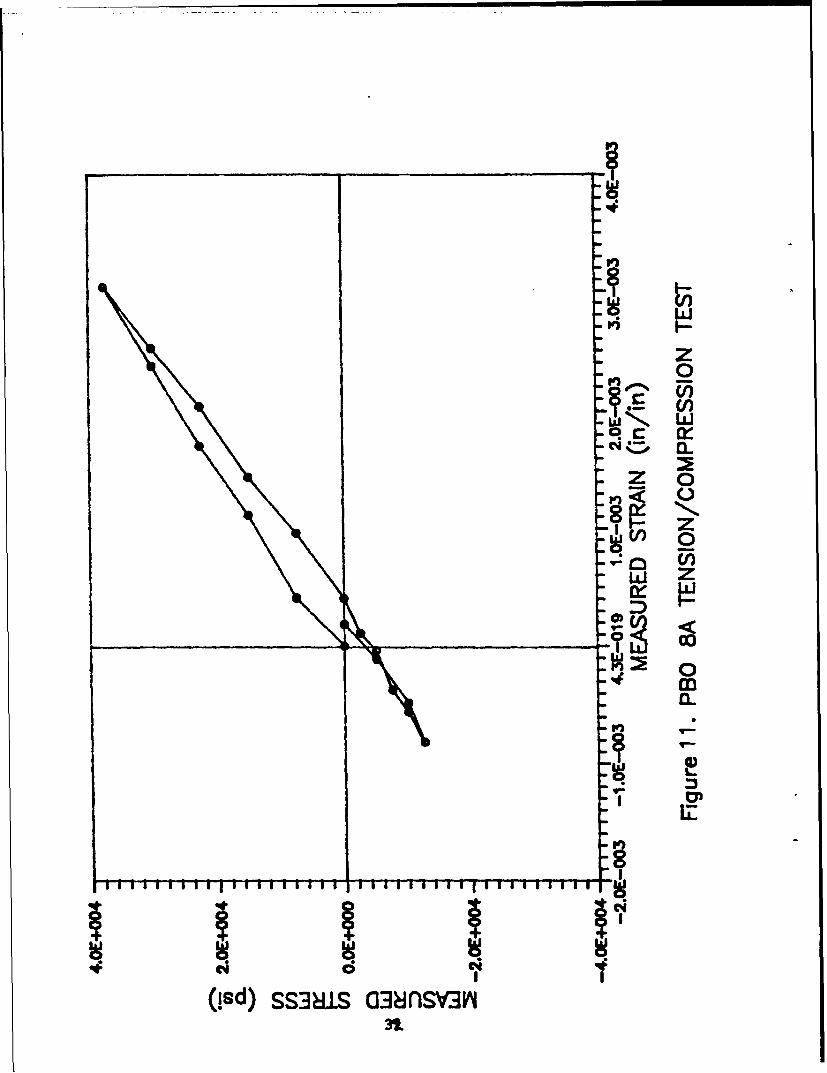
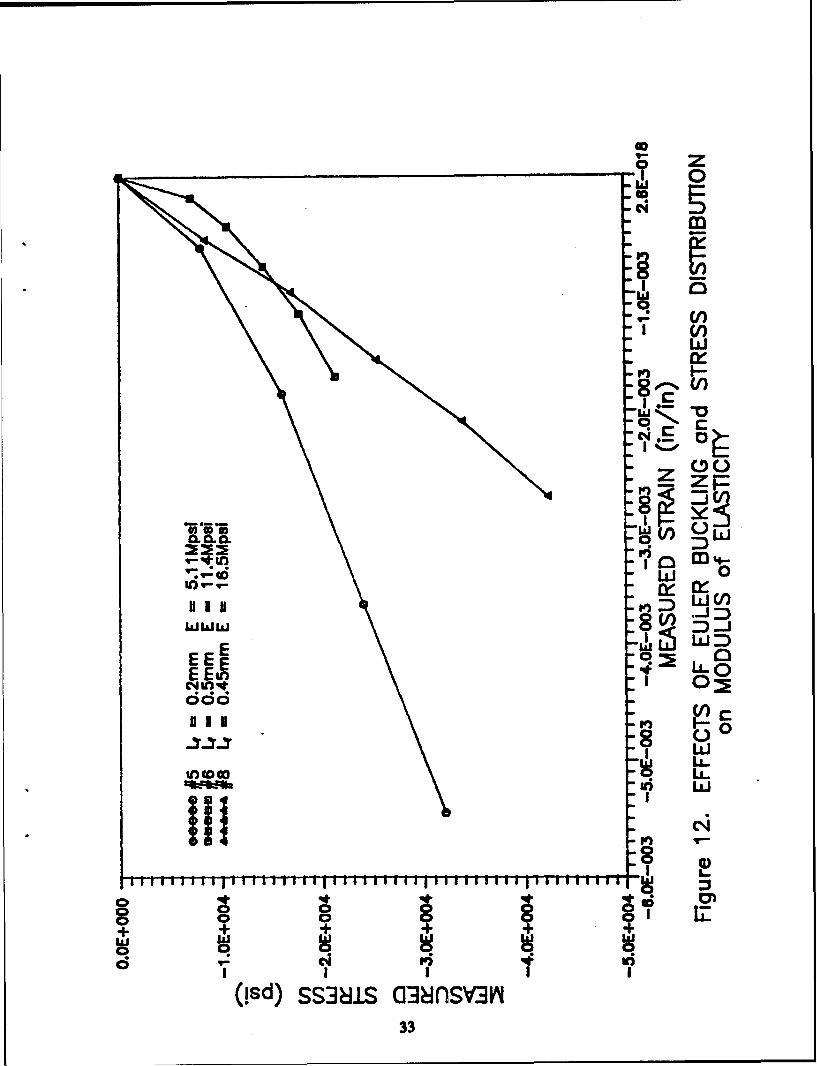
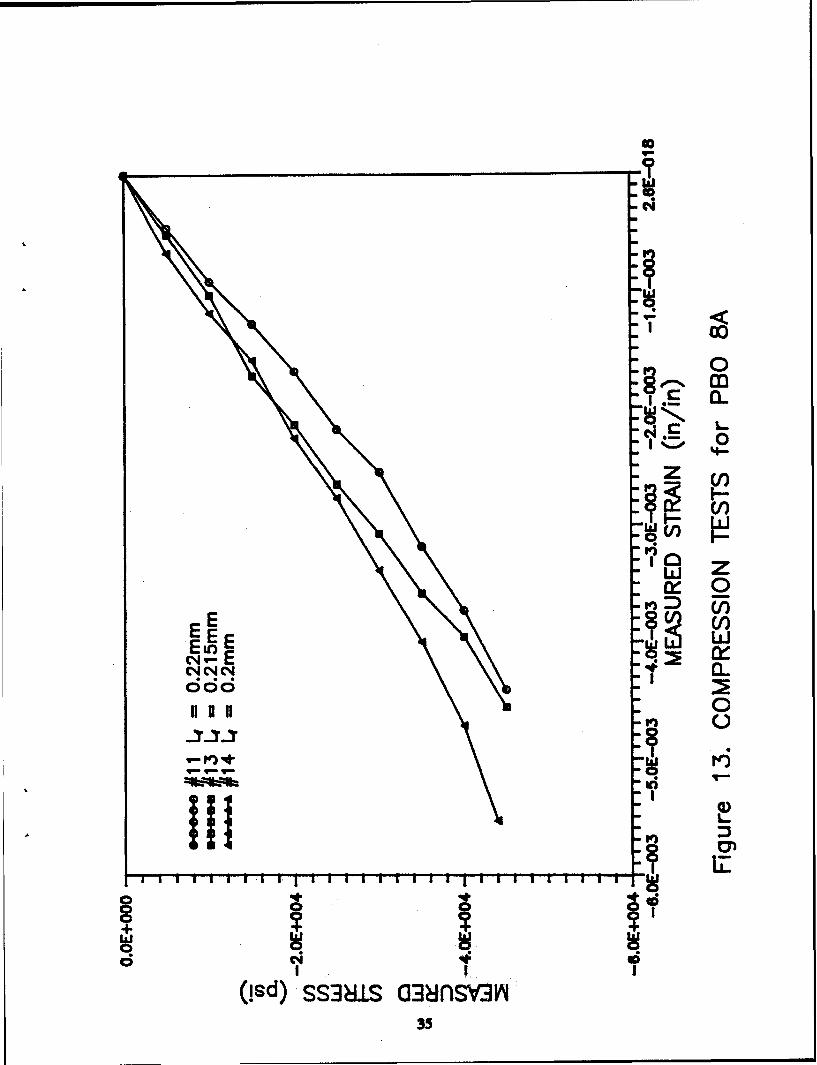
The typical relationship between compressive stress and strain as a function of gage
length is shown in Figure 12. Fiber #6 demonstrated an initially high modulus, but due to
the large gage length of 0.5 mm, it buckled causing premature failure and a subsequent low
modulus. With a gage length of 0.2 mm, fiber #5 had a low modulus and compressive
strength. The low modulus might be attributed to the machine compliance as discussed
earlier or possible errors in measuring the gage length. The low compressive strength
could only be credited to fiber misalignment or a nonuniform stress distribution. Fiber #8
had a gage length of 0.45 mm and the highest modulus of the three. Later measurements
of compressive properties were determined with fibers whose gage length were between
31
wqcr
C4%-of a.z o
0
V)0p in
a Ca.
(Isd) ssas a3?nsv~n
m
w
0
nflCoo w
W,
E E
Dun r)
8 Li.lin w
ot+o
w
(Isd) ss3aiS a03insv3v133
0.2 - 0.5 mm, inclusive.
Using Eq (3), with the tensile machine compliance curve mean corrected modulus
of E, = 35.9 Mpsi, d = 17.5 gim, G = 0.174 Mpsi; the minimum gage length allowable to
avoid boundary effects on the stress distribution was 0.53 mm. The shear modulus for
PBO was unknow~n, but was approximated by using the shear modulus of PBT,poly(p-
phenylenebenobisthiazole) (21). From fiber #5 in Figure 12, the minimum aspect ratio to
avoid end effects was 12. The minimum aspect ratio, from Eq (3), was approximately 30
which was on the decreasing portion of the curve meaning something was driving the
modulus lower beside the non-uniform stress distribution, or the approximation for mini-
mum gage length was not applicable for PBO.
The Euler Buckling criterion was adequate for a rough upper estimate, but the
empirical and analytical data revealed a wide dichotomy in minimum gage lengths. Recall
the Euler Buckling analysis yielded a maximum gage length requirement of 0.81 mm. The
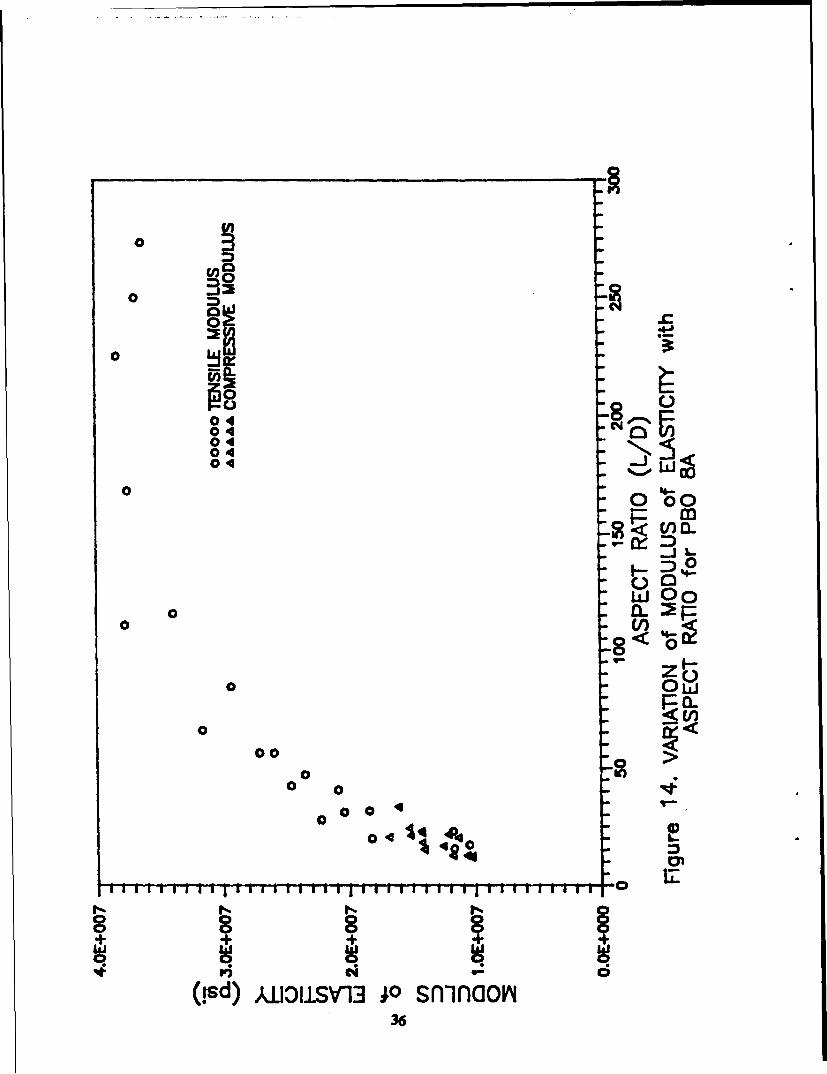
dependence of the apparent modulus on the gage length was also present in the
compression measurements as shown in Figure 13 and 14. In the compression tests, the
modulus varied with the gage length just as in the tension tests. The apparent modulus
range was from 10 - 20 Mpsi, as listed in Table V, which was significantly lower than the
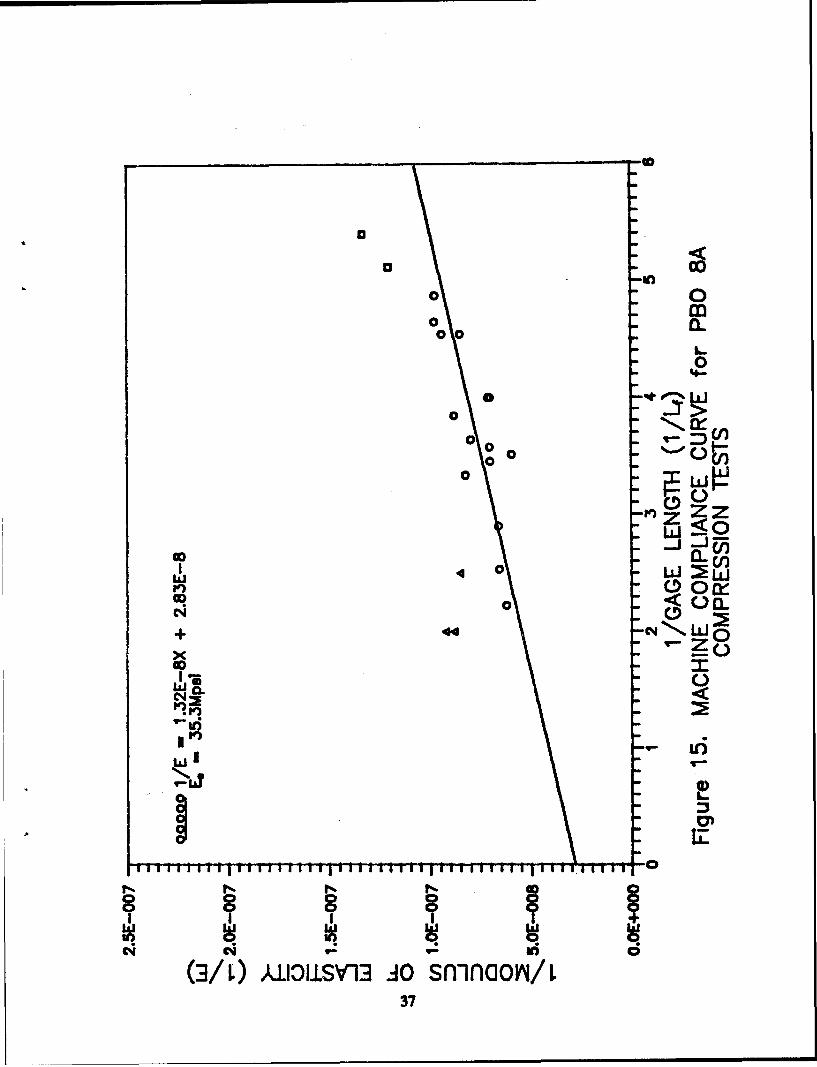
tensile modulus range. From the compression compliance curve shown in Figure 15, the
corrected modulus and machine compliance were 35.3 Mpsi and 5.20 x 10"1 in'/lb. Both
these values were within 3% of the corresponding tensile quantities. The extrapolated
corrected modulus from Figure 15 was initially questioned due to the distance the curve
had to be extended without having any data points in the that region. Assuming the
machine compliance was constant in both tension and compression, the corrected
compressive modulus could be obtained by using Eq (5) and the tensile machine
compliance. The resulting average corrected compressive modulus was 35.6 Mpsi.
The variation above and below the linear curve fit was present in both the tension
and compression compliance curves. From Figure 16, the effective gage length might
34
cc
CL0
V)
:70wi0
S0
351
0
0404040404
-
0 '4-0 00
JL.
L 00
00
0 ow0a-
0 00
0 >
00
8 8++ +
(!sd) AIIOIiSVI3 10 sfliflovqIm6
a<
0 0m000
0.
00
0
0o
0
I 0 W W
+ 44w
400
(3/c ,UOIY1 4 nian
IF~ I37
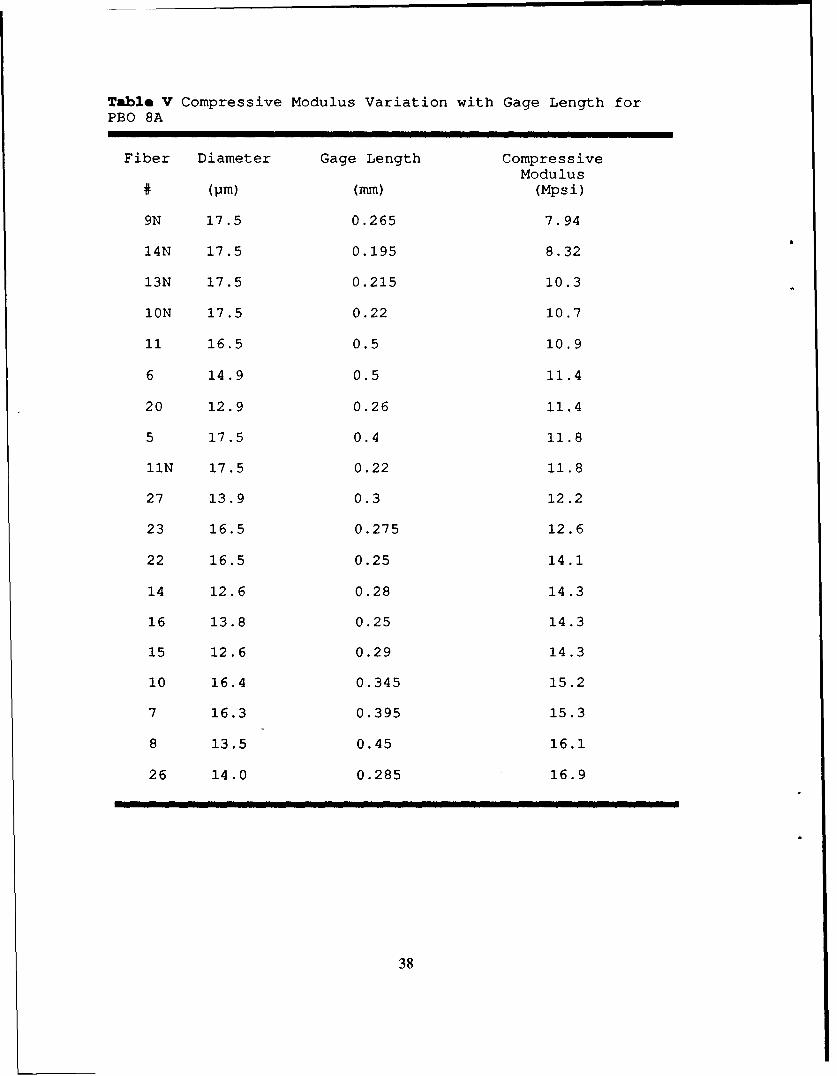
Table V Compressive Modulus Variation with Gage Length forPBO 8A
Fiber Diameter Gage Length CompressiveModulus
# (Pm) (mm) (Mpsi)
9N 17.5 0.265 7.94
14N 17.5 0.195 8.32
13N 17.5 0.215 10.3
1ON 17.5 0.22 10.7
11 16.5 0.5 10.9
6 14.9 0.5 11.4
20 12.9 0.26 11.4
5 17.5 0.4 11.8
11N 17.5 0.22 11.8
27 13.9 0.3 12.2
23 16.5 0.275 12.6
22 16.5 0.25 14.1
14 12.6 0.28 14.3
16 13.8 0.25 14.3
15 12.6 0.29 14.3
10 16.4 0.345 15.2
7 16.3 0.395 15.3
8 13.5 0.45 16.1
26 14.0 0.285 16.9
38
L
L0
I.-
I--
0z
rzl
N -to
c.39 I a
02
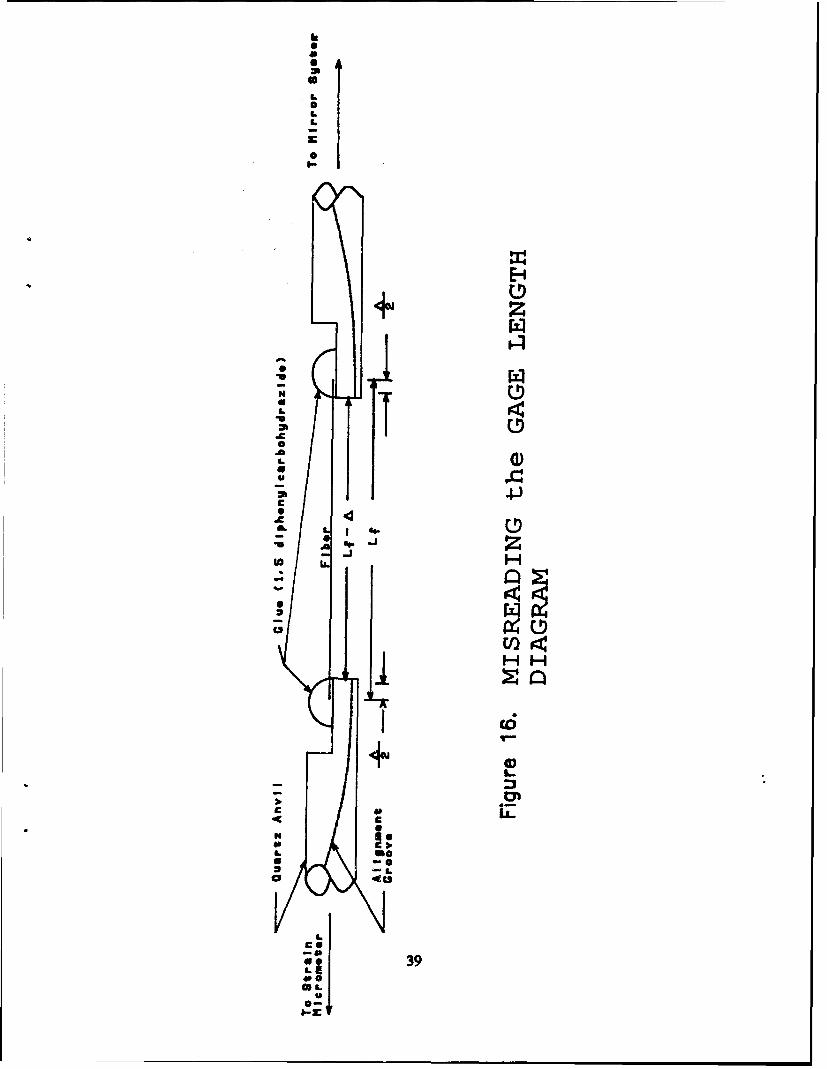
actually be longer than the measured gage length. The fiber was glued to each anvil, a
perfect boundary didn't exist since the glue didn't instantaneously anchor the fiber. In ac-
tuality the fiber must extend into the glue some unknown amount, depending on the type of
glue, fiber, and interface between them, before the glue supported the fiber. The additional
length needed to support the fiber plus the distance between the two anvils was the
effective gage length. The misreading of the gage length can be determined by slightly
varying the derivation of Eq (5). Using the effective gage length as l4-A for the 'old' I and
substituting into Eq (4c) yields
F, = E(Al, + Al.)/(], - A) (9a)
where A is the error attributed to misreading the gage length.
odJE = A4r/l4(4/( - A) + A1J(4 - A) (9b)
Adding ±A to l4 in the numerator of the first term of Eq (9b)
I/E = Al1/a[[1 + A/(], - A)] + Alja,(1/l-A) (9c)
Simplifying to obtain the desired y = mx + b form
I/E = Al1 a,4 + [Al1A/a1,4 + Aja1j[l/(l, - A) (9d)
where
I/Eo = A11/a,1 (9e)
I/E = (I/Eo) + [A/Eo + A=aa,][1/(I, - A)] (10)
40
Equation (10) was used to determine the gage length misreading including the effects of the
machine compliance. A similar derivation was used to determine the effects of glue
displacement combined with misreading the gage length and the machine compliance by
adding the term Al, to the numerator of Eq (9a) and resulted in the following equation:
1/E = I/Eo + [A/Eo + Aim/(at +Al3/,][1/(lf - A)] (11)
From Eq (5), (10), and (11), as the gage length increased the effect it had on the apparent
modulus decreased; in the limit of 14 going to infinity, the corrected and apparent moduli
are equal. Error caused by misreading the gage length or glue displacement; if present,
constructively add to lower the modulus values; thereby, increasing the slope of the
compliance curve. Recall, Figure 6 and 15 showed variation above and below the linear
curve forced through the data points. Misreading the gage length would only shift the
curve above the linear fit not below. Glue slippage would have the same effect as the
misreading error. Both errors, if present, because the slope to increase, but the corrected
modulus remained constant. Misreading the gage length was not fiber dependent; the
unknown additional distance into the glue on the anvil needed to support the fiber would
be expected to remain relatively constant for all fibers of similar composition and dimen-
sion. Fiber slippage would depend on the bond between the fiber and the glue; therefore, it
would be possible that one fiber may slip, and another may not even if the fibers were of
the same type. Due to the random scatter of data on the compliance curve, the existence of
errors in the PBO fibers due to misreading the gage length and/or fiber slippage was
inconclusive.
The type of variation present didn't reinforce the theories of misreading the gage
length or fiber slippage, both dictating an increase in slope for shorter gage lengths which
was not consistently present. The square data points in Figure 15 correspond to fibers
which were misaligned or had a nonuniform stress distribution, but it was impossible to
41
distinguish which one was present. The triangular data points represent fibers that buckled
resulting in the lower compressive modulus.
In the compression tests, the stress-strain relation was nonlinear in some instances.
This could be due to plastic deformation or out of plane displacement of the fiber. Gradual
kinkband formation would account for the nonlinearity; however, the nature of kinkband
formation is not known. In roughly 50% of the fibers tested, the load prior to failure re-
sulted in an elastic deformation which would not indicate gradual kinkband formation.
Since the deformation at failure could not be determined, the linearity or nonlinearity of the
deformation was unknown. The deformation at the critical load was indeterminable since
the mirror images could not be realigned. The inability to realign the images after failure
produced the linear stress-strain relation from zero load to fracture. The appearance of a
non-linear stress-strain relation existed for fibers with relatively large gage lengths;
however, this was not attributed to plastic deformation of the fiber in these cases. In those
fibers exhibiting this phenomenon, the non-linear behavior was due to gradual bowing of
the fiber caused by an induced moment from fiber misalignment or possibly plastic
deformation of the glue. The load was not large enough to cause buckling, but did cause
the non-linear displacement. The bowing of the fibers could possibly be caused by fiber
misalignment or due to the formation of kinkbands. The former was difficult to detect due
to the low power of the travelling microscope. When kinkbands were formed the applied
load no longer acted in line with the longitudinal axis of the fiber, but was resolved into
normal and shear stresses acting perpendicular and parallel to the plane of the kinkband.
These two stresses might cause the bowing which was evident in some of the polymeric
fibers, thus yielding non-linear displacements.
42
B. KEVLAR 29TM
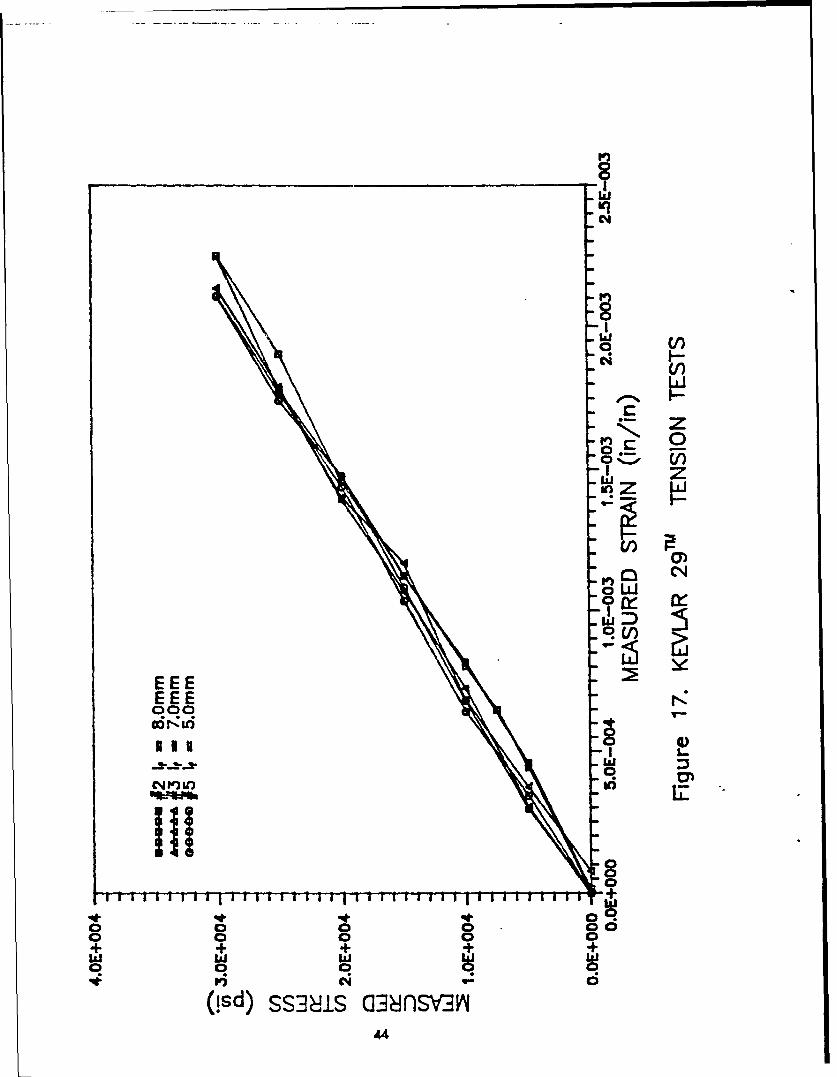
Kevlar 29T' were polymeric fibers tested to further examine the reliability of direct
compression testing of fibers of extremely short gage length. Figure 17 showed
representative tension tests with little variation in apparent modulus as the gage length
exceeded 5.0 mm. The offset from the origin after the fiber was unloaded was present in
almost every tension test and was always in the direction of positive strain; thus reinforcing
the assertion that the offset was due to machine imprecision, plastic deformation of the
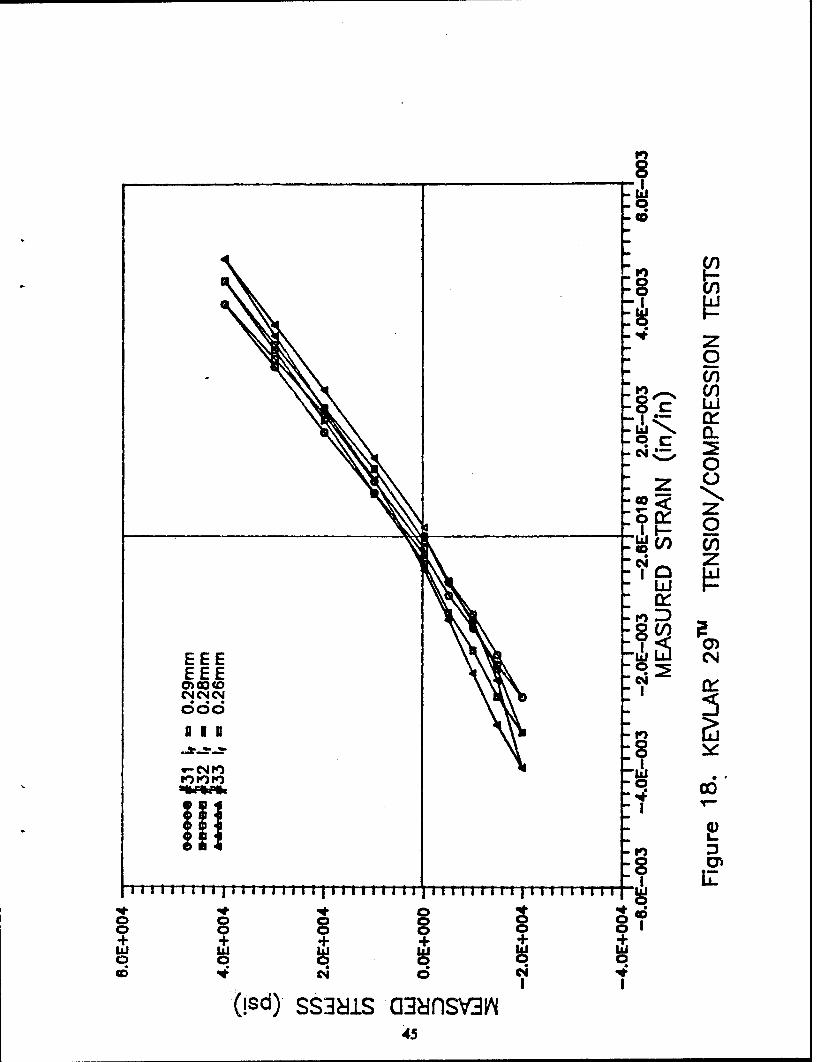
glue, or hysteresis in the glue. Significant variation was present in fibers of gage lengths
less than 1.0 mm as shown by the tension/compression measurements in Figure 18. The
nonlinearity seen in the final load increments of the compressive loading in Figure 17
cannot be attributed to any one cause but might be due to fiber misalignment, nonuniform
stress distribution, and/or microbuckling of the microfibril. The tension/compression tests
exhibited linearity when passing through the origin as expected indicating equivalent tensile
and compressive moduli. Again, the offset from the origin upon unloading was negative
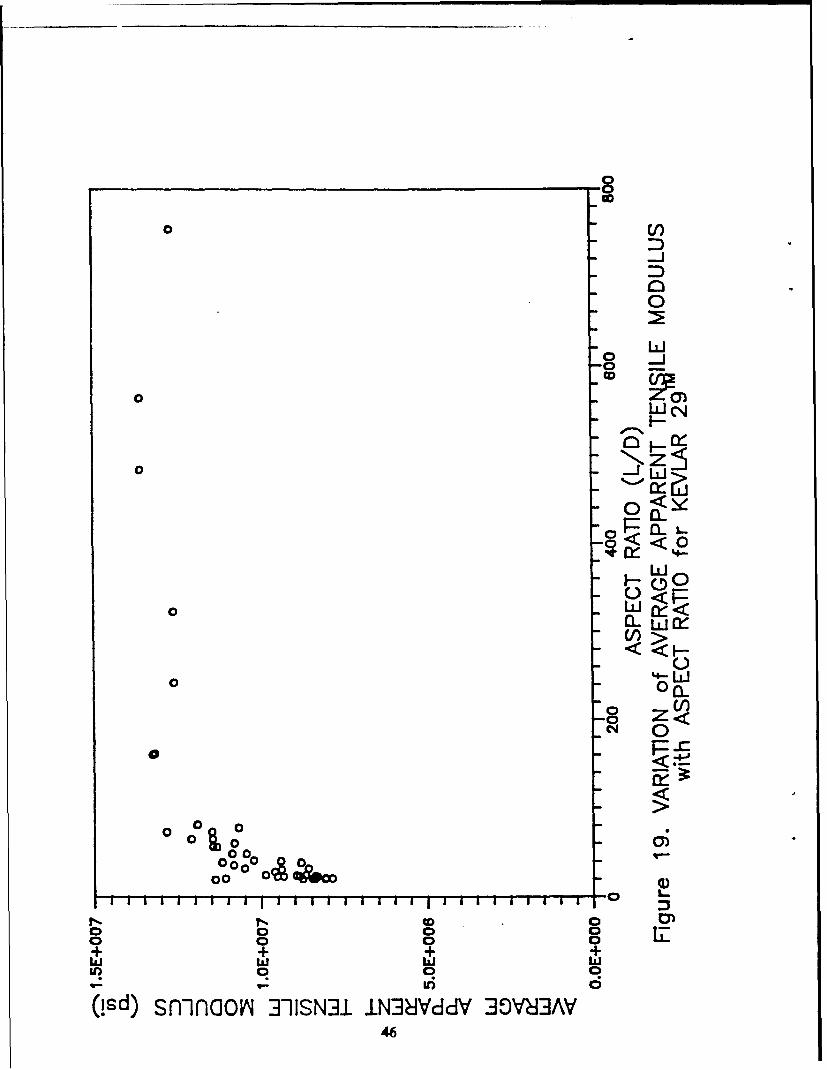
strain for compression and positive strain for tension. The fiber tensile modulus was no
longer dependent on gage length as the gage length exceeded 1.25 mm which resulted in an
aspect ratio of 100 as shown if Figure 19. The modulus approaches an asymptote at
approximately 13.5 Mpsi which was slightly higher than the 12.0 Mpsi obtained from the
Instron data (21). The diameter of the fiber did not alter the average tensile modulus
versus aspect ratio plot; therefore, little or no dependence on fiber diameter by the stress
distribution or tensile modulus existed. A ,inm~nary of the fiber tension tests are listed in
Table VI; those measurements marked with an asterisk had misaligned fibers.
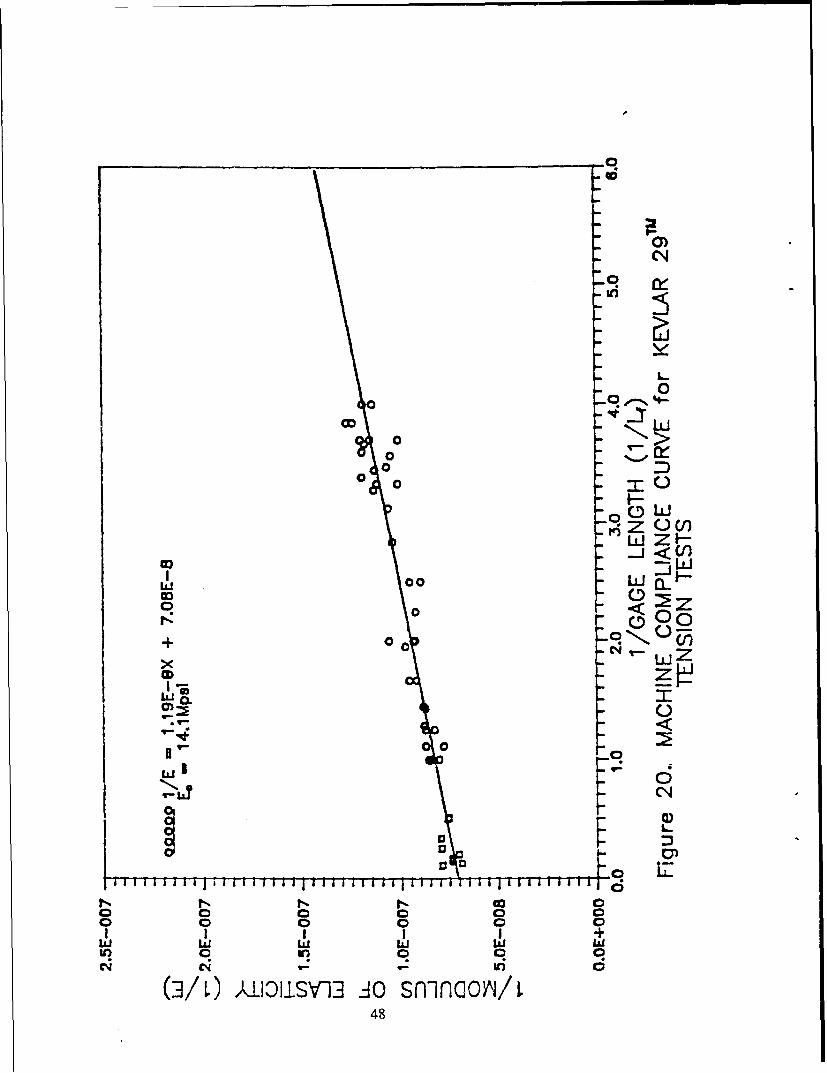
The machine compliance curve shown in Figure 20 yielded a corrected modulus of
14.1 Mpsi and a machine compliance of 4.70 x 101" in'lib. The square data points
correspond to moduli values where the modulus no longer depended on the gage length;
therefore, they were not included in the linear regression calculation to determine the best
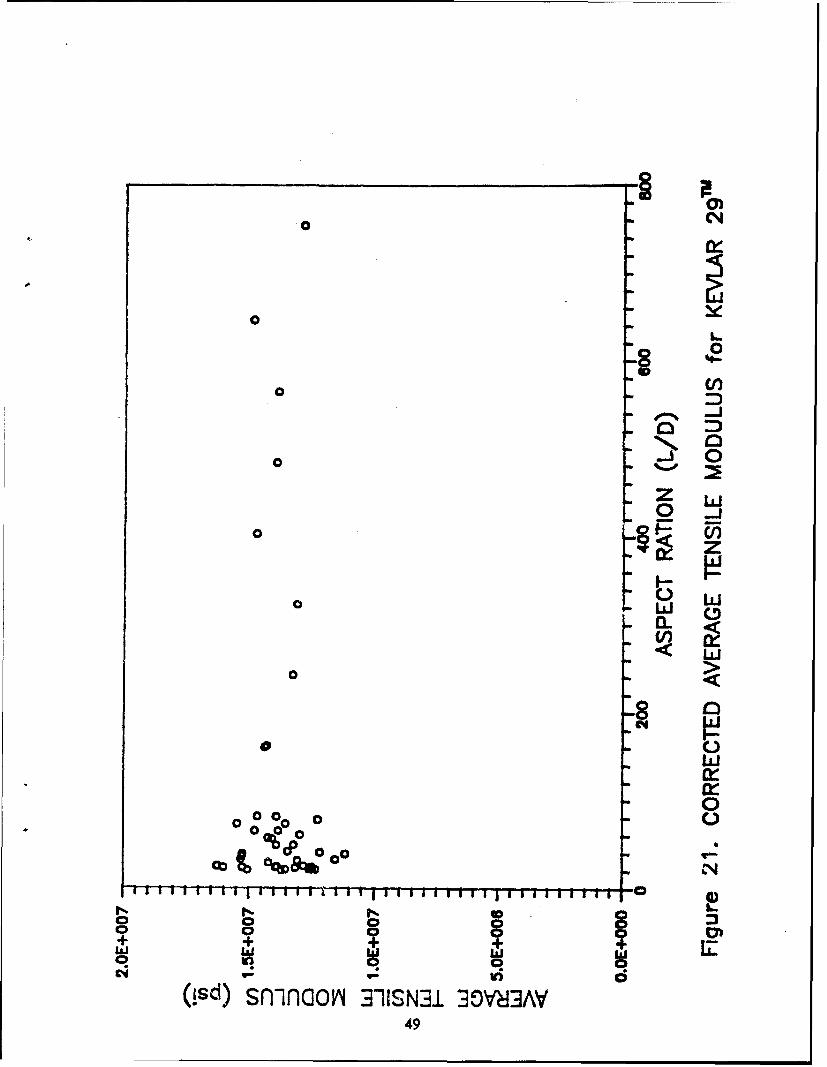
for the data. Using the tensile machine compliance and Eq (5), the corrected tensile moduli
were plotted in Figure 21. The mean corrected tensile modulus was 14.1 with a standard
43
0 c
C4
C0
w z
OV)
000)
C4)
I~ix
00 0
La LV
0 0 o0- 0S 0 0
(!sd) SS~IýS C~insv~rnI"
00
S~cW
0
EEE)
DII
%oO 0
0
00 V)4I I
(isd ss~is ainsi45r
-8
0 (1)DMJ
0
00
0 0<
l<<0
00LL
0 0000 '~
t. 0
o 0 0 z
ILJ IdIdIII 00 0
(!sd) sfliflQON 3-11SN31 LN38VddV 3OVMJJAV
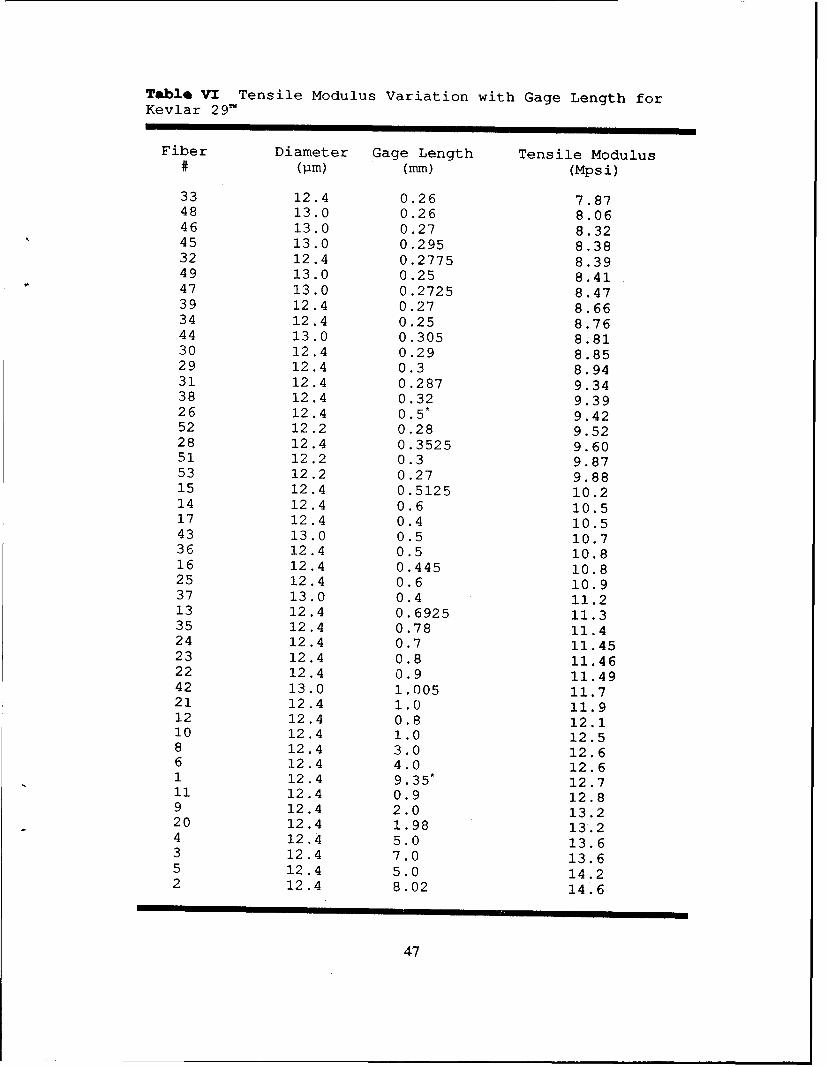
Table VI Tensile Modulus Variation with Gage Length forKevlar 29'
Fiber Diameter Gage Length Tensile Modulus# (pm) (mm) (Mpsi)
33 12.4 0.26 7.8748 13.0 0.26 8.0646 13.0 0.27 8.3245 13.0 0.295 8.3832 12.4 0.2775 8.3949 13.0 0.25 8.4147 13.0 0.2725 8.4739 12.4 0.27 8.6634 12.4 0.25 8.7644 13.0 0.305 8.8130 12.4 0.29 8.8529 12.4 0.3 8.9431 12.4 0.287 9.3438 12.4 0.32 9.3926 12.4 0.5* 9.4252 12.2 0.28 9.5228 12.4 0.3525 9.6051 12.2 0.3 9.8753 12.2 0.27 9.8815 12.4 0.5125 10.214 12.4 0.6 10.517 12.4 0.4 10.543 13.0 0.5 10.736 12.4 0.5 10.816 12.4 0.445 10.825 12.4 0.6 10.937 13.0 0.4 11.213 12.4 0.6925 11.335 12.4 0.78 11.424 12.4 0.7 11.4523 12.4 0.8 11.4622 12.4 0.9 11.4942 13.0 1.005 11.721 12.4 1.0 11.912 12.4 0.8 12.110 12.4 1.0 12.58 12.4 3.0 12.66 12.4 4.0 12.61 12.4 9.35* 12.711 12.4 0.9 12.89 12.4 2.0 13.220 12.4 1.98 13.24 12.4 5.0 13.63 12.4 7.0 13.65 12.4 5.0 14.22 12.4 8.02 14.6
47
0)
0
00LL
a) LLaI.
Ii0 00 W
+ o*ZNO,004
LLI CL
00
~I <
0
oi0n 0 0ha vi~ di 1ah a
48
0
LL
4-3
0 Cr
0~ ui
00
0 0 00
00 00000 1
+N
(!d sn nco 3-SI I jIIIIM IIISII IIIIS-
lw..49
deviation of 1.1 Mpsi.
The shear modulus for Kevlar 29T was unknown, therefore the minimum gage
length required as determined by Eq (3) was unobtainable. Using Eq (2), the maximum
gage length to avoid Euler Buckling was 0.35 mm.
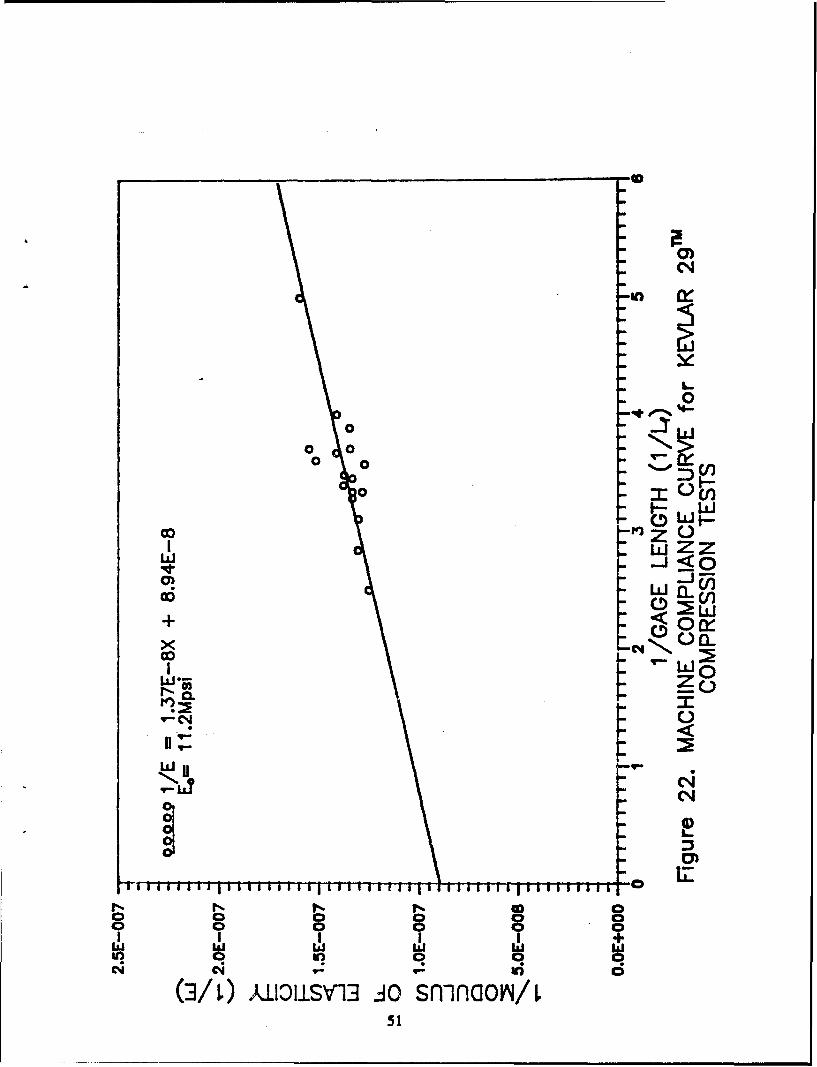
The compression compliance curve, data listed in Table VII, is shown in Figure 22
and yielded a corrected modulus of 11.2 Mpsi and machine compliance of 5,38 x 10"0
in'/lb. The scatter of data as the gage length decreased illustrated a greater sensitivity to a
non-uniform stress distribution and fiber misalignment than for the longer fibers. Using the
tensile machine compliance and Eq (5), the corrected mean compressive modulus was 11.2
Mpsi.
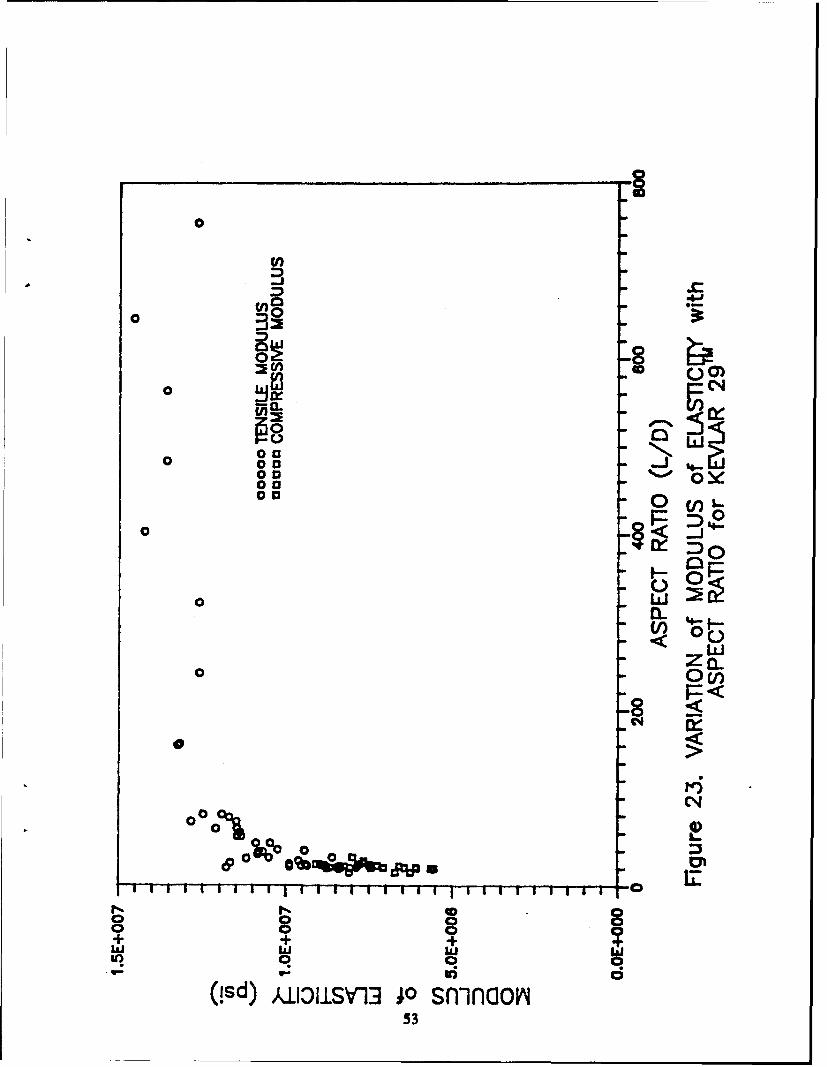
The dependence of the modulus on the gage length was present in both the tension
and compression tests. This is further illustrated by Figure 23 where both the tensile and
compressive moduli were plotted versus the aspect ratio.
50
0
0 -
0 00
0 0 U
1 EDZZLi -j <0
+ <Ork
0
0 - 0 C
Go/>*
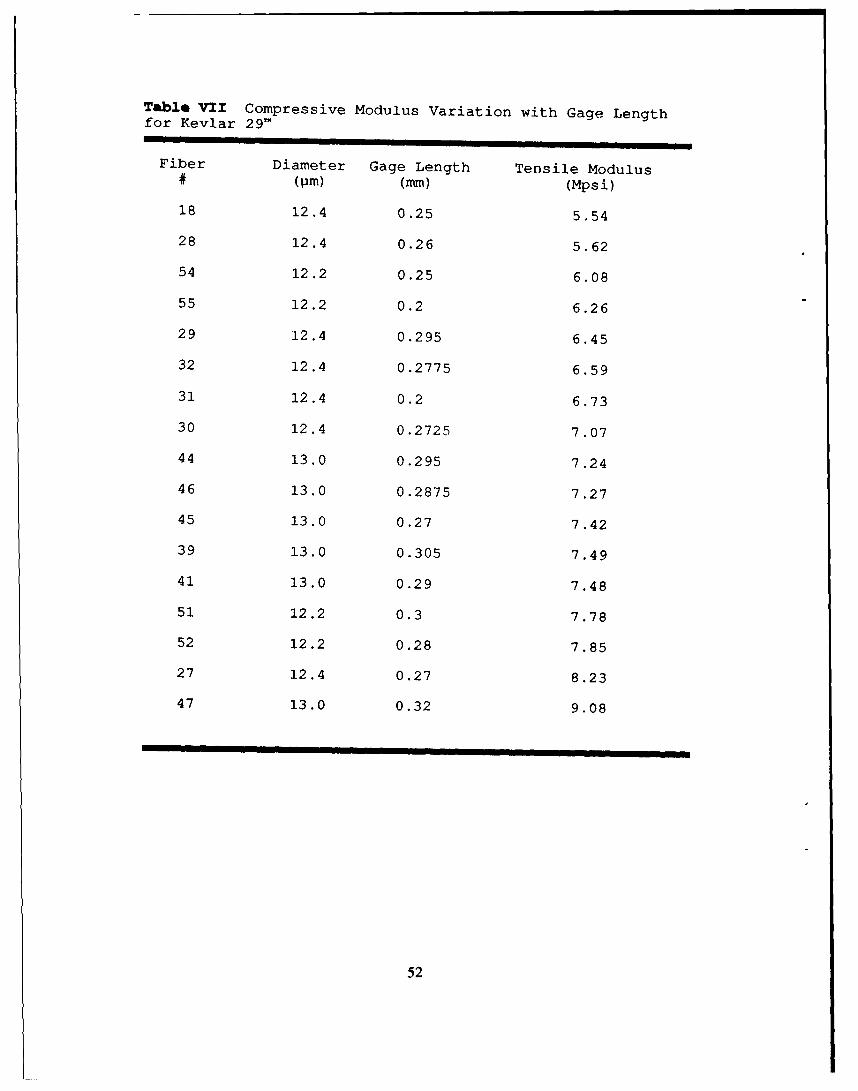
Table VII Compressive Modulus Variation with Gage Lengthfor Kevlar 29"
Fiber Diameter Gage Length Tensile Modulus
# (Pm) (mm) (Mpsi)
18 12.4 0.25 5.54
28 12.4 0.26 5.62
54 12.2 0.25 6.08
55 12.2 0.2 6.26
29 12.4 0.295 6.45
32 12.4 0.2775 6.59
31 12.4 0.2 6.73
30 12.4 0.2725 7.07
44 13.0 0.295 7.24
46 13.0 0.2875 7.27
45 13.0 0.27 7.42
39 13.0 0.305 7.49
41 13.0 0.29 7.48
51 12.2 0.3 7.78
52 12.2 0.28 7.85
27 12.4 0.27 8.23
47 13.0 0.32 9.08
52
BM
o C-)
0000
00
C)
w00 V)
0oc
4*%0%0:
(!sd AlIUSY1 ;o nini53~
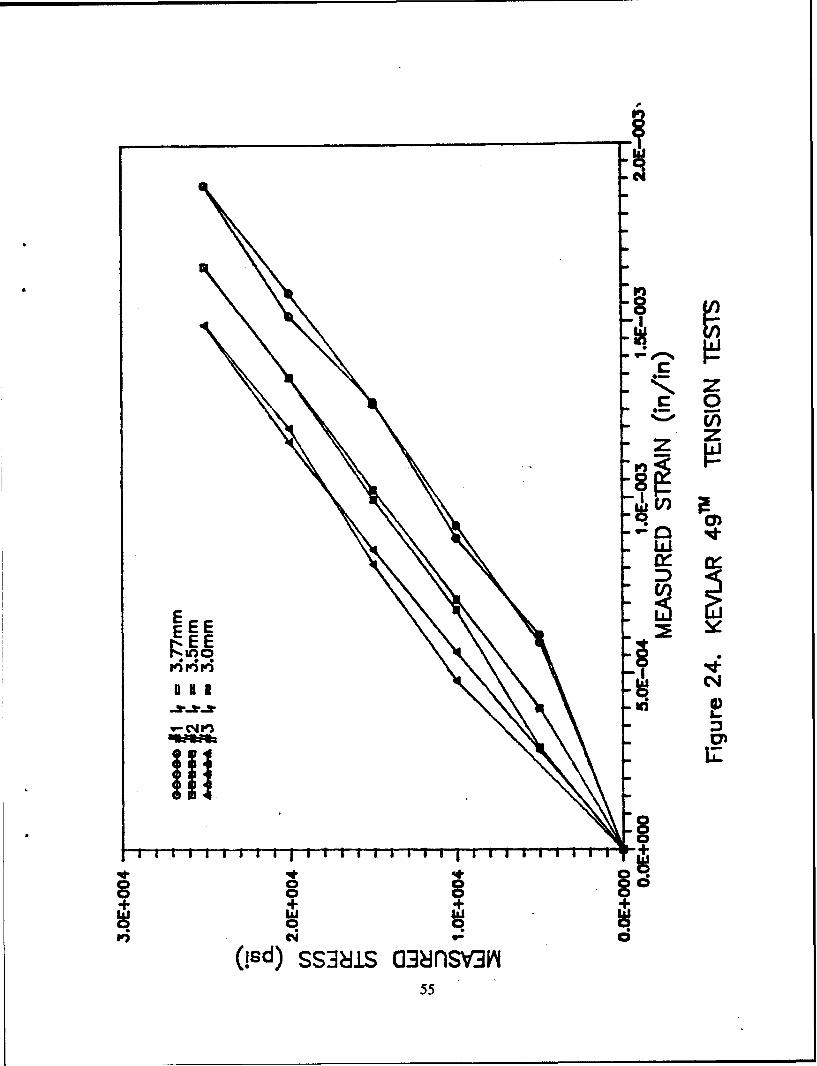
C. Kevlar 49'
To further investigate the reliability of direct compression testing using the MTM-8,
Kevlar 49' as listed in Table VIII, another polymeric fiber, was tested. Representative
tension tests are shown in Figure 24, notice little dependence of the apparent modulus on
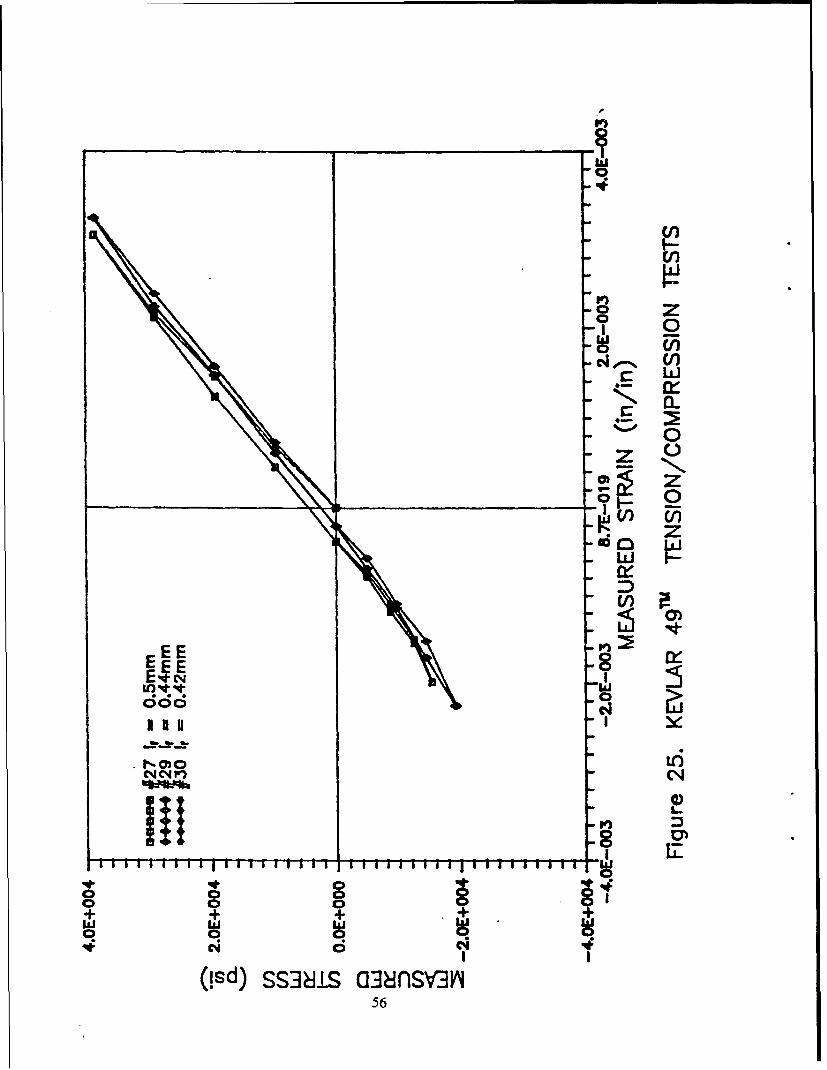
gage lengths greater than 3.0 mm. Conversely, fibers with gage lengths' less than 1.0 mm
had apparent moduli with a strong dependence on the gage length as shown in Figure 25.
The fiber behaved linearly when passing from tensile to compressive loading, therefore in-
dicating equivalent moduli. The compressive failure behavior was the same as the previous
two fibers; therefore, the nonlinearity near the last load increments could not be definitively
attributed to fiber misalignment, nonuniform stress distribution, misreading the gage length
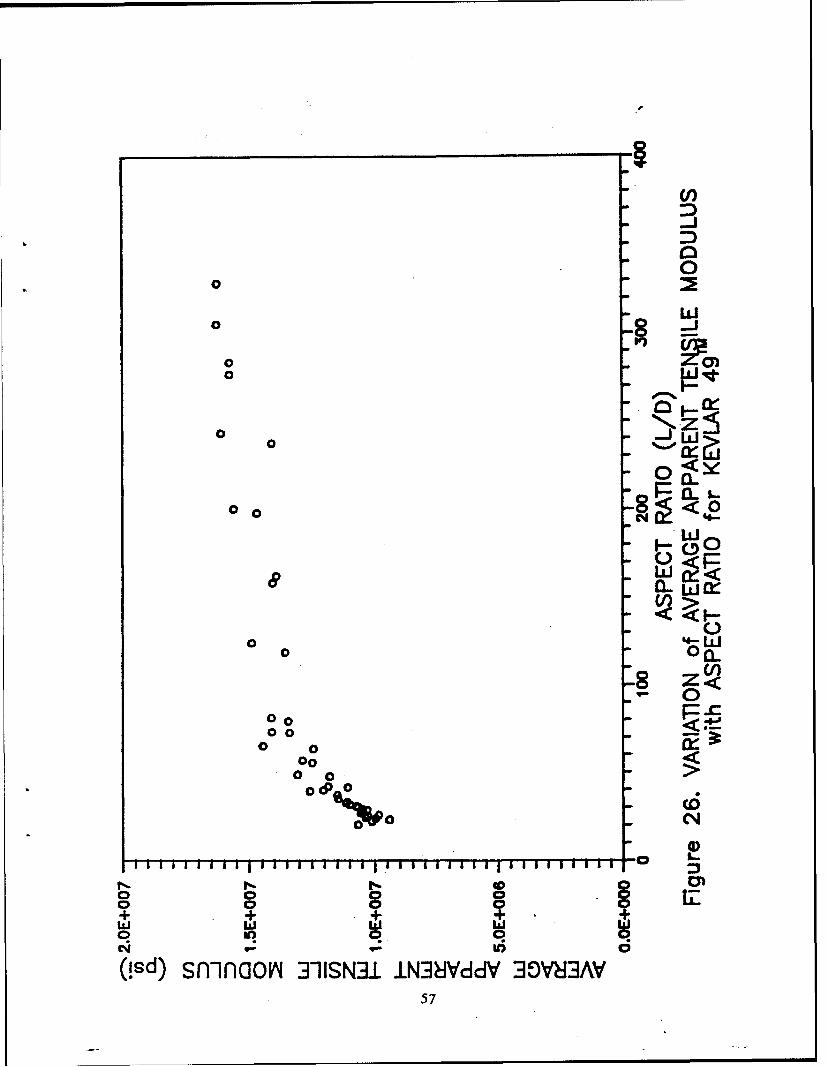
and/or glue slippage. The moduli no longer depended on the gage length when an aspect
ratio of approximately 80, corresponding to a gage length of 0.98 mm, was obtained as
shown in Figure 26. The asymptotic modulus from Figure 26 was approximately 16.0
Mpsi compared to 18.0 Mpsi obtained from Instron measurements. The repeatability of
cyclical loading was demonstrated by the previous two fibers tested and was no longer
questioned. The offset phenomena was again present and followed the same trends
discussed earlier. Just as in the previous two cases, the apparent tensile modulus did not
depend on the fiber diameter which was determined by having no significant change
between the plots of tensile modulus versus aspect ratio and tensile modulus versus gage
length. The machine compliance curve is shown in Figure 27 and resulted in a corrected
tensile modulus of 16.5 Mpsi and machine compliance of 4.70 x IOMo in'/lb. Again, the
scatter of moduli at extremely short gage lengths could not be described by errors in
misreading the gage length or glue slippage, but was attributed to increased sensitivity of
the apparent moduli to the machine compliance and/or fiber misalignment. Using the
tensile machine compliance and Eq (5), the corrected tensile modulus for the fibers in
Figure 26 are shown in Figure 28 and had a mean of 16.5 Mpsi with a standard deviation
of 0.898 Mpsi. The corrected moduli are in agreement with the asymptotic moduli from
54
rO-
EE E
wI iig %
55.
C,.)
000
0~
-460z
ckd 0
En E4I%~ E -
0+ + ++
q N
(!sd) SS3ýiS O138nfsv3ii56
00 2
0
0
0 -ZL
ow~0 0<
C/)P 0L
< o
0 0L
0. 0 a(00
00 +4-1+0 0
6 0 '0
(s)srn-naIor J1ISN~i lN3dVddfV 30V8i3AV57
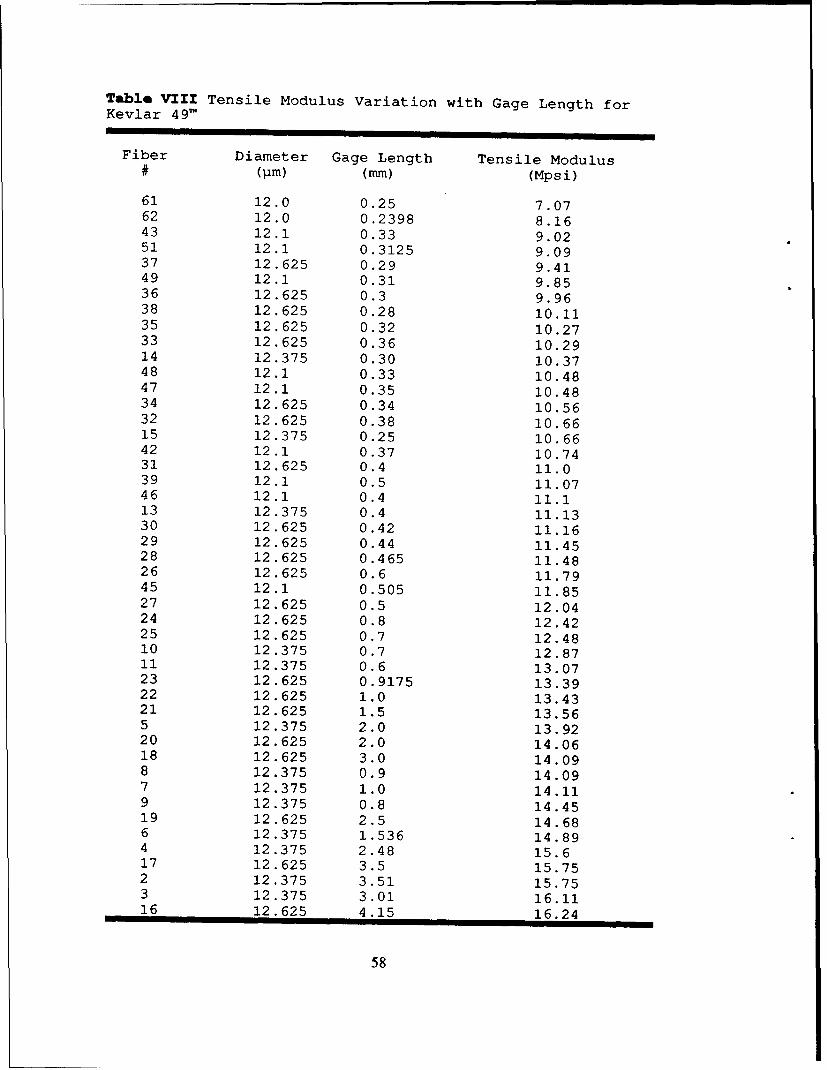
Table VIII Tensile Modulus Variation with Gage Length forKevlar 49"
Fiber Diameter Gage Length Tensile Modulus# (pm) (mm) (Mpsi)
61 12.0 0.25 7.0762 12.0 0.2398 8.1643 12.1 0.33 9.0251 12.1 0.3125 9.0937 12.625 0.29 9.4149 12.1 0.31 9.8536 12.625 0.3 9.9638 12.625 0.28 10.1135 12.625 0.32 10.2733 12.625 0.36 10.2914 12.375 0.30 10.3748 12.1 0.33 10.4847 12.1 0.35 10.4834 12.625 0.34 10.5632 12.625 0.38 10.6615 12.375 0.25 10.6642 12.1 0.37 10.7431 12.625 0.4 11.039 12.1 0.5 11.0746 12.1 0.4 11.113 12.375 0.4 11.1330 12.625 0.42 11.1629 12.625 0.44 11.4528 12.625 0.465 11.4826 12.625 0.6 11.7945 12.1 0.505 11.8527 12.625 0.5 12.0424 12.625 0.8 12.4225 12.625 0.7 12.4810 12.375 0.7 12.8711 12.375 0.6 13.0723 12.625 0.9175 13.3922 12.625 1.0 13.4321 12.625 1.5 13.565 12.375 2.0 13.9220 12.625 2.0 14.0618 12.625 3.0 14.098 12.375 0.9 14.097 12.375 1.0 14.119 12.375 0.8 14.4519 12.625 2.5 14.686 12.375 1.536 14.894 12.375 2.48 15.617 12.625 3.5 15.752 12.375 3.51 15.753 12.375 3.01 16.1116 12.625 4.15 16.24
58
* 0)
0
0L 0
r0
+ U0)NOf
00
00 '<
(3U101Y3-0s-noiWI59
0
000z 0
0 000 ~00
600
Figure 26 which indicated that the apparent moduli were accurately corrected for machine
compliance.
The minimum gage length required to avoid a non-uniform stress distribution
calculated using Eq (3) was 0.19 mm. Using Eq (2), the maximum gage length allowed in
order to prohibit Euler Buckling was 0.4 mm.
The compression measurements for Kevlar 49', listed in Table IX, exhibited some
degree of scatter for extremely short gage lengths. The corrected compressive modulus was
15.3 Mpsi with a machine compliance of 6.08 x 10"° in'/lb as seen in Figure 29. Again,
using the tensile machine compliance and Eq (5) the mean corrected compressive modulus
was 16.9 Mpsi.
61
0
00
Ccn0 00 L
00
a5 0 L.J7
V+ 0 L&~%% cn
ca 00
t CL
V-e
t~. S C
O) 0 0 0
(3/ L) kIZliJSY13 JO sn-iflaon/ L62
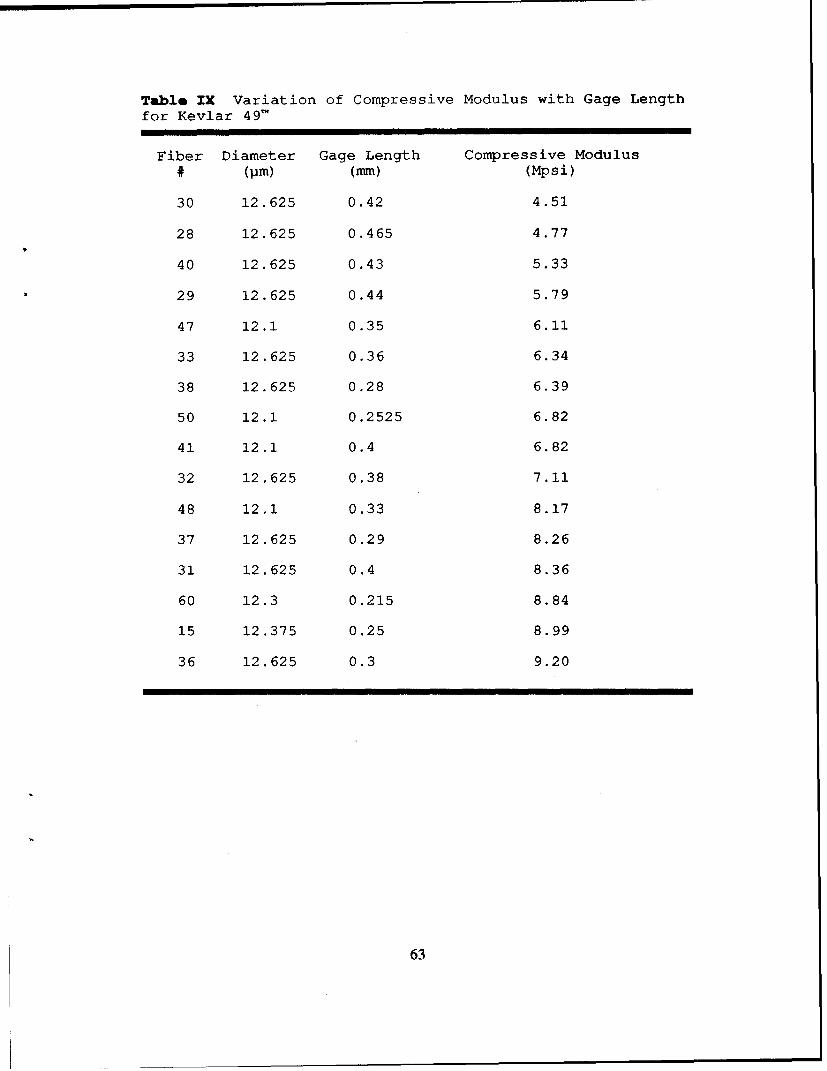
Table IX Variation of Compressive Modulus with Gage Lengthfor Kevlar 492
Fiber Diameter Gage Length Compressive Modulus# (pm) (mm) (Mpsi)
30 12.625 0.42 4.51
28 12.625 0.465 4.77
40 12.625 0.43 5.33
29 12.625 0.44 5.79
47 12.1 0.35 6.11
33 12.625 0.36 6.34
38 12.625 0.28 6.39
50 12.1 0.2525 6.82
41 12.1 0.4 6.82
32 12.625 0.38 7.11
48 12.1 0.33 8.17
37 12.625 0.29 8.26
31 12.625 0.4 8.36
60 12.3 0.215 8.84
15 12.375 0.25 8.99
36 12.625 0.3 9.20
63
D. Carbon
To determine if direct compression testing was effected by the material
characteristics of the fiber, an isotropic vapor grown carbon fiber, courtesy of Applied
Sciences Federated, was tested. Since this was a carbon fiber, the stiffness was expected to
be larger than the previous two fibers; therefore, the fiber would not be as susceptible to
environmental or vibration induced disturbances. The carbon fiber was an experimental
fiber with unknown material properties; this study was the first attempt at characterizing
this fiber.
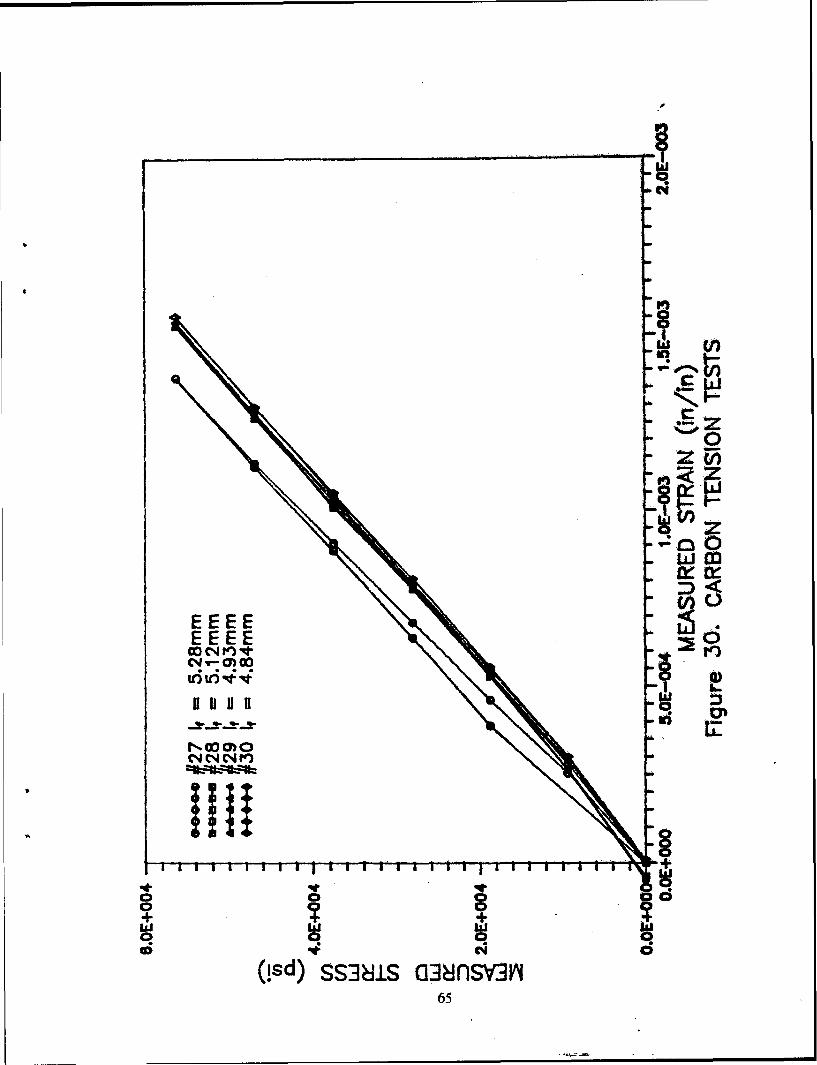
Representative tension tests are illustrated in Figure 30 and results listed in Table
X, all carbon fibers tested had a diameter of 28.6 gm. The slight differences in apparent
moduli of those fibers illustrated in Figure 30 were well within an experimental error of
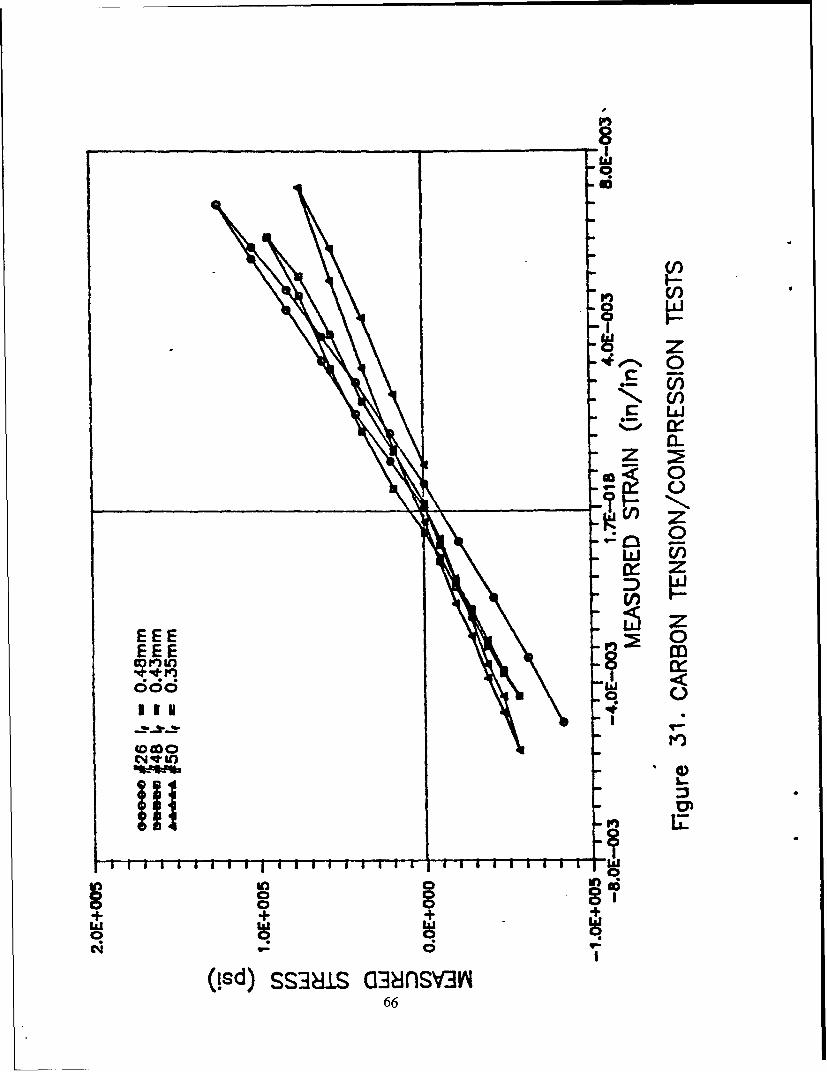
5%; therefore, the modulus did not depend on the gage length. As Figure 31 showed, the
apparent modulus was very dependent on the gage length when the gage length was less
than 1.0 mm. As the gage length decreased, the apparent modulus did also. Since the
gage length dependence was present in the carbon fiber, this phenomenon was not restricted
to anisotropic, polymeric fibers as once thought. The linearity of the complete stress-strain
curves shown in Figure 31 indicated equivalent moduli just as in the previously tested
fibers. Due to the high stiffness of the carbon fiber, tensile and compressivestrengths could
not be determined without reconfiguring the machine. During the compressive loading, no
nonlinear behavior was present. The carbon fiber had the smallest offset from the origin
upon unloading of all the fibers tested. The repeatability of cyclic loading was not in
question since it was proven in the first three fibers tested. From Figure 32, the modulus
lost dependence on the gage length at an aspect ratio of 100 which corresponded to a gage
length of 2.86 mm for a fiber diameter of 28.6 gim. The asymptotic modulus from Figure
32 was approximately 37.0 Mpsi.
The carbon fiber had what is called an onion skin structure. An onion is composed
of many concentric layers of material with a finite gap between each layer; the carbon fiber
was analogous, and as the diameter of the fiber increased so did the gaps between
64
I W
01, S
1)0E EE EE E EEcc N ) 14
ca d
(!sd) SS3ý1S GJ1JflsvJY65
-0Iii
qz
Ir
z :
ini
0~
E EE m 0E EE 0
666; -W
33H I
~ooo
In 0 in0 08C 0+ + +
(Isd) SS3&±S C]38nsv3Yr66
-8C/)
0 00
00
0
z0
0 <0
o-
ooa
0 00
0
00 0 o-s
0 !
CL o0 0
LL0 0--
oo0 0 0 <i
oo0 0 0 0
+++ + + ~ +
(!sd) sflinfloVi 3-1ISNJI J±N3NVddV 30V83AV67
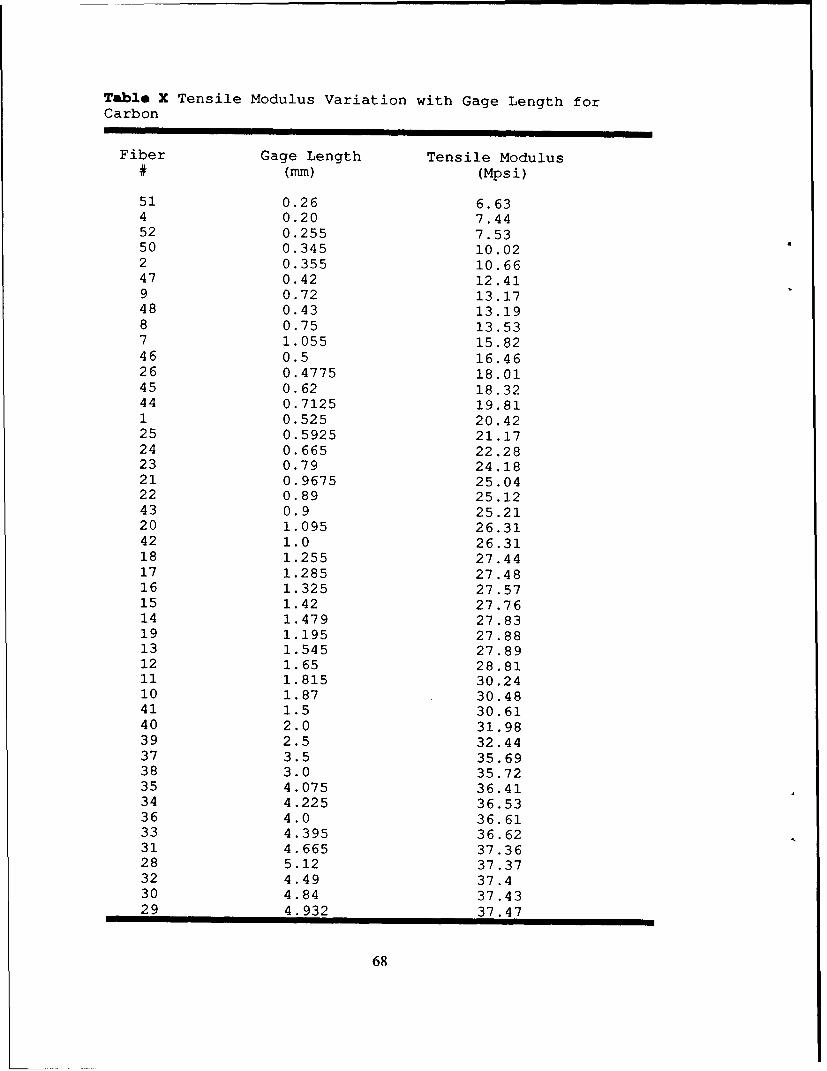
Table X Tensile Modulus Variation with Gage Length forCarbon
Fiber Gage Length Tensile Modulus# (mm) (Mpsi)
51 0.26 6.634 0.20 7.4452 0.255 7.5350 0.345 10.022 0.355 10.6647 0.42 12.419 0.72 13.1748 0.43 13.198 0.75 13.537 1.055 15.8246 0.5 16.4626 0.4775 18.0145 0.62 18.3244 0.7125 19.811 0.525 20.4225 0.5925 21.1724 0.665 22.2823 0.79 24.1821 0.9675 25.0422 0.89 25.1243 0.9 25.2120 1.095 26.3142 1.0 26.3118 1.255 27.4417 1.285 27.4816 1.325 27.5715 1.42 27.7614 1.479 27.8319 1.195 27.8813 1.545 27.8912 1.65 28.8111 1.815 30.2410 1.87 30.4841 1.5 30.6140 2.0 31.9839 2.5 32.4437 3.5 35.6938 3.0 35.7235 4.075 36.4134 4.225 36.5336 4.0 36.6133 4.395 36.6231 4.665 37.3628 5.12 37.3732 4.49 37.430 4.84 37.4329 4.932 37.47
68
layers (20). The gaps between layers don't support any load; therefore, the moduli would
be lower for the fibers of larger diameter regardless of the gage length.
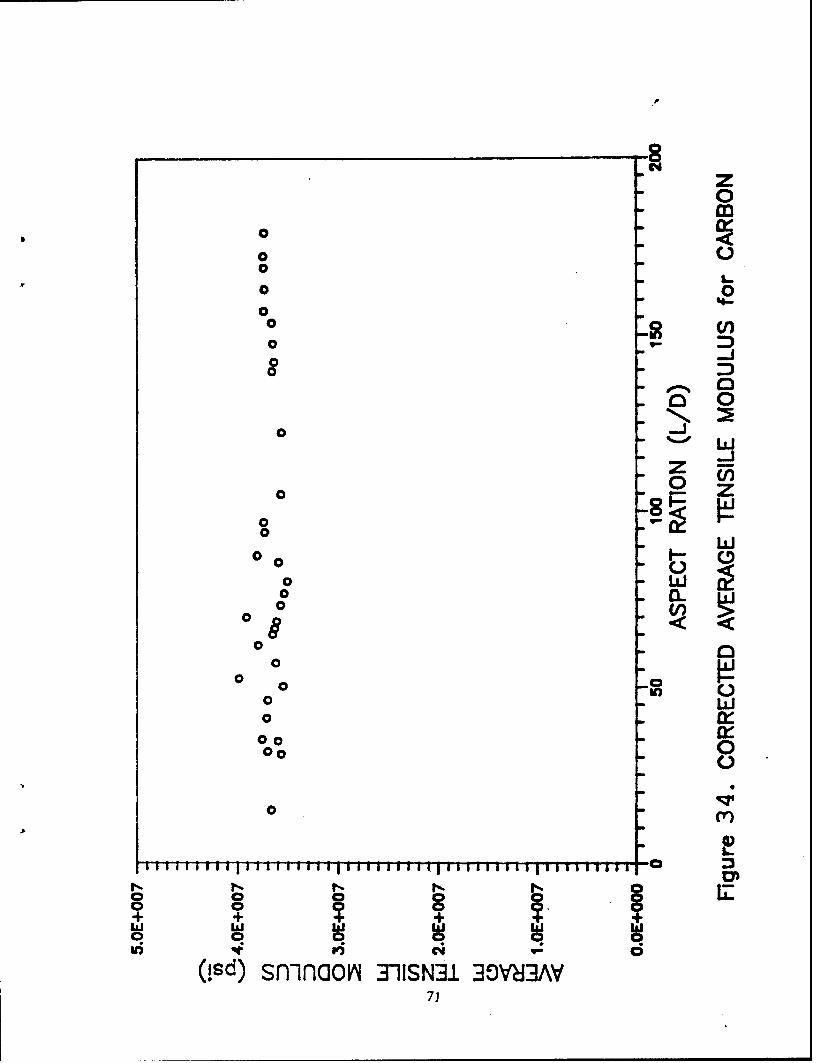
The machine compliance curve shown in Figure 33 yielded a corrected tensile
modulus of 36.4 Mpsi and a machine compliance of 4.48 x 10"1 in'/lb. The carbon fiber
didn't vary from the linear relation as the gage lengths become significantly small;
therefore, determining if any error due to misreading the gage length and/or glue slippage
was present could not be determined. The square data points represent moduli which don't
depend on the gage length; they aren't included in the linear curve. Using the tensile
machine compliance and Eq (5), the apparent moduli of Figure 32 were corrected and are
shown in Figure 34. The mean corrected tensile modulus was 36.4 Mpsi with a standard
deviation of 1.0 Mpsi.
The carbon fiber was assumed isotropic since no evidence was available to con-
tradict this assertion (20). By St. Venant's Principle, the minimum gage length required to
avoid end effects was 0.286 mm for a 28.6 Itm diameter fiber. From the Euler Buckling
analysis using Eq (2), the maximum gage length allowable to preclude buckling was 0.97
mm.
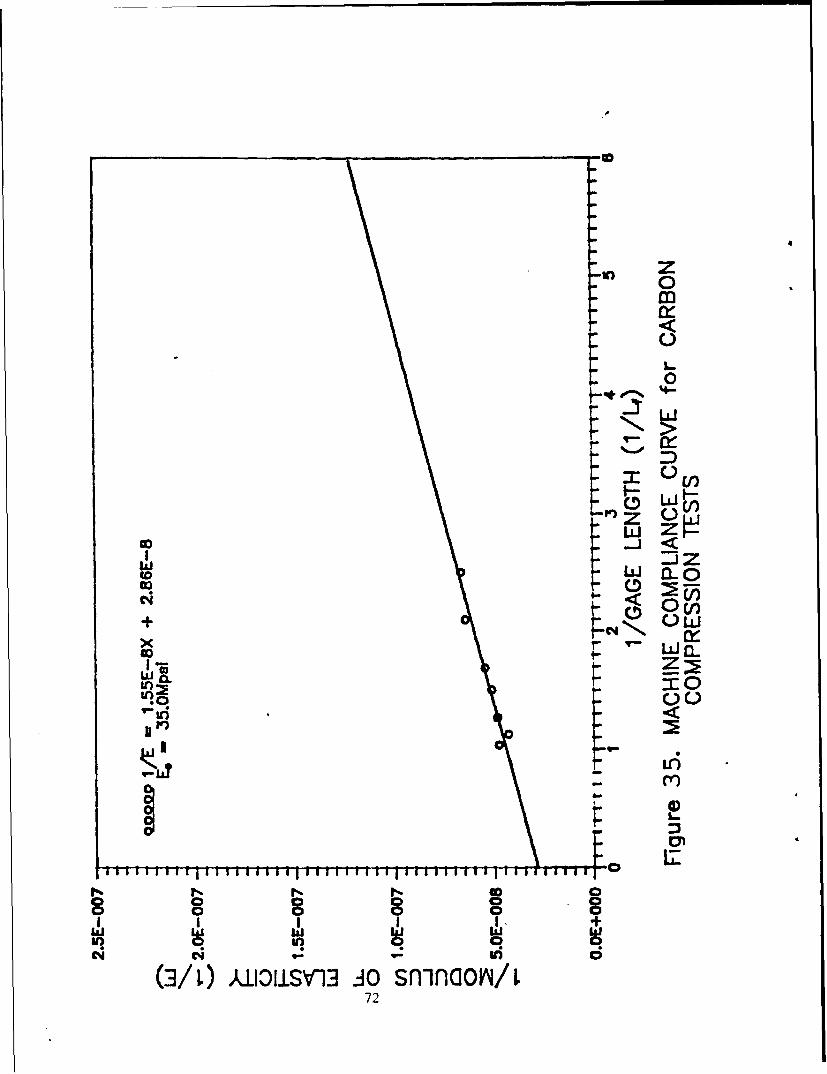
The machine compliance from the compression tests, data listed in Table XI, is
illustrated in Figure 35 and yielded a corrected compressive modulus of 35.0 Mpsi and a
machine compliance of 6.10 x 10¹⁰ in'/lb. The scatter in moduli was much smaller for the
carbon fiber than the other three fibers which might be due to the larger diameter and
greater stiffness or less sensitivity to maclihie compliance and/or fiber misalignment.
Finally, using the tensile machine compliance and Eq (5), the mean corrected moduli was
28.5 Mpsi. Since this fiber had not been previously characterized, the difference between
the corrected tensile and compressive moduli might be real. However, the gage lengths for
the compression test were in some cases twice as large as the those used for the preceding
fibers; therefore, the carbon fibers tested in compression might have bowed due to eccentric
loading or fiber misalignment.
69
zm0:
0
<C.)
<Z
0Z <
00
00 0
3. z0~ P28*1)
(J/I.A±I~Iswu .o snL4o./1Oft
-~ z0
0%
0
01
00
-AJ
80%
z -J00 0 a
0 L
0
04
000
000
0 L0
0
aY)
o 0 0+ + 7 71 -
(!sd) sn-inaoor 311SN31 30V83AV71
0
m.
0
I~ELi
Go <0 < V)C
0 00cC- 0 I I
x LLI X
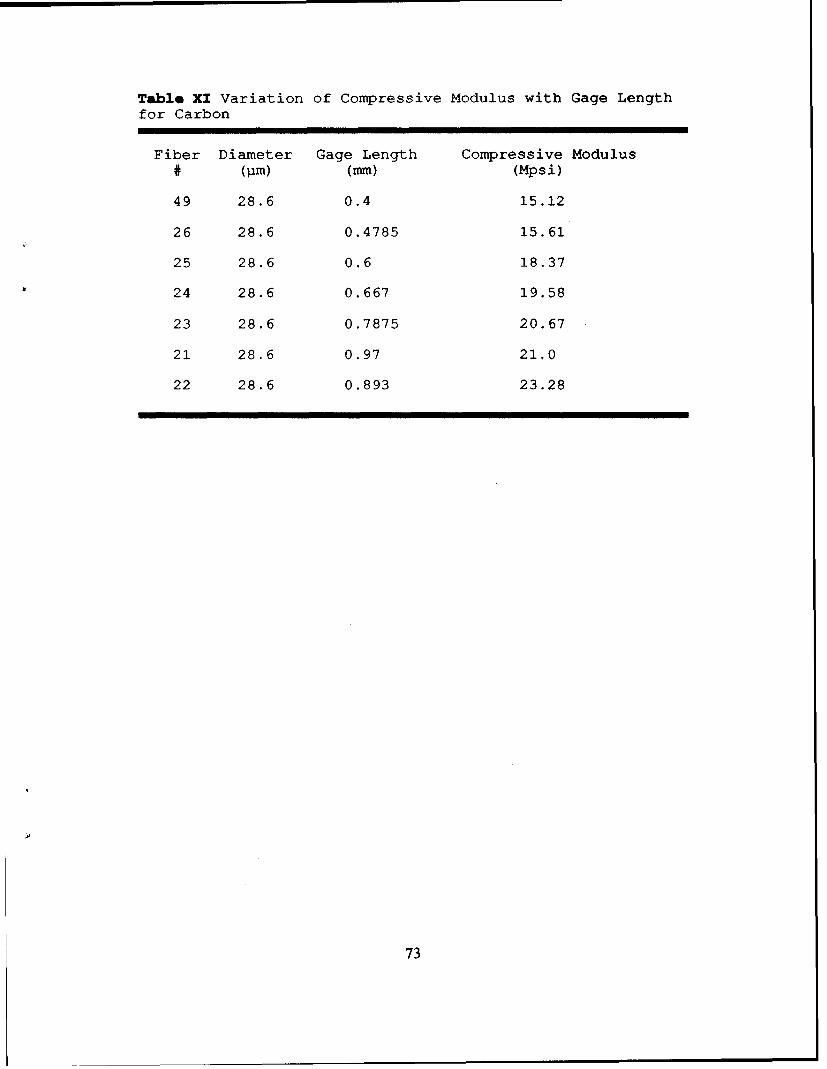
Table XI Variation of Compressive Modulus with Gage Lengthfor Carbon
Fiber Diameter Gage Length Compressive Modulus# (Pm) (mm) (Mpsi)
49 28.6 0.4 15.12
26 28.6 0.4785 15.61
25 28.6 0.6 18.37
24 28.6 0.667 19.58
23 28.6 0.7875 20.67
21 28.6 0.97 21.0
22 28.6 0.893 23.28
73
SECTION V
DISCUSSION
A. Error Possibilities
The PBO 8A, Kevlar 29', Kevlar 49TM, and Carbon fibers all qualitatively behaved
similarly through the various tests. The three polymeric fibers were expected to perform
similarly since they all were anisotropic; however, the isotropic carbon fiber acted just as
the polymer fibers with respect to the moduli depending on the gage length and being
effected possible glue deformation. The latter of the two phenomena was evident by the
strain offset at zero load. The anisotropy of the polymer fibers did not seem to play a
significant role in any of the tests.
The compliance curves for each fiber in tension and compression did result in
slightly varying value for the machine compliance. In tension, the mean machine
compliance was 4.74 x 10"1 in3/lb with a standard deviation of 2.50 x 10" in'/lb; but in
compression, they were 5.69 x 10"1 in'flb and 4.60 x 10.1 inWlb, respectively. The true
machine compliance should be constant but the overall "machine compliance" did vary in
magnitude in tension and compression possibly due to glue deformation.
In trying to account for the variation of modula for the polymeric fibers of
extremely small gage lengths, misreading the gage length and fiber slippage have been
examined. From the earlier discussion each would only decrease, with no evidence to
expect an increase, the measured moduli. Recall the data points below the linear curve in
each of the polymeric fibers' compliance curves. As a result, the increase in moduli at
shorter gage lengths for the polymeric fibers was inexplicable by these two theories. Error
in modulus due to misreading the gage length and/or fiber slippage wasn't determined since
none of the fibers definitively behaved in a manner which was predicted by either theory.
As discussed earlier, the fiber is composed of fibril, and the fibril is composed of
microfibril as shown in Figure 36. The inter-element composition is inherent to polymeric
fibers. Due to the orientation of the fibril and microfibril in the fiber, the fiber may
experience micro-buckling of the microfibril followed by the fibril when compressively
74
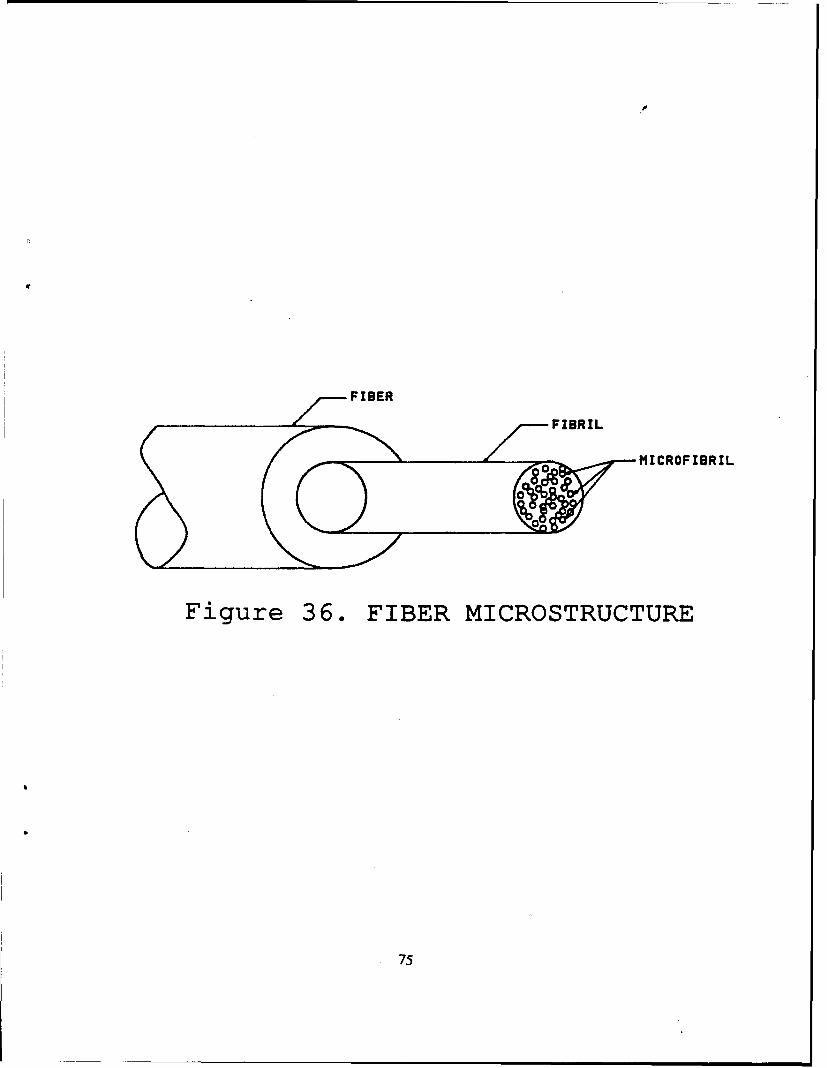
,, _lFIBER
FIBRIL ICROFIBRIL
Figure 36. FIBER MICROSTRUCTURE
75
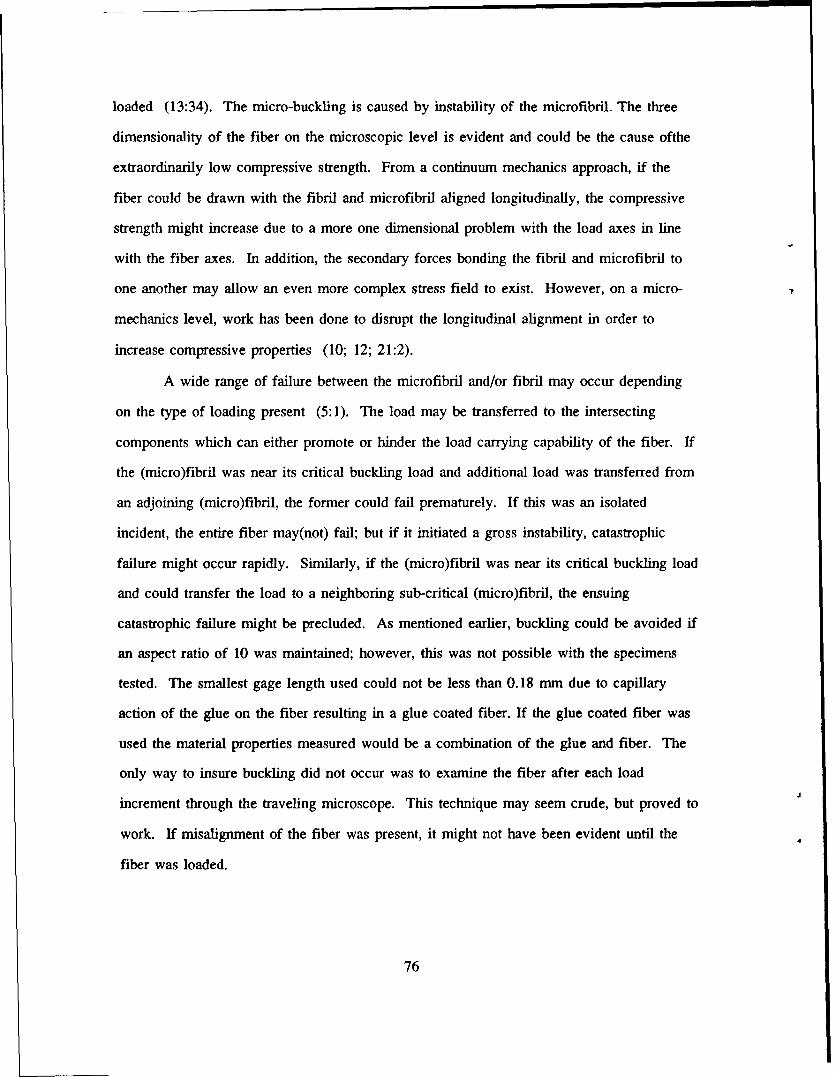
loaded (13:34). The micro-buckling is caused by instability of the microfibril. The three
dimensionality of the fiber on the microscopic level is evident and could be the cause ofthe
extraordinarily low compressive strength. From a continuum mechanics approach, if the
fiber could be drawn with the fibril and microfibril aligned longitudinally, the compressive
strength might increase due to a more one dimensional problem with the load axes in line
with the fiber axes. In addition, the secondary forces bonding the fibril and microfibril to
one another may allow an even more complex stress field to exist. However, on a micro-
mechanics level, work has been done to disrupt the longitudinal alignment in order to
increase compressive properties (10; 12; 21:2).
A wide range of failure between the microfibril and/or fibril may occur depending
on the type of loading present (5:1). The load may be transferred to the intersecting
components which can either promote or hinder the load carrying capability of the fiber. If
the (micro)fibril was near its critical buckling load and additional load was transferred from
an adjoining (micro)fibril, the former could fail prematurely. If this was an isolated
incident, the entire fiber may(not) fail; but if it initiated a gross instability, catastrophic
failure might occur rapidly. Similarly, if the (micro)fibril was near its critical buckling load
and could transfer the load to a neighboring sub-critical (micro)fibril, the ensuing
catastrophic failure might be precluded. As mentioned earlier, buckling could be avoided if
an aspect ratio of 10 was maintained; however, this was not possible with the specimens
tested. The smallest gage length used could not be less than 0.18 mm due to capillary
action of the glue on the fiber resulting in a glue coated fiber. If the glue coated fiber was
used the material properties measured would be a combination of the glue and fiber. The
only way to insure buckling did not occur was to examine the fiber after each load
increment through the traveling microscope. This technique may seem crude, but proved to
work. If misalignment of the fiber was present, it might not have been evident until the
fiber was loaded.
76
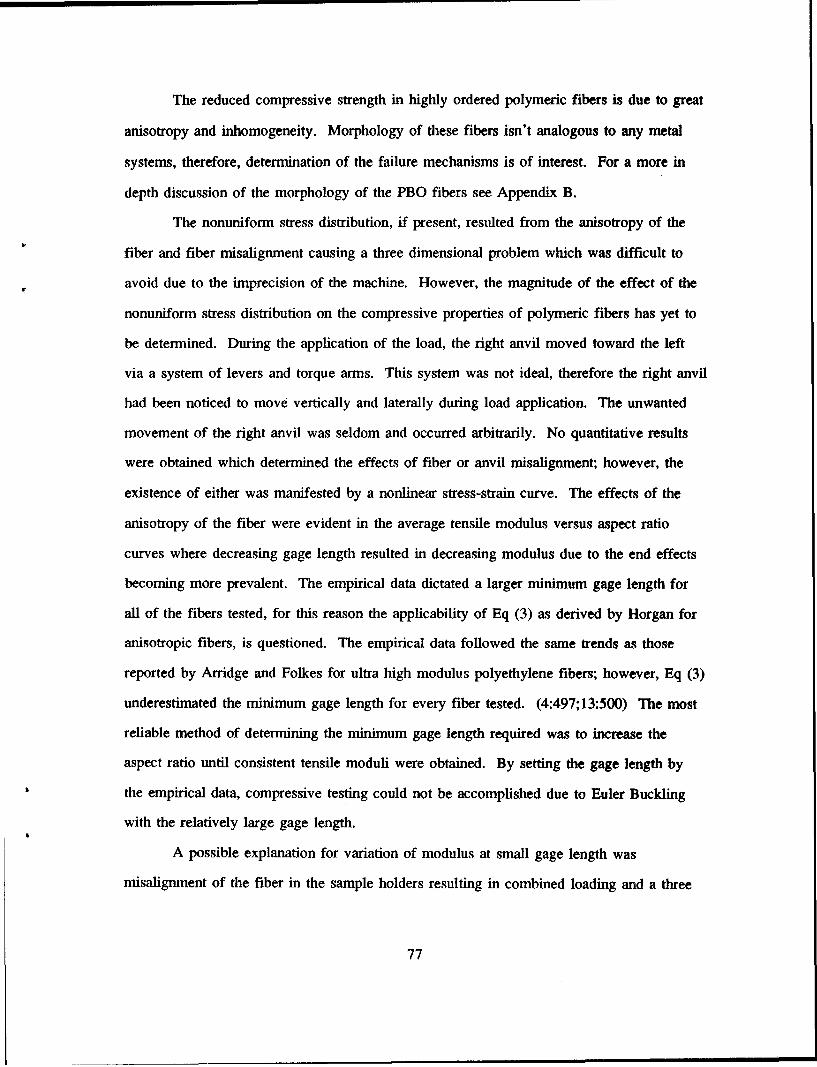
The reduced compressive strength in highly ordered polymeric fibers is due to great
anisotropy and inhomogeneity. Morphology of these fibers isn't analogous to any metal
systems, therefore, determination of the failure mechanisms is of interest. For a more in
depth discussion of the morphology of the PBO fibers see Appendix B.
The nonuniform stress distribution, if present, resulted from the anisotropy of the
fiber and fiber misalignment causing a three dimensional problem which was difficult to
avoid due to the imprecision of the machine. However, the magnitude of the effect of the
nonuniform stress distribution on the compressive properties of polymeric fibers has yet to
be determined. During the application of the load, the right anvil moved toward the left
via a system of levers and torque arms. This system was not ideal, therefore the right anvil
had been noticed to move vertically and laterally during load application. The unwanted
movement of the right anvil was seldom and occurred arbitrarily. No quantitative results
were obtained which determined the effects of fiber or anvil misalignment; however, the
existence of either was manifested by a nonlinear stress-strain curve. The effects of the
anisotropy of the fiber were evident in the average tensile modulus versus aspect ratio
curves where decreasing gage length resulted in decreasing modulus due to the end effects
becoming more prevalent. The empirical data dictated a larger minimum gage length for
all of the fibers tested, for this reason the applicability of Eq (3) as derived by Horgan for
anisotropic fibers, is questioned. The empirical data followed the same trends as those
reported by Arridge and Folkes for ultra high modulus polyethylene fibers; however, Eq (3)
underestimated the minimum gage length for every fiber tested. (4:497;13:500) The most
reliable method of determining the minimum gage length required was to increase the
aspect ratio until consistent tensile moduli were obtained. By setting the gage length by
the empirical data, compressive testing could not be accomplished due to Euler Buckling
with the relatively large gage length.
A possible explanation for variation of modulus at small gage length was
misalignment of the fiber in the sample holders resulting in combined loading and a three
77
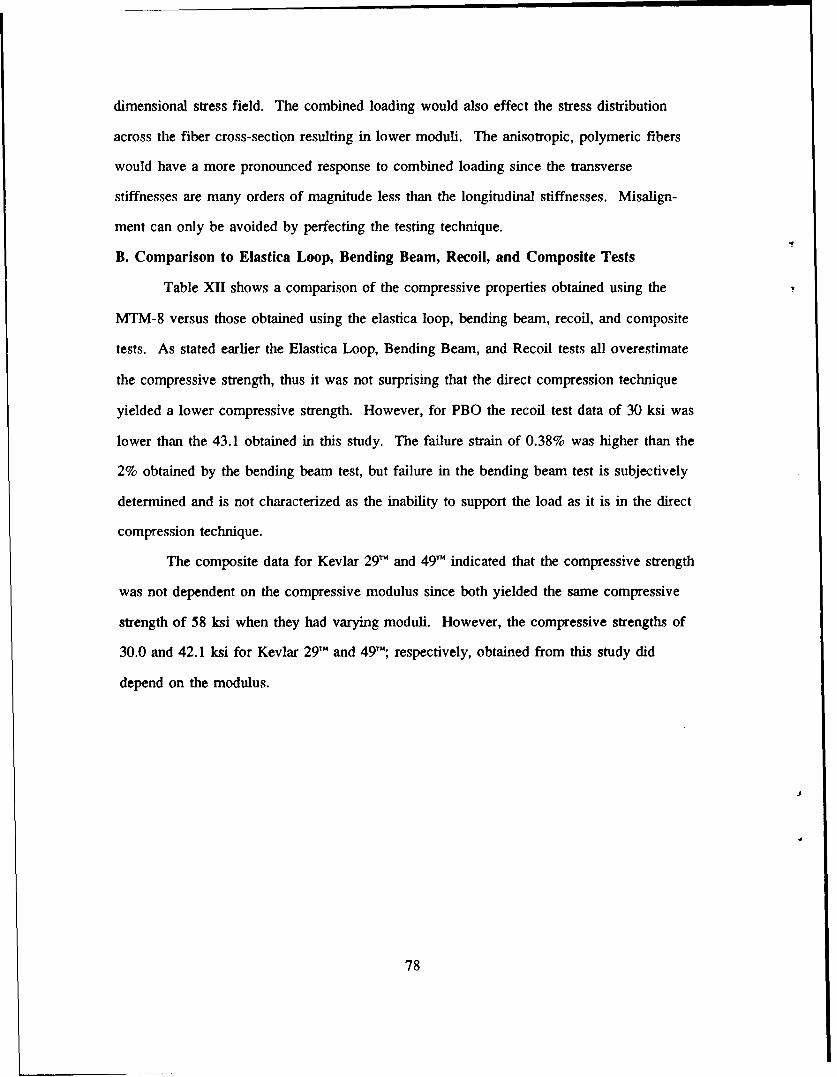
dimensional stress field. The combined loading would also effect the stress distribution
across the fiber cross-section resulting in lower moduli. The anisotropic, polymeric fibers
would have a more pronounced response to combined loading since the transverse
stiffnesses are many orders of magnitude less than the longitudinal stiffnesses. Misalign-
ment can only be avoided by perfecting the testing technique.
B. Comparison to Elastica Loop, Bending Beam, Recoil, and Composite Tests
Table XII shows a comparison of the compressive properties obtained using the
MTM-8 versus those obtained using the elastica loop, bending beam, recoil, and composite
tests. As stated earlier the Elastica Loop, Bending Beam, and Recoil tests all overestimate
the compressive strength, thus it was not surprising that the direct compression technique
yielded a lower compressive strength. However, for PBO the recoil test data of 30 ksi was
lower than the 43.1 obtained in this study. The failure strain of 0.38% was higher than the
2% obtained by the bending beam test, but failure in the bending beam test is subjectively
determined and is not characterized as the inability to support the load as it is in the direct
compression technique.
The composite data for Kevlar 29TM and 49TM indicated that the compressive strength
was not dependent on the compressive modulus since both yielded the same compressive
strength of 58 ksi when they had varying moduli. However, the compressive strengths of
30.0 and 42.1 ksi for Kevlar 29TM and 49"'; respectively, obtained from this study did
depend on the modulus.
78
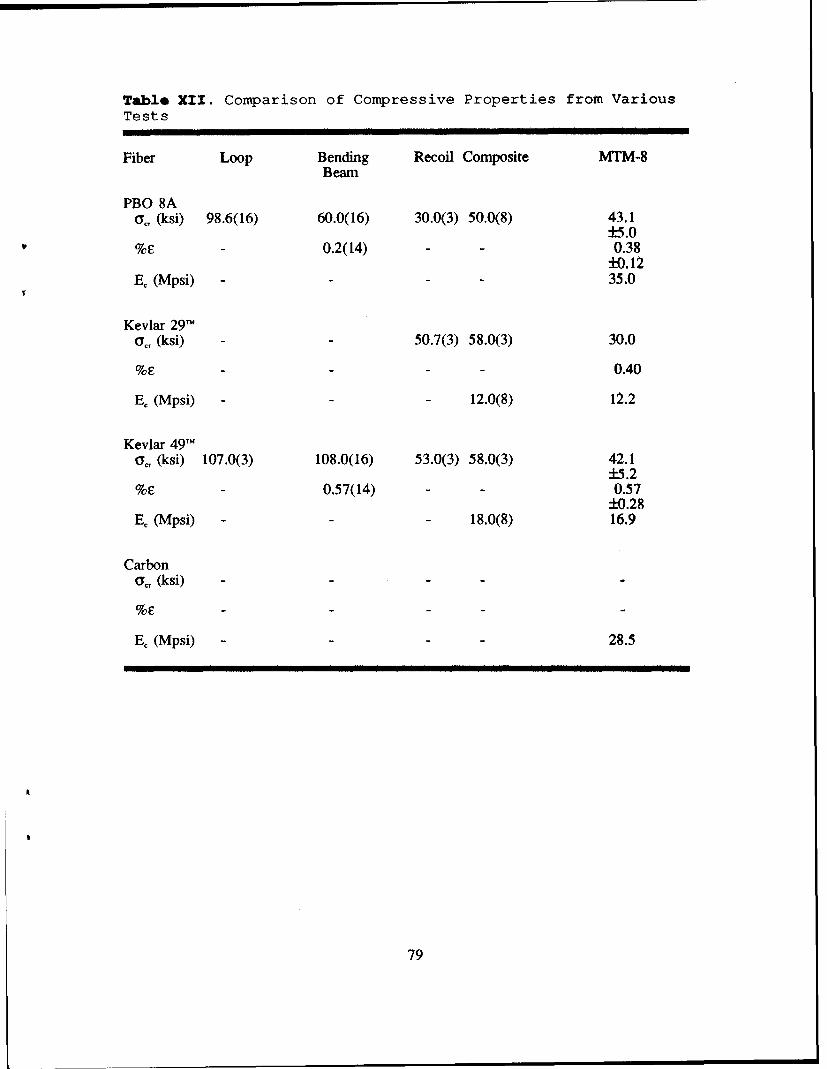
Table XII. Comparison of Compressive Properties from VariousTests
Fiber Loop Bending Recoil Composite MTM-8Beam
PBO 8Aa, (ksi) 98.6(16) 60.0(16) 30.0(3) 50.0(8) 43.1
±5.0%F - 0.2(14) - 0.38
±0.12E, (Mpsi) - - - 35.0
Kevlar 29"'
(Y, (ksi) - - 50.7(3) 58.0(3) 30.0
%- - - 0.40
E, (Mpsi) -- 12.0(8) 12.2
Kevlar 49T"(y, (ksi) 107.0(3) 108.0(16) 53.0(3) 58.0(3) 42.1
±5.2% - 0.57(14) - 0.57
±0.28E. (Mpsi) - - 18.0(8) 16.9
Carbona., (ksi) -
%E
E, (Mpsi) 28.5
79
SECTION VI
CONCLUSION
The ability of the MTM-8 to determine the compressive properties of high
performance composite fibers was explored. The full stress-strain curves exhibited linear
behavior when crossing the origin indicating equivalent tensile and compressive moduli.
To account for the machine compliance, fibers of varying gage length were tested in both
tension then compression to obtain tensile and compressive moduli. By plotting the inverse
of the modulus versus inverse of the gage length the machine compliance and corrected
modulus were obtained. The mean machine compliance was 4.74 x 10"1 in'/Ab with a stan-
dard deviation of 2.50 x 10l" in'/Ib in tension and 5.69 x l0' in'/lb and 4.60 x 10" in'/lb
in compression; respectively. The corrected moduli for PBO, Kevlar 29TM, Kevlar 29T, and
were 35.0, 12.2, 16.9, and 28.5 Mpsi; respectively. Due to the consistency and reliability
of the tension test data, the corrected compressive moduli were calculated using the tensile
machine compliance. The compressive strengths, following the same order, were 43.1,
30.0, 42.1 ksi; the compressive strength for carbon was not determined. The possible
errors investigated were misreading the gage length, fiber slippage, glue deformation, non-
uniform stress distribution, and fiber misalignment. A quantitative determination of
misreading the gage length and fiber slippage was inconclusive. The glue deformation and
nonuniform stress distribution, the existence of one or both was supported by the varying
machine compliance during the tension and compression testing, could not be separated
from the machine compliance. Analytically quantifying the minimum gage length required
to avoid end effects consistently underestimated the length needed. Empirical quantification
was obtained by plotting the average tensile moduli versus the aspect ratio, from this curve
a minimum gage length, determined when the variation of moduli was marginal, was
determined. The minimum gage length needed to avoid end effects was large enough to
allow Euler Buckling if the fiber had been tested in compression at this long gage length.
80
Fiber misalignment was the largest error factor. Misaligning the fiber in the sample holders
would cause a three dimensional stress field which not only increased the complexity of the
analysis, but also reduced the tensile and compressive properties. Misalignment of the
fibers in tension testing did not have as large an effect as in compression. At the smaller
gage lengths, variation of both the tensile and compressive moduli was present in the
compliance curves even for fibers that were believed to be aligned properly. The variation
might still be due to misalignment because the misalignment might not be visible with the
100x travelling microscope. If the fiber was misaligned by less than 2.5 pim, the misalign-
ment would go undetected. The fiber diameters ranged from 12.2 - 35.3 gim, therefore the
eccentricity of the load caused by the misalignment would have had a substantial effect on
the stress field given the small dimension of the fiber. The effects of error caused by
misalignment could be lessened by increasing the number of tests for a given fiber until
consistent results are obtained. The larger the test sample, the less likely small degrees of
misalignment would effect the extrapolated values of moduli and the statistical mean of the
compressive strength.
The MTM-8 is very labor intensive. To obtain consistent and reliable moduli from
the compliance curves and compressive strength from the compression tests, one hundred or
more fibers needed to be tested. Towards the latter stages of testing when efficiency of the
technique was highest, each test took approximately twenty minutes. Thus, for each fiber,
thirty-three hours or more would be needed to obtain reliable and consistent results. The
MTM-8 would be more appropriately used to first determine if the fiber behaves linearly
when transitioning from tensile to compressive loading. If the linear relation exists, the
compressive modulus is equal to the tensile and a less time consuming and reliable
techniques are available to determine the tensile modulus. Determining the compressive
strength would involve testing enough fibers to obtain consistent results within a defined
tolerance. When the fibers were mounted in the sample holders without misalignment, the
values of compressive strength are very consistent yielding errors of less than 5% with
81
respect to one another.
The MTM-8 adequately characterizes fiber compressive behavior more so than the
elastica loop, bending beam, and recoil tests. The possibilities of error are user controlled
in the former but not so in the latter three tests. Given adequate time to become proficient
in the testing technique, the accuracy of the results using the MTM-8 are incontestable.
82
SECTION VII
FUTURE WORK
The reliability of direct compression testing of high performance composite fibers
could be greatly increased if fiber alignment in the sample holders could be guaranteed. In
addition, the nonuniform stress distribution and/or glue deformation in fibers with extremely
short gage length needed accurately defined. Euler Buckling could be avoided if aspect
ratios less than 10 were used when possible.
To further explore the use of the Tecam Micro-Tensile Testing machine for direct
compression testing of composite fibers, the following modifications should be considered.
The single most needed improvement to the MTM-8 is to increase the magnification power
of the travelling microscope. If the power could be increased to say 200x, the possibility
of misaligning the fiber is greatly reduced; therefore, decreasing the number of tests needed
to obtain reliable results. In addition, if a video camera to the travelling microscope would
allow constant monitoring of the fiber while under load, thus kinkband formation and
propagation would be visible. This capability would allow compressive failure mechanisms
to be studied, thereby gaining a better understanding of compressive failure behavior. With
knowledge of kinkband formation, non-linearities in the stress-strain curve could be sighted,
thus giving a more accurate characterization; and ultimately leading toward the
improvement of polymer fiber compressive strength.
83
REFERENCES
1. Adams, W.W., T. Grieshop, T. Helminiak, M. Hunsaker, J.F. O'Brien, M. Altieri, S.J.Bai, M. Brandt, A.V. Fratini, W-F. Hwang, T. Haddock, S.J. Krause, and P.G. Lenhert,"Processing, Properties, Structure, and Morphology of PBO and ABPBO Polymer Fibers",AFWAL-TR-86-4011, 1986.
2. Allen, Steven R., "Mechanical and Morphological Correlations in Poly(p-phenylenebenzobisthiazole) Fibers", AFWAL-TR-83-4065, July 1983.
3. Allen, Steven R., "Tensile Recoil Measurement of Compressive Strength for PolymericHigh Performance Fibers", Journal of Materials Science 22(1987) 853-859.
4. Arridge, R.G.C., and M. J. Folkes, "Effect of Sample Geometry on the Measurement ofMechanical Properties of Anisotropic Materials", Polymer, Vol 17 June, (1976).
5. Askeland, Donald, R. The Science and Engineering of Materials. PWS Engineering,Boston, MA 1984.
6. Brush, D. 0. and Bo 0. Almroth. Buckling of Bars, Plates, and Shells. McGraw-HillBook Company; New York, NY 1975.
7. Chai. Herzl, "Postbuckling Analysis of Laminated Media", Visiting Scientist,AFWAL/MLBP, 1988.
8. Chauh, C. C. and J. Im. Personal Interview. Dow Chemical Company, 1 Nov 1988.
9. Chen, K. J., and R. J. Diefendorf, "Residual Stress in High Modulus Carbon Fibers",Progress in Science and Engineering of Composites; T. Hayashi, K. Kawata, and S.Umekawa, Ed., ICCM-IV, Tokyo, 1982.
10. Chuah, H. H., T. T. Tsai, K. H. Wei, C. S. Wang, and F. E. Arnold, "CrosslinkedBenzobisthiazole Rigid-Rod Copolymers Via Labile Methyl Groups", American ChemicalSociety Meeting, 9 - 14 April, 1989.
11. Cohen, Yachin, "Structure Formation in Solution of Rigid Polymers Undergoing aPhase Transition", AFWAL-TR-87-4030, 1987.
12. Dang, T. D., L. S. Tan, K. H. Wei, H. H. Chuah and F. E. Arnold, "Pseudo-LadderStructures Via Dihydroxy Pendant Benzobisthiazole Rigid-Rod Polymers", AmericanChemical Society Meeting, 9 - 14 April, 1989.
13. DeTeresa, S.J., "The Axial Compressive Strength of High Performance PolymerFibers", AFWAL-TR-85-4013, 1985
14. Horgan, C. 0., Journal of Elasticity 1972,2,169,335: International Journal of SolidsStructures 1974,10,837.
15. Keller, Capt Russel L. Examination of High Performance Polymer Fibers UnderCompressive Deformation. MS Thesis, AFIT/GAE/AA/86D-5. School of Engineering, AirForce Institute of Technology (AU), Wright-Patterson AFB OH, December 1986.
84
16. Kumar, Satish. Structure and Properties of High Performance Polymeric and CarbonFibers - An Overview. University of Dayton Research Institute, AFWAL MaterialsLaboratory, Polymer Branch, Wright-Patterson AFB OH, 1988
17. Lenhert. Galen, Visiting Scientist. Personal Interview. AFWAL/Materials Laboratory,Wright-Patterson AFB OH, 5 OCT 1988.
18. Lindsey, Kenneth, Personal Interview. AFWAL Materials Laboratory/Mechanics
Branch, Wright-Patterson AFB OH, 1 APR through 1 OCT 1988.
19. Techne (Princeton) Limited. Micro-Tensile Testing Machine. Instruction Book. 1963.
20. Wang, C-S., Research Chemist, University of Dayton Research Institute. PersonalInterview. AFWAL Materials Laboratory/Polymer Branch, Wright-Patterson AFB OH, IMar through 28 Nov 1988.
21. Wang, C. S., J. Burkett, S. Bhattacharya, H. H. Chuah, and F. E. Arnold, "DisruptivePacking Order Via Bulky Benzobisthiazole Rigid-Rod Polymers", American ChemicalSociety Meeting, 9 - 14 April, 1989.
85
APPENDIX A: TEST PROCEDURES
All of the testing undertaken in this effort was completed using the Tecam MTM-8
Micro-Tensile Machine. The MTM-8, pictured in Figure 37, is the only machine available
today capable of direct compression testing of composite fibers.
Due to the limited use of the MTM-8 no standard testing procedure has been
developed, thus the testing procedure used became very dynamic as the technique was
optimized. All of the fibers were viewed with an optical microscope at 200x prior to
testing in order to determine the average diameter, and to examine the fiber for existing
kinkbands or gross defects. Damaging the fiber prior to mounting was quite possible due
to the frailty of the fibers and having to move the fiber from spool, to microscope, to
MTM-8. In addition, the fibers were placed in a glass petri dish to prevent wind currents
from bending the fiber and causing kinkbands.
The displacements are recorded from a micrometer which employs two mirrors and a
light source for a null balance.
The fiber mounting procedure is quite involved and takes many hours to perfect. During
the initial stages of testing only one fiber could be successfully mounted in approximately
1 hours, and the reliability of this mount was questionable. As experience was gained, the
mounting time was reduced to fifteen minutes with a high degree of reliability. The fibers
were mounted on the quartz anvils as shown in Figures 16 and 38. The first method used
was to hold the fiber by attaching a piece of tape to the fiber then picking up the fiber by
the taped portion with tweezers. The fiber was then mounted on the left anvil, since it is
much less sensitive to jarring than the right, by holding the micro-soldering iron under the
anvil to melt the glue while holding the fiber on the anvil. This method was very inade-
quate since a very steady hand was needed to hold the fiber and soldering iron at the same
time without out putting any undo strain on the fiber. Once the left side was mounted the
fiber was separated from the tape by a scissors which usually damaged the fiber
86
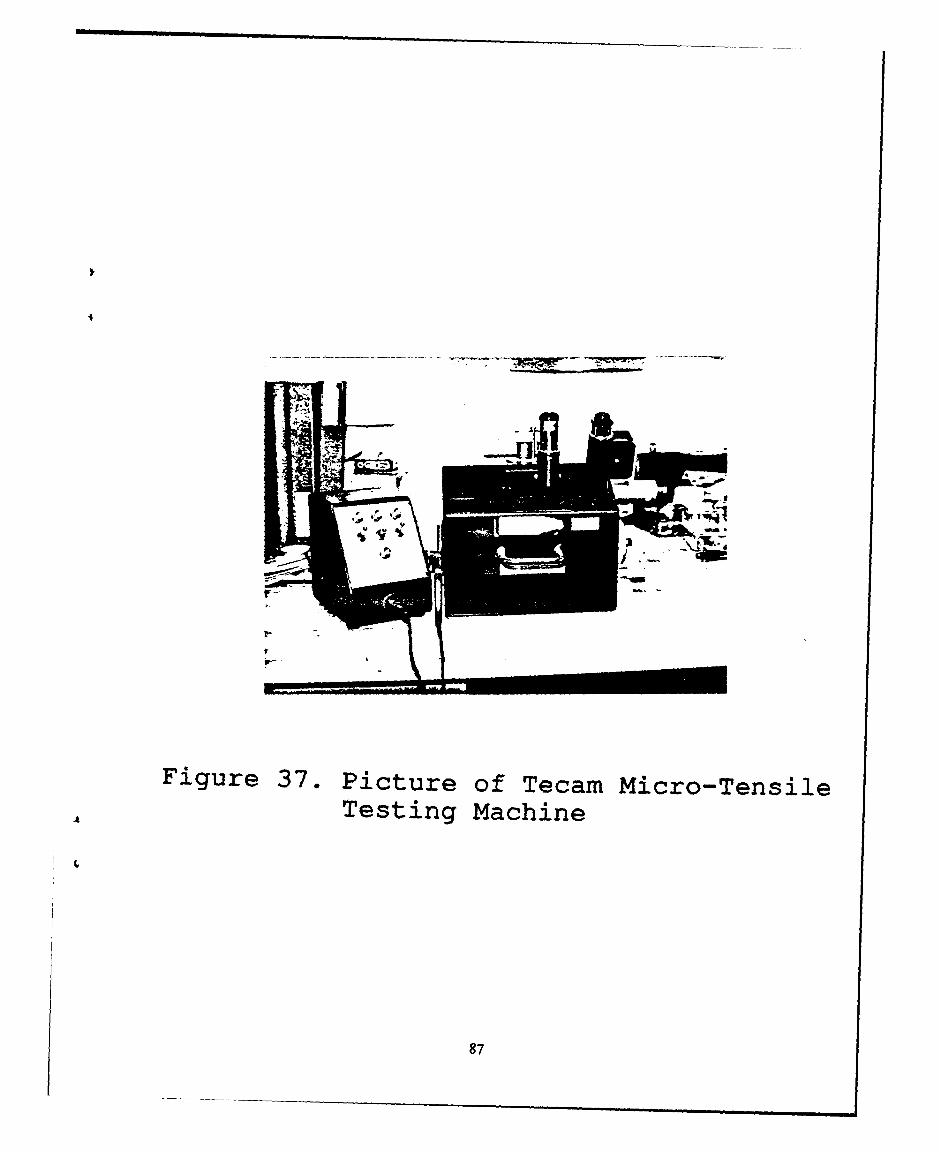
IA
Figure 37. Picture of Tecam Micro-TensileTesting Machine
87
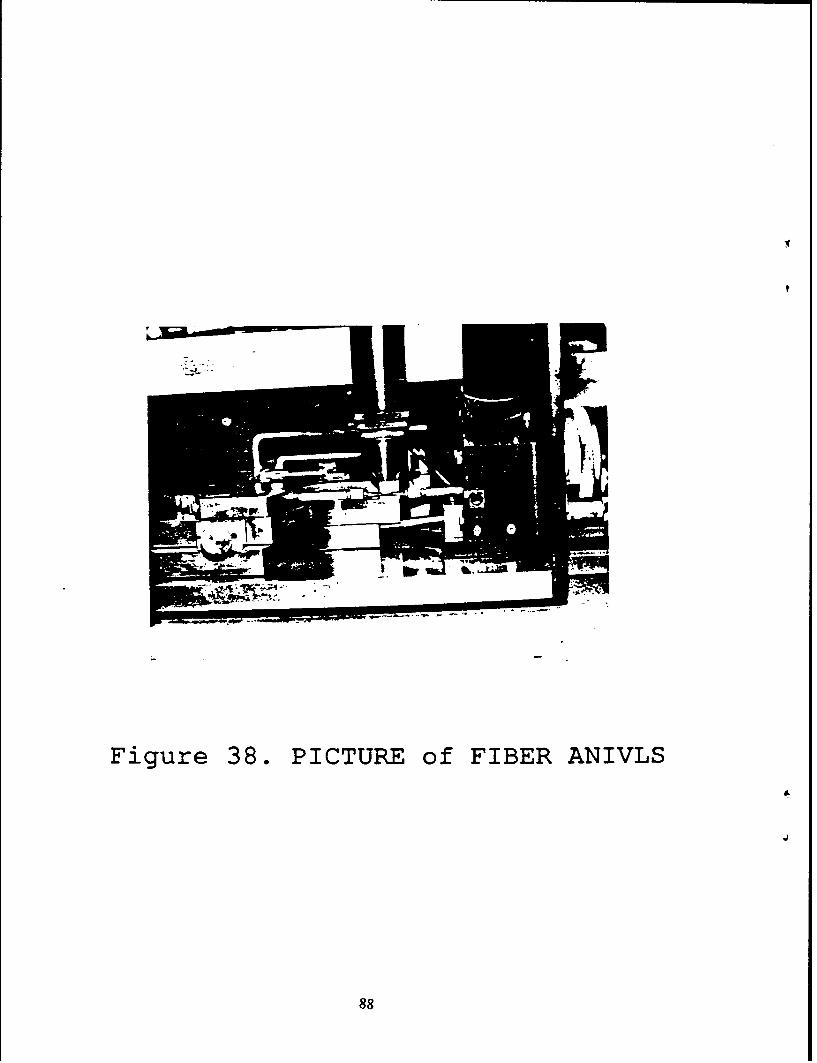
Figure 38. PICTURE of FIBER ANIVLS
88
considerably since the fiber was bent as it was sheared between the two blades. Again
resulting in very questionable results.
A new technique was developed to hold the fiber while mounting which limited the
chances of damaging the fiber. The fiber was balanced atop the tweezers then laid on the
two anvils simultaneously followed by melting the glue. Confidence in testing an
undamaged fiber was high, however since the fiber was not firmly held while transferring
from the petri dish to the anvils; the fiber had a tendency to blow away or be thrown of
the tweezers by static electricity. To limit the air currents around the machine, the machine
was partially enclosed by a plexiglass hood, moved into an isolated room where the air
circulation was minimal, and a dust mask was worn by the operator to limit exhaling on
the fiber. The static electricity problem was overcome by using a anti-static gun.
Having the fiber securely glued to the anvils, the one dimensionality of the fiber
must be ensured. The traveling microscope had cross hairs on the lens; therefore, the cross
hairs were positioned on one end of the fiber then traversed the length of the fiber. Any
deviation from the cross hair horizontal line was corrected. The cross hairs were stencilled
on the objective lens and this lens could be rotated for focussing; therefore, the cross hairs
could also rotate. Transverse translation of the cross hairs had to be checked before each
test. Furthermore, the vertical direction was also aligned by using the travelling micro-
scope. If one anvil was out of focus with respect to the other then a correction was
needed. In addition, a hand held jeweler's magnifying glass of lOx was used to determine
vertical alignment. The correction process was indeed difficult. The left anvil can move
both horizontally and vertically. Making corrections in both directions was done using the
movement controls on the left anvil. Depending on which anvil was out of alignment, the
4. glue was remelted, and the left anvil was moved until alignment was achieved or the glue
solidified. If the glue solidified before the repositioning was complete, the process become
iterative. The process was the same for both the horizontal and vertical corrections.
89
The realignment process was very difficult to accomplish without damaging the
fiber. In order to reduce the number of repositioning iterations, grooves were cut in the
quartz anvils so the fiber could simply be dropped into the grooves and glued. The
alignment was not always perfect, but the repositioning task was much easier, and the
mounting time was decreased from approximately ninety minutes to fifteen. Fiber damage
during mounting would go undetected until the test was completed and raw data reduction
was accomplished; therefore, a significant amount of time would be wasted. If the fiber
needed to be repositioned more than ten times then the fiber was usually damaged, and the
time used to mount a new fiber was far less than the time spent to do the test, reduce the
data, and find out the results are erroneous.
To remove the fiber from the anvils after a test was completed, the glue was
remelted, by holding a micro-soldering iron just below the anvil, on the right anvil then the
left anvil was moved away from the right with the large strain micrometer. This procedure
reduced the chance of sharp movements of the right anvil. The right anvil and left mirror
both were supported by two fine copper wires which were broken once when the right
anvil was jarred resulting in eight hours of repair time (18).
90
APPENDIX B: PBO MORPHOLOGY
Fiber extrusion from a PBO dope is depicted in Figure 39. The dope was forced
through the spinnery by a piston which supplied a constant pressure and entered a water
bath. The fiber was very difficult to work once it entered the bath; therefore, the
substructure was set. In the bath the fiber rolled on the take-up wheel, which along with
the extrusion rate determines the spin draw rate, and then was rolled on a spool. The
fibers on the spool were classified "as spun"; whereas, the fibers in question were annealed
at 600'C. The dope was de-airiated prior to entering the resovoir to force out unwanted
gases. The de-ariation was similar to the extrusion by having the dope forced through
many small holes at the bottom of a reservoir. Alignment of polymer chains might occur
during one or both of these processes resulting in the fibril/microfibril substructure. Not all
of the gas was extracted from the dope, therefore when the fiber was drawn, voids and
porosities might exist. Furthermore, as the fiber travelled through the water bath, water
diffused into the fiber. Once the fiber was dry, the water had diffused out leaving the
cavity it occupied behind; thus creating additional voids. The greater the alignment, the
greater the mechanical properties; therefore, the optimum spin draw rate largely determined
how the substructure was aligned. Cohen and others found that the fiber was composed of
highly oriented structural components internally held together by primary forces, but were
only loosely bonded to each otherthrough tecondary forces (11:4). Figures 30 showed the
nature of the discretely connected regions. The fiber components, fibril and microfibril
range in size from microns to nanometers, respectively. The fiber structure was a product
of processing methods used, but no quantitative explanation exists for how the discrete
components evolved.
91
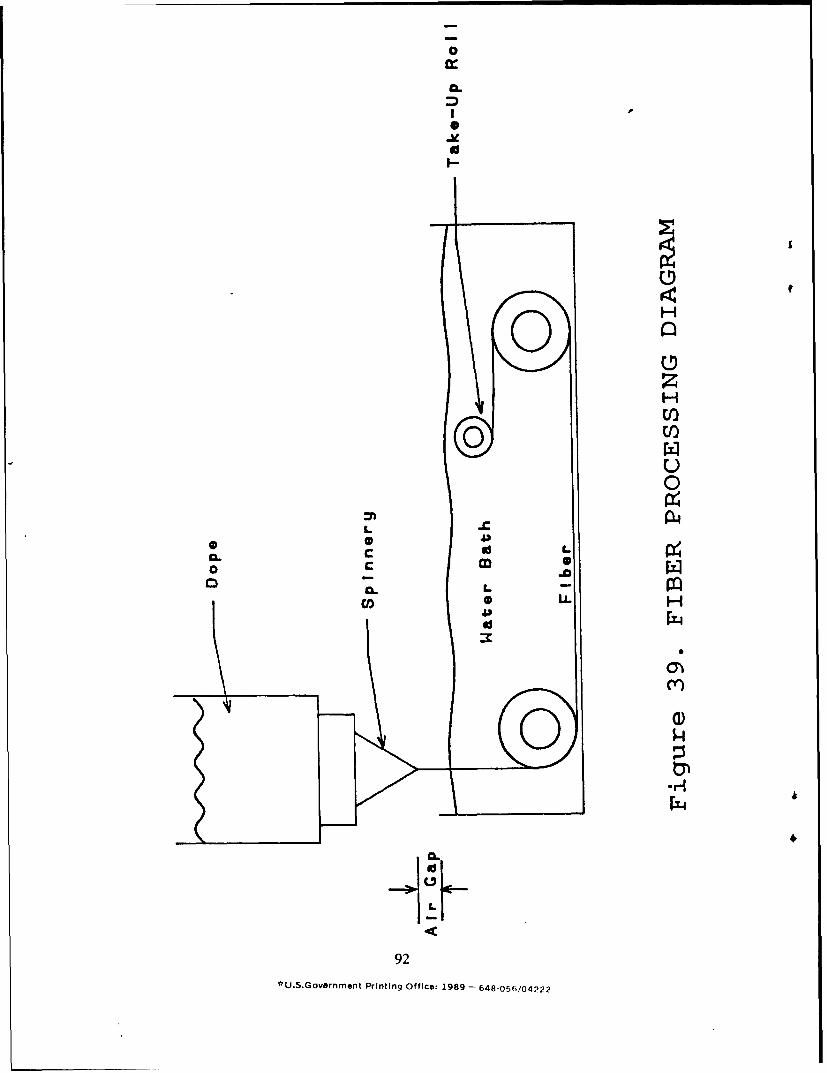
0
C C4
m
I-
0
az
H
Cl)
FZ
oo
92)
L P t o 9
* "--2
a- CLLo C S
a.-,-t
92 L.
4U2Go~nmn PrnigOfie 98 -68-5/42