ReviewReceived: 3 May 2011 Revised: 13 August 2011 Accepted: 10 September 2011 Published online in Wiley Online Library:
(wileyonlinelibrary.com) DOI 10.1002/jsfa.4690
Composition of milk from minor dairy animalsand buffalo breeds: a biodiversity perspectiveElinor Medhammar, Ramani Wijesinha-Bettoni, Barbara Stadlmayr,Emma Nilsson, Ute Ruth Charrondiere∗ and Barbara Burlingame
Abstract
A comprehensive review is presented of the nutrient composition for buffalo, mare, and dromedary camel milks at thelevel of breed, and species-level data for yak, mithun, musk ox, donkey, Bactrian camel, llama, alpaca, reindeer and moosemilks. Average values of nutrients were calculated and compared. Interspecies values (g 100 g−1) were 0.7–16.1 for total fat,1.6–10.5 for protein, 2.6–6.6 for lactose, and 67.9–90.8 for water. Reindeer and moose milks had the highest fat and proteinconcentrations and the lowest lactose contents. Mare and donkey milks had the lowest protein and fat contents, in additionto showing the most appropriate fatty acid profile for human nutrition. Dromedary camel milk was most similar to cow milk inproximate composition. Moose milk was the richest in minerals, having values as high as 358 mg 100 g−1 for calcium, 158 mg100 g−1 for sodium and 150 mg 100 g−1 for phosphorus. Interbreed differences of 4 g 100 g−1 were observed in total fat inbuffalo, yak, mare and dromedary camel milks. Large interbreed differences were also present in the mineral contents in mare,buffalo and dromedary camel milks. By bringing together these compositional data, we hope to usefully widen the biodiversityknowledge base, which may contribute to the conservation and sustainable use of milk from underutilized dairy breeds andspecies, and to improved food and nutrition security, particularly in developing countries.c© 2011 Society of Chemical Industry
Keywords: milk; biodiversity; nutrient; composition; breed; species
INTRODUCTIONMilk is one of the most nutritionally complete foods. It containsall the nutrients necessary to sustain life of the neonate and theyoung infant, and adds quality to the human diet. Milk is anexcellent source of macro- and micro nutrients, and thereforecan play an important role in helping individuals to meet theirnutritional requirements.1 Milk protein contains all the essentialamino acids and thus provides an important source of proteinof high biological value, especially useful in developing countrieswhere rice or tubers are staples.2 Dairy animals are a key factorin household food security for small-scale livestock holders, whosupply the vast majority of milk in developing countries.3 Cow,goat and sheep milks account for about 87% of the global milkproduction.4 However, minor dairy animal species are nutritionallyand economically important in several countries.
The significance of biodiversity, defined as variation in foodcomposition at the species level and below, has recently beendiscussed in depth.5,6 The general global trend has beentowards diet simplification, with negative impact of food security,nutritional balance and the growing incidence of chronic diseases.Biodiversity contributes to a more diverse diet that can reversethis unhealthy trend and improve dietary choices. Nutrition andbiodiversity links directly to two of the Millennium DevelopmentGoals: to halve the proportion of people who suffer fromhunger; and to ensure environmental sustainability.7 However, thecontribution of biodiversity and underutilized species to nutritionand health has long been neglected. The nutrient potential ofmilk from a wide range of species and breeds has not beenfully explored. Acknowledging the importance of biodiversity forimproved nutrition is crucial for addressing malnutrition and for
appropriate nutrition interventions. Developing the biodiversityknowledge base also provides motivation to maintain local speciesand breeds which may otherwise become extinct; for example,in Italy, reductions in some autochthonous donkey populationssuch as the Ragusana breed and di Pantelleria breeds have beenreported,8 while mechanization of many agricultural practices hasled to the decline of the mare breed Murghes, now threatenedwith extinction.9
Buffalo milk is ranked second in the world in production,contributing towards ∼13% of the world’s milk production.4
In the Himalayan region, water buffalo (Bubalus bubalis) is theprimary source of income earned from livestock and yields 98%of the total milk consumed by the population (Singh, 1992, citedin Meena et al., 2011).10 In Pakistan and India, buffalo accountsfor 63% and 56%, respectively, of the total milk production.4 Inthe mountainous regions of China, Mongolia, Russia, Nepal, India,Bhutan, Tajikistan and Uzbekistan, where no other bovines arereared, the populations rely heavily on yak (Bos grunniens) formilk, meat, fur and transportation (Wiener, 2002, cited in Silk et al.,2006).11 Yak milk is dried in several factories in China, Nepal andMongolia for domestic consumption.12 Mithun (Bos frontalis), adomesticated bovine species, is mainly found in the hill regionsof India, Myanmar, Bhutan and Bangladesh,13 where it plays an
∗ Correspondence to: Ute Ruth Charrondiere, Nutrition and Consumer ProtectionDivision, Food and Agriculture Organization of the United Nations (FAO), Vialedelle Terme di Caracalla 00153 Rome, Italy. E-mail: [email protected]
NutritionandConsumerProtectionDivision,FoodandAgricultureOrganizationof the United Nations (FAO), 00153 Rome, Italy
J Sci Food Agric (2011) www.soci.org c© 2011 Society of Chemical Industry

www.soci.org E Medhammar et al.
important role in the economic, social and cultural life of thelocal people. This animal has the possibility of being further usedfor milk production in order to improve the rural economy andnutrition status in these countries. Mithun cross cattle hybridsare also used as milk animals in parts of northeastern India andBhutan.14
It is estimated that approximately 30 million people across theworld drink mare (Equus ferus caballus) milk.15 Herds are mainlyfound in Russia, Kazakhstan, Kyrgyzstan, Tajikistan, Uzbekistan,Mongolia, and eastern and central Europe. Both mare and donkeymilks are similar to human milk in total protein and lactosecontents, have similar fatty acid and protein profiles and a fairlylow mineral content. Therefore, equine milks could be a betteralternative to cow milk for infants, especially those with cow milkallergies.8,15 – 17
In arid and semi-arid areas where cows are affected by theheat and lack of water and feed, camelids play a major role insupplying the population with milk.18 There are two species ofcamel: the dromedary or Arabian camel (Camelus dromedaries)and the Bactrian camel (Camelus bactrianus). Out of an estimated18 million camels in the world, only 2 million are Bactrian camels.19
In Somalia, Mali and Ethiopia, camel milk represents about 40%,17% and 12%, respectively, of the total milk production.4 Llama(Lama glama) and alpaca (Lama pacos) are domesticated SouthAmerican camelids. Unlike camels, they have historically not beenbred for dairy purposes and information on milk composition andconsumption is scarce. Llama and alpaca milks are still under-exploited nutritional and economic resources for the millions ofpeople living in the mountainous areas of South America.17,20
Reindeer (Rangifer tarandus) herding is practised by about 20ethnic groups, from the Saami people of northern Scandinavia andthe Kola Peninsula, to the Koryak and Chukch people of easternSiberia. Reindeer milking is labour intensive and the task usuallyfalls to women.21 Renewed interest in reindeer milk lies in theexpanding market of gourmet products.21
Moose (Alces alces), also known as European elk, is the world’slargest antlered mammal and can be found in Canada, Alaska,Russia, Sweden, Norway, Finland and the Baltic states. Moosemilking farms, e.g. the Kostroma moose farm,22 can be found inRussia.
Minor dairy animals have considerable potential in contributingto food and nutrition security. They have been domesticated andbred for dairy purposes in regions where harsh environments andclimates require animals with special adaptations. They contributeto sustainable family nourishment, assure an income for therural population, enhance agricultural development, preserve localresources and improve human nutrition within these regions.23
Emphasizing the role of dairy animals other than cow, goatand sheep in milk production contributes directly to biodiversityenhancement by the preservation of traditional species, productsand local culture.
It is well known that milk composition varies among species,breeds within the same species, and even among individualanimals within the same breed.24,25 There are many reasons forthese differences in milk composition, including stage of lactation,breed differences, number of calvings (parity), seasonal variations,age and health of animal, feed and management effects includingnumber of milkings per day and herd size.24,26 – 28 The knowledgeof differences in nutrients and other bioactive components in milkamongst species and breeds allows the development of productsfor consumers with special needs, e.g. alternatives to cow milk for
people with allergy and milk intolerance,12,29 and improved milkcomposition through selection and cross-breeding.
The nutritional value of milk of minor dairy animals in humannutrition has so far received little attention in research and needs tobe emphasized. Previous reviews of milk from goat, sheep, cameland mare have presented different aspects in milk compositionamongst one or two species,30 – 32 but to our knowledge no reviewpaper on the milk composition at breed level of such a largenumber of species, which also includes data on underutilizedspecies, is available. The aim of this review is therefore to report,compare and highlight the inter- and intraspecies differences andsimilarities in composition of milk from various minor dairy animalsand buffalo.
EXPERIMENTAL (COMPILATION OF NUTRIENTCOMPOSITION DATA)Literature searchRelevant articles were obtained through an extensive literaturesearch in reference databases (using Scopus, Science Direct andCab Abstracts), book chapters, nutrition and agricultural journalsduring the period of November–January 2009/2010. Keywordsused were: milk, breed, biodiversity, milk AND the different animalspecies. Each bibliography of references generally led to severalother papers.
Only milks of species known to be consumed by humans wereincluded. Information on dairy products was not compiled. Dataon milk composition less then 30 days from parturition were nottaken into account, with the exception of one entry for moose milkfrom 15 to 25 days after parturition, and one entry for reindeermilk from lactation week 3. These were included because of thelimited data available for moose and reindeer milk and becausethe values were very similar to other values.
Information was gathered on the composition of whole rawmilk of dairy animals at the breed level, or at species level foranimals classified as underutilized. Breed is referred to as ‘asubspecific group of animal species, within a single zoologicaltaxon of the lowest known rank’.33 As the same breed may bereferred to by different names in different countries or regions,care was taken to identify such cases. Yak, Bactrian camel,donkey, moose, reindeer, musk ox, llama, alpaca and mithunwere categorized as underutilized species in regard to milkproduction, meaning that they are ‘species with underexploitedpotential for contributing to food security, health and nutrition’.33
They were identified taxonomically at the species level, andbreed name was noted when available. There were 119 scientificpapers that met the inclusion criteria, covering 271 data points.Of these, 13 papers were excluded because of problems withthe values or documentation. For three papers34 – 36 the valuesgiven far exceeded the normal range (e.g. one paper reportedα-tocopherol values in milk which were more than 1000 timeshigher than the average for the species); therefore these paperswere also excluded. Very large values were found for copper andmanganese,37 the value for the latter being more than 2000 timesthe value for cow (8147 µg compared with 4 µg 100 g−1) andmore than 45 times the highest value reported for any species(dromedary, 180 µg 100 g−1),38 and for this reason these valuestoo were excluded. The vitamin C values in one paper on camelmilk39 were excluded due to sample handling. For papers wherecontact information was provided, authors were contacted toobtain clarification prior to excluding a paper. Only one paperwith values for barren ground caribou was found,2 but had to be
wileyonlinelibrary.com/jsfa c© 2011 Society of Chemical Industry J Sci Food Agric (2011)

Composition of milk from minor dairy animals and buffalo breeds www.soci.org
excluded as the values were for milk obtained within 1 week ofparturition.
Buffalo have historically been divided into swamp and riverbuffalo based on morphological, behavioural and geographicalcriteria.40 The two types also differ in chromosome number, withswamp buffalo having 48 chromosomes and river buffalo 50chromosomes (Ulbrich and Fischer, 1967, cited in Groeneveldet al., 2010;40 Fischer and Ulbrich, 1968, cited in Groeneveld et al.,201040). They are sometimes referred to as different subspecies:river buffalo as Bubalus bubalis bubalis and swamp buffalo asBubalus bubalis carabenesis. Swamp buffalo have no recognizedbreeds.40 They are reported to be mainly used as draught animals41
and their milk yield is poor.10 Conversely, river buffalo are mainlyused for milk production.42 In the present work, we differentiatedby buffalo breeds and not by subspecies, and it is likely that ourdata are mainly limited to river buffalo breeds.
Camels may also be classified according to their function (racing,draught or dairy), or their habitat (lowland/mountain).19 However,in the present work we differentiated among camels only at specieslevel (dromedary versus Bactrian) and breed level.
We did not attempt to classify animals according to milk yieldsor maternal body weight in the present study. Although lactation-averaged values were used when they were presented in somepapers, other papers did not report lactation-averaged values butonly individual values for various lactation stages; in such cases,all reported values were used.
Standardization of dataAmong the data sources, considerable differences were encoun-tered in data expression. Protein and fat were sometimes reportedper 100 g milk, per 100 g protein or 100 g fat, or per 100 g aminoacids or per 100 g fatty acids. Units for micronutrient composi-tion were expressed in mg 100 g−1, mg kg−1, µg g−1, ppm andmmol L−1. Therefore, the compilation of macronutrients and mi-cronutrients required standardization prior to any comparisons.Differences in the data presented in this paper and the originalsource are a result of these recalculations. Although the majorityof data were from primary publications, sometimes it was notpossible to refer back to the original source and values cited in thepapers had to be used.
Data were recalculated to grams, milligrams or microgramsper 100 g fresh milk. When the concentration (mmol L−1) wasgiven, the values were recalculated to mg 100 g−1 by using thecorresponding molecular weight. Values for amino acids that weregiven per 100 g protein were recalculated to 100 g milk. Valuesfor fatty acids that were given per 100 g fat or fatty acids wererecalculated to 100 g milk, by using the conversion factor 0.945.43
In several papers presenting amino acids or fatty acids, no proteinor fat values were reported. Therefore average protein and fatvalues were calculated and applied per species, to express aminoacids and fatty acids per 100 g milk. When no nitrogen conversionfactor for protein was indicated, the factor 6.38, recommendedfor milk and milk products,44 was used. Internal checks on thenutrient profiles were carried out as recommended by Greenfieldand Southgate.43 Mean values were calculated when only a rangewas given in the scientific papers. Where breed-level informationwas available, average values per breed were used. Some of thesedata included different feeding regimes and lactation stages. Theonly exceptions were individual fatty acids, where data werenot averaged for breed, for reasons discussed under ‘‘Interbreeddifferences in milk composition’’.
Some papers reported values for folic acid, but since folate isthe naturally occurring form of the vitamin it was assumed to befolate. It was impossible to differentiate among all the active formsof vitamins A and E. Thus they were simply reported as vitaminA or vitamin E. Values for L-ascorbic acid were grouped togetherwith vitamin C.
The percentage of cow, goat, sheep, camel and buffalo milkproduction was obtained from FAO STAT 2008,4 using the valuesfor milk production per species and total milk production.
The amount of data available varied with species. A briefsummary of the data collected is given in Table 1.
Cow milkCow milk (the term ‘cow’ is used here to refer to the female ofBos taurus and Bos indicus) was included in this study as a genericreference for comparison purposes. Nutrient data for whole milk(3.25% milk fat, without added vitamin A and vitamin D, USDAcode 01211) were obtained from the USDA National NutrientDatabase45 and are included in Table 2 and in the nutrient tables.These values were chosen as a reference because the number ofdata points from which they had been derived were sufficientlylarge (ranging from 12 to 46 for the main nutrients).
Statistical analysisA statistical analysis using SPSS for MAC (version16.0) was carriedout on proximate data and mineral data. For the other nutrients, notenough data points were available after the data were averagedaccording to breed. The averaging was done in order to give anequal weight to data from all breeds, as otherwise the mean valuewould have been biased by data from the more commonly studiedbreeds, which contribute more data points. Data are presentedas mean ± SD. To account for significant differences among theanimal species for protein, total fat, ash, lactose, water, calcium,magnesium, phosphorous and potassium, the one-way ANOVA(followed by the Sidak) test was applied. Significance was set atP < 0.05.
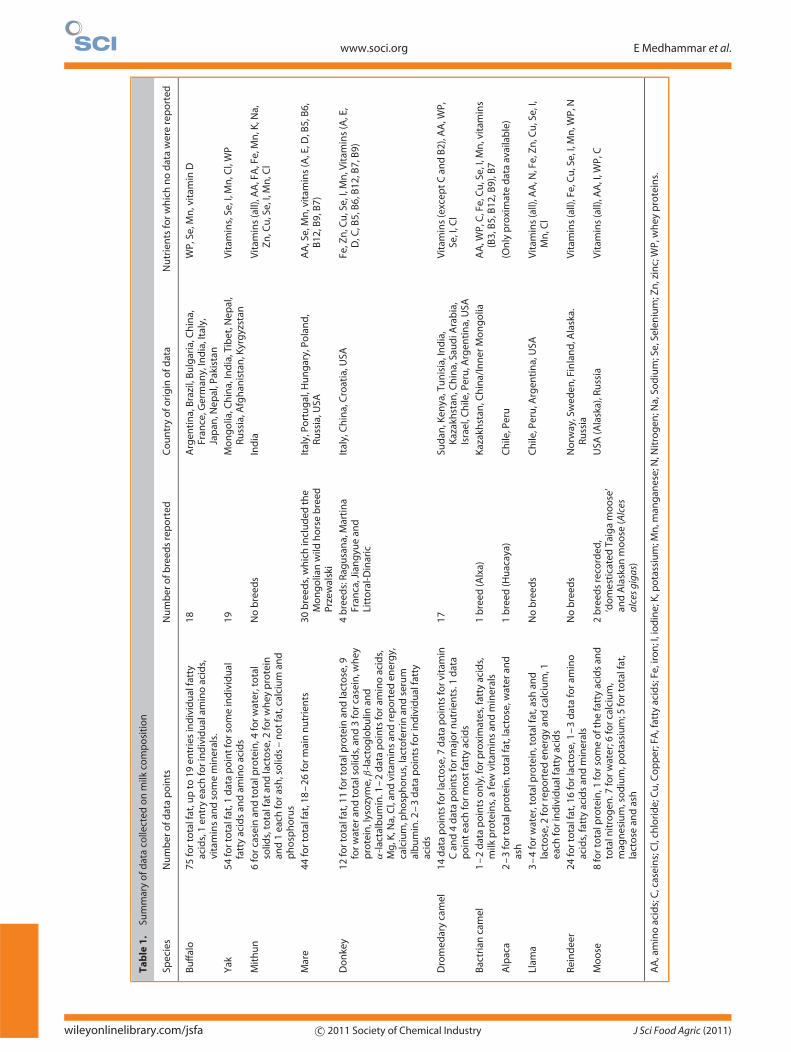
RESULTS AND DISCUSSIONInterspecies differences in nutrient compositionTable 2 shows proximate data for all the species and includes theresults of the statistical analysis for buffalo, yak, mare, donkey,dromedary camel and reindeer milks; milk from the other speciesdid not have enough data points for inclusion in this analysis. Inthe following sections, the values referred to are for the averagecomposition of the milk, unless otherwise mentioned.
Comparison with cow milkBovine species buffalo (Bubalus bubalis), yak (Bos grunniens) andmithun (Bos frontalis). Milk from yak and mithun contained moreprotein on average than buffalo and cow milks. The highestreported protein value was 6.8 g 100 g−1 in mithun milk – data forlate lactation.46 Yak and buffalo milks were significantly differentfrom each other (P < 0.05) only in their total protein content.The milk from all three species contain appreciably higher valuesfor average total fat than cow milk, with the maximum individualvalue reported being 10.3 g 100 g−1 for mithun milk – data forlate lactation.46 This value is unusually high, considering thatthe mithun is not an Arctic animal, although its habitat is at anelevation of 1000–3000 m above sea level. The high values for fatand protein in mithun milk have been attributed to the low milkyield.46,47
J Sci Food Agric (2011) c© 2011 Society of Chemical Industry wileyonlinelibrary.com/jsfa
www.soci.org E Medhammar et al.
Tab
le1
.Su
mm
ary
ofd
ata
colle
cted
on
milk
com
po
siti
on
Spec
ies
Nu
mb
ero
fdat
ap
oin
tsN
um
ber
ofb
reed
sre
po
rted
Co
un
try
ofo
rig
ino
fdat
aN
utr
ien
tsfo
rwh
ich
no
dat
aw
ere
rep
ort
ed
Bu
ffal
o75
fort
ota
lfat
,up
to19
entr
ies
ind
ivid
ual
fatt
yac
ids,
1en
try
each
fori
nd
ivid
ual
amin
oac
ids,
vita
min
san
dso
me
min
eral
s.
18A
rgen
tin
a,B
razi
l,B
ulg
aria
,Ch
ina,
Fran
ce,G
erm
any,
Ind
ia,I
taly
,Ja
pan
,Nep
al,P
akis
tan
WP,
Se,M
n,v
itam
inD
Yak
54fo
rto
talf
at,1
dat
ap
oin
tfo
rso
me
ind
ivid
ual
fatt
yac
ids
and
amin
oac
ids
19M
on
go
lia,C
hin
a,In
dia
,Tib
et,N
epal
,Ru
ssia
,Afg
han
ista
n,K
yrg
yzst
anV
itam
ins,
Se,I
,Mn
,Cl,
WP
Mit
hu
n6
forc
asei
nan
dto
talp
rote
in,4
forw
ater
,to
tal
solid
s,to
talf
atan
dla
cto
se,2
forw
hey
pro
tein
and
1ea
chfo
rash
,so
lids
–n
ot
fat,
calc
ium
and
ph
osp
ho
rus
No
bre
eds
Ind
iaV
itam
ins
(all)
,AA
,FA
,Fe,
Mn
,K,N
a,Z
n,C
u,S
e,I,
Mn
,Cl
Mar
e44
fort
ota
lfat
,18
–26
form
ain
nu
trie
nts
30b
reed
s,w
hic
hin
clu
ded
the
Mo
ng
olia
nw
ildh
ors
eb
reed
Prze
wal
ski
Ital
y,Po
rtu
gal
,Hu
ng
ary,
Pola
nd
,Ru
ssia
,USA
AA
,Se,
Mn
,vit
amin
s(A
,E,D
,B5,
B6,
B12
,B9,
B7)
Do
nke
y12
fort
ota
lfat
,11
fort
ota
lpro
tein
and
lact
ose
,9fo
rwat
eran
dto
tals
olid
s,an
d3
forc
asei
n,w
hey
pro
tein
,lys
ozy
me,
β-l
acto
glo
bu
linan
dα
-lac
talb
um
in.1
–2
dat
ap
oin
tsfo
ram
ino
acid
s,M
g,K
,Na,
Cl,
and
vita
min
san
dre
po
rted
ener
gy,
calc
ium
,ph
osp
ho
rus,
lact
ofe
rrin
and
seru
mal
bu
min
.2–
3d
ata
po
ints
fori
nd
ivid
ual
fatt
yac
ids
4b
reed
s:Ra
gu
san
a,M
arti
na
Fran
ca,J
ian
gyu
ean
dLi
tto
ral-
Din
aric
Ital
y,C
hin
a,C
roat
ia,U
SAFe
,Zn
,Cu
,Se,
I,M
n,V
itam
ins
(A,E
,D
,C,B
5,B
6,B
12,B
7,B
9)
Dro
med
ary
cam
el14
dat
ap
oin
tsfo
rlac
tose
,7d
ata
po
ints
forv
itam
inC
and
4d
ata
po
ints
form
ajo
rnu
trie
nts
.1d
ata
po
int
each
form
ost
fatt
yac
ids
17Su
dan
,Ken
ya,T
un
isia
,In
dia
,K
azak
hst
an,C
hin
a,Sa
ud
iAra
bia
,Is
rael
,Ch
ile,P
eru
,Arg
enti
na,
USA
Vit
amin
s(e
xcep
tC
and
B2)
,AA
,WP,
Se,I
,Cl
Bac
tria
nca
mel
1–
2d
ata
po
ints
on
ly,f
orp
roxi
mat
es,f
atty
acid
s,m
ilkp
rote
ins,
afe
wvi
tam
ins
and
min
eral
s1
bre
ed(A
lxa)
Kaz
akh
stan
,Ch
ina/
Inn
erM
on
go
liaA
A,W
P,C
,Fe,
Cu
,Se,
I,M
n,v
itam
ins
(B3,
B5,
B12
,B9)
,B7
Alp
aca
2–
3fo
rto
talp
rote
in,t
ota
lfat
,lac
tose
,wat
eran
das
h1
bre
ed(H
uac
aya)
Ch
ile,P
eru
(On
lyp
roxi
mat
ed
ata
avai
lab
le)
Llam
a3
–4
forw
ater
,to
talp
rote
in,t
ota
lfat
,ash
and
lact
ose
,2fo
rrep
ort
eden
erg
yan
dca
lciu
m,1
each
fori
nd
ivid
ual
fatt
yac
ids
No
bre
eds
Ch
ile,P
eru
,Arg
enti
na,
USA
Vit
amin
s(a
ll),A
A,N
,Fe,
Zn
,Cu
,Se,
I,M
n,C
l
Rein
dee
r24
fort
ota
lfat
,16
forl
acto
se,1
–3
dat
afo
ram
ino
acid
s,fa
tty
acid
san
dm
iner
als
No
bre
eds
No
rway
,Sw
eden
,Fin
lan
d,A
lask
a.Ru
ssia
Vit
amin
s(a
ll),F
e,C
u,S
e,I,
Mn
,WP,
N
Mo
ose
8fo
rto
talp
rote
in,1
fors
om
eo
fth
efa
tty
acid
san
dto
taln
itro
gen
.7fo
rwat
er;6
forc
alci
um
,m
agn
esiu
m,s
od
ium
,po
tass
ium
;5fo
rto
talf
at,
lact
ose
and
ash
2b
reed
sre
cord
ed,
‘do
mes
tica
ted
Taig
am
oo
se’
and
Ala
skan
mo
ose
(Alc
esal
ces
giga
s)
USA
(Ala
ska)
,Ru
ssia
Vit
amin
s(a
ll),A
A,I
,WP,
C
AA
,am
ino
acid
s;C
,cas
ein
s;C
l,ch
lori
de;
Cu
,Co
pp
er;F
A,f
atty
acid
s;Fe
,iro
n;I
,io
din
e;K
,po
tass
ium
;Mn
,man
gan
ese;
N,N
itro
gen
;Na,
Sod
ium
;Se,
Sele
niu
m;Z
n,z
inc;
WP,
wh
eyp
rote
ins.
wileyonlinelibrary.com/jsfa c© 2011 Society of Chemical Industry J Sci Food Agric (2011)
Composition of milk from minor dairy animals and buffalo breeds www.soci.org
Tab
le2
.Pr
oxi
mat
eco
mp
osi
tio
no
fmilk
fro
mth
eva
rio
us
spec
ies
(ave
rag
ean
dra
ng
e)
Per1
00g
milk
Co
wa
Bu
ffal
ob
Yak
cM
ith
un
dM
usk
oxe
Mar
efD
on
keyg
Dro
med
ary
cam
elh
Bac
tria
nca
mel
iLl
amaj
Alp
acak
Rein
dee
rlM
oo
sem
Ener
gy,
calc
ula
ted
∗A
vera
ge
263
(63)
412
(99)
417
(100
)51
0(1
22)
356
(85)
199
(48)
156
(37)
234
(56)
319
(76)
326
(78)
299
(71)
819
(196
)53
8
valu
e,kJ
(kca
l)(1
29)
Ran
ge
296
–49
533
5–
557
458
–57
517
1–
295
135
–21
518
5–
332
258
–35
823
7–
351
525
–10
79
(71
–11
8)(8
0–
133)
(110
–13
8)(4
1–
71)
(32
–51
)(4
4–
79)
(62
–86
)(5
7–
84)
(126
–25
8)
Ener
gy,
Rep
ort
edva
lue,
kJ(k
cal)
Ave
rag
e25
6(6
1)36
8(8
9)19
3(4
6)21
0(5
0)39
2(9
4)88
0(2
09)
Ran
ge
349
–38
217
7–
210
388
–39
668
0–
1139
(87
–91
)(4
2–
50)
(93
–95
)(1
62–
272)
Wat
er(g
)A
vera
ge
88.1
83.2
a82
.6a
78.6
83.6
89.8
b90
.8b
89.0
b84
.884
.883
.767
.9c
76.8
Ran
ge
87.7
–89
.282
.3–
84.0
75.3
–84
.477
.4–
79.7
87.9
–91
.389
.2–
91.5
88.7
–89
.483
.7–
86.9
83.2
–84
.261
.9–
76.3
74.3
–79
.2
Tota
lpro
tein
(g)
Ave
rag
e3.
24.
0a5.
2b6.
55.
32.
0c1.
6c3.
1d3.
94.
15.
810
.4e
10.5
Ran
ge
3.1
–3.
32.
7–
4.6
4.2
–5.
96.
1–
6.8
1.4
–3.
21.
4–
1.8
2.4
–4.
23.
6–
4.3
3.4
–4.
33.
9–
6.9
7.5
–13
.07.
8–
14.4
Tota
lfat
(g)
Ave
rag
e3.
37.
4a6.
8a8.
95.
41.
6b,e
0.7b
3.2e
5.0
4.2
3.2
16.1
c8.
6
Ran
ge
5.3
–9.
05.
6–
9.5
7.7
–10
.30.
5–
4.2
0.3
–1.
82.
0–
6.0
4.3
–5.
72.
7–
4.7
2.6
–3.
810
.2–
21.5
7.0
–10
.0
Lact
ose
(g)
Ave
rag
e5.
14.
4a4.
8a4.
44.
16.
6b6.
4b4.
3a4.
26.
35.
12.
9c2.
6
Ran
ge
4.9
–5.
63.
2–
4.9
3.3
–6.
24.
1–
4.6
5.6
–7.
25.
9–
6.9
3.5
–4.
95.
9–
6.5
4.4
–5.
61.
2–
3.7
0.6
–3.
6
Ash
(g)
Ave
rag
e0.
70.
8a0.
8a0.
91.
60.
4b0.
4b0.
80.
90.
71.
61.
5c1.
6
Ran
ge
0.7
–0.
80.
4–
1.0
0.3
–0.
50.
3–
0.4
0.6
–0.
91.
4–
1.7
1.2
–2.
71.
5–
1.6
∗ Ap
pro
xim
ate
valu
eca
lcu
late
db
yu
sin
gth
een
erg
yva
lue
forp
rote
in(1
7kJ
),la
cto
se(1
6kJ
),an
dfa
t(3
7kJ
).Th
eva
lues
inkc
alw
ere
ob
tain
edb
yu
sin
gth
eco
nve
rsio
nfa
cto
rs1
kJ=
0.23
9kc
al.
Tab
le2
incl
ud
esth
ere
sult
so
fth
est
atis
tica
lan
alys
isfo
rb
uff
alo
,yak
,mar
e,d
on
key,
dro
med
ary
cam
elan
dre
ind
eer
milk
s;th
eo
ther
milk
sd
idn
ot
hav
een
ou
gh
dat
ap
oin
tsfo
rin
clu
sio
nin
this
anal
ysis
.V
alu
esin
aro
ww
ith
diff
eren
tle
tter
sar
esi
gn
ifica
ntl
yd
iffer
ent
(P<
0.05
).a
Co
w.U
SDA
.45
bB
uff
alo
.A
vera
ge
valu
esfr
om
Mu
rrah
,10,4
2,70
–72
,88,
95–
103,
129,
133,
134
Egyp
tian
bu
ffal
o,57
Zaf
arab
adi,95
Meh
san
a,95
,98
Bu
lgar
ian
Mu
rrah
,97,1
04,1
05B
ulg
aria
nb
uff
alo
×M
urr
ahb
reed
,97B
had
awar
i,98N
iliRa
vi,41
,42,
86Ja
ffra
bad
i,Su
rti,
Nag
pu
ri,P
and
har
pu
ri,a
nd
Tod
a,98
Ku
nd
i,41K
utt
anad
dw
arfb
uff
alo
,106
Zaf
farb
adia
nd
no
n-d
escr
ipt
hill
bu
ffal
o,10
Mu
rrah
×M
edit
erra
nea
n(c
ross
-bre
ed),96
,107
Med
iter
ran
ean
bu
ffal
o.10
8,10
9
cY
ak.A
vera
ge
valu
es,2,
11,1
10–
117
Him
ach
aliy
ak,11
8Pa
mir
,Kaz
aski
stan
iyak
,Mo
ng
olia
nya
kan
dU
pp
erA
ltai
yak,
119
Go
rno
-Alt
ai,57
Kir
gh
iz,57
,119
Zo
mo
(yak
×ze
bu
hyb
rid
s),11
8K
hai
nag
,113
Mai
wa,
37,1
17,1
19,1
20
Tian
zhu
Wh
ite,
117,
119,
120
Jiu
lon
g,11
5,11
7,12
0D
imzo
Jom
(cro
ss-b
reed
)an
dU
ran
gJo
m(c
ross
-bre
ed),11
Sib
u,43
Pali
and
Jial
i,117,
120
Gu
olu
o,H
uan
hu
,Zh
on
gd
ian
.117
dM
ith
un
.Ave
rag
eva
lues
.46,4
7
eM
usk
ox:
Ten
er(1
956)
cite
din
ref.
2.f
Mar
e.A
vera
ge
valu
esfr
om
Kir
gh
iz,
New
Kri
gh
iz,
Imp
rove
dK
irg
hiz
,tr
ott
ers,
Kir
gh
iztr
ott
er,
Kaz
akh
,B
ash
kir,
Russ
ian
bre
edo
fm
ilkin
gm
ares
and
San
am
ares
(mts
yri),
57M
urg
ese,
9,12
1It
alia
nsa
dd
leh
ors
e,12
2,13
5Lu
sita
no
,93,9
4H
aflin
ger
,77,8
2,92
,137
pri
mit
ive
Ko
nik
ho
rse,
85W
ielk
op
ols
ka,74
Perc
her
on
,123,
131
sad
dle
po
ny,
59B
ard
igia
no
,122
Palo
min
o,13
1Th
oro
ug
hb
red
,124,
138
Shet
lan
dp
on
y,12
4,13
8B
reto
n,
Bro
ulo
nn
ais
and
Hu
ng
aria
nD
rau
gh
t,82Q
uar
tera
nd
Rap
idH
eavy
Dra
ft,77
Prze
wal
ski.83
,124
gD
on
key.
Ave
rag
eva
lues
,2,56
,83,
124
Rag
usa
na,
8Li
tto
ral-
Din
aric
ass,
84Ji
ang
yue,
80M
arti
na
Fran
ca,13
6m
ixo
fmilk
fro
mRa
gu
san
aan
dM
arti
na
Fran
cab
reed
.81
hD
rom
edar
yca
mel
.Ave
rag
eva
lues
fro
mW
adh
a,39
,125
Afr
a,M
uja
hee
nB
lack
,Mal
ahB
lack
and
Safr
a,39
Ham
ra,39
,125
Maj
ahei
m,36
,63,
125
Som
ali,
Turk
ana,
and
Som
ali×
Turk
ana,
87Ja
isal
mer
i,B
ikan
eri,
and
Kac
hch
hi,12
6N
ajd
i,38,7
8A
rvan
a.32
iB
actr
ian
cam
el.A
vera
ge
valu
es,2
Alx
a.65
jLl
ama.
Ave
rag
eva
lues
.17,2
0,51
,91,
130
kA
lpac
a.A
vera
ge
valu
es,20
Hu
acay
a.91
lRe
ind
eer.
Ave
rag
eva
lues
,21,5
3,55
,57,
139
Ala
skan
rein
dee
r.139
mM
oo
se.A
vera
ge
valu
es,2,
23,5
2,12
8d
om
esti
cate
dTa
iga
mo
ose
.140
J Sci Food Agric (2011) c© 2011 Society of Chemical Industry wileyonlinelibrary.com/jsfa

www.soci.org E Medhammar et al.
Musk ox (Ovibos moschatus). The musk ox is an Arctic mammalthat belongs to the subfamily Caprinae, as do goat and sheep.Only data on proximate composition were available for musk ox,obtained from one study (Tener, 1956, cited in Alston-Mills, 1995).2
Although the milk contains more fat than cow milk, the fat content(5.4 milk g 100 g−1) is not high for an Arctic animal.
Equine species mare (Equus ferus caballus) and donkey (Equusafricanus asinus). The milk from these two non-ruminant specieswas very similar to each other: no significant differences (P < 0.05)were seen in protein, fat, lactose, ash or water contents. Both maremilk and donkey milks contained substantially lower amounts oftotal fat and total protein compared with cow milk. The lactose andwater contents of both mare and donkey milks were higher thanof cow milk. The values for ash were nearly half the correspondingvalue for cow milk. Equine milks have been reported to be nearestin composition to human milk because of the high lactose and lowprotein and mineral contents48 and fatty acid composition.49
Camelid species dromedary camel (Camelus dromedaries), Bactriancamel (Camelus bactrianus), llama (Lama glama) and alpaca (Lamapacos). Camelids have a stomach with three compartmentsrather than four but with similar functional properties toruminant stomachs;50 therefore they are sometimes called‘pseudoruminants’.
The lactose and protein contents in the milk from the two camelspecies were similar but their fat contents differed. Bactrian camelmilk varied from dromedary camel milk mainly in fat content: theaverage fat content of Bactrian camel milk was 5 g 100 g−1 milk. Inoverall proximate composition, dromedary camel milk was mostsimilar to cow milk. Alpaca milk was richer in protein and ashthan other camelid milks, having an average protein value of 5.8 g100 g−1 and an average value for ash of 1.6 g 100 g−1 – nearlydouble the values reported in the other milks. Llama milk had thehighest average lactose content in this group, with a maximumreported value of 6.3 g 100 g−1 milk.51
Cervid species reindeer (Rangifer tarandus) and moose (Alces alces).Both these species are noted for their concentrated milk, which hasa cream-like consistency.52,53 Both milks contained on average 7 g100 g−1 or more protein than cow milk. The average fat contentof reindeer milk was almost double that of moose milk and nearlyfive times the value for cow milk. Both reindeer and moose milkwere low in lactose, containing approximately half the value foundin cow milk.
Variations in proximate composition among speciesThe interspecies range between the lowest and highest averageprotein content was nearly 9 g 100 g−1, with the highest valuesreported in cervid milks and the lowest in equine milks. Just onecup (250 mL) of moose or reindeer milk (which provide on average26 g protein) equals the recommended safe level of protein intake(∼26 g per day) for children below 10 years of age.54
Reindeer milk, reported to be second only to marine mammalsin fat content,48 had by far the highest amount of average fat(16 g 100 g−1): the highest individual value reported for reindeermilk was 21.5 g 100 g−1.55 Donkey milk contained the least fat(0.7 g 100 g−1), while mare milk also had a very small average fatcontent (1.6 g 100 g−1), with the lowest value being 0.3 g 100 g−1
for donkey milk.56
The average lactose content was lowest in moose milk (2.6 g100 g−1) and reindeer milk (2.9 g 100 g−1). The Saami people, whoare reindeer herders, are reported to be rather intolerant of lactose;hence reindeer milk is particularly suitable.53
The highest average lactose content was in mare milk (6.6 g100 g−1); donkey and llama milks also had a high content oflactose, with average values of 6.4 and 6.3 g 100 g−1, respectively.The highest reported value for lactose was 7.2 g 100 g−1 in maremilk.57
Reported energy values were available for five of the speciesincluded in this study, and Table 2 includes both reported andcalculated values for energy. The differences between the reportedand calculated energy values can be attributed to a number ofcauses, including the fact that the calculated values are based onthe average values for protein, lactose and fat, and the reportedvalues may not have always included an analysis of all energy-yielding components. Some of the reported values may havebeen for total combustible energy, while others would have beencalculated energy values. The multiplicity of analytical methodsavailable for analysing protein, fat and carbohydrates and thevariety of different available food energy conversion factors canalso lead to different energy values.58
Reindeer milk provided the most energy – more than four timesthe amount from mare and donkey milks. In reindeer milk, the highenergy and protein may be optimal to meet both the growth andenergy requirements of the calf, which enables the calf to survivethe harsh Arctic winter; the concentrated milk is reported to beparticularly suitable for the locomotive lifestyle of the reindeer.55
Mithun and moose milks also provided more than 500 kJ 100 g−1
of energy.The average ash content was highest in musk ox, alpaca and
moose milks (1.6 g 100 g−1), while reindeer milk had a similarlyhigh value of 1.5 g 100 g−1. The highest individual value reportedwas for reindeer milk: 2.7 g 100 g−1. The lowest values were inmare and donkey milks: 0.4 g 100 g−1. In general, an inverserelationship between ash content and lactose content was seen,with milk containing the lowest ash content (mare and donkeymilks) containing the highest lactose content, and vice versa.This is as expected, as lactose, together with sodium, potassiumand chloride ions, plays a major role in maintaining the osmoticpressure in the mammary system.59
Within a species, differences in water content were not verylarge – generally 2–3% – with the exception of reindeer (14%) andyak (9%) milks. In order to see if the large variation in total proteincontent in reindeer milk merely reflected differences in watercontent, the total protein was calculated per 100 g dry weight(DW) basis for the lowest and highest protein values, using thecorresponding water values reported in those studies. The rangethus obtained was 31.6–34.1 g 100 g−1 DW, which still shows adifference of 2.5 g between the lowest and highest values. Whenthe values for total fat in yak milk were reviewed, the study givingthe lowest value (5.6 g 100 g−1) and the study giving the secondhighest value (8.6 g 100 g−1) had the same water content (84.4 g100 g−1), further supporting the conclusion that the range ofvalues does not just correspond to changes in water content.
MineralsThe amount of available data for minerals varied, depending onspecies (Table 3). Buffalo, moose, mare and dromedary camel datawere fairly complete, while data for yak, donkey, Bactrian camel,llama and reindeer were limited. Mithun data were found only for
wileyonlinelibrary.com/jsfa c© 2011 Society of Chemical Industry J Sci Food Agric (2011)
Composition of milk from minor dairy animals and buffalo breeds www.soci.org
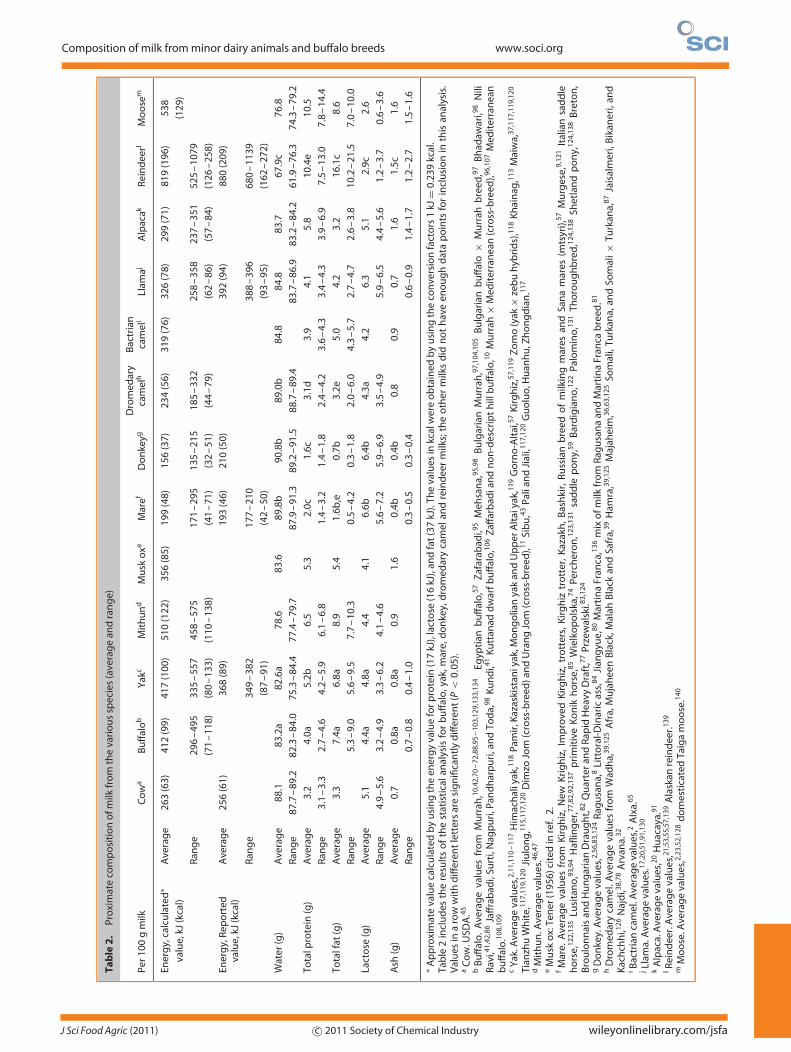
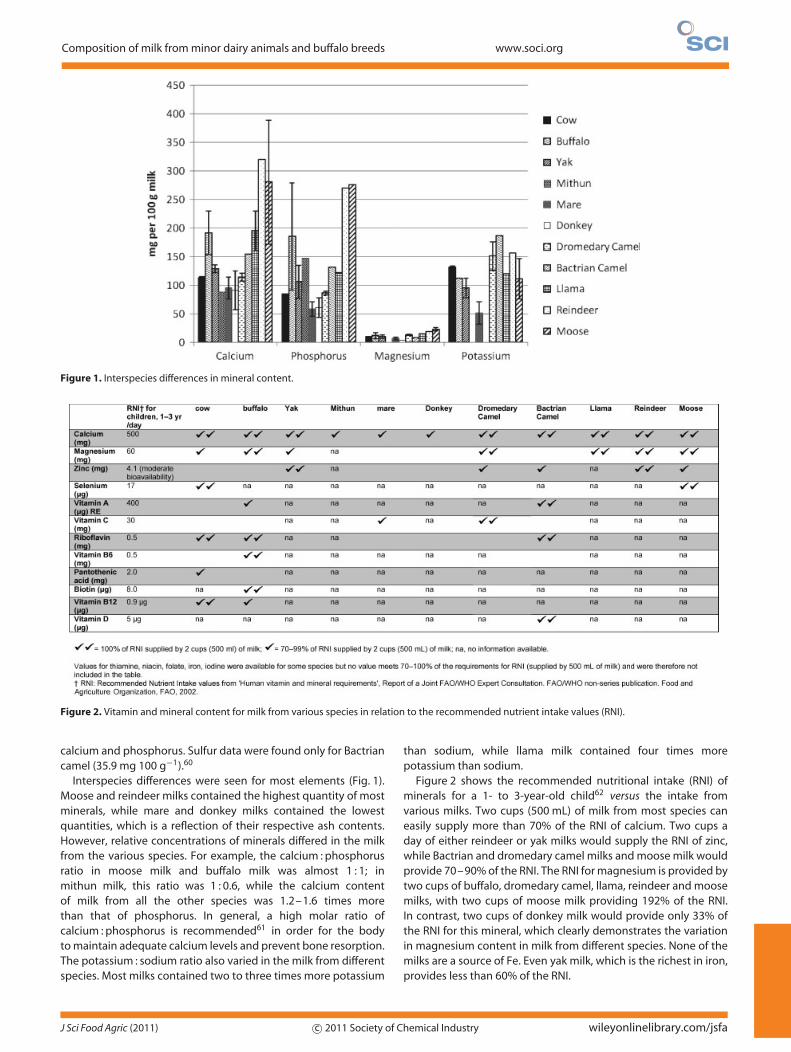
Figure 1. Interspecies differences in mineral content.
Figure 2. Vitamin and mineral content for milk from various species in relation to the recommended nutrient intake values (RNI).
calcium and phosphorus. Sulfur data were found only for Bactriancamel (35.9 mg 100 g−1).60
Interspecies differences were seen for most elements (Fig. 1).Moose and reindeer milks contained the highest quantity of mostminerals, while mare and donkey milks contained the lowestquantities, which is a reflection of their respective ash contents.However, relative concentrations of minerals differed in the milkfrom the various species. For example, the calcium : phosphorusratio in moose milk and buffalo milk was almost 1 : 1; inmithun milk, this ratio was 1 : 0.6, while the calcium contentof milk from all the other species was 1.2–1.6 times morethan that of phosphorus. In general, a high molar ratio ofcalcium : phosphorus is recommended61 in order for the bodyto maintain adequate calcium levels and prevent bone resorption.The potassium : sodium ratio also varied in the milk from differentspecies. Most milks contained two to three times more potassium
than sodium, while llama milk contained four times morepotassium than sodium.
Figure 2 shows the recommended nutritional intake (RNI) ofminerals for a 1- to 3-year-old child62 versus the intake fromvarious milks. Two cups (500 mL) of milk from most species caneasily supply more than 70% of the RNI of calcium. Two cups aday of either reindeer or yak milks would supply the RNI of zinc,while Bactrian and dromedary camel milks and moose milk wouldprovide 70–90% of the RNI. The RNI for magnesium is provided bytwo cups of buffalo, dromedary camel, llama, reindeer and moosemilks, with two cups of moose milk providing 192% of the RNI.In contrast, two cups of donkey milk would provide only 33% ofthe RNI for this mineral, which clearly demonstrates the variationin magnesium content in milk from different species. None of themilks are a source of Fe. Even yak milk, which is the richest in iron,provides less than 60% of the RNI.
J Sci Food Agric (2011) c© 2011 Society of Chemical Industry wileyonlinelibrary.com/jsfa

www.soci.org E Medhammar et al.
Tab
le3
.M
iner
alco
mp
osi
tio
no
fmilk
fro
mth
eva
rio
us
spec
ies
(ave
rag
e,w
ith
ran
ge
inp
aren
thes
es)
Per1
00g
milk
Co
wa
Bu
ffal
ob
Yak
cM
ith
un
dM
aree
Do
nke
yfD
rom
edar
yca
mel
gB
actr
ian
cam
elh
Llam
aiRe
ind
eerj
Mo
ose
kRN
Ilp
erd
ayfo
rch
ildre
n,
1–
3ye
ars
Cal
ciu
m(m
g)
113
191b
129a
,b88
95a
9111
4a,b
153.
719
532
028
0c50
0
(112
–11
6)(1
47–
220)
(119
–13
4)(7
6–
124)
(68
–11
5)(1
05–
120)
(152
.3–
155)
(170
–22
0)(1
56–
358)
Iro
n(m
g)
0.03
0.17
0.57
0.10
0.21
0.31
5(1
2%b
ioav
aila
bili
ty)
(0.0
0–
0.07
)(0
.15
–0.
98)
(0.0
3–
0.15
)(0
.17
–0.
26)
Mag
nes
ium
(mg
)10
12a
107a
413
a,b
8.1
1519
23b
60
(7–
12)
(2–
16)
(8–
12)
(4–
12)
(12
–14
)(1
9–
26)
Pho
sph
oru
s(m
g)
8418
5a10
6a,b
147
58b
6186
a,b
131.
512
227
027
6
(59
–95
)(1
02–
293)
(77
–13
5)(4
3–
83)
(49
–73
)(8
3–
90)
(117
–14
5.9)
Pota
ssiu
m(m
g)
132
112
9551
a50
151b
186.
112
015
611
1a,b
(106
–16
3)(8
3–
107)
(25
–87
)(1
24–
173)
(181
.2–
191)
(82
–15
0)
Sod
ium
(mg
)43
4729
1622
6666
.427
.248
78
(26
–58
)(2
1–
38)
(13
–20
)(5
9–
73)
(60.
8–
72)
(46
–50
)(3
7–
158)
Zin
c(m
g)
0.4
0.5
0.9
0.2
0.6
0.7
1.1
0.6
4.1
(mo
der
ate
bio
avai
lab
ility
)
(0.3
–0.
5)(0
.7–
1.1)
(0.2
–0.
3)(0
.4–
0.6)
Co
pp
er(m
g)
0.03
0.02
0.41
0.05
0.15
0.29
(0.0
0–
0.08
)(0
.02
–0.
11)
(0.1
2–
0.17
)
Sele
niu
m(µ
g)
3.7
1117
(0.0
–8.
8)
Iod
ine
(µg
)4
75
Man
gan
ese
(µg
)4
106
1
(0–
8)(6
0–
180)
Ch
lori
de
(mg
)57
1934
152
6880
Tab
le3
incl
ud
esth
ere
sult
so
fth
est
atis
tica
lan
alys
isfo
rbu
ffal
o,y
ak,m
are,
dro
med
ary
cam
elan
dm
oo
sem
ilks;
the
oth
erm
ilks
did
no
thav
een
ou
gh
dat
ap
oin
tsfo
rin
clu
sio
nin
this
anal
ysis
.Val
ues
ina
row
wit
hd
iffer
ent
sup
ersc
rip
tsar
esi
gn
ifica
ntl
yd
iffer
ent
(P<
0.05
).a
Co
w.U
SDA
.45
bB
uff
alo
.Ave
rag
eva
lues
fro
mEg
ypti
anb
uff
alo
,57K
utt
anad
dw
arfb
uff
alo
,106
Meh
san
aan
dZ
afar
abad
i,95M
urr
ah.95
,129
,134
cY
ak.A
vera
ge
valu
esfr
om
,111,
113
Kh
ain
ag(y
akh
ybri
d),11
3M
aiw
a.37
,115
Co
bal
t.111
dM
ith
un
.Ave
rag
eva
lues
.47
eM
are.
Ave
rag
eva
lues
fro
mIt
alia
nsa
dd
leh
ors
e,12
2,13
5H
aflin
ger
,137
Perc
her
on
,15B
ard
igia
no
,122
Palo
min
o,13
1Th
oro
ug
hb
red
,124,
138
Shet
lan
dp
on
y,12
4,13
8Pr
zew
alsk
iho
rse,
83,1
24Lu
sita
no
.94
fD
on
key.
Ave
rag
eva
lues
fro
m,83
mix
ofR
agu
san
aan
dM
arti
na
Fran
cam
ilk.81
gD
rom
edar
yca
mel
.Ave
rag
eva
lues
fro
mM
ajah
eem
,Wad
ah,H
amra
,125
Naj
di,38
Arv
ana.
64
hB
actr
ian
cam
el.A
vera
ge
valu
esfr
om
Alx
a.60
,65
iLl
ama.
Ave
rag
eva
lues
.17,5
1
jRe
ind
eer.
Ave
rag
eva
lues
.21,1
39
kM
oo
se.A
vera
ge
valu
es,52
Ala
skan
mo
ose
,141
and
do
mes
tica
ted
Taig
am
oo
se.14
0
lRN
I:Re
com
men
ded
Nu
trie
nt
Inta
keva
lues
forc
hild
ren
,1–
3ye
ars,
fro
m‘H
um
anvi
tam
inan
dm
iner
alre
qu
irem
ents
’.62
wileyonlinelibrary.com/jsfa c© 2011 Society of Chemical Industry J Sci Food Agric (2011)

Composition of milk from minor dairy animals and buffalo breeds www.soci.org
Tab
le4
.V
itam
inco
nte
nt
ofm
ilkfr
om
the
vari
ou
ssp
ecie
s(a
vera
ge,
wit
hra
ng
ein
par
enth
eses
)
Per1
00g
milk
Co
wa
Bu
ffal
ob
Mar
ecD
on
keyd
Dro
med
ary
Cam
ele
Bac
tria
nca
mel
fRN
Igfo
rch
ildre
n,1
–3
year
s)
Vit
amin
A(µ
g)R
EA
vera
ge
4669
97M
ean
req
uir
emen
t:40
0µg
RE/d
ay
Vit
amin
E(m
g)(
α-t
oco
ph
ero
l)A
vera
ge
0.07
0.19
0.15
(0.0
3–
0.08
)(0
.19
–0.
20)
Thia
min
e(m
g)
Ave
rag
e0.
050.
050.
030.
060.
010.
5m
g/d
ay
(0.0
4–
0.05
)(0
.02
–0.
04)
Rib
ofla
vin
(mg
)A
vera
ge
0.17
0.11
0.02
0.03
0.06
0.12
0.5
mg
/day
(0.1
6–
0.20
)(0
.01
–0.
03)
Nia
cin
(mg
)A
vera
ge
0.09
0.17
0.07
0.09
6∗m
g/d
ay
(0.0
7–
0.12
)
Pan
toth
enic
acid
(mg
)A
vera
ge
0.37
0.15
2.0
mg
/day
(0.3
6–
0.38
)
Vit
amin
B6
(mg
)A
vera
ge
0.04
0.33
0.05
0.5
mg
/day
(0.0
3–
0.04
)
Fola
te(µ
g)
Ave
rag
e5
0.6
160
µg/d
ay
Bio
tin
(µg
)A
vera
ge
138.
0µg
/day
Vit
amin
B12
(µg
)A
vera
ge
0.45
0.40
0.9
µg/d
ay
(0.2
7–
0.53
)
Vit
amin
C(m
g)
Ave
rag
e0
2.5
4.3
6.7
3.0
30m
g/d
ay
(1.7
–8.
1)(2
.5–
18.4
)
Vit
amin
D(µ
g)
1.6
5µg
/day
aC
ow
.45
bB
uff
alo
.Ave
rag
eva
lues
fro
mEg
ypti
anb
uff
alo
57an
dM
urr
ah.10
0
cM
are.
Ave
rag
eva
lues
fro
mPe
rch
ero
n,12
3sa
dd
lep
on
y,12
3an
dPa
lom
ino
.131
dD
on
key.
Ave
rag
eva
lues
.48
eD
rom
edar
yca
mel
.Ave
rag
eva
lues
fro
mM
ajah
eem
,63A
rvan
a,64
Ara
bi,
An
afi,B
ish
ari.13
2
fB
actr
ian
cam
el.A
vera
ge
valu
esfr
om
Alx
a.65
gRN
I:Re
com
men
ded
Nu
trie
nt
Inta
keva
lues
forc
hild
ren
,1–
3ye
ars
fro
m‘H
um
anvi
tam
inan
dm
iner
alre
qu
irem
ents
.62
∗ mg
NE,
nia
cin
equ
ival
ents
;RE,
reti
no
leq
uiv
alen
ts.
J Sci Food Agric (2011) c© 2011 Society of Chemical Industry wileyonlinelibrary.com/jsfa
www.soci.org E Medhammar et al.
The low Fe content is one of the reasons why animal milks arenot recommended in the complementary feeding of infants below12 months.
VitaminsData for vitamins were limited, or absent altogether for severalof the species studied here. Available data are shown in Table 4.Dromedary camel milk had the highest average value for vitamin C(6.7 mg 100 g−1 milk), with the values ranging from 2.5 mg 100 g−1
(Majaheem breed)63 to 18.4 mg 100 g−1 milk (Arvana breed).64 Theavailability of even a moderate amount of vitamin C in camel milkis reported to have significant relevance to nutrition in areas wheregreen vegetable and fruits are hard to find (Sawaya et al., 1984,cited in Zhang et al., 2005).65 However, vitamin C in camel milk isreported to be more heat sensitive than in cow milk, decreasingby about 27% when the milk is pasteurized.63 While a value forvitamin C in cow milk is not available in the USDA database (0 mg100 g−1 milk), other databases (McCanes and Widdowson, DanishFood Composition Database and Colombian Food CompositionTable) report values from 1.2 to 2 mg 100 g−1 milk. Two cups ofdromedary camel milk can supply the RNI of vitamin C, while twocups of mare milk can supply 72% RNI (Fig. 2).
Buffalo milk had a vitamin B6 content of 0.33 mg 100 g−1, nearlyan order of magnitude larger than that of cow milk. Two cups ofbuffalo milk can provide 330% of the RNI (0.5 mg per day) of vitaminB6 for a 1- to 3-year-old child, while the same quantity of Bactriancamel milk and cow milk provide 50%RNI and 40% RNI, respec-tively. The RNI of riboflavin, 0.5 mg per day, can be provided by twocups of cow, buffalo or Bactrian camel milks, while mare, donkeyand dromedary milks can provide 20–60% of the RNI. Buffalo milkwas rich in biotin; even 100 g of milk can easily provide the RNI.Vitamin D is reported in Bactrian camel milk at 1.6 µg 100 g−1,65
with two cups of milk providing 160% of the RNI. However, forniacin and folate, two cups of milk a day from any of the dairyspecies listed in Fig. 2 are not able to provide even 20% of the RNI.
Amino acidsThe high-quality protein in milk plays a crucial role in nutrition,especially in the developing world where diets are largely cerealbased. Lysine is commonly limiting in wheat- or maize-based diets,being present at 57% and 58% of requirement levels.54 In cassava-based diets the branched-chain amino acids leucine, valine andisoleucine are the limiting amino acids, being present at 79% ofrequirement levels.54
Table 5(a) shows the distribution of amino acids as grams ofamino acid per100 g total protein. Table 5(b) shows the adultindispensable amino acid requirement,54 together with the aminoacid content of the milks expressed as a percentage of therequirement pattern values. It is clear that all milks are a richsource of indispensable amino acids, regardless of species.
It is useful to consider how the amino acid content of milk fromdifferent species compare, per equal volume of milk, as shown inTable 6. As expected, the amino acid content reflects the proteincontent; donkey milk contained the lowest amounts of AA andreindeer milk contained the highest, per 100 g milk. The lysinecontent of buffalo milk was double that of cow milk. However,the lysine value of standardized cow milk, 137 mg 100 g−1 milk,is lower than is usual for cow milk. For example, other values forcow milk in the USDA database vary from 246 to 287 mg 100 g−1
milk, while the value in the Danish Food Composition Database is310 mg 100 g−1 milk. Only yak milk (375 mg 100 g−1) and reindeermilk (909 mg 100 g−1) exceed these values.
Milk proteinsThe major milk proteins are caseins (αS1-, αS2-, β-, κ- andγ -caseins) and whey proteins, which include α-lactalbumin, β-lactoglobulin, serum albumin, lactoferrin, immunoglobulins andlysozyme. Although the content of milk proteins is generallyproportional to the total protein content, the pattern of milkproteins varies among species.
The casein fraction in total protein varies with species (Table 7).In mare and donkey milks it was on average 43% and 45% oftotal protein, respectively, while in dromedary and reindeer milkit was 86% and 80% of total protein, respectively. Reindeer milk,which has the highest protein content from the above species,contains nearly12 times as much casein per 100 g milk as donkeymilk, which contained the lowest average protein. The two equinemilks had the lowest amount of total whey proteins per 100 g milk,even though whey proteins make up 40–50% of the total proteinin these milks, compared with less than 20% in cow milk.56
Dromedary camel, Bactrian camel and llama milks are reportednot to contain measurable amounts of β-lactoglobulin;17,66,67 oneof the main proteins associated with cow milk allergy.
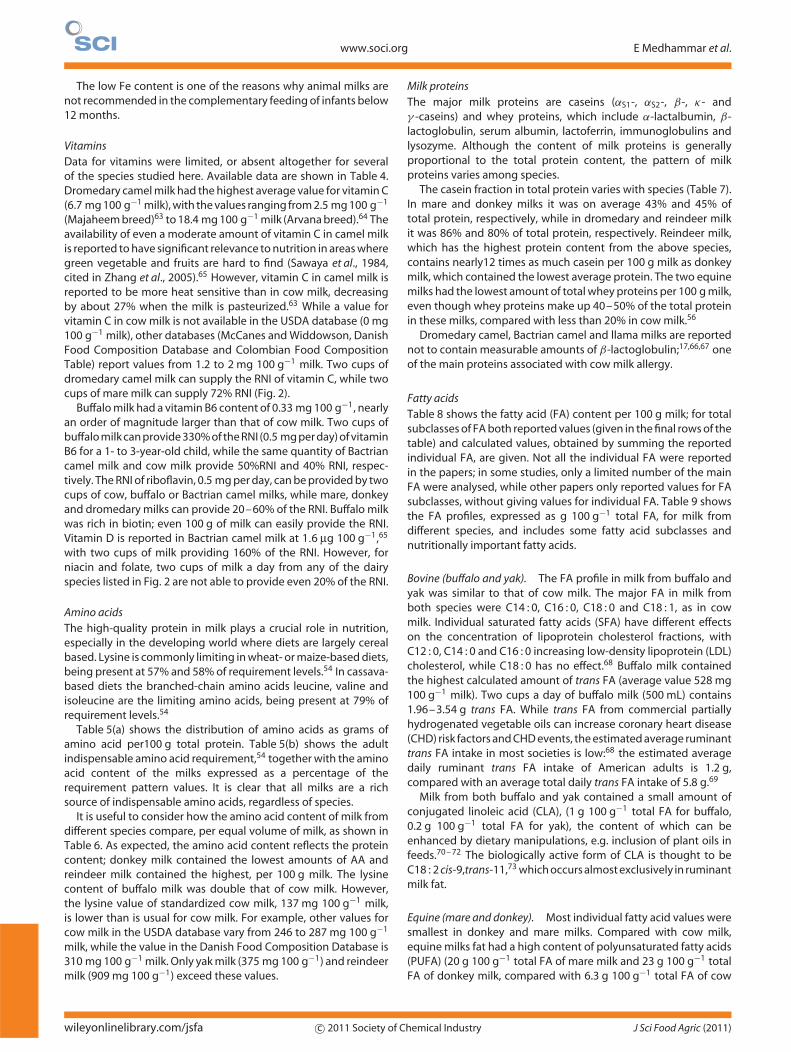
Fatty acidsTable 8 shows the fatty acid (FA) content per 100 g milk; for totalsubclasses of FA both reported values (given in the final rows of thetable) and calculated values, obtained by summing the reportedindividual FA, are given. Not all the individual FA were reportedin the papers; in some studies, only a limited number of the mainFA were analysed, while other papers only reported values for FAsubclasses, without giving values for individual FA. Table 9 showsthe FA profiles, expressed as g 100 g−1 total FA, for milk fromdifferent species, and includes some fatty acid subclasses andnutritionally important fatty acids.
Bovine (buffalo and yak). The FA profile in milk from buffalo andyak was similar to that of cow milk. The major FA in milk fromboth species were C14 : 0, C16 : 0, C18 : 0 and C18 : 1, as in cowmilk. Individual saturated fatty acids (SFA) have different effectson the concentration of lipoprotein cholesterol fractions, withC12 : 0, C14 : 0 and C16 : 0 increasing low-density lipoprotein (LDL)cholesterol, while C18 : 0 has no effect.68 Buffalo milk containedthe highest calculated amount of trans FA (average value 528 mg100 g−1 milk). Two cups a day of buffalo milk (500 mL) contains1.96–3.54 g trans FA. While trans FA from commercial partiallyhydrogenated vegetable oils can increase coronary heart disease(CHD) risk factors and CHD events, the estimated average ruminanttrans FA intake in most societies is low:68 the estimated averagedaily ruminant trans FA intake of American adults is 1.2 g,compared with an average total daily trans FA intake of 5.8 g.69
Milk from both buffalo and yak contained a small amount ofconjugated linoleic acid (CLA), (1 g 100 g−1 total FA for buffalo,0.2 g 100 g−1 total FA for yak), the content of which can beenhanced by dietary manipulations, e.g. inclusion of plant oils infeeds.70 – 72 The biologically active form of CLA is thought to beC18 : 2 cis-9,trans-11,73 which occurs almost exclusively in ruminantmilk fat.
Equine (mare and donkey). Most individual fatty acid values weresmallest in donkey and mare milks. Compared with cow milk,equine milks fat had a high content of polyunsaturated fatty acids(PUFA) (20 g 100 g−1 total FA of mare milk and 23 g 100 g−1 totalFA of donkey milk, compared with 6.3 g 100 g−1 total FA of cow
wileyonlinelibrary.com/jsfa c© 2011 Society of Chemical Industry J Sci Food Agric (2011)

Composition of milk from minor dairy animals and buffalo breeds www.soci.org
Table 5(a). Distribution of amino acids in milks as grams amino acid per 100 g total protein
Cowa Buffalob Yakc Donkeyd Reindeere
Average total protein (g 100 g−1 milk): 3.2 4.0 5.2 1.6 10.4
Amino acids: (g AA 100 g−1 protein)
Isoleucine 5.03 4.85 4.38 5.44 4.42
Leucine 8.13 9.20 12.23 8.44 9.34
Lysine 4.28 7.48 7.21 7.19 8.74
Methionine 2.28 2.33 2.75 1.75 2.61
Phenylalanine 4.50 4.58 4.48 4.25 4.48
Threonine 4.38 4.35 4.12 3.50 4.53
Tryptophan 2.28 1.63 1.38
Valine 5.88 5.85 6.02 6.38 5.83
Cysteine 0.50 0.83 0.98 0.44 0.75
Tyrosine 4.63 4.53 3.31 3.63 5.41
Arginine 2.28 2.55 3.79 4.50 2.97
Histidine 2.28 2.73 2.25 2.81
Alanine 3.16 3.03 2.63 3.44 3.08
Aspartic acid 7.25 7.13 6.69 8.75 6.42
Glutamic acid 19.8 21.4 16.6 22.4 20.3
Glycine 2.28 1.93 2.65 1.19 2.24
Proline 10.4 12.0 2.46 8.63 9.26
Serine 3.25 4.65 3.88 6.13 5.46
Total 92.6 99.4 85.8 98.3 100.1
a Cow.45
b Buffalo. Average values from Bulgarian Murrah.142
c Yak. Average values,11 from Khainag (yak hybrid,113 Maiwa.37
d Donkey. Average values from Jiangyue.80
e Reindeer. Average values,53 (Malinen et al., 2002; Holand et al., unpublished data; Luick et al., 1974).
Table 5(b). Distribution of amino acids in milks, expressed as a percentage of requirement pattern
Percentage of requirement patternRequirement pattern (adult indispensable
AA requirement∗) in mg g−1 protein Cowa Buffalob Yakc Donkeyd Reindeere
Isoleucine 30 168 162 146 181 147
Leucine 59 138 156 207 143 158
Lysine 45 95 166 160 160 194
Threonine 23 190 189 179 152 197
Tryptophan 6 380 272 231
Valine 39 151 150 154 163 149
Histidine 15 152 182 150 187
Phe + Tyr 38 240 239 205 207 260
Met + Cys 22 126 143 170 99 153
∗ ‘Protein and amino acid requirements in human nutrition’. Report of a joint WHO/FAO/UNU Expert Consultation. WHO technical Report series, p.935. Mean nitrogen requirement of 105 mg nitrogen kg−1 per day (0.66 g protein kg−1 per day).Met + Cys, methionine and cysteine, sulfur AA; Phe + Tyr, phenylalanine + tyrosine.a Cow.45
b Buffalo. Average values from Bulgarian Murrah.142
c Yak. Average values,11 from Khainag (yak hybrid),113 Maiwa.37
d Donkey. Average values from Jiangyue.80
e Reindeer. Average values,53 (Malinen et al., 2002; Holand et al., unpublished data; Luick et al., 1974).
milk) and a low content of SFA, particularly mare milk, whichhad an average value of 38 g 100 g−1 total FA, compared with60 g 100 g−1 total FA in cow milk. There is convincing evidencethat replacing SFA (C12 : 0–C16 : 0) with PUFA decreases LDLcholesterol concentration and the total/high-density lipoprotein(HDL) cholesterol ratio.68
In addition, the milks contained α-linolenic acid (ALA) andlinoleic acid (LA), which are essential since they cannot besynthesized by humans.68 The highest values reported in mare milkwere 20 g 100 g−1 total FA for ALA in the milk from the primitiveKonik horse – an average for lactation months 1–674 – and 16 g100 g−1 total FA for LA in Wielkopolska mares – an average for
J Sci Food Agric (2011) c© 2011 Society of Chemical Industry wileyonlinelibrary.com/jsfa

www.soci.org E Medhammar et al.
Table 6. Average amino acid composition (mg 100 g−1 milk) of cow, buffalo, yak, donkey and reindeer milks, with ranges in parenthesis
mg 100 g−1 milk Average Cowa Buffalob Yakc Donkeyd Reindeere
Isoleucine 161 194 228 87 460
(446–468)
Leucine 260 368 636 135 971
(958–987)
Lysine 137 299 375 115 909
(284–466) (804–1099)
Methionine 73 93 143 28 271
(243–295)
Phenylalanine 144 183 233 68 466
(211–254) (458–471)
Threonine 140 174 214 56 471
(206–223) (454–482)
Tryptophan 73 85 144
(132–155)
Valine 188 234 313 102 606
(287–339) (580–630)
Cysteine 16 33 51 7 78
(74–81)
Tyrosine 148 181 172 58 563
(550–573)
Arginine 73 102 197 72 309
(265–383)
Histidine 73 109 36 292
(255–363)
Alanine 101 121 137 55 320
(312–332)
Aspartic acid 232 285 348 140 668
(641–682)
Glutamic acid 634 857 864 358 2116
(1931–2319)
Glycine 73 77 138 19 233
(227–238)
Proline 334 481 128 138 963
(937–1011)
Serine 104 186 202 98 568
(554–580)
a Cow.45
b Buffalo. Average values from Bulgarian Murrah.142
c Yak. Average values,11 from Khainag (yak hybrid),113 Maiwa.37
d Donkey. Average values from Jiangyue.80
e Reindeer. Average values,53 (Malinen et al., 2002; Holand et al., unpublished data; Luick et al., 1974).
lactation months 1–6,74 compared with 3.23 g 100 g−1 total FAfor LA in cow milk.75
The fatty acid composition in mare milk is reported to be similarto that of human milk,49 and particularly relevant for humannutrition.76 The high LA and ALA contents and low C18 : 0 areattributed to monogastric animals: the microbial hydrogenationof fatty acid in the digestive tract does not occur before intestinalabsorption in equines, as in the ruminant tract (Jenkins et al.,1996, cited in Chiofalo et al., 2001).8 Therefore, the high contentof unsaturated long-chain FA in equine milk is related to amountsconsumed with forage.8,77
It is interesting to note that although mare milk had the secondlowest content of total fat per 100 g milk, it contains the highestamount of total n-3 fatty acids per 100 g milk, an average of99 mg 100 g−1 and range of 58–307 mg 100 g−1, because of
the high content of ALA (average 94 mg 100 g−1). It has beensuggested that mare milk may be used in infant nutrition, as thelivers of infants are probably capable of transforming these FAinto eicosapentaenoic acid (EPA), docosahexaenoic acid (DHA)and arachidonic acid.76 The n-3 fatty acids EPA and DHA, as partof a healthy diet, can contribute to the prevention of coronaryheart disease (CHD) and possibly other degenerative diseasesassociated with ageing.68 For populations with no access to n-3 FAfrom fish, e.g. Mongolia, intake of mare milk is crucial for meetingrequirements (adequate intake of 100–150 mg EPA+DHA for a 2-to 4-year-old child; acceptable macronutrient distribution rangeof 0.25–2 g per day for adults).68
Camelids (dromedary camel, Bactrian camel and llama). Indromedary camel milk, the monounsaturated fatty acid (MUFA)
wileyonlinelibrary.com/jsfa c© 2011 Society of Chemical Industry J Sci Food Agric (2011)

Composition of milk from minor dairy animals and buffalo breeds www.soci.org
Tab
le7
.M
ilkp
rote
ins:
aver
age,
wit
hra
ng
ein
par
enth
eses
Per1
00g
milk
Bu
ffal
oa
Yak
bM
ith
un
cM
ared
Do
nke
yeD
rom
edar
yca
mel
fB
actr
ian
cam
elg
Llam
ahRe
ind
eeri
Mo
ose
j
Tota
lpro
tein
(g)
4.0
5.2
6.5
2.0
1.6
3.1
3.9
4.1
10.4
10.5
(2.7
–4.
6)(4
.2–
5.9)
(6.1
–6.
8)(1
.4–
3.2)
(1.4
–1.
8)(2
.4–
4.2)
(3.6
–4.
3)(3
.4–
4.3)
(7.5
–13
.0)
(7.8
–14
.4)
Nit
rog
en,t
ota
l(g
)1.
00.
280.
290.
40.
81.
2
(0.2
6–
0.32
)(0
.4–
0.5)
(0.5
6–
1.16
)
Wh
eyp
rote
in(m
g)
1505
790
760
1012
(142
0–
1590
)(6
65–
955)
(680
–85
0)
Cas
ein
(mg
)31
1030
6044
5085
571
426
5232
0083
00
(302
0–
3200
)(2
111
–38
00)
(427
0–
4770
)(8
35–
890)
(612
–87
0)(1
900
–32
90)
(800
0–
8600
)
β-C
asei
n(m
g)
1100
α-C
asei
n(m
g)
1200
Lyso
zym
e(m
g)
157
(100
–22
7)
Lact
ofe
rrin
(mg
)67
3021
22
(29
–31
)
β-L
acto
glo
bu
lin(m
g)
708
305
(534
–88
2)(2
03–
375)
α-L
acta
lbu
min
(mg
)19
817
734
0
(193
–20
4)(1
53–
197)
Imm
un
og
lob
ulin
(mg
)19
2383
64
Seru
mal
bu
min
(mg
)10
735
(79
–13
4)(2
8–
42)
aB
uff
alo
.Ave
rag
eva
lues
fro
mM
urr
ah13
3an
dEg
ypti
anb
uff
alo
.57
bY
ak.A
vera
ge
valu
es,11
,143
Go
rno
-Alt
ai,57
Mai
wa,
37an
dJi
ulo
ng
.115
cM
ith
un
.Ave
rag
eva
lues
.46,4
7,14
4
dM
are.
Ave
rag
eva
lues
fro
mPr
zew
alsk
iho
rse,
83H
aflin
ger
,Qu
arte
r,an
dRa
pid
Hea
vyD
raft
.77
eD
on
key.
Ave
rag
eva
lues
,16,5
6,83
Jian
gyu
e,80
mix
ofR
agu
san
aan
dM
arti
na
Fran
cam
ilk.81
fD
rom
edar
yca
mel
.Ave
rag
eva
lues
fro
mW
adah
Ham
ra,a
nd
Maj
ahei
m,12
5an
dA
rvan
a.20
gB
actr
ian
cam
el.A
vera
ge
valu
esfr
om
Alx
a65an
dK
azak
h.12
7
hLl
ama.
Ave
rag
eva
lues
.17,1
30
iRe
ind
eer.
Ave
rag
eva
lues
.57,1
39
jM
oo
se.A
vera
ge
valu
esfr
om
do
mes
tica
ted
Taig
am
oo
se.14
0
J Sci Food Agric (2011) c© 2011 Society of Chemical Industry wileyonlinelibrary.com/jsfa

www.soci.org E Medhammar et al.
Tab
le8
.Fa
tty
acid
s(m
g10
0g
−1m
ilk)i
nm
ilkfr
om
the
vari
ou
ssp
ecie
s(a
vera
ge,
wit
hra
ng
ein
par
enth
eses
)
Co
wa
Bu
ffal
ob
n=
Bu
ffal
ob
Yak
c
(n=
1,ra
ng
eg
iven
wh
ere
n=
2)M
ared
n=
Mar
edD
on
keye
n=
Do
nke
yeD
rom
edar
yf
n=
Dro
med
aryf
cam
el
Bac
tria
ng
cam
el(n
=3
anim
als)
Llam
ahRe
ind
eeri
n=
Rein
dee
ri
Mo
ose
j
(n=
1,ra
ng
eg
iven
wh
ere
n=
2)
Tota
lfat
3.3
7.4
6.8
1.6
0.72
3.0
5.0
4.2
16.1
8.6
(g10
0g
−1
milk
)(5
.3–
9.0)
(5.6
–9.
5)(0
.5–
4.2)
(0.3
–1.
8)(2
.0–
6.0)
(4.3
–5.
7)(2
.7–
4.7)
(10.
2–
21.5
)
Fatt
yac
id(m
g1
00
g−1
milk
)
Satu
rate
dFA
C4
:075
829
49
12
31
386
395
336
(237
–38
0)(1
–2)
(2–
4)(5
10–
133)
(33
–38
)
C6
:075
1116
19
32
61
710
93
320
4
(114
–27
8)(1
–3)
(4–
7)(1
12–
474)
C7
:01
18
C8
:075
1111
513
322
612
596
381
696
(71
–18
5)(1
3–
49)
(46
–77
)(3
–7)
(28
–12
4)
C9
:01
352
C10
:075
1431
859
1365
289
38
114
410
923
1
(113
–12
24)
(31
–10
5)(6
7–
112)
(4–
13)
(61
–15
5)
C11
:01
12
C12
:077
1420
989
1373
238
329
2168
415
237
(75
–10
0)(1
47–
333)
(43
–11
5)(3
8–
38)
(25
–33
)(1
5–
24)
(93
–21
7)(2
4–
50)
C13
:07
22
1932
114
(1–
3)(1
4–
24)
C14
:029
714
922
419
1378
228
432
929
347
84
1720
210
(194
–33
4)(6
83–
1254
)(5
6–
110)
(21
–35
)(1
32–
476)
(233
–34
0)(1
190
–24
90)
(166
–25
3)
Cis
o14
:03
Tr1
11
C15
:03
168
667
72
24
4159
683
137
60
(155
–17
6)(5
–12
)(1
–2)
(17
–56
)(4
8–
74)
(103
–15
5)(5
0–
70)
Cis
o15
:04
2(1
–3)
229
(18
–41
)
Can
teis
o15
:02
61(5
1–
71)
C16
:082
914
2520
1890
1726
02
554
876
1044
1300
452
7018
93
(534
–93
8)(2
060
–35
70)
(148
0–
2310
)(1
50–
312)
(41
–69
)(6
06–
1150
)(7
80–
1190
)(3
710
–69
50)
(143
5–
2352
)
Cis
o16
:03
21
47
(2–
3)
Sum
C12
:0–
1200
3820
2460
424
142
1512
8014
1719
5074
4022
00
C16
:0(3
050
–53
30)
(205
0–
2880
)(2
58–
558)
(115
–16
8)(7
80–
1720
)(1
076
–16
00)
(524
0–
1000
0)(1
680
–27
30)
C17
:02
6741
75
21
428
4010
93
6185
(63
–72
)(4
–7)
(1–
1)(1
6–
40)
(24
–48
)(4
7–
80)
wileyonlinelibrary.com/jsfa c© 2011 Society of Chemical Industry J Sci Food Agric (2011)

Composition of milk from minor dairy animals and buffalo breeds www.soci.org
Tab
le8
.(C
onti
nued
) Co
wa
Bu
ffal
ob
n=
Bu
ffal
ob
Yak
c
(n=
1,ra
ng
eg
iven
wh
ere
n=
2)M
ared
n=
Mar
edD
on
keye
n=
Do
nke
yeD
rom
edar
yf
n=
Dro
med
aryf
cam
el
Bac
tria
ng
cam
el(n
=3
anim
als)
Llam
ahRe
ind
eeri
n=
Rein
dee
ri
Mo
ose
j
(n=
1,ra
ng
eg
iven
wh
ere
n=
2)
Cis
o17
:04
42
45
(3–
5)(2
8–
63)
C18
:036
514
952
964
1313
25
434
678
143
74
2120
1044
(220
–42
8)(5
48–
1237
)(7
51–
1180
)(8
–20
)(4
–7)
(299
–40
1)(7
24–
869)
(138
0–
2740
)
Cis
o18
:02
8(6
–10
)
C19
:01
19
C20
:03
832
14
1750
151
239
(73
–97
)(0
–1)
(14
–20
)
C21
:01
13
C22
:016
2Tr
25
413
118
(3–
7)
C23
:02
2(1
–3)
Tota
lSFA
∗18
7058
1035
4055
031
020
8022
3729
4011
240
4540
(426
0–
8810
)(2
920
–41
80)
(320
–75
0)(2
40–
380)
(151
0–
2600
)(1
849
–25
17)
(751
0–
1507
0)(3
110
–59
60)
Tota
lC4
–C
10∗
300
888
5910
115
937
540
514
8196
7
(535
–20
67)
(46
–15
9)(1
19–
200)
(369
–38
2)(7
29–
2098
)(7
41–
1193
)
Mo
no
un
satu
rate
dFA
C8
:11
145
C10
:13
1413
152
111
522
(12
–19
)(7
–22
)(8
–13
)
C12
:112
22
11
5541
(1–
4)(1
–2)
C13
:11
10
C14
:18
5519
137
25
340
1717
71
4354
(38
–81
)(4
–9)
(1–
8)(8
–61
)(1
2–
26)
C15
:14
3(3
–5)
C16
:111
147
613
723
292
171
296
298
(74
–25
2)(6
1–
91)
(171
–36
2)(1
07–
219)
(239
–35
6)
C16
:1n
-75
72
111
335
(5–
8)(9
–14
)
C16
:1ci
s-9
570
(55
–82
)
C17
:13
256
62
1
(22
–28
)(1
–11
)(1
–2)
C17
:1n
-81
14
C18
:181
214
1824
1101
1723
02
464
622
1119
733
424
9020
64
(501
–92
8)(1
131
–22
61)
(60
–38
5)(3
5–
58)
(381
–86
4)(7
61–
1424
)(1
720
–29
30)
(175
5–
2372
)
J Sci Food Agric (2011) c© 2011 Society of Chemical Industry wileyonlinelibrary.com/jsfa

www.soci.org E Medhammar et al.
Tab
le8
.(C
onti
nued
) Co
wa
Bu
ffal
ob
n=
Bu
ffal
ob
Yak
c
(n=
1,ra
ng
eg
iven
wh
ere
n=
2)M
ared
n=
Mar
edD
on
keye
n=
Do
nke
yeD
rom
edar
yf
n=
Dro
med
aryf
cam
el
Bac
tria
ng
cam
el(n
=3
anim
als)
Llam
ahRe
ind
eeri
n=
Rein
dee
ri
Mo
ose
j
(n=
1,ra
ng
eg
iven
wh
ere
n=
2)
C18
:1ci
sn
-11
310
45
161
106
(78
–13
1)(1
2–
21)
C18
:1ci
sn
-12
137
C18
:1ci
sn
-13
114
C19
:11
46
C20
:19
4(1
–5)
1494
C20
:1n
-71
16
C20
:1n
-91
14
20:1
n-1
12
2(1
–2)
C21
:11
95
C22
:12
36(1
9–
53)
27
C24
:17
Tota
lMU
FA∗
812
2170
1180
432
7722
0013
0712
6027
3025
40
(136
0–
2770
)(2
10–
643)
(56
–99
)(1
787
–25
50)
(894
–16
57)
(196
0–
3170
)
Poly
un
satu
rate
dFA
C16
:210
9
C16
:345
C16
:425
C18
:212
08
9685
812
22
108
5997
7
(75
–13
9)(7
2–
106)
(58
–20
0)(9
7–
118)
(281
–16
73)
C18
:29-
c,12
-c3
93(9
0–
96)
C18
:375
952
613
184
(129
–25
6)2
8021
4
(11
–10
4)(4
5–
115)
(121
–30
6)
C18
:36-
9-12
-c1
1
C18
:39-
12-1
5-c
357
(26
–74
)
C20
:25
3(2
–4)
11
C20
:449
C20
:530
C22
:446
C22
:55
C22
:65
wileyonlinelibrary.com/jsfa c© 2011 Society of Chemical Industry J Sci Food Agric (2011)

Composition of milk from minor dairy animals and buffalo breeds www.soci.org
Tab
le8
.(C
onti
nued
)
Co
wa
Bu
ffal
ob
n=
Bu
ffal
ob
Yak
c
(n=
1,ra
ng
eg
iven
wh
ere
n=
2)M
ared
n=
Mar
edD
on
keye
n=
Do
nke
yeD
rom
edar
yf
n=
Dro
med
aryf
cam
el
Bac
tria
ng
cam
el(n
=3
anim
als)
Llam
ahRe
ind
eeri
n=
Rein
dee
ri
Mo
ose
j
(n=
1,ra
ng
eg
iven
wh
ere
n=
2)
n-3
C18
:32
5214
942
301
5659
153
n-3
(ALA
)(5
0–
54)
(56
–29
9)(2
3–
38)
(52
–66
)
C18
:4n
-32
1(1
–1)
C20
:3n
-35
3(1
–7)
1Tr
(0.4
)
20:4
n-3
1Tr
(0.3
)
C20
:5n
-3(E
PA)
26
(5–
7)Tr
(0.3
)2
Tr(T
r–2)
113
C22
:5n
-34
1(1
–1)
1Tr
(0.4
)2
12(9
–16
)
22:6
n-3
(DH
A)
Tr(0
.4)
21
(1–
2)
Tota
ln-3
∗58
9934
6959
65
(55
–61
)(5
8–
307)
(52
–66
(62
–69
)
n-6
C18
:2,n
-69
145
239
120
744
326
(LA
)(5
1–
241)
(29
–49
)(5
9–
82(1
22–
443)
C20
:2n
-64
5(4
–6)
22
(1–
2)
20:3
n-6
81
(1–
1)
C20
:4n
-62
6(6
–7)
92
(1–
6)2
31(2
5–
37)
C18
:3n
-62
1(T
r–1)
214
4(1
0–
279)
C22
:6n
-62
4(4
–5)
Tota
ln-6
∗10
153
4220
7450
1
(10
–12
)(5
7–
254)
(31
–52
)(5
9–
82(1
57–
759)
Tota
lPU
FA∗
195
454
(265
–45
4)14
656
0(3
04–
1021
)77
277
153
150
566
1460
(56
–96
)(2
31–
322)
(126
–16
9)(2
19–
828)
(671
–22
48)
tran
sFA
C16
:1tr
ans
216
(11
–22
)
C18
:1tr
ans
217
7
(141
–21
2)
C18
:1tr
ans
n-9
315
(14
–15
)1
53
C18
:1tr
ans
n-1
13
210
150
215
1
(159
–27
4)(1
30–
172)
J Sci Food Agric (2011) c© 2011 Society of Chemical Industry wileyonlinelibrary.com/jsfa
www.soci.org E Medhammar et al.
Tab
le8
.(C
onti
nued
)
Co
wa
Bu
ffal
ob
n=
Bu
ffal
ob
Yak
c
(n=
1,ra
ng
eg
iven
wh
ere
n=
2)M
ared
n=
Mar
edD
on
keye
n=
Do
nke
yeD
rom
edar
yf
n=
Dro
med
aryf
cam
el
Bac
tria
ng
cam
el(n
=3
anim
als)
Llam
ahRe
ind
eeri
n=
Rein
dee
ri
Mo
ose
j
(n=
1,ra
ng
eg
iven
wh
ere
n=
2)
C18
:1tr
ans
n-4
18
C18
:1tr
ans
n-5
–6
133
C18
:1tr
ans
n-7
–8
159
C18
:1tr
ans
n-1
01
65
C18
:1tr
ans
n-1
21
59
C18
:1tr
ans
n-1
51
33
C18
:2t9
t12
tran
s2
28(2
2–
33)
C18
:2tr
ans
n-6
C18
:2c9
,t11
669
165
1(T
r–1)
2132
(n-6
),C
LA(4
0–
131)
(16
–26
)
C18
:210
-t,1
2-c
613
(5–
20)
tota
ltra
nsFA
∗24
528
161
(Tr–
1)21
182
461
(392
–70
7)(1
6–
26(4
40–
482)
tota
lCLA
(C18
:29-
c,11
-t)+
(C18
:210
-t,
12-c
)
1282
(45
–15
1)16
1(T
r–1)
32
Fro
mp
aper
s
Tota
lsat
ura
ted
951
6051
508
576
337
219
3029
50
(458
0–
6570
)(4
50–
693)
(335
–40
5)
Tota
lun
satu
rate
d3
1830
2750
469
313
28
(138
0–
2690
)(5
67–
773)
Tota
lMU
FAp
aper
s3
1960
537
83
130
142
(176
0–
2150
)(3
31–
465)
(95
–15
7)
Tota
lPU
FA3
204
529
83
151
182
pap
ers
(193
–21
6)(2
39–
405)
(100
–20
8)
wileyonlinelibrary.com/jsfa c© 2011 Society of Chemical Industry J Sci Food Agric (2011)

Composition of milk from minor dairy animals and buffalo breeds www.soci.org
Tab
le8
.(C
onti
nued
)
Co
wa
Bu
ffal
ob
n=
Bu
ffal
ob
Yak
c
(n=
1,ra
ng
eg
iven
wh
ere
n=
2)M
ared
n=
Mar
edD
on
keye
n=
Do
nke
yeD
rom
edar
yf
n=
Dro
med
aryf
cam
el
Bac
tria
ng
cam
el(n
=3
anim
als)
Llam
ahRe
ind
eeri
n=
Rein
dee
ri
Mo
ose
j
(n=
1,ra
ng
eg
iven
wh
ere
n=
2)
Tota
ltra
ns3
220
pap
ers
(174
–26
7)
tota
lCLA
(C18
:213
805
1
9-c,
11-t
)+(C
(44
–15
0)(T
r–1)
18:2
10-t
,12-
c)
n-3
tota
l6
452
94
(10
–10
9)(6
3–
124)
n-6
tota
l6
112
283
(78
–12
3)
∗ Cal
cula
ted
asth
esu
mo
frep
ort
edin
div
idu
alFA
.No
teth
atn
ot
allt
he
ind
ivid
ual
FAar
ere
po
rted
inth
ep
aper
s,as
som
ep
aper
so
nly
rep
ort
edva
lues
for
tota
lFA
.Th
eca
lcu
late
dva
lues
for
tota
lMU
FAan
dPU
FAd
on
ot
incl
ud
etr
ans
fatt
yac
ids,
wh
ich
are
giv
ense
par
atel
y.∗∗
Val
ues
fort
ota
lFA
asre
po
rted
inp
aper
s.Tr
,tra
ce=
less
than
1m
g.
SFA
,sat
ura
ted
fatt
yac
ids;
MU
FA,m
on
ou
nsa
tura
ted
fatt
yac
ids;
PUFA
,po
lyu
nsa
tura
ted
fatt
yac
ids;
TFA
,tra
nsfa
tty
acid
s;LA
,lin
ole
icac
id;A
LA,α
-lin
ole
nic
acid
;EPA
,eic
osa
pen
taen
oic
acid
;DH
A,d
oco
sah
exae
no
icac
id;
CLA
,co
nju
gat
edlin
ole
icac
id.
aC
ow
.45
bB
uff
alo
.Ave
rag
eva
lues
,usi
ng
valu
esfr
om
Nili
Ravi
and
Ku
nd
ibre
ed,41
Mu
rrah
bre
ed,d
ata
fro
mth
ree
diff
eren
tfe
eds)
,70–
72M
urr
ahb
reed
,dat
afr
om
earl
y,m
id,l
ate
lact
atio
n.13
4
cY
ak.A
vera
ge
valu
es,u
sin
gva
lues
fro
mK
hai
nag
bre
ed11
3an
dM
aiw
ab
reed
.37
dM
are.
Ave
rag
eva
lues
,usi
ng
valu
esfr
om
pri
mit
ive
Ko
nik
ho
rse,
85W
ielk
op
ols
kam
are
bre
ed,74
fou
rd
iffer
ent
lact
atio
nst
ages
,Hafl
ing
erb
reed
,fo
ur
diff
eren
tla
ctat
ion
stag
es,76
Ko
nik
Pols
ki,W
ielk
op
ols
kam
are
bre
edan
dPo
lish
Co
ld-b
loo
ded
Ho
rse
bre
eds,
49Ra
pid
Hea
vyD
raft
bre
edan
d1s
tan
d2n
dm
ilkco
llect
ion
dat
afo
rHafl
ing
eran
dQ
uar
terH
ors
eb
reed
s.77
eD
on
key.
Ave
rag
eva
lues
,usi
ng
valu
esfr
om
Rag
usa
na
bre
ed,8
Mar
tin
aFr
anca
bre
ed,t
wo
diff
eren
tfe
eds14
5an
dm
ilkfr
om
am
ixo
fRag
usa
na
and
Mar
tin
aFr
anca
bre
eds.
81
fD
rom
edar
yca
mel
.Ave
rag
eva
lues
,usi
ng
valu
esfr
om
Naj
dib
reed
78,1
46an
dM
ajah
eem
bre
ed.14
7
gLl
ama.
50
hRe
ind
eer53
(fo
urd
iffer
ent
lact
atio
nst
ages
).iM
oo
se52
(ave
rag
efo
ran
imal
s1
–3,
and
dat
afr
om
ref.
9ci
ted
ther
ein
).jB
actr
ian
cam
el60
(dat
afo
rth
ree
do
mes
tica
ted
cam
els)
.
J Sci Food Agric (2011) c© 2011 Society of Chemical Industry wileyonlinelibrary.com/jsfa

www.soci.org E Medhammar et al.
Tab
le9
.Fa
tty
acid
con
ten
t,g
100
g−1
tota
lFA
(ave
rag
e,w
ith
ran
ge
inp
aren
thes
es)
Fatt
yac
idin
100
gto
talF
AC
ow
aB
uff
alo
bY
akc
Mar
edD
on
keye
Dro
med
aryf
Bac
tria
n†g
Llam
ah(n
=1)
Rein
dee
riM
oo
sej
aver
age†
Tota
lfat
(g10
0g
−1m
ilk)
3.3
7.4
6.8
1.6
0.7
3.0
5.0
4.2
16.1
8.6
(5.3
–9.
0)(5
.6–
9.5)
(0.5
–4.
2)(0
.3–
1.8)
(2.0
–6.
0)(4
.3–
5.7)
(2.7
–4.
7)(1
0.2
–21
.5)
(7.0
–10
.0)
Tota
lC4
–C
109.
613
0.9∗
6.7∗
23∗
13∗
9∗11
∗4∗
(8–
30)
(17
–25
)(5
–16
)(0
–15
)
Sum
C12
:0–
C16
:038
.555
47∗
28∗
21∗
43∗
30∗
45∗
56∗
27∗
(44
–76
)(3
9–
55)
(17
–37
)(1
7–
29)
(24
–54
)(2
3–
34)
(35
–75
)(2
1–
33)
Tota
lsat
ura
ted
60.0
7465
3857
6047
∗65
84∗
53
(65
–94
)(3
0–
46)
(49
–60
)(3
9–
53)
(56
–11
3)(5
2–
58)∗
Tota
lun
satu
rate
d26
3546
4235
(20
–38
)(3
8–
51)
Tota
lMU
FA26
.028
18∗
2520
73∗
28∗
3120
∗31
∗
(25
–31
)(2
2–
31)
(14
–23
)(5
6–
80)
(19
–35
)(1
5–
24)
Tota
ln-3
17∗
122.
4∗[0
.5∗ ]
(0–
2)(4
–20
)(9
–18
)(0
–1)
Tota
ln-6
210
∗11
1∗4∗
8
(1–
2)(4
–17
)(1
–6)
(4–
21)
Tota
lPU
FA6.
33
2∗20
2310
∗3∗
44∗
14∗
(16
–27
)(1
5–
31)
(7–
10)
(3–
4)(2
–6)
(8–
25)
Tota
ltra
nsFA
30.
2∗[0
.1∗ ]
33∗
(3–
4)
Tota
lCLA
(C18
:29-
c,11
-t)+
(C18
:210
-t,1
2-c)
1[0
.2∗ ]
[0.1
][0
.4∗ ]
1
(1–
2)(0
–1)
C18
:3n
-3(A
LA)
16.
24
21
[0.4
]
(4–
20)
(3–
6)
C20
:5n
-3(E
PA)
[0.0
2][0
.13]
[0.5
]
C22
:6n
-3(D
HA
)[0
.03]
[0.1
5]
C18
:2,n
-6(L
A)
106
12
28
(3–
16)
(4–
7)(1
–2)
(1–
3)(4
–21
)
∗ Den
ote
sva
lues
that
wer
eca
lcu
late
das
the
sum
oft
he
rep
ort
edin
div
idu
alva
lues
.Val
ues
less
than
0.1%
are
insq
uar
eb
rack
ets.
Cal
cula
ted
valu
esfo
rPU
FAan
dM
UFA
do
no
tin
clu
de
tran
sFA
,wh
ich
are
inth
eir
ow
nca
teg
ory
.Wh
enth
e%
FAh
adto
be
calc
ula
ted
,th
eav
erag
eva
lue
for
tota
lfat
ob
tain
edfr
om
the
pap
ers
rep
ort
ing
the
FAw
asg
ener
ally
use
d(r
ath
erth
anth
eav
erag
efo
rth
esp
ecie
s)in
the
calc
ula
tio
ns.
Tota
lFA
do
esn
ot
equ
al10
0%b
ecau
sen
ot
allp
aper
sre
po
rted
valu
esfo
rall
FA.
†Fo
rB
actr
ian
cam
elan
dm
oo
sem
ilk,v
ery
littl
ed
ata
wer
eav
aila
ble
,an
dla
rge
diff
eren
ces
wer
eo
bse
rved
bet
wee
nan
imal
sw
ith
inth
esa
me
stu
dy.
Ther
efo
re,t
he
dat
aw
ere
con
sid
ered
atan
imal
leve
l:th
eav
erag
efo
rB
actr
ian
cam
eld
ata
are
fro
mth
ree
(do
mes
tica
ted
)an
imal
s,re
po
rted
inJi
rim
utu
;60m
oo
sed
ata
are
fort
hre
ean
imal
sre
po
rted
inC
oo
kci
ted
ther
ein
.52
aC
ow
.45
bB
uff
alo
.Ave
rag
eva
lues
,usi
ng
valu
esfr
om
Nili
Ravi
bre
ed,41
Mu
rrah
bre
ed,d
ata
fro
mth
ree
diff
eren
tfe
eds,
70–
72M
urr
ahb
reed
,dat
afr
om
earl
y,m
id,l
ate
lact
atio
n.13
4
cY
ak.A
vera
ge
valu
es,u
sin
gva
lues
fro
mK
hai
nag
bre
ed11
3an
dM
aiw
ab
reed
.37
dM
are.
Ave
rag
eva
lues
,usi
ng
valu
esfr
om
pri
mit
ive
Ko
nik
ho
rse,
85W
ielk
op
ols
kam
are
bre
ed,f
ou
rd
iffer
ent
lact
atio
nst
ages
,74H
aflin
ger
bre
ed,f
ou
rd
iffer
ent
lact
atio
nst
ages
,76K
on
ikPo
lski
,Wie
lko
po
lska
mar
eb
reed
and
Polis
hC
old
-blo
od
edH
ors
eb
reed
s,49
Rap
idH
eavy
Dra
ftb
reed
and
1st
and
2nd
milk
colle
ctio
nd
ata
forH
aflin
ger
and
Qu
arte
rHo
rse
bre
eds.
77
eD
on
key.
Ave
rag
eva
lues
,usi
ng
valu
esfr
om
Rag
usa
na
bre
ed,8
Mar
tin
aFr
anca
bre
ed,t
wo
diff
eren
tfe
eds14
5an
dm
ixo
fRag
usa
na
and
Mar
tin
aFr
anca
bre
eds.
81
fD
rom
edar
yca
mel
.Ave
rag
eva
lues
,usi
ng
valu
esfr
om
Naj
dib
reed
78,1
46an
dM
ajah
eem
bre
ed.14
7
gLl
ama.
50
hRe
ind
eer.
Dat
afr
om
fou
rdiff
eren
tla
ctat
ion
stag
es.53
iM
oo
se.52
Ave
rag
efo
ran
imal
s1
–3,
and
dat
afr
om
ref.
9ci
ted
ther
ein
.jB
actr
ian
cam
el.D
ata
fort
hre
ed
om
esti
cate
dca
mel
s.60
wileyonlinelibrary.com/jsfa c© 2011 Society of Chemical Industry J Sci Food Agric (2011)

Composition of milk from minor dairy animals and buffalo breeds www.soci.org
Tab
le1
0.
Bu
ffal
om
ilkco
mp
osi
tio
na
Per1
00g
milk
Ave
rag
e±
SDRa
ng
eB
reed
and
loca
tio
nw
ith
low
est
valu
eRe
f.fo
rlo
wes
tva
lueb
Bre
edan
dlo
cati
on
wit
hh
igh
est
valu
eRe
f.fo
rhig
hes
tva
lueb
Wat
er(g
)83
.2±
0.6
82.3
–84
.0M
urr
ah×
Med
iter
ran
ean
(cro
ss-b
reed
)A
vera
ge96
,107
Bu
lgar
ian
Bu
ffal
o×
Mu
rrah
bre
ed(B
ulg
aria
)
97
n=
11,n
′ =51
Tota
lso
lids
(g)
17.0
±0.
616
.1–
17.7
Tod
a(In
dia
)98
Mu
rrah
×M
edit
erra
nea
n(c
ross
-bre
ed)
(Arg
enti
na,
Ger
man
y)
96,1
07
n=
8,n′ =
32
Solid
s–
no
tfa
t(g
)9.
7±
0.8
8.3
–11
.3N
on
-des
crip
th
illb
uff
alo
10K
utt
anad
Dw
arfB
uff
alo
(Ind
ia,K
eral
a)10
6
n=
9,n′ =
40(In
dia
/Ku
mao
nre
gio
n)
Pro
tein
,to
tal(
g)
4.0
±0.
52.
7–
4.6
No
n-d
escr
ipt
hill
bu
ffal
o10
Med
iter
ran
ean
bu
ffal
oA
vera
ge10
8,10
9
n=
10,n
′ =42
(Ind
ia/K
um
aon
reg
ion
)
Fat,
tota
l(g
)7.
4±
0.9
5.3
–9.
0B
ulg
aria
nB
uff
alo
×M
urr
ahb
reed
97B
had
awar
iA
vera
ge98
n=
18,n
′ =75
(Bu
lgar
ia)
Lact
ose
(g)
4.4
±0.
63.
2–
4.9
Ku
ttan
adD
war
fBu
ffal
o(In
dia
,Ker
ala)
106
Bu
lgar
ian
Mu
rrah
Ave
rag
e97,1
04,1
05
n=
6,n′ =
23
Ash
(g)
0.8
±0.
040.
7–
0.8
Meh
san
a95
Mu
rrah
×M
edit
erra
nea
n(c
ross
-bre
ed)
96
n=
5,n′ =
12(In
dia
,Bo
mb
ay)
(Arg
enti
na)
Cal
ciu
m(m
g)
191
±38
147
–22
0K
utt
anad
Dw
arfB
uff
alo
(Ind
ia/K
eral
a)10
6Eg
ypti
anb
uff
alo
57
n=
5,n′ =
9
Mag
nes
ium
(mg
)12
±5
2–
16K
utt
anad
Dw
arfB
uff
alo
(Ind
ia/K
eral
a)10
6M
urr
ah(In
dia
–B
om
bay
;Fra
nce
)95
,129
n=
5,n′ =
6
Pho
sph
oru
s(m
g)
185
±94
102
–29
3Eg
ypti
anb
uff
alo
57M
ehsa
na
(Ind
ia,B
om
bay
)95
n=
5,n′ =
8
Cit
ric
acid
(mg
)21
4±
1918
5–
224
Mu
rrah
(Ind
ia–
Bo
mb
ay;F
ran
ce)
95,1
29Eg
ypti
anb
uff
alo
57
n=
4,n′ =
5
Ch
ole
ster
ol(
mg
)8
±3
4–
10Eg
ypti
anb
uff
alo
57N
iliRa
vi(P
akis
tan
)41
n=
3,n′ =
3
Pho
sph
olip
ids,
tota
l(m
g)
20Eg
ypti
anb
uff
alo
57
n=
1,n′ =
1
aO
nly
pro
xim
ates
and
dat
aw
ith
n≥
4ar
esh
ow
n,w
ith
the
exce
pti
on
ofa
few
nu
trie
nts
wh
ich
hav
eb
een
incl
ud
edb
ecau
seth
eyd
on
ot
bel
on
gin
any
oft
he
tab
les
forn
utr
ien
tg
rou
ps.
bW
her
ed
ata
for
the
sam
eb
reed
wer
eav
aila
ble
fro
mm
ore
than
on
est
ud
y,th
em
ean
valu
efo
rth
eb
reed
was
calc
ula
ted
and
use
d,a
nd
the
refe
ren
ces
fro
mw
her
eth
ein
div
idu
alva
lues
wer
eta
ken
are
giv
en.T
he
nu
mb
ero
fen
trie
sin
the
smal
lerd
atab
ase
thu
so
bta
ined
isin
dic
ated
by
n.Th
en
um
ber
ofd
ata
po
ints
bef
ore
aver
agin
gfo
rbre
edis
ind
icat
edb
yn′ .
J Sci Food Agric (2011) c© 2011 Society of Chemical Industry wileyonlinelibrary.com/jsfa

www.soci.org E Medhammar et al.
Tab
le1
1.
Yak
milk
com
po
siti
on
a
Per1
00g
milk
Ave
rag
e±
SDRa
ng
eB
reed
and
loca
tio
nw
ith
low
est
valu
eRe
f.fo
rlo
wes
tva
lueb
Bre
edan
dLo
cati
on
wit
hh
igh
est
valu
eRe
ffo
rhig
hes
tva
lueb
Ener
gy
(kJ)
368
349
–38
2Ti
anzh
uW
hit
eA
vera
ge
forv
alu
esfo
rear
ly,m
idan
dla
tela
ctat
ion
117
(Ch
ina)
11
(n=
2,n′ =
4)(C
hin
a/G
ansu
pro
vin
ce)
Ener
gy
(kca
l)89
87–
91Ti
anzh
uW
hit
eA
vera
ge
forv
alu
esfo
rear
ly,m
idan
dla
tela
ctat
ion
117
(Ch
ina)
11
(n=
2,n′ =
4)(C
hin
a/G
ansu
pro
vin
ce)
Wat
er(g
)82
.6±
1.8
75.3
–84
.4Y
ak(M
on
go
lia)
143
(Ind
ia)
110
(n=
23,n
′ =27
)
Tota
lso
lids
(g)
17.2
±0.
915
.6–
18.8
Kh
ain
ag(y
akh
ybri
d)(
Mo
ng
olia
)11
3(In
dia
)11
1
(n=
21,n
′ =24
)
Solid
s–
no
tfa
t(g
)9.
9±
1.7
7.1
–11
.5(In
dia
)11
0(In
dia
)11
1
(n=
7,n′ =
9)
Pro
tein
,to
tal(
g)
5.2
±0.
54.
2–
5.9
Mai
wa
37,1
20(In
dia
/Pra
des
h)
118
(n=
26,n
′ =32
)
Fat,
tota
l(g
)6.
8±
0.9
5.6
–9.
5K
hai
nag
113
Pam
ir11
9
(n=
41,n
′ =54
)(M
on
go
lia)
Lact
ose
(g)
4.8
±0.
63.
3–
6.2
Sib
u(T
ibet
)12
0(M
on
go
lian
)14
3
(n=
28,n
′ =34
)
Ash
(g)
0.8
±0.
10.
4–
1.0
Yak
115
Jial
i11
7,12
0
(n=
23,n
′ =28
)
Cal
ciu
m(m
g)
129
±7
119
–13
4(In
dia
)11
1K
hai
nag
113
(n=
54,n
′ =5)
(Mo
ng
olia
)
Lact
icac
id(m
g)
170
(Tib
et)
114
(n′ =
1,n
=1)
β-L
acto
glo
bu
lin(m
g)
708
±24
653
4–
882
Mai
wa
37Ji
ulo
ng
Ave
rag
eo
fval
ues
forfi
rsts
um
mer
seas
on
afte
rca
lvin
gan
dse
con
dsu
mm
erse
aso
naf
ter
calv
ing
wit
ho
ut
calv
ing
agai
n(h
alfm
ilk)11
5
(n=
3,n′ =
4)(C
hin
a)
α-L
acta
lbu
min
(mg
)19
8±
819
3–
204
Mai
wa
37Ji
ulo
ng
Ave
rag
eo
fval
ues
for:
first
sum
mer
seas
on
afte
rcal
vin
gan
dse
con
dsu
mm
erse
aso
naf
terc
alvi
ng
wit
ho
ut
calv
ing
agai
n(h
alf
milk
)115
(n=
3,n′ =
4)(C
hin
a)
Seru
mal
bu
min
(mg
)10
7±
3979
–13
4Ji
ulo
ng
Ave
rag
eo
fval
ues
for:
first
sum
mer
seas
on
afte
rcal
vin
gan
dse
con
dsu
mm
erse
aso
naf
terc
alvi
ng
wit
ho
ut
calv
ing
agai
n(h
alf
milk
)115
Mai
wa
(Ch
ina)
37
(n=
3,n′ =
4)
aO
nly
pro
xim
ates
and
dat
aw
ith
n≥
4ar
esh
ow
n,w
ith
the
exce
pti
on
ofa
few
nu
trie
nts
wh
ich
hav
eb
een
incl
ud
edb
ecau
seth
eyd
on
ot
bel
on
gin
any
oft
he
tab
les
forn
utr
ien
tg
rou
ps.
bW
her
ed
ata
fort
he
sam
eb
reed
wer
eav
aila
ble
fro
mm
ore
than
on
est
ud
y,th
em
ean
valu
efo
rth
eb
reed
was
calc
ula
ted
and
use
d,a
nd
the
refe
ren
ces
fro
mw
her
eth
ein
div
idu
alva
lues
wer
eta
ken
are
giv
en.T
he
nu
mb
ero
fen
trie
sin
the
smal
lerd
atab
ase
thu
so
bta
ined
isin
dic
ated
by
n.Th
en
um
ber
ofd
ata
po
ints
bef
ore
aver
agin
gfo
rbre
edis
ind
icat
edb
yn′ .
wileyonlinelibrary.com/jsfa c© 2011 Society of Chemical Industry J Sci Food Agric (2011)

Composition of milk from minor dairy animals and buffalo breeds www.soci.org
Tab
le1
2.
Mar
em
ilkco
mp
osi
tio
na
Per1
00g
milk
Ave
rag
e±
SDRa
ng
eB
reed
wit
hlo
wes
tva
lue
Ref.
forl
ow
est
valu
ebB
reed
wit
hh
igh
est
Ref.
forh
igh
est
valu
eb
Ener
gy
(kJ)
193
±24
177
–21
0H
aflin
ger
Lact
atio
nav
erag
e92Pr
zew
alsk
iho
rse
83
n=
2,n′ =
6
Ener
gy
(kca
l)46
±6
42–
50H
aflin
ger
Lact
atio
nav
erag
e92Pr
zew
alsk
iho
rse
83
n=
2,n′ =
6
Wat
er(g
)89
.8±
0.8
87.9
–91
.3Sa
dd
lep
on
y12
3Lu
sita
no
Lact
atio
nav
erag
e94
n=
13,n
′ =30
Tota
lso
lids
(g)
10.5
±0.
69.
4–
12.1
Hafl
ing
erA
vera
ge
ofm
ilkfr
om
1st
and
2nd
colle
ctio
ns77
,82
Sad
dle
po
ny
123
n=
19,n
′ =30
Pro
tein
,to
tal(
g)
2.0
±0.
41.
4–
3.2
San
am
ares
(mts
yri)
Ave
rag
eva
lue57
Palo
min
o13
1
n=
20,n
′ =33
Fat,
tota
l(g
)1.
6±
(0.7
)0.
5–
Lusi
tan
oLa
ctat
ion
aver
age93
,94
Sad
dle
po
ny
123
n=
23,n
′ =45
4.2
Lact
ose
(g)
6.6
±(0
.4)
5.6
–7.
2B
ury
atA
vera
ge
valu
e57Tr
ott
ers
Ave
rag
eva
lue57
n=
16,n
′ =31
Ash
(g)
0.4
±(0
.1)
0.3
–0.
5Im
pro
ved
Kir
gh
izA
vera
ge
valu
e57B
ury
atA
vera
ge
valu
e57
n=
18,n
′ =38
Cal
ciu
m(m
g)
95±
(19)
76–
124
Tho
rou
gh
bre
dLa
ctat
ion
aver
age12
4,13
8Pa
lom
ino
131
n=
9,n′ =
26
Iro
n(m
g)
0.10
±(0
.05)
0.03
–0.
15Th
oro
ug
hb
red
Lact
atio
nav
erag
e124,
138
Ital
ian
sad
dle
ho
rse
122,
135
n=
4,n′ =
6
Mag
nes
ium
(mg
)7
±(2
)4
–12
Lusi
tan
oLa
ctat
ion
aver
age94
Palo
min
o13
1
n=
8,n′ =
1858
±(1
3)
Pho
sph
oru
s(m
g)
n=
8,n′ =
2043
–83
Prze
wal
skih
ors
eLa
tela
ctat
ion
83,1
24Pa
lom
ino
131
Pota
ssiu
m(m
g)
51±
(20)
25–
87Sh
etla
nd
po
ny
124,
138
Palo
min
o13
1
n=
9,n′ =
18
Sod
ium
(mg
)16
±(3
)13
–20
Shet
lan
dp
on
y12
4,13
8H
aflin
ger
137
n=
6,n′ =
10
Zin
c(m
g)
0.2
±(0
.1)
0.2
–0.
3Sh
etla
nd
124,
138
Ital
ian
sad
dle
ho
rse
122,
135
J Sci Food Agric (2011) c© 2011 Society of Chemical Industry wileyonlinelibrary.com/jsfa

www.soci.org E Medhammar et al.
Tab
le1
2.
(Con
tinu
ed)
Per1
00g
milk
Ave
rag
e±
SDRa
ng
eB
reed
wit
hlo
wes
tva
lue
Ref.
forl
ow
est
valu
ebB
reed
wit
hh
igh
est
Ref.
forh
igh
est
valu
eb
n=
5,n′ =
8Po
ny
Co
pp
er(m
g)
0.05
±(0
.04)
0.02
–0.
11Pr
zew
alsk
iho
rse
Late
lact
atio
n83
,124
Bar
dig
ian
o12
2
n=
5,n′ =
8
Vit
amin
C(m
g)
4.3
±(3
.3)
1.7
–8.
1Sa
dd
lep
on
y12
3Pa
lom
ino
131
n=
3,n′ =
6
Thia
min
e(m
g)
0.03
±(0
.01)
0.02
–0.
04Sa
dd
lep
on
y12
3Pe
rch
ero
nA
vera
ge
fro
mth
ree
entr
ies12
3
n=
2,n′ =
4
Rib
ofla
vin
(mg
)0.
020.
011
–0.
026
Perc
her
on
Ave
rag
efr
om
thre
een
trie
s123
Sad
dle
po
ny
123
n=
2,n′ =
4
Nia
cin
(mg
)0.
07Sa
dd
lep
on
y;A
vera
ge
fro
m(t
hre
een
trie
s123
)8
n=
2,n′ =
4Pe
rch
ero
n
Cas
ein
(mg
)85
5±
3083
5–
890
Hafl
ing
erA
vera
ge
ofm
ilkfr
om
1st
and
2nd
colle
ctio
ns77
Qu
arte
rA
vera
ge
ofm
ilkfr
om
1st
and
2nd
colle
ctio
ns77
n=
3,n′ =
5
Wh
eyp
rote
in(m
g)
790
±14
966
5–
955
Hafl
ing
erA
vera
ge
ofm
ilkfr
om
1st
and
2nd
colle
ctio
ns77
Qu
arte
rA
vera
ge
ofm
ilkfr
om
1st
and
2nd
colle
ctio
ns77
n=
3,n′ =
5
Sial
icac
id4.
6m
gB
ard
igia
no
;Ita
lian
sad
dle
ho
rse
122
n=
2,n′ =
2
aO
nly
pro
xim
ates
and
dat
aw
ith
n≥
4ar
esh
ow
n,w
ith
the
exce
pti
on
ofa
few
nu
trie
nts
wh
ich
hav
eb
een
incl
ud
edb
ecau
seth
eyd
on
ot
bel
on
gin
any
oft
he
tab
les
forn
utr
ien
tg
rou
ps.
bW
her
ed
ata
for
the
sam
eb
reed
wer
eav
aila
ble
fro
mm
ore
than
on
est
ud
y,th
em
ean
valu
efo
rth
eb
reed
was
calc
ula
ted
and
use
d,a
nd
the
refe
ren
ces
fro
mw
her
eth
ein
div
idu
alva
lues
wer
eta
ken
are
giv
en.T
he
nu
mb
ero
fen
trie
sin
the
smal
lerd
atab
ase
thu
so
bta
ined
isin
dic
ated
by
n.Th
en
um
ber
ofd
ata
po
ints
bef
ore
aver
agin
gfo
rbre
edis
ind
icat
edb
yn′ .
wileyonlinelibrary.com/jsfa c© 2011 Society of Chemical Industry J Sci Food Agric (2011)

Composition of milk from minor dairy animals and buffalo breeds www.soci.org
content was high, with an average value of 73 g 100 g−1 totalFA. The milk also contained a small amount (2 g 100 g−1 totalFA) of ALA. The content of very short-chain fatty acids (C4–C8)was lowest in dromedary milk among all the species with valuesreported here. It has been suggested that these FA, which areproduced by cellulose fermentation in the rumen, may be rapidlymetabolized by camel tissue and are therefore not excreted in themilk.78
Only one study on Bactrian camel milk was available, andsince the variation in the fatty acid composition among the threeanimals was quite large, the ranges observed by the authors arealso reported here. A small amount (2 g 100 g−1 total FA) of LAwas reported in the milk.
One study50 reported the FA composition of llama milk. As g100 g−1 total FA, the proportions of SFA, C4–C10, MUFA and PUFAin llama milk were comparable to the values for cow milk. Themilk also contained trans FA (3 g/100 g−1 total FA, mainly C18 : 1trans-11), and a very small amount of CLA (0.4 g 100 g−1 total FA).
Cervid species (reindeer and moose). The FA profile of reindeermilk showed the highest amount of SFA (84 g 100 g−1 FA). Whenthe fatty acid content in 100 g milk was considered, the total SFAcontent of reindeer milk far exceeded that of other milks, havingan average of 11240 mg 100 g−1 milk (compared with 1870 mg100 g−1 cow milk). Calculated from the average value, two cupsof reindeer milk would contain 56. 2 g saturated fat. For a womanwho requires 2200 kcal per day this would provide 23% of the totalenergy intake. The population nutrient intake goals for preventingdiet-related chronic diseases recommend that saturated fat shouldaccount for less that 10% of the total energy intake.79
Moose milk FA data were limited, consisting of data for threeanimals reported in Cook et al.52 cited therein. According to thesestudies, moose milk had a high content of PUFA compared withcow milk.
Interbreed differences in milk compositionBreed differences are one of the factors known to affect milkcomposition.25 Before evaluating breed differences, it is importantto understand the normal biological variation within a breed. Apreliminary analysis of data for the Murrah breed of buffalo, whichprovided the greatest number of data points at the level of breed(up to 19 data points for some nutrients), was therefore carriedout (data not shown). These data represented different lactationperiods, feeds and seasons. Fairly small differences were presentin proximate composition (protein: 0.3 g 100 g−1; total fat: 0.8 g100 g−1; lactose: 0.4 g 100 g−1; solids-not-fat: 0.5 g 100 g−1). Incontrast, the differences among breeds for buffalo (Table 10) areconsiderably larger (protein: 1.9 g 100 g−1; total fat: 3.7 g 100 g−1;lactose: 1.7 g 100 g−1; solids-not-fat: 3 g 100 g−1). Therefore, adifference in nutrient content among different breeds which isnotably larger than the difference seen within a single breed mayat least be partially attributed to breed.
However, the standard deviations for individual fatty acids werevery large even within the Murrah breed. When the fatty acids werecalculated as per 100 g total FA, these large differences were stillpresent, indicating that many factors in addition to breed affectthe FA composition. This agrees with published data that showthat the FA composition is particularly prone to vary with factorsthat include feed, lactation period and season.24,26,27
Buffalo milkLarge differences were reported for fat values; Bulgarian buffalocross Murrah breed milk had the lowest reported content of5.3 g 100 g−1, while the Bhadawari buffalo milk had an averagefat content of 9 g 100 g−1. Protein values also varied, from 2.7 g100 g−1 in ‘hill’ buffalo milk to 4 g 100 g−1 in Mediterranean buffalomilk. Variations were also seen in mineral values (e.g. calcium,147–220 mg 100 g−1; phosphorus, 102–293 mg 100 g−1), but itis not clear if these differences can be attributed to differencesamong breeds. Individual references may be found in Table 10.
Yak and mithun milksThe total fat in yak milk ranged from 5.6 to 9.5 g 100 g−1 andaveraged 6.8 g 100 g−1, with milk from the Pamir breed having thehighest reported content and milk from the Khainag breed fromMongolia having the lowest. The lactose value of yak milk from theSibu breed from Tibet was nearly half that reported for a Mongolianyak (3.3 versus 6.2 g 100 g−1). Fairly large differences were alsoseen in the mineral values, but the small number of studies (oneto five studies per element) precludes any conclusions. Individualreferences may be found in Table 11.
Mare and donkey milksThe range for total fat in mare milk was 0.5–4.2 g 100 g−1, withan average value of 1.6 g 100 g−1 milk. The breed with the lowestvalue was Lusitano (average from two studies and a number oflactation periods). The value for the highest fat content (Saddlepony) was 2.6 times greater than the average fat content. Largedifferences between the lowest and highest concentrations wereapparent for some of the essential elements. For example, milkfrom the Palomino breed had 48 mg more calcium per 100 g milkthan milk from the Thoroughbred breed. The potassium contentdiffered by 62 mg 100 g−1 (25–87 mg 100 g−1) between the breedwith the lowest value, Shetland pony, and highest value, Palomino.Phosphorus content was again highest for milk from the Palominobreed (83 mg 100 g−1), being almost double the value for milkfrom the Przewalski horse (42 mg 100 g−1). Individual referencesmay be found in Table 12.
In donkey milk, the casein content varied from 612 mg 100 g−1
milk from the Jiangyue breed80 to 870 mg 100 g−1 milk for a mixedmilk from Ragusana and Martina Franca breeds.81
Dromedary camel, Bactrian camel, llama and alpaca milksThe total fat in dromedary camel milk ranged from 2 to 6 g100 g−1 milk, with the lowest fat content reported for milk fromthe Kachchhii breed39 and the highest for milk from the Arvanabreed.32 Fairly large interbreed differences were also reportedfor certain minerals. For example, manganese ranged from 60 to180 µg 100 g−1 milk: the Najdi breed milk showed a value threetimes higher than the value for milk from the Majaheim breed. Thedifference between the highest (Najdi breed) and lowest (Hamrabreed) potassium contents in dromedary milk was 49 mg (range124–173 mg 100 g−1 milk). Individual references may be found inTable 13.
Variation in milk composition with lactation stageReports suggest that stage of lactation is the most important factorto influence milk composition.82 Since a substantial number ofstudies looked at the effect of lactation stage on milk composition,the data from these studies are summarized below.
J Sci Food Agric (2011) c© 2011 Society of Chemical Industry wileyonlinelibrary.com/jsfa

www.soci.org E Medhammar et al.
Table 13. Dromedary camel milk compositiona
Per 100 g milk Average ± SD RangeBreed with
lowest valueRef. for
lowest valuebBreed with
highest valueRef. for
highest valueb
Water (g) 89.0 ± 0.5 88.3–89.4 Majaheim 36 Hamra 125
n = 3, n′ = 3
Protein, total (g) 3.1 ± 0.5 2.4–4.2 Kachchhi 126 Wadah 125
n = 11, n′ = 12
Fat, total (g) 3.2 ± 1.1 2.0–6.0 Kachchhi 126 Arvana 32
n = 15, n′ = 23
Ash (g) 0.8 Wadah, Hamra,Majaheim, Bikaneri,Najdi, Turkana,Jaisalmeri, Kachchhiand Somali
36,38,39,63,87,125,126
n = 10, n′ = 12
Lactose (g) 4.3 ± 0.4 3.5–4.9 Arvana 32 Somali 87
n = 12, n′ = 15
Vitamin C (mg) 6.7 ± 7 2.5–18.4 Majaheem 63 Arvana 32
n = 5, n′ = 5
Calcium (mg) 114 ± 6 105–120 Arvana 32 Majaheem 125
n = 5, n′ = 5
Iron (mg) 0.21 0.17–0.26 Arvana 32 Hamra 125
n = 5, n′ = 5
Magnesium (mg) 13 ± 1 12–14 Hamra 125 Najdi 38
n = 4, n′ = 4
Phosphorus (mg) 86 ± 3 83–90 Arvana 32 Hamra 125
n = 5, n′ = 5
Potassium (mg) 151 ± 25 124–173 Hamra 125 Najdi 38
n = 4, n′ = 4
Sodium (mg) 66 ± 6 59–73 Najdi 38 Wadah 125
n = 4, n′ = 4
Zinc (mg) 0.6 ± 0.1 0.4–0.6 Najdi 38 Majaheim 125
n = 4, n′ = 4
Copper (mg) 0.15 0.12–0.17 Majaheim 125 Wadah 125
n = 4, n′ = 4
Manganese (µg) 106 60–180 Majaheim 125 Najdi 38
n = 4, n′ = 4
Free cholesterol (mg) 9 Najdi 78,146
n = 1, n′ = 4
Cholesteryl ester (mg) 5 Najdi 78,146
n = 1, n′ = 4
Total cholesterol (mg) 19 Najdi 78,146
n = 1, n′ = 3
a Only proximates and data with n ≥ 4 are shown, with the exception of a few nutrients which have been included because they do not belong inany of the tables for nutrient groups.b Where data for the same breed were available from more than one study, the mean value for the breed was calculated and used, and the referencesfrom where the individual values were taken are given. The number of entries in the smaller database thus obtained is indicated by n. The number ofdata points before averaging for breed is indicated by n′.
Protein
The milk from most species showed a pattern of being higher inearly and late lactation and lower in mid lactation. However, someequids have been reported to produce relatively dilute milk inmid to late lactation, e.g. Przewalski horse83 and Littoral-Dinaricdonkey,84 where a decrease in both milk yield and in proteinpercentage have been reported as lactation progresses. Wild andsemi-domestic ruminants are reported to give milk richer in bothprotein and fat, particularly in late lactation, than do domesticatedspecies, partially to compensate for the declining rate of milkintake by the calf during late lactation.53,55
Fat
The changes in fat were reported to be difficult to interpret, beingstrongly related to seasonal feeding effects.74,85,86 Especially incamel milk, the availability of feed and water in arid areas has beenshown to influence milk composition.87 The fat percentage wasshown to increase as lactation progressed for milk from buffalo,e.g. Murrah breed88,89 and Nili Ravi breed;90 mithun,46 llama20 andalpaca raised at low altitudes;91 and reindeer.55 In contrast, the fatpercentage decreased as lactation progressed in mare milk, e.g.Wielkopolska breed,74 Haflinger breed,92 Lusitano breed93,94 andprimitive Konik horse85 and donkey milk (Littoral-Dinaric breed).84
wileyonlinelibrary.com/jsfa c© 2011 Society of Chemical Industry J Sci Food Agric (2011)

Composition of milk from minor dairy animals and buffalo breeds www.soci.org
LactoseLactose was reported to be the least variable component in somemilk, e.g. Murrah buffalo,88 mithun48 donkey (Littoral-Dinaric)84
and Jiangyue breeds80 and in Bactrian camel,65 being osmoticallyactive and functioning as a regulator of water content in milk.55
The lactose percentage showed a slight increase as lactationprogressed in mare milk, e.g. Haflinger breed92 and Lusitanobreed,93,94 whereas in reindeer milk the lactose percentagedecreased significantly as lactation progressed.55
CONCLUSIONThis review attempts to widen the biodiversity knowledge baseby bringing together available data on the composition of milkfrom underutilized species and minor dairy animals at breed level.Using cow milk as a reference, comparisons of milk compositionwere made among species and between breeds within the samespecies. Significant differences were found both for macro- andmicronutrients, although the limitation or lack of data for somespecies impeded the analysis, making comparisons difficult. Manyfactors influence nutrient content in milk. Large interspeciesdifferences in nutrient composition were evident, ranging from 0.7to 16.1 g 100 g−1 for total fat, from 1.6 to 10.5 g 100 g−1 for proteinand from 2.6 to 6.6 g 100 g−1 for lactose, when species averageswere considered. Interbreed differences in fat and protein contentswere found in buffalo, mare, yak and dromedary camel, milks witha difference of ∼4 g fat and 2 g protein 100 g−1 milk betweenthe highest and lowest values. For mare, buffalo and dromedarycamel milks, large interbreed differences in mineral content wereapparent. The vitamin C content in dromedary camel milk rangedfrom 2.5 to 18.4 mg 100 g−1, which can mean the differencebetween nutritional adequacy and deficiency. Equine milk mayhave useful applications in infant feeding, due to its low proteinand mineral contents (lower renal solute load) and similarities inprotein and fat composition to those in human milk. Similar tohuman milk, equine milk has a high lactose content. However,further studies are needed, particularly because adverse effectson iron nutrition can be expected. The nutritional value of milkwould depend on the specific nutritional needs of the populationgroup or individual in question; better knowledge of interspeciesand interbreed differences would allow more informed choices fordiet interventions.
In addition to bringing together most of the available data forminor dairy animals and buffalo breeds, this study has helpedto identify areas where data are limited or inadequate either atbreed level or at species level, for example, vitamin data anddata on cholesterol for milk from most of the species covered inthe review. As milk composition is known to change because ofvarious factors in addition to breed differences, the importanceof reporting data on feeding regimes, lactation stages etc. whenpresenting dairy studies was also apparent. One limitation of thisstudy is that we concentrated largely on breed-level data: data thatwere reported only at species level were not collected (except fordata of underutilized species), which makes the species-level datacomparison less complete than it could have been. For example,studies on buffalo that reported values for generic buffalo milk(without specifying the breed) were excluded.
This review has shown there are large differences in mostnutrients in milk from different species and even among breedswithin the same species. Generating nutrient data in milk from lesscommonly used species of dairy animals and reporting nutritionaldata at the breed level will broaden the knowledge base on dairy
animal biodiversity as essential sources of nutrients, facilitate themaintenance of local species and breeds, and contribute towardsthe conservation of diverse genetic resources for improving humannutrition.
ACKNOWLEDGEMENTSThe authors are grateful to Jerome Mounsey for advice onanalysing the data and ideas for improving the manuscript. Manythanks to Maylis Razes for help with SPSS and Isabella McDonnellfor carefully reading the final draft.
REFERENCES1 Buttriss J. Milk: dietary Importance, in Encyclopedia of Food Sciences
and Nutrition, ed. by Benjamin C. Academic Press, Oxford,pp. 3968–3974 (2003).
2 Alston-Mills BP, Comparative analysis of milks used for humanconsumption, in Handbook of Milk composition, ed. by Robert GJ.Academic Press, San Diego. CA, pp. 828–834 (1995).
3 FAO, Animal Production and Health Division. Milk and DairyProducts (2010). [Online]. Available: http://www.fao.org/ag/againfo/themes/en/dairy/home.html [8 January 2010].
4 FAO Statistical Database (2008). [Online]. Available: http://faostat.fao.org/ [18 February 2010].
5 Toledo A and Burlingame B, Biodiversity and nutrition: a commonpath toward global food security and sustainable development. JFood Compos Anal 19:477–483 (2006).
6 Burlingame B, Charrondiere R and Mouille B, Food composition isfundamental to the cross-cutting initiative on biodiversity forfood and nutrition. J Food Compos Anal 22:361–365 (2009).
7 FAO, Expert Consultation on Nutrition Indicators for Biodiversity2. [Online]. FAO, Rome (2008). Available: http://www.fao.org/infoods/biodiversity/index en.stm [6 October 2011].
8 Chiofalo B, Salimei E and Chiofalo L, Ass’s milk: exploitation of analimentary resource. Riv Folium Suppl 1:235–241 (2001).
9 Caroprese M, Albenzio M, Marino R, Muscio A, Zezza T and Sevi A,Behavior, milk yield, and milk composition of machine-and hand-milked Murgese mares. J Dairy Sci 90:2773–2777 (2007).
10 Meena HR, Ram H and Rasool TJ, Milk constituents in non-descriptbuffaloes reared at high altitudes in the Kumaon hills of the centralHimalayas. Buffalo Bull 26:72–76. (2007).
11 Silk TM, Guo M, Haenlein GFW and Park YW, Yak milk, in Handbook ofMilk of Non-bovine Mammals, ed. by Park YW and Haenlein GFW.Wiley-Blackwell, Ames, IA (2006).
12 Park YW and Haenlein GFW, Overview of milk of non-bovinemammals, in Handbook of Milk of Non-bovine Mammals, ed. byPark YW and Haenlein GFW. Wiley-Blackwell, Ames, IA, pp. 3–9(2006).
13 Nath NC and Verma ND, Biochemical evaluation of mithun milk forhuman consumption. Indian Vet J 77:418–423 (2000).
14 Indian Council of Agricultural Research, National Research Centreon Mithun. [Online]. Available: http://www.nrcmithun.res.in/ [20January 2010].
15 Doreau M and Martin-Rosset W, Dairy animals: horse, in Encyclopediaof Dairy Sciences, ed. by Hubert R. Elsevier, Oxford, pp. 630–637(2002).
16 Vincenzetti S, Polidori P, Fantuz F, Mariani PL, Cammertoni N andVita A, Donkey’s milk caseins characterization. Ital J Anim Sci4:427–429 (2005).
17 Fernandez FM and Oliver G, Proteins present in llama milk. I.Quantitative aspects and general characteristics. Milchwissenschaft43:299–302 (1988).
18 Yagil R, Camels and camel milk. FAO Animal Production andHealth Paper (1982). [Online]. Available: http://www.fao.org/DOCREP/003/X6528E/X6528E00.htm#TOC [6 October 2011].
19 Alhadrami GA, Camel, in Encyclopedia of Dairy Science, ed. by H.Roginski JWF and Fox PF. Academic Press, London, pp. 616–622(2003).
20 Riek A and Gerken M, Changes in llama (Lama glama) milkcomposition during lactation. J Dairy Sci. 89:3484–3493 (2006).
J Sci Food Agric (2011) c© 2011 Society of Chemical Industry wileyonlinelibrary.com/jsfa
www.soci.org E Medhammar et al.
21 Holand Ø, Gjøstein H, Aikio P, Nieminen M and White RG, Dairyanimals: reindeer, in Encyclopedia of Dairy Sciences, ed. by Hubert R.Elsevier, Oxford, pp. 637–643 (2002).
22 Minaev A, Moose as a domestic animal. The Kostromamoose farm (2010). [Online]. Available: http://www.moosefarm.newmail.ru/e000.htm. 2010 [2 March 2010].
23 Park YW and Haenlein GFW, Handbook of Milk of Non-bovineMammals. Wiley-Blackwell, Ames, IA (2006).
24 Laben RC, Factors responsible for variation in milk composition.J Dairy Sci 46:1293–1301 (1963).
25 Legates JE, Genetic and environmental factors affecting the solids-not-fat composition of milk. J Dairy Sci 43:1527–1532 (1960).
26 Jenkins TC and McGuire MA, Major advances in nutrition: impact onmilk composition. J Dairy Sci 89:1302–1310 (2006).
27 Walker GP, Dunshea FR and Doyle PT, Effects of nutrition andmanagement on the production and composition of milk fatand protein: a review. Aust J Agric Res 55:1009–1028 (2004).
28 Bansal BK, Randhawa SS, Singh KB and Boro PK, Effect of specific,nonspecific and latent mastitis on milk composition of dairy cows.Indian J Anim Sci 73:812–814 (2003).
29 Suutari TJ, Valkonen KH, Karttunen TJ, Ehn BM, Ekstrand B,Bengtsson U, et al, IgE cross reactivity between reindeer andbovine milk β-lactoglobulins in cow’s milk allergic patients. J InvestAllerg Clin 16:296–302 (2006).
30 Malacarne M, Martuzzi F, Summer A and Mariani P, Protein andfat composition of mare’s milk: some nutritional remarks withreference to human and cow’s milk. Int Dairy J 12:869–877 (2002).
31 Park YW, Juarez M, Ramos M and Haenlein GFW, Physico-chemicalcharacteristics of goat and sheep milk. Small Ruminant Res68:88–113 (2007).
32 Konuspayeva G, Faye B and Loiseau G, The composition of camelmilk: a meta-analysis of the literature data. J Food Compos Anal22:95–101 (2009).
33 FAO, Expert Consultation on Nutrition Indicators for Biodiversity2. Food Composition (2010). [Online]. FAO, Rome. Available:http://www.fao.org/infoods/biodiversity/index en.stm [6 October2011].
34 Ahmed FA, Bandyopadhyay S, Ghosh MK and Bhattacharya M,Determination of alpha-tocopherol in yak milk. Indian J DairySci 77:1048–1049 (2007).
35 Sharma DK, Ahmed FA, Raquib M and Bhattacharya M, Estimation ofthiamine content in yak milk. Indian J Dairy Sci 58:368–369 (2005).
36 Elamin FM and Wilcox CJ, Milk composition of Majaheim camels.J Dairy Sci 75:3155–3157 (1992).
37 Qinghai S, Jiancai L, Mohammad SA, Xinping F and Mingruo G, Grosscomposition and nutrient profiles of Chinese yak (Maiwa) milk. IntJ Food Sci Technol 43:568–572 (2008).
38 Abu-Lehia IH, Composition of camel milk. Milchwissenschaft42:368–371 (1987).
39 Al Mutery A, Wernery U and Jose S, Quality of raw camel milk fromSaudi Arabia. J Camel Pract Res 15:61–62 (2008).
40 Groeneveld LF, Lenstra JA, Eding H, Toro MA, Scherf B, Pilling D, et al,Genetic diversity in farm animals: a review. Anim Genet 41:6–31(2010).
41 Talpur FN, Memon NN and Bhanger MI, Comparison of fatty acid andcholesterol content of Pakistani water buffalo breeds. Pakistan JAnal Environ Chem 8:15–20 (2007).
42 Han B-Z, Meng Y, Li M, Yang Y-X, Ren F-Z, Zeng Q-K, et al, A surveyon the microbiological and chemical composition of buffalo milkin China. Food Control 18:742–746 (2007).
43 Greenfield H and Southgate DAT, Food Composition Data: Production,Management and Use (2nd edn). FAO, Rome (2003).
44 FAO/WHO, Energy and Protein Requirements. Report of a jointFAO/WHO Ad Hoc expert Committee. Rome (1973).
45 USDA, USDA National Nutrient Database for StandardReference (2009). [Online]. Available: http://www.nal.usda.gov/fnic/foodcomp/search/ [6 October 2011].
46 Mech A, Dhali A, Prakash B and Rajkhowa C, Variation in milk yieldand milk composition during the entire lactation period in Mithuncows (Bos frontalis). Livest Res Rural Dev 20:article 75 (2008).
47 Mondal SK, Pal DT, Singh G and Bujarbaruah KM, Physico-chemicalproperties of mithun milk. Indian J Anim Sci 71:1066–1068 (2001).
48 Kon SK, Milk and Milk Products in Human Nutrition. FAO, Rome (1972).49 Pietrzak-Fiecko R, Tomczynski R, Swistowska A, Borejszo Z,
Kokoszko E and Smoczynska K, Effect of mare’s breed on
the fatty acid composition of milk fat. Czech J Anim Sci 54:403–407(2009).
50 Schoos V, Medina M, Saad S and Van Nieuwenhove CP, Chemical andmicrobiological characteristics of llama’s (Lama glama) milk fromArgentina. Milchwissenschaft 63:398–401 (2008).
51 Morin DE, Rowan LL, Hurley WL and Braselton WE, Composition ofmilk from llamas in the United States. J Dairy Sci 78:1713–1720(1995).
52 Cook HW, Rausch RA and Baker BE, Moose (Alces alces) milk: grosscomposition, fatty acid, and mineral constitution. Can J Zool48:213–215 (1970).
53 Holand Ø and Gjøstein NM, Reindeer milk, in Handbook of Milk ofNon-bovine Mammals. Wiley-Blackwell, Ames, IA (2006).
54 WHO/FAO/UNU, Protein and Amino Acid Requirements in HumanNutrition: Report of a Joint WHO/FAO/UNU Expert Consultation.WHO, Geneva (2007).
55 Gjøstein H, Holand Ø and Weladji RB, Milk production andcomposition in reindeer (Rangifer tarandus): effect of lactationalstage. Comp Biochem Physiol A 137:649–656 (2004).
56 Chiavari C, Coloretti F, Nanni M, Sorrentino E and Grazia L, Use ofdonkey’s milk for a fermented beverage with lactobacilli. Lait85:481–490 (2005).
57 Mittaine J, Milk other than cows’ milk. WHO Monograph Series48:681–694 (1962).
58 FAO, Food energy: methods of analysis and conversionfactors (2003). Rome. [Online]. Available: ftp://ftp.fao.org/docrep/fao/006/y5022e/y5022e00.pdf [6 October 2011].
59 Fox PF and McSweeny PLH, Dairy Chemistry and Biochemistry. Blackie,London (1998).
60 Jirimutu, Li J, Alam MS, Li H, Guo M and Zhang H, Fatty acid andprotein profiles, and mineral content of milk from the wild Bactriancamel (Camelus bactrianus ferus) in Mongolia. Milchwissenschaft65:21–25 (2010).
61 Kemi VE, Karkkainen MUM, Rita HJ, Laaksonen MML, Outila TA andLamberg-Allardt CJE, Low calcium : phosphorus ratio in habitualdiets affects serum parathyroid hormone concentration andcalcium metabolism in healthy women with adequate calciumintake. Br J Nutr 103:561–568 (2010).
62 FAO/WHO. Human Vitamin and Mineral Requirements: Report of a JointFAO/WHO Expert Consultation (2002). Bangkok. [Online]. Available:http://www.fao.org/DOCREP/004/Y2809E/y2809e00.htm [6 Octo-ber 2011].
63 Mehaia MA, Vitamin C and riboflavin content in camels milk: effectsof heat treatments. Food Chem 50:153–155 (1994).
64 Konuspayeva G, Faye B, Loiseau G, Narmuratova M, Ivashchenko A,Meldebekova A, et al, Physiological change in camel milkcomposition (Camelus dromedarius) 1. Effect of lactation stage.Trop Anim Health Pro 42:495–499 (2009).
65 Zhang H, Yao J, Zhao D, Liu H, Li J and Guo M, Changes in chemicalcomposition of Alxa Bactrian camel milk during lactation. J DairySci 88:3402–3410 (2005).
66 Abdel Rahim AG, The chemical composition and nutritional value ofcamel (Camelus dromedarius) and goat (Capra bircus) milk. WorldRev Anim Prod 23:9–12 (1987).
67 Merin U, Bernstein S, Bloch-Damti A, Yagil R, Van Creveld C,Lindner P, et al, A comparative study of milk serum proteins incamel (Camelus dromedarius) and bovine colostrum. Livest Prod Sci67:297–301 (2001).
68 FAO/WHO, Interim Summary of Conclusions and Dietary Recom-mendations on Total Fat & Fatty Acids (2008). [Online]. JointFAO/WHO Expert Consultation on Fats and Fatty Acids. Available:http://www.who.int/nutrition/topics/FFA summary rec conclusion.pdf [19 October 2011].
69 FDA, Trans fatty acids: EFSA Panel reviews dietary intakes andhealth effects (2004). [Online]. Available: http://www.fda.gov/Food/LabelingNutrition/LabelClaims/NutrientContentClaims/ucm110179.htm [6 October 2011].
70 Kathirvelan C and Tyagi AK, Conjugated linoleic acid content of milkfrom buffaloes fed a mustard oil-based diet. Int J Dairy Technol62:141–146 (2009).
71 Tyagi AK, Kewalramani N, Dhiman TR, Kaur H, Kanwajia SK andSinghal KK, Conjugated linoleic acid content of milk and milkproducts as influenced by dietary fat sources in buffaloes. Indian JAnim Sci 76:742–746 (2006).
72 Tyagi AK, Kewalramani N, Dhiman TR, Kaur H, Singhal KK andKanwajia SK, Enhancement of the conjugated linoleic acid content
wileyonlinelibrary.com/jsfa c© 2011 Society of Chemical Industry J Sci Food Agric (2011)

Composition of milk from minor dairy animals and buffalo breeds www.soci.org
of buffalo milk and milk products through green fodder feeding.Anim Feed Sci Technol 133:351–358 (2007).
73 Jensen RG, Invited review: the composition of bovine milk lipids:January 1995 to December 2000. J Dairy Sci 85:295–350 (2002).
74 Pikul J and Wojtowski J, Fat and cholesterol content and fatty acidcomposition of mares’ colostrums and milk during five lactationmonths. Livest Sci 113:285–290 (2008).
75 Official Danish Food Composition Database (2009). [Online]. Avail-able: http://www.foodcomp.dk/v7/fcdb default.asp [6 October2011].
76 Orlandoi M, Goracci J and Curadi MC, Fat composition of mare’s milkwith reference to human nutrition. Ann Fac Med Vet 56:97–106(2003).
77 Pelizzola V, Contarini G, Povolo M and Giangiacomo R, Chemi-cal–physical characteristics and fatty acid composition of mare’smilk. Milchwissenschaft 61:33–36 (2006).
78 Gorban AM and Izzeldin OM, Fatty acids and lipids of camel milk andcolostrum. Int J Food Sci Nutr 52:283–287 (2001).
79 WHO/FAO, Diet, Nutrition and the Prevention of Chronic Diseases,in Report of a Joint WHO/FAO Expert Consultation (2002).[Online]. Available: http://www.fao.org/docrep/005/ac911e/ac911e00.htm#Contents2002 [6 October 2011].
80 Guo HY, Pang K, Zhang XY, Zhao L, Chen SW, Dong ML, et al,Composition, physiochemical properties, nitrogen fractiondistribution, and amino acid profile of donkey milk. J Dairy Sci90:1635–1643 (2007).
81 Salimei E, Fantuz F, Coppola R, Chiofalo B, Polidori P and Varisco G,Composition and characteristics of ass’s milk. Anim Res 53:67–78(2004).
82 Csapo J, Stefler J, Martin TG, Makray S and Csapo-Kiss Z, Compositionof mares’ colostrum and milk: fat content, fatty acid compositionand vitamin content. Int Dairy J 5:393–402 (1995).
83 Oftedal OT and Jenness R, Interspecies variation in milk compositionamong horses, zebras and asses (Perissodactyla: Equidae). J DairyRes 55:57–66 (1988).
84 Ramljak J, Stulina I, Antunac N, Basic I, Kelava N and Konjacic M,Characteristics of the lactation, chemical composition milk hygienequality of the Littoral-Dinaric ass. Mljekarstvo 59:107–113 (2009).
85 Pikul J, Wojtowski J, Dankow R, Kuczyska B and Łojek J, Fat contentand fatty acids profile of colostrum and milk of primitive Konikhorses (Equus caballus gmelini Ant.) during six months of lactation.J Dairy Res 75:302–309 (2008).
86 Shah SK, Schermerhorn EC, Cady RA and McDowell RE, Factorsaffecting milk fat percent of Nili-Ravi buffaloes in Pakistan. J DairySci 66:573–577 (1983).
87 Wangoh J, Farah Z and Puhan Z, Composition of milk from threecamel (Camelus dromedarius) breeds in Kenya during lactation.Milchwissenschaft 53:136–139 (1998).
88 Bhonsle D, Chourasia SK, Singh M and Jain RK, Factors affecting majormilk constituents in Murrah buffaloes. IndianJAnimSci 73:107–109(2003).
89 Ceron-Munoz M, Tonhati H, Duarte J, Oliveira J, Munoz-Berrocal Mand Jurado-Gamez H, Factors affecting somatic cell counts andtheir relations with milk and milk constituent yield in buffaloes. JDairy Sci 85:2885–2889 (2002).
90 Shah SK, Schermerhorn EC, Cady RA and McDowell RE, Factorsaffecting milk fat percent of Nili-Ravi buffaloes in Pakistan. JDairy Sci 66:573–577 (1983).
91 Parraguez VH, Thenot M, Latorre E, Ferrando G and Raggi LA, Milkcomposition in alpaca (Lama pacos): comparative study in tworegions of Chile. Arch Zootec 52:431–439 (2003).
92 Mariani P, Summer A, Martuzzi F, Formaggioni P, Sabbion A andCatalano AL, Physicochemical properties, gross composition,energy value and nitrogen fractions of Haflinger nursing maremilk throughout 6 lactation months. Anim Res 50:415–425 (2001).
93 Santos AS and Silvestre AM, A Study of Lusitano mare lactation curvewith Wood’s model. J Dairy Sci 91:760–766 (2008).
94 Santos AS, Sousa BC, Leitao LC and Alves VC. Yield and compositionof milk from Lusitano lactating mares. Pferdeheilkunde 21:115–116(2005).
95 Sharma UP, Rao SK and Zariwala IT, Composition of milk of differentbreeds of Buffaloes. Indian J Dairy Sci 33:7–12 (1980).
96 Patino EM, Mendez FI, Faisal EL, Cedres JF, Gomez LG and GuanziroliStefani MC, Buffalo milk composition of Murrah and half-bredMurrah × Mediterraneo in Corrientes, Argentina. Buffalo Newsl18:8–10 (2003).
97 Tzankova M and Petrova N, Production and composition of milkfrom three breeds of buffaloes in Shoumen region. Bulg J Agric Sci6:103–106 (2000).
98 Kundu SS, Kushwaha BP, Maity SB, Singh S and Kumar A, Milkcomposition of Bhadawari buffaloes. Indian J Anim Sci77:1330–1333 (2007).
99 Pyne AK, Maitra DN and Majumder SC, Effect of seasons on thecomposition of milk and milk yield in Murrah buffaloes in agro-climatic conditions of west Bengal. Indian Vet J 67:991–992 (1990).
100 Panda N and Kaur H, Influence of vitamin E supplementation onspontaneous oxidized flavour of milk in dairy buffaloes. Int J DairyTechnol 60:198–204 (2007).
101 Sodhi SS, Mehra ML, Jain AK and Trehan PK, Effect of non-geneticfactors on the composition of milk of Murrah buffaloes. Indian VetJ 85:950–952 (2008).
102 Hayashi Y, Devkota NR and Kumagai H, Effects of field pea (Pisumsativum L.) hay feeding on dry matter intake and milk productionof Murrah buffaloes (Bubalus bubalis) fed rice straw ad libitum.Anim Sci J 78:151–158 (2007).
103 Hayashi Y, Thapa BB, Sharma MP, Sapkota M and Kumagai H, Effectsof maize (Zea mays L.) silage feeding on dry matter intake and milkproduction of dairy buffalo and cattle in Tarai, Nepal. Anim Sci J80:418–427 (2009).
104 Peeva TZ, Composition of buffalo milk: sources of specific effects onthe separate components. Bulg J Agric Sci 7:329–335 (2001).
105 Tzankova M, Influence of the factor number of lactation and thelineal belonging on the buffalo milk composition. Bulg J Agric Sci7:337–340 (2001).
106 Anilkumar K, Syam Mohan KM, Ally K and Sathian CT, Compositionand mineral levels of the milk of Kuttanad dwarf Buffaloes ofKerala. Buffalo Bull 22:67–70 (2003).
107 Braun PG and Preuss SE, Nutritional composition and chemico-physical parameters of water buffalo milk and milk productsin Germany. Milchwissenschaft 63:70–72 (2008).
108 Varricchio ML, Di Francia A, Masucci F, Romano R and Proto V, Fattyacid composition of Mediterranean buffalo milk fat. Ital J Anim Sci6:509–511 (2007).
109 Zicarelli L, Buffalo milk: Its properties, dairy yield and mozzarellaproduction. Vet Res Commun 28:127–135 (2004).
110 Mondal D and Pal RN, Chemical composition of yak milk. Indian JAnim Sci 49:413–414 (1996).
111 Chatterjee A, Das DN, Sarkar M and Bora P, Chemical compositionincluding mineral constituents of yak milk. Indian J Dairy Sci56:115–116 (2003).
112 Das DN, Das BC, Sarkar M, Mohanty TK, Mondal DB, Singh BP, et al,Lactation performance of yak (Poephagus grunniens L.): a FieldStudy. Indian Vet J 75:926–927 (1996).
113 Indra R and Magash A, Composition, quality and consumption of yakmilk in Mongolia, in Yak Production in Central Asian Highlands:Proceedings of the Third International Congress on Yak, Lhasa, 2000,ed. by Jianlin H, Richard C, Hanotte O, McVeigh C, and Rege JEO.International Livestock Research Institute, PR China, pp. 493–497(2002).
114 Wu XH, Luo Z, Yu L, Ren FZ, Han BZ and Nout MJR, A survey oncomposition and microbiota of fresh and fermented yak milk atdifferent Tibetan altitudes. Dairy Sci Technol 89:201–209 (2009).
115 Wiener G, Dairy animals: yak, in Encyclopedia of Dairy Sciences, ed. byHubert R. Elsevier, Oxford, pp. 623–30 (2002).
116 Sarkar M, Basu A, Das BC, Das DN and Mondal DB, Lactation curvesof milk yield and some major milk constituents of yak. Indian Vet J77:551–552 (2000).
117 Wiener G, Jianlin H and Ruijun L, The Yak (2nd edn). FAO RegionalOffice for Asia and the Pacific, Bangkok (2003).
118 Jain YC and Yadava RS, Yield and composition of milk of Himachaliyak, yak hybrid and hill cow. Indian J Anim Sci 55:223–224 (1985).
119 Pal RN, The golden fluid: yak milk. Asian Livestock 18:34–36 (1993).120 Dong S, Long R and Kang M, Milking performance of China yak (Bos
grunniens): a preliminary report. Afr J Agric Res 2:53–57 (2007).121 Cagno RD, Tamborrino A, Gallo G, Leone C, Angelis MD, Faccia M,
et al, Uses of mares’ milk in manufacture of fermented milks. IntDairy J 14:767–775 (2004).
122 Martuzzi F, Summer A, Catalano AL and Mariani P, Macro- and micro-mineral elements of the milk and sialic acid bound to casein and towhey proteins in nursing mares of Bardigiano horse breed, in 49thAnnual Meeting of the European Association for Animal Production,Warsaw, Poland (1998).
J Sci Food Agric (2011) c© 2011 Society of Chemical Industry wileyonlinelibrary.com/jsfa

www.soci.org E Medhammar et al.
123 Holmes AD, McKey BV, Wertz WW, Lindquist HG and Parkinson LR,The vitamin content of mare’s milk. J Dairy Sci 29:163–171 (1946).
124 Schryver H, Oftedal O, Williams J, Cymbaluk NF, Antczak D andHintz H, A comparison of the mineral composition of milk ofdomestic and captive wild equids (Equus przewalski, E. zebra,E. burchelli, E. caballus, E. assinus). Comp Biochem Physiol A85:233–235 (1986).
125 Mehaia MA, Hablas MA, Abdel-Rahman KM and El-Mougy SA, Milkcomposition of Majaheim, Wadah and Hamra camels in SaudiArabia. Food Chem 52:115–122 (1995).
126 Mal G and Sena DS, Milk composition among different breeds ofcamel. Indian Vet J 84:1064–1065 (2007).
127 Konuspayeva G, Faye B, Loiseau G and Levieux D, Lactoferrin andimmunoglobulin contents in camel’s milk (Camelus bactrianus,Campus dromedarius, and hybrids) from Kazakhstan. J Dairy Sci90:38–46 (2007).
128 Park YW, Minor species milk, in Handbook of Milk of Non-bovineMammals. Wiley-Blackwell, Ames, IA (2006).
129 Ahmad S, Gaucher I, Rousseau F, Beaucher E, Piot M, Grongnet JF,et al, Effects of acidification on physico-chemical characteristics ofbuffalo milk: a comparison with cow’s milk. Food Chem 106:11–17(2008).
130 Fernandez FM and Oliver G, Studies of α-lactalbumin in llama milk.Small Ruminant Res 8:97–106 (1992).
131 Holmes AD, Spelman AF, Smith CT and Kuzmeski JW, Compositionof mares’ milk as compared with that of other species. J Dairy Sci30:385–395 (1947).
132 Mohamed HE, Mousa HM and Beynen AC, Ascorbic acidconcentrations in milk from Sudanese camels. J Anim Phys AnimNutr 89:35–37 (2005).
133 Dubey PC, Suman CL, Sanyal MK, Pandey HS, Saxena MM andYadav PL, Factors affecting composition of milk of buffaloes. IndianJ Anim Sci 67:802–804 (1997).
134 Kuldip C, Sharma KC, Sacdheva KV and Singh S, A comparative grossand lipid composition of Murrah breed of buffalo and cross-bredcow’s milk during different lactation stages. Arch Tiez Dummerstorf43:123–130 (2000).
135 Martuzzi F, Catalano AL, Summer A and Mariani P, Calcium,phosphorus and magnesium in the milk of nursing mares fromItalian saddle horse breed and their variations during lactation.AnnFac Med Vet Univ Parma 27:205–212 (1997).
136 Salimei E, Fantuz F, Varisco G, Maglieri C and Polidori M, Differentfibre sources in dairy ass’s diet: effects on milk yield andcomposition. Ital J Anim Sci 4:430–432 (2005).
137 Summer A, Sabbioni A, Formaggioni P and Mariani P, Trend in ashand mineral element content of milk from Haflinger nursing maresthroughout six lactation months. Livest Prod Sci 88:55–62 (2004).
138 Schryver HF, Oftedal OT, Williams J, Soderholm LV and Hintz HF,Lactation in the horse: the mineral composition of mare milk.J Nutr 116:2142–2147 (1986).
139 Luick JR, White RG, Gau AM and Jenness R, Compositional changesin the milk secreted by grazing reindeer. I. Gross composition andash. J Dairy Sci 57:1325–1333 (1974).
140 Chalyshev AV and Badlo LP, Nutrient composition of milk fromdomesticated taiga moose during the lactation period. Alces38:41–44 (2002).
141 Franzmann AW, Flynn A and Arneson PD, Moose milk and hairelement levels and relationships. J Wildlife Dis 12:202–207 (1976).
142 Tzankova M and Dimov K, Amino acid composition of milk fromBulgarian Murrah buffalo cows. Bulg J Agric Sci 9:553–536 (2003).
143 Osthoff G, Hugo A, De Wit M and Mai Nguyen TP, The chemicalcomposition of milk from free-ranging African buffalo (Synceruscaffer). S Afr J Wildl Res 39:87–102 (2009).
144 Mech A, Dhali A, Khate K and Rajkhowa C, Changes in milk nitrogencompositions during early and mid lactation stages in Mithun (Bosfrontalis). Indian J Anim Sci 77:59–61 (2007).
145 Chiofalo B, Polidori M, Costa R and Salimei E, Fresh forage in dairyass’s ration: effect on milk fatty acid composition and flavours. ItalJ Anim Sci 4:433–435 (2005).
146 Gorban AMS and Izzeldin OM, Study on cholesteryl ester fatty acidsin camel and cow milk lipid. Int J Food Sci Technol 34:229–234(1999).
147 Abu-Lehia IH, Physical and chemical characteristics of camel milkfatand its fractions. Food Chem 34:261–271 (1989).
wileyonlinelibrary.com/jsfa c© 2011 Society of Chemical Industry J Sci Food Agric (2011)